Analytical Approach for the Flexural Analysis of RC Beams 1 Strengthened with Prestressed CFRP 2 Mohammadali Rezazadeh, 1 Joaquim Barros, 2 Inês Costa, 3 3 4 ABSTRACT: The objective of this paper is to propose a simplified analytical approach to predict the flexural behavior 5 of simply supported reinforced-concrete (RC) beams flexurally strengthened with prestressed carbon fiber reinforced 6 polymer (CFRP) reinforcements using either externally bonded reinforcing (EBR) or near surface mounted (NSM) 7 techniques. This design methodology also considers the ultimate flexural capacity of NSM CFRP strengthened beams 8 when concrete cover delamination is the governing failure mode. A moment-curvature ( M ) relationship formed 9 by three linear branches corresponding to the precracking, postcracking, and postyielding stages is established by 10 considering the four critical M points that characterize the flexural behavior of CFRP strengthened beams. Two 11 additional M points, namely, concrete decompression and steel decompression, are also defined to assess the 12 initial effects of the prestress force applied by the FRP reinforcement. The mid-span deflection of the beams is 13 predicted based on the curvature approach, assuming a linear curvature variation between the critical points along the 14 beam length. The good predictive performance of the analytical model is appraised by simulating the force-deflection 15 response registered in experimental programs composed of RC beams strengthened with prestressed NSM CFRP 16 reinforcements. 17 18 Keywords: Analytical approach, flexural analysis, RC beams, prestressed CFRP reinforcement, concrete cover 19 delamination. 20 1 ISISE, PhD student of the Structural Division of the Dep. of Civil Engineering, University of Minho, 4800-058 Guimarães, Portugal. [email protected] 2 ISISE, Full Professor of the Structural Division of the Dep. of Civil Engineering, University of Minho, 4800-058 Guimarães, Portugal. [email protected] 3 ISISE, PhD student of the Structural Division of the Dep. of Civil Engineering, University of Minho, 4800-058 Guimarães, Portugal. [email protected]

Welcome message from author
This document is posted to help you gain knowledge. Please leave a comment to let me know what you think about it! Share it to your friends and learn new things together.
Transcript
Analytical Approach for the Flexural Analysis of RC Beams 1
Strengthened with Prestressed CFRP 2
Mohammadali Rezazadeh,1 Joaquim Barros,2 Inês Costa,3 3
4
ABSTRACT: The objective of this paper is to propose a simplified analytical approach to predict the flexural behavior 5
of simply supported reinforced-concrete (RC) beams flexurally strengthened with prestressed carbon fiber reinforced 6
polymer (CFRP) reinforcements using either externally bonded reinforcing (EBR) or near surface mounted (NSM) 7
techniques. This design methodology also considers the ultimate flexural capacity of NSM CFRP strengthened beams 8
when concrete cover delamination is the governing failure mode. A moment-curvature ( M ) relationship formed 9
by three linear branches corresponding to the precracking, postcracking, and postyielding stages is established by 10
considering the four critical M points that characterize the flexural behavior of CFRP strengthened beams. Two 11
additional M points, namely, concrete decompression and steel decompression, are also defined to assess the 12
initial effects of the prestress force applied by the FRP reinforcement. The mid-span deflection of the beams is 13
predicted based on the curvature approach, assuming a linear curvature variation between the critical points along the 14
beam length. The good predictive performance of the analytical model is appraised by simulating the force-deflection 15
response registered in experimental programs composed of RC beams strengthened with prestressed NSM CFRP 16
reinforcements. 17
18
Keywords: Analytical approach, flexural analysis, RC beams, prestressed CFRP reinforcement, concrete cover 19
delamination. 20
1 ISISE, PhD student of the Structural Division of the Dep. of Civil Engineering, University of Minho, 4800-058
Guimarães, Portugal. [email protected] 2 ISISE, Full Professor of the Structural Division of the Dep. of Civil Engineering, University of Minho, 4800-058
Guimarães, Portugal. [email protected] 3 ISISE, PhD student of the Structural Division of the Dep. of Civil Engineering, University of Minho, 4800-058
Guimarães, Portugal. [email protected]

1. Introduction 1
Carbon fiber reinforced polymer (CFRP) systems have been extensively investigated for the flexural and shear 2
strengthening of reinforced concrete (RC) structures due to their advantages, like high strength and stiffness to weight 3
ratios, excellent fatigue behavior, and high durability in environment conditions where conventional materials have 4
serious concerns in terms of degradation of their properties [1-3]. CFRP composite materials can be applied to RC 5
structures to be strengthened by using either externally bonded reinforcing (EBR) or near surface mounted (NSM) 6
techniques [4, 5]. Experimental research has demonstrated that NSM technique is more effective in shear and flexural 7
strengthening than the EBR technique due to the higher ratio of the bond contact area to the cross sectional area, as 8
well as the higher confinement to the CFRP provided by the surrounding concrete [6-9]. 9
Nordin and Taljsten applied a prestress force to the NSM CFRP reinforcement for the flexural strengthening of RC 10
beams resulting a better utilization of these high tensile strength materials [10]. In fact, applying an appropriate 11
prestress level on the CFRP reinforcement can significantly increase the load carrying capacity corresponding to 12
concrete cracking and steel yielding initiations, as well as an increase of the load at serviceability limit state (SLS) 13
conditions [11-13]. Prestressed CFRPs can also decrease the deflection and crack width when compared to the 14
corresponding results obtained with non-prestressed CFRPs [14, 15]. 15
The possible flexural failure modes for the RC beams strengthened with CFRP reinforcement using EBR or NSM 16
techniques can be classified into distinct categories, namely: tension failure of CFRP, concrete compression failure, 17
delamination of concrete cover, and CFRP debonding [1, 16]. Although the ultimate flexural capacity of RC beams 18
can be increased significantly by using CFRP reinforcement, its efficiency for the flexural strengthening may be 19
limited by the occurrence of concrete cover delamination (rip-off) as a premature failure mode [15]. Concrete cover 20
delamination can occur due to the formation and propagation of a fracture surface in the concrete cover at the free 21
extremity of the CFRP reinforcement. Many studies have been carried out to identify the load carrying capacity of 22
EBR CFRP strengthened RC beam failing by concrete cover delamination [17-19]. For the NSM technique, however, 23
a formulation with physical and mechanical support for the prediction of this type of failure mode, with a format that 24
can be used in a design context of RC beams flexurally strengthened with CFRP systems, still does not exist. 25
Therefore, the present work has also the purpose of developing this type of formulation. 26

The moment-curvature relationship of the cross section of RC beams can be idealized as a trilinear diagram 1
representing the uncracked, cracked, and yielded stages of a RC beam [20]. A trilinear moment-curvature response 2
was considered by Saqan and Rasheed for rectangular cross section beams reinforced with prestressed steel strands in 3
order to compute the neutral axis depth with a simple hand calculation instead of iterative numerical procedure for the 4
cracked section [21]. On the other hand, the flexural capacity and the deformational behavior of CFRP strengthened 5
beams can analytically be predicted by using a trilinear moment-curvature relationship based on the strain 6
compatibility and principles of static equilibrium. El-Mihilmy and Tedesco, and Rasheed et al. adopted a trilinear 7
relationship for the flexural response of RC beams flexurally strengthened with FRP plates [22, 23]. El-Mihilmy and 8
Tedesco also proposed a method for calculating the deflection using the developed effective moment of inertia for 9
FRP-strengthened RC beams, while Rasheed et al. determined the deflection by integrating the curvature along the 10
beam length. The deflection of the strengthened beams can also be estimated based on the integration of the curvature 11
in the uncraked and cracked sections representing a certain number of elements with the length equal to average crack 12
spacing [11]. Barros and Dalfré proposed an analytical approach to calculate the deflection of RC structures 13
strengthened according to NSM or EBR technique based on the force method, also known as flexibility method, 14
consisting on establishing a set of displacement compatibility equations whose number is equal to the unknown 15
redundant supports and generalized displacements (or forces) to be determined [24]. 16
The current study intends to propose an analytical formulation, with a design framework, based on the strain 17
compatibility and principles of static equilibrium to predict moment-curvature and force-deflection relationships of 18
RC beams flexurally strengthened with prestressed CFRP reinforcement. The moment-curvature response of the 19
prestressed section is simulated by the proposed simplified trilinear diagram (representing the precracking, 20
postcracking, and postyielding stages) consisting two stages up to concrete crack initiation (precracking stage) in order 21
to simulate the effect of the prestressing. One of these stages refers to concrete decompression, and the other to steel 22
decompression. In fact, according to this analytical approach, the influence of the prestress force on the trilinear 23
moment-curvature response of the non-prestressed section can be considered by adding the strain profile of the cross 24
section at the concrete and steel decompression points to the corresponding strain values in the non-prestressed section 25
at the concrete cracking and steel yielding initiation points, respectively. Furthermore, the analytical equations are 26
proposed to determine the neutral axis depth of the cracked non-prestressed and prestressed strengthened sections at 27
the critical points in order to provide a simple hand calculation and eliminate the iterative numerical procedure. The 28

developed design methodology also considers the possibility of occurring the concrete cover delamination failure 1
mode, since this can limit the ultimate flexural load carrying capacity of RC beams strengthened with NSM CFRP 2
reinforcement. This methodology is developed by considering the influence of the effective parameters on the 3
occurrence of the concrete cover delamination failure mode. 4
The force versus mid-span deflection of the beam is analytically predicted using the curvature distribution along the 5
beam length. The calculation complexities are simplified by assuming a linear curvature variation between the critical 6
points that decompose the beam in the three regions corresponding to the trilinear flexural behavior. 7
The developed analytical formulation can be also applied on the design of RC slabs strengthened with FRP systems 8
other than CFRP reinforcements. The predictive performance of the analytical model is assessed by simulating the 9
tests of experimental studies, consisting of RC beams flexurally strengthened with prestressed or non-prestressed NSM 10
CFRP reinforcements. 11
12
2. Assumptions 13
The following assumptions were adopted in the proposed analytical model: 14
a) Strain in the longitudinal steel bars, CFRP reinforcement and concrete is directly proportional to their 15
distance from the neutral axis of the cross section of the RC element; 16
b) There is no slip between steel and CFRP reinforcements and surrounding concrete when conventional 17
flexural failure modes are considered as the prevailing ones; 18
c) The maximum compressive strain in concrete is 0.003. 19
20
3. Analytical Approach 21
As already mentioned, the moment-curvature ( M ) relationship of the cross section of a prestressed strengthened 22
RC beam can be idealized by a trilinear diagram representing the precracking, postcracking, and postyielding phases, 23
delimited by the following M points (Figure 1): initial camber (point (ci)); concrete crack initiation (point (cr)); 24
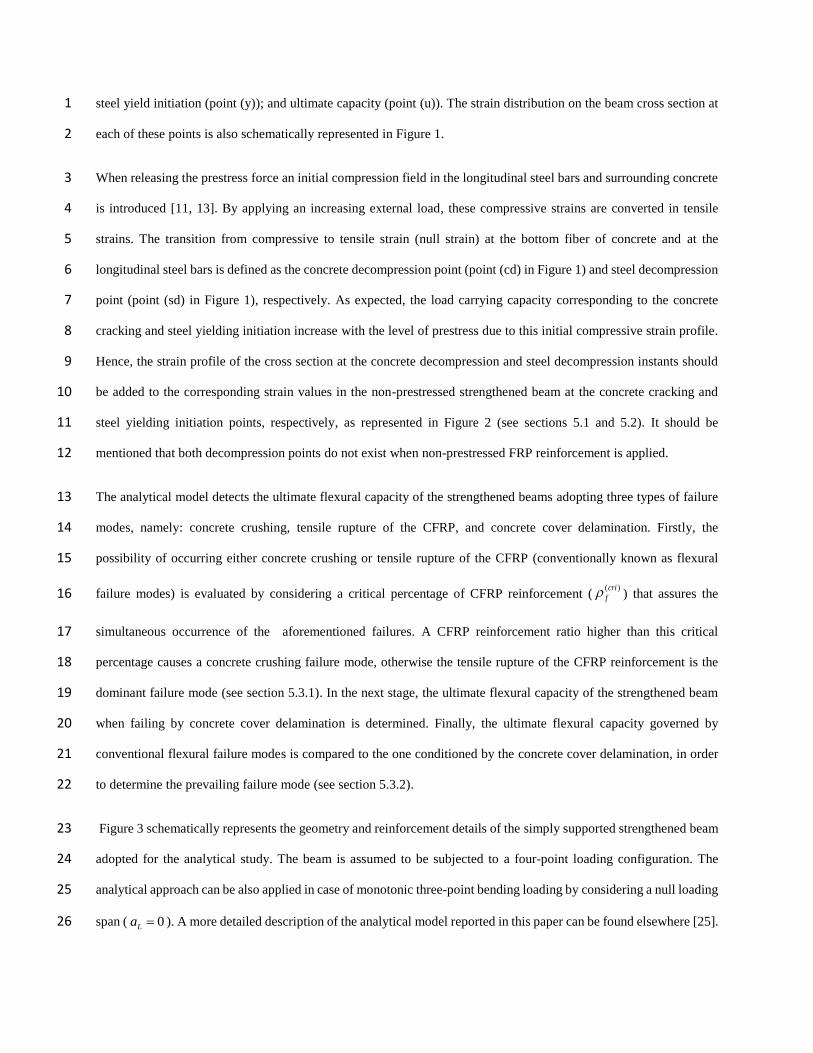
steel yield initiation (point (y)); and ultimate capacity (point (u)). The strain distribution on the beam cross section at 1
each of these points is also schematically represented in Figure 1. 2
When releasing the prestress force an initial compression field in the longitudinal steel bars and surrounding concrete 3
is introduced [11, 13]. By applying an increasing external load, these compressive strains are converted in tensile 4
strains. The transition from compressive to tensile strain (null strain) at the bottom fiber of concrete and at the 5
longitudinal steel bars is defined as the concrete decompression point (point (cd) in Figure 1) and steel decompression 6
point (point (sd) in Figure 1), respectively. As expected, the load carrying capacity corresponding to the concrete 7
cracking and steel yielding initiation increase with the level of prestress due to this initial compressive strain profile. 8
Hence, the strain profile of the cross section at the concrete decompression and steel decompression instants should 9
be added to the corresponding strain values in the non-prestressed strengthened beam at the concrete cracking and 10
steel yielding initiation points, respectively, as represented in Figure 2 (see sections 5.1 and 5.2). It should be 11
mentioned that both decompression points do not exist when non-prestressed FRP reinforcement is applied. 12
The analytical model detects the ultimate flexural capacity of the strengthened beams adopting three types of failure 13
modes, namely: concrete crushing, tensile rupture of the CFRP, and concrete cover delamination. Firstly, the 14
possibility of occurring either concrete crushing or tensile rupture of the CFRP (conventionally known as flexural 15
failure modes) is evaluated by considering a critical percentage of CFRP reinforcement (( )cri
f ) that assures the 16
simultaneous occurrence of the aforementioned failures. A CFRP reinforcement ratio higher than this critical 17
percentage causes a concrete crushing failure mode, otherwise the tensile rupture of the CFRP reinforcement is the 18
dominant failure mode (see section 5.3.1). In the next stage, the ultimate flexural capacity of the strengthened beam 19
when failing by concrete cover delamination is determined. Finally, the ultimate flexural capacity governed by 20
conventional flexural failure modes is compared to the one conditioned by the concrete cover delamination, in order 21
to determine the prevailing failure mode (see section 5.3.2). 22
Figure 3 schematically represents the geometry and reinforcement details of the simply supported strengthened beam 23
adopted for the analytical study. The beam is assumed to be subjected to a four-point loading configuration. The 24
analytical approach can be also applied in case of monotonic three-point bending loading by considering a null loading 25
span ( 0La ). A more detailed description of the analytical model reported in this paper can be found elsewhere [25]. 26

1
4. Constitutive Law of the Materials 2
The compressive behavior of concrete is assumed linear up to the yielding of the longitudinal steel reinforcement in 3
order to simplify the calculation procedure. After steel yielding, the contribution of concrete in compression is 4
simulated by a rectangular compressive stress block, defined by the 1 and
1 parameters (Eq. (1)) schematically 5
represented in Figure 4a [1]. 6
'
1 '
4.
6. 2.
c c
c c
(1)-a 7
' 2
1 ' 2
1
3. .
.3.
c c c
c
(1)-b 8
where '
c is the strain corresponding to the specified compressive strength of concrete '
cf , which is calculated as: 9
'
' 1.7
c
cc
E
f (2)
10
The tensile behavior of concrete is assumed linear up to the stress at concrete crack initiation in concrete tensile surface 11
[26]. An elasto-perfectly plastic model is used to simulate the behavior of the longitudinal steel bars, as represented 12
in Figure 4b, while a linear behavior is adopted for the CFRP up to its ultimate tensile strength (Figure 4c). 13
14
5. Moment-Curvature Relationship 15
The analytical approach defines the moment-curvature response of the cross section of a RC element flexurally 16
strengthened with CFRP reinforcements (failing in bending) using sectional analysis based on the strain compatibility 17
and force equilibrium at the governing stages assumed representatives of the behavior of this type of elements. 18
5.1. Precracking Stage 19
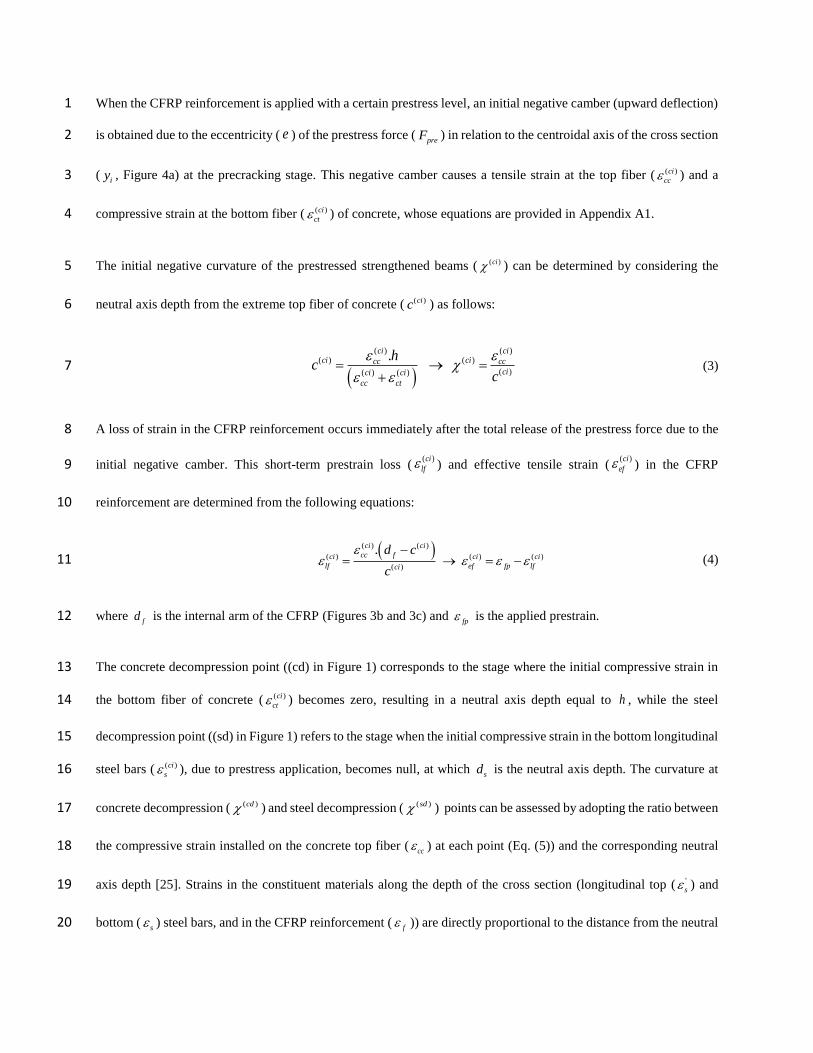
When the CFRP reinforcement is applied with a certain prestress level, an initial negative camber (upward deflection) 1
is obtained due to the eccentricity ( e ) of the prestress force (preF ) in relation to the centroidal axis of the cross section 2
(iy , Figure 4a) at the precracking stage. This negative camber causes a tensile strain at the top fiber ( ( )ci
cc ) and a 3
compressive strain at the bottom fiber ( ( )ci
ct ) of concrete, whose equations are provided in Appendix A1. 4
The initial negative curvature of the prestressed strengthened beams ( ( )ci ) can be determined by considering the 5
neutral axis depth from the extreme top fiber of concrete ( ( )cic ) as follows: 6
( ) ( )( ) ( )
( )( ) ( )
.ci cici cicc cc
cici ci
cc ct
hc
c
(3) 7
A loss of strain in the CFRP reinforcement occurs immediately after the total release of the prestress force due to the 8
initial negative camber. This short-term prestrain loss (( )ci
lf ) and effective tensile strain (( )ci
ef ) in the CFRP 9
reinforcement are determined from the following equations: 10
( ) ( )
( ) ( ) ( )
( )
.ci ci
cc fci ci ci
lf ef fp lfci
d c
c
(4) 11
where fd is the internal arm of the CFRP (Figures 3b and 3c) and fp is the applied prestrain. 12
The concrete decompression point ((cd) in Figure 1) corresponds to the stage where the initial compressive strain in 13
the bottom fiber of concrete ( ( )ci
ct ) becomes zero, resulting in a neutral axis depth equal to h , while the steel 14
decompression point ((sd) in Figure 1) refers to the stage when the initial compressive strain in the bottom longitudinal 15
steel bars ( ( )ci
s ), due to prestress application, becomes null, at which sd is the neutral axis depth. The curvature at 16
concrete decompression ( ( )cd ) and steel decompression ( ( )sd ) points can be assessed by adopting the ratio between 17
the compressive strain installed on the concrete top fiber (cc ) at each point (Eq. (5)) and the corresponding neutral 18
axis depth [25]. Strains in the constituent materials along the depth of the cross section (longitudinal top ( '
s ) and 19
bottom (s ) steel bars, and in the CFRP reinforcement ( f )) are directly proportional to the distance from the neutral 20

axis depth at each decompression point, while the concept of effective tensile strain should be adopted for the 1
prestressed CFRP reinforcement (see Appendix A2 and Figure 2). 2
( )
( ).ci
ct icd ci
cc cc
i
y
h y
(5)-a 3
( )
( ).ci
s isd ci
cc cc
s i
y
d y
(5)-b 4
The flexural bending moment at the concrete decompression ( ( )cdM ) and steel decompression ( ( )sdM ) points can be 5
derived based on the sum of internal moments with respect to the corresponding neutral axis using the strain 6
distribution of the section [25]: 7
'2 ' '1. . . . . . . . . . . .
3
cd cd cd cd cd
cc c s s s s s s s s ef f f fM b E h E A h d E A h d E A d h (6) 8
2'2 ' '1 1
. . . . . . . . . . . .3 3
sd sd sd sd sd
cc c s s s s s s ct c s ef f f f sM b E d E A d d b E h d E A d d (7) 9
The steel decompression point is followed by the concrete crack initiation, where the beam still exhibits linear elastic 10
behavior, but the tensile strain at the extreme bottom fiber of concrete ( ( )cr
ctb ) reaches its flexural tensile strength (11
'0.62ct r c r cf E f f [26]) (Figure 2a). The strains in the constituent materials along the cross section are 12
proportional to the distance from the centroidal axis of the beam cross section (iy ) (Figure 2a). The increment of 13
curvature and flexural capacity corresponding to the bending moment between the concrete decompression and crack 14
initiation points can be obtained from Eqs. (8) and (9) in relation to the centroidal axis of the beam cross section (iy15
). 16
cr
ccbb
c
i
r
y
(8) 17
2'2 ' '1 1
. . . . . . . . . . . . . . .3 3
cr cr cr cr cr cr
b ccb c i sb s s i s ctb c i sb s s s i fb f f f iM b E y E A y d b E h y E A d y E A d y (9) 18

where the equations for the determination of the strain components are provided in Appendix A3. Finally, the curvature 1
( ( )cr ) and flexural bending moment ( ( )crM ) of the prestressed strengthened beams at the concrete crack initiation 2
can be determined by using Eqs. (10) and (11), where the ( )cd and ( )cdM are considered null for the non-prestressed 3
beam (Figure 2a). 4
( )
cr cd cr
b (10) 5
( )cr cd cr
bM M M (11) 6
5.2. Postcracking Stage 7
The steel yield initiation point corresponds to the stage where the strain in the longitudinal tensile steel reinforcement 8
( ( )y
sb ) reaches its yield strength (sy sy sf E ). The steel decompression point should be introduced as an initial 9
condition for the steel yield initiation instant. Accordingly, to determine the strain distribution of the cross section at 10
the steel yield initiation point, the strain profile of the cross section at the steel decompression instant should be added 11
to the corresponding strain values of the cross section due to the bending moment after this decompression point 12
(Figure 2b). 13
The strain profile of the cross section due to the bending moment between the steel decompression and steel yield 14
initiation points can be obtained adopting the proportional strain distribution to the distance from the neutral axis depth 15
( ( )y
bc ) by considering the strain value in the longitudinal tensile steel bars ( ( )y
sb ) [25]. According to the principles of 16
static equilibrium, a quadratic equation is obtained to calculate the neutral axis depth ( ( )y
bc ) at the steel yield initiation 17
stage due to the bending moment after the steel decompression point (Eq. (12)) (see Appendix A4). 18
( ) 2 ( ). . 0y y
b ba c b c c (12)-a 19
where 20
'
' '
.
2. . . .
2. . . . . . .
c
s s s s f f
s s s s s s f f f
a E b
b E A E A E A
c E A d E A d E A d
(12)-b 1
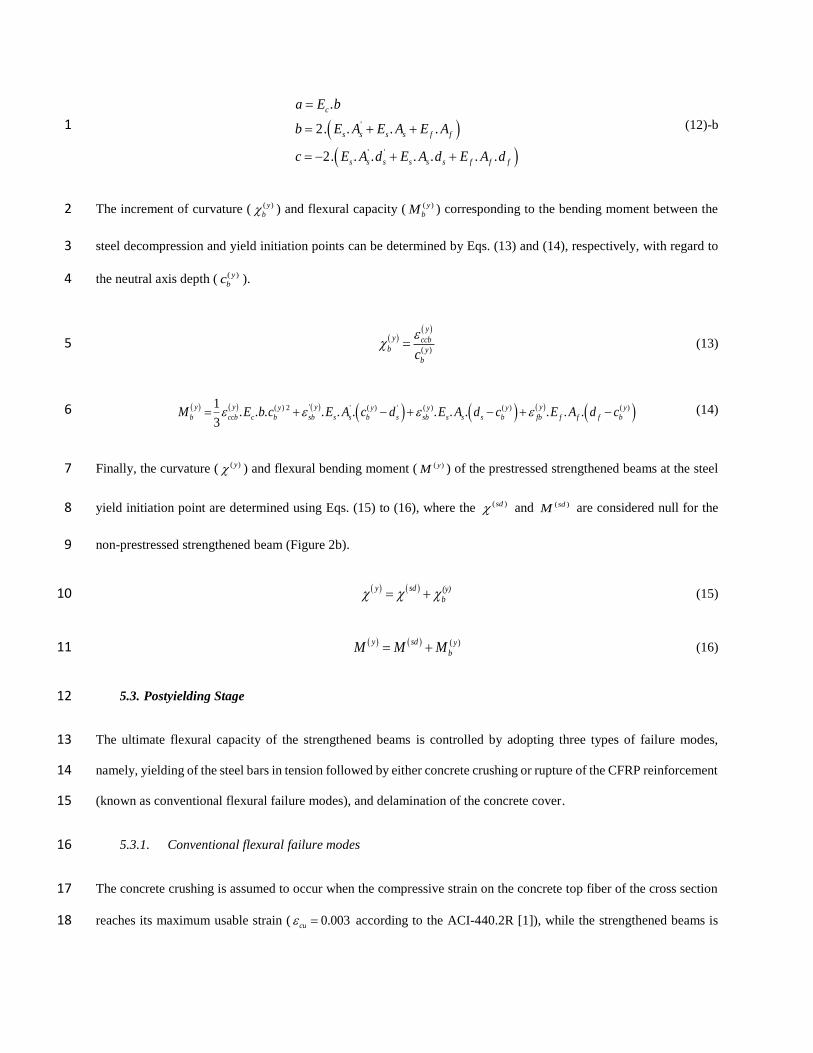
The increment of curvature ( ( )y
b ) and flexural capacity ( ( )y
bM ) corresponding to the bending moment between the 2
steel decompression and yield initiation points can be determined by Eqs. (13) and (14), respectively, with regard to 3
the neutral axis depth ( ( )y
bc ). 4
( )
yy ccb
b y
bc
(13) 5
'( ) 2 ' ( ) ' ( ) ( ) ( )1 . . . . . . . . . . . .3
y y y y y y
b ccb c b sb s s
y
b s sb s s s b fb b
y
f f f
yM E b c E A c d E A d c E A d c (14) 6
Finally, the curvature ( ( )y ) and flexural bending moment ( ( )yM ) of the prestressed strengthened beams at the steel 7
yield initiation point are determined using Eqs. (15) to (16), where the ( )sd and ( )sdM are considered null for the 8
non-prestressed strengthened beam (Figure 2b). 9
y sd (y)
b (15) 10
( )y sd y
bM M M (16) 11
5.3. Postyielding Stage 12
The ultimate flexural capacity of the strengthened beams is controlled by adopting three types of failure modes, 13
namely, yielding of the steel bars in tension followed by either concrete crushing or rupture of the CFRP reinforcement 14
(known as conventional flexural failure modes), and delamination of the concrete cover. 15
5.3.1. Conventional flexural failure modes 16
The concrete crushing is assumed to occur when the compressive strain on the concrete top fiber of the cross section 17
reaches its maximum usable strain ( 0.003cu according to the ACI-440.2R [1]), while the strengthened beams is 18

assumed to experience the rupture of the CFRP reinforcement when the ultimate tensile strain in the CFRP is achieved 1
(fu ). 2
To assess the prevailing failure mode in the strengthened beams at the ultimate stage, a critical percentage of CFRP 3
reinforcement (( )cri
f ) can be determined assuming simultaneous tension and compression failures to detect the 4
appropriate failure mode (Appendix A5). If the CFRP ratio exceeds the critical value, failure will be due to the concrete 5
crushing, otherwise failure will be caused by rupture of the CFRP reinforcement. The critical area (( )cri
fA ) and the 6
corresponding percentage (( )cri
f ) for the CFRP reinforcement can be determined from: 7
' ( ) ' '( ) ( )
1 1( ) ( ). . . . . . .
. .
cri cri cri
c s s s s sy fcri cri
f f
fu f f
f c b A E A f AA
E b d
(17) 8
Concrete Crushing 9
Concrete crushing will prevail at ultimate stage when the CFRP ratio exceeds the critical percentage. From the 10
equilibrium of the internal forces results a quadratic equation that determines the neutral axis depth ( ( )u
ccc ) at failure 11
(Appendix A5): 12
( ) 2 ( ). . 0u u
cc cca c b c c (18)-a 13
where 14
' ' 2
' 2 '
'2 ' '
. . 3. .
3. . . . . . . .
3. . . . . . .
c c cu cu
c cu s s f f s sy f f fp
c cu s s s f f f
a f b
b E A E A A f E A
c E A d E A d
(18)-b 15
The curvature ( ( )u
cc ) and ultimate flexural capacity ( ( )u
ccM ) are obtained from the following equations (Appendix A5): 16
( )
cc
u cucc uc
(19) 17
'' ( ) 2 ' ( ) ' ( ) ( )11 1 , ,. . . . . 1 . . . . . . . .
2
u u uu u u u
c cc s cc s s cc s sy s s cc f f ccc cc f f cM f c b E A c d f A d c E A d c
(20) 1
Rupture of CFRP Reinforcement 2
The equilibrium of the internal forces at the cross section, when the rupture of the CFRP reinforcement occurs, can be 3
derived adopting strain compatibility, resulting in a cubic equation, whose solution leads the depth of the neutral axis 4
at ultimate stage ( ( )u
rcc ) (Appendix A5): 5
( ) 3 ( ( )) 2. . . 0u u u
rcrc rca b c cc dc (21)-a 6
where 7
( ) ' ' ( )
, ,
' ( ) ' ' ' '
,
'2 ( ) ' '
,
'2 ( ) ' '
,
. . . 3.
3. . .( . . . . ) . . .
3. . . . . 2. . . .
3. . . . . . . . .
u u
fb rc c c fb rc
u
c fb rc c s s c f c f fu s sy
u
c fb rc s s f s f f fu s sy
u
c f fb rc s s s f f fu s sy
a f b
b E A f b d A f A f
c E A d d d A f A f
d d E A d d A f A f
(21)-b 8
Accordingly, the curvature ( ( )u
rc ) and ultimate flexural capacity ( ( )u
rcM ) regarding the neutral axis depth level ( ( )u
rcc ) 9
at CFRP failure is determined as follows (Appendix A5): 10
,
u
u cc rc
rc u
rcc
(22) 11
'' ( ) 2 ' ( ) ' ( ) ( )11 1 ,. . . . . 1 . . . . . . .
2
u uu u u u
rc c rc s rc s s rc s sy s s rc fu f f rcM f c b E A c d f A d c f A d c
(23) 12
5.3.2. Concrete cover delamination 13
Concrete cover delamination, also designated by rip-off, is initiated by forming an in-plane shear crack at the 14
extremities of the CFRP reinforcement due to high strain gradient caused by the abrupt termination of the CFRP. This 15
crack is propagated along the depth of the concrete cover of the beam up to attain the tensile steel reinforcement level, 16
and then progresses horizontally along this level due to the resistance offered by this reinforcement to the propagation 17
of the crack through it, as well as the higher percentage of voids just below this reinforcement [15, 18]. Subsequently, 18
separation of the concrete cover along the longitudinal tensile steel bars occurs in the shear span of the beam, which 1
can compromise the flexural strengthening effectiveness of this technique if it occurs prematurely. Furthermore, the 2
susceptibility to the concrete cover delamination in the NSM CFRP strengthened beams is influenced by some 3
variables, such as the concrete strength class, reinforcement ratio of existing longitudinal steel bars, number and 4
diameter of the bars composing this reinforcement, the relative position between the longitudinal steel and CFRP 5
reinforcements, number of CFRP reinforcements, and distance between the consecutive CFRPs [27]. 6
The present section aims to propose a new methodology to predict the ultimate flexural capacity of a RC beam 7
strengthened with NSM CFRP laminates failing by concrete cover delamination. For this purpose, the concrete cover 8
delamination is assumed to occur when the principal tensile stress transferred to the surrounding concrete at the 9
extremity of the longitudinal CFRP laminate attains the concrete tensile strength ( '0.56ct cf f [26]). The present 10
approach, for the tensile fracture surface of this surrounding concrete, was inspired on the work of Bianco et al. (2014) 11
that proposed a semi-pyramidal shape for modeling the concrete resisting contribution during the pullout process of 12
NSM FRP reinforcement bridging a shear failure crack in the context of the use of these composite materials and 13
technique for the shear strengthening of RC beams [28]. Hence, in the current analytical model, the semi-pyramidal 14
configuration was adopted for the concrete tensile fracture surface at the extremities of each CFRP laminate applied 15
for flexural strengthening, as represented in Figure 5a. 16
The dimensions of this tensile fracture surface of the surrounding concrete (assumed by simplification as having a 17
semi-pyramid format) are supposed to be limited by some restrictions to consider the influence of the aforementioned 18
variables on the susceptibility of concrete cover delamination, and also simplify the model. These restrictions of the 19
semi-pyramid on the beam’s tensile surface aim to avoid interaction between the concrete fracture surfaces of 20
consecutive CFRP laminates. On the other hand, due to the possibility of occurring a weak plan just beneath the tensile 21
steel bars, the thickness of the semi-pyramid is limited to the concrete cover thickness (cc ) (Figure 5c). 22
Accordingly, the semi-pyramidal concrete fracture surface is assumed to be extended until the base area of the semi-23
pyramid (rectangular shape) reaches a boundary limit. This boundary limit is defined when the short side of the 24
rectangular base achieves the length of cc (Figure 5c), while the long side of this rectangular should be limited to25
'min ( ;2 )f fs s for the CFRP laminates near the beam edge (side-laminates) and fs for the mid-laminates (Figure 5b). 26

However, considering that fs is in general higher than 40 mm (Barros and Kotynia 2008) and the angle formed 1
by the principal generatrices of the semi-pyramid with the CFRP longitudinal axis (Figures 5b and 5c) is presumed to 2
be in the interval of 10 to 35 degrees (Bianco et al. 2014), the above boundary limit on the beam’s tensile surface 3
seems to be experimentally supported. 4
According to the base area and of the semi-pyramid of the concrete fracture surface (Figures 5a and 5c), the height 5
of the semi-pyramid can be defined as the resisting bond length (rbL ), where the slip between the CFRP laminate and 6
surrounding concrete is neglected along this length to calculate the resistance of the concrete fracture surface. The 7
resistance of the concrete fracture surface for each CFRP laminate (cfF ) can be determined by considering the concrete 8
tensile strength (ctf ). Accordingly, the ultimate flexural capacity of a strengthened beam developing a concrete cover 9
delamination failure mode ( ( )u
ccdM ) can be determined using the maximum applicable force to all the CFRP laminates 10
at the end section of rbL (section A-A in Figures 5b and 5c). 11
The implementation of the proposed methodology to predict the concrete cover delamination as prevailing failure 12
mode comprises the following steps (Figure 6): 1) providing the input parameters; 2) determination of the resisting 13
bond length (rbL ); 3) evaluation of the tensile strength of CFRP ( fuF ), maximum value of the force transferable 14
through the resisting bond length (rbF ), and concrete tensile fracture capacity (
cfF ) for each CFRP laminate; 4) 15
assessment the possibility of the concrete tensile fracture at the end of the CFRP laminate considering the 16
characteristics of bond conditions and the CFRP tensile strength; 5) determination of ultimate flexural capacity of the 17
strengthened beam adopting concrete cover delamination failure; 6) evaluation the possibility of occurrence of the 18
concrete cover delamination in comparison to the conventional prevailing failure modes including concrete crushing 19
and rupture of the CFRP far from its extremities. 20
1) Input parameter 21
The input parameters include: concrete cover thickness cc , angle between principal generatrices of the semi-22
pyramidal fracture surface and the CFRP longitudinal axis, number of the longitudinal CFRP laminates N , distance 23
between two adjacent CFRP laminates fs , distance between the beam edge and the nearest CFRP laminate
'
fs , 1
thickness fa and width
fb of laminate’s cross section, and values of local bond stress-slip relationship: maximum 2
shear stress max and maximum slip
max (Figure 5). 3
2) Resisting bond length rbL 4
The resisting bond length (rbL ) at each extremity of the CFRP laminate can be calculated as follows: 5
tan
crb
cL
(24) 6
3) Tensile strength of CFRP fuF , concrete tensile fracture capacity
cfF , and resisting bond force rbF 7
Tensile strength of the CFRP laminate can be determined by Eq. (25). It should be noted that in the case of a round 8
CFRP bar, its cross section is converted to an equivalent square cross sectional area. 9
. .fu f f fuF a b f (25) 10
The concrete tensile fracture capacity (cfF ) of each CFRP laminate, adopting a semi-pyramidal fracture surface, can 11
be determined considering the tensile resistance of concrete on the slant area of the semi-pyramid. It was evidenced 12
that the concrete tensile resistance of the slant area is equivalent to simply multiplying the base area of semi-pyramid 13
times the concrete tensile strength (Bianco 2008 [29]). Hence, for the current study, Eq. (26) is proposed to determine 14
the concrete tensile fracture capacity (cfF ) corresponding to each CFRP laminate. 15
'min 2. .tan ; 2. ; . .cf rb f f c ctF L s s c f (26) 16
The maximum value of the force (rbF ) that can be transferable through the resisting bond length (
rbL ) by the CFRP 17
laminate can be obtained by Eq. (27) adopting an idealized local bond-slip relationship with a single softening branch 18
as shown in Figure 5d (Bianco et al. 2014). 19
1 2
1
1( ) . . . . cos . 1 .sin .rb rb p rb rbF L L C L C L
J (27)-a 20
where 1
1
max 1 max 1max1 max 22 2 2
max 1
.12. ; .
..
. .1; ;
.
f fp
p f f
f c cf f
a bLL b a J
E A Ea b
J JC C
J
(27)-b 2
and cA is the cross sectional area of the surrounding concrete that provides confinement to each CFRP laminate, and 3
for side-laminates and mid-laminates can be obtained by Eqs. ((27)-c) and ((27)-d), respectively. 4
'min 2. ; .c f f cA s s c (27)-c 5
.c f cA s c (27)-d 6
The maximum bond force (rbF ) for the resisting bond length (
rbL ) should be limited to the maximum debonding 7
resistance (rbeF ) and its corresponding effective resisting bond length (
rbeL ) given in Eq. (28) (Bianco et al. 2014). 8
max
1
. .;
2.
p
rbe rbe
LL F
J
(28) 9
4) Assessment the possibility of concrete tensile fracture 10
This step of the algorithm aims to check which of the three types of failure modes occurs, namely, rupture of the 11
CFRP, interfacial debonding failure, or concrete tensile fracture when the tensile force is applied to the CFRP laminate 12
at the end section of resisting bond length (section A-A in Figure 5). In fact, the concrete tensile fracture can occur 13
when the concrete tensile fracture capacity (cfF ) corresponding to the CFRP laminate is a lower than the minimum of 14
the tensile strength of the CFRP ( fuF ) and the resisting bond force (rbF ). Otherwise, by increasing the applied force 15
to the CFRP laminate at the section A-A represented in Figure 5, either the rupture of the CFRP or interfacial 16
debonding failure would occur before the concrete tensile fracture (Figure 6). 17
5) Ultimate flexural capacity of the strengthened beam failed by concrete cover delamination 18

The effective concrete tensile fracture capacity (cfeF ) of the CFRP laminates can be determined by summing the 1
concrete tensile fracture capacity (cfF ) of all the CFRP laminates flexurally applied on the tensile face of the beam 2
(Eq. 29). 3
1
N
cfe cfi
i
F F
(29) 4
The flexural capacity ( ( )Lrb
ccdM ) of the strengthened beam at the end section of resisting bond length (section A-A in 5
Figure 5) can be obtained by Eq. (30) using the effective concrete tensile fracture capacity (cfeF ) of the CFRP 6
laminates, where the beam’s cross section is supposed to be located between the concrete cracking and steel yield 7
initiation phases (postcracking stage). Otherwise, for the section located in the postyielding stage, the contribution of 8
concrete in compression should be simulated by a rectangular compressive stress block (Eq. (1)), and the compressive 9
and tensile strains in the longitudinal top and bottom steel bars, respectively, should be limited by its yield strength (10
sy sy sf E ). 11
2 ' ' '
, , ( ) ,
1 . . . . . . . . . .3
cc ccd c ccd s ccd s s ccd s
Lrb
cc s ccd s s s ccd cfe ccdd fM E b c E A c d E A d c F d c (30) 12
where the strains of the components along the cross section can be determined adopting the proportional strain 13
distribution to the distance from the neutral axis depth (ccdc ) by considering the average tensile strain in the CFRP 14
laminates (, ( . . . )f ccd cfe f f fF N a b E ). 15
According to the principles of static equilibrium and proportionality of the strain distribution along the cross section, 16
the neutral axis depth (ccdc ) can be obtained using a quadratic equation represented in Eq. (31). 17
2. . 0ccd ccda c b c c (31)-a 18
where 19
'
' '
.
2. . . . . .
2. . . . . . . . .
c
s s s s f f f
s s s s s s f f f f
a E b
b E A E A E N a b
c E A d E A d E N a b d
(31)-b 1
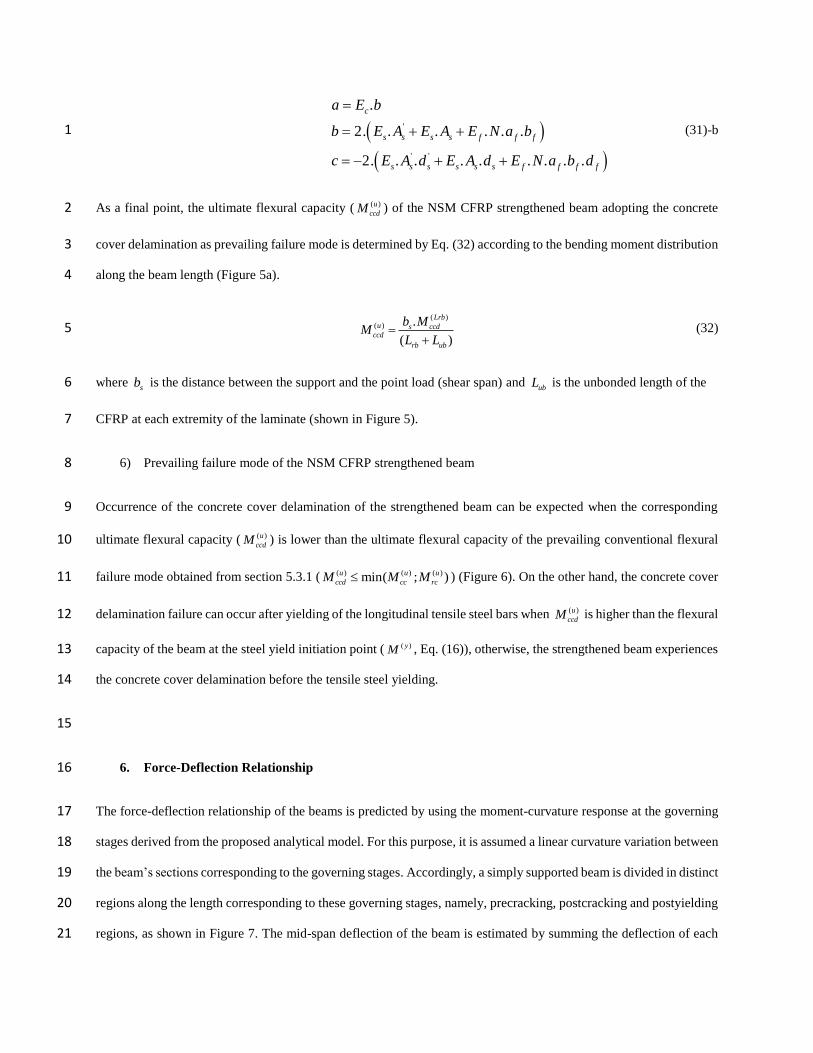
As a final point, the ultimate flexural capacity ( ( )u
ccdM ) of the NSM CFRP strengthened beam adopting the concrete 2
cover delamination as prevailing failure mode is determined by Eq. (32) according to the bending moment distribution 3
along the beam length (Figure 5a). 4
( )
( ) .
( )
Lrbu s ccd
ccd
rb ub
b MM
L L
(32) 5
where sb is the distance between the support and the point load (shear span) and
ubL is the unbonded length of the 6
CFRP at each extremity of the laminate (shown in Figure 5). 7
6) Prevailing failure mode of the NSM CFRP strengthened beam 8
Occurrence of the concrete cover delamination of the strengthened beam can be expected when the corresponding 9
ultimate flexural capacity ( ( )u
ccdM ) is lower than the ultimate flexural capacity of the prevailing conventional flexural 10
failure mode obtained from section 5.3.1 ( ( ) ( ) ( )min( ; )u u u
ccd cc rcM M M ) (Figure 6). On the other hand, the concrete cover 11
delamination failure can occur after yielding of the longitudinal tensile steel bars when ( )u
ccdM is higher than the flexural 12
capacity of the beam at the steel yield initiation point ( ( )yM , Eq. (16)), otherwise, the strengthened beam experiences 13
the concrete cover delamination before the tensile steel yielding. 14
15
6. Force-Deflection Relationship 16
The force-deflection relationship of the beams is predicted by using the moment-curvature response at the governing 17
stages derived from the proposed analytical model. For this purpose, it is assumed a linear curvature variation between 18
the beam’s sections corresponding to the governing stages. Accordingly, a simply supported beam is divided in distinct 19
regions along the length corresponding to these governing stages, namely, precracking, postcracking and postyielding 20
regions, as shown in Figure 7. The mid-span deflection of the beam is estimated by summing the deflection of each 21

region (i ) in one-half of the beam length ( 2L ) (Figure 8) [25]. The deflection of the each region can be determined 1
by integrating the function, ( )x , that defines the curvature along the length of this region: 2
1
1
( ) ( ). . ( )i i
Li
i L L i
Li
x x d x
(33) 3
where x is a variable along this region, and iL and
1iL are the distances of the section boundaries of this region to 4
the support. 5
The negative camber (upward deflection) ( ( )cid ) of the prestressed strengthened beam can be obtained by considering 6
the constant curvature variation due to the effective negative bending moment (( ). . .ci
epre ef f fM E A e ) at both 7
extremities of the bonded length of CFRP reinforcement (bL ), as shown in Figure 8a: 8
/2
( ) ( ). (2. )
. .8. .
ub
Lepre b bci ci
ec ucrL
M L L Ld x dx
E I
(34) 9
where ( )cie is the effective initial negative curvature by considering the effective negative bending moment, and
ucrI 10
is the moment of inertia of the uncracked section (Appendix A1). 11
The mid-span deflection of the beam at the concrete crack initiation is calculated adopting the curvature variation 12
along the length of the beam (see Figure 8b) by using Eq. (35). The mid-span deflection corresponding to the concrete 13
and steel decompression points can also be obtained by substituting ( )cd and ( )sd into Eq. (35) instead of ( )cr , 14
respectively. 15
/2( )
( ) 2 ( ) ( ) ( )(0 ) ( /2)
0
( ). . . .s
s s
s
b Lcrcr cr cr cr
b b Ls b
d x dx x dxb
(35) 16
To predict the mid-span deflection at the steel yield initiation stage, the beam length should be divided into the 17
precracking and postcracking regions (Figure 7). In the precracking region, the bending moment is less than the crack 18
initiation moment ( ( )crM ), while the bending moment within the postcracking region is limited to the steel yield 19

initiation moment ( ( )yM ). The mid-span deflection of the beam can be determined by Eq. (36) assuming a linear 1
variation of the curvature between the governing sections, as represented in Figure 8c. 2
( )
( )
( ) ( )
/2( ) ( ) ( )( ) 2 ( ) ( ) ( )
( ) ( )
0
( ) ( ) ( )( )(0 ) ( )
( ). . (( ).( ) ). . . .
y
cr s
y
cr s
y yscr cr s
L b Lcr y cry y cr y
cry ycr s crL b
y y yb L/ 2L L b
d x dx x L x dx x dxL b L
(36) 3
where ( )y
crL is the length of the precracking region at the steel yield initiation stage (Figure 7 and 8c). 4
The mid-span deflection of the beam at the ultimate stage can be determined by dividing the beam length in three 5
regions (precracking, postcracking, and postyielding), by considering the trilinear moment-curvature relationship 6
represented in Figure 7. The maximum bending moment within the precracking and postcracking regions are limited 7
by the crack initiation ( ( )crM ) and steel yield initiation ( ( )yM ) bending moments, while the ultimate flexural moment 8
of the beam limits the bending moment in the postyielding region. According to the linear variation of the curvature 9
in the three regions of the governing stages, as shown in Figure 8d, Eq. (37) can be considered to calculate the mid-10
span deflection of the beam corresponding to its flexural capacity. 11
( )( )
( ) ( )
( ) ( ) ( ) (
( ) ( ) ( ) ( ) ( )( ) 2 ( ) ( ) ( ) ( )
( ) ( ) ( ) ( )
0
/2( ) ( ) ( )
(0 ) ( ) (
( ). . (( ).( ) ). . (( ).( ) ). .
. .
uuycr s
u u
cr y
u u u u
cr cr y y
s
LL bcr y cr u yu u cr u y
cr yu u u ucr y cr s yL L
Lu u u
L L L Lb
d x dx x L x dx x L x dxL L L b L
x dx
)
( ) ( )( )) ss
u ub L/ 2b
(37) 12
where ( )u
crL is the length of the precracking region, and ( )u
yL is the distance of ( )y from the support along the beam 13
length at ultimate stage. 14
It is worth to note that the load ( P ) corresponding to the flexural bending moment at the governing stages for the 15
simply supported beams under four-point loading configuration can be computed by using Eq. (38). 16
( )
4.i
i
L
MP
L a
(38) 17
where La is the loading span represented in Figure 3. 18
1
7. Assessment of Predictive Performance of the Analytical Approach 2
7.1. Conventional flexural failure modes 3
To assess the predictive performance of the proposed analytical model, it is applied on the prediction of the force-4
deflection relationship of the beams forming three experimental programs conducted by Rezazadeh et al. [13], Badawi 5
and Soudki [11], and El-Hacha and Gaafar [12]. These experimental programs are composed of RC beams 6
strengthened with prestressed NSM CFRP reinforcement failed by conventional flexural failure modes, and included 7
an unstrengthened RC beam serving as a control beam, as well as a strengthened beam with a non-prestressed NSM 8
CFRP reinforcement. The level of the prestress force applied to the CFRP reinforcement was 20%, 30% and 40% of 9
its nominal tensile strength in series 1 of the tested beams [13], 40% and 60% in series 2 [11], and 20%, 40% and 60% 10
in series 3 [12]. 11
The data defining the geometry and reinforcement details of the three series of the experimental programs is included 12
in Table 1. All beams were simply supported, and were monotonically tested under four-point loading. It is worth to 13
note that the shear reinforcement ratio and spacing of the stirrups in all the RC beams were designed to avoid the shear 14
failure. The average values of the main properties for concrete, longitudinal steel bars and CFRP elements are indicated 15
in Table 2, where the nominal properties of the CFRP reinforcement were supplied by manufacturer. The used epoxy 16
adhesive provided a proper bond in all cases and, therefore, the analytical formulation previously described is 17
applicable. 18
Two types of failure modes of the tested beams were experimentally observed: concrete crushing; rupture of the CFRP 19
reinforcement (both after yielding of the tensile steel reinforcement). The prevailing failure modes of the beams at the 20
maximum capacity were analytically predicted similar to the ones experienced experimentally (using the critical 21
percentage of the CFRP reinforcement (Eq. 17)), except in the case of the non-prestressed strengthened beam in series 22
3 (see Table 5). This can be attributed to the value of the compressive strain experimentally observed on the top fiber 23
of concrete (0.0039 [12]) at the CFRP failure, which is higher than the analytical limit assumed for concrete crushing 24
(0.003). The load versus mid-span deflection relationship obtained analytically and registered experimentally for the 25
all beams of series 1, 2, and 3 is compared in the Figure 9, 10, and 11, respectively. A good predictive performance 26

of the proposed analytical model is achieved for all the tested beams. Tables 3, 4, and 5 compares the values obtained 1
analytically and registered experimentally for the governing stages of the flexural response of the beams, and also 2
include the short-term prestress loss, initial camber, and prevailing conventional failure mode. 3
In order to evaluate the efficiency of the proposed simplified analytical approach (formed by a trilinear response), the 4
moment-curvature relationship ( M ) of the non-prestressed and 40% prestressed strengthened beams of the series 5
3 obtained with this approach is compared to the one determined by using a sectional analysis software developed at 6
University of Minho (DOCROS-Design Of CROss Sections). DOCROS assumes that a plane section remains plane 7
after deformation and perfect bond exists between distinct materials. According to DOCROS, a cross section is divided 8
in horizontal layers, and the thickness and width of each layer is user-defined and depend on the cross-section 9
geometry. DOCROS can analyze sections of irregular shape and size, composed of different types of materials 10
subjected to an axial force and variable curvature. Composite layers are used when more than one material exist at 11
same depth of the cross section. Each layer can have an initial non-null stress in order to simulate a prestress effect. 12
DOCROS has a wide database of constitutive laws for the simulation of monotonic and cyclic behavior of cement 13
based materials, polymer based materials and steel bars. More detailed information about DOCROS can be found in 14
[30]. 15
In the analysis carried out with DOCROS, the cross section of the non-prestressed and 40% prestressed strengthened 16
beams of the series 3 was discretized in horizontal layers of 1 mm thick. Moreover, in the case of the prestressed 17
section, an initial prestrain was applied to the layers corresponding to the CFRP reinforcement in order to simulate the 18
prestress effect. 19
The behavior of concrete in uniaxial compression was simulated by the stress-strain relationship proposed by CEB-20
FIP model code [31], while the behavior of concrete in tension was assumed linear up to its tensile strength and the 21
post-cracking residual strength was neglected in order to provide a more realistic comparison with the analytical 22
approach as described by the diagram represented in Figure 12a [7]. To simulate both tension and compression 23
behavior of the steel bars, the stress-strain relationship represented in Figure 12b was used [7]. The tensile behavior 24
of the CFRP reinforcement was assumed linear up to its ultimate tensile strength. 25
In Figure 13, the predictive performance of the proposed analytical approach in terms of moment-curvature and neutral 1
axis-curvature relationships is assessed by comparing the results obtained experimentally and numerically (DOCROS) 2
for the non-prestressed and 40% prestressed strengthened beams of the series 3. This figure evidences a good 3
predictive performance for the proposed simplified analytical approach. It should be noted that the experimental 4
moment-curvature and neutral axis-curvature relationships of the analyzed beams were determined by using the strains 5
of components along the mid-span cross section of the aforementioned beams reported by [12]. 6
To evaluate the level of accuracy of the proposed analytical approach on the prediction of force-deflection using the 7
M relationship, the mid-span deflection of the non-prestressed and 40% prestressed strengthened beams of the 8
series 3 was analytically and numerically obtained using the proposed analytical approach and Def-DOCROS 9
software. For this purpose, the M relationship obtained in section 5 by using the analytical and numerical 10
approaches was used. According to Def-DOCROS software, a statically determinate beam is discretized in Euler-11
Bernoulli beam elements of 2 nodes. The updated flexural stiffness of each element is determined from the M 12
relationship of the cross section representative of the element by using a matrix displacement approach described 13
elsewhere [30]. The experimental, analytical, and numerical force-deflection relationships for the aforementioned 14
beams are compared in Figures 13e and 13f, where it is visible that the proposed analytical approach has high level of 15
predictive performance accuracy. 16
7.2. Concrete cover delamination failure mode 17
The proposed methodology for the prediction of the ultimate flexural capacity of the NSM CFRP strengthened beams 18
with concrete cover delamination failure, was applied to six NSM CFRP strengthened beams tested by Sharaky et al. 19
[32], Sharaky [33], Al-Mahmoud et al. [34], Barros and Fortes [7] and Barros et al. [35]. The support and loading 20
configuration of the tested beams are schematically represented in Figures 3 and 5a. The geometry, steel and CFRP 21
reinforcement details of the strengthened beams are described in Table 6. Moreover, the main material properties of 22
the tested beams are represented in Table 7. The shear reinforcement ratio and spacing of stirrups were adopted for all 23
the beams in order to avoid the shear failure. 24
The parameters of local bond-slip relationship for all the tested beams were adopted similar to the corresponding 25
values considered by [28]: max 20.1MPa and
max 7.12mm . On the other side, the angle ( ) between the CFRP 26
longitudinal axis and generatrices of the concrete fracture surface (semi-pyramid) for all the investigated beams was 1
found equal to 35o by considering the best ultimate flexural capacity for the strengthened beams by using a back 2
analysis of the experimental data. Moreover, this value of was adopted considering the recommended range by 3
[28] (10o-35o). 4
The ultimate flexural capacity obtained analytically and registered experimentally for all the tested beams is compared 5
in Table 8, where it can be confirmed that the ultimate flexural capacity of the strengthened beams when failing by 6
the concrete cover delamination was analytically predicted less than the one corresponding to the prevailing 7
conventional flexural failure modes ( ( ) ( ) ( )min( ; )u u u
ccd cc rcP P P ). Table 8 also indicates the comparison between the 8
concrete tensile fracture capacity (cfF ) with the tensile strength of CFRP (
fuF ) and resisting bond force (rbF ) 9
corresponding to the resisting bond length (rbL ) for each CFRP laminate. A good predictive performance of the 10
analytical approach in terms of the ultimate flexural capacity of the strengthened beams when failing by concrete 11
cover delamination is evidenced by considering the ratio between the analytical and experimental flexural capacity of 12
the tested beams ( ( ) ( )expu u
ccd ccdP P ), where this ratio was found between [0.83-1.13] for all the tested beams. 13
14
8. Conclusions 15
In the current study, an analytical approach was developed based on the strain compatibility and principles of static 16
equilibrium to predict the moment-curvature and load-deflection relationships of simply supported beams 17
strengthened with prestressed CFRP reinforcement that can be applied according to the EBR or NSM techniques. 18
The presented formulation assumes that the moment-curvature response of a beam’s cross section can be simulated 19
by a trilinear diagram defining precracking, postcracking, and postyielding stages. Two further stages are proposed, 20
namely: concrete and steel decompression stages, to assess the initial effects of the prestress force applied by the 21
CFRP reinforcement. A linear variation is assumed for the curvature along the beam length between the sections 22
corresponding to the governing stages of the beam’s response in order to simplify the calculation of the beam’s 23
deflection. The flexural capacity of the strengthened beams according to either EBR or NSM techniques is 24
predicted adopting two types of failure modes, comprising yielding of the steel bars in tension followed by either 25
concrete crushing or rupture of the CFRP reinforcement. 26

In the case of the NSM technique, a design framework methodology is proposed to obtain the ultimate flexural 1
capacity of the NSM CFRP strengthened beams when failing by concrete cover delamination. Concrete cover 2
delamination is predicted by assessing the possibility of occurring the concrete tensile fracture at the extremities 3
of the CFRP reinforcement in comparison with debonding and rupture of the CFRP failure modes. Finally, the 4
concrete cover delamination is adopted as prevailing failure of the strengthened beams when its ultimate flexural 5
capacity is less than the one corresponding to the occurrence of the conventional flexural failure modes (concrete 6
crushing or rupture of the CFRP reinforcement). 7
The results of three experimental programs composed of RC beams strengthened with prestressed NSM CFRP 8
reinforcement, failed by conventional flexural failure modes, were compared with the ones obtained by the 9
proposed analytical approach, and a good predictive performance was determined. Moreover, the results in terms 10
of moment-curvature and force-deflection relationships obtained with the proposed model and by using a computer 11
package (DOCROS and Def-DOCROS software) based on a cross section layer model were compared. The results 12
showed that the proposed analytical approach can accurately simulate the effect of the prestress force on the 13
flexural behavior of the NSM CFRP strengthened beam (by introducing the concrete and steel decompression 14
points as an initial condition to the concrete cracking and steel yielding initiation points of the non-prestressed 15
strengthened beam) compared to the use of a cross section layer model. 16
On the other hand, the predictive performance of the proposed methodology for concrete cover delamination failure 17
was evaluated by considering the ultimate load carrying capacity of six NSM CFRP strengthened beams failed 18
according to this failure mode. The proposed formulation provided a good estimate of the ultimate load carrying 19
capacity for concrete cover delamination as prevailing failure mode, resulting the ratio of the analytical and 20
experimental flexural capacity of the tested beams of a mean value and a standard deviation of 0.99 and 0.10, 21
respectively. According to this proposed methodology, by increasing the unbonded length of the CFRP 22
reinforcement at its extremities, the resistance to the occurrence of concrete cover delamination can decrease, while 23
a higher concrete tensile strength and also, a higher concrete cover depth below the tensile steel bars can increase 24
this resistance. On the other side, this resistance is influenced by the distance between the two adjacent CFRPs, as 25
well as distance between the lateral face of the beam’s cross section and the nearest CFRP. Accordingly, by 26
adopting a strengthening configuration for consecutive NSM CFRPs according to minimizing the interaction of 27

the concrete tensile fracture of the adjacent CFRPs can provide the maximum resistance to the occurrence of 1
concrete cover delamination. 2
3
Acknowledgment 4
The study reported in this paper is part of the project “PreLami - Performance of reinforced concrete structures 5
strengthened in flexural with an innovative system using prestressed NSM CFRP laminates”, with the reference 6
PTDC/ECM/114945/2009. The third author also wishes to acknowledge the scholarship granted by FCT 7
(SFRH/BD/61756/2009). The authors would also like to acknowledge the support provided by S&P, for supplying the 8
adhesives and the laminates, and Casais and CiviTest for the preparation of the beams. 9
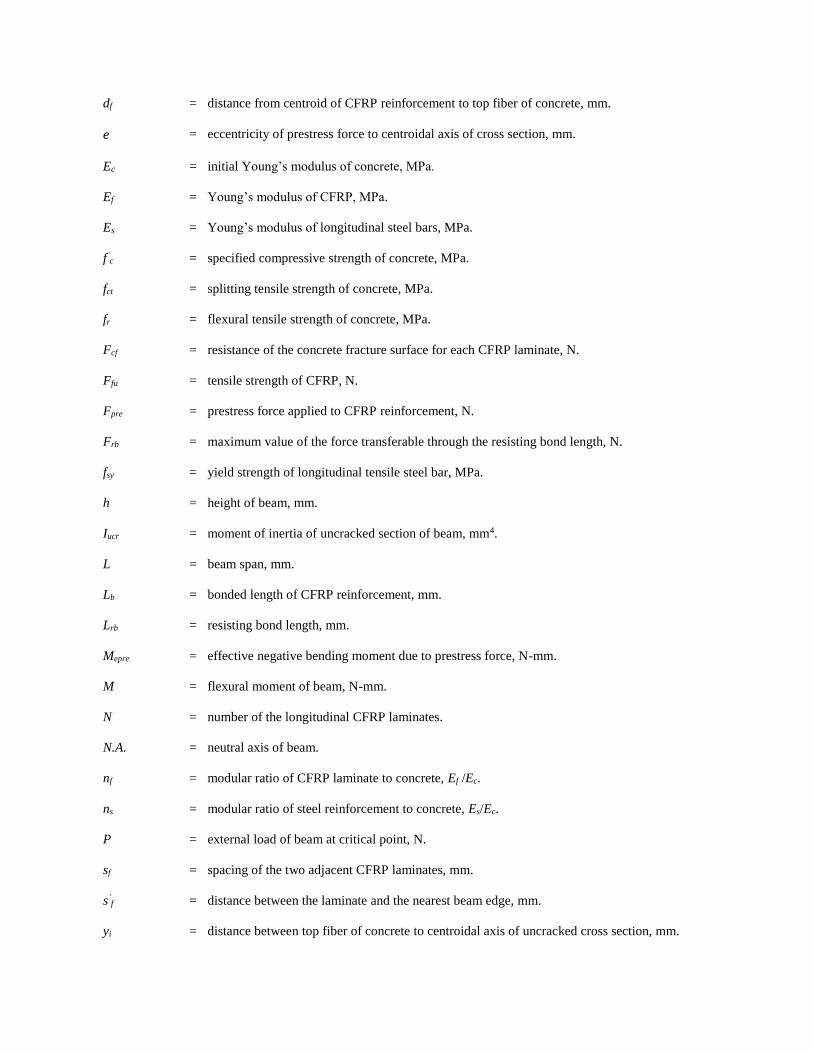
Notations 10
The following symbols are used in this paper: 11
Af = area of CFRP reinforcement, mm2.
Agroove = area of groove for NSM technique, mm2.
As = area of tensile steel bars, mm2.
A’s = area of compressive steel bars, mm2.
af = thickness of CFRP laminate, mm.
aL = loading span, mm.
b = width of beam, mm.
bf = width of CFRP laminate, mm.
bs = shear span, mm.
c = depth of neutral axis from top fiber of concrete at critical point, mm.
cc = concrete cover for the bottom face of the beam, mm.
ccri = depth of neutral axis from top fiber of concrete at critical CFRP reinforcement ratio, mm.
ds = distance from centroid of tensile steel bars to top fiber of concrete, mm.
d's = distance from centroid of compressive steel bars to top fiber of concrete, mm.
df = distance from centroid of CFRP reinforcement to top fiber of concrete, mm.
e = eccentricity of prestress force to centroidal axis of cross section, mm.
Ec = initial Young’s modulus of concrete, MPa.
Ef = Young’s modulus of CFRP, MPa.
Es = Young’s modulus of longitudinal steel bars, MPa.
f’c = specified compressive strength of concrete, MPa.
fct = splitting tensile strength of concrete, MPa.
fr = flexural tensile strength of concrete, MPa.
Fcf = resistance of the concrete fracture surface for each CFRP laminate, N.
Ffu = tensile strength of CFRP, N.
Fpre = prestress force applied to CFRP reinforcement, N.
Frb = maximum value of the force transferable through the resisting bond length, N.
fsy = yield strength of longitudinal tensile steel bar, MPa.
h = height of beam, mm.
Iucr = moment of inertia of uncracked section of beam, mm4.
L = beam span, mm.
Lb = bonded length of CFRP reinforcement, mm.
Lrb = resisting bond length, mm.
Mepre = effective negative bending moment due to prestress force, N-mm.
M = flexural moment of beam, N-mm.
N = number of the longitudinal CFRP laminates.
N.A. = neutral axis of beam.
nf = modular ratio of CFRP laminate to concrete, Ef /Ec.
ns = modular ratio of steel reinforcement to concrete, Es/Ec.
P = external load of beam at critical point, N.
sf = spacing of the two adjacent CFRP laminates, mm.
s’f = distance between the laminate and the nearest beam edge, mm.
yi = distance between top fiber of concrete to centroidal axis of uncracked cross section, mm.
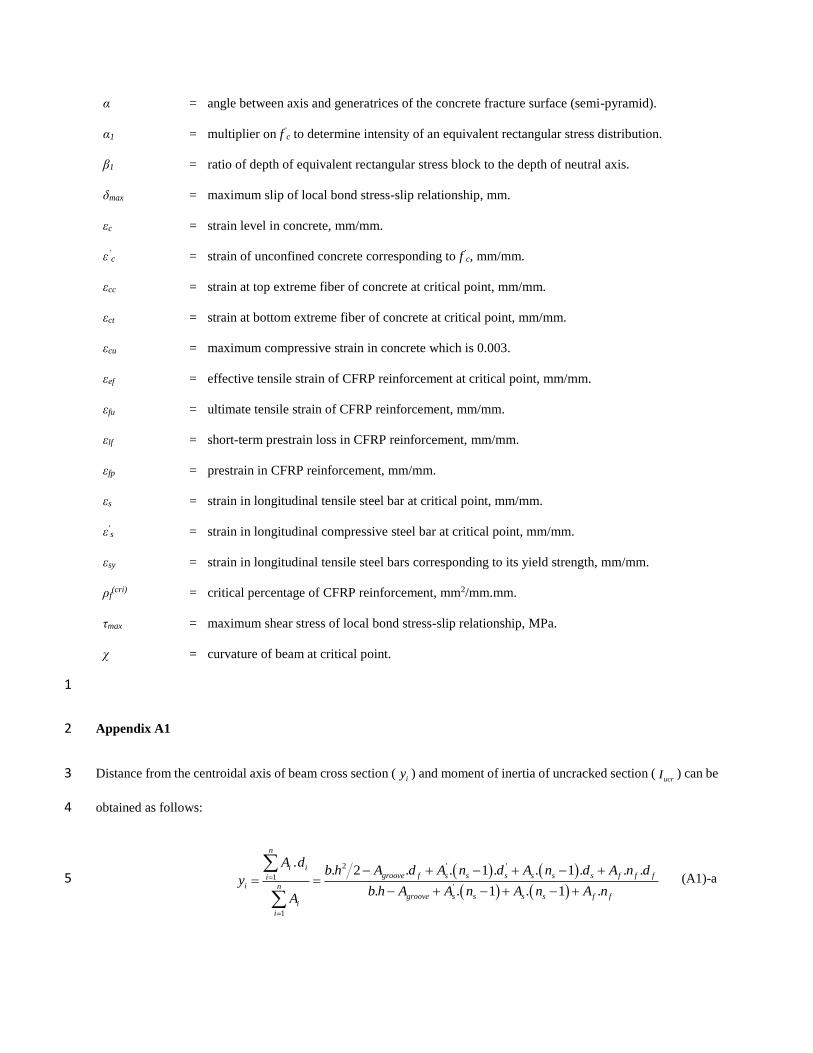
α = angle between axis and generatrices of the concrete fracture surface (semi-pyramid).
α1 = multiplier on f’c to determine intensity of an equivalent rectangular stress distribution.
β1 = ratio of depth of equivalent rectangular stress block to the depth of neutral axis.
δmax = maximum slip of local bond stress-slip relationship, mm.
εc = strain level in concrete, mm/mm.
ε’c = strain of unconfined concrete corresponding to f’c, mm/mm.
εcc = strain at top extreme fiber of concrete at critical point, mm/mm.
εct = strain at bottom extreme fiber of concrete at critical point, mm/mm.
εcu = maximum compressive strain in concrete which is 0.003.
εef = effective tensile strain of CFRP reinforcement at critical point, mm/mm.
εfu = ultimate tensile strain of CFRP reinforcement, mm/mm.
εlf = short-term prestrain loss in CFRP reinforcement, mm/mm.
εfp = prestrain in CFRP reinforcement, mm/mm.
εs = strain in longitudinal tensile steel bar at critical point, mm/mm.
ε's = strain in longitudinal compressive steel bar at critical point, mm/mm.
εsy = strain in longitudinal tensile steel bars corresponding to its yield strength, mm/mm.
ρf(cri) = critical percentage of CFRP reinforcement, mm2/mm.mm.
τmax = maximum shear stress of local bond stress-slip relationship, MPa.
χ = curvature of beam at critical point.
1
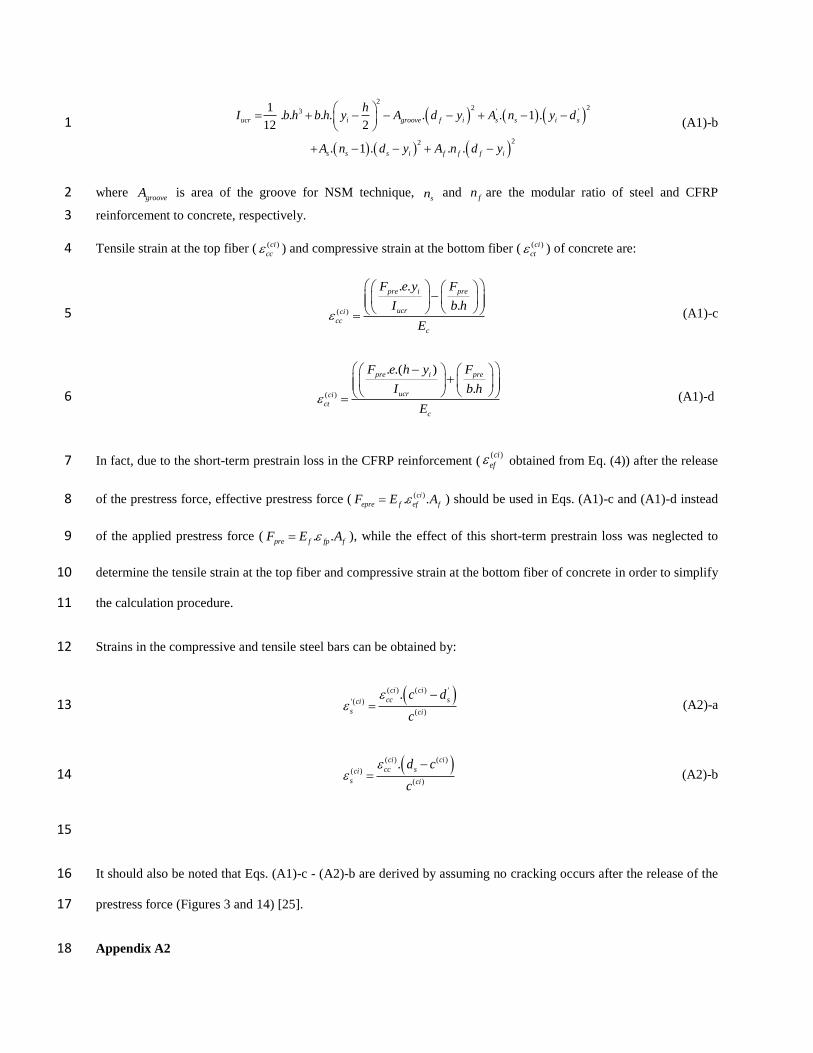
Appendix A1 2
Distance from the centroidal axis of beam cross section (iy ) and moment of inertia of uncracked section (
ucrI ) can be 3
obtained as follows: 4
2
1
1
' '
'
. 1 ..
. . 1 . .
. 1 . 1
2
.
. .
.
groove f s s s s s s f f f
n
i i
ii n
igroove s s s s
i
f f
A db h
yb h
A d A n d A n d A n d
A A n A n AA
n
(A1)-a 5
222
3 ' '
22
1 . . . . . . 1 .12 2
. 1 . . .
i iucr groove f s s s
s
i
i is s f f f
hI b h b h A d A n dy y
A n d A n
y
y yd
(A1)-b 1
where grooveA is area of the groove for NSM technique,
sn and fn are the modular ratio of steel and CFRP 2
reinforcement to concrete, respectively. 3
Tensile strain at the top fiber ( ( )ci
cc ) and compressive strain at the bottom fiber ( ( )ci
ct ) of concrete are: 4
( )
. .
.
pre i pre
ucrci
cc
c
F e y F
I b h
E
(A1)-c 5
( )
. .( )
.
pre i pre
ucrci
ct
c
F e h y F
I b h
E
(A1)-d 6
In fact, due to the short-term prestrain loss in the CFRP reinforcement (( )ci
ef obtained from Eq. (4)) after the release 7
of the prestress force, effective prestress force ( ( ). .ci
epre f ef fF E A ) should be used in Eqs. (A1)-c and (A1)-d instead 8
of the applied prestress force ( . .pre f fp fF E A ), while the effect of this short-term prestrain loss was neglected to 9
determine the tensile strain at the top fiber and compressive strain at the bottom fiber of concrete in order to simplify 10
the calculation procedure. 11
Strains in the compressive and tensile steel bars can be obtained by: 12
( ) ( ) '
'( )
( )
.ci ci
cc sci
s ci
c d
c
(A2)-a 13
( ) ( )
( )
( )
.ci ci
cc sci
s ci
d c
c
(A2)-b 14
15
It should also be noted that Eqs. (A1)-c - (A2)-b are derived by assuming no cracking occurs after the release of the 16
prestress force (Figures 3 and 14) [25]. 17
Appendix A2 18
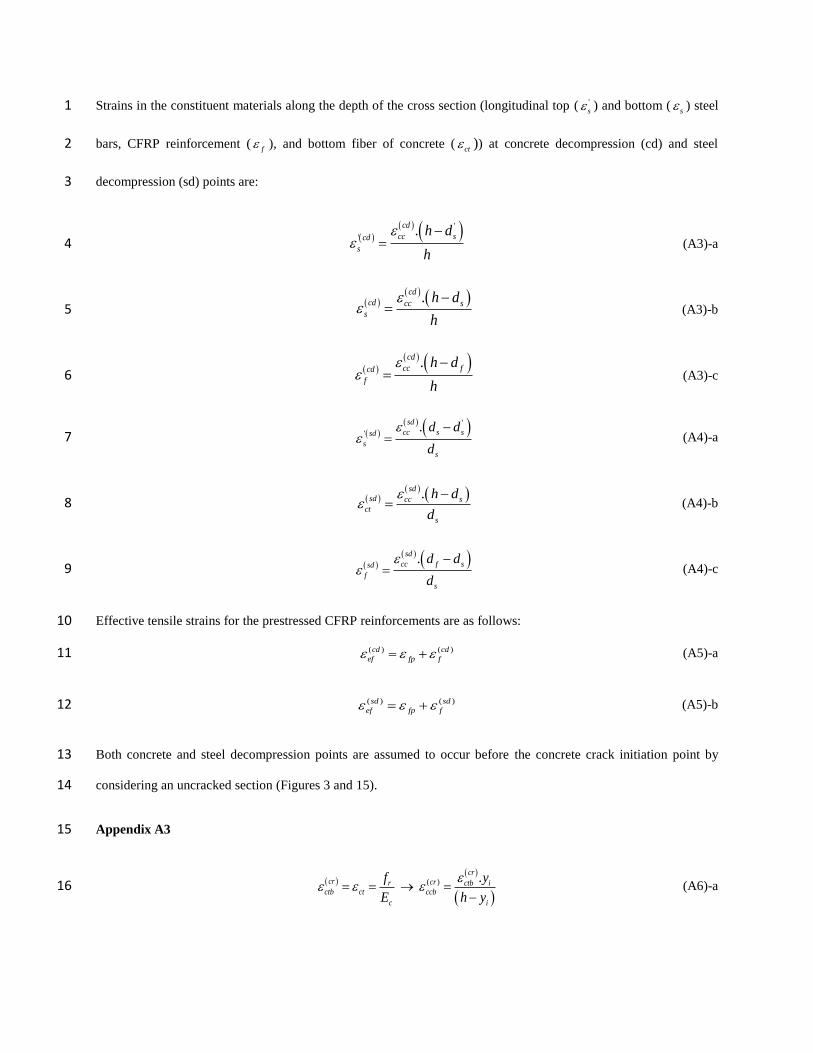
Strains in the constituent materials along the depth of the cross section (longitudinal top ( '
s ) and bottom (s ) steel 1
bars, CFRP reinforcement (f ), and bottom fiber of concrete (
ct )) at concrete decompression (cd) and steel 2
decompression (sd) points are: 3
'
'.
cd
cc scd
s
h d
h
(A3)-a 4
.cd
cd cc s
s
h d
h
(A3)-b 5
.cd
cc fcd
f
h d
h
(A3)-c 6
'
'.
sd
cc s ssd
s
s
d d
d
(A4)-a 7
.sd
sd cc s
ct
s
h d
d
(A4)-b 8
.sd
cc f ssd
f
s
d d
d
(A4)-c 9
Effective tensile strains for the prestressed CFRP reinforcements are as follows: 10
( ) ( )cd cd
ef fp f (A5)-a 11
( ) ( )sd sd
ef fp f (A5)-b 12
Both concrete and steel decompression points are assumed to occur before the concrete crack initiation point by 13
considering an uncracked section (Figures 3 and 15). 14
Appendix A3 15
( ) .
crcr crr ctb i
ctb ct ccb
c i
f y
E h y
(A6)-a 16

Strain components of the longitudinal steel bars in compression ( ' cr
sb ) and in tension ( cr
sb ), and CFRP 1
reinforcement ( r
fb
c ) can be obtained by: 2
'
'.
cr
ccb i scr
sb
i
y d
y
(A6)-b 3
.cr
cr ccb s i
sb
i
d y
y
(A6)-c 4
.cr
ccb f i
fb
cr
i
d y
y
(A6)-d 5
Uncracked section was assumed to determine Eqs. (A6)-a - (A6)-d (Figures 2a and 3). 6
Appendix A4 7
By adopting the principles of static equilibrium at the steel yield initiation point (Figure 2b): 8
'( ) ' ( )1. . . . . . . . . 0
2
y yy y
ccb c b s sb s s sb s f f f
y
bE c b A E A E A E (A7) 9
where compressive strains at the top fiber of concrete ( y
ccb ) and longitudinal top steel bars ( ' y
sb ), and tensile strain 10
in the CFRP reinforcement ( y
fb ) can be obtained by: 11
( ) ( )
( )
.y yy sb b
ccb y
s b
c
d c
(A8)-a 12
( ) ( ) '
'
( )
.y y
sb by s
sb syy
s b
c d
d c
(A8)-b 13
( ) ( )
( )
.y y
sb f by
fb y
s b
d c
d c
(A8)-c 14
The equations represented in this section are determined by assuming a cracked section, and also the resistance of 15 concrete in tension is neglected (Figures 2b and 3) [25]. 16
Appendix A5 17

The critical percentage of CFRP reinforcement ( ( )cri
f ) can be determined assuming simultaneous tension and 1
compression failures (Figure 16a): 2
' ( ) ' '( ) ( )
1 1. . . . . . . . . 0cri cri cri
c s s s s sy f fu ff c b A E A f A E (A9) 3
where the neural axis depth ( ( )cric ) and strain components in the longitudinal top ( ' cri
s ) and bottom ( cri
s ) steel 4
bars at simultaneous tension and compression failures are: 5
( )
.
(( ) )
f cucri
fu fp cu
dc
(A10) 6
( ) '
'
( )
'( ).
.
cri
cu scri
s cr
cri
syi s s sy
c dif E fnot
c
(A11)-a 7
( )
( )
( ).
cri
cr
cu scri cri
s sy s yi s s
d cE f
c
(A11)-b 8
The equations of this section are derived by assuming a cracked section, and also the resistance of concrete in tension 9
is neglected (Figures 3 and 16a) [25]. 10
Concrete Crushing 11
From the strain profile of the cross section when the concrete crushing occurs (Figure 16b): 12
'' ( ) '
1 1 cc , ,. . . . . . . . . 0cc
u uu
c s s s s sy f f ccff c b A E A f A E (A12) 13
where compressive strains in the longitudinal top steel bars ( '
,
u
s cc ), and tensile strain in the CFRP reinforcement (14
,
u
fb cc ) can be obtained from the following equations: 15
( ) '
cc'
, ,( )
cc
'.
.
u
cu su u
s c sy s s syc ccu
c di t
cff no E
(A13)-a 16
( )
cc
, , ,( )
cc
.
u
f cuu u u
fb cc f cc fb cc fp fuu
d c
c
(A13)-b 17
Rupture of CFRP Reinforcement 18

The equilibrium of the internal forces, when the rupture of the CFRP reinforcement occurs, results in the following 1
equation (Figure 16c): 2
'' ( ) '
1 1 ,. . . . . . . . 0uu
c rc s s rc s s sy f fuf c b A E A f A f (A14) 3
where compressive strains at the top fiber of concrete (
,
u
cc rc ) and in the longitudinal top steel bars ( '
,
u
s rc ), and 4
tensile strain in the CFRP reinforcement (
,
u
fb rc ) can be obtained by: 5
( )
,
, ( )
.u u
u fb rc rc
cc rc u
f rc
c
d c
(A15)-a 6
,
u
fb rc fu fp (A15)-b 7
'
( ) '
,'
, ,( )
. .
u u
fb rc rc su u
s rc rcu
f r
sy
c
s s sy
c dif n fot
d cE
(A16) 8
9
References 10
[1] ACI-440.2R. Guide for the Design and Construction of Externally Bonded FRP Systems for Strengthening 11
Concrete Structures. American Concrete Institute, 2008. 12
[2] CAN/CSA-S6-00. Canadian Highway Bridge Design Code. Toronto, Canada, 2000. 13
[3] ISIS Canadian Network of Centres Excellence. Prestressing Concrete Structures with Fibre Reinforced Polymers. 14
9. Department of Civil Engineering, University of Calgary, Contributor: Raafat El-Hacha, 2007; p. 14. 15
[4] Dias, S., and Barros, J. Shear Strengthening of RC Beams with NSM CFRP Laminates: Experimental Research 16
and Analytical Formulation. Composite Structures. 2012; 99:477-90. 17
[5] Rabinovitch, O., and Frosting, Y. Experimental and Analytical Comparison of RC Beams Strengthened with CFRP 18
Composites. Composite Part B: Engineering. 2003; 34:14. 19
[6] El-Hacha, R., and Rizkalla, S. Near-Surface-Mounted Fiber-Reinforced Polymer Reinforcements for Flexural 20
Strengthening of Concrete Structures. ACI Structural Journal. 2004; 101(5):717-26. 21
[7] Barros, J., and Fortes, A. Flexural Strengthening of Concrete Beams with CFRP Laminates Bonded into Slits. 1
Cement and Concrete Composites. 2005; 27(4) p:471-80. 2
[8] De Lorenzis, L., and Teng, J. Near-Surface Mounted FRP Reinforcement: an Emerging Technique for Structural 3
Strengthening. Composite Part B: Engineering, 2007;39(2):119-49. 4
[9] Bilotta, A., Ceroni, F., Nigro, E., and Pecce, M. Bond Behavior of FRP NSM Systems in Concrete Elements. 5
composite Part B: Engineering, 2012;43(2):99-109. 6
[10] Nordin, H., and Taljsten, B. Concrete Beams Strengthened with Prestressed Near Surface Mounted CFRP. 7
Journal of Composites for Construction. 2006; 60-8. 8
[11] Badawi, M., and Soudki, K. Flexural Strengthening of RC Beams with Prestressed NSM CFRP Rods- 9
Experimental and Analytical Investigation. Construction and Building Materials. 2009; 3292-300. 10
[12] El-Hacha, R., and Gaafar, M. Flexural Strengthening of Reinforced Concrete Beams Using Prestressed Near-11
Surface-Mounted CFRP Bars. PCI Journal. 2011. 12
[13] Rezazadeh, M., Costa, I., and Barros, J. Influence of Prestress Level on NSM CFRP Laminates for the Flexural 13
Strengthening of RC Beams. Composite Structures. 2014; 116:489-500. 14
[14] Hajihashemi, A., Mostofinejad, D., and Azhari, M. Investigation of RC Beams Strengthened with Prestressed 15
NSM CFRP Laminates. Journal of Composites for Construction (ASCE). 2011; 15(6.). 16
[15] Rezazadeh, M., and Barros, J. A New Hybrid Methodology According to Near Surface Mounted Carbon Fiber 17
Reinforced Polymer Technique for the Flexural Strengthening of Reinforced Concrete Beams. Reinforced Plastics 18
and Composites, 2014; DOI: 10.1177/0731684414551374. 19
[16] Xue, W., Tan, Y., and Zeng, L. Flexural Response Predictions of Reinforced Concrete Beam Strengthened with 20
Prestressed CFRP plates. Composite Structures. 2009; 92:612-22. 21
[17] Teng, J., Smith, S., Yao, J., and Chen, J. Intermediate Crack-induced Debonding in RC Beams and Slabs. 22
Construction and Building Materials. 2003; 17:447-62. 23
[18] Gao, B., Leung, C., Kim, J. Prediction of concrete cover separation failure for RC beams strengthened with CFRP 24
strips. Engineering Structures. 2004; 27:177-89. 25
[19] Xiong, G., Jiang, X., Liu, J., and Chen, L. A Way for Preventing Tension Delamination of Concrete Cover in 26
Midspan of FRP Strengthened Beams. Construction and Building Materials. 2007; 21:402–8.. 27
[20] Alwis, W. Trilinear Moment-Curvature Relationship for Reinforced Concrete Beams. ACI Structural Journal. 1
1990; 8. 2
[21] Saqan, E., and Rasheed, H. Simplified Nonlinear Analysis to Compute Neutral Axis Depth in Prestressed 3
Concrete Regtangular Beams. Journal of the Franklin Institute. 2010; 348:1588-604. 4
[22] El-Mihilmy, M, and Tedesco, W. Deflection of Reinforced Concrete Beams Strengthened with Fiber-Reiforced 5
Polymer (FRP) Plates. ACI Structural Journal. 2000; 97(5):8. 6
[23] Rasheed, H., Charkas, H., and Melhem, H. Simplified Nonlinear Analysis of Strengthened Concrete Beams based 7
on a Rigorous Approach. Journal of Structural Engineering (ASCE). 2004; 130(7.). 8
[24] Barros, J., and Dalfre, G. A Model for the Prediction of the Behaviour of Countinuous RC Slabs Flexurally 9
Strengthened with CFRP Systems. In: Proceedings of FRPRCS 11. Guimaraes, Portugal., Conference, Conference 10
2013. 11
[25] Rezazadeh, M., Barros, J., and Costa, I. Analytical Model for the Prediction of the Behavior of RC Beams 12
Flexurally Strengthened with Prestressed NSM CFRP Laminates. Report nº 2014-DEC/E-04, University of Minho, 13
2014. 14
[26] ACI-318M-08. Building Code Requirements for Structural Concrete. American Concrete Institute, 2008. 15
[27] Barros, J., and Kotynia, R. Possibilities and Challenges of NSM for the Flexural Strengthening of RC Structures. 16
Proceedings of Fourth International Conference on FRP Composites in Civil Engineering. Zurich, Switzerland, 2008. 17
[28] Bianco, V., Monti, G., and Barros, J. Design Formula to Evaluate the NSM FRP Strips Shear Strength 18
Contribution to a RC Beam. Composite Part B: Engineering. 2014; 56:960-71. 19
[29] Bianco, V. Shear Strengthening of RC Beams by Means of NSM CFRP Strips: Experimental Evidence and 20
Analytical Modeling. PhD thesis, Sapienza University of Rome. 2008. 21
[30] Varma, R K. Numerical Models for the Simulation of the Cyclic Behaviour of RC Structures Incorporating New 22
Advanced Materials. PhD thesis, University of Minho, Portugal, 2012. 23
[31] CEB-FIP Model Code. Comite Euro-International du Beton, . Bulletin d’Information n 213/214,1993. 24
[32] Sharaky, I., Torres, L., Comas, J., and Barris, C. Flexural Response of Reinforced Concrete (RC) Beams 25
Strengthened with Near Surface Mounted (NSM) Fibre Reinforced Polymer (FRP) Bars. Composite Structures. 2014; 26
109. 27
[33] Sharaky, I. A Study of the Bond and Flexural Behaviour of Reinforced Concrete Elements Strengthened with 1
Near Surface Mounted (NSM) FRP Reinforcement. PhD thesis, Spain: University of Girona. 2013. 2
[34] Al-Mahmoud, F., Castel, A., Francois, R., and Tourneur, C. Strengthening of RC Members with Near-Surface-3
Mounted CFRP Rods. Composite Structures. 2009; 91. 4
[35] Barros, J., Dias, S., and Lima, J. Efficacy of CFRP-based Techniques for the Flexural and Shear Strengthening 5
of Concrete Beams. Cement and Concrete Composites. 2007; 29(3). 6
7
8

Table 1: Geometry and reinforcement details of the beam series [11-13] 1
Beam
series
N
o.
L
(mm)
aL
(mm)
bs
(mm)
b
(mm)
h
(mm)
d’s
(mm)
ds
(mm)
df
(mm)
A’s
(mm2)
As
(mm2)
Af
(mm2)
groove size
(mm2)
Series 1 [13]
5 2200 400 900 150 300 25 265 288 157.1 (2φ10)
157.1 (2φ10)
28
CFRP laminate
(1.4×20)
144 6×24
Series 2
[11] 4 3300 1100 1100 152 254 35 220 241.5
197
(2φ11.2)
353.4
(2φ15)
70.9 CFRP bar
(1φ9.5)
375
15×25
Series 3
[12] 5 5000 1000 2000 200 400 35 343 387.5
200.6
(2φ11.3)
603.2
(3φ16)
63.6 CFRP bar
(1φ9)
500
20×25
2
3

Table 2: Main properties for concrete, steel and CFRP reinforcements [11-13] 1
Beam series
concrete Steel reinforcement CFRP reinforcement nominal CFRP properties
f’c
(MPa)
fsy
(MPa)
fsu
(MPa)
Es
(GPa)
ffu
(MPa)
Ef
(GPa)
ffu(n)
(MPa)
Ef(n)
(GPa)
Series 1 [13] 32 585 656 208 1922 164 2000 150
Series 2 [11] 45 440 560 190 1970 136 1970 136
Series 3 [12] 40 475 - 200 2167 130 2068 124
2
3

Table 3: Experimental and analytical values of the governing stages of the flexural response for the RC beams of the 1 series 1 [13] 2
RC beams Result dci
(mm)
εlfci
(%)
Pcd
(kN)
dcd
(mm)
Psd
(kN)
dsd
(mm)
Pcr
(kN)
dcr
(mm)
Py
(kN)
dy
(mm)
Pu
(kN)
du
(mm)
Failue Mode
Control Exper Analy
- - - - - - 13.81 17.70
0.30 0.37
49.70 52.40
5.87 5.30
61.46 53.64
45.70 30.43
CC CC
Non
prestressed
Exper
Analy 0 0 0 0 0 0
17.01
17.85
0.35
0.37
60.32
60.24
5.93
5.53
92.97
86.60
24.46
18.11
RC
RC
20% prestressed
Exper Analy
-0.08 -0.10
0.40 1.20
- 5.71
- 0.11
7.10 6.00
0.17 0.13
22.14 23.59
0.46 0.49
68.69 66.37
6.14 5.41
94.00 86.34
19.36 13.80
RC RC
30%
prestressed
Exper
Analy
-0.18
-0.15
1.30
1.20
-
8.20
-
0.17
15.5
8.60
0.36
0.18
23.04
26.08
0.55
0.54
72.52
68.88
6.52
5.35
95.16
86.10
16.92
12.07
RC
RC
40% prestressed
Exper Analy
- -0.20
1.90 1.20
- 10.68
- 0.22
18.10 11.21
0.25 0.24
25.08 28.46
0.47 0.59
74.16 71.48
5.34 5.30
87.45 85.82
10.15 10.42
RC RC
dci is initial deflection due to prestressing force;
εlfci is the short-term losses of the tensile strain of the prestressed laminate after releasing;
Pcd is the load at concrete decompression point, and dcd its corresponding deflection;
Psd is the load at steel decompression point, and dsd its corresponding deflection;
Pcr is the load at cracking initiation, and dcr its corresponding deflection;
Py is the load at yield initiation of the longitudinal tensile bars, and dy its corresponding deflection;
Pu is the ultimate load, and du its corresponding deflection;
CC is concrete crushing, and RC is rupture of CFRP
3
4

Table 4: Experimental and analytical values of the governing stages of the flexural response for the RC beams of the 1 series 2 [11] 2
RC beams Result dci
(mm)
εlfci
(%)
Pcd
(kN)
dcd
(mm)
Psd
(kN)
dsd
(mm)
Pcr
(kN)
dcr
(mm)
Py
(kN)
dy
(mm)
Pu
(kN)
du
(mm)
Failue Mode
Control Exper
Analy - - - - - -
10.20
13.13
1.86
1.29
55.10
55.80
23.50
17.60
64.30
57.43
85.30
95.00
CC
CC
Non
prestressed
Exper
Analy 0 0 0 0 0 0
10.92
12.90
1.76
1.14
69.50
65.26
26.03
18.43
96.50
102.23
65.49
64.80
CC
CC
40%
prestressed
Exper
Analy
-
-1.21
-
2.48
-
17.85
-
1.55
-
19.85
-
1.73
30.09
30.92
4.34
2.70
95.00
86.38
25.82
17.71
115.25
113.35
48.34
47.13
RC
RC
60%
prestressed
Exper
Analy
-
-1.81
-
2.48
-
26.78
-
2.33
-
29.78
-
2.61
40.00
39.85
5.05
3.51
105.00
96.31
25.72
17.70
112.26
112.08
32.89
32.96
RC
RC
3
4
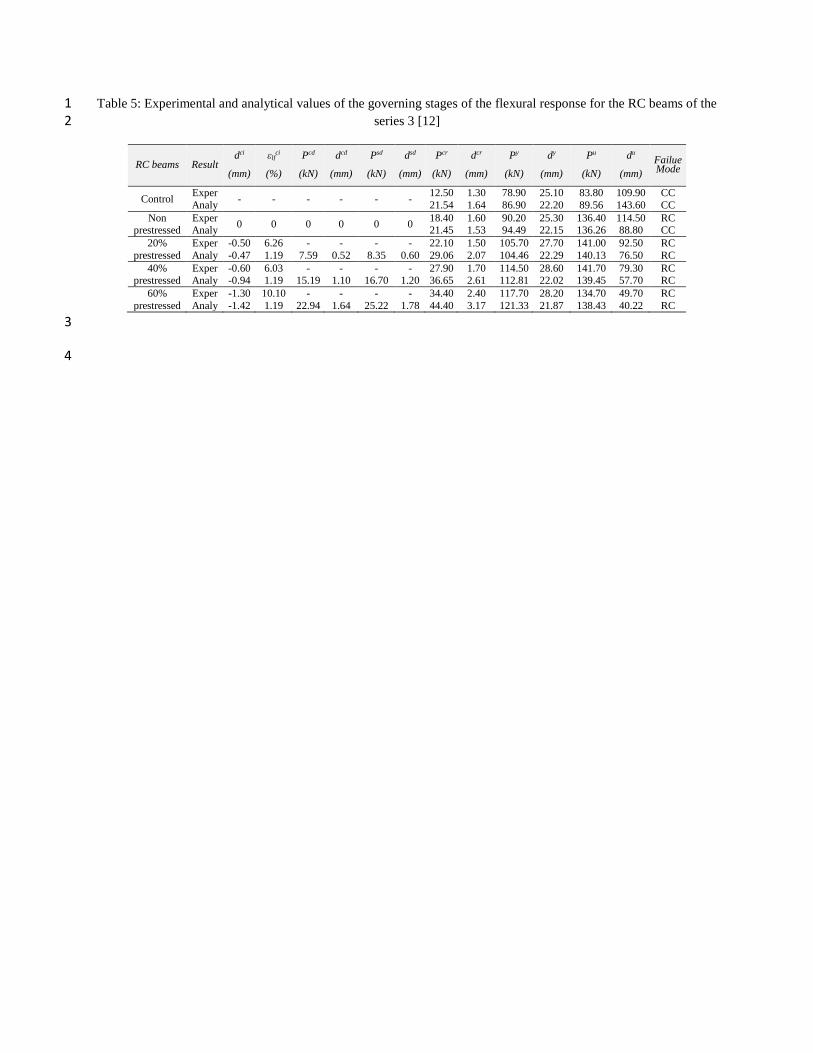
Table 5: Experimental and analytical values of the governing stages of the flexural response for the RC beams of the 1 series 3 [12] 2
RC beams Result dci
(mm)
εlfci
(%)
Pcd
(kN)
dcd
(mm)
Psd
(kN)
dsd
(mm)
Pcr
(kN)
dcr
(mm)
Py
(kN)
dy
(mm)
Pu
(kN)
du
(mm)
Failue Mode
Control Exper
Analy - - - - - -
12.50
21.54
1.30
1.64
78.90
86.90
25.10
22.20
83.80
89.56
109.90
143.60
CC
CC
Non prestressed
Exper Analy
0 0 0 0 0 0 18.40 21.45
1.60 1.53
90.20 94.49
25.30 22.15
136.40 136.26
114.50 88.80
RC CC
20%
prestressed
Exper
Analy
-0.50
-0.47
6.26
1.19
-
7.59
-
0.52
-
8.35
-
0.60
22.10
29.06
1.50
2.07
105.70
104.46
27.70
22.29
141.00
140.13
92.50
76.50
RC
RC
40% prestressed
Exper Analy
-0.60 -0.94
6.03 1.19
- 15.19
- 1.10
- 16.70
- 1.20
27.90 36.65
1.70 2.61
114.50 112.81
28.60 22.02
141.70 139.45
79.30 57.70
RC RC
60%
prestressed
Exper
Analy
-1.30
-1.42
10.10
1.19
-
22.94
-
1.64
-
25.22
-
1.78
34.40
44.40
2.40
3.17
117.70
121.33
28.20
21.87
134.70
138.43
49.70
40.22
RC
RC
3
4

Table 6: Geometry, steel and CFRP reinforcement details of the tested beams [7, 32-35] 1
Tested
beams
Lb
(mm)
Lub
(mm)
aL
(mm)
bs
(mm)
b
(mm)
h
(mm)
d’s
(mm)
ds
(mm)
df
(mm)
A’s
(mm)
As
(mm)
Af*
(mm)
sf
(mm)
s’f
(mm)
by [32] 2000 200 800 800 160 280 40 240 272 2φ8 2φ12 2bφ8 80 40
by [33] 2000 200 800 800 160 280 40 240 270 2φ8 2φ12 1bφ8 &
2L:1.4x20 45.5 34.5
by [34] 2100 350 1200 800 150 280 40 240 274 2φ6 2φ12 2bφ6 88 31
by [7]-a 1400 50 500 500 100 177 25 152 171 2φ8 3φ6 2L:1.4x10 30 35
by [7]-b 1400 50 500 500 100 175 25 152 169 2φ8 2φ6 &
1φ8 2L:1.4x10 30 35
by [35] 800 50 300 300 120 170 21 149 164 2φ6.5 2φ6.5 2L:1.4x10 40 40
* Two types of CFRP reinforcement were used: CFRP round bar (b) and CFRP laminate (L)
2

Table 7: Main properties for the concrete, steel and CFRP reinforcements [7, 32-35] 1
Tested beams
concrete Steel reinforcement CFRP
reinforcement
f’c
(MPa)
fsy
(MPa)
fsu
(MPa)
Es
(GPa)
ffu
(MPa)
Ef
(GPa)
by [32] and [33] 32 545 624 205 2350 170
by [34] 37 600 - 210 1875 146
by [7] 46 730 800 200 2740 159
by [35] 52 627 765 200 2740 159
2
3
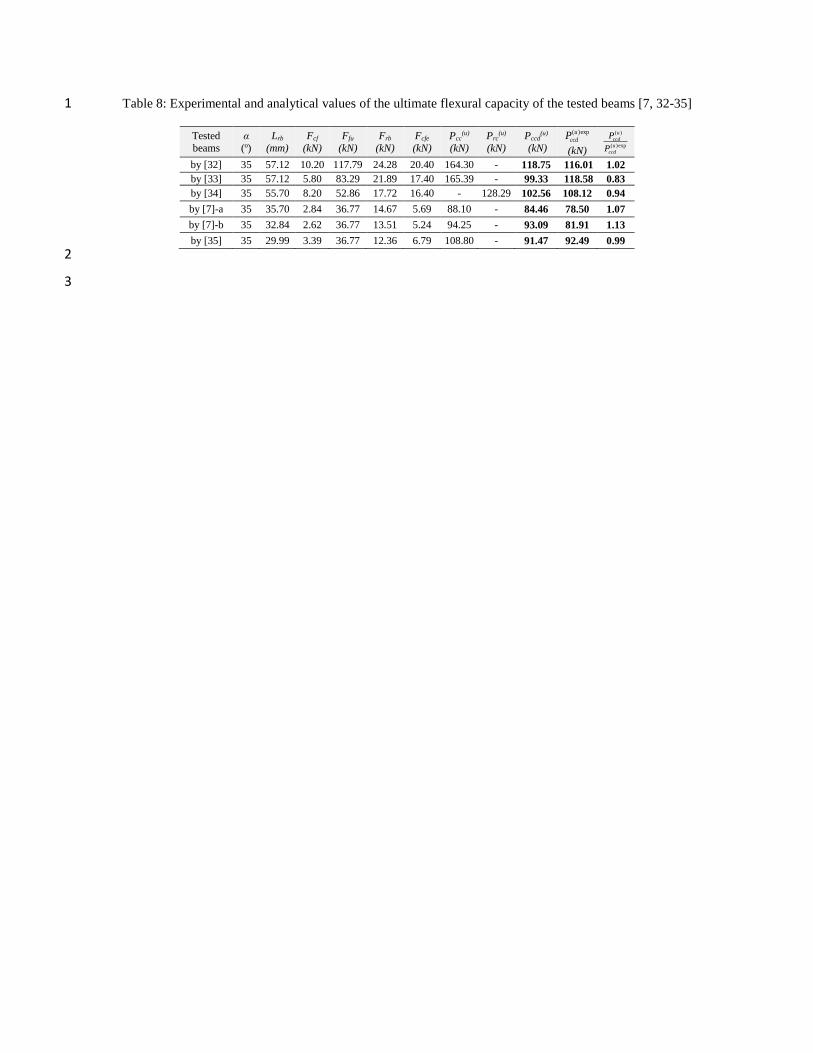
Table 8: Experimental and analytical values of the ultimate flexural capacity of the tested beams [7, 32-35] 1
Tested
beams
α
(o)
Lrb
(mm)
Fcf
(kN)
Ffu
(kN)
Frb
(kN)
Fcfe
(kN)
Pcc(u)
(kN)
Prc(u)
(kN)
Pccd(u)
(kN)
( )expu
ccdP
(kN)
( )
( )exp
u
ccd
u
ccd
P
P
by [32] 35 57.12 10.20 117.79 24.28 20.40 164.30 - 118.75 116.01 1.02
by [33] 35 57.12 5.80 83.29 21.89 17.40 165.39 - 99.33 118.58 0.83
by [34] 35 55.70 8.20 52.86 17.72 16.40 - 128.29 102.56 108.12 0.94
by [7]-a 35 35.70 2.84 36.77 14.67 5.69 88.10 - 84.46 78.50 1.07
by [7]-b 35 32.84 2.62 36.77 13.51 5.24 94.25 - 93.09 81.91 1.13
by [35] 35 29.99 3.39 36.77 12.36 6.79 108.80 - 91.47 92.49 0.99
2
3
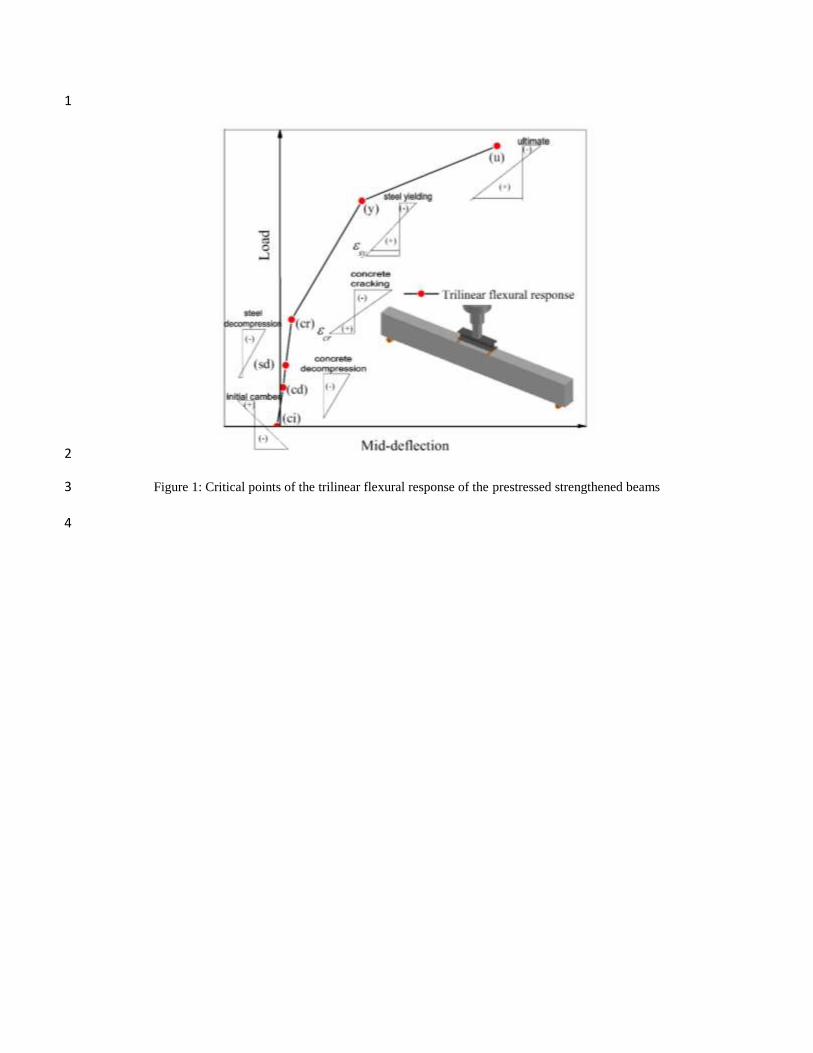
1
2
Figure 1: Critical points of the trilinear flexural response of the prestressed strengthened beams 3
4
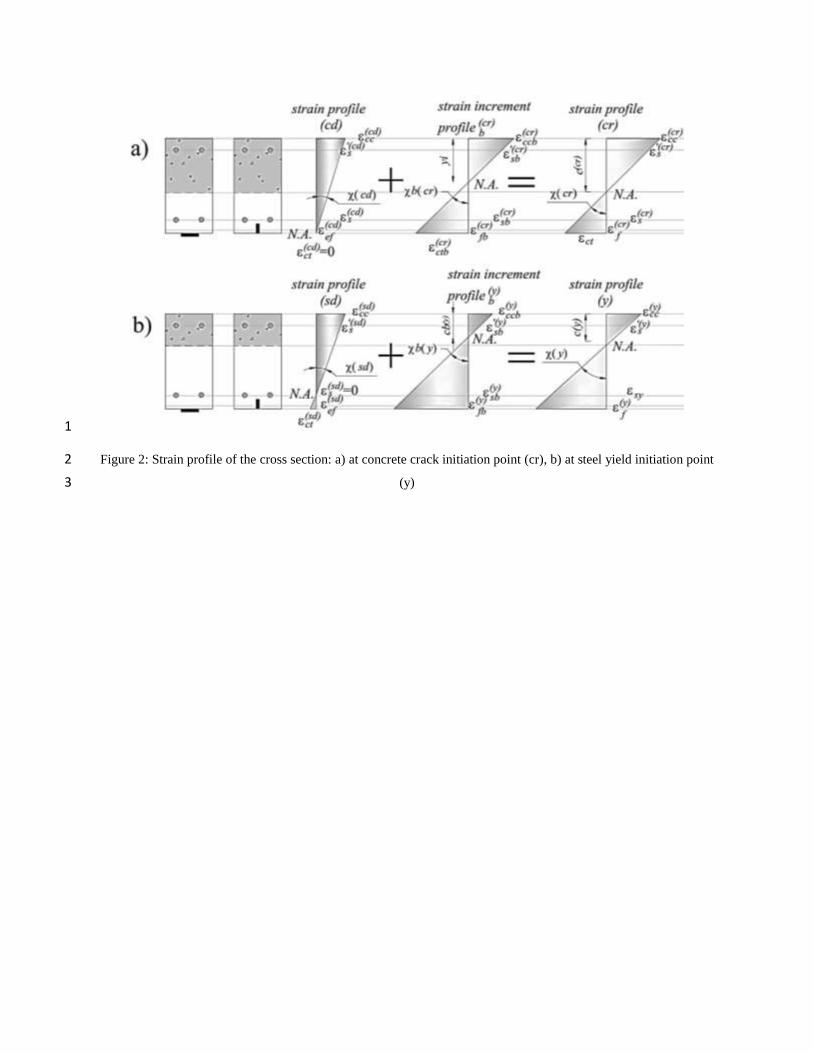
1
Figure 2: Strain profile of the cross section: a) at concrete crack initiation point (cr), b) at steel yield initiation point 2
(y) 3

1
Figure 3: Definition of the geometry and reinforcement configuration for the analytical model: a) geometry of 2
strengthened beam, b) reinforcement details in EBR technique, c) reinforcement details in NSM technique 3
4
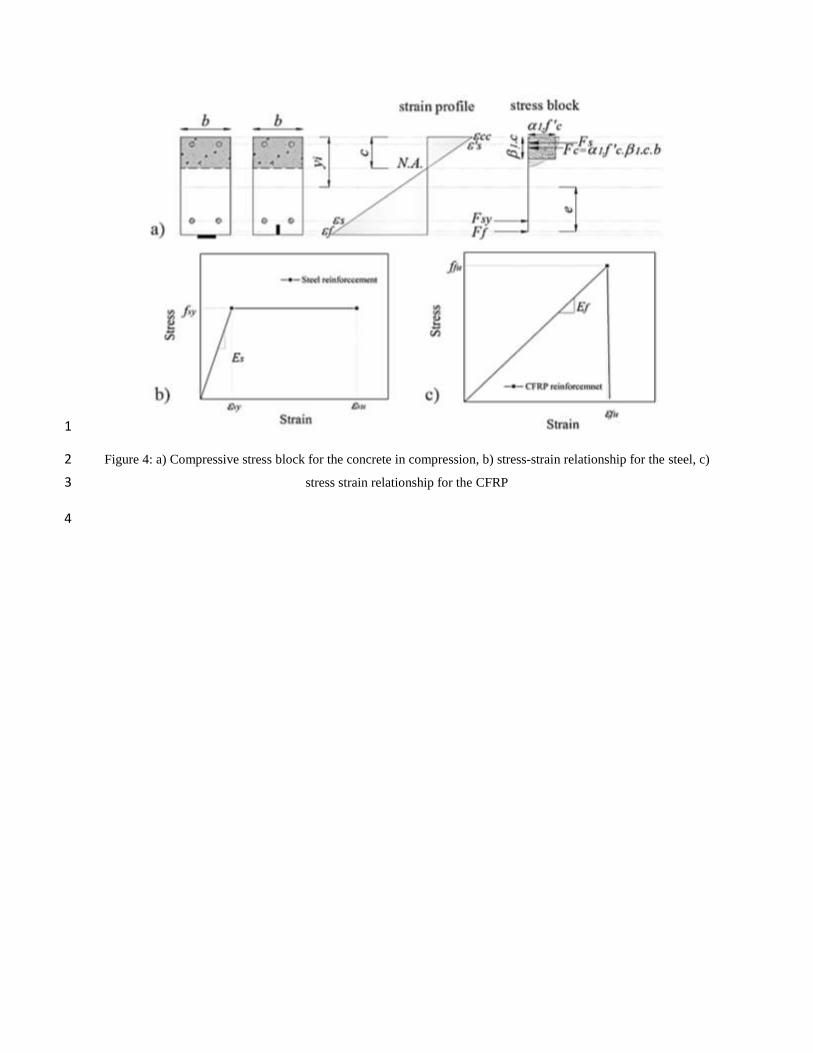
1
Figure 4: a) Compressive stress block for the concrete in compression, b) stress-strain relationship for the steel, c) 2
stress strain relationship for the CFRP 3
4
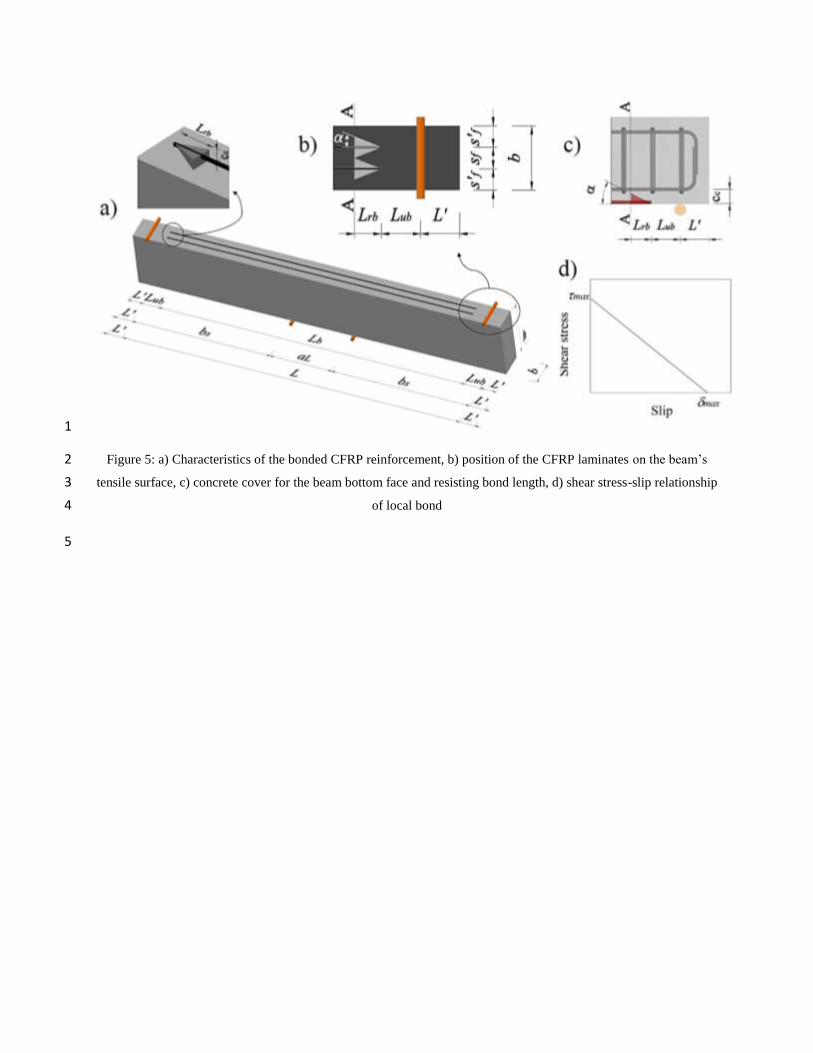
1
Figure 5: a) Characteristics of the bonded CFRP reinforcement, b) position of the CFRP laminates on the beam’s 2
tensile surface, c) concrete cover for the beam bottom face and resisting bond length, d) shear stress-slip relationship 3
of local bond 4
5

1
Figure 6: Calculation procedure for concrete cover delamination failure mode 2
3
4

1
2
3
Figure 7: Distinct regions of the beam 4
5

1
Figure 8: Curvature distribution along the beam length at the stages: a) initial camber, b) precracking, c) 2
postcracking, d) postyielding 3
4
5
6
7
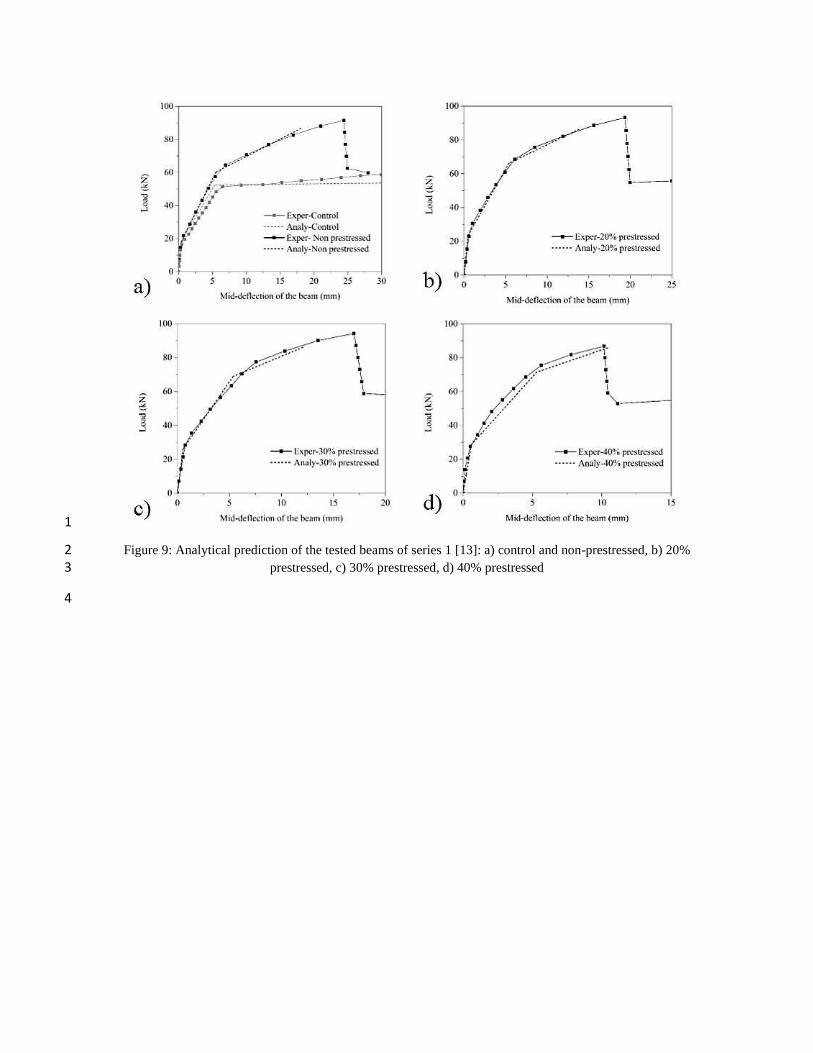
1
Figure 9: Analytical prediction of the tested beams of series 1 [13]: a) control and non-prestressed, b) 20% 2 prestressed, c) 30% prestressed, d) 40% prestressed 3
4
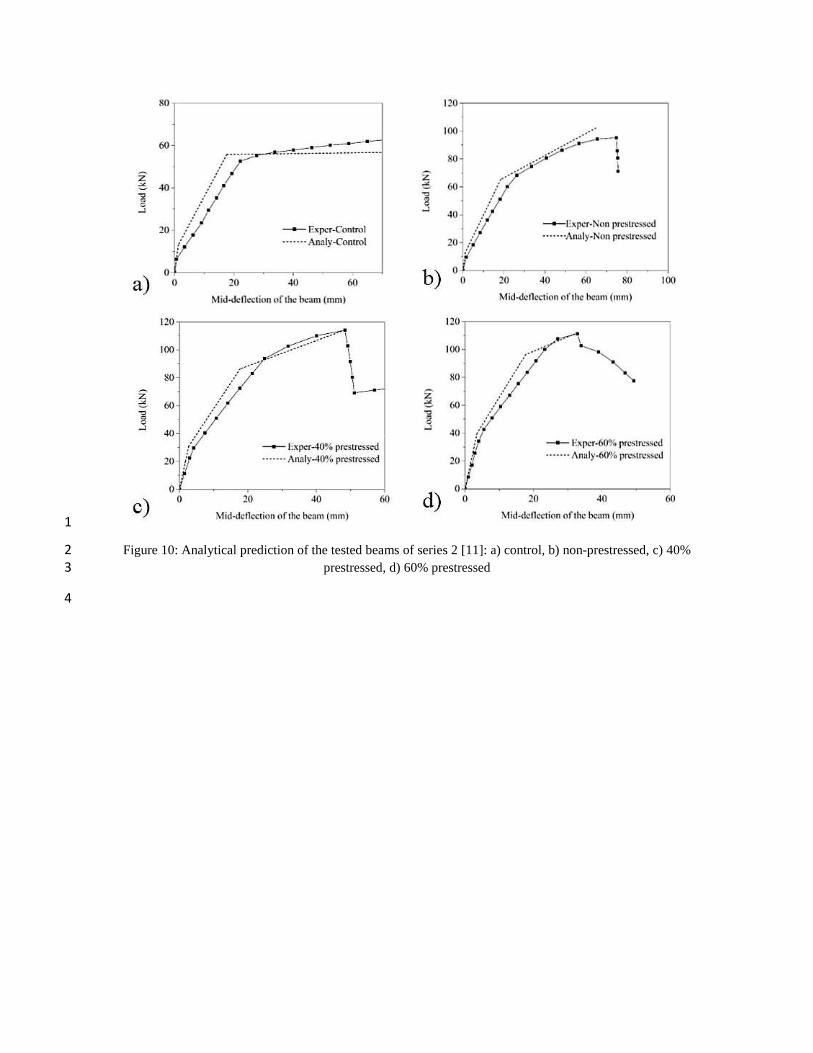
1
Figure 10: Analytical prediction of the tested beams of series 2 [11]: a) control, b) non-prestressed, c) 40% 2 prestressed, d) 60% prestressed 3
4
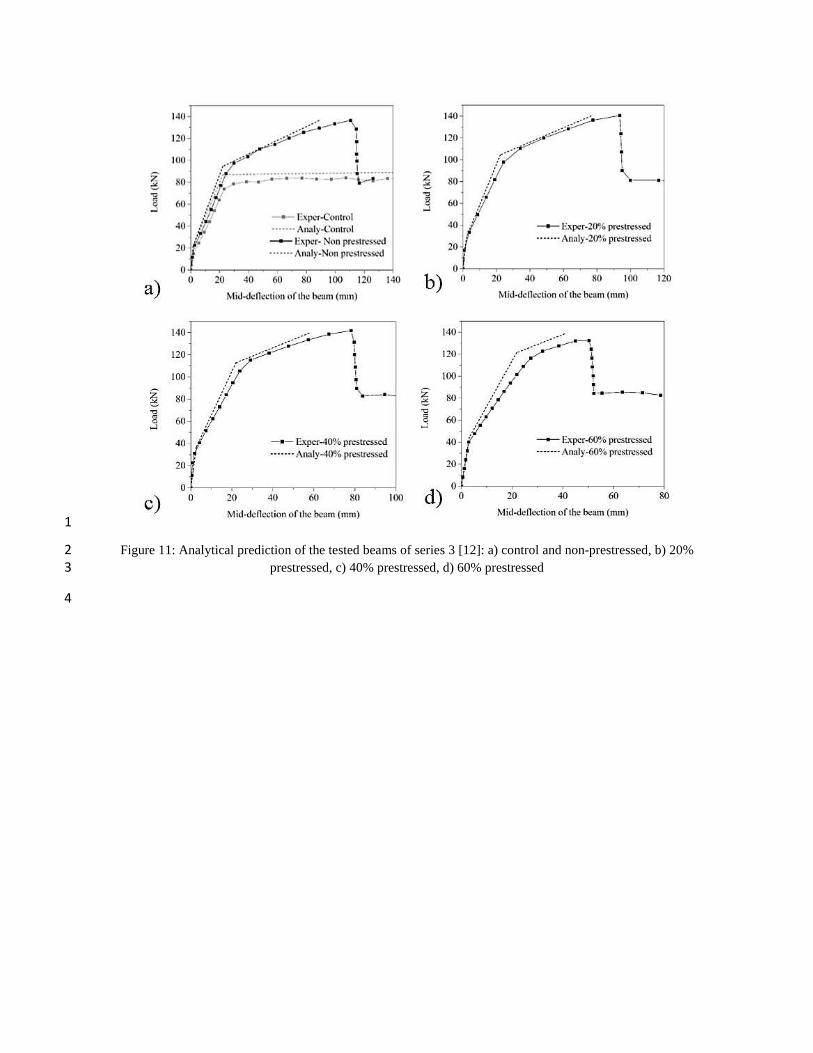
1
Figure 11: Analytical prediction of the tested beams of series 3 [12]: a) control and non-prestressed, b) 20% 2 prestressed, c) 40% prestressed, d) 60% prestressed 3
4

1
2
Figure 12: Stress-strain relationship used in DOCROS to simulate: a) concrete, b) steel bars 3
4
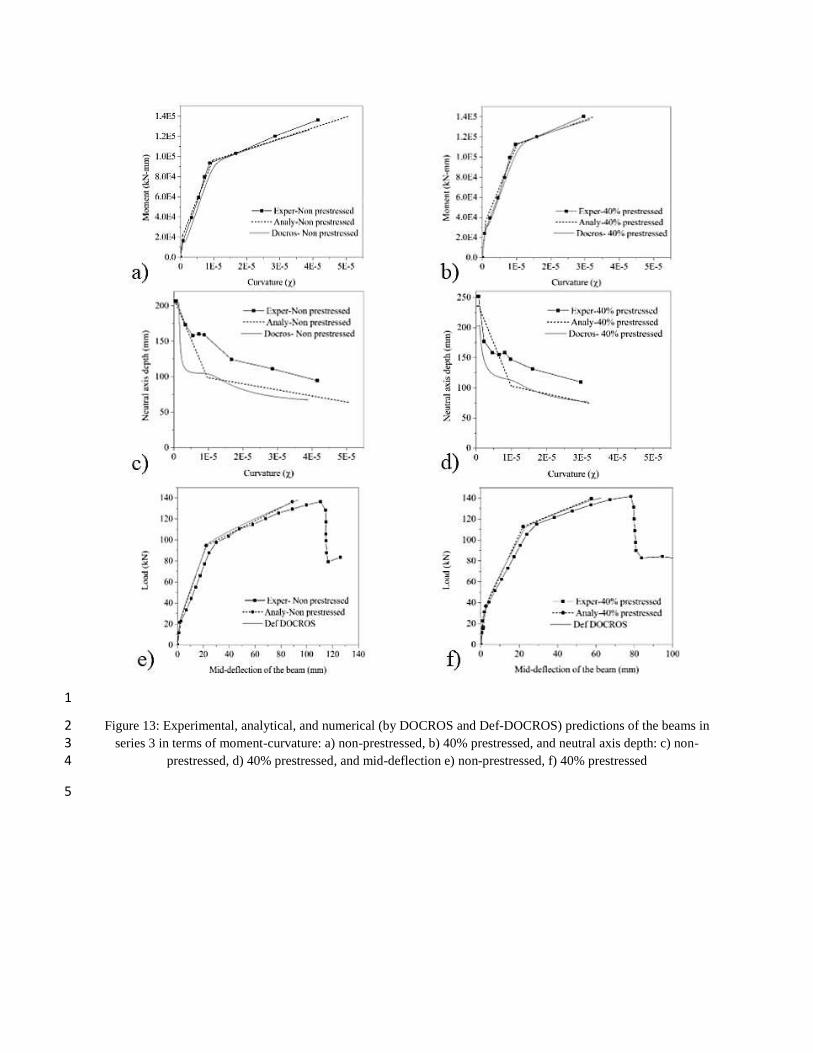
1
Figure 13: Experimental, analytical, and numerical (by DOCROS and Def-DOCROS) predictions of the beams in 2 series 3 in terms of moment-curvature: a) non-prestressed, b) 40% prestressed, and neutral axis depth: c) non-3
prestressed, d) 40% prestressed, and mid-deflection e) non-prestressed, f) 40% prestressed 4
5
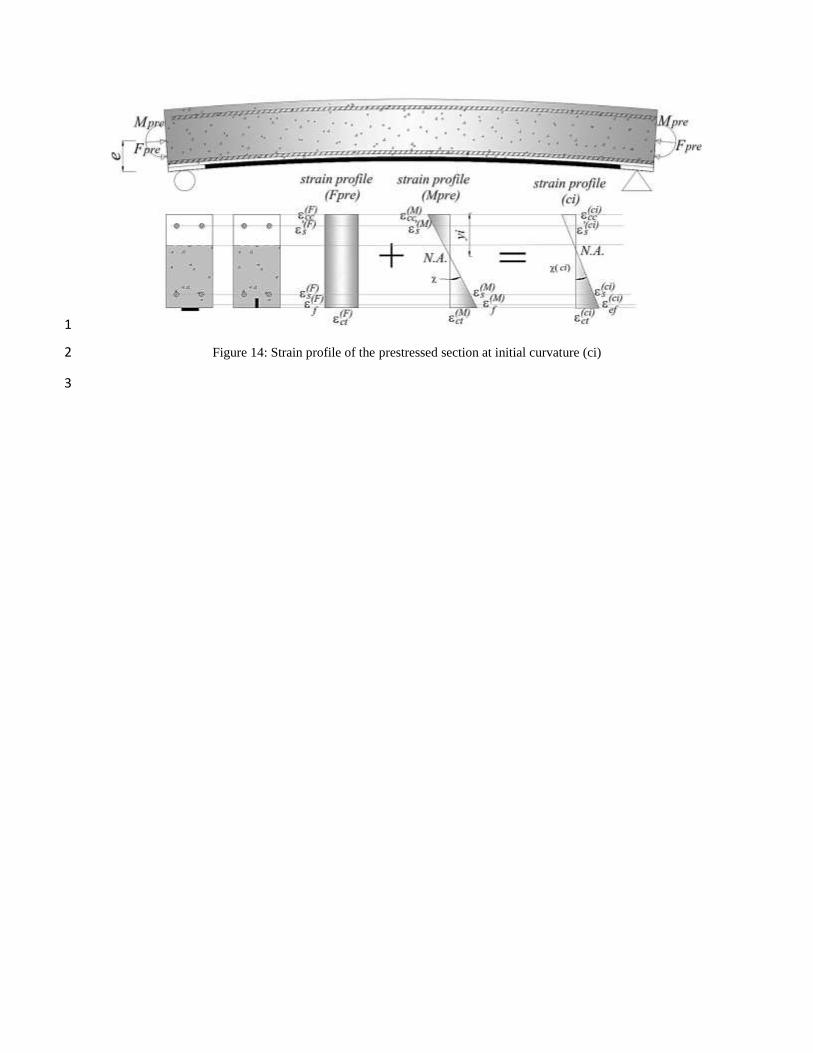
1
Figure 14: Strain profile of the prestressed section at initial curvature (ci) 2
3
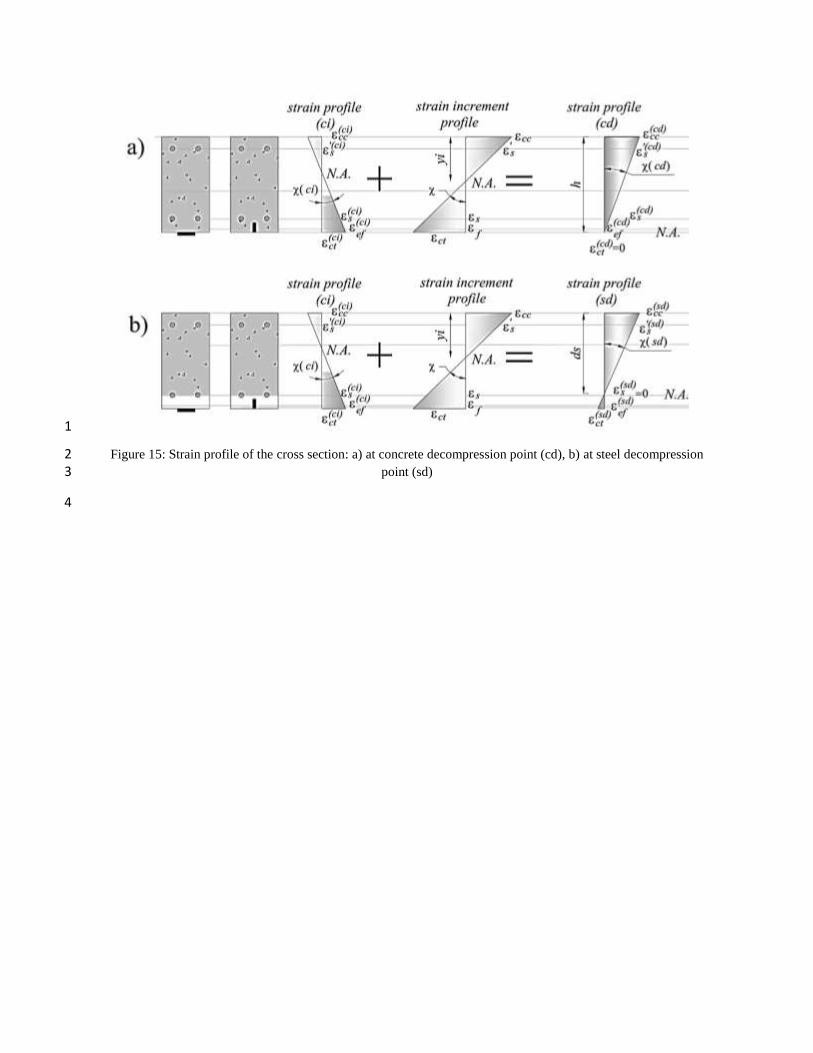
1
Figure 15: Strain profile of the cross section: a) at concrete decompression point (cd), b) at steel decompression 2 point (sd) 3
4
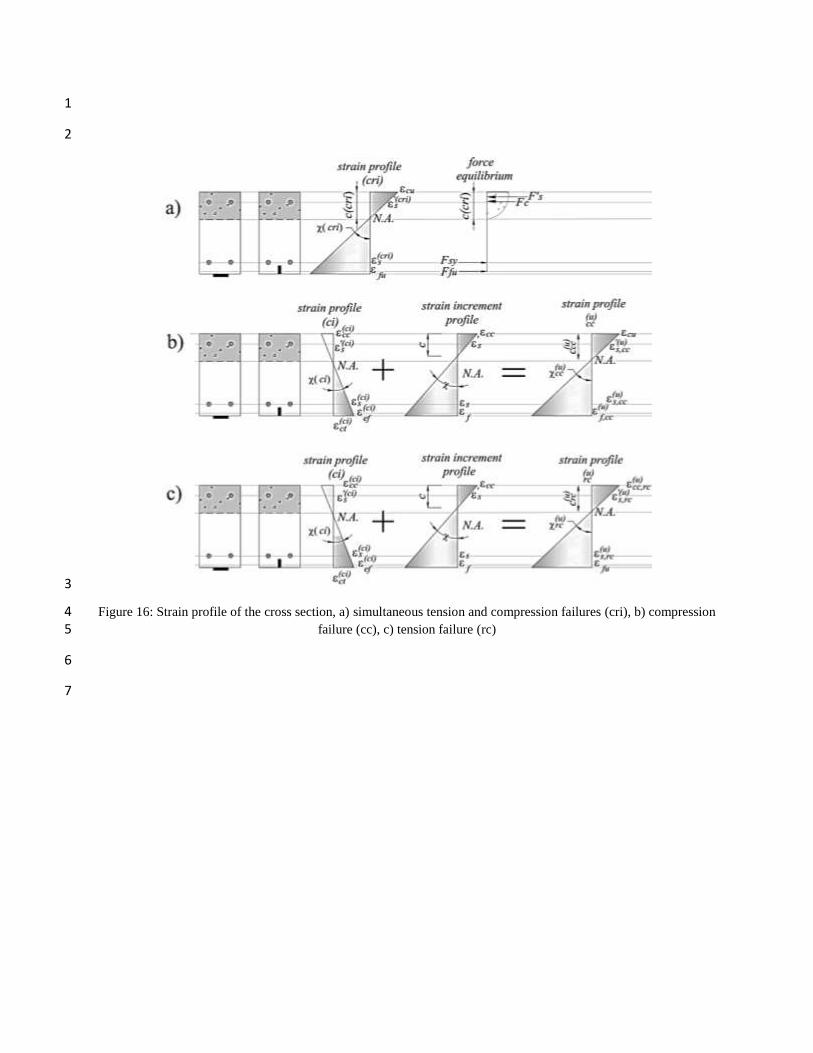
1
2
3
Figure 16: Strain profile of the cross section, a) simultaneous tension and compression failures (cri), b) compression 4 failure (cc), c) tension failure (rc) 5
6
7
Related Documents