Geosynthetics 2015 February 15-18, Portland, Oregon Analytic Approach for Design of Reinforced Soil Bridge Pier on Reinforced Soil Pads over Weaker Soils V.K. Tyagi, Hi-Tech Geosynthtics Pvt. Ltd, India, [email protected] ABSTRACT Application of geosynthetic reinforced structures (GRS) in the construction of bridge piers and abutments over reinforced foundation pads (RSF) has been demonstrated in several full-scale case histories. Further, the behavior of RSF supporting GSF constructed over weak cohesive frictional fills has been demonstrated by conducting full scale load tests. In these applications, the behavior of GRS and RSF have been comprehensively investigated through field monitoring which has indicated that these systems satisfy the serviceability requirements prescribed by international codes. However, the only analyses approaches to evaluate these systems involve numerical and physical modeling. To address this issue, this paper presents analytic method based on limit equilibrium principles to help design theses systems. 1. INTRODUCTION The effect of replacing existing low frictional fill soil by higher frictional fill is taken into consideration using enhanced bearing capacity coefficients in the bearing capacity analysis (Giroud and Noiray 1981). The German code on geosynthetic structures (EBGEO) recommends that if particular stringent demands are made on the deformation behavior of structure subjected to heavy loads and empirical data of past projects is very less, then Geotechnical Category – 3 (GC- 3) case is applicable. These results should be verified by proper instrumented modeling and it is also important that results are checked with numerical analysis for plausibility. As per table 3.2, page 37 of EBGEO (2011), any bridge abutment/pier structure having height > 2m will come in GC-3 category. Limit equilibrium analysis of reinforced pad is appropriate for ultimate limit analysis for evaluating bearing capacity failure, external stability like sliding, overturning, pullout failure, global stability and strength of reinforcement. Yet it is unable to predict the serviceability state properly at functional stresses which is very important for GC-3 structures. The analytical method adopted by EBGEO applies to sheet reinforcements like geogrid or geotextile and not to three dimensional geosynthetics like geocells. Thus it becomes difficult to formulate mathematical forms in case of heterogeneous medium comprising of multiple geosynthetics. However empirical results obtained from physical and numerical modeling on multiple geosynthetics can be converted into graphs and tables and formulae can also be developed using regression methods in case of greater correlations. Guido et al. (1985) performed a series of laboratory model tests on rectangular and square footing. They indicated that bearing capacity ratio (BCR) at a settlement of 0.1B increases rapidly with increasing strip length up to a length of about 0.7B after which it remains relatively constant. Omar et al. (1993) conducted laboratory tests for the ultimate bearing capacity of strip and square foundations on sand reinforced with geogrid layers. From this experiment, they have drawn conclusions that for development of maximum bearing capacity, the effective depth of reinforcement is 2B for strip footings and 1.4B for square footings. Further they have observed that maximum width of reinforcement layers for optimum mobilization of maximum bearing capacity ratio is 8B for strip footings and 4.5B for square footings. Dash et al. (2001) have presented the laboratory test results of strip footings on geocell reinforced sand beds with additional planar reinforcement. Shin et al. (2000) have done laboratory test to determine the bearing capacity of strip footing supported by sand reinforced with multiple layers of geogrid of one type. The results show that the ratio of the critical depth of reinforcement below the footing w.r.t the width of footing is about 2. For a given reinforcements depth ratio, the BCR w.r.t ultimate load increases with the embedment ratio of the foundation. Dash et al. (2001) presented the results from laboratory model tests on a strip footing supported by sand reinforced with a geocell mattress. The parameters varied in the testing program include pattern of geocell formation, pocket size, height and width of geocell mattress, depth of the top of geocell mattress, tensile stiffness of the geogrids used to fabricate geocell and the relative density of sand. With the provisions of geocell reinforcement, failure is not observed even at a settlement equal to 50% of the footing width and a load as high as 8 times the ultimate bearing capacity of the unreinforced sand. The performance improvement is significant up to a geocell height equal to 2 times the width of the footing. Beyond that height, the improvement is marginal. The optimum width of the geocell layer is around 4 times the footing width at which stage the geocell would intercept all the potential rupture planes formed in the foundation soil. Aigen Zhao (1998) has presented the failure criterion for a reinforced soil composite. 312

Welcome message from author
This document is posted to help you gain knowledge. Please leave a comment to let me know what you think about it! Share it to your friends and learn new things together.
Transcript

Geosynthetics 2015 February 15-18, Portland, Oregon
Analytic Approach for Design of Reinforced Soil Bridge Pier on
Reinforced Soil Pads over Weaker Soils
V.K. Tyagi, Hi-Tech Geosynthtics Pvt. Ltd, India, [email protected]
ABSTRACT Application of geosynthetic reinforced structures (GRS) in the construction of bridge piers and abutments over reinforced
foundation pads (RSF) has been demonstrated in several full-scale case histories. Further, the behavior of RSF
supporting GSF constructed over weak cohesive frictional fills has been demonstrated by conducting full scale load tests.
In these applications, the behavior of GRS and RSF have been comprehensively investigated through field monitoring
which has indicated that these systems satisfy the serviceability requirements prescribed by international codes. However,
the only analyses approaches to evaluate these systems involve numerical and physical modeling. To address this issue,
this paper presents analytic method based on limit equilibrium principles to help design theses systems.
1. INTRODUCTION
The effect of replacing existing low frictional fill soil by higher frictional fill is taken into consideration using enhanced bearing capacity coefficients in the bearing capacity analysis (Giroud and Noiray 1981). The German code on geosynthetic structures (EBGEO) recommends that if particular stringent demands are made on the deformation behavior of structure subjected to heavy loads and empirical data of past projects is very less, then Geotechnical Category – 3 (GC-3) case is applicable. These results should be verified by proper instrumented modeling and it is also important that results are checked with numerical analysis for plausibility. As per table 3.2, page 37 of EBGEO (2011), any bridge abutment/pier structure having height > 2m will come in GC-3 category. Limit equilibrium analysis of reinforced pad is appropriate for ultimate limit analysis for evaluating bearing capacity failure, external stability like sliding, overturning, pullout failure, global stability and strength of reinforcement. Yet it is unable to predict the serviceability state properly at functional stresses which is very important for GC-3 structures. The analytical method adopted by EBGEO applies to sheet reinforcements like geogrid or geotextile and not to three dimensional geosynthetics like geocells. Thus it becomes difficult to formulate mathematical forms in case of heterogeneous medium comprising of multiple geosynthetics. However empirical results obtained from physical and numerical modeling on multiple geosynthetics can be converted into graphs and tables and formulae can also be developed using regression methods in case of greater correlations. Guido et al. (1985) performed a series of laboratory model tests on rectangular and square footing. They indicated that bearing capacity ratio (BCR) at a settlement of 0.1B increases rapidly with increasing strip length up to a length of about 0.7B after which it remains relatively constant. Omar et al. (1993) conducted laboratory tests for the ultimate bearing capacity of strip and square foundations on sand reinforced with geogrid layers. From this experiment, they have drawn conclusions that for development of maximum bearing capacity, the effective depth of reinforcement is 2B for strip footings and 1.4B for square footings. Further they have observed that maximum width of reinforcement layers for optimum mobilization of maximum bearing capacity ratio is 8B for strip footings and 4.5B for square footings. Dash et al. (2001) have presented the laboratory test results of strip footings on geocell reinforced sand beds with additional planar reinforcement. Shin et al. (2000) have done laboratory test to determine the bearing capacity of strip footing supported by sand reinforced with multiple layers of geogrid of one type. The results show that the ratio of the critical depth of reinforcement below the footing w.r.t the width of footing is about 2. For a given reinforcements depth ratio, the BCR w.r.t ultimate load increases with the embedment ratio of the foundation. Dash et al. (2001) presented the results from laboratory model tests on a strip footing supported by sand reinforced with a geocell mattress. The parameters varied in the testing program include pattern of geocell formation, pocket size, height and width of geocell mattress, depth of the top of geocell mattress, tensile stiffness of the geogrids used to fabricate geocell and the relative density of sand. With the provisions of geocell reinforcement, failure is not observed even at a settlement equal to 50% of the footing width and a load as high as 8 times the ultimate bearing capacity of the unreinforced sand. The performance improvement is significant up to a geocell height equal to 2 times the width of the footing. Beyond that height, the improvement is marginal. The optimum width of the geocell layer is around 4 times the footing width at which stage the geocell would intercept all the potential rupture planes formed in the foundation soil. Aigen Zhao (1998) has presented the failure criterion for a reinforced soil composite.
312
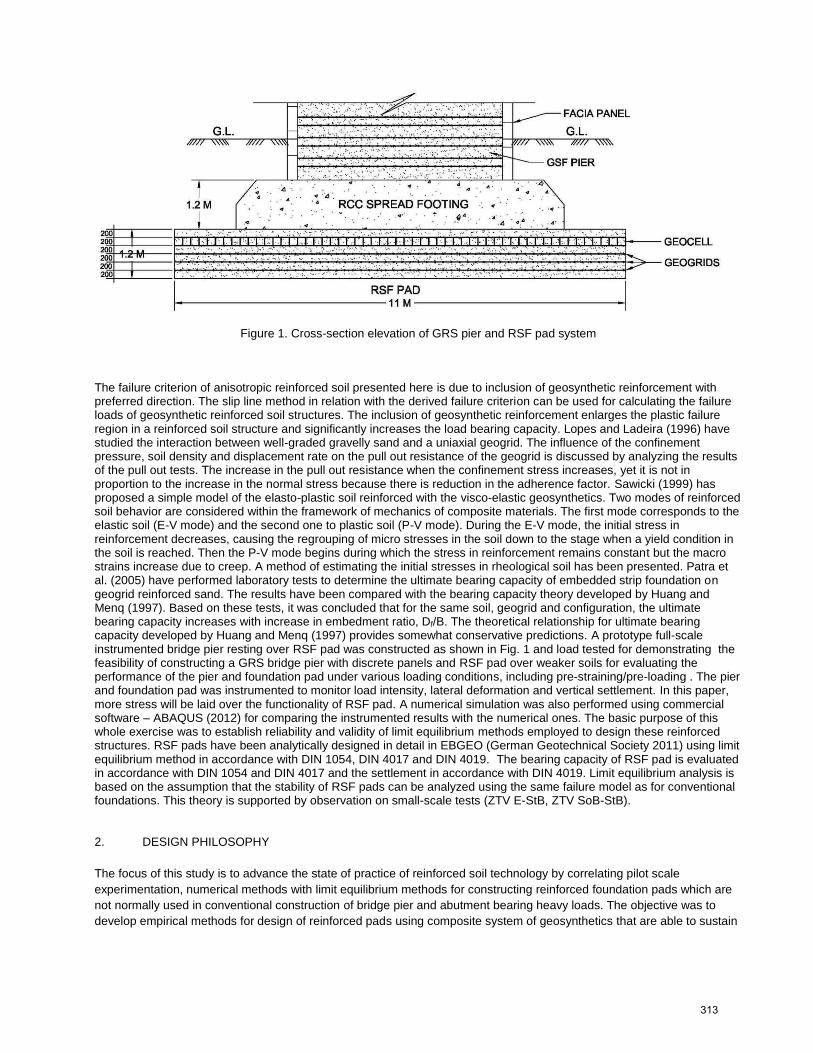
Figure 1. Cross-section elevation of GRS pier and RSF pad system
The failure criterion of anisotropic reinforced soil presented here is due to inclusion of geosynthetic reinforcement with preferred direction. The slip line method in relation with the derived failure criterion can be used for calculating the failure loads of geosynthetic reinforced soil structures. The inclusion of geosynthetic reinforcement enlarges the plastic failure region in a reinforced soil structure and significantly increases the load bearing capacity. Lopes and Ladeira (1996) have studied the interaction between well-graded gravelly sand and a uniaxial geogrid. The influence of the confinement pressure, soil density and displacement rate on the pull out resistance of the geogrid is discussed by analyzing the results of the pull out tests. The increase in the pull out resistance when the confinement stress increases, yet it is not in proportion to the increase in the normal stress because there is reduction in the adherence factor. Sawicki (1999) has proposed a simple model of the elasto-plastic soil reinforced with the visco-elastic geosynthetics. Two modes of reinforced soil behavior are considered within the framework of mechanics of composite materials. The first mode corresponds to the elastic soil (E-V mode) and the second one to plastic soil (P-V mode). During the E-V mode, the initial stress in reinforcement decreases, causing the regrouping of micro stresses in the soil down to the stage when a yield condition in the soil is reached. Then the P-V mode begins during which the stress in reinforcement remains constant but the macro strains increase due to creep. A method of estimating the initial stresses in rheological soil has been presented. Patra et al. (2005) have performed laboratory tests to determine the ultimate bearing capacity of embedded strip foundation on geogrid reinforced sand. The results have been compared with the bearing capacity theory developed by Huang and Menq (1997). Based on these tests, it was concluded that for the same soil, geogrid and configuration, the ultimate bearing capacity increases with increase in embedment ratio, Df/B. The theoretical relationship for ultimate bearing capacity developed by Huang and Menq (1997) provides somewhat conservative predictions. A prototype full-scale instrumented bridge pier resting over RSF pad was constructed as shown in Fig. 1 and load tested for demonstrating the feasibility of constructing a GRS bridge pier with discrete panels and RSF pad over weaker soils for evaluating the performance of the pier and foundation pad under various loading conditions, including pre-straining/pre-loading . The pier and foundation pad was instrumented to monitor load intensity, lateral deformation and vertical settlement. In this paper, more stress will be laid over the functionality of RSF pad. A numerical simulation was also performed using commercial software – ABAQUS (2012) for comparing the instrumented results with the numerical ones. The basic purpose of this whole exercise was to establish reliability and validity of limit equilibrium methods employed to design these reinforced structures. RSF pads have been analytically designed in detail in EBGEO (German Geotechnical Society 2011) using limit equilibrium method in accordance with DIN 1054, DIN 4017 and DIN 4019. The bearing capacity of RSF pad is evaluated in accordance with DIN 1054 and DIN 4017 and the settlement in accordance with DIN 4019. Limit equilibrium analysis is based on the assumption that the stability of RSF pads can be analyzed using the same failure model as for conventional foundations. This theory is supported by observation on small-scale tests (ZTV E-StB, ZTV SoB-StB). 2. DESIGN PHILOSOPHY
The focus of this study is to advance the state of practice of reinforced soil technology by correlating pilot scale
experimentation, numerical methods with limit equilibrium methods for constructing reinforced foundation pads which are
not normally used in conventional construction of bridge pier and abutment bearing heavy loads. The objective was to
develop empirical methods for design of reinforced pads using composite system of geosynthetics that are able to sustain
313
superstructure load on piers within tolerable limits of strength and serviceability during construction phase and after
construction.
2.1 Numerical Modeling Approach
Numerical analysis of the overall structure was performed by analyzing the GRS and RSF pad as an integral structure for
simulating the overall behavior. Geogrids in numerical simulation requires some specific considerations for geometrical
and constitutive modeling taking into account geometric non-linearity and anisotropic behavior of geogrids. The
construction of reinforced foundation pad and geosynthetic reinforced pier is modeled stepwise, in order to simulate the
real construction process. The geogrids follow linear elastic constitutive behavior, while the soil layers are modeled with
more advanced soil models like Hardening Soil (HS) or Hardening Soil with small stiffness (HS –Small). For numerical
simulation of realistic behavior of reinforced soil structures, a suitable formulation for geogrids, an advanced frictional
contact algorithm and sophisticated constitutive modeling of the material are essential. In general FEM softwares, geogrid
layers are usually modeled with 2D-beam model or 3D shell or membrane elements with zero bending stiffness. The
geogrid reinforcement is primary loaded perpendicularly by second order geometric effects (geometric nonlinearity) as
bending stiffness are practically nil. As geogrid is no longer horizontal after load application, tensile strains in geogrid
develop due to vertical loading. Thus geometry of the mesh needs to be uploaded during the stepwise incremental
loading. Thus finite element (FE) analysis with updated Langrage procedure has to be done where stiffness matrix is
updated due to the new geometrical positions of the deformed elements. This FE procedure was adopted as case studies
with 2D FE-models have shown that ignoring of nonlinear effect leads to underestimation of geogrid strains by 20-30%
(Heitz 2006). In most FE analysis geogrids have been treated as flexible elastic elements that represent a grid like
structure. Geogrids have an axial tensional stiffness but almost nil bending stiffness i.e. they can only sustain tensile
forces, but no compression and bending. However in 2D-analysis simulation an elastic material behavior with axial
stiffness EA can not address the anisotropic behavior of biaxial geogrids. In 3D-simulation, the biaxial-anisotropic
(orthotropic) behavior of geogrid can be addressed by use of different axial rigidities e.g. EA1 and EA2. Thus a 3-D shell
element can be used to account for orthotropic behavior. An elastic-plastic constitutive model is often assumed for
interface elements. To distinguish between elastic and plastic material behavior, failure criteria by Mohr-Coulomb is used.
For static loads, single layer reinforced system are often considered to be more effective than multilayered reinforcement.
However, for dynamic loads, multilayered systems are assumed to be more sustainable (Arwanitaki & Triantafyllidis 2006).
In case of analytical methods as derived in EBGEO (2010), validity of membrane theory is assumed and calculated
membrane force is distributed to the geogrid layers according to their characteristic axial rigidity. The results obtained from
analytical methods adopted by EBGEO are on conservative side by 20-25% as non-linear effect is ignored which is
considered in FEM analysis. Thus for layers greater than two layers should be verified by numerical analysis. In case of
loading with eccentricity also, stress distribution due to non-linearity should be cross- verified by numerical methods. In
simple situations, a multiplication factor can be used to get correct values from analytical analysis.
2.2 Analytic Approach Analysis of GRS was in accordance with BS 8006 (2012) for internal and external stability and was then verified by
EBGEO. The results were almost comparable. These results were also verified by commercial software MSEW (3.0)
based on FHWA-NHI-00-043 (2001) along with seismic stability check. The results for external stability under sliding are
more conservative in BS-8006 under load combination B. As analytical methods are limited in considering the complexity
of interaction mechanism, non-linear behavior and prediction of deformations, numerical methods & full scale modeling
can be successfully used to establish correlation factors with analytical formulae. Then analytical methods can be
successfully used in similar situation for superior prediction of behavior of reinforced structure and cost-optimization.
314

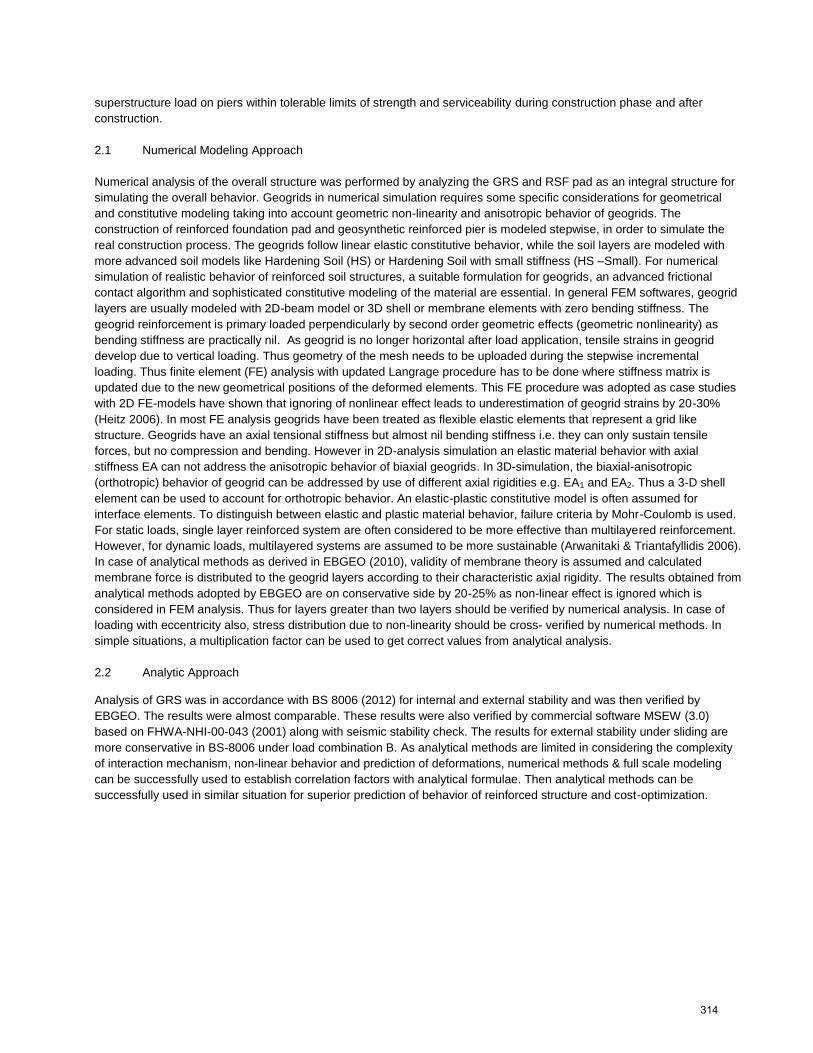
Figure 2. Prestraining of GSF pier and RSF pad system
3. CONSTRUCTION METHODOLOGY
The pier was supported on reinforced cement concrete (RCC) spread footing as shown in Fig. 2. The size of the footing
could not be beyond a certain limit as there was excessive increase in overall settlement beyond acceptable serviceability
limit. Thus it was decided to adopt reinforced soil pad below RCC footing for reduction of load intensity by providing large
area along with enhancement of bearing capacity as well as reduction in differential and total settlement. The height of the
pier was 5.0 m. The cross-section size of pier was 4m x 4m. The dimensions of RCC spread footing were kept as 5m x 5m
x 1.2m. The cross-section area of (RSF) was kept as 11m x 11m. The depth of the RSF was kept as 1.2m. After
excavation of area for foundation, a fabric separator (Woven Geotextile) was laid along the base and walls of the pit. Basic
function of this fabric separator was to maintain structural integrity of RSF pad. After the excavation of soil, the base of the
pit was compacted. The pit was refilled with granular sub base material ( = 35º, = 20kN/m3) along with layers of
geogrids and geocell as shown in Figure 1. The fill was compacted in 200 mm lifts to achieve 95% proctor density with
three layers of geogrid and one layer of geocell placed 200 mm apart. RSF pad was instrumented with strain gauges,
pressure cells and inclinometers for evaluating the performance of the RSP pad in detail. The GRS pier were constructed
using high strength polyester geogrids and discrete 3D-panels along with corner column junctions. The construction of
GRS pier is not being discussed here in detail as that is not the subject of the paper and its construction is very already
well documented. The GRS pier was pre-strained using hydraulic jacks and a specifically designed reaction system. The
jacks and concrete pads were bolted together with vertical steel rods. After completion of RSF and RCC footing, four
concrete reaction bottom pads were poured over RCC footing. The dimensions of the base pads were 2.50m x 2.50m x
0.3m thick. Four sections of special steel rods of 40 mm were anchored into each pad. Each pad was separated with
thermocol to maintain its independence. Load was measured with load cells and calculated from hydraulic jack pressure.
Load was maintained with an electrical hydraulic pump and strain box indicator connected to load cell. The experiment
ensured that the load is evenly applied over entire area of pier. A pressure transducer was connected to hydraulic line to
monitor jack pressure. The pier was loaded by squeezing the reinforced soil between concrete pads. Displacements were
measured with linear variable displacement transducers (LVDTs), linear potentiometers and mechanical/digital dial
gauges. Vertical settlements were measured from top pads. Lateral displacement was measured along the height of pier
walls. Strain gauges were of high elongation foil types. They were first glued on a heat set non woven fabric piece and
then glued over the geogrids. They were placed @ 0.2m interval in both directions on each layer.
4. NUMERICAL MODELING
The analytical methods proposed by several international codes have been developed based on theoretical and
experimental investigations. Thus these methods may not be completely applicable to all geosynthetic applications due to
variation in geometrical, mechanical, geosynthetic configuration and load. Fig. 3 represents the typical layout of
geosynthetics considered for increase of bearing capacity along with decrease in differential and total settlement.
315

Figure 3. Increase in BCR (Bearing Capacity Ratio) by using geosynthetics
Thus it becomes imperative to use numerical modeling for observing the behavior of structure at working stress
conditions, inspecting the complex interaction between geogrids, soil and other rigid structures. It may also help in techno-
commercial optimization of the structure. It is also used as a tool for cross-verification of deformation of overall system
which is significant for such type of high loading structures. The geogrid material model adopted in this case was based on
the test data obtained from physical modeling of the structure which was cross-verified by user-defined model so that it
can be used in future projects without any physical simulation of structure. Geogrid material behavior was considered to
be anisotropic and non-linear, using the parameters listed in Table 1.
Table 1. Finite element material properties
The material model is assumed to be phenomenological as it is presumed to capture the mechanical response of yarns in
both warp and weft directions. It also accounts for non-linearity during the analysis step since it is intended to be finite-
strain approach. It is valid for structural directions not orthogonal to each other with deformation. This model defines the
local geogrid stress as a function of change in angle between the fibers (shear strain) and the normal strains along the
yarn directions. It also allows for the computation of local geogrid stress based on test data or user-defined model. The
geogrid material model defined in test data also assumes that the response along the warp and weft are independent of
each other and that the shear response is independent of the direct response along the yarns of geogrid. This model also
includes separate loading and unloading responses. It is also able to exhibit non-linear elastic behavior, damaged elastic
behavior and elastic-plastic type behavior with permanent deformation upon complete unloading. It is also able to deform
elastically to large tensile and shear strains and can have properties depending on temperatures and other variables.
Polyester (PET) geogrids were used for the project. PE geogrid consists of bundles of high tenacity PET yarns (1000 to
316
1500 Deniers) woven at junctions to create a grid like structure. It is further coated with Poly Vinyl Chloride (PVE) material
for durability. The non-linear behavior of geogrids arises from the nonlinear response of individual yarns, the exchange of
crimp between the backfill and the geogrid as they are stretched and the contact and the friction between the yarns in
cross and in same direction. There is also passive resistance offered by transverse portion of grid. In general, geogrid
exhibits a significant stiffness only along the yarn directions under tension. The tensile response in warp and weft
directions may be coupled due to crimp exchange between backfill and geogrid and junctions between them. Under in-
plane shear deformation, the yarns in the warp and weft directions rotate with respect to each other. The resistance
increases with shear deformation as lateral passive resistance is formed between the backfill and yarns in each direction.
There is almost negligible stiffness in bending and in-plane compression. The behavior of geogrids is modeled
phenomenological in ABAQUS/Explicit to capture the non-linear anisotropic behavior. The planar kinematic states of
geogrid is described in terms of nominal direct strains in the geogrid plane and the angle between the warp and weft
direction. The engineering nominal shear strain, 12, is defined as the change in angle, 12, between the two yarn directions
going from referenced to deformed configuration. The nominal strains along the yarn directions n1 and n2 in the deformed
configuration are computed from respective yarn stretch values, 1 and 2. The fabric nominal stress, T, is converted to
the Cauchy stress, , and the subsequent internal forces arising from the fabric deformation are computed. The output of
geogrid nominal strains, geogrid nominal stresses, and the regular Cauchy stresses can be obtained. The relationship
between the Cauchy stress, , and the nominal stress, T, is:
𝐽𝜎 = 𝜆1 𝑇11 𝒏𝟏 𝒏𝟏 + 𝜆2 𝑇22 𝒏𝟐 𝒏𝟐 + 𝑇𝟏𝟐 csc(𝜓12) (𝒏𝟏𝒏𝟐 + 𝒏𝟐𝒏𝟏) − 𝑇12 cot(𝜓12) (𝒏𝟏 𝒏𝟏 + 𝒏𝟐 𝒏𝟐) [1]
where J is the volumetric Jacobian. The non-linear behavior of geocell arises from the nonlinear response, the exchange
of crimp between the backfill and the geogrid as they are stretched and the contact and the friction between the geocell
wall in cross and in same direction. There is also passive resistance offered by transverse portion of geocell. In general,
geocell exhibits a significant stiffness only along the longitudinal directions under tension. The tensile response in
perpendicular directions may be coupled due to crimp exchange between backfill and geocell and junctions between
them. The behavior of geocell is modeled phenomenological in ABAQUS/Explicit to capture the non-linear anisotropic
behavior. The planar kinematic states of geocell is described in terms of nominal direct strains in the geocell plane and the
angle between the perpendicular directions. The shape of geocell was modeled with a rhomboidal shape as assumed in
earlier experiment (Leschinsky and Ling 2012). Geocell and the infill material has also been modeled separately. Frictional
interface between the geocell and infill material has been modeled separately. Analytical model for estimating compaction
induced horizontal stress in the geocell reinforced base and for considering accumulated residual strain in geocell and
induced additional confining stress to the fill material has been deployed as provided by Yang (2010).
Finite element adopted for geogrid, geocell and soil is 4-node, doubly curved, general purpose, fully integrated finite-
membrane-strain shell element (S4 of Aqabus). As element stiffness is fully integrated, no spurious membrane or bending
zero energy mode exist and no membrane or bending mode hourglass stabilization is used. This element assumes that
the transverse shear force or strain (since the transverse shear treatment is based on the initial elastic modulus of the
material) is constant over the element. The Concrete in spread footing was considered as linear elastic with high stiffness
exhibiting non-yielding behavior. It was modeled with hexahedral 8-noded elements with reduced integration (C3D8R).
The double hardening model like hardening soil with small strain (HSsmall) is being used for modeling of soil. This is
basically an elastic-plastic hyperbolic model with Mohr-Coulomb failure criterion. The reason for using this model is due to
the importance accorded to small-strain stiffness under heavy loading. Ignoring small-strain stiffness in geotechnical
analysis may potentially lead to overestimation of foundation settlements and thus consequently underestimating stresses.
Accurate prediction of stresses is essential for design of geogrid reinforcement and over prediction of settlements may
result in uneconomical ground improvement. It is also recommended for serviceability Limit State analyses as it generally
predicts soil behavior and field measurements more precisely than basic linear-elasticity methods. It also accounts for
stress history which is crucial for flexible footing under heavy loading. Constitutive models available in Abaqus library do
not include double hardening models like HSsmall model. Thus we implemented this model in Abaqus with user subroutines
UMAT and VUMAT written in Python language on similar coding developed by Arslan and Sture (2008).
The behavior of a RSF pad sitting on the sub grade depends on many factors including the reinforcement type,
reinforcement spacing, reinforcement stiffness, footing embedment depth, reinforcement-soil interaction coefficient and
footing width. The effect of all these factors needs to be incorporated into a rational design method for RSF pad. In order
317
to include the effect of different soil properties in the design method, additional finite element analyses were conducted
using friction angles of = 35º, 40º, 45º and 50º and varying elastic modulus of geocell (500 to 2000 MPa), soil (10 to 25
MPa) and axial stiffness of geogrids (3500 to 5000 kN/m). Based on the database generated by FE parametric study, a
multi-regression statistical analysis was conducted to develop a simple Bearing Capacity Ratio (BCR) and settlement ratio
(SR) model for use by geotechnical engineers in design of RCF pad with various alternatives. The full model described in
Eq. 2 that includes the effects of all variables and their interactions was first analyzed.
BCR = β0 + β1*X1 + β2*X2 + β3*X3 + β4*X4 + β5*X5 + β6X6 + β7X1*X2 + β8*X1X3 + β9*X1X4 + β10*X1X5 +
β11*X1X6 + β12*X2X3 + β13*X2X4 + β14*X2X5 + β15*X2X6 + β16*X3X4 + β17*X3X5 + β18*X3X6 +
β19*X4X5 + β20*X4X6 + β21*X5X6 [2]
where, BCR is the ultimate bearing capacity ratio of the reinforced soil (at s/B = 10%), X1 is the spacing ratio between
reinforcement layers (h/B), X2 is the average normalized stiffness of reinforcement (Jav / (Esav*Dav)], X3 is the footing
embedment ratio (d/B), X4 is the footing width ratio (B/4 m), X5 is the normalized friction angle of soil (/35), and X6 is the
normalized elastic modulus of soil (E/17.5 MPa). A stepwise variable selection procedure was then performed on the
general model shown in Eq. 2 5 to remove insignificant variables from the general model. The statistical variable selection
procedure showed that no interaction between these variables is significant and that reinforcement spacing, average
reinforcement stiffness, footing embedment, and footing width are the statistically significant variables for the BCR at the
95% confidence level. The multiple regression analysis was then conducted on the reduced model, and the results yielded
the model shown in Equation 3:
BCR = 3.6823 - 0.45851*X1 + 0.08947*X2 - 0.27817*X3 - 0.3945*X4 - 1.6964*X5 + 0.4276*X6 (R2 = 0.95) [3]
The relative importance of each independent variable on the BCR was assessed by comparing t values. Index |t| is a t-
statistical parameter, which is used for evaluating the statistical significance of design parameters; the higher the value is,
the more significant is the parameter. The results of t value comparison show that the spacing between reinforcement ratio
(|t| =17.85) has the most significant effect on the increase of bearing capacity among all variables. The stiffness of
reinforcement (|t| =5.85) has the weakest effect on the increase of bearing capacity among all variables. It is worth noting
that there is a tradeoff between increasing reinforcement stiffness and reducing reinforcement spacing. However, based
on the results of this study, it is advisable to decrease spacing increasing stiffness as far as reinforcement spacing is kept
within acceptable design range [i.e., 200 mm ≤ h ≤ 400 mm] and provided that it is cost-effective. Use of one layer of
geocell lowers the failure wedge, enhances bearing capacity and reduces differential and total settlement. The BCR
regression model in Eq. 3 was verified by comparing the results of the regression model with the results of finite element
analysis determined for 100 new reinforced cases of different configurations. The results of the comparison are presented
in Fig. 4. The absolute errors range from 0.14% to 2.25%, which suggests that the BCR values predicted by the
regression model in Eq. 3 have good correlation. Settlement reduction ratio (SRR) was obtained by interlinking it to
stiffness ratio and then to applied load and BCR in similar manner as evaluated in EBGEO (2011).
𝑆𝑅𝑅 =𝑆1
𝑆2=
𝐸2
𝐸1= 𝐵𝐶𝑅 − (
𝑈𝐿𝑇𝐼𝑀𝐴𝑇𝐸 𝐿𝑂𝐴𝐷
𝑈𝐵𝐶1) [4]
where S1 and S2 are settlement values of unreinforced soil and reinforced soil respectively; E1 and E2 are equivalent
stiffness of unreinforced soil and reinforced soil respectively; BCR being the bearing capacity ratio due to ground
improvement; ultimate load is the uniformly load applied to the RSF pad and UBC1 is the ultimate bearing capacity of
unreinforced ground. The SRR regression model in Eq. 4 was verified by comparing the results of the regression model
with the results of finite element analysis determined for 100 new reinforced cases of different configurations. The results
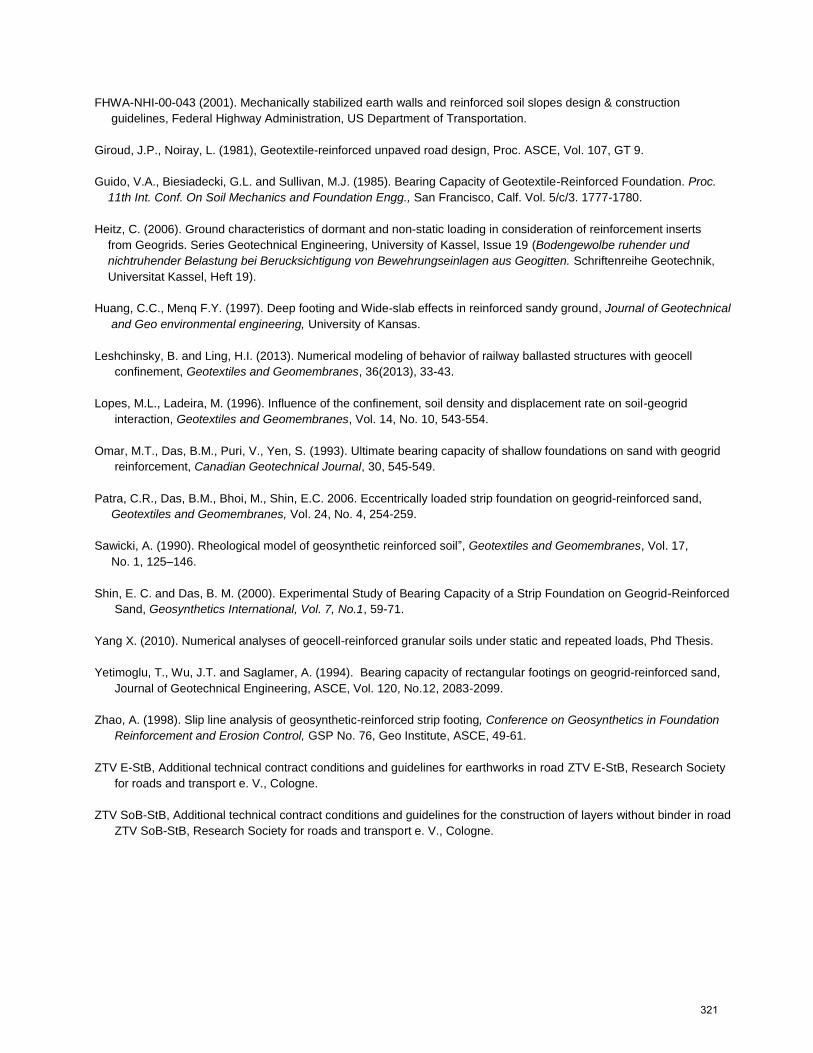
of the comparison are presented in Fig. 4. The load v/s settlement characteristics for pilot test have been plotted in Fig. 5
along with FEM results on unreinforced soil and reinforced soil. Good correlation exist between instrumented and FEM
results.
318
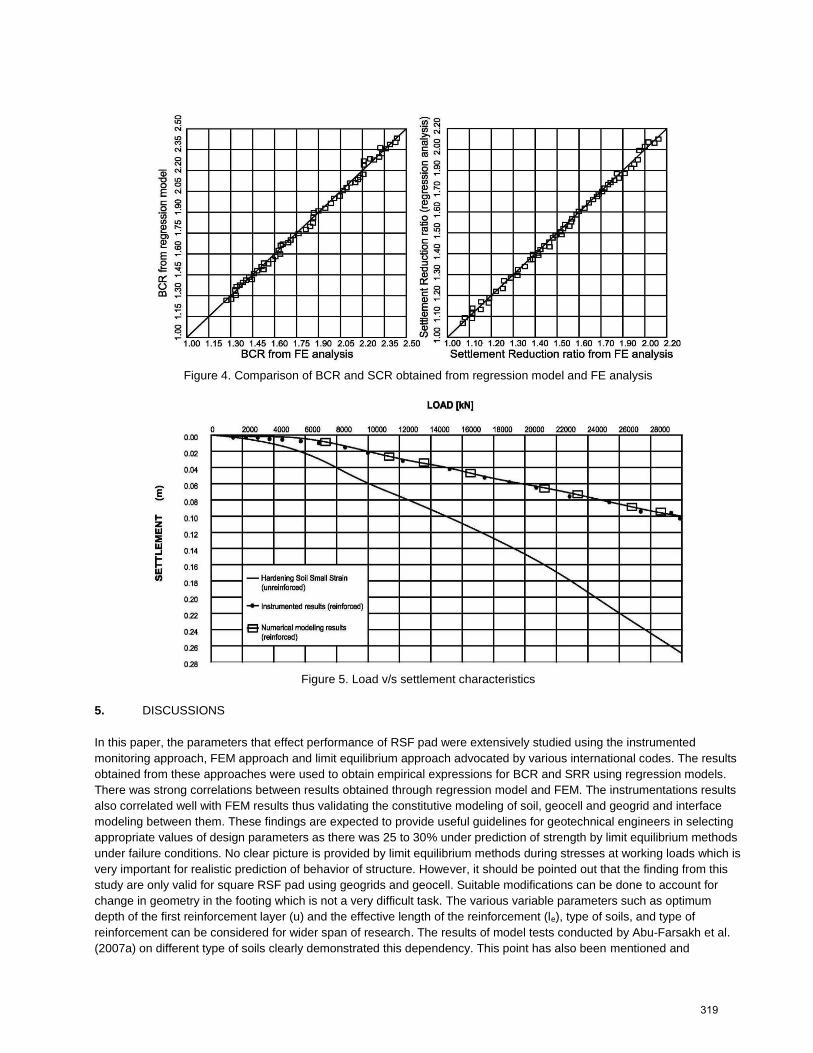
Figure 4. Comparison of BCR and SCR obtained from regression model and FE analysis
Figure 5. Load v/s settlement characteristics
5. DISCUSSIONS
In this paper, the parameters that effect performance of RSF pad were extensively studied using the instrumented
monitoring approach, FEM approach and limit equilibrium approach advocated by various international codes. The results
obtained from these approaches were used to obtain empirical expressions for BCR and SRR using regression models.
There was strong correlations between results obtained through regression model and FEM. The instrumentations results
also correlated well with FEM results thus validating the constitutive modeling of soil, geocell and geogrid and interface
modeling between them. These findings are expected to provide useful guidelines for geotechnical engineers in selecting
appropriate values of design parameters as there was 25 to 30% under prediction of strength by limit equilibrium methods
under failure conditions. No clear picture is provided by limit equilibrium methods during stresses at working loads which is
very important for realistic prediction of behavior of structure. However, it should be pointed out that the finding from this
study are only valid for square RSF pad using geogrids and geocell. Suitable modifications can be done to account for
change in geometry in the footing which is not a very difficult task. The various variable parameters such as optimum
depth of the first reinforcement layer (u) and the effective length of the reinforcement (le), type of soils, and type of
reinforcement can be considered for wider span of research. The results of model tests conducted by Abu-Farsakh et al.
(2007a) on different type of soils clearly demonstrated this dependency. This point has also been mentioned and
319

discussed in detail by Yetimoglu (1994) and Abu-Farsakh et al. (2007b). Therefore, more studies on the influence of soil
type and footing type, which were not covered in this FEM study, are highly desired in developing a rational and reliable
design methodology for RSF pads. The FEM analyses were validated using full-scale instrumented modeling tests and
then used to analyze full-scale square RSF pad over existing soil. The results also showed that the BCR decreases with
the increase in footing width. This is in agreement with other research studies (Das et al., 1994; and Elvidge and
Raymond, 2001). However, full-scale field tests are no longer required as numerical modeling and regression modeling is
showing high correlations. Thus FEM modeling for GC-3 type structures and regression model or limit equilibrium methods
with suitable correction factors can be used for GC-1 and GC-2 type structures.
6. CONCLUSIONS
Based on the results of finite element, full-scale modeling and regression analyses of a RSF pad, following conclusions
can be drawn:
1) Smaller spacing of reinforcement (200mm to 300mm) using high frictional fill loads to superior compaction of
reinforced fill and is the main factor for good performance. This envisaged reinforced system is having superior
seismic resistance.
2) Durability of geosynthetics is not considered to be a problem as they are closed spaced and adequate encapsulated.
3) The inclusion of reinforcement layers reduces the magnitude of vertical stress through redistribution of the load
applied on the footing onto a wider range, thus helping reduce the overall settlement of the soil below RSF pad.
4) A regression model was developed for BCR and SRR of RSF pad based on the results of FE analysis. The
verification showed that the model can be used to estimate BCR and SRR with good accuracy.
5) The BCR of the RSF pad decreases and SRR of RSF pad increases with the increase in reinforcement spacing.
6) The BCR of the RSF pad increases and SRR decreases with the increase in the reinforcement stiffness. The
stiffness-related increase is more remarkable at normalized reinforcement stiffness of less than 0.5.
7) The increase in footing embedment depth and/or footing width improves the ultimate bearing capacity of the
unreinforced soil more than that of the reinforced soil, resulting in a decrease in the BCR and an increase in the SRR.
REFERENCES
Abaqus (2011). User Manual, Version 2.12
Abu-Farsakh, M. Y., Chen, Q. and Yoon, S. (2007a). Use of Reinforced Soil Foundation (RSF) to Support Shallow
Foundation,” Report No. FHWA/LA.04/423, Louisiana Transportation Research Center, Baton Rouge, LA, 195.
Abu-Farsakh, M. Y., Gu, J., Voyiadjis, G.Z. and Tao, M. (2007b). Numerical Parametric Study of Strip Footing on
Reinforced Embankment Soil,” Journal of the Transportation Research Board, No. 2004, Soil Mechanics, 132 – 140.
Arslan, H., Sture, S. (2008). Finite Element Analysis of localization and micro-macro structure relation in granular
materials – Part – II: Implementation, and simulations, Acta Mech, 197, 153-171.
Arwanitaki, A., Triantafyllidis, T. (2006). Multi-layer reinforced with geogrids earth system via pole-like founding
elements, Structural Engineering (Mehrlagig mit Geogittern bewehrte Erdkorper uber pfahlartigen
Grundung elementen, Bautechnik) 83(10), 696-707.
Benz, T. (2007). Small-strain stiffness of soils and its numerical consequences, Phd Thesis, Universitat Sttutgart.
BS 8006-1 (2010). Code of practice for strengthened/reinforced soils and other fills, BSI.
Das, B. M., Shin, E.C. and Omar, M.T. (1994). The bearing capacity of surface strip foundations on geogrid reinforced
sand and clay – a comparative study, Geotechnical and Geological Engineering, Vol. 12, No. 1, 1-14.
EBGEO (2011). Recommendations for design and analysis of earth structures using geosynthetics reinforcements,
DGGT (German Geotechnical Society).
320
FHWA-NHI-00-043 (2001). Mechanically stabilized earth walls and reinforced soil slopes design & construction
guidelines, Federal Highway Administration, US Department of Transportation.
Giroud, J.P., Noiray, L. (1981), Geotextile-reinforced unpaved road design, Proc. ASCE, Vol. 107, GT 9.
Guido, V.A., Biesiadecki, G.L. and Sullivan, M.J. (1985). Bearing Capacity of Geotextile-Reinforced Foundation. Proc.
11th Int. Conf. On Soil Mechanics and Foundation Engg., San Francisco, Calf. Vol. 5/c/3. 1777-1780.
Heitz, C. (2006). Ground characteristics of dormant and non-static loading in consideration of reinforcement inserts
from Geogrids. Series Geotechnical Engineering, University of Kassel, Issue 19 (Bodengewolbe ruhender und
nichtruhender Belastung bei Berucksichtigung von Bewehrungseinlagen aus Geogitten. Schriftenreihe Geotechnik,
Universitat Kassel, Heft 19).
Huang, C.C., Menq F.Y. (1997). Deep footing and Wide-slab effects in reinforced sandy ground, Journal of Geotechnical
and Geo environmental engineering, University of Kansas.
Leshchinsky, B. and Ling, H.I. (2013). Numerical modeling of behavior of railway ballasted structures with geocell
confinement, Geotextiles and Geomembranes, 36(2013), 33-43.
Lopes, M.L., Ladeira, M. (1996). Influence of the confinement, soil density and displacement rate on soil-geogrid
interaction, Geotextiles and Geomembranes, Vol. 14, No. 10, 543-554.
Omar, M.T., Das, B.M., Puri, V., Yen, S. (1993). Ultimate bearing capacity of shallow foundations on sand with geogrid
reinforcement, Canadian Geotechnical Journal, 30, 545-549.
Patra, C.R., Das, B.M., Bhoi, M., Shin, E.C. 2006. Eccentrically loaded strip foundation on geogrid-reinforced sand,
Geotextiles and Geomembranes, Vol. 24, No. 4, 254-259.
Sawicki, A. (1990). Rheological model of geosynthetic reinforced soil”, Geotextiles and Geomembranes, Vol. 17,
No. 1, 125–146.
Shin, E. C. and Das, B. M. (2000). Experimental Study of Bearing Capacity of a Strip Foundation on Geogrid-Reinforced
Sand, Geosynthetics International, Vol. 7, No.1, 59-71.
Yang X. (2010). Numerical analyses of geocell-reinforced granular soils under static and repeated loads, Phd Thesis.
Yetimoglu, T., Wu, J.T. and Saglamer, A. (1994). Bearing capacity of rectangular footings on geogrid-reinforced sand,
Journal of Geotechnical Engineering, ASCE, Vol. 120, No.12, 2083-2099.
Zhao, A. (1998). Slip line analysis of geosynthetic-reinforced strip footing, Conference on Geosynthetics in Foundation
Reinforcement and Erosion Control, GSP No. 76, Geo Institute, ASCE, 49-61.
ZTV E-StB, Additional technical contract conditions and guidelines for earthworks in road ZTV E-StB, Research Society
for roads and transport e. V., Cologne.
ZTV SoB-StB, Additional technical contract conditions and guidelines for the construction of layers without binder in road
ZTV SoB-StB, Research Society for roads and transport e. V., Cologne.
321
Related Documents