1 Storebrand Results 1st Quarter 2008 April 2008 Analyst presentation 2 Analyst Presentation 1 st Quarter 2007 Page # Slide # • Storebrand Group Group CEO Idar Kreutzer 2-11 3-22 Back-up: • Storebrand Group 12-18 23-36 • Storebrand ASA 19-20 37-40 • Storebrand Life Group 21-25 41-50 • Storebrand Life Insurance 26-35 51-70 • SPP 36-46 71-92 • Storebrand Investments 47-52 93-104 • Storebrand Bank 53-58 105-116 • Storebrand Non-Life 59-61 117-122

Welcome message from author
This document is posted to help you gain knowledge. Please leave a comment to let me know what you think about it! Share it to your friends and learn new things together.
Transcript

1
Storebrand
Results 1st Quarter 2008
April 2008
Analyst presentation
2
Analyst Presentation1st Quarter 2007
Page # Slide #
• Storebrand GroupGroup CEO Idar Kreutzer 2-11 3-22
Back-up:
• Storebrand Group 12-18 23-36
• Storebrand ASA 19-20 37-40
• Storebrand Life Group 21-25 41-50
• Storebrand Life Insurance 26-35 51-70
• SPP 36-46 71-92
• Storebrand Investments 47-52 93-104
• Storebrand Bank 53-58 105-116
• Storebrand Non-Life 59-61 117-122

2
Storebrand
Results Q1 2008
30 April 2008
Idar KreutzerGroup CEO
4
Highlights Q1 2008
� Group result of NOK 535 million
� Positively affected by new life insurance regulation and IFRS effects totaling close to NOK 200 million
� Growth in premiums
� Integration of SPP according to plan
� Bridge financing extended to March 2009
3
5
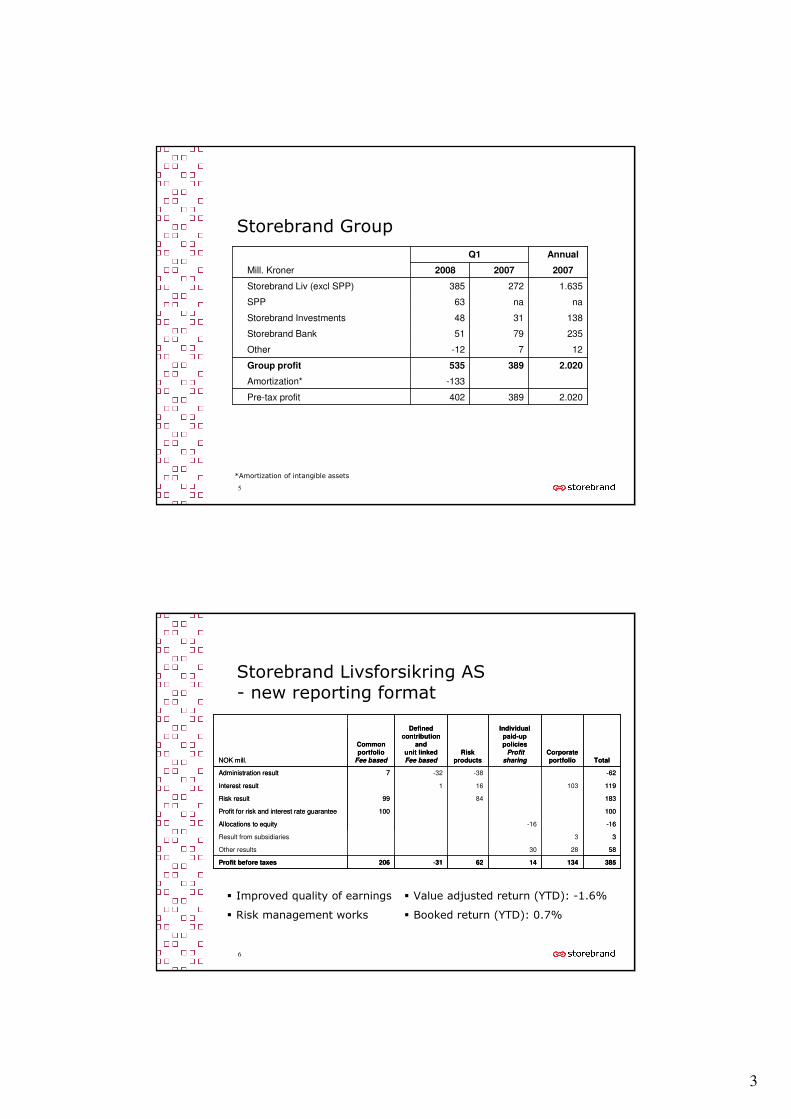
Storebrand Group
*Amortization of intangible assets
2.020389402Pre-tax profit
-133Amortization*
2.020389535Group profit
127-12Other
2357951Storebrand Bank
1383148Storebrand Investments
nana63SPP
1.635272385Storebrand Liv (excl SPP)
200720072008Mill. Kroner
AnnualQ1
2.020389402Pre-tax profit
-133Amortization*
2.020389535Group profit
127-12Other
2357951Storebrand Bank
1383148Storebrand Investments
nana63SPP
1.635272385Storebrand Liv (excl SPP)
200720072008Mill. Kroner
AnnualQ1
6
Storebrand Livsforsikring AS - new reporting format
� Improved quality of earnings
� Risk management works
� Value adjusted return (YTD): -1.6%
� Booked return (YTD): 0.7%
3851341462-31206Profit before taxes
582830Other results
33Result from subsidiaries
-16-16Allocations to equity
100100Profit for risk and interest rate guarantee
1838499Risk result
119103161Interest result
-62-38-327Administration result
NOK mill. Total
Corporate
portfolio
Individual
paid-up
policies
Profit
sharing
Risk
products
Defined
contribution
and
unit linked
Fee based
Common
portfolio
Fee based

4
7
Storebrand Livsforsikring AS - Norwegian business
*Weighted average for products in the common portfolio. The common portfoliois marked-to-market
NOK 10 bn
-
-
0,0%Value adjustedreturn (YTD)
-1,6%
Booked return(YTD)*
0,7%
Interest rate guarantee p.a.
3,5%
AuM NOK 157 bn
17 %
18 %
29 %
16 %
8 %4 %
8 %
Shares
Bonds
Hold to maturity
Real Estate
Alpha
Money market
Other
Common portfolio
31 %
0 %
16 %
2 %
10 %
4 %
37 %
Corporate portfolio
8
Storebrand Livsforsikring AS– risk capital
Additional statutory reserves includes more than one year interest rate guarantees
0
5
10
15
Q1 2003 Q1 2004 Q1 2005 Q1 2006 Q1 2007 Q1 2008
Additional statutory reserves* Market value adj. res.
Core capital margin Profit carried forward
8,0
14,613,3
9,68,1
4,9
NOK bn

5
9
Storebrand Livsforsikring AS- growth in premium income
0
3
6
9
12
15
18
Q1-07 Q2-07 Q3-07 Q4-07 Q1-08
12 month rolling premium income*
+25%
* Premium income ex transfers
NOK bn
10
* Company portfolio includes results from amongst others SPP Liv Pensjonstjänst AB, SPP Konsult AB, SPP Kundcenter AB, SPP Fonder AB and SPP Varumärkes AB
� Good risk result
� Challenging financial markets
� Including integration costs of approx. NOK 15 million
� Tax cost on financial result
SPP incl. Euroben- new reporting format
6453-3103Profits SPP
4646Other results
-691-70Financial result
71-373Risk result
177-110Administration result
portfolio*LinkedproductsNOK mill.
TotalCorporateEurobenUnitGuaranteed
6453-3103Profits SPP
4646Other results
-691-70Financial result
71-373Risk result
177-110Administration result
portfolio*LinkedproductsNOK mill.
TotalCorporateEurobenUnitGuaranteed

6
11
3 %1 %32 %
64 %
Bonds and moneymarket instruments
Shares
Real Estate
Other
SPP incl. Euroben– allocation guaranteed portfolios
80 %
20 %
0 % 0 %
Common portfolio
NOK 2,0 bn
NOK 8,0 bn
NA
NA
NOK 69,1 bnAuM
Value adjusted return (YTD)
- 3,9%
Interest rate guarantee p.a.
2,5% - 5,2%
Conditional bonus reserves
NOK 8,1 bn
Euroben
12
SPP incl. Euroben- new investment strategy
� Reduced weighting in Swedish
equities
� Reduced basic risk
� Dynamic risk management
(CPPI)
� Investments in Storebrand
Alternative Investments
� Improved hedge programme
being implemented
Conditional bonus reserves
13,9
10,2
0
2
4
6
8
10
12
14
Q4 2007 Q1 2008
NOK bn

7
13
SPP incl. Euroben- good growth in premiums
� 50% increase in new sales
� 12.5% market share of new sales in 2007
� Increased sales through all channels
+11%
0
2
4
6
8
Q1-07 Q2-07 Q3-07 Q4-07 Q1-08
12 month roling premium income
NOK bn
* Premium income ex transfers
14
SPP - integration according to plan
2008 and 2009
Implementation & continuing improvement
January - April 2008
First 100 days
100-day
program
Separation &
Integration
Asset
management
� New products developed
� Lean in sales
� Strengthened distribution capacity
� Continuing lean implementation
� IT-separation
� Procurement
� Discontinue TSA*
� Move asset mgmt to SBK
� Increased sales
� Improved productivity
� Broker-roadshow
� Lean-pilot projects finished
� IT-separation from Handelsbanken
� IT-infrastructure agreement
� SPP in new organization
� SRI mainly implemented
� New investment strategy
� Altered risk management model
� Improved fund offer
*Transitional Service Agreements

8
15
Storebrand Investments- sound result
� Good cost control
� Net finance/other includes NOK 13.6 million from real estate management
� Low performance related fees
1383148Profits before taxes
66621Net financial and other
-258-65-59Total costs
3319085Total income
200720072008NOK mill.
AnnualQ1
1383148Profits before taxes
66621Net financial and other
-258-65-59Total costs
3319085Total income
200720072008NOK mill.
AnnualQ1
16
0,0 %
20,0 %
40,0 %
60,0 %
80,0 %
100,0 %
120,0 %
Q1 2003 Q1 2004 Q1 2005 Q1 2006 Q1 2007 Q1 2008
Cost/income
Storebrand Investments- positive development in cost/income
Income = Total income ex performance related fees and real estate management (12 month rolling)
Costs = Total costs ex bonuses (12 month rolling)

9
17
Storebrand Bank- higher net interest margin
� Net interest income increased by 36% compared to Q1 2007
� Net interest margin: 1.19 %
2357944Profit before taxes
-7Amortizations
2357951Profit before amortizations
78451Loan loss provisions
1573550Operating profit before losses
-360-81-111Operating expenses
517115160Total income
461217Other operating income
581118Net fee and commission income
41393126Net interest income
200720072008NOK mill
AnnualQ1 2008
18
Storebrand Bank- stable development
� Price measures give improved profitability
� 12 franchises in Ring Eiendomsmegling acquired
� Covered Bond issuing subsidiary established
� Deposit to loan ratio of 50%
Gross lending by sector
Residential
mortgages
Other retail
Real estate
Other corporate5 %
29 %
2 %
64 %

10
19
Storebrand Helse- solid growth
� Premium income: +22 %
� 55% of sales in Sweden
� 8 000 new customers in Q1
� 70 000 customers in total
Dagbladet 08.02.08
20
Financing
� Bridge loan extended until March 2009
� 65bp + 20bp on extension
� Will be replaced by long term subordinated debt
� Storebrand ASA has strengthened
Storebrand Livsforsikring AS' capital base
0
50
100
150
200
250
300
03.09.2007 03.10.2007 02.11.2007 02.12.2007 01.01.2008 31.01.2008 01.03.2008 31.03.2008
iTraxx Europe Subordinated Financials
Storebrand UT 2

11
21
Summary
� Satisfactory development in results in challenging markets
� Good premium growth
� Integration of SPP proceeding according to plan
� New reporting format
22
Storebrand's objective is to be the leading and most respected institution in the Nordic market for long-term savings and insurance

12
Storebrand Group
24
IFRS accounting
Storebrand ASA’s group accounts are presented in accordance with the International Financial Reporting Standards (IFRS) approved by the European Union.

13
25
Storebrand Group
Group profit by sub-group
01.01. - 31.12
NOK million 2008 2007 2007
Life activities 448 272 1 635
Investment activities 48 31 138
Storebrand Bank 51 79 235
Other activities -12 7 12
Group profit 535 389 2 020
Amortization intangible assets -133
Group profit after amortization before tax 402 389 2.020
Q1
26
Storebrand GroupOperating Profit
Q1
NOK million 2008
Net premiums - insurance 12 299
Interests income 126
Financial income company 10
Financial income customers -5 954
Other income 946
Operating income 7 427
Insurance benefits, reserve allocations -4 084
To/from additional staturory reserves - life ins. 402
Funds allocated to policyholders - life insurance -1 981
Interests costs - 240
Loan losses - banking 2
Operating expenses - 947
Other costs - 44
Costs and expenses -6 892
Group result 535
Amortization intangible assets - 133
Group result after amortization before tax 402

14
27
Storebrand GroupOperating Profit
Q1 01.01. - 31.12
NOK million 2007 2007
Net premiums - insurance 6 335 19 744
Interests income 93 413
Financial income 3 384 12 407
Other income 168 834
Operating income 9 979 33 397
Insurance benefits, reserve allocations -7 477 -27 620
Interests costs - 66 - 318
Loan losses - banking 45 78
Operating expenses - 647 -2 582
Other costs - 21 - 188
Costs and expenses -8 166 -30 630
To (from) market price adjustment reserve - 896 2 036
Operating profit 917 4 803
28
Storebrand GroupEarnings per share
01.01.-31.12
NOK million 2008 2007 2007
Profit after amortisation before tax 402 388 2 029
Tax - 233 - 24 - 20
Profit for the year 169 364 2 009
- Minority interests - 6 - 1 - 3
- Change in security reserve etc. 0 1 - 7
Earnings 163 364 1 999
Earnings per share 0,37 1,48 7,95
Average number of shares (million shares) 444,9 245,4 251,5
Q 1

15
29
Storebrand Group
Balance sheet
Andel Share of
NOK million 31.3.08 totalt assets
Intangible assets- company 10 557 3 %
Shares in associated companies - company 154 0 %
Loans - company 38 190 10 %
Bonds held to maturity - company 23 191 6 %
Other assets - comapny 23 519 6 %
Bonds held to maturity - customers 40 154 10 %
Real estate to market value 21 539 6 %
Financial assets at market value - customers 175 440 45 %
Other assets - customers 55 788 14 %
Total assets 388 531 100 %
Equity 19 434 5 %
Subordinated loan capital 6 182 2 %
Market value adjustment reserve 0 0 %
Technical reserves 279 073 72 %
Liabilities to financial institutions 24 663 6 %
Deposits from and liabilities to customers 18 974 5 %
Derivatives 3 165 1 %
Other allocations and liabilities 37 040 10 %
Total liabilities and equity capital 388 531 100 %
30
Storebrand GroupBalance sheet
31.12 Share of
NOK million 2007 total assets
Intangible assets 10 425 3 %
Shares in associated companies 175 0 %
Loans 39 868 10 %
Bonds held to maturity 40 380 11 %
Real estate at market value 21 359 6 %
Financial assets at market value 234 398 61 %
Bank deposits 25 569 7 %
Other assets 9 577 3 %
Total assets 381 749 100 %
Equity 19 241 5 %
Subordinated loan capital 5 214 1 %
Market value adjustment reserve 3 854 1 %
Technical reserves 282 984 74 %
Liabilities to financial institutions 26 392 7 %
Deposits from and liabilities to customers 17 470 5 %
Derivatives 3 645 1 %
Other allocations and liabilities 22 951 6 %
Total liabilities and equity capital 381 749 100 %
16
31
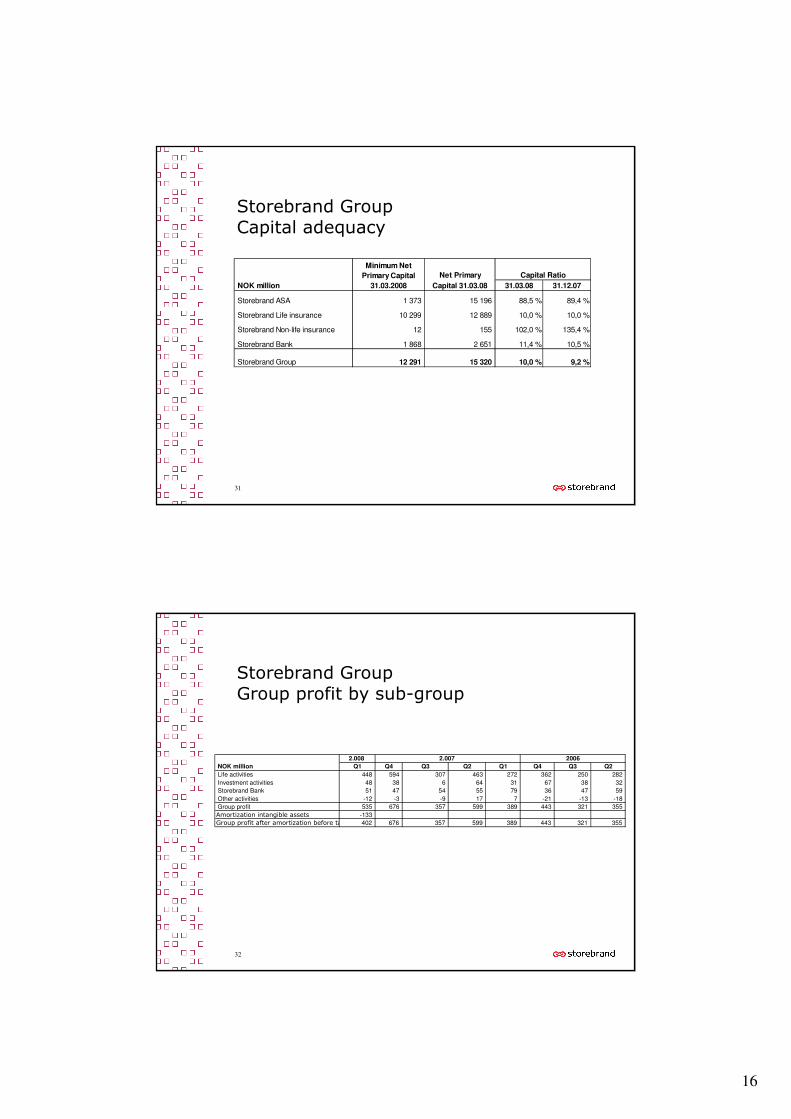
Storebrand Group
Capital adequacy
Net Primary
NOK million Capital 31.03.08 31.03.08 31.12.07
Storebrand ASA 1 373 15 196 88,5 % 89,4 %
Storebrand Life insurance 10 299 12 889 10,0 % 10,0 %
Storebrand Non-life insurance 12 155 102,0 % 135,4 %
Storebrand Bank 1 868 2 651 11,4 % 10,5 %
Storebrand Group 12 291 15 320 10,0 % 9,2 %
Capital Ratio
Minimum Net
Primary Capital
31.03.2008
32
Storebrand Group
Group profit by sub-group
2.008
NOK million Q1 Q4 Q3 Q2 Q1 Q4 Q3 Q2
Life activities 448 594 307 463 272 362 250 282
Investment activities 48 38 6 64 31 67 38 32
Storebrand Bank 51 47 54 55 79 36 47 59
Other activities -12 -3 -9 17 7 -21 -13 -18
Group profit 535 676 357 599 389 443 321 355
Amortization intangible assets -133
Group profit after amortization before tax 402 676 357 599 389 443 321 355
20062.007

17
33
Storebrand Group
Other activities
01.01.-31.12
NOK million 2008 2007 2007
Storebrand ASA 1)
661 1.052 1.057
Storebrand Skadeforsikring -6 -14 -18
Other companies/elimintations 2)
-668 -1.031 -1.027
Total profit other activities -12 7 12
Amortization intangible assets -2
Profit other activities after amortization before tax -15 7 12
1) Including group contributions and dividends from subsidiaries
2) Including elimination of dividends/group contributions from subsidiaries
Q1
34
Shareholder structureas at 25 April 2008
20 largest shareholders By region
*NOM= Client account
Shareholders Acc. Type* Tot. %
KAUPTHING BANK HF ORD 14.51
GJENSIDIGE FORSIKRIN ORD 12.77
KAUPTHING BANK ORD 5.49
FOLKETRYGDFONDET ORD 5.02
EXISTA BV ORD 4.70
FIDELITY FUNDS-EUROP ORD 4.14
EXISTA B.V. ORD 3.99
STATE STREET BANK NOM 2.56
CATER ALLEN INTERN. ORD 2.35
HSBC BANK PLC ORD 2.22
ØVRIGE 10 AKSJONÆRER 12.53
TOTAL 70.28
Foreign ownership 71,3 %
Norw ay
28.7 %
Iceland
20.6 %UK
19.2 %
Other
17.1 %
Luxembourg
9.1 %
USA
5.2 %

18
35
Rating for Storebrand as at April 30 2008
Storebrand ASA
Moody’s: Baa2 (S)
S&P: BBB+ (N)
StorebrandLivsforsikring AS
Moody’s: A2 (S)
S&P: A (N)
StorebrandBank ASA
Moody’s: A2 (S)
S&P: BBB+ (P)
P=positive outlook, S=stable outlook, N=negative outlook
36
Storebrand Group
Key figures01.01.- 31.12
NOK milion 2007 2006 2006
Group
Earnings per share 0,37 1,48 7,95
Capital ratio 10,0 % 10,6 % 9,3 %
Storebrand Livsforsikring AS (excl. SPP)
Policyholders' funds 169.723 155.406 280.965
Return on customers guaranteed portfolio 0,7 %
Return on company portfolio 0,0 % 0,0 % 0,0 %
Risk capital above regulatory minimum (excl.HTM) 7.911 14.633 15.512
SPP Group
Policyholders' funds 91.189
Return on Defined Benefit -4,0 %
Return on Defined Contribution -3,8 %
Adjusted Conditional Bonuses 10.152
Storebrand Bank
Interest margin 1,19 % 1,08 % 1,07 %
Cost/income 74 % 70 % 70 %
Net lending 37.520 32.274 36.791
Gross non-performing and loss-exposed loans 512 597 496
Storebrand Investments (asset management)
Total funds under management 229.568 219.525 227.356
Funds under management for external clients 59.230 56.353 57.661
Cost/income 71 % 76 % 78 %
Q1

19
Storebrand ASA
38
Storebrand ASA
Profit for the year *)
01.01 - 31.12
NOK million 2008 2007 2007
Group contributions and transfers 672 1 033 1 033
Interest income 106 19 117
Interest expense - 91 - 23 - 114
Realised/unrealised gains/losses on securities - 7 44 85
Other financial income/costs 1 - 1 2
Net financial items 10 39 90
Total operating expenses - 21 - 20 - 66
Profit before tax 661 1 052 1 057
*) Results according to IFRS, official accounts prepared according to NGAAP.
Q1

20
39
Storebrand ASA
Quartely development
2.008
NOK million Q1 Q4 Q3 Q2 Q1 Q4 Q3 Q2
Group contributions and transfers 672 0 0 0 1 033 0 0 0
Interest income 106 41 28 30 19 18 18 21
Interest expense - 91 - 37 - 28 - 26 - 23 - 22 - 20 - 18
Realised/unrealised gains/losses on securities - 7 2 - 5 44 44 21 13 - 2
Other financial income/costs 1 - 5 0 8 - 1 0 0 4
Net financial items 10 1 - 6 55 39 17 11 4
Total operating expenses - 21 - 7 - 16 - 23 - 20 - 21 - 19 - 19
Profit before tax 661 - 6 - 21 32 1 052 - 5 - 8 - 14
2.007 2006
40
Storebrand ASA
Balance sheet *)
Share of Share of
NOK million 31.03.2008 total assets 31.12.2007 total assets
Shares in subsidiaries 14 972 69 % 15 183 67 %
Financial assets at market value 1 456 7 % 1 511 7 %
Other assets 5 153 24 % 5 945 26 %
Total assets 21 581 100 % 22 639 100 %
Equity 15 916 74 % 15 440 68 %
Bond loan 5 356 25 % 1 580 7 %
Other liabilities 309 1 % 5 620 25 %
Total liabilities and equity capital 21 581 100 % 22 639 100 %
*) Balance according to IFRS, official accounts prepared according to NGAAP.

21
Storebrand Life Group
42
Storebrand Life Group - Result per line of business
Full year
NOK mill. 2008 2007 2007
Storebrand Livsforsikring AS 382 269 1 622
SPP Group 63
Other subsidiaries (inclusive Storebrand Helse) 4 3 13
Profit life group before amortisiation cost 448 272 1 635
Amortisation -122
Profit before tax life group 326 272 1 635
Q1

22
43
Storebrand Life GroupProfit and loss
Full year
NOK Million. 2008 2007 2007
Premiums written 8 986 5 434 16 578
Net transfers of premium reserve 2 193 384 1 056
Net income of financial investments 3 272 11 932
Net income of common portfolio -5 210
Net income of investment choise portfolio -4 362
Net income of company portfolio -11
Claims paid -4 713 -5 028 -15 357
Change in technical reserves 137 -1 944 -10 231
Operating expenses -737 -472 -1 815
Other income/costs 438 47 208
To/from market value adjustment reserve 3 619 -896 2 036
Profit to policyholders in excess of guaranteed intrest 0 -528 -2 784
Profit to owner 339 269 1 622
Q1
44
Storebrand Life GroupProfit analysis
Full year
NOK Million 2008 2007 2007
Interest result* -358 870 7 887
Administration result -84 -135 -669
Risk result 292 80 244
Other results 222 -11 -3 029
Profit before additional statutory allocations 72 803 4 432
Transferred from additional statutory allocations 376
Profit after additional statutory allocations 448 803 4 432
Profit to policyholders in excess of guaranteed intrest 0 -532 -2 797
Profit to owner before amortisation cost 448 272 1 635
Amortisation -122
Profit before tax 326 272 1 635
*) Figures from 2007 includes return on owners capital. Profit from subsidiaries are included
in Storebrand Livsforsikring AS in 2007 owing to the equity method
Q1

23
45
Storebrand Livsforsikring - per line of business 1Q 2008
Storebrand SPP Other Total
NOK Millon Livsforsikring ASGroup Group Group
Interest result -288 -70 -358
Administration result -101 17 -84
Risk result 221 71 292
Other results 93 45 83 222
Profit before additional statutory allocations -74 63 83 72
From additional statutory allocations 376 376
Profit after additional statutory allocations 302 63 83 448
Profit to policyholders in excess of guaranteed intrest 0 0
Result to owner before amortisation cost 302 63 83 448
Amortisation -122 -122
Result before tax 302 -59 83 326
46
Storebrand Life GroupSatisfactory solidity
� Capital ratio of 10.0 % and solcvency marign of 131 %
� Risk capital of NOK 8.1 billion, equivalent to 5.2 % of Norwegianinsurance fund excl. additional statutory reserves
� Solidity capital of NOK 40.4 billion, equivalent to 17.9 % of insurancefund excl. additional statutory reserves
The graph shows customers risk capital as % of customers fund for Storebrand Livsforsikring AS (Norwegian life company)
Solidity capital includes equity capital, subordinated loans, market value adjustment reserve, additional statutory reserves, conditional bonus, risk equalisation reserve, profit carried forward and reserves on bonds held to maturity
0,0 %
2,0 %
4,0 %
6,0 %
8,0 %
10,0 %
12,0 %
14,0 %
2005 2006 2007 Q1 2007 Q1 2008
Proft carried forward
Core capital Margin
Market value
adjustment reserves
Additional statutory
reserves

24
47
Storebrand Life GroupSolvency margin and capital adequancy
Solvency margin Solvency margin
NOK Million capital requirement Solvency margin
Storebrand Life Group 13 517 10 324 130,9 %
Storebrand Livsforsikring AS 21 906 6 785 322,9 %
SPP Group 5 638 3 439 163,9 %
NOK million Core Capital
Eligible
subordinatede
loan capital
Risk weighted
calculation
base
Core capital
ratio in % Capital ratio in %
Storebrand Livsforsikring Group 7 280 5 609 128 747 5,7 % 10,0 %
Storebrand Livsforsikring AS 15 727 7 399 100 749 15,6 % 23,0 %
48
Storebrand Life GroupBalance sheet
Share of Share of
total assets total assets
NOK Million. 31.03.08 31.03.08 31.12.07 31.12.07
Immaterial assets 9 685 3 % 9 611 3 %
Real estate 21 103 6 % 21 359 6 %
Long term shares and interests from group companies 126 0 % 146 0 %
Bonds held to maturity 40 154 12 % 40 380 12 %
Mortgage and other loans 3 028 1 % 2 703 1 %
Shares 55 064 16 % 73 488 22 %
Bonds 114 161 34 % 105 375 31 %
Short term debt instruments 3 373 1 % 2 102 1 %
Assets - Unit Link 36 872 11 % 39 083 12 %
Other financial assets*) 40 836 12 % 33 083 10 %
Real estate for own use 1 575 0 % 1 005 0 %
Other assets 14 691 4 % 6 347 2 %
Total assets 340 668 100 % 334 682 100 %
*) Other financial assets includes derivates, bank deposits and mutual investments

25
49
Storebrand Life GroupBalance sheet (continued)
Share of Share of
total assets total assets
NOK Million 31.03.08 31.03.08 31.12.07 31.12.07
Equity 15 578 5 % 15 748 5 %
Minority interests' share in equity 157 0 % 136 0 %
Subordinated loan capital 9 017 3 % 8 814 3 %
Market value adjustment reserve 0 0 % 3 854 1 %
Premium reserve for own account 216 649 64 % 213 866 64 %
Additional statutory allocations 5 294 2 % 5 757 2 %
Premium/pension adjustment fund 5 921 2 % 6 255 2 %
Claims reserve for own account 1 932 1 % 1 970 1 %
Other insurance reserves 10 152 3 % 13 909 4 %
Insurance fund reserves for own account 239 947 70 % 241 757 72 %
Security reserves 0 % 197 0 %
Insurance related reserves for own account 239 947 70 % 241 955 72 %
0 %
Insurance fund reserves-defined contribution and unit linked 37 387 11 % 39 208 12 %
Other debts *) 38 581 11 % 24 969 7 %
Total equity and liabilities 340 668 100 % 334 682 100 %
*) Other debts includes repo SPP, short positions and other current liabilities.
50
Storebrand Livsforsikring - Premium due
Full year
NOK Million 2008 2007 2007
Storebrand Livsforsikring AS 9 683 6 340 19 717
SPP Group 2 575
Storebrand Helse 58 47 199
Total 12 315 6 387 19 916
Q1

26
Storebrand Livsforsikring AS(Norwegian Activities)
52
Storebrand Livsforsikring AS
(Norwegian Activities)– Highlights as at 31.03.2008
� The new insurance act and regulations came into force on 1 january 2008.The new act entails considerable changes for life insurance companies.
� The interest result loss totalled NOK 288 million (NOK 870 million) for Q1.The net gains from securities amounted to NOK 265 million (NOK 254 million) for the quarter.
� The administration result loss totalled NOK 101 million (loss of NOK 135 million) for Q1.
� Total risk result was a profit of NOK 221 million (NOK 80 million) for Q1. The result was affected by the fact that NOK 65 million from the security fund was entered as income for sectors without a risk equalisation fund.
� Total profit allocated to the owner before tax amounted to NOK 299 million for Q1.

27
53
Storebrand Livsforsikring AS - Profit analysis
Full year
NOK Million 2008 2007 2007
Interest result -288 870 7 887
Administration result -101 -135 -669
Risk result 221 80 244
Other results 173 -14 -3 042
Profit before additional statutory allocations 6 801 4 420
From additional statutory allocations 376
Profit after additional statutory allocations 382 801 4 420
Profit to policyholders in excess of guaranteed intrest 0 -532 -2 797
Profit to owner exclusive subsidaries 382 269 1 622
Profit subsidaries Norwegian business 4 3 13
Frofit before tax Storebrand Livsforsikring Norwegian business 385 272 1 635
*) Figures from 2007 includes return on owners capital. Profit from subsidiaries are included
in Storebrand Livsforsikring AS in 2007 on the basis of the equity method
Q1
54
Storebrand Livsforsikring AS - Profit to owner
3851341462-31206Profit before taxes
582830Other results
33Result from subsidiaries
-16-16Allocations to equity
100100Profit for risk and interest rate guarantee
1838499Risk result
120103161Interest result
-63-38-327Administration result
NOK mill. TotalCorporate portfolio
Individual paid-up policies
Profit
sharing
Risk products
Defined contribution
and unit linked Fee based
Common portfolio
Fee based

28
55
Storebrand Livsforsikring AS - Insurance fund reserves
Full year
NOK Million 2008 2007 2007
Premium reserve, premium fund etc. for own account 164 369 149 766 159 222
Additional statutory allocations 5 355 5 550 5 757
Insurance fund reserves for own account 169 723 155 316 164 979
Security reserves 188 197
169 723 155 504 165 176
Q1
56
Storebrand Livsforsikring AS - Insurance fund reserves
Defined Individual
Common contribution Risk endowment,
NOK Million portfolio & Unit Linked products paid-up policies Total
Premium reserve, premium fund etc. for own account 71.379 10.909 2.126 79.954 164.368
Additional statutory allocations 2.384 61 2.910 5.355
Insurance fund for own account 73.763 10.970 2.126 82.864 169.723

29
57
Storebrand Livsforsikring AS - Asset allocation
Full year
NOK million 2008 2007 2007
Equity Norwegian *) 10 503 9 496 10 977
Equity Foreign *) 30 901 39 181 40 916
Real Estate 22 670 18 247 22 262
Money market 18 336 9 626 11 880
Bonds held to maturity 40 154 41 284 40 380
Bonds 47 305 44 110 45 906
Loans 3 028 2 671 2 703
Other fiancial assets 9 301 680 8 627
Assets in defined contribution and unit linked 10 838 7 777 8 929
Total 193 037 173 070 192 579
*)Incl. Investments in equity funds
Q1
58
Storebrand Livsforsikring AS - Norwegian business
*Gjennomsnitt for produkter i kollektivporteføljen. Investeringsvalgsporteføljen vurderes til markedsverdi.
NOK 10 bn
-
-
0.0%Value adjustedreturn (YTD)
-1.6%
Booked return(YTD)*
0.7%
Interest rate guarantee p.a.
3.5%
AuM NOK 157 bn
17 %
18 %
29 %
16 %
8 %4 %
8 %
Shares
Bonds
Hold to maturity
Real Estate
Alpha
Money market
Other
Common portfolio,paid up policies & individual
31 %
0 %
16 %
2 %
10 %
4 %
37 %
Company portfolio

30
59
Storebrand Livsforsikring AS - Norwegian business
*Gjennomsnitt for produkter i kollektivporteføljen. Investeringsvalgsporteføljen vurderes til markedsverdi.
NOK 79 bn
3,6%
0,8%
-1,9%Value adjustedreturn (YTD)
-1,4%
Booked return(YTD)*
0,6%*
Interest rate guarantee p.a.
3,4%
AuM NOK 78 bn
16 %
20 %
28 %
16 %
8 %4 %
8 %
Shares
Bonds
Hold to maturity
Real Estate
Alpha
Money market
Other
Common portfolio
31 %
0 %
16 %
2 %
10 %
4 %
37 %
Paid up policies & Individual
60
Storebrand Livsforsikring AS - Policyholders’ solidity capital
Full year
NOK Million 2008 2007 2007
Additional statutory allocations 5 355 5 550 5 757
Market value adjustment reserve - 6 786 3 854
Total 5 355 12 336 9 611
Q1

31
61
Storebrand Livsforsikring AS - Policyholders’ solidity capital
Individual
Group policies and
NOK million pension paid-up policies Total
Additional statutory allocations 2.453 2.902 5.355
Market value adjustment reserve - - -
Profit carried forward - - -
Total 2.453 2.902 5.355
62
Storebrand Livsforsikring AS - Unrealised gains
Q1 Change
NOK Million 2008 2007
Shares 718 -3 447
Fixed interest investments -1 173 -608
Market value adjustment/depreciation -456 -4 056
short terms investments
Market value adjustment
bonds held to maturity 211 171
Total -244 -3 884

32
63
NOK million
Booked return
(2.000)
(1.500)
(1.000)
(500)
-
500
1.000
1.500
2.000
-1 % 0 % 1 % 2 % 3 % 4 % 5 % 6 % 7 % 8 % 9 % 10 %
Re
su
lt t
o o
wn
er
Storebrand Livsforsikring AS - profitt sharing (finance result)
The graph gives an indication of the financial result to owner given different booked returns. In addition there will be results an administration result and a risk result.
64
Storebrand Livsforsikring AS -Premiums excl. reserves transferred tothe company
Full year
NOK million 2008 2007 2007
Group pension 3 734 3 011 8 376
Paid-up policies 47 53 110
Group pension defined contribution 508 389 1 636
Individual endowment an pension 875 1 109 4 732
Individual Unit linked 492 196 489
Risk products without profit charing 755 678 1 234
6 412 5 434 16 578
Q1

33
65
Storebrand Livsforsikring AS -Net transfers of premium reserves in NOK million
Full year
NOK Million 2008 2007 2007
Premium reserves recieved
Group pensions 3 205 850 2 870
Individual life insurance 49 22 215
Unit Linked 41 73 195
Total 3 294 945 3 279
Premium reserves transferred
Group pensions -1 045 -480 -1 987
Individual life insurance -22 -60 -138
Unit Linked -34 -21 -99
Total -1 101 -561 -2 223
Net transfers Storebrand Livsforsikring AS 2 193 384 1 056
Q1
66
Storebrand Livsforsikring AS -Net transfers of premium reserves in NOK million
2 193
1 056
5 260
564
1 493
2003 2005 2006 2007 1Q08

34
67
Storebrand Livsforsikring AS - new premiums APE
New premiums consist of new sales and increased sales on existing contracts with subtractions for contracts where premiums isn't paid. Moved reserves are included in the numbers.
The definition deviates from MCEV where the insurance policy must be registered in our production system before taken into consideration.
Full year
NOK mill 2008 2007 2007
Common portfolio, Individual, Paid up Policies 575 na 890
Defined Contribution and Unit Linked 151 na 248
Risk products 39 na 49
SUM 765 na 1.187
Q1
68
Storebrand Livsforsikring AS – new premiums yearly premium
Yearly premiums consist of new sales and increased sales on existing contracts with subtractions for contracts where premiums isn't paid. Moved reserves are included in the numbers.
The definition deviates from MCEV where the insurance policy must be registered in our production system before taken into consideration.
Full year
NOK mill 2008 2007 2007
Common portfolio, Individual, Paid up Policies 168 na 394
Defined Contribution and Unit Linked 115 na 197
Risk products 39 na 49
SUM 322 na 640
Q1

35
69
Storebrand Livsforsikring AS – new single premiums
Single premiums consist of new sales and increased sales on existing contracts, with subtractions for contracts where premiums isn't paid. Moved reserves are included in the numbers.
The definition deviates from MCEV where the insurance policy must be registered in our production system before taken into consideration.
Full year
NOK mill 2008 2007 2007
Common portfolio, Individual, Paid up Policies 4.078 na 4.958
Defined Contribution and Unit Linked 355 na 512
Risk products - na -
SUM 4.433 na 5.470
Q1
70
(Page intentionally left blank)
36
SPP(Swedish activities)
72
SPP including Euroben– Highlights as at 31.03.2008
� Good administration and risk results
� Difficult financial markets contributes to a negative financial result
� New Investment Strategy approved
� Sales up 50% from Q1 2007
� Premium income up 12% since Q1 2007

37
73
SPP including Euroben- Result
Full year
NOK million 2008 2007 2007
Adm. Result 17 26 101
Risk result 71 15 186
Financial result -69 -10 -372
Other 46 87 278Result SPP 64 118 192
Q1
74
SPP including Euroben- Result pr line of business
Guaranteed Unit Euroben Company Sum
NOK million products Linked portfolio'
Adm. Resultat 0 10 -1 7 17
Risk result 73 0 -3 0 71
Financial result -70 0 1 0 -69
Other 0 0 0 46 46
Result SPP 3 11 -3 53 64
* Selskapsporteføljen includes results from SPP Liv Pensjonstjänst AB, SPP Konsult AB, SPP Kundcenter AB, SPP Fonder AB og SPP Varumärkes AB
38
75
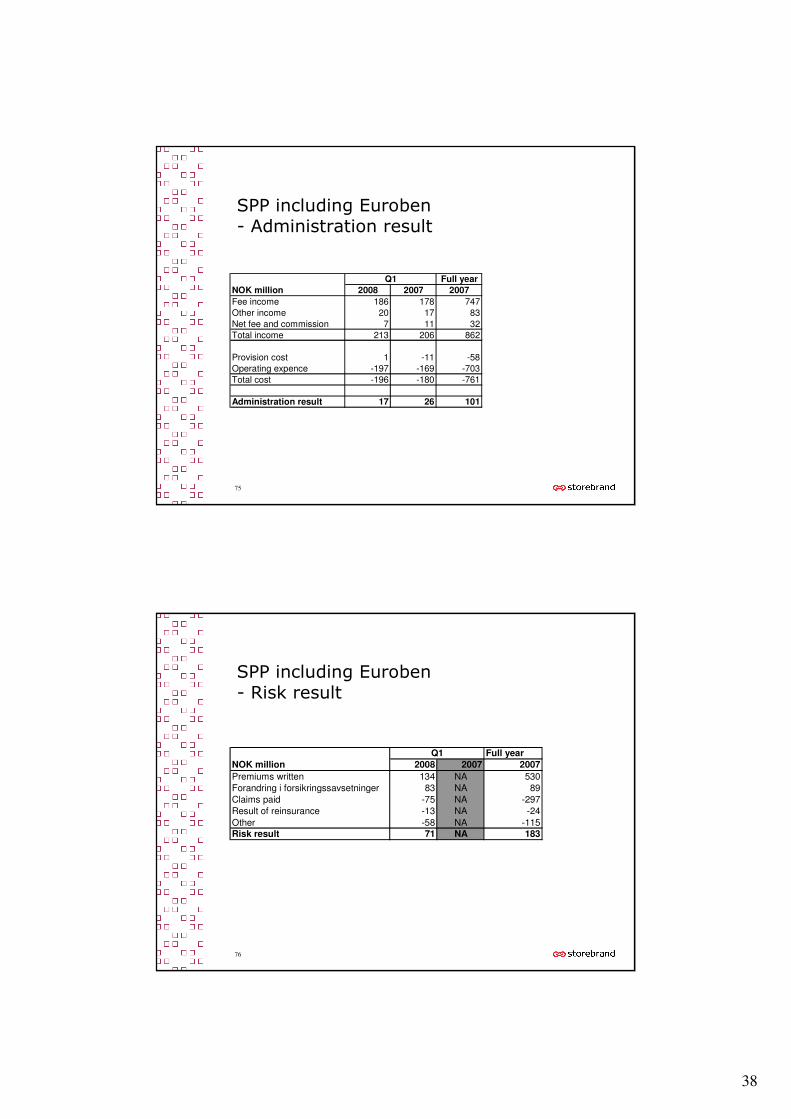
SPP including Euroben- Administration result
Full year
NOK million 2008 2007 2007
Fee income 186 178 747
Other income 20 17 83
Net fee and commission 7 11 32
Total income 213 206 862
Provision cost 1 -11 -58
Operating expence -197 -169 -703
Total cost -196 -180 -761
Administration result 17 26 101
Q1
76
SPP including Euroben- Risk result
Full year
NOK million 2008 2007 2007
Premiums written 134 NA 530
Forandring i forsikringssavsetninger 83 NA 89
Claims paid -75 NA -297
Result of reinsurance -13 NA -24
Other -58 NA -115Risk result 71 NA 183
Q1
39
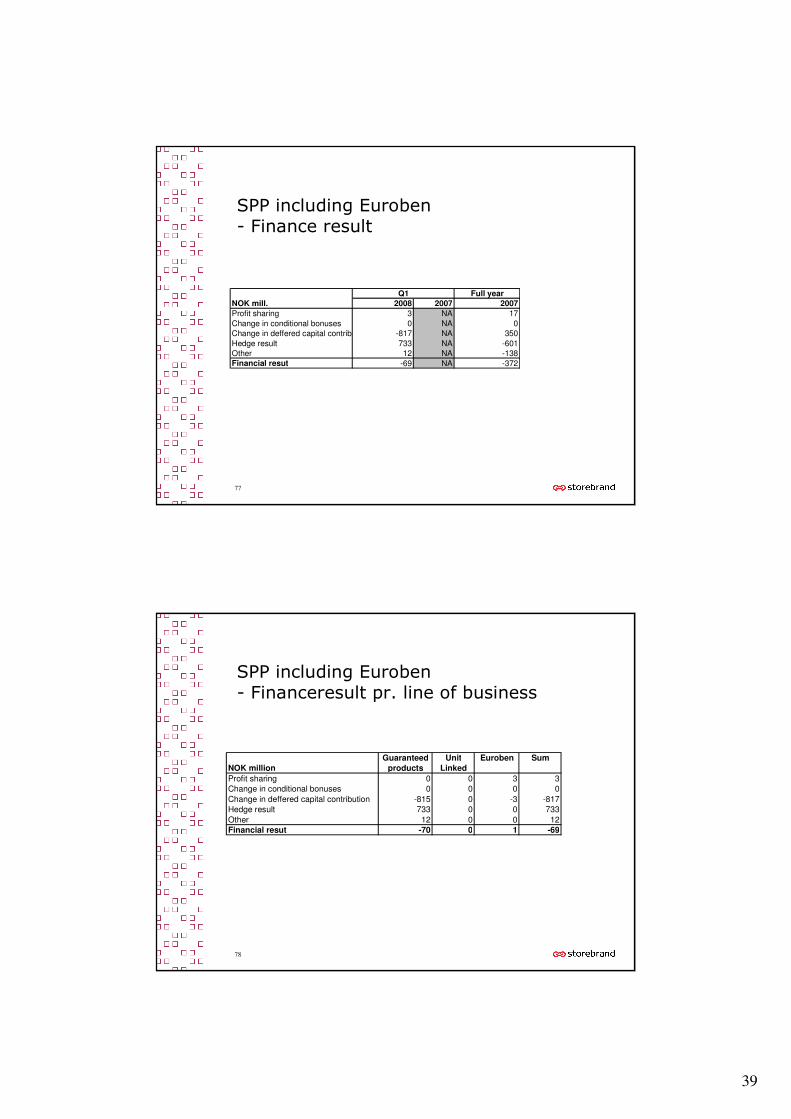
77
SPP including Euroben- Finance result
Full year
NOK mill. 2008 2007 2007
Profit sharing 3 NA 17
Change in conditional bonuses 0 NA 0
Change in deffered capital contribution -817 NA 350
Hedge result 733 NA -601
Other 12 NA -138
Financial resut -69 NA -372
Q1
78
SPP including Euroben- Financeresult pr. line of business
Guaranteed Unit Euroben Sum
NOK million products Linked
Profit sharing 0 0 3 3
Change in conditional bonuses 0 0 0 0
Change in deffered capital contribution -815 0 -3 -817
Hedge result 733 0 0 733
Other 12 0 0 12
Financial resut -70 0 1 -69

40
79
SPP including Euroben- Other income
Full year
NOK million 2008 2007 2007
Return on company portfolio 69 105 357
Interest cost subordinated debt -23 -18 -79Other result 46 87 278
Q1
80
SPP including Euroben- Claims reserves
Full year
NOK million 2008 2007 2007
Claims reserves 89.961 84.359 91.750
Conditional bonuses 8.191 11.952 11.909
Deffered capital contribution 1.961 1.489 2.065
Other 1.479 1.509 1.544
Total claims reserves 101.592 99.308 107.268
Q1

41
81
SPP including Euroben- Claims reserves pr line of business
Guaranteed Unit Euroben Sum
NOK million products Linked
Claims reserves 60.857 23.298 5.806 89.961
Conditional bonuses 6.192 0 1.999 8.191
Deffered capital contribution 1.956 0 5 1.961
Other 1.422 0 57 1.479
Total claims reserves 70.427 23.298 7.867 101.592
82
SPP including Euroben- Company portfolio
NOK million SPP* Euroben SPP* Euroben
Equity 4.909 508 5.351 503
Subordinated debt 1.371 0 1.371 0
Other 0 0 0 0
Sum 6.280 508 6.722 503
*Excluding Euroben
Q1 2008 Full year 2007

42
83
SPP including Euroben- asses allocation pr line of business
Guaranteed Unit Euroben Sum
NOK million products Linked
Swedish Equity 7.367 0 747 8.114
International Equity 13.585 0 964 14.549
Nominall Bonds 37.452 0 6.647 44.099
Real interest Bonds 6.041 0 0 6.041
Real estate 359 0 0 359
Other 1.772 23.298 0 25.070
Total 66.576 23.298 8.358 98.232
84
3 %1 %32 %
64 %
Bonds and moneymarket instruments
Shares
Real Estate
Other
SPP including Euroben– allocation guaranteed portfolios
80 %
20 %
0 % 0 %
Common portfolio
NOK 2,0 bn
NOK 8,0 bn
NA
NA
NOK 69,1 bnAuM
Value adjustedreturn (YTD)
- 3,9%
Interest rate guarantee p.a.
2,5% - 5,2%
Aditional statutoryresults
NOK 8,1 bn
Euroben

43
85
SPP Group- Balance sheet
Share of
total assets
NOK millions 31.03.08 31.03.08
Intangible assets 9.668 7,0%
Longterm shares an interest from group companies 136 0,1%
Shares 7.299 5,3%
Bonds 62.455 45,0%
Assets - Unit link 23.298 16,8%
Other financial assets 30.712 22,1%
Other assets 523 0,4%
Discontinued operations 4.792 3,5%
Total assets 138.883 100,0%
86
SPP Group- Balance sheet
Share of
total assets
NOK mill 31.03.08 31.03.08
Equity 6.609 4,8%
Minority interests' share in equity 0 0,0%
Subordinated loan capital 8.542 6,2%
Premium reserve for own account 68.142 49,1%
Insurance fund reserves-defined contribution and UL 33.450 24,1%
Other assets 17.349 12,5%
Discontinued operations 4.792 3,5%
Total equity and liabilities 138.883 100,0%

44
87
SPP including Euroben- profit sharing in guaranteed business
The graph shows an expected financial result to owner, given different yields. The graph does not take into account other results elements as administration result, risk result and other. From 2009 there will also be a result from asset management.
Assumptions: Consolidation as of the beginning of the year, all portfolios above 105%. Inflation 2%.
0
200
400
600
800
1.000
2,4 3,4 4,4 5,4 6,4 7,4 8,4 9,4
Return %
MS
EK
88
SPP including Euroben- Premium income
Full year
NOK million 2008 2007 2007
Guaranteed products 996 1.021 3.654
Unit Link 652 617 2.727
Euroben 221 20 955
Total 1.869 1.657 7.336
Q1

45
89
SPP including Euroben- New subscription APE
Full year
NOK million 2008 2007 2007
Guaranteed products 94 90 278
Unit Link 134 86 295
Euroben 36 2 214
Total 265 178 786
Q1
New premiums consist of new sales and increased sales on existing contracts with subtractions for contracts where premiums isn't paid. Moved reserves are included in the numbers.
The definition deviates from MCEV where the insurance policy must be registered in our production system before taken into consideration.
90
SPP including Euroben– New subscription – yearly premium
Full year
NOK million 2008 2007 2007
Guaranteed products 722 675 2.473
Unit Link 620 586 2.591
Euroben 62 3 131
Total 1.404 1.265 5.195
Q1
Yearly premiums consist of new sales and increased sales on existing contracts with subtractions for contracts where premiums isn't paid. Moved reserves are included in the numbers.
The definition deviates from MCEV where the insurance policy must be registered in our production system before taken into consideration.

46
91
SPP including Euroben- New subscription – single premiums
Full year
NOK million 2008 2007 2007
Guaranteed products 273 345 1.181
Unit Link 33 31 136
Euroben 159 16 824
Total 465 392 2.141
Q1
Single premiums consist of new sales and increased sales on existing contracts, with subtractions for contracts where premiums isn't paid. Moved reserves are included in the numbers.
The definition deviates from MCEV where the insurance policy must be registered in our production system before taken into consideration.
92
(Page intentionally left blank)

47
Storebrand Investments
94
Storebrand InvestmentsHighlights Q1
� Profit before tax NOK 48 million compared to NOK 31 million 1 th quarter last year.
� Strong operating profit margin, due to good cost control.
� Reduction in assets under management in mutual fund due to distress in the financial markets results in reduced volume related revenues.
� Poor investment results for the Storebrand Life portfolio in 1 th quarter 2008.
� NOK 230 billion in assets under management as of Q1
� 55% of Storebrand’s mutual funds (and 57% of equity funds) have outperformed index (measured before management fees).

48
95
Profit before tax Q1 2008
� The decline in total income can be ascribed to a reduction in volume related income.
� Performance related income is stable.
� Good cost control combined with lower performance and volume related expenses results in lower costs compared to 2007.
� Net financial income is driven by good results in Storebrand
Eiendom.
01.01-31.12
NOK million 2008 2007 2007
Total income 85 90 331
Total costs -59 -65 -258
Net financial income/ other 21 6 66
Profit before tax 48 31 138
Q1
96
Profit development
2008
NOK million Q1 Q4 Q3 Q2 Q1 Q4 Q3 Q2
Total income 85 84 49 109 90 153 98 73
Total costs -59 -71 -51 -72 -65 -95 -67 -59Net financial income/other 21 24 8 27 6 8 7 19
Profit before tax 48 37 5 64 31 67 38 32
2007 2006

49
97
Profit development
Rolling 12 months income1), left axis
Rolling 12 months costs, left axis
Quarterly profit before tax
� Cost/income ratio 62 percent1
as of Q1 (65 percent1 as of Q4,
63% as of Q1 2007).
� The increase in income is
related to good results in
Storebrand Eiendom and stable
revenue from Storebrand
Investments.
� Good cost control combined
with lower volume related
expenses leads to lower costs.
NOK million
2)1) Includes net financial income and profit before tax
from Storebrand Alternative Investments (SAI) and Storebrand Eiendom. 12 months rolling
2) Total costs / profit adjusted for non-recurring costs of NOK 8.8 million in 2003
407
253
5
64
31
67
38
3220
4
-2
148
37
34
Q1-
05
Q2-
05
Q3-
05
Q4-
05
Q1-
06
Q2-
06
Q3-
06
Q4-
06
Q1-
07
Q2-
07
Q3-
07
Q4-
07
Q1-
08
220
240
260
280
300
320
340
360
380
400
420
440
460
480
500
98
0,0 %
20,0 %
40,0 %
60,0 %
80,0 %
100,0 %
120,0 %
Q1 2003 Q1 2004 Q1 2005 Q1 2006 Q1 2007 Q1 2008
Cost/income
Strong development in operating profit in
Storebrand Investments
� 50 percent in target cost/income ratio for Storebrand Investments by the end of 2009.
Income1 = Income ex performance fee and SAI (12 month rolling)
Cost = Total costs ex performance related pay (12 month rolling)

50
99
Contribution to Storebrand Life portfolio year to date
* Return in international equity portfolios are measured against fx-unhedged index in NOK
** Shares in hedge funds
The slide only shows contribution from internally managed portfolios
Portfolio
Index
Relative performance
SB Selecta
SB Multi Strategy
BelAir Sustain
AGFIX**
Aker Asset MGT
Bonds Foreign
Active Credit**
Money Market Foreign Credit
Money Market OECD
Bonds Norway
Money Market Norway
Tactical Allocation**
Equity Finance L/S**
Equity Energy L/S**
Equity Technology L/S**
Equity Europe L/S**
Equity Global Qvant
Equity Norway
2,7 %
4,7 %
0,8 %
2,0 %
1,5 %
0,3 %
-9,1 %
-3,2 %
-2,5 %
-0,6 %
-0,4 %
0,2 %
0,2 %
-5,4 %
-11,1 %
-0,2 %
-2,7 %
0,6 %
0,0 %
0,9 %
0,9 %
0,9 %
1,3 %
3,3 %
1,0 %
-1,3 %
1,3 %
2,0 %
1,3 %
0,3 %
0,3 %
0,9 %
0,9 %
1,0 %
-14,9 %
-15,8 %
1,5 %
1,7 %
-3,8 %
-1,8 %
3,6 %
-8,1 %
-4,5 %
-1,2 %
1,4 %
0,9 %
0,5 %
0,4 %
-4,5 %
-10,1 %
0,9 %
-17,6 %
-15,2 %
3,2 %
100
� 55% (30 out of 551) of Storebrand's mutual funds have outperformed index (measured before management fees).
� According to Standard & Poors rating2 42 percent of Storebrand’s funds are among the top 30 percent and 68 percent among the top 50 percent.
Storebrand’s mutual fundsPerformance / Rating
1 Excluding feeder funds and index funds. Storebrand Investments manages 62 mutual funds
2 Norwegian registered mutual funds as of 16. April 2008
Stars S&P # Fund Percent # Fund Percent # Fund Percent # Fund Percent # Fund Percent
5 10 % 7 18 % 4 5 % 2 7 % 2 12 % 4 67 %
4 20 % 9 24 % 24 33 % 9 31 % 6 35 % 2 33 %
3 20 % 10 26 % 30 41 % 12 41 % 2 12 % 0 0 %
2 25 % 8 21 % 13 18 % 4 14 % 5 29 % 0 0 %
1 25 % 4 11 % 2 3 % 2 7 % 2 12 % 0 0 %
# of funds 38 73 29 17 6
Average scoreAverage scoreAverage scoreAverage score 3,23,23,23,2 3,23,23,23,2 3,23,23,23,2 3,23,23,23,2 3,13,13,13,1 4,74,74,74,7
Morningstar's rating - all mutual fundsMorningstar's rating - all mutual fundsMorningstar's rating - all mutual fundsMorningstar's rating - all mutual funds
StorebrandStorebrandStorebrandStorebrand DnB NOR Nordea Odin Skagen

51
101
23,8 22,5 23,0 25,5
11,2 11,0 10,410,0 8,8
16,5 18,0 19,119,5 19,3
12,8 12,9 11,6 9,2
7,2 6,8 6,9 6,57,4
25,3
8,4
Q1 07 Q2 07 Q3 07 Q4 07 Q1 08
16,8 16,0 15,9 15,6 15,2
10,7 10,1 9,4 9,7 8,0
22,4 23,9 26,52 28,2 29,6
19,5 19,3 17,7 14,9
4,6 4,63 4,59 4,7 4,7
14,7
Q1 07 Q2 07 Q3 07 Q4 07 Q1 08
Market share Norwegian registered mutual funds
All mutual funds (market share in %)
Equity/life cycle funds (market share in %)
Nordea
Odin
Storebrand
DnB NOR
Nordea
Odin
Storebrand
DnB NOR
Skagen
Skagen
Equity funds market in Norway
� Norwegian equity funds exceed
NOK 203 billion in assets under
management.
� The overall market consist of NOK
82 billion from Norwegian retail
customers, 85 billion from
institutional investors and 36
billion from foreign investors.
� Storebrand has a 8% market
share in the retail market, 11%
market share in the institutional
market and 1% amongst foreign
investors.
� There seems to be a trend in the
market where the historical main
suppliers of mutual funds, is
dropping market shares to smaller
providers
102
Sales developmentNet sales of NOK 0,05 billion in Q1 2008 compared to NOK 2,8 billion in Q1 2007 1
Excluding group assets1
Storebrand (funds and discretionary)
� Negative trend in net sales due to the distress in international finance market in Q1 2008.
� Net subscriptions of high margin products at NOK 0,02 billion and net subscriptions of NOK
0,4 billion in Unit Linked funds.
� Storebrand's market share of subscriptions in the mutual fund market is 9,1 percent year to
date, and 16,4 percent of the redemptions.
� Total net subscriptions of NOK 1,2 billion in the discretionary portfolio.
Nett subscriptions in Norw egian registered equityfunds
-10
0
10
20
30
40
Q1
03
Q2
03
Q3
03
Q4
03
Q1
04
Q2
04
Q3
04
Q4
04
Q1
05
Q2
05
Q3
05
Q4
05
Q1
06
Q2
06
Q3
06
Q4
06
Q1
07
Q2
07
Q3
07
Q4
07
Q1
08
NOK billion
-10,0
0,0
10,0
20,0
30,0
40,0
Quarterly (rigth axis) 12 month rolling (left axis)

52
103
Storebrand InvestmentsAssets under management
Total assets under management
NOK billion
126,6140,6 142,1 144,1 143,6
12,9
14,6 20,0 25,6 26,79,7
29,430,3
28,0 32,2
15,8
20,324,6
29,7 27,1
2004 2005 2006 2007 Q1-2008
Group internal Real estate (group internal)
External discretionary Mutual funds
165
205
217227 230
� 3 billion increase in assets under management in Q1 2008
� Assets under management in the in the discretionary portfolio has increased 4 billion year to date.
� Assets under management in mutual funds has decreased 2,6 billion in Q1 2008
104
(Page intentionally left blank)

53
Storebrand Bank
106
Storebrand Bank Group Highlights Q1 2008
� Storebrand Bank achieved a group profit before tax of NOK 44 million for Q1.
� Positive development in net interest income with growth of 36 per cent since Q1 2007.
� The continuing growth in customer numbers, re-pricing of the lending portfolio and the improved deposit-to-loan ratio all made positive contributions to the financial performance.
� Storebrand Kredittforetak AS carried out its first issue of bonds with pre-emptive rights. Lending totalled NOK 6.4 billion at the end of Q1.
� The lending programme established by Storebrand Kredittforetak AS received on Aaa-rating from Moody’s.
� Net write-back of loan losses amounting NOK 1 million in Q1.
� Storebrand Bank has completed the acquisitions of Trajan and 12 companies in the Ring Eiendomsmegling chain.
Note: Storebrand Bank Group
Q1 Full year
Key Figures 2008 2007 2007
Gross lending (NOK million) 37 816 32 661 37 096
Customer deposits (NOK million) 18 974 14 555 17 470
Net int. income / avg. total assets 1,19 % 1,08 % 1,07 %
Cost / Income 73,6 % 70,1 % 69,7 %

54
107
Profit and loss
Note: Storebrand Bank Group
1) In the consolidated accounts for Storebrand Bank Group amortisation is included in operating expenses.
Full Year
NOK million 2008 2007 2007
Net interest income 126 93 413
Net fee and commission income 18 11 58
Other operating income 17 12 46
Total income 160 115 517
Operating expenses -111 -81 -360
Operating profit before losses 50 35 157
Loan loss provisions 1 45 78
Profit before amortisation 51 79 235
Amortisation of intangible assets 1) -7
Profit before tax 44 79 235
Q1
108
Quarterly development in profit and loss
Note: Storebrand Bank Group
1) In the consolidated accounts for Storebrand Bank Group amortisation is included in operating expenses.
2008 2007 2006
NOK million Q1 Q4 Q3 Q2 Q1 Q4 Q3 Q2
Net interest income 126 111 108 102 93 101 109 102
Net fee and commission income 18 15 15 17 11 11 12 5
Other operating income 17 17 3 14 12 13 8 8
Total income 160 143 126 133 115 126 129 116
Operating expenses -111 -114 -83 -83 -81 -96 -93 -72
Operating profit before losses 50 29 43 51 35 30 36 44
Loan loss provisions 1 18 11 4 45 6 11 15
Profit before amortisation 51 47 54 55 79 36 47 59
Amortisation of intangible assets 1) -7
Profit before tax 44 47 54 55 79 36 47 59

55
109
Balance sheet
Note: Storebrand Bank Group
Nok million 31.03.08
Share
31.03.08 31.12.07
Share
31.12.07
Cash and deposits with central banks 529 1,2 % 1 062 2,5 %
Loans to and deposits with credit institutions 657 1,5 % 374 0,9 %
Financial assets designated at fair value through p&l 3 058 7,2 % 3 022 7,2 %
Net lending to customers 37 520 88,3 % 36 791 87,8 %
Deferred taxs assets 173 0,4 % 174 0,4 %
Other assets 548 1,3 % 465 1,1 %
Total Assets 42 485 100,0 % 41 887 100,0 %
Liabilities to credit institutions 2 610 6,1 % 3 065 7,3 %
Deposits from and due to customers 18 974 44,7 % 17 470 41,7 %
Other financial liabilities 17 979 42,3 % 18 216 43,5 %
Provision for accrued expenses and liabilities 89 0,2 % 83 0,2 %
Subordinated loan capital 959 2,3 % 1 014 2,4 %
Equity 1 874 4,4 % 2 040 4,9 %
Total Equity and liabilities 42 485 100,0 % 41 887 100,0 %
110
Residential
mortgages
Other retail
Real estate
Other corporate
Development in loan portfolio
Growth in lending – 12 months rolling
Note: Storebrand Bank GroupFigures for Q4 2007 shown in brackets
Gross lending by sector
Total loans inclusive corporate loans administered by Storebrand Bank on behalf of Storebrand Life is NOK 40,8 bn
NOK bn
29 %(29 %)
2 %(2 %)
64 %(64 %)
5 %(5 %)0
1
2
3
4
5
6
7
8
Q1 06 Q2 06 Q3 06 Q4 06 Q1 07 Q2 07 Q3 07 Q4 07 Q1 08

56
111
Development in customer deposits
� Customer deposits have been increased by NOK 1,5 bn in Q1
� Deposits / gross lending was 50% at the end of Q1
NOK mill.
Note: Storebrand Bank Group
0
2
4
6
8
10
12
14
16
18
20
Q1 06Q2 06Q3 06Q4 06Q1 07Q2 07Q3 07Q4 07Q1 08
40 %
42 %
44 %
46 %
48 %
50 %
52 %
Customer deposits Deposits/gross lending
112
Development in non-performing loans
� Non-performing loans without evidence of impairment has increased with 73 million in Q1
� Non-performing loans without evidence of impairment in the retail portfolio has been reduced by 4 million
� Loans with evidence of impairment has been reduced by 9 million in Q1
NOK million
589502
448 424 415352
311 297 288
92
128143
109181
215
81 151225
0
100
200
300
400
500
600
700
800
Q1 06 Q3 06 Q1 07 Q3 07 Q1 08
0 %
10 %
20 %
30 %
40 %
50 %
60 %
70 %
80 %
90 %
Non-performing loans without evidence of
impairmentNon-performing loans with evidence of
impairmentLoss provisions/defaulted loans
Note: Storebrand Bank Group*): Loss provisions to defaulted loans is calculated as individual impairment loss provisions / gross defaulted loans with identified loss of value. Amortised cost is the present value of the cash flow of the portfolio of NPLs. Depreciation is the expected loss.

57
113
Capital adequacy
Note: Storebrand Bank Group
Requirement
for capital
base
Net primary
capital Capital ratio
(NOK million) (NOK million) 31.03.2008 31.12.2007
1 868 2 651 11.4% 10.5%
114
Retail Customers
40.000
45.000
50.000
55.000
60.000
65.000
70.000
75.000
'Jan
-04
'Apr-
04
'Jul
-04
Oct
-04
'Jan
-05
'Apr-
05
'Jul
-05
Oct
-05
'Jan
-06
'Apr-
06
'Jul
-06
Oct
-06
'Jan
-07
'Apr-
07
'Jul
-07
'Oct
-07
'Jan
-08
stk
Retail customers

58
115
Balance sheetStorebrand Kredittforetak AS
The first issue of bonds under the covered bond programme was carried out in April, with payment due in May. The covered bond programme is Aaa rated.
NOK million 31.03.2008 31.12.2007
Loans to and deposits with credit institutions 80.6
Financial assets designated at fair value through profit and loss 165.1
Net lending to customers 6 443.2
Other assets 47.4Total assets 6 655.7 80.6
Liabilities to credit institutions 6 339.5
Other liabilities 12.8 0.5
Equity 303.3 80.1Total liabilities and equity 6 655.7 80.6
116
(Page intentionally left blank)

59
Storebrand Non-life
118
Non-Life Highlights Q1 2008
� Storebrand Non-Life reports an operating loss of NOK 6 million in Q1 (loss of NOK 14 million)
� Operating profit in SB Skadeforsikring AS was NOK 4 million (loss of NOK 13 million). Q1 earnings were positively affected by a dividend from Oslo Re of NOK 20 million
� Storebrand P&C insurance had a total of 19 253 customers as of March 31st. This represents an increase of 3 315 customers in Q1
� E-sales accounted for 57 percent of total sales in Q1
Numbers in brackets as of 31.03.2007

60
119
Non-Life Group
Profit and loss
Full year
NOK million 2008 2007 2007
Storebrand Skadeforsikring AS 4 -13 -34
Oslo Reinsurance Company ASA (run-off) 10 -1 17
Eliminations -20 0 0
Operating result non life insurance -6 -14 -18
Change in insurance funds -2 0 10
Pre tax result non life business -8 -14 -8
Q1
120
Non-life GroupBalance sheet
Share Share
NOK million 31.03.08 31.03.08 31.12.07 31.12.07
Intangible assets 25 1 % 27 1 %
Shares 21 1 % 21 1 %
Bonds and other interest bearing financial assets 350 18 % 406 19 %
Reinsurance part of premium- and claims reserve 1,347 68 % 1,441 69 %
Other assets 233 12 % 201 10 %
Total assets 1,976 100 % 2,096 100 %
Equity 247 13 % 265 13 %
Premium and claims reserve 1,625 82 % 1,723 82 %
Security reserve 30 2 % 28 1 %
Other liablilities 74 4 % 80 4 %
Total equity and liabilities 1,976 100 % 2,096 100 %

61
121
Oslo Reinsurance Company Profit and loss
Full year
NOK million 2008 2007 2007
Premiums for own account 1 1 2
Claims for own account 13 -5 -4
Insurance related operating costs -8 -5 -21
Financial income 3 5 32
Other income/costs 1 2 7
Operating result 10 -1 17
Changes in security reserve etc. - - 8
Profit before taxes 10 -1 25
Q1
122
Oslo Reinsurance Company Balance sheet
Share Share
NOK million 31.03.08 31.03.08 31.12.07 31.12.07
Financial assets 230 52 % 288 56 %
Reinsurance part of premium- and claims reserve 85 19 % 93 18 %
Receivables 41 9 % 37 7 %
Other assets 90 20 % 98 19 %
Total assets 446 100 % 517 100 %
Equity 121 27 % 121 23 %
Premium and claims reserve 252 56 % 293 57 %
Security reserve 22 5 % 22 4 %
Other liablilities 52 12 % 81 16 %
Total equity and liabilities 446 100 % 517 100 %
Related Documents


