Analyst Presentation Full Year 2015 Results (Audited) Jakarta 24 February 2016

Welcome message from author
This document is posted to help you gain knowledge. Please leave a comment to let me know what you think about it! Share it to your friends and learn new things together.
Transcript

Analyst Presentation Full Year 2015 Results (Audited)
Jakarta
24 February 2016
2
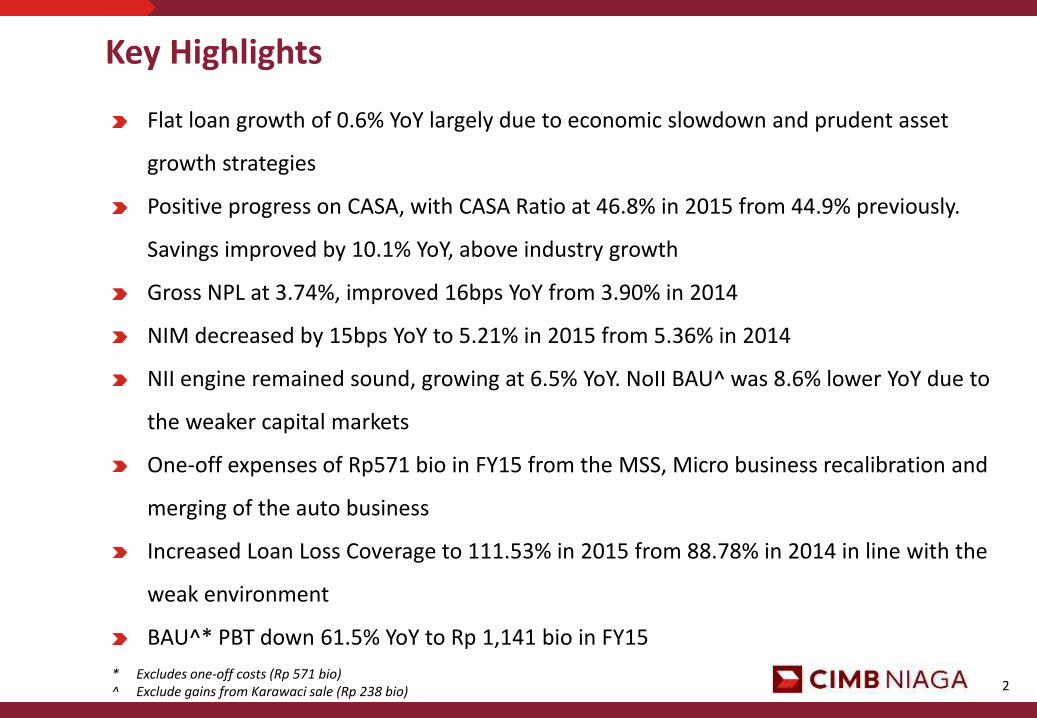
Key Highlights
Flat loan growth of 0.6% YoY largely due to economic slowdown and prudent asset
growth strategies
Positive progress on CASA, with CASA Ratio at 46.8% in 2015 from 44.9% previously.
Savings improved by 10.1% YoY, above industry growth
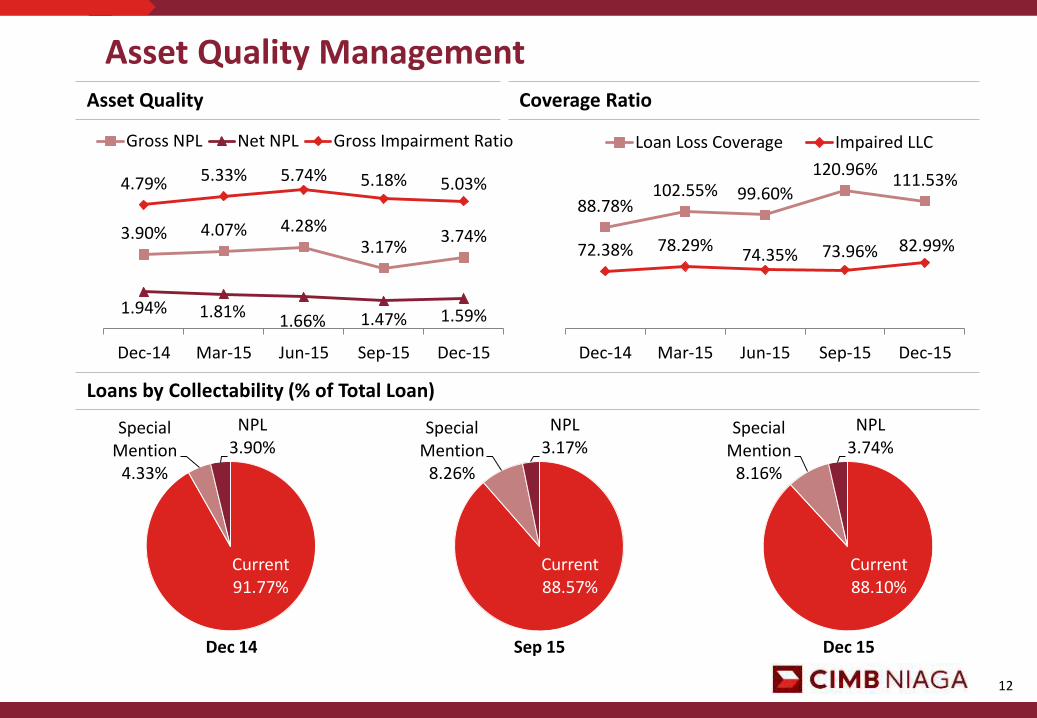
Gross NPL at 3.74%, improved 16bps YoY from 3.90% in 2014
NIM decreased by 15bps YoY to 5.21% in 2015 from 5.36% in 2014
NII engine remained sound, growing at 6.5% YoY. NoII BAU^ was 8.6% lower YoY due to
the weaker capital markets
One-off expenses of Rp571 bio in FY15 from the MSS, Micro business recalibration and
merging of the auto business
Increased Loan Loss Coverage to 111.53% in 2015 from 88.78% in 2014 in line with the
weak environment
BAU^* PBT down 61.5% YoY to Rp 1,141 bio in FY15
* Excludes one-off costs (Rp 571 bio) ^ Exclude gains from Karawaci sale (Rp 238 bio)
CIMB Niaga: FY 2015 Results Financial Results

4
(Rp bil) 3Q15 BAU*
4Q15 BAU*
QoQ FY14 BAU^
FY15 BAU*
YoY
Interest Income 5,696 5,604 -1.6% 20,813 22,319 7.2%
Interest Expense (2,718) (2,742) 0.9% (10,124) (10,933) 8.0%
Net Interest Income 2,978 2,862 -3.9% 10,689 11,386 6.5%
Non Interest Income 556 614 10.4% 2,571 2,350 -8.6%
Operating Income 3,534 3,476 -1.6% 13,260 13,736 3.6%
Operating Expenses (1,728) (1,794) 3.8% (6,832) (7,234) 5.9%
GA & Promotion Expenses (899) (1,003) 11.6% (3,714) (3,816) 2.7%
Personnel Expenses (829) (791) -4.6% (3,118) (3,418) 9.6%
Pre Provision Operating Profit 1,806 1,682 -6.9% 6,428 6,502 1.2%
Provision Expenses (1,191) (1,389) 16.6% (3,466) (5,361) 54.7%
PBT 615 293 -52.4% 2,962 1,141 -61.5%
Net Profit 442 238 -46.1% 2,105 856 -59.3%
EPS (Rp, full amount) 17.59 9.46 -46.2% 83.74 34.07 -59.3%
PBT (Actual) 144 193 34.0% 3,200 570 -82.2%
Net Profit (Actual) 89 163 83.1% 2,342 428 -81.7%
Income Statement - Consolidated
* Excludes one-off costs (Rp 571 bio) ^ Exclude gains from Karawaci sale (Rp 238 bio)

5
Financial Position - Consolidated
(Rp tril) Dec-14 Sep-15 Dec-15 QoQ YoY
Cash & Short Term Funds 25.68 27.65 27.09 -2.0% 5.5%
Govt Bonds & Marketable Securities 22.35 26.67 25.91 -2.8% 15.9%
Loans 176.38 178.89 177.36 -0.9% 0.6%
Loan Provision (6.11) (6.85) (7.40) 8.0% 21.1%
Fixed & Other Assets 14.86 17.93 15.89 -11.4% 6.9%
Total Assets 233.16 244.29 238.85 -2.2% 2.4%
Current Account 39.22 45.19 40.44 -10.5% 3.1%
Saving Account 39.17 43.31 43.12 -0.4% 10.1%
Time Deposit & Structured Deposit 96.33 97.22 94.97 -2.3% -1.4%
Total Customer Deposits 174.72 185.72 178.53 -3.9% 2.2%
Other Liabilities 29.99 30.33 31.64 4.3% 5.5%
Total Liabilities 204.71 216.05 210.17 -2.7% 2.7%
Equity 28.45 28.24 28.68 1.6% 0.8%

6
(%) 3Q15 BAU*
4Q15 BAU*
QoQ FY14 BAU^
FY15 BAU*
YoY
ROA 1.01 0.49 1.33 0.47
ROE (shareholders’ fund) 6.19 3.34 7.66 2.99
NIM 5.40 5.25 5.36 5.21
Fee Income / Total Income 15.73 17.66 19.38 17.11
Cost to Income (CIR) 48.88 51.63 51.52 52.67
CASA Ratio 47.66 46.81 44.87 46.81
Loan to Deposit (LDR) 94.93 97.98 99.46 97.98
LDR (Bank Only) 92.04 94.87 95.62 94.87
Gross NPL 3.17 3.74 3.90 3.74
Net NPL 1.47 1.59 1.94 1.59
Cost of Credit 2.67 3.17 2.12 3.02
Impairment – Gross 5.18 5.03 4.79 5.03
Loan Loss Coverage 120.96 111.53 88.78 111.53
Impaired LLC 73.96 82.99 72.38 82.99
Key Ratios - Consolidated
* Excludes one-off costs (Rp 571 bio) ^ Exclude gains from Karawaci sale (Rp 238 bio)
7
(Rp bil)
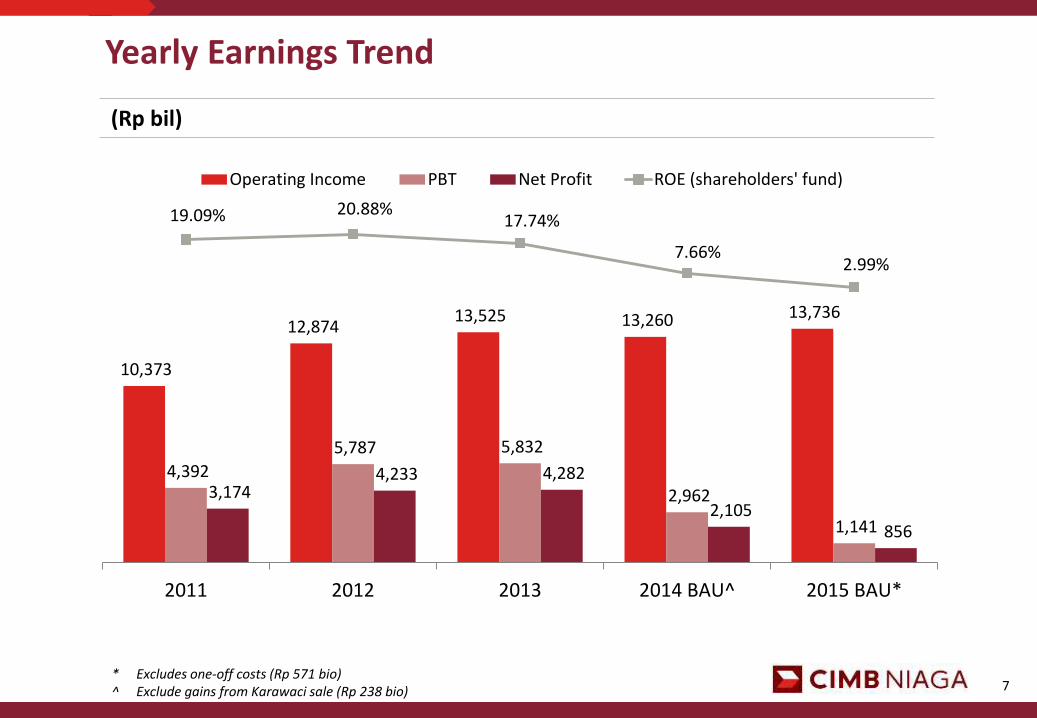
Yearly Earnings Trend
10,373
12,874 13,525 13,260 13,736
4,392
5,787 5,832
2,962
1,141
3,174 4,233 4,282
2,105 856
19.09% 20.88% 17.74%
7.66% 2.99%
2011 2012 2013 2014 BAU^ 2015 BAU*
Operating Income PBT Net Profit ROE (shareholders' fund)
* Excludes one-off costs (Rp 571 bio) ^ Exclude gains from Karawaci sale (Rp 238 bio)

8
Net Interest Margin (%, YTD Annualized)
Net Interest Income Breakdown (incl. FTP)
5.36% 5.22%
5.08% 5.19% 5.21%
Dec-14 Mar-15 Jun-15 Sep-15 Dec-15
Net Interest Income
FY14: Rp 10,689 billion
FY15: Rp 11,386 billion
Quarterly Annualized NIM
4Q14 1Q15 2Q15 3Q15 4Q15
5.63% 5.22% 4.94% 5.40% 5.25%
NIMs Steady
Retail 36%
Commercial 10%
MSME 18%
Corporate 16%
Treasury 20%
9
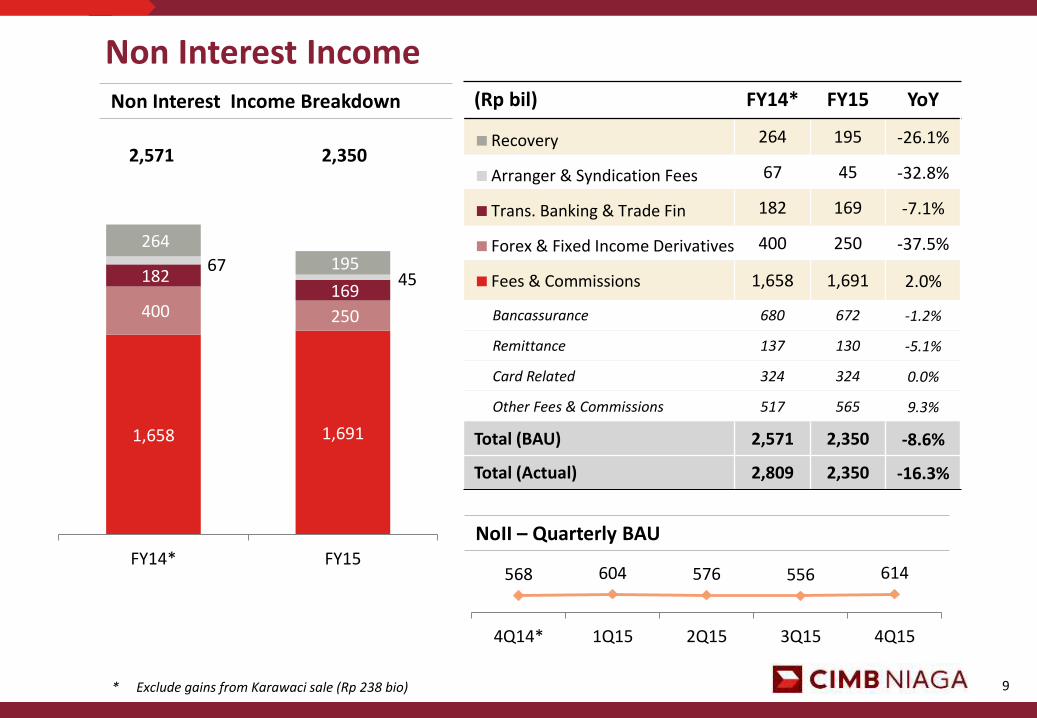
(Rp bil) FY14* FY15 YoY
264 195 -26.1%
67 45 -32.8%
182 169 -7.1%
400 250 -37.5%
1,658 1,691 2.0%
Bancassurance 680 672 -1.2%
Remittance 137 130 -5.1%
Card Related 324 324 0.0%
Other Fees & Commissions 517 565 9.3%
Total (BAU) 2,571 2,350 -8.6%
Total (Actual) 2,809 2,350 -16.3%
NoII – Quarterly BAU
568 604 576 556 614
4Q14* 1Q15 2Q15 3Q15 4Q15
1,658 1,691
400 250
182 169
67 45
264 195
FY14* FY15
Recovery
Arranger & Syndication Fees
Trans. Banking & Trade Fin
Forex & Fixed Income Derivatives
Fees & Commissions
Non Interest Income Non Interest Income Breakdown
2,350 2,571
* Exclude gains from Karawaci sale (Rp 238 bio)
10
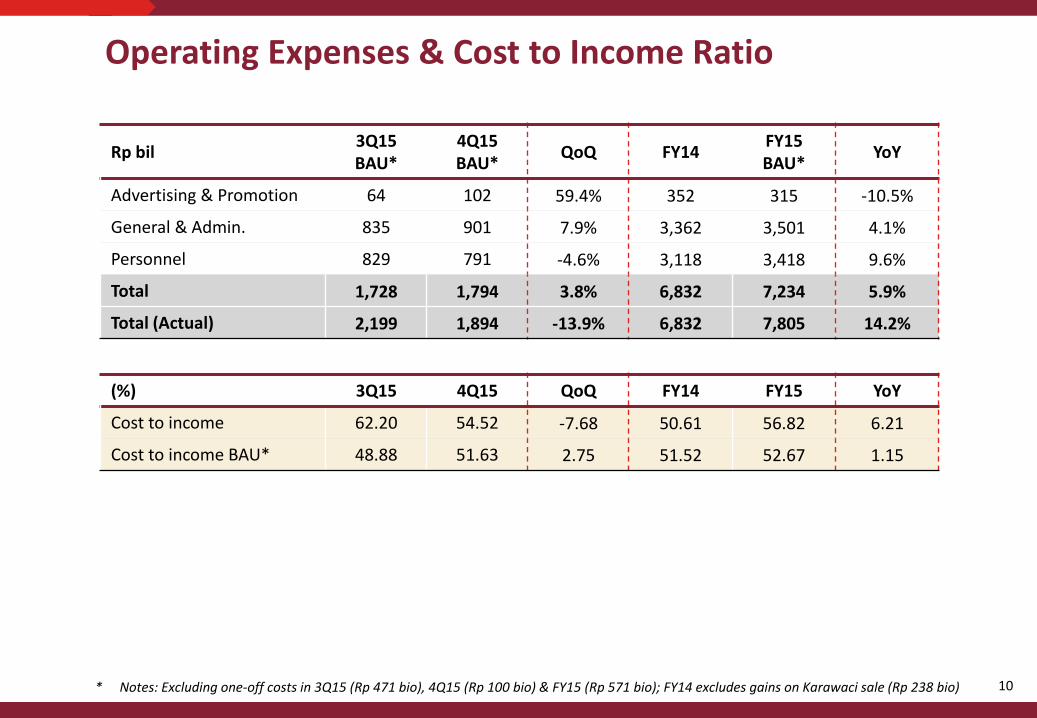
Operating Expenses & Cost to Income Ratio
* Notes: Excluding one-off costs in 3Q15 (Rp 471 bio), 4Q15 (Rp 100 bio) & FY15 (Rp 571 bio); FY14 excludes gains on Karawaci sale (Rp 238 bio)
Rp bil 3Q15 BAU*
4Q15 BAU*
QoQ FY14 FY15 BAU*
YoY
Advertising & Promotion 64 102 59.4% 352 315 -10.5%
General & Admin. 835 901 7.9% 3,362 3,501 4.1%
Personnel 829 791 -4.6% 3,118 3,418 9.6%
Total 1,728 1,794 3.8% 6,832 7,234 5.9%
Total (Actual) 2,199 1,894 -13.9% 6,832 7,805 14.2%
(%) 3Q15 4Q15 QoQ FY14 FY15 YoY
Cost to income 62.20 54.52 -7.68 50.61 56.82 6.21
Cost to income BAU* 48.88 51.63 2.75 51.52 52.67 1.15
11
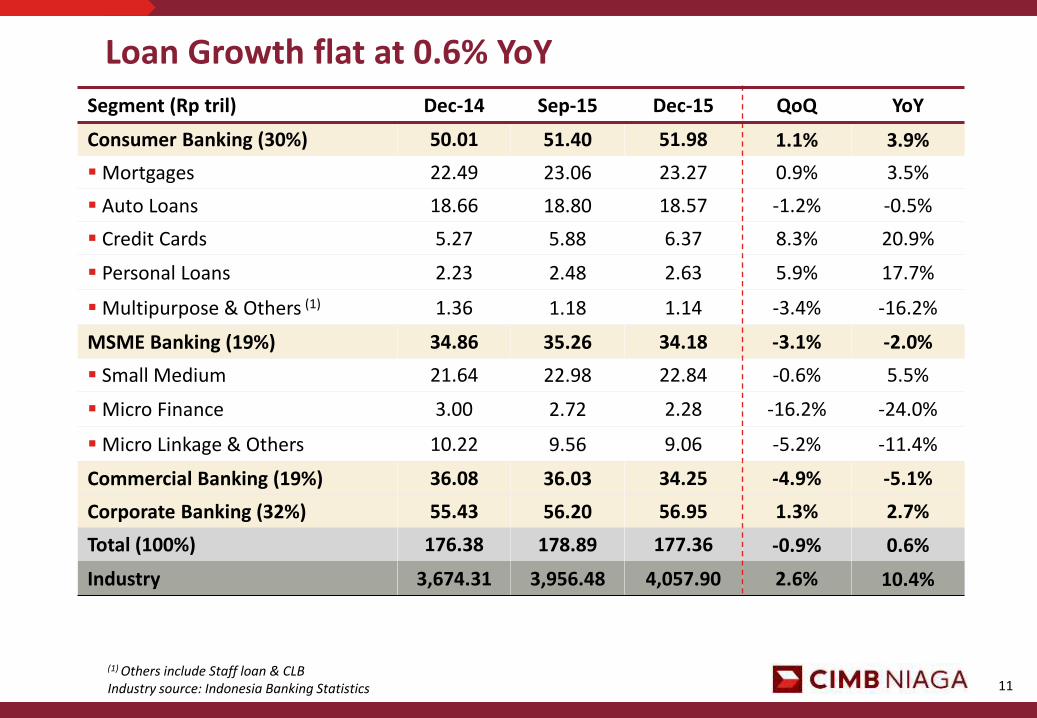
Loan Growth flat at 0.6% YoY
Segment (Rp tril) Dec-14 Sep-15 Dec-15 QoQ YoY
Consumer Banking (30%) 50.01 51.40 51.98 1.1% 3.9%
Mortgages 22.49 23.06 23.27 0.9% 3.5%
Auto Loans 18.66 18.80 18.57 -1.2% -0.5%
Credit Cards 5.27 5.88 6.37 8.3% 20.9%
Personal Loans 2.23 2.48 2.63 5.9% 17.7%
Multipurpose & Others (1) 1.36 1.18 1.14 -3.4% -16.2%
MSME Banking (19%) 34.86 35.26 34.18 -3.1% -2.0%
Small Medium 21.64 22.98 22.84 -0.6% 5.5%
Micro Finance 3.00 2.72 2.28 -16.2% -24.0%
Micro Linkage & Others 10.22 9.56 9.06 -5.2% -11.4%
Commercial Banking (19%) 36.08 36.03 34.25 -4.9% -5.1%
Corporate Banking (32%) 55.43 56.20 56.95 1.3% 2.7%
Total (100%) 176.38 178.89 177.36 -0.9% 0.6%
Industry 3,674.31 3,956.48 4,057.90 2.6% 10.4%
(1) Others include Staff loan & CLB Industry source: Indonesia Banking Statistics
12
88.78% 102.55% 99.60%
120.96% 111.53%
72.38% 78.29% 74.35% 73.96% 82.99%
Dec-14 Mar-15 Jun-15 Sep-15 Dec-15
Loan Loss Coverage Impaired LLC
Asset Quality Management Asset Quality
Loans by Collectability (% of Total Loan)
Coverage Ratio
3.90% 4.07% 4.28% 3.17%
3.74%
1.94% 1.81% 1.66% 1.47% 1.59%
4.79% 5.33% 5.74% 5.18% 5.03%
Dec-14 Mar-15 Jun-15 Sep-15 Dec-15
Gross NPL Net NPL Gross Impairment Ratio
Current 91.77%
Special Mention
4.33%
NPL 3.90%
Dec 14
Current 88.10%
Special Mention
8.16%
NPL 3.74%
Dec 15
Current 88.57%
Special Mention
8.26%
NPL 3.17%
Sep 15
13
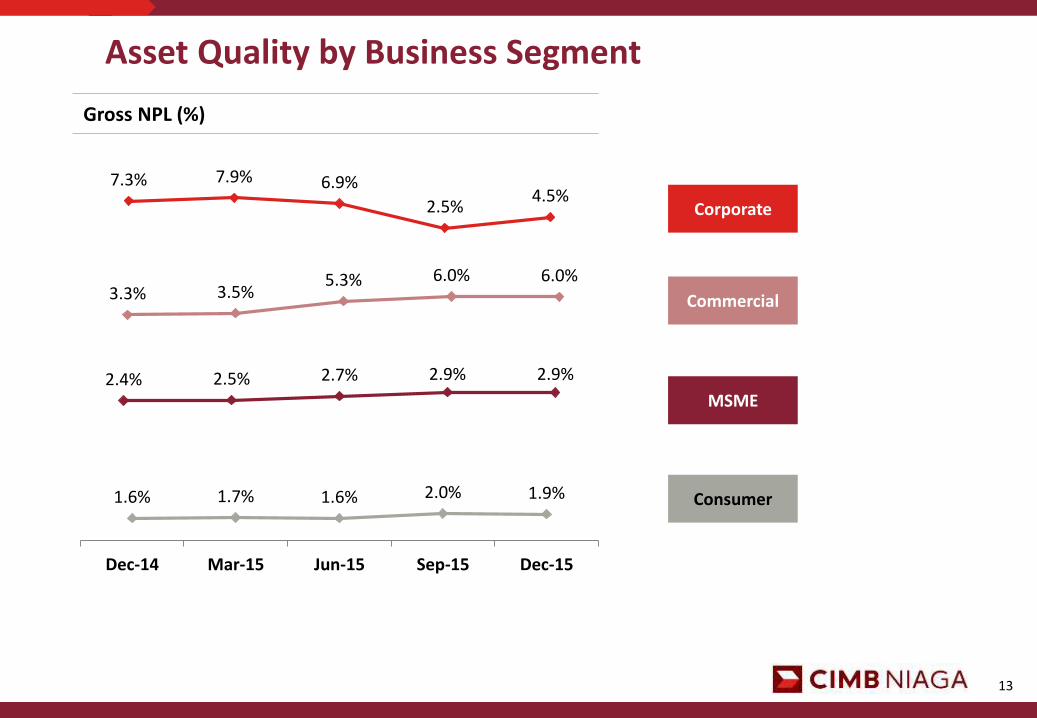
Asset Quality by Business Segment
Gross NPL (%)
7.3% 7.9% 6.9%
2.5% 4.5%
3.3% 3.5% 5.3% 6.0% 6.0%
1.6% 1.7% 1.6% 2.0% 1.9%
Dec-14 Mar-15 Jun-15 Sep-15 Dec-15
2.4% 2.5% 2.7% 2.9% 2.9%
Corporate
Commercial
MSME
Consumer

14
Rp tril Dec-14 Sep-15 Dec-15 QoQ YoY
CASA 78.39 88.50 83.56 -5.6% 6.6%
Current Account 39.22 45.19 40.44 -10.5% 3.1%
Saving Account 39.17 43.31 43.12 -0.4% 10.1%
Time Deposits & Structured Deposits
96.33 97.22 94.97 -2.3% -1.4%
Total 174.72 185.72 178.53 -3.9% 2.2%
Industry 4,114 4,464 4,413 -1.1% 7.3%
CASA 2,174 2,382 2,384 0.1% 9.7%
Time Deposits 1,940 2,083 2,030 -2.5% 4.6%
Total CASA grew 6.6% YoY
15
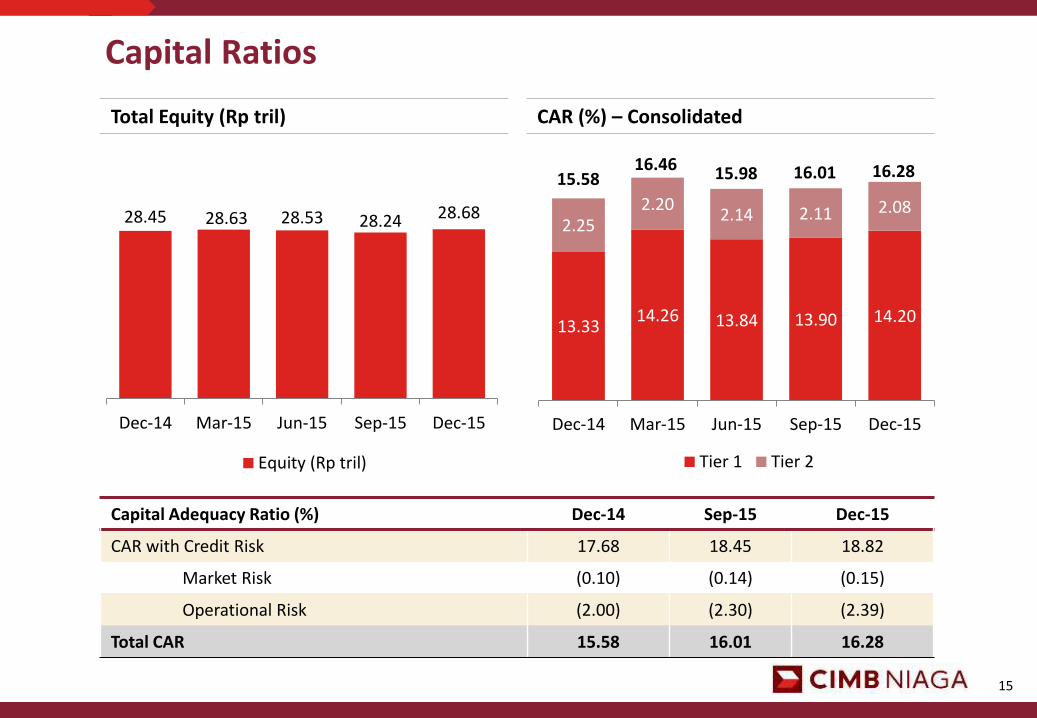
Capital Ratios
Total Equity (Rp tril) CAR (%) – Consolidated
Capital Adequacy Ratio (%) Dec-14 Sep-15 Dec-15
CAR with Credit Risk 17.68 18.45 18.82
Market Risk (0.10) (0.14) (0.15)
Operational Risk (2.00) (2.30) (2.39)
Total CAR 15.58 16.01 16.28
13.33 14.26 13.84 13.90 14.20
2.25 2.20
2.14 2.11 2.08
Dec-14 Mar-15 Jun-15 Sep-15 Dec-15
Tier 1 Tier 2
16.28 16.46 15.98 16.01 15.58
(1) Quarterly annualized * Excludes one-off costs (Rp 571 bio)
28.45 28.63 28.53 28.24 28.68
Dec-14 Mar-15 Jun-15 Sep-15 Dec-15
Equity (Rp tril)(1)
28.45 28.63 28.53 28.24 28.68
0.66% 1.15% 1.31% 6.19% 3.34%
Dec-14 Mar-15 Jun-15 Sep-15 Dec-15
Equity (Rp tril) ROE Shareholders Fund BAU
CIMB Niaga: FY 2015 Results Consumer Banking
17
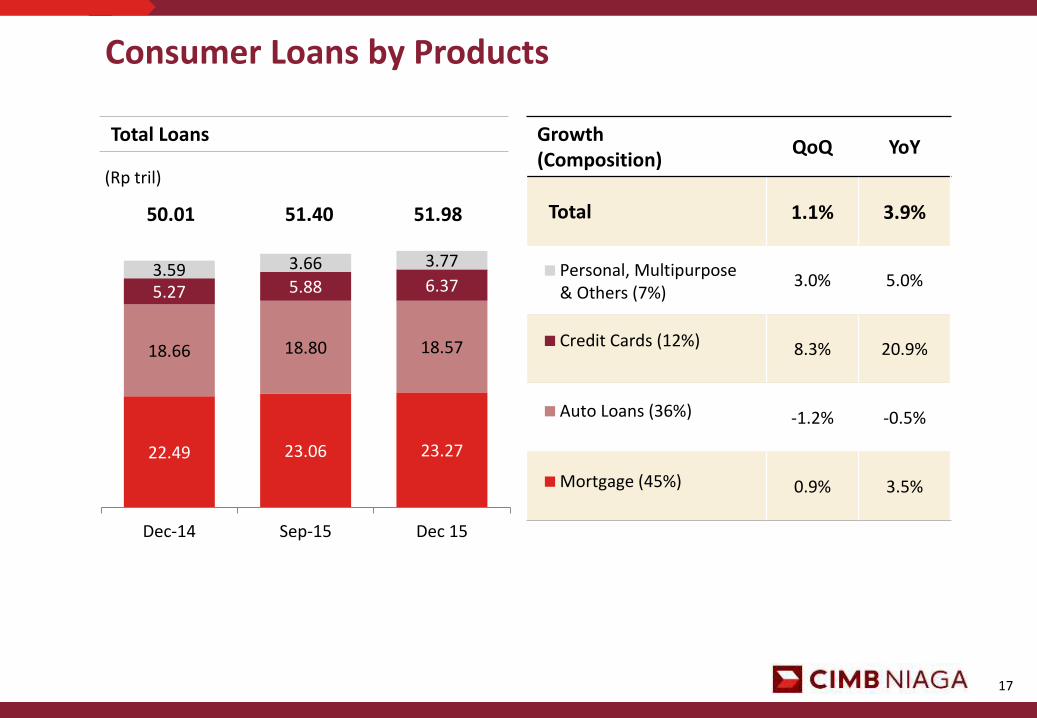
Consumer Loans by Products
Growth (Composition)
QoQ YoY
Total 1.1% 3.9%
3.0% 5.0%
8.3% 20.9%
-1.2% -0.5%
0.9% 3.5%
Total Loans
22.49 23.06 23.27
18.66 18.80 18.57
5.27 5.88 6.37 3.59 3.66 3.77
Dec-14 Sep-15 Dec 15
Personal, Multipurpose& Others (7%)
Credit Cards (12%)
Auto Loans (36%)
Mortgage (45%)
50.01 51.40
(Rp tril)
51.98

18
Mortgages
Total Loans
Market Share
Mortgage Lender Sep-15
BTN 35.4%
BCA 17.4%
BNI 10.1%
Mandiri 7.9%
CIMB Niaga 6.9%
2.5% 2.6% 2.2%
Dec-14 Sep-15 Dec-15
22.49 23.06 23.27
Dec-14 Sep-15 Dec-15
(Rp tril)
7.1% 6.9% 6.8%
NPL Ratio
Market Share
+3.5% YoY
Industry Source: Indonesia Banking Statistics
+0.9% QoQ

19
Creating a Dominant Player in Auto Business
Total Loans
(Rp tril) Growth QoQ YoY
Total -1.2% -0.5%
-35.4% -15.2%
-4.8% -14.2%
-2.5% -11.7%
3.2% 4.6%
13.42 13.61 14.04
1.80 1.63 1.59
2.32 2.09 1.99
1.12 1.47 0.95
0.8%
1.5% 1.9%
Dec-14 Sep-15 Dec-15
Indirect Auto Loans
KITAF
Direct Loans
CNAF
NPL ratio
18.66 18.80 18.57
NPL Ratio
As of 1 January 2016 KITAF is effectively merged into CNAF
Merger

20
1,805
1,924 2,001
Dec-14 Sep-15 Dec-15
Become Top 3 Player in Credit Cards
Number of Cards Outstanding Balance
2013
# Bank Mkt Share
3 BNI
4 Mega
5 CIMBN 10.7%
5.27 5.88
6.37
1.2% 1.1% 1.1%
Dec-14 Sep-15 Dec-15
Outstanding Balance NPL
(thou) (Rp tril)
2014
# Bank Mkt Share
3 Mega
4 CIMBN 11.3%
5 BNI
* Market share based on card issued
+4.0% QoQ
+10.9% YoY
Sep-15
# Bank Mkt Share*
3 CIMBN 11.5%
4 Mega
5 BNI
21
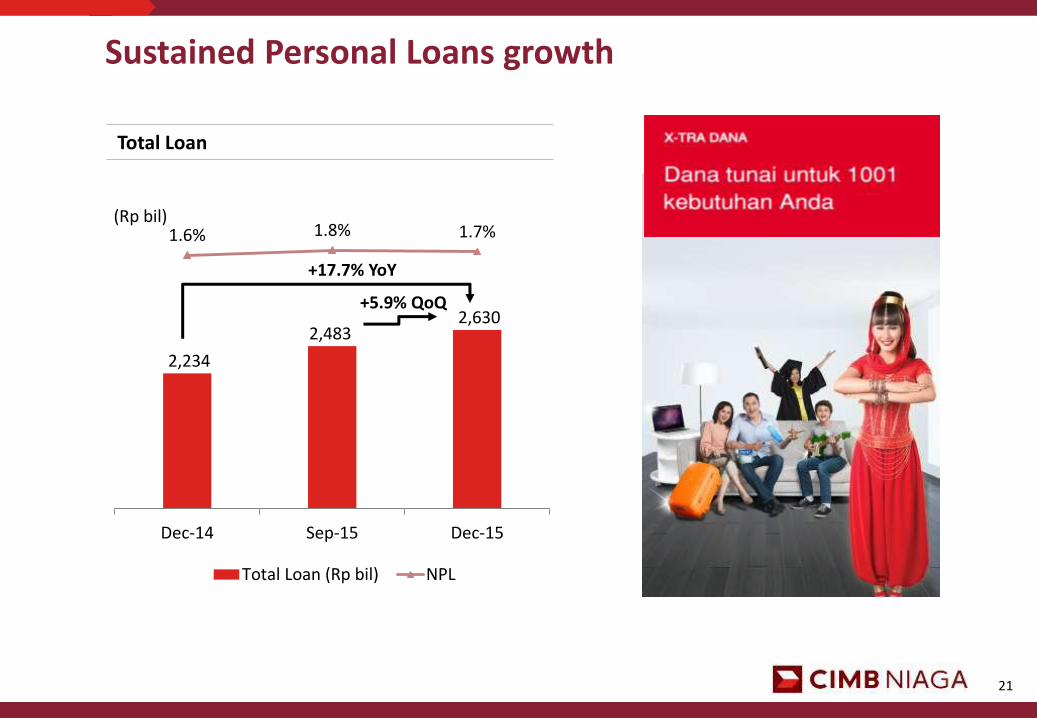
Sustained Personal Loans growth
Total Loan
2,234
2,483 2,630
1.6% 1.8% 1.7%
Dec-14 Sep-15 Dec-15
Total Loan (Rp bil) NPL
(Rp bil)
+17.7% YoY
+5.9% QoQ
22
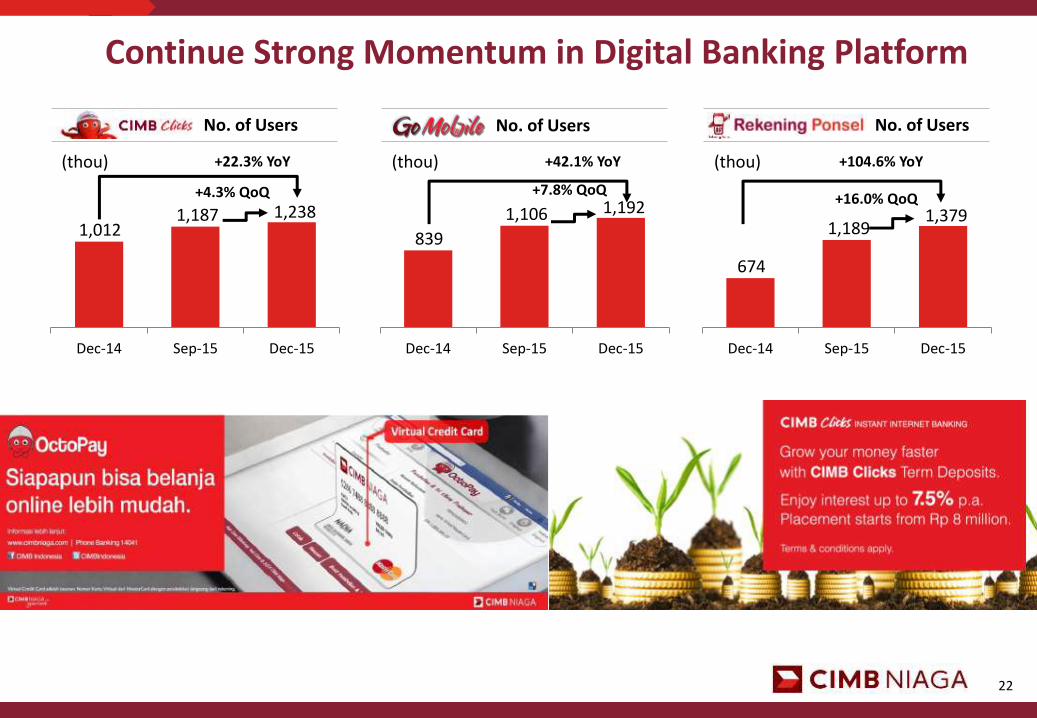
No. of Users
1,012 1,187 1,238
Dec-14 Sep-15 Dec-15
(thou) +22.3% YoY
+4.3% QoQ
Continue Strong Momentum in Digital Banking Platform
839
1,106 1,192
Dec-14 Sep-15 Dec-15
+7.8% QoQ
+42.1% YoY
No. of Users
(thou)
No. of Users
674
1,189 1,379
Dec-14 Sep-15 Dec-15
+16.0% QoQ
+104.6% YoY (thou)

CIMB Niaga: FY 2015 Results MSME Banking
24
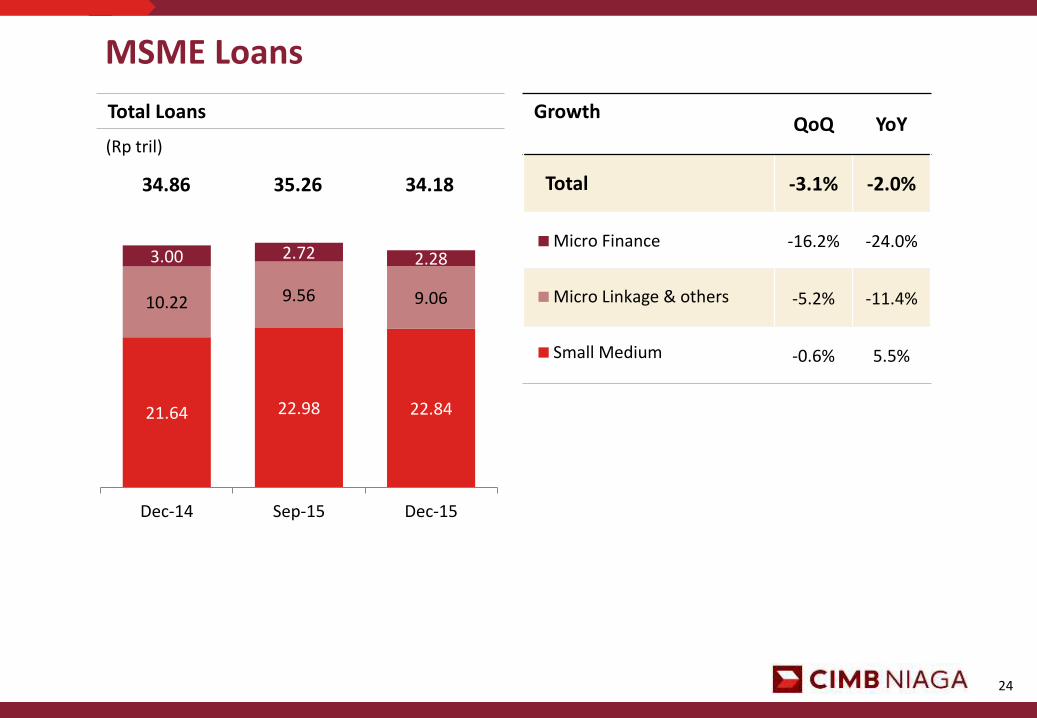
Growth QoQ YoY
Total -3.1% -2.0%
-16.2% -24.0%
-5.2% -11.4%
-0.6% 5.5%
Total Loans
21.64 22.98 22.84
10.22 9.56 9.06
3.00 2.72 2.28
Dec-14 Sep-15 Dec-15
Micro Finance
Micro Linkage & others
Small Medium
34.86 35.26 34.18
(Rp tril)
MSME Loans

CIMB Niaga: FY 2015 Results Commercial Banking

26
Commercial Loans
Growth (Composisiton) QoQ YoY
Total -4.9% -5.1%
-2.9% -1.4%
-7.6% -9.7%
Total Loans
15.93 15.58 14.39
20.15 20.45 19.86
Dec-14 Sep-15 Dec-15
Working Capital (58%)
Investment (42%)
36.08 36.03 34.25
(Rp tril)

CIMB Niaga: FY 2015 Results Corporate Banking
28
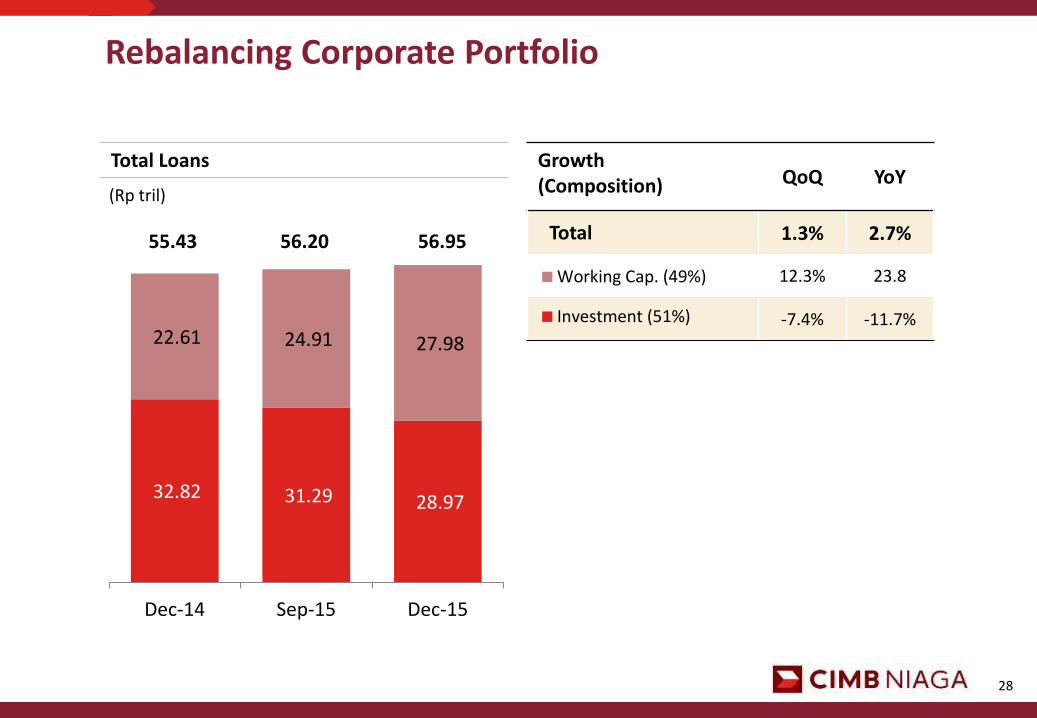
Rebalancing Corporate Portfolio
Growth (Composition) QoQ YoY
Total 1.3% 2.7%
12.3% 23.8
-7.4% -11.7%
Total Loans
(Rp tril)
32.82 31.29 28.97
22.61 24.91 27.98
Dec-14 Sep-15 Dec-15
Working Cap. (49%)
Investment (51%)
55.43 56.20 56.95

CIMB Niaga: FY 2015 Results Syariah Banking

30
Syariah Banking
Total Deposits
(Rp tril)
6.77 7.85
7.58
Dec-14 Sep-15 Dec-15
Total Financing
(Rp tril)
6.44 6.91 7.28
Dec-14 Sep-15 Dec-15
+12.0% YoY
-3.4% QoQ
+13.0% YoY
+5.4% QoQ
CIMB Niaga: FY 2015 Results Final Remarks
32
Final Remarks
2015 was challenging given the economic slowdown and softer commodity sector
Undertaken strategic steps to improve efficiency and scale: completed MSS,
disposed bad bank, recalibrated Micro business and streamlined auto business
Foundation setting for future growth: Successful completion of core banking system
in Jan 2016, building digital banking platform
2016 outlook appears more positive with a favorable monetary policy and continued
government growth initiatives and stimulus packages
CIMB Niaga will emphasize CASA growth, prudent asset expansion, close asset
quality monitoring and cost management in 2016

33
THANK YOU

CIMB Niaga: FY 2015 Results Appendices
35
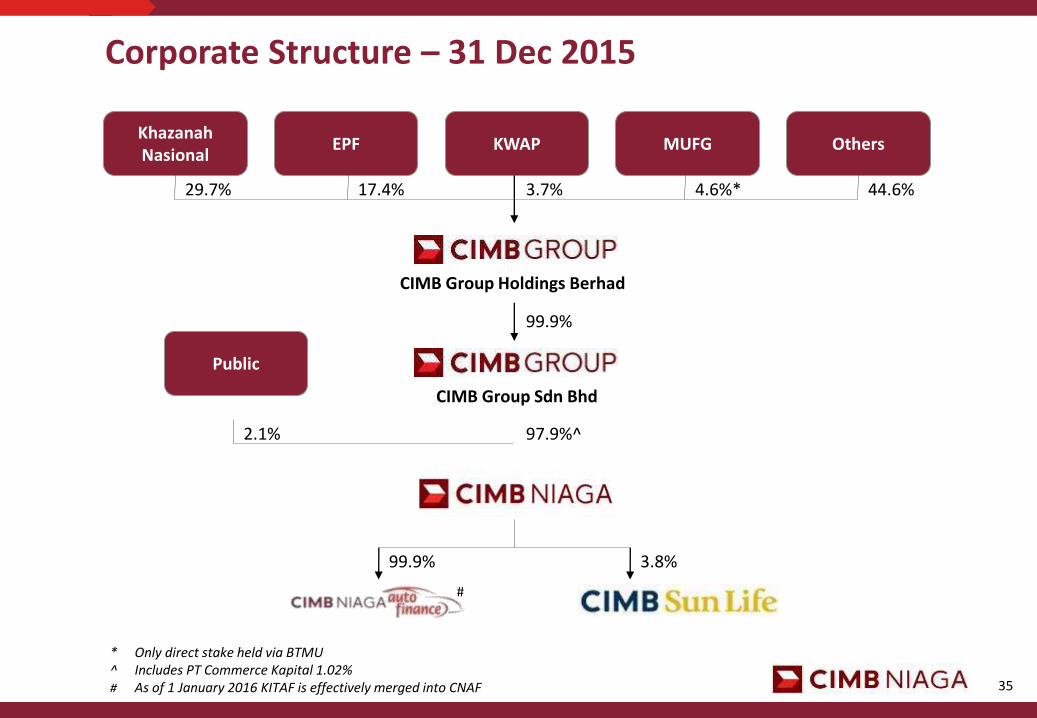
Corporate Structure – 31 Dec 2015
* Only direct stake held via BTMU ^ Includes PT Commerce Kapital 1.02% # As of 1 January 2016 KITAF is effectively merged into CNAF
EPF KWAP MUFG Others Khazanah Nasional
Public
29.7% 17.4% 3.7% 4.6%* 44.6%
99.9%
2.1% 97.9%^
99.9% 3.8%
CIMB Group Holdings Berhad
CIMB Group Sdn Bhd
#
36
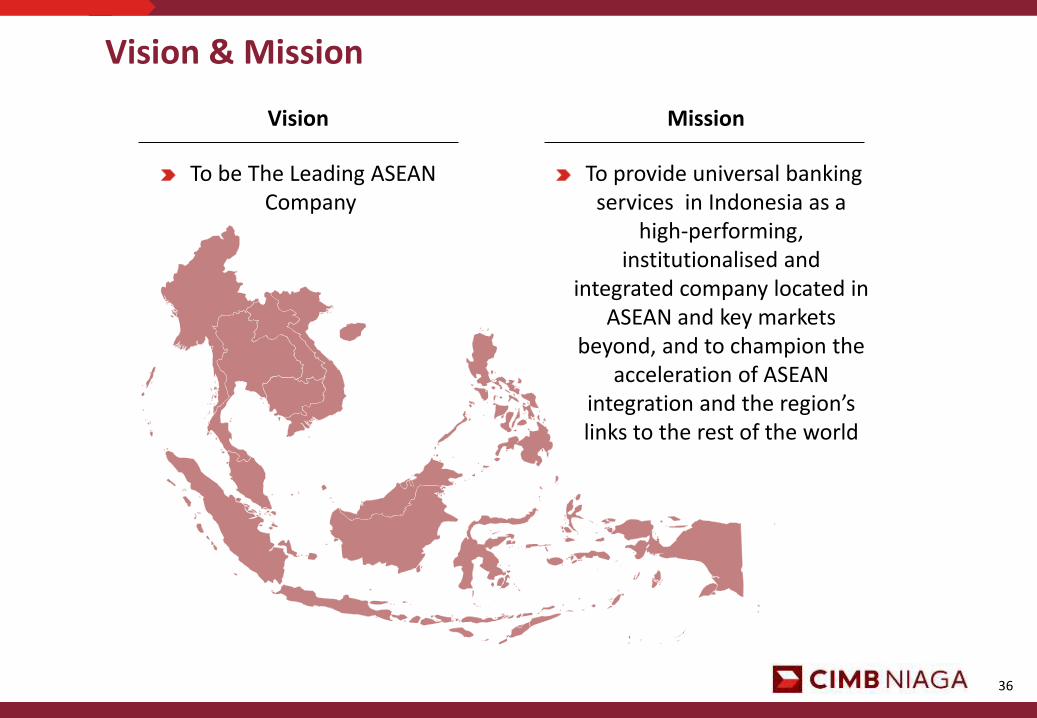
Vision & Mission
To be The Leading ASEAN Company
Vision Mission
To provide universal banking services in Indonesia as a
high-performing, institutionalised and
integrated company located in ASEAN and key markets
beyond, and to champion the acceleration of ASEAN
integration and the region’s links to the rest of the world

37
Dato’ Sri Nazir Razak Glenn M.S. Yusuf
President Commissioner Vice President Commissioner
Roy Edu Tirtadji Sri Hartina Urip Simeon Zulkifli M. Ali
Independent Commissioner Independent Commissioner Independent Commissioner
Pri Notowidigdo David Richard Thomas Ahmad Zulqarnain Onn
Independent Commissioner Commissioner Commissioner
Board of Commissioners
38
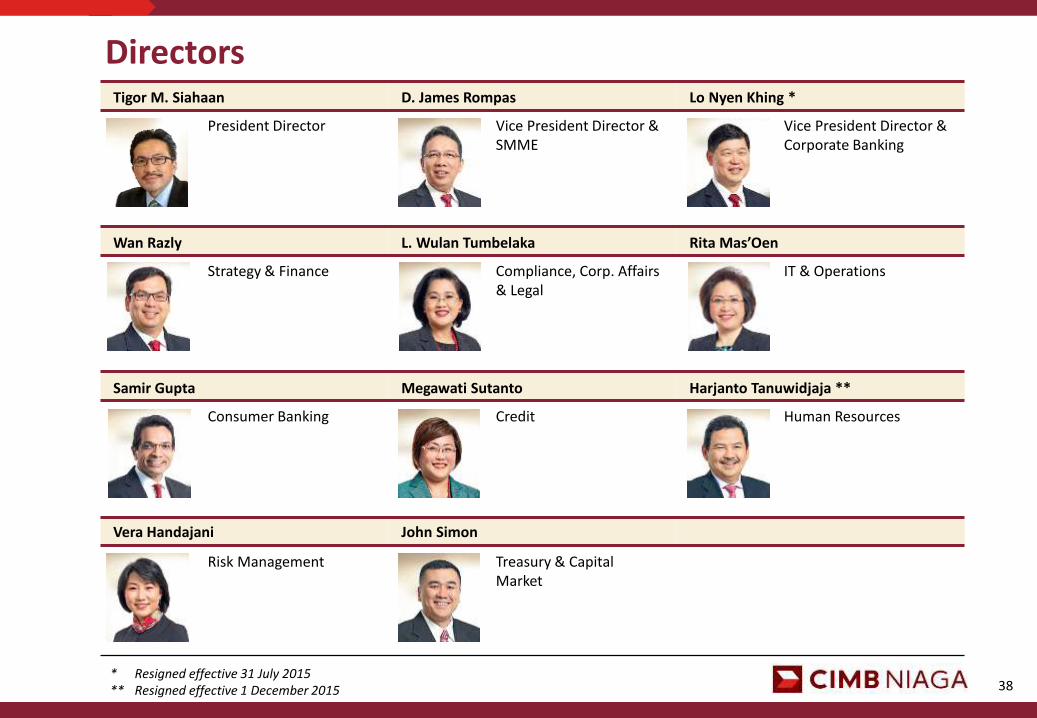
Tigor M. Siahaan D. James Rompas Lo Nyen Khing *
President Director Vice President Director & SMME
Vice President Director & Corporate Banking
Wan Razly L. Wulan Tumbelaka Rita Mas’Oen
Strategy & Finance Compliance, Corp. Affairs & Legal
IT & Operations
Samir Gupta Megawati Sutanto Harjanto Tanuwidjaja **
Consumer Banking Credit Human Resources
Vera Handajani John Simon
Risk Management Treasury & Capital Market
Directors
* Resigned effective 31 July 2015 ** Resigned effective 1 December 2015

39
5th in terms of Asset
Assets (Rp trillion)
Source: Published Financial Statement by Bank Indonesia as of November-15; Bank only # Industry as of November-15
792 775
574
440
233 185 167 166 159 146
BRI Mandiri BCA BNI CIMBN Permata BTN Panin Danamon Maybank
Market Share# 13.1% 12.9% 9.5% 7.3% 3.9% 3.1% 2.8% 2.8% 2.6% 2.4%
Top 10 banks control 60.4% of industry’s Asset

40
Maintained position as the 5th largest bank
595 581
462
323
182 143 122 119 115 114
BRI Mandiri BCA BNI CIMBN Permata BTN Panin Danamon BII
528 507
372
297
168 135 129 114 104 104
BRI Mandiri BCA BNI CIMBN BTN Permata Panin Danamon Maybank
Loans (Rp trillion) Customer Deposits (Rp trillion)
Top 10 banks control 62.2% of industry’s loans Top 10 banks control 63.1% of industry’s deposits
Source: Published Financial Statement by Bank Indonesia as of November-15; Bank only * Branches exclude Micro, Cash Counters, Payment Point & Mobile Cash; Danamon incl. Danamon Simpan Pinjam (DSP); Panin as of Dec-14
13.4% 12.8% 9.4% 7.5% 4.3% 3.4% 3.3% 2.9% 2.6% 2.6% 13.6% 13.3% 10.6% 7.4% 4.2% 3.3% 2.8% 2.7% 2.6% 2.6% Market Share#
Branches* (Sep-15)
21,685
17,341 16,783
14,219
3,366 1,830 1,600 1,473 1,019 1,008
BRI Mandiri BCA BNI CIMBN BTN BII Danamon Panin Permata
ATM (Sep-15)
2,380
1,329 1,160 1,083 1,080
560 553 433 378 314
Mandiri Danamon BCA BRI BNI Panin CN BII BTN Permata
# Industry as of November-15
41
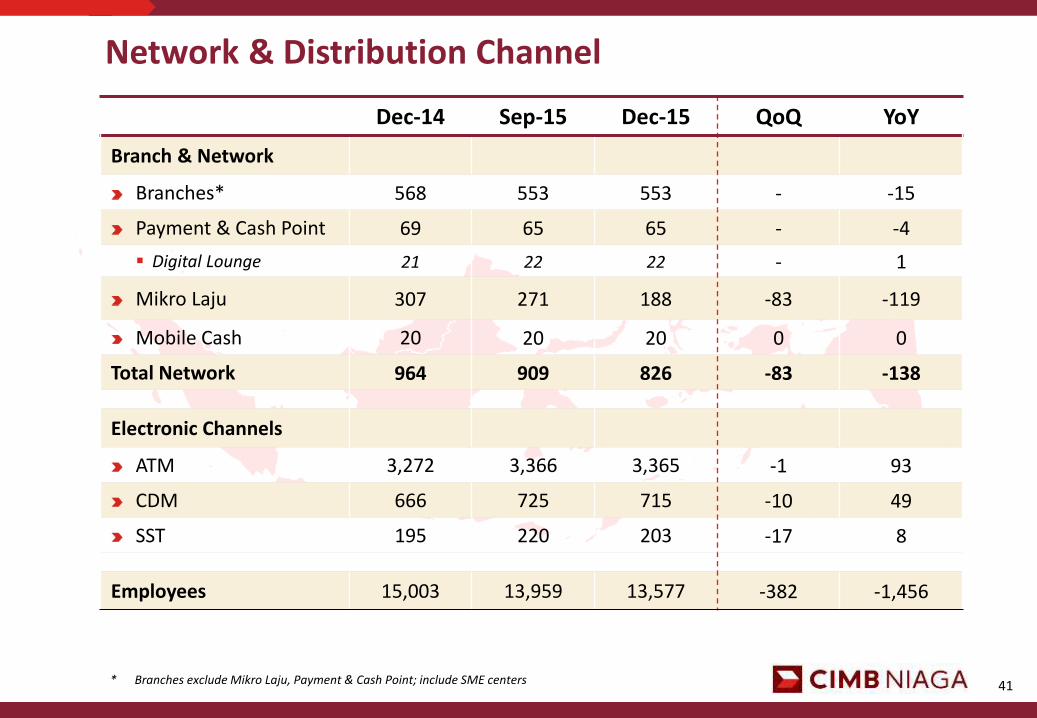
Network & Distribution Channel
* Branches exclude Mikro Laju, Payment & Cash Point; include SME centers
Dec-14 Sep-15 Dec-15 QoQ YoY
Branch & Network
Branches* 568 553 553 - -15
Payment & Cash Point 69 65 65 - -4
Digital Lounge 21 22 22 - 1
Mikro Laju 307 271 188 -83 -119
Mobile Cash 20 20 20 0 0
Total Network 964 909 826 -83 -138
Electronic Channels
ATM 3,272 3,366 3,365 -1 93
CDM 666 725 715 -10 49
SST 195 220 203 -17 8
Employees 15,003 13,959 13,577 -382 -1,456

42
Share Price and Ratings
Rating Agencies Rating / Outlook
Moody’s 5 Jan 2016
Outlook
Bank Deposits
Baseline Credit Assessment
Adj. Baseline Credit Assessment
Issuer Rating
Stable
Baa3/P-3
ba2
baa3
Baa3
Fitch 4 Dec 2015
Long Term Foreign Currency IDR Short Term Foreign Currency IDR Support Rating Viability Rating National Long Term National Short Term Rupiah Subordinated Bonds Rupiah Senior Bond Program 1 2012 Rupiah Senior Bond Prg. 1 tranche 1 & 2
BBB / Stable F3 2 bb AAA(idn) / Stable F1+(idn) AA(idn) AAA(idn) AAA(idn)
Pefindo 02 Jul 2015
Corporate Rating Senior Bond Rating Shelf Registration Bond Rating
idAAA idAAA idAAA
Share Price & Trading Volume
BNGA Dec-14 Mar-15 Jun-15 Sep-15 Dec-15
Price (Rp) 835 800 675 540 595
PBV (x) 0.74 0.70 0.59 0.48 0.54
PER 8.96 15.15 29.95 43.51 34.95
43
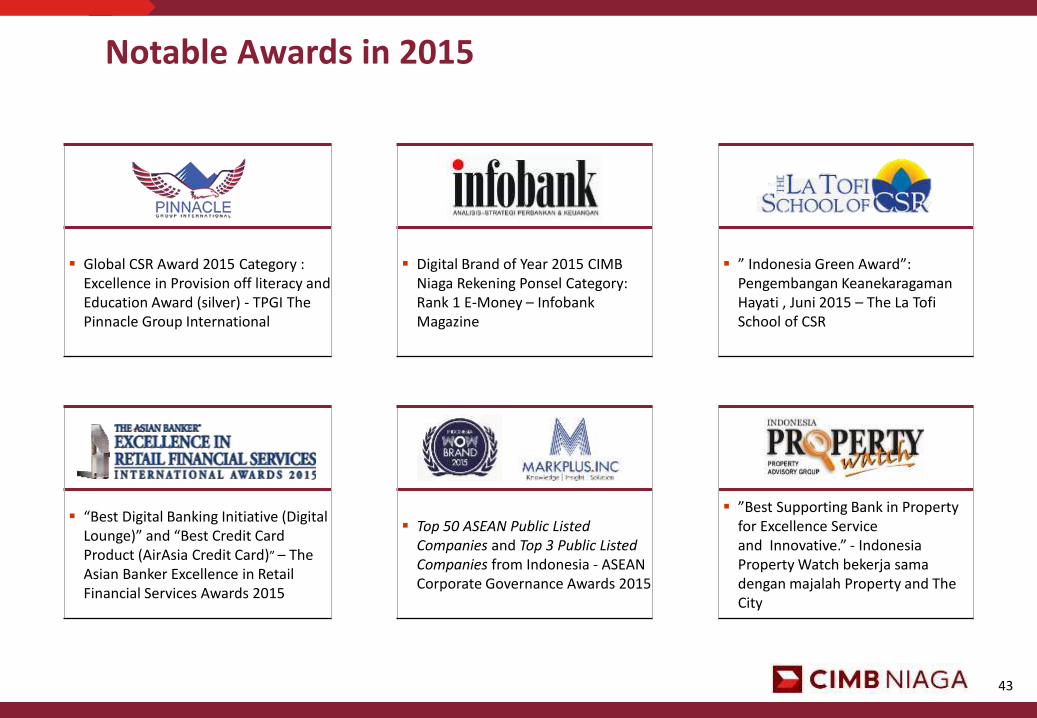
Notable Awards in 2015
Global CSR Award 2015 Category : Excellence in Provision off literacy and Education Award (silver) - TPGI The Pinnacle Group International
Digital Brand of Year 2015 CIMB Niaga Rekening Ponsel Category: Rank 1 E-Money – Infobank Magazine
” Indonesia Green Award”: Pengembangan Keanekaragaman Hayati , Juni 2015 – The La Tofi School of CSR
“Best Digital Banking Initiative (Digital Lounge)” and “Best Credit Card Product (AirAsia Credit Card)” – The Asian Banker Excellence in Retail Financial Services Awards 2015
Top 50 ASEAN Public Listed Companies and Top 3 Public Listed Companies from Indonesia - ASEAN Corporate Governance Awards 2015
”Best Supporting Bank in Property for Excellence Service and Innovative.” - Indonesia Property Watch bekerja sama dengan majalah Property and The City
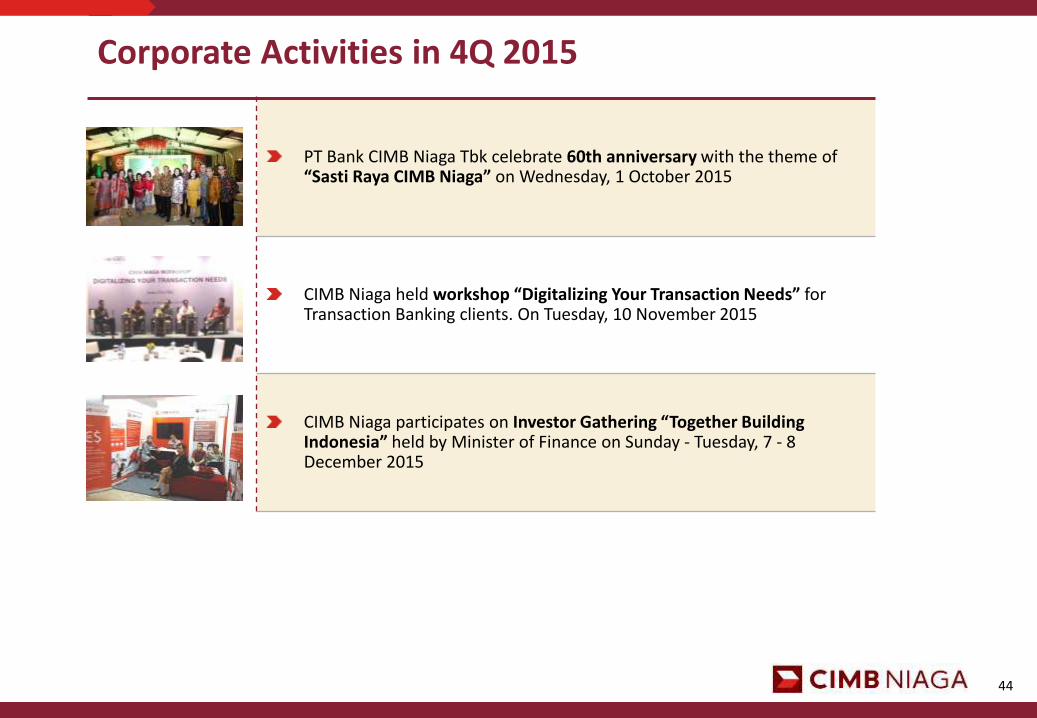
44
Corporate Activities in 4Q 2015
PT Bank CIMB Niaga Tbk celebrate 60th anniversary with the theme of “Sasti Raya CIMB Niaga” on Wednesday, 1 October 2015
CIMB Niaga held workshop “Digitalizing Your Transaction Needs” for Transaction Banking clients. On Tuesday, 10 November 2015
CIMB Niaga participates on Investor Gathering “Together Building Indonesia” held by Minister of Finance on Sunday - Tuesday, 7 - 8 December 2015

THANK YOU
PT Bank CIMB Niaga Tbk Investor Relations Menara Sentraya 31st Floor Jl. Iskandarsyah Raya I A Jakarta 12160 Tel. : (62-21) 270 0555 Fax. : (62-21) 250 5205 Email : [email protected]
www.cimbniaga.com
Related Documents