ANALYST PRESENTATION 1Q2020 RESULTS AFFIN BANK BERHAD 1 June 2020

Welcome message from author
This document is posted to help you gain knowledge. Please leave a comment to let me know what you think about it! Share it to your friends and learn new things together.
Transcript

ANALYST PRESENTATION
1Q2020 RESULTSAFFIN BANK BERHAD
1 June 2020

Key Performance Highlights 1Q2020
PROFITABILITY
ASSET QUALITY
CAPITAL
• Achieved a PBT of RM174.3 mn (1Q2019: RM185.0 mn) YoY decline of 5.8%
• Net income recorded was RM630.4 mn (1Q2019: RM472.5 mn) YoY growth of 33.4%
• Cost to Income Ratio of 52.67%, improved by 11.73% YoY (1Q2019: 64.40%)
• ROE of 5.34% (1Q2019: 5.79%)
• Gross Impaired Loans ratio was at 3.11% (1Q2019:3.31%)
• Loan Loss Reserve including regulatory reserve was at 96.14% (1Q2019: 97.39%)
• Common Equity Tier-1 Capital Ratio increased 183bps to 14.25% (1Q2019: 12.42%)
• Total Capital Ratio improved to 23.12% (1Q2019: 20.76%)
LOANS • Gross Loans reduced to RM45.5 bn 1Q2020 (YoY reduction of 6.2% 1Q2019:RM48.5 bn)
• CASA ratio increased in 1Q2020: 17.95% compared to 1Q2019: 14.54%
• Customer Deposits was at RM50.9 bn (1Q2019: RM57.4 bn), YoY reduction of RM6.5 bn or 11.3%
• LCR comfortable level at 141.68%, (1Q2019: 146.76%)
• NSFR improved significantly to 114.29% (1Q2019: 81.19%)
2
DEPOSITS

RM Millions 1Q2019 4Q2019 1Q2020 QoQ (%) YoY (%)
Cash, short-term funds & deposits placements
with FIs6,987.7 4,605.4 5,559.0 20.7 (20.4)
Financial assets/investments 16,003.0 13,304.0 12,430.4 (6.6) (22.3)
Gross loans, advances & financing 48,510.2 45,961.9 45,484.4 (1.0) (6.2)
Other assets 4,706.4 4,470.0 3,735.1 (16.4) (20.6)
TOTAL ASSETS 76,207.3 68,341.3 67,208.9 (1.7) (11.8)
Deposits from customers 57,361.0 51,089.0 50,932.9 (0.3) (12.6)
of which : CASA 8,347.7 9,752.2 9,143.7 (6.2) 9.5
Fixed Deposits, NIDs, MMD & CMD 49,013.3 41,336.8 41,789.2 (1.1) (17.3)
Deposits & Placement of banks and other FIs 3,707.7 1,763.3 1,418.6 (19.5) (61.7)
Other liabilities 2,347.5 2,485.5 2,029.3 (18.4) (13.6)
Subordinated MTN/ Senior Notes 3,639.7 3,607.1 3,587.3 (0.5) (1.4)
Total Equity 9,151.4 9,396.4 9,240.8 (1.7) 1.0
TOTAL LIABILITIES & EQUITY 76,207.3 68,341.3 67,208.9 (1.7) (11.8)
3
Balance Sheet Highlights

Loans: Continued Focus on SME & Consumer Banking
22.4 25.0 24.6 24.2
20.1 19.9 17.3 17.1
3.6 4.1 4.1 4.2
2017 2018 2019 1Q2020
Consumer Corporate SMEs
46.1 49.046.0 45.5
7.8%
43.6%
48.6%
9.2%
37.6%
53.2%
RM Billions 1Q2019 4Q2019 1Q2020QoQ
(%)
YoY
(%)
Consumer Banking 25.2 24.6 24.2 (1.6) (4.0)
Corporate Banking 19.2 17.3 17.1 (1.2) (10.9)
SME Banking 4.1 4.1 4.2 2.4 2.4
TOTAL 48.5 46.0 45.5 (1.1) (6.2)
4
Composition
FY2017
Gross Loans
(RM Billions)
Composition
1Q2020

Deposits: CASA Focus With the Launch of our New Systems (AffinMax, New RIB)
Deposits (RM Billions)
Deposits by Business Segments (RM Billions)
Consumer Corporate SME
FY2019 24.0 47.0% 21.5 42.0% 5.6 11.0%
1Q2020 24.7 48.5% 20.5 40.3% 5.7 11.2%
LTF & LTFE (%)
5
79.4
82.9 82.5
70.4
72.071.4
1Q2019 2019 1Q2020
Loans to Fund Ratio (LTF) Loans to Fund and Equity Ratio (LTFE)
57.4
51.1 50.9
1Q2019 2019 1Q2020
12.8%

Deposits: Reducing Dependence on High Cost Deposits
1Q2019 1Q2020
Deposits from Customers (RM Billions)
57.4
Deposits from Customers (RM Billions)
50.9
6
Corporate SME Consumer Total
CASA Ratio
(%) 17.9 48.2 15.1 18.0
3.4 2.3 2.8
19.526.8
2.4
Consumer Banking Corporate Banking SME
CASA Fixed Deposits, MM & Others
3.9 2.4 2.7
20.8
18.1
3.0
Consumer Banking Corporate Banking SME
CASA Fixed Deposits, MM & Others
Corporate SME Consumer Total
CASA Ratio
% 8.4 53.8 14.8 14.5

Increasing Intensity of CASA Focus
7
1Q2019 2Q2019 3Q2019 4Q2019 1Q2020
LCR (%) 146.76 146.79 237.78 171.72 141.68
NSFR(%) 81.19 89.32 121.14 115.60 114.29
14.54 13.92
14.64
19.09
17.95
1Q
2019
2Q
2019
3Q
2019
4Q
2019
1Q
2020
CASA Ratio (%)

Resilient Capital Levels Given the Challenging Environment
%
CET 1
Dec 2019
CET 1
Mar 2020
Tier 1
Dec 2019
Tier 1
Mar 2020
Total
Capital
Dec 2019
Total
Capital
Mar 2020
AFFIN BANK
BERHAD*
Group 14.45 14.25 16.24 16.04 23.26 23.11
Bank 12.95 12.88 14.64 14.59 22.28 22.30
AFFIN
ISLAMIC
BANK
BERHAD
Bank 11.7 11.36 13.82 13.48 20.63 20.32
AFFIN
HWANG
INVESTMENT
BANK
BERHAD#
Group 33.23 34.01 33.99 34.63 34.76 35.43
Bank 42.74 40.88 42.74 40.88 43.57 41.77
Common Equity Tier 1 (“CET 1”) Capital Ratio, Tier 1 (“Tier 1”) Capital Ratio and Total Capital Ratio of all banking entities
within the Group remained at above the minimum regulatory requirements.
• After proposed interim dividend of 7 sen
# After proposed final dividend of 4 sen
8

Asset Quality: Priority to Increase the LLR (Excluding Regulatory Reserve)
• Loan Loss Reserve (including RR) was slightly lower at
96.14% as at 1Q2020 (1Q19: 97.39%)
2.53
3.253.00 3.11
2.102.59
2.28 2.37
2017 2018 2019 1Q2020
Gross Impaired Loan Ratio
Net Impaired Loans Ratio
Impaired Loan Ratios (%)
Loan Loss Reserve (%)
9
• GIL recorded at 3.11% (1Q19: 3.31). Excluding the R&R accounts, the GIL was at 2.98%.
• NIL at 2.37% (1Q19: 2.63%). Excluding the R & R accounts, the NIL was at 2.24%.
98.50 97.08 96.88 96.14
36.5028.50
60.29 57.45
2017 2018 2019 1Q2020
LLR (Inc RR) LLR (Excl RR)

5.025.40 5.55
4.42 4.54
1Q
20
19
2Q
20
19
3Q
20
19
4Q
20
19
1Q
20
20
SME
5.92 5.815.33
4.80 4.70
1Q
20
19
2Q
20
19
3Q
20
19
4Q
20
19
1Q
20
20
1.581.72
1.60 1.691.83
1Q
20
19
2Q
20
19
3Q
20
19
4Q
20
19
1Q
20
20
Consumer Corporate
10
Asset Quality by Business Segments
• Enhance early warning framework to
ensure timely detection and rehabilitation.
• Regional Asset Quality Management
set-up for faster response.
• Enhance Collections strategy and
execution through use of collection
scorecards and associated analytics.
Gross Impairment Ratio (%)

RM Million 1Q2019 4Q2019 1Q2020 QoQ (%) YoY (%)
Net Interest Income (+Islamic) 285.8 297.6 293.1 (1.5) (2.5)
Non-Interest Income 186.7 189.4 337.2 78.0 80.7
of which :
Gains on Financial Instruments 71.5 55.0 207.6 >100 > 100
Fee & Commissions 102.6 120.5 116.3 (3.5) 13.3
Operating Expenses (304.3) (291.5) (332.0) 13.9 9.1
Allowances for Impairment Losses 9.9 (46.6) (118.1) >100 (>100)
Share of JV & Associate 7.3 17.5 (3.7) (>100) (>100)
Zakat (0.4) (0.2) (2.2) (>100) (>100)
Profit Before Tax 185.0 166.2 174.3 4.9 (5.8)
Income Statement
11

Entity1Q2019
(RM million)
4Q2019
(RM Million)
1Q2020
(RM million)QoQ (%) YoY (%)
AFFIN Bank
(Bank Level)103.7 125.5 31.9 (74.6) (69.2)
AFFIN Islamic 32.0 7.7 19.2 >100 (40.0)
Affin Hwang Investment 45.2 29.2 127.4 >100 181.9
AXA Affin Life Insurance (1.8) 0.6 (3.7) (>100) (>100)
AXA Affin General Insurance 9.1 16.4 (0.1) (95.7) (92.3)
Affin Moneybrokers0.7 0.5 0.9 80.0 28.6
AFFIN Bank Group 185.0 166.2 174.3 4.9 (5.8)
PBT Contribution by Subsidiaries, JV and Associate Company
12

NIM increased 14bps, as we continue to expand our CASA franchise
Net Interest Margin (%)
1.84 1.83 1.72 1.86
2017 2018 2019 1Q2020
• NIM increased by 14 bps year-to-date to 1.86%, mainly due to lower funding cost.
• The Group will continue to pursue CASA funding to mitigate the impact on the NIM. The NIM for FY2020 is expected to be
between 1.6% to 1.8%.
Quarterly NIM (%)
4Q2018 1Q2019 2Q2019 3Q2019 4Q2019 1Q2020
1.83 1.61 1.63 1.65 1.72 1.86
13

RM Million 1Q2019 4Q2019 1Q2020 QoQ (%) YoY (%)
Stockbroking 16.9 18.5 24.3 31.4 43.8
Portfolio management fees 70.5 81.7 78.9 (3.4) 11.9
Initial service charges 13.9 24.9 29.7 19.3 113.7
Fee income 12.7 15.5 12.3 (20.6) (3.1)
Other Commission Income (fx, trade, BG) 19.2 19.2 18.3 (4.7) (4.7)
Fee and commission expense (30.6) (39.3) (47.2) (20.1) (54.2)
NET FEE AND COMMISSION INCOME 102.6 120.5 116.3 (3.5) 13.4
Net Fee and Commission Income: AHAM continue to sustain its growth, AUM at RM55.3 billion
108.0
102.6
109.7 108.6
120.5116.3
4Q2018 1Q2019 2Q2019 3Q2019 4Q2019 1Q2020
QUARTERLY
14

Gross Credit Cost (bps)
Credit Cost: Priority to Increase the LLR (excluding Regulatory Reserve)
Net Credit Cost (bps)
15
• Increasing credit charges to build up Loan Loss Reserve
• 1Q2020 calculated on annualized basis• Limited Recoveries due to COVID-19
25.0
15.0 17.0
108.0
2017 2018 2019 1Q2020
16.0 8.0 10.0
100.0
2017 2018 2019 1Q2020

RM Million 1Q2019 4Q2019 1Q2020 QoQ (%) YoY%
Personnel cost 193.1 200.6 214.0 6.7 10.8
Promotion & marketing related
expenses17.0 10.4 12.3 18.3 (27.6)
Establishment-related expenses 67.8 64.1 77.1 20.3 13.7
General & administrative expenses 26.4 16.4 28.6 74.4 8.3
TOTAL 304.3 291.5 332.0 13.9 9.1
Cost to Income ratio (%) 64.40 63.36 52.67 (10.69) (11.73)
Operating Expenses: Increased due to Higher Personnel Cost
64.40 63.38 64.54 63.3652.67
1Q2019 2Q2019 3Q2019 4Q2019 1Q2020
16

1Q2019 (%) FY2019 (%) 1Q2020 (%) QoQ (%) YoY (%)
Return on Equity (After Tax) 5.79 5.42 5.34 (0.08) (0.45)
Fee to Income 39.52 40.27 53.50 13.23 13.98
Net Interest Margin 1.61 1.72 1.86 0.14 0.25
Cost to Income 64.40 63.36 52.67 (10.69) (11.73)
CASA Ratio 14.54 19.09 17.95 (1.14) 3.41
LTF Ratio 79.43 84.03 82.50 (1.53) 3.07
Liquidity Coverage 146.79 171.72 141.68 (30.04) (5.11)
Net Stable Funding Ratio 81.19 115.60 114.29 (1.31) 33.10
Gross Impaired Loans Ratio 3.31 3.00 3.11 0.11 (0.20)
Net Impaired Loans Ratio 2.63 2.28 2.37 0.09 (0.26)
LLR (Including RR) 97.39 96.88 96.14 (0.74) (1.25)
LLR (Excluding RR) 55.37 60.29 57.45 (2.84) 19.90
CET 1 Capital Ratio 12.42 14.46 14.25 (0.21) 1.83
Total Capital Ratio 20.76 23.26 23.11 (0.15) 2.35
17
Pro
fita
bilit
yD
ep
os
its
As
se
t
Qu
ali
ty
Capital
Key Ratios

Consumer Banking: Loans
18
RM Billion 1Q2019 4Q2019 1Q2020 QoQ (%) YoY (%)
Mortgage 11.0 11.7 11.8 0.9 7.3
Hire Purchase 12.1 10.7 10.3 (3.7) (14.9)
Credit Card 0.1 0.2 0.2 0.0 100.0
ASB 0.6 0.6 0.5 (16.7) (16.7)
Personal Loans/Financing 1.4 1.4 1.4 0.0 0.0
TOTAL 25.2 24.6 24.2 (1.6) (4.0)
25.2 24.6 24.2
1Q2019 4Q2019 1Q2020
4.0%

Consumer Banking: Mortgage
Total Loan Composition (%)
Mortgage Loans (RM Billions)
19
• Mortgage Loans improved 7.3% YoY to RM11.8 billion as at 1Q2020.
• No change in composition mix YoYPrimary Market,
78%
Secondary Market, 22%
1Q2019 1Q2020
11.011.7 11.8
1Q2019 4Q2019 1Q2020
Primary Market78%
Secondary Market, 22%
7.3%

Consumer Banking: Hire Purchase
• Repayment in HP loan base to RM10.3 billion in March 2020
• HP asset quality remains resilient as reflected in the impaired loan ratio of 0.70%.
HP Portfolio Composition (%)
Hire Purchase (HP) Loans (RM Billions)
National21%
Non-National
79%
PORTFOLIO NET OUTSTANDING
(RM Million)
National cars 2.1
Non-National cars 8.2
20
National19%
Non-National
81%
• Non-national makes e.g. Toyota, Honda, Mazda, Mercedes Benz, BMW
constitutes 79% of HP Portfolio.
1Q2019 1Q2020
12.1
10.6 10.3
1Q2019 4Q2019 1Q2020
14.9%

Consumer Banking: Credit Cards
ENR (RM’Millions)
152.21
179.07 171.34
1Q2019 4Q2019 1Q2020
Total Number of transactions*
113,815
147,815 137,253
1Q2019 4Q2019 1Q2020
*based on average monthly transactions
21
49,035 47,988 48,433
1Q2019 4Q2019 1Q2020
Total Number of Cards in circulation
Transactors vs Revolvers Ratio*
Transactors65%
Revolvers35%
1Q2019
Transactors 61%
Revolvers 39%
1Q2020
*based on no of customer
12.6%
20.6%
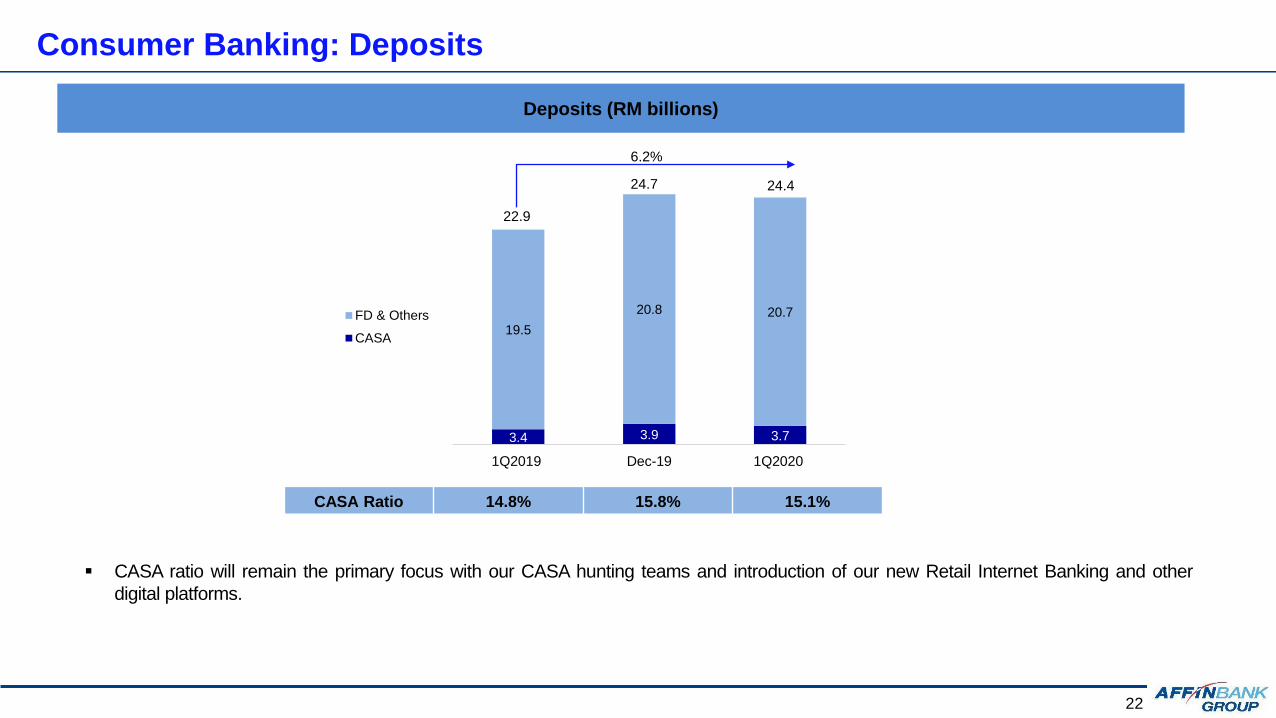
Consumer Banking: Deposits
▪ CASA ratio will remain the primary focus with our CASA hunting teams and introduction of our new Retail Internet Banking and other
digital platforms.
22
CASA Ratio 14.8% 15.8% 15.1%
Deposits (RM billions)
6.2%
3.4 3.9 3.7
19.5
20.8 20.7
1Q2019 Dec-19 1Q2020
FD & Others
CASA
22.9
24.7 24.4

4.1 4.1
4.2
1Q2019 4Q2019 1Q2020
SME Banking: Loans
▪ Loan growth steady at 2.4% YoY with RM1.0 billion loan stocks on the book for SME segment
23
2.4%
Loans (RM billion)
1Q2019 4Q2019 1Q2020 QoQ YoY
Term Loans 2.8 2.7 2.8 3.6% 0.0%
OD 0.7 0.7 0.8 12.5% 12.5%
Trade & others 0.6 0.7 0.6 -16.7% 0.0%
Total 4.1 4.1 4.2 2.4% 2.4%

SME Banking: Deposits
▪ CASA ratio above 48% and will remain the primary focus with our CASA hunting teams and SMEdge series of CASA products
▪ Overall deposit growth will be under pressure due to high cash requirements by SMEs; efforts to be on growing CASA with targeted
campaigns at HNW & high-cash entities
▪ Defending FD base while managing cost of funds
24
CASA Ratio 53.8% 49.0% 48.2%
Deposits (RM billions)
2.82 2.77 2.76
2.42 2.88 2.96
1Q2019 4Q2019 1Q2020
FD/TD
CASA
5.725.655.24
9.2%

Corporate Banking: Loans
• Corporate Banking experienced a decline in asset growth in the 1Q2020 owing to repayments in term loans versus a lower growth in
new disbursements.
25
19.2
17.3 17.1
1Q2019 4Q2019 1Q2020
10.9%
Loans (RM billions)

Corporate Banking: Deposits
• Corporate Banking will unveil a new Corporate Internet Banking, now known as AffinMax in October 2020.
26
Deposits (RM billions)
24.76
15.7
CASA Ratio 8.4% 21.0% 17.9%
22.67
12.4 11.5
2.09
3.32.5
1Q2019 4Q2019 1Q2020
FD CASA
14.0
43.5%
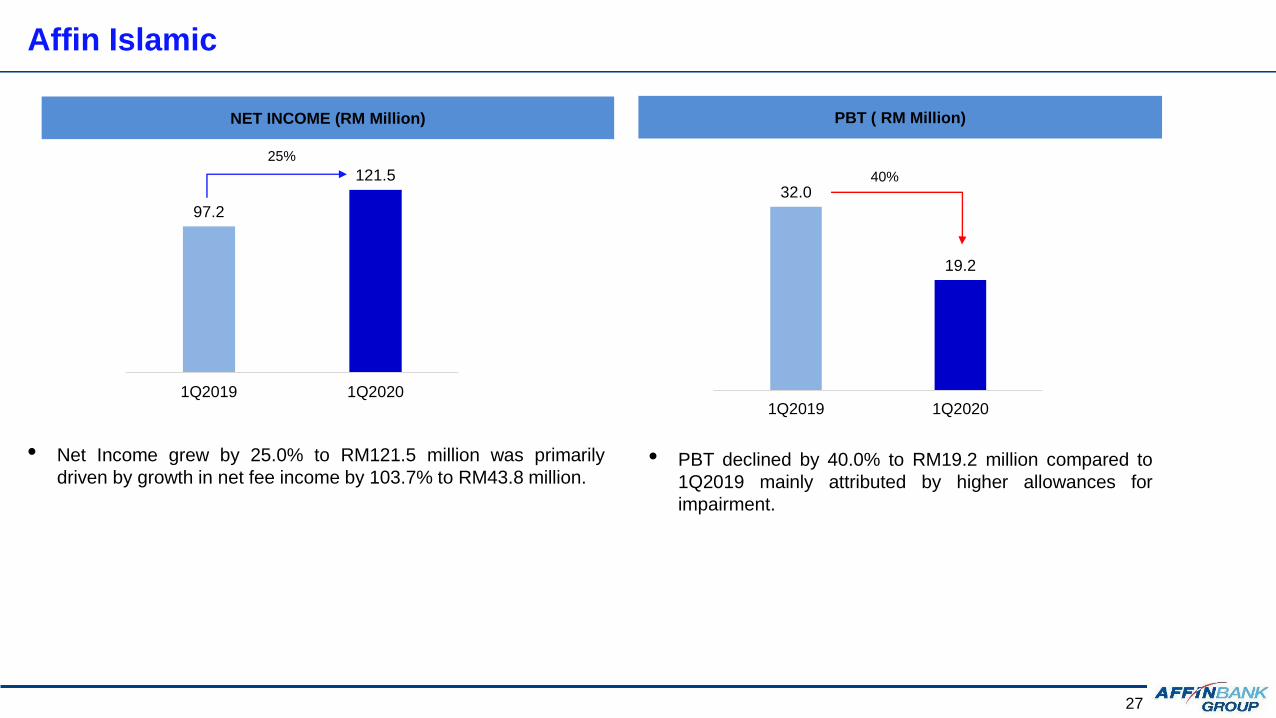
Affin Islamic
• Net Income grew by 25.0% to RM121.5 million was primarily
driven by growth in net fee income by 103.7% to RM43.8 million.
PBT ( RM Million)NET INCOME (RM Million)
32.0
19.2
1Q2019 1Q2020
97.2
121.5
1Q2019 1Q2020
25%
40%
• PBT declined by 40.0% to RM19.2 million compared to
1Q2019 mainly attributed by higher allowances for
impairment.
27

28
Comprehensive Digital Ecosystem a Key Digital Enabler
SME ColonyAppTaPay
New
Retail Internet Banking AffinMax
2019
2019 AffinPay 2019 October 2020
2017

29
Final Remarks
▪ Focusing on Consumer Banking business in particular mortgage
financing and unsecured financing.
▪ SME Banking focusing on targeted customer selection and cross
selling into Consumer Banking.
▪ Building a stronger CASA franchise in Corporate Banking with our
new AffinMax Internet Banking Proposition.
▪ Proactively managing asset quality by focusing on restructuring of
corporate accounts and implementing early warning framework to
ensure timely detection and rehabilitation.
▪ Implemented fast-track transformation journey to provide our
customers an elevated digital platform and improved Customer
Experience.
Loans Growth Flat
Deposits Growth 2-3%
Cost to Income Ratio <60%
Gross Credit Cost ~50bps
2020 GUIDANCE

Appendix

Shareholding Statistics January 2020 – April 2020
LTAT35.33
BHB20.73
BEA23.56
EPF6.82
OTHERS13.56
Substantial Shareholders (%) Foreign Shareholdings (%)
23.56 23.56 23.56 23.56
2.92 2.92 2.86 2.83
JAN FEB MAR APR
BEA Others
JAN
2020
FEB
2020
MAR
2020
APRIL
2020
26.48 26.48 26.42 26.39
30
THANK YOUFor any enquiries, please email [email protected] or call us at
+603-2055-9005 (Investor Relations Department)
Disclaimer. This presentation has been prepared by AFFIN Bank Berhad (the “Company”) for information purposes only and does not purport to contain all the information that may be required to evaluate the
Company or its financial position. No representation or warranty, express or implied, is given by or on behalf of the Company as to the accuracy or completeness of the information or opinions contained in this
presentation. The presentation does not constitute or form part of an offer, solicitation or invitation of any offer, to buy or subscribe for any securities, nor should it or any part of it form the basis of, or be relied in any
connection with, any contract, investment decision or commitment whatsoever. The Company does not accept any liability whatsoever for any loss howsoever arising from any use of this presentation or their
contents or otherwise arising in connection therewith.
Related Documents