ANALYST BRIEFING Jakarta, 14 November 2018 3Q18 PERFORMANCE RESULTS

Welcome message from author
This document is posted to help you gain knowledge. Please leave a comment to let me know what you think about it! Share it to your friends and learn new things together.
Transcript

ANALYST BRIEFING
Jakarta, 14 November 2018
3Q18 PERFORMANCE RESULTS

2
1
2
3
4
INTRODUCTION
OPERATIONAL REVIEW
COMMERCIAL REVIEW
FINANCIAL REVIEW
5 QUESTION & ANSWERS
Agenda

Highlights of 3Q18 and 9M18 results
Total Revenue
Gross Profit Margin
EBIT
EBITDA
Net Income
ASP (USD/ton)
y-y
+22%
0%
+20%
+18%
+15%
+20%
3Q18
606
33%
154
170
95
$88.6
Q-Q
+41%
+6%
+95%
+82%
+113%
+13%
Coal sales
6.4 Mt
Up 1.1Mt
+21% Q-Q
Coal sales
16.1 Mt Down 0.4 Mt
-2% Y-Y
9M18
1,415
30%
321
366
197
$84.2
Unit: US$ million
9M17
1,164
30%
267
310
172
$70.3
2Q18
431
27%
79
93
44
$78.3
3

ITM coal value chain strategy
RESERVES PRODUCTION
4
SHAREHOLDERS VALUE
MARKETING
• Aim for new customer segments
in domestic & SEA markets, e.g.
Vietnam, Myanmar.
• Expand coal trading capacity and
leverage vast network to capture
opportunities in growth market.
• Increase coal trading activities to
provide diverse range of products,
especially medium-low CV coal to
tap the growth market.
• Synergize with Banpu to improve
coal quality through blending.
• Maintain and continue brand
elevation.
• Grow organically (e.g. new mining
methods, exploration activities).
• Expand inorganically focusing on
synergic acquisition around
current operations.
• Focus on premium coal, medium
to high CV, which is increasingly
difficult to source.
• Leverage ITM’s capability and
infrastructure to synergize with
nearby concessions.
• Focus on operational excellence,
productivity improvement, contractor
management and utilize new
technology.
• Optimize infrastructure and logistics
efficiencies (e.g. Trubaindo/ Bharinto
hauling road improvement).
• Review and optimize coal flow
process.
• Expand in-house mining contractor
business.
• Grow fuel business through increase
in 3rd party volume to reach
economics of scale.
Growing synergistic premium
coal reserves
Enhance margins along coal
production value chain
Expand product range, market
and profitability

5
1
2
3
4
INTRODUCTION
OPERATIONAL REVIEW
COMMERCIAL REVIEW
FINANCIAL REVIEW
5 QUESTION & ANSWERS
Agenda

6
East Kalimantan
Bunyut Port
Balikpapan
Palangkaraya
Banjarmasin
Central Kalimantan
South Kalimantan
Samarinda
Jorong Port
INDOMINCO 12.8 Mt
TD.MAYANG TRUBAINDO
4.7 Mt
BHARINTO 2.7 Mt
KITADIN EMBALUT 1.1 Mt
JORONG 1.2 Mt
Operational Summary 2018
2018 TARGET: 22.5 Mt
2014 2015 2016 2017 2018e
Unit: Mt
Indominco
Trubaindo
Bharinto
Kitadin Jorong
2016 2014 2015
YEARLY OUTPUT TREND
2017
29.1 28.5 25.6
22.1
2018e
22.5
4Q17 1Q18 2Q18 3Q18 4Q18e
Unit: Mt
Indominco
Trubaindo
Bharinto
Kitadin Jorong
QUARTERLY OUTPUT TREND
4Q17 1Q18
5.7
4.1
6.4
2Q18
5.2
3Q18
6.8
4Q18e
7
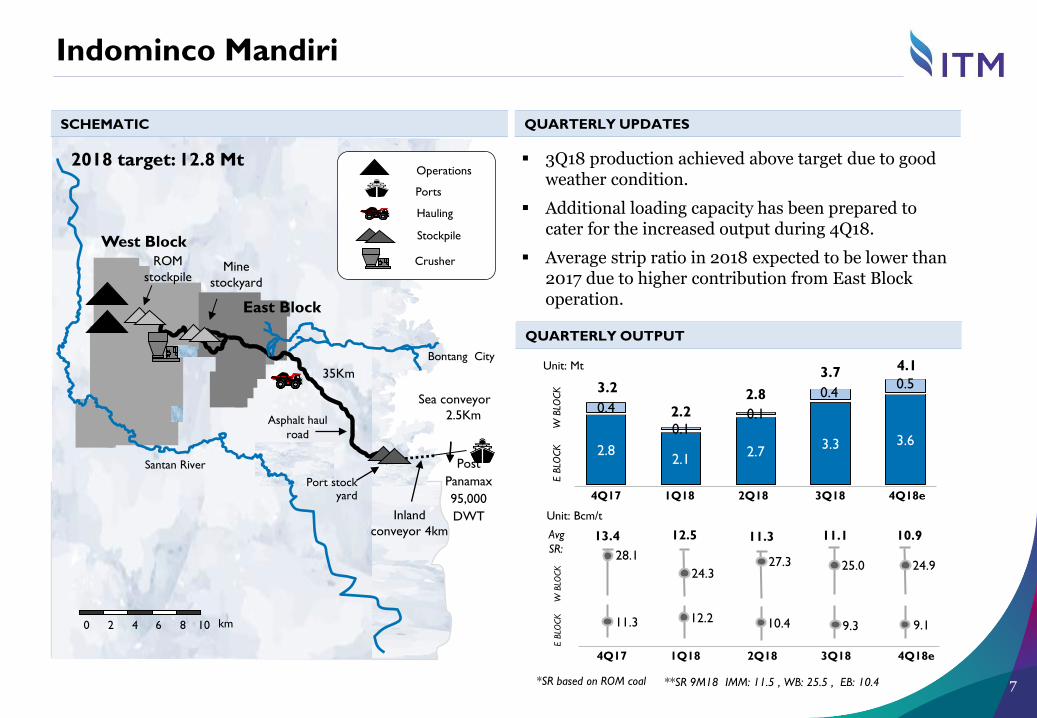
East Block
Santan River
Port stock yard
Bontang City
Asphalt haul
road
2.5Km
35Km
Sea conveyor
Mine
stockyard
Inland
conveyor 4km
0 10 6 8 2 km 4
West Block
Operations
Stockpile
Ports
Hauling
Crusher ROM
stockpile
Post
Panamax
95,000
DWT
3Q18 production achieved above target due to good weather condition.
Additional loading capacity has been prepared to cater for the increased output during 4Q18.
Average strip ratio in 2018 expected to be lower than 2017 due to higher contribution from East Block operation.
SCHEMATIC QUARTERLY UPDATES
QUARTERLY OUTPUT
2018 target: 12.8 Mt
E B
LOCK
W
BLO
CK
E B
LOCK
W
BLO
CK
Unit: Mt
Unit: Bcm/t
Avg
SR:
4Q17 1Q18 2Q18 3Q18 4Q18e
**SR 9M18 IMM: 11.5 , WB: 25.5 , EB: 10.4
2.8 2.1
2.7 3.3 3.6
0.4
0.1 0.1
0.4 0.5 3.2
2.2
2.8
3.7 4.1
4Q17 1Q18 2Q18 3Q18 4Q18e
*SR based on ROM coal
28.1
11.3
13.4
24.3
12.2
12.5
27.3
10.4
11.3
Indominco Mandiri
25.0
9.3
11.1
24.9
9.1
10.9

8
Mahakam
River
South Block 1
(Dayak Besar)
North
Block
40km
Mine to port
ROM
stockpile
Bunyut
Port
0 10 25 15 20 5 km
Product coal conveyor,
stacking,
stockpile
East Kalimantan
Bharinto 60km
south west of
Trubaindo North
Block
South Block 2
(Biangan)
PT. Bharinto
PT. Trubaindo
Operations
Stockpile
Hauling
Barge Port
Trubaindo:
3Q18 production output slightly higher than target.
Continue hauling road improvement activities from Trubaindo to Bharinto area and expected to be completed by end of 2018.
Bharinto:
3Q18 production achieved closed to target.
Additional fleets from mining contractor are being prepared to support future production.
Melak group – Trubaindo and Bharinto
SCHEMATIC QUARTERLY UPDATES
2018 target: TCM 4.7 Mt
BEK 2.7 Mt
TRUBAINDO
TRUBAINDO
BHARINTO
Unit: Mt
Unit: Bcm/t
BHARINTO
4Q17 1Q18 2Q18 3Q18 4Q18e
**SR 9M18 TCM: 12.6 , BEK: 9.5
4Q17 1Q18 2Q18 3Q18 4Q18e
*SR based on ROM coal
1.3 1.0 1.1 1.3 1.3
0.6 0.5 0.7 0.7 0.8
1.9 1.5
1.8 2.0 2.1
QUARTERLY OUTPUT
Avg SR:
10.9
12.2
13.5
10.6
Kedangpahu
River
11.5
10.0
12.7
8.3
PT. TIS
9.8
10.5

9
Balikpapan
Mahakam River
Samarinda to Muara
Berau
Bontang city
Embalut
Embalut Port
to Muara Jawa
ROM
stockpile
Operations
Stockpile
Ports
Hauling
Crusher 0 10 6 8 2 km 4
5km Mine to port
TD. Mayang
East Kalimantan
IMM EB IMM WB
Bontang Port
Kitadin Embalut and Tandung Mayang
SCHEMATIC
2018 target: EMB 1.1 Mt Kitadin Embalut:
3Q18 production output was above the target.
On-going study to optimize coal reserves.
Kitadin Td.Mayang:
Continue mine closure activities including mine rehabilitation.
0.3 0.3 0.3 0.3 0.2
TD
M
EM
B
Unit: Mt
Unit: Bcm/t
**SR 9M18 EMB: 10.1
4Q17 1Q18 2Q18 3Q18 4Q18e
4Q17 1Q18 2Q18 3Q18 4Q18e
*SR based on ROM coal
QUARTERLY UPDATES
QUARTERLY OUTPUT
EM
B
Avg SR:
11.0 11.2 9.5 9.8 12.0

10
0.3 0.3 0.3 0.3 0.3
Coal terminal
Jorong
Java Sea
Haul road
0 10 25 15 20 5 km
20km
Operations
Stockpile
Hauling
Barge Port
Pelaihari
Jorong
SCHEMATIC
2018 target: 1.2 Mt
Unit: Mt
Unit: Bcm/t
4Q17 1Q18 2Q18 3Q18 4Q18e
4Q17 1Q18 2Q18 3Q18 4Q18e
**SR 9M18 JBG: 6.2 *SR based on ROM coal
QUARTERLY UPDATES
QUARTERLY OUTPUT
Avg SR:
5.0 6.1
3Q18 production achieved according to target.
Additional drilling and coal price improvement resulted in potential additional reserves – for better mine closure activities.
6.1 6.5 4.5

11
1
2
3
4
INTRODUCTION
OPERATIONAL REVIEW
COMMERCIAL REVIEW
FINANCIAL REVIEW
5 QUESTION & ANSWERS
Agenda
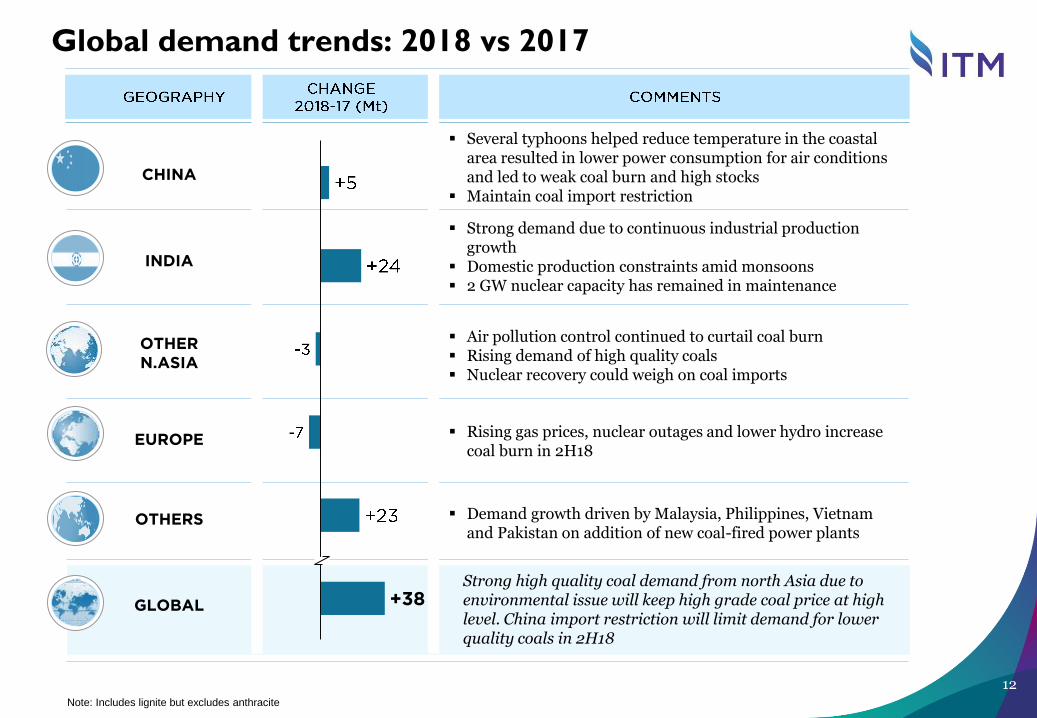
Note: Includes lignite but excludes anthracite
Global demand trends: 2018 vs 2017
12
OTHERS
CHINA
EUROPE
OTHER
N.ASIA
INDIA
GLOBAL +38
Rising gas prices, nuclear outages and lower hydro increase coal burn in 2H18
Demand growth driven by Malaysia, Philippines, Vietnam and Pakistan on addition of new coal-fired power plants
Strong high quality coal demand from north Asia due to environmental issue will keep high grade coal price at high level. China import restriction will limit demand for lower quality coals in 2H18
Air pollution control continued to curtail coal burn Rising demand of high quality coals Nuclear recovery could weigh on coal imports
Several typhoons helped reduce temperature in the coastal area resulted in lower power consumption for air conditions and led to weak coal burn and high stocks
Maintain coal import restriction
Strong demand due to continuous industrial production growth
Domestic production constraints amid monsoons 2 GW nuclear capacity has remained in maintenance
12

Global supply trends: 2018 vs 2017
13
S.AFRICA
INDONESIA
RUSSIA
COLOMBIA
AUSTRALIA
USA
OTHERS
COMMENTS
GLOBAL +32
Government attempts to boost exports to support currency Exports has been driven by seaborne demand, particularly
China, rather than government intervention
High producer discipline continued to tighten high CV market
Strong domestic demand High stocks of lower CV coal at RBCT port Shortage of high quality product
Strong domestic demand constrained availability for export Increase discounted other origin off-spec coals and
strengthen US dollar threaten US export
Production constraints continued to curtail export growth Rainy season will impact production in Q4
Seasonal tightness in rail capacity
Exports from Poland, China and Canada are expected to decline
High quality product is likely to continue to be tight due to limited supply and high producer discipline but supply of lower quality coal is improving
13

China: strong demand amid tight supply
14
3Q18
Strong inland thermal coal demand due to hot weather but coastal demand was not as strong as it was inland due to several typhoons brought lower temperature with them.
Weaker coal burn in coastal area led to high coal stocks at power plants.
Domestic coal production keeps improving although safety monitoring continued.
Environmental protection measures in industrial sector helps to boost power demand.
Tough import control policies and strong demand from non-coastal power plants helped to boost domestic coal prices.
Widened spreads for off-spec coal prices in international market
Outlook
Domestic coal production is expected to continued improve in Q4.
Expected low coal import in Q4 due to lack of import quota.
Stimulus package to offset trade dispute’s negative will boost coal demand.
14

India: robust demand amid supply deficit
15
3Q18
Strong power demand growth due to increasing industrial production.
A dip in supply from nuclear and hydropower led to increased reliance on coal power generation.
Growth in domestic production and despatches can only partially meet the growing demand for coal.
Policies to improve the power sector started to improve load factors at several plants.
• High import demand in non-power sector.
Outlook
State-owned power companies seek imported coal due to inadequate domestic supply.
Supreme Court has agreed to changes in power purchase agreements (PPAs) in Gujarat state for the struggling privately owned coal-fired power utilities, allowing them to increase power tariffs to compensate for higher costs of imported coal.
This should enable the coastal generators to buy significantly more imported coal and ramp up utilization rates at underused plants.
15

16
China 19%
Japan
19%
Philippines
10%
India
14%
Vietnam
Indonesia
12%
5%
4% 2%
JAPAN
PHILIPPINES
THAILAND
INDIA
KOREA CHINA
TAIWAN
ITALY
1.5
INDONESIA OTHERS*
Taiwan
Korea
Italy Others
ITM coal sales 9M18
COAL SALES 9M18 COAL SALES BREAKDOWN BY DESTINATION
Total coal sales 9M18: 16.1 Mt
*) Note: New Zealand, Malaysia, Myanmar
Hongkong
1%
HK
0.2 Mt
0.3 Mt
0.9 Mt
2.2 Mt
3.0 Mt
0.4 Mt
0.7 Mt
3.1 Mt
0.6 Mt
1.9 Mt
1.7 Mt
VIETNAM
0.8 Mt
Bangladesh
2%
BANGLADESH
0.3 Mt
Thaliand
6%
1%
5%

17
90%
8% 2%
TARGET SALES 2018: 24.2 Mt
Contract Status Price Status
Contracted
Indicative coal sales 2018
COAL SALES CONTRACT AND PRICING STATUS
98%
2%
Fixed
Indexed
Unsold Uncontracted
Contracted

Note: * Included post shipment price adjustments as well as traded coal
** The Newcastle Export Index (previously known as the Barlow Jonker Index – BJI)
Unit: US$/ton
ITM ASPs vs thermal coal benchmark prices
ITM ASP VS BENCHMARK PRICES COMMENTS
Monthly NEX
Quarterly ITM ASP
US$88.6/t
US$103.1/t
0
50
100
150
200
2007
2008
2009
2010
2011
2012
2013
2014
2015
2016
2017
Monthly NEX
18
3Q18 ASP firmed up according to strong
market due supply tightness
– ITM ASP: US$88.6/t* (+13% QoQ)
– NEX (Nov 09, 2018)**: US$103.1/t
Market continued strong in 3Q18, however,
price gap between HCV and LCV coal was
widening due a massive flow of lower quality
coal from Indonesia and Chinese import
restriction policy.
Supply tightness continued to be a major
factor on benchmark coal price, while
Chinese policy remains a major influence.

19
1
2
3
4
INTRODUCTION
OPERATIONAL REVIEW
COMMERCIAL REVIEW
FINANCIAL REVIEW
5 QUESTION & ANSWERS
Agenda

20
256 247 285
146 126
212
56 62
108
20 21
27
10 18
10
3Q17 2Q18 3Q18
415 431
606
Unit: US$ million
Sales Revenue
+41% QoQ
+46% YoY
Indominco +16% (QoQ) ; +11%(YoY)
Trubaindo +68% (QoQ) ; +45% (YoY)
Bharinto +74% (QoQ) ; +95% (YoY)
Kitadin +30% (QoQ) ; +40% (YoY)
Jorong -42% (QoQ) ; 0% (YoY)
20
71 Others +67% (QoQ) ; +259% (YoY)
42

21
Average Gross Margin
3Q17 2Q18 3Q18
27
47% 49% 60%
Kitadin
20 21
3Q17 2Q18 3Q18
Bharinto
62
108
41%
49%
56
50%
3Q17 2Q18 3Q183Q17 2Q18 3Q18
Indominco
32% 35% 35%
285
247 256
3Q17 2Q18 3Q18
32% 34%
46%
212
Trubaindo
146
126
3Q17 2Q18 3Q18
45%
38% 45%
606
ITM Consolidated
415 431
Unit : US$ Million
GPM* (%)
Revenue
Note: Excluding royalty
Jorong
26% 24%
10 18
10
38%

22
45.1
Unit: US$/Ltr
3Q17 4Q17 1Q18 2Q18 3Q18
Unit: Bcm/t
Avg. 9M17: $0.52/ltr
Avg. 9M18: $0.68/ltr
Unit: US$/t
3Q17 4Q17 1Q18 2Q18 3Q18
Cost Analysis
WEIGHTED AVERAGE STRIP RATIO
FUEL PRICE TOTAL COST*
3Q17 4Q17 1Q18 2Q18 3Q18
Unit: US$/t Avg. 9M17: $40.3/t
Avg. 9M18: $50.2/t
PRODUCTION COST
12.3
0.50
12.1
Avg. 9M17: 10.9
Avg. 9M18: 11.1
40.5
12.0
50.8
0.57
0.64
44.5
10.8
0.69
43.7
Avg. 9M17: $53.8/t
Avg. 9M18: $65.9/t
* Cost of Goods Sold + Royalty + SG&A
52.9 48.0
Coal
Others
10.8
0.72
50.2
44.8
3Q17 4Q17 1Q18 2Q18 3Q18
54.6
61.7 62.8 63.3
Others
61.9 65.5 66.3 65.8
Coal 59.3

23
EBITDA
Unit: US$ million
3Q17 2Q18 3Q18
170
54
65
35
14
123
55
30
20
8 1 4
0.2 6
+82% QoQ
+39% YoY
Indominco +22% (QoQ) ; -3%(YoY)
Trubaindo +218% (QoQ) ; +114% (YoY)
Bharinto +137% (QoQ) ; +78% (YoY)
Kitadin +64% (QoQ) ; +82% (YoY)
Jorong -76% (QoQ) ; -85% (YoY)
Others +17% (QoQ) ; +42 (YoY)
93
44
20
15
8 1 5

24
Net Income
3Q17 2Q18 3Q18
Unit: US$ million
32
39
26
8
32
13
13
5 1
95
67
(1) (3)
+113% QoQ
+42% YoY
Indominco +34% (QoQ) ; +1%(YoY)
Trubaindo +205% (QoQ) ; +205% (YoY)
Bharinto +138% (QoQ) ; +100 % (YoY)
Kitadin +107% (QoQ) ; +74% (YoY)
Jorong -100% (QoQ) ; n.a (YoY) Others 0%(QoQ) ; n.m (YoY)
22
13
10
4 1
44
(3) (0.2)

25
Net Gearing (%)
Net D/E (times)
Unit: US$ million
2015 2014
226
268
Unit: US$ million
0
2014
0 0
2015 2016
0
2017
0
3Q18
2016
328
Balance Sheet
KEY RATIOS CASH POSITION
DEBT POSITION
2015
(0.32)
(32%)
2014
(0.26)
(26%)
(0.36)
(36%)
2016
(0.39)
(39%)
2017 2017
374
(0.35)
(35%)
3Q18 3Q18
351

26
2018 Capital Expenditure Plan
Units: US$ million
4.5
Realized up to Sep 2018
2018 Capex plan
16.0
20.8
22.7
107.1
38.8
11.4
2.9
5.9
0.1
40.0
18.4
Indominco
Trubaindo
Bharinto
Jorong
TRUST
ITM Consolidated

27
Thank you Question & Answer

28
Appendices
29
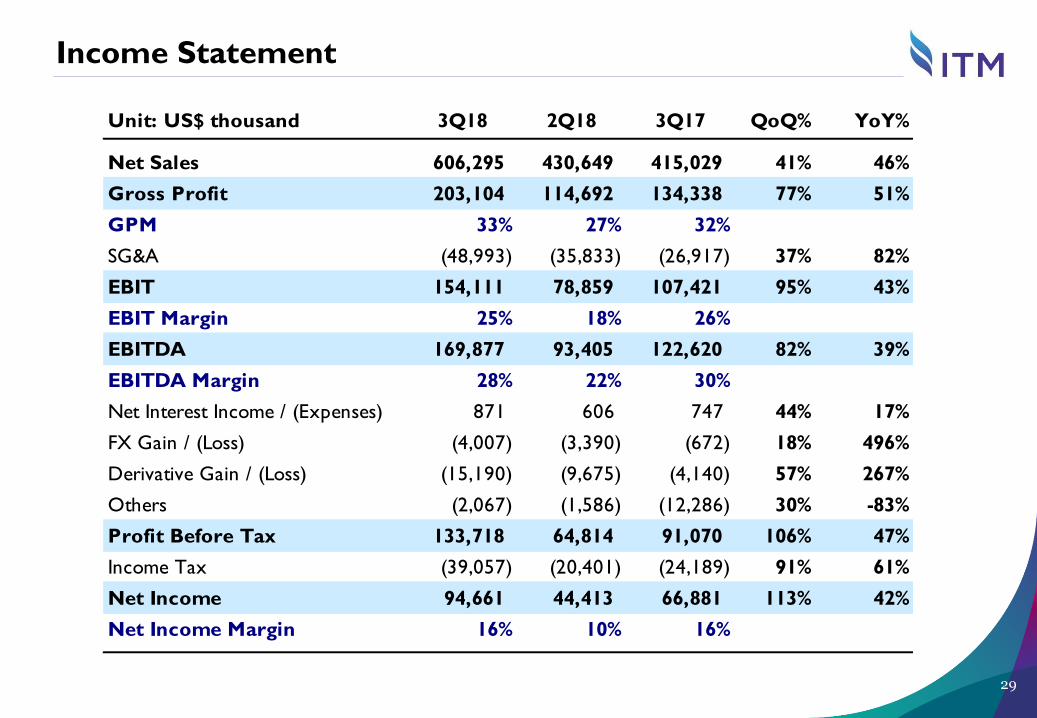
Income Statement
Unit: US$ thousand 3Q18 2Q18 3Q17 QoQ% YoY%
Net Sales 606,295 430,649 415,029 41% 46%
Gross Profit 203,104 114,692 134,338 77% 51%
GPM 33% 27% 32%
SG&A (48,993) (35,833) (26,917) 37% 82%
EBIT 154,111 78,859 107,421 95% 43%
EBIT Margin 25% 18% 26%
EBITDA 169,877 93,405 122,620 82% 39%
EBITDA Margin 28% 22% 30%
Net Interest Income / (Expenses) 871 606 747 44% 17%
FX Gain / (Loss) (4,007) (3,390) (672) 18% 496%
Derivative Gain / (Loss) (15,190) (9,675) (4,140) 57% 267%
Others (2,067) (1,586) (12,286) 30% -83%
Profit Before Tax 133,718 64,814 91,070 106% 47%
Income Tax (39,057) (20,401) (24,189) 91% 61%
Net Income 94,661 44,413 66,881 113% 42%
Net Income Margin 16% 10% 16%

30
Income Statement
Unit: US$ thousand 9M18 9M17 YoY%
Net Sales 1,415,191 1,163,813 22%
Gross Profit 428,849 346,881 24%
GPM 30% 30%
SG&A (108,176) (79,783)
EBIT 320,673 267,098 20%
EBIT Margin 23% 23%
EBITDA 365,534 310,273 18%
EBITDA Margin 26% 27%
Net Interest Income / (Expenses) 2,299 2,050
FX Gain / (Loss) (9,776) 360
Derivative Gain / (Loss) (24,969) 426
Others (7,116) (19,779)
Profit Before Tax 281,111 250,155 12%
Income Tax (83,940) (77,983)
Net Income 197,171 172,172 15%
Net Income Margin 14% 15%

31
11 Mt 187Mt
ITM Structure
ITMG
65%
PT Indominco
Mandiri
(CCOW Gen I)
PT Trubaindo Coal
Mining
(CCOW Gen II)
PT Kitadin-
Embalut
(IUP)
PT Jorong Barutama
Greston
(CCOW Gen II)
PT Indo Tambangraya Megah Tbk.
99.99% 99.99% 99.99% 99.00%
Banpu
Public 35%*
East Kalimantan East Kalimantan South Kalimantan
INDONESIAN STOCK EXCHANGE
IPO 18th Dec 2007
6,100-6,500 kcal/kg 5,600-6,200 kcal/kg 5,400-5,600 kcal/kg 4,300-4,400 kcal/kg
3.4 Mt 0.9 Mt 0.8 Mt
PT Bharinto
Ekatama
(CCOW Gen III)
99.00%
East /
Central Kalimantan
6,100-6,500 kcal/kg
1.9 Mt
East Kalimantan
684 Mt
62 Mt
Resources
Reserves
384 Mt
35 Mt
101 Mt
3 Mt
417 Mt
134 Mt
40 Mt
99.99%
PT Tambang Raya
Usaha Tama
Mining Services
99.99%
Jakarta Office
PT ITM Indonesia Trading
Jakarta Office
Exp: Mar 2028 Exp: Feb 2035 Exp: May 2035 Exp: Jun 2041 Exp: Feb 2022
PT ITM Energi Utama Power Investment
PT ITM Batubara Utama Coal Investment
99.99%
99.99%
Jakarta Office
Jakarta Office
5 Mt
TRUST Indominco Trubaindo Embalut Bharinto Jorong
IEU
IBU
Note: Updated Coal Resources and Reserves as of 31 Dec 2017 based on estimates prepared by Competent Persons
(consider suitably experienced under the JORC Code) and deducted from coal sales volume in 9M18.
* : ITM own 2.95% from share buyback program
PT ITM Banpu Power Power Investment
70.00%
Jakarta Office
IBP
8.7 Mt
ITMI
GEM
PT GasEmas Fuel Procurement
Jakarta Office
75.00%
Output 9M18:
PT Tepian Indah
Sukses
(IUP)
70.00%
East Kalimantan
6,400 kcal/kg
Exp: Apr 2029
5 Mt
TIS
99.99%
Central Kalimantan
5,500 kcal/kg
77 Mt
NPR
PT Nusa Persada
Resources
(IUP)
Exp: May 2033
NTU
PT Nusantara Timur Unggul Logistics Services Jakarta Office
33.34%
PT Energi Batubara Perkasa Coal Trading Jakarta Office
EBP
99.99%
Related Documents