A Shaky Foundation Missouri Underfunding the School Formula Fiscal Year 2014: 2013-2014 School Year Missouri is failing to invest properly in schools in every region of the state, undermining our state’s commitment to prosperity and opportunity by shortchanging students in every corner of the state. An analysis of required K-12 school funding levels in Missouri shows that Missouri is underfunding its K-12 schools by $656 million statewide, nearly 20 percent below the required level. Very few parts of the state have been spared with nearly every county in Missouri having at least one school district that is $700 or more short of the required funding level per student. 1 On a per student basis, the shortfall is about $700 if applied equally throughout the state. Yet, actual shortfalls vary widely between counties, and even between school districts in the same county. So although the shortfall in funding is hurting counties throughout the state, it tends to be worse in rural areas compared to schools within Missouri’s large cities of Kansas City and St. Louis. Key Findings on Counties: • As shown in the map, schools in 57 of Missouri’s 115 counties, nearly one out of every two counties in the state, are underfunded by an average of $800/student or more. • County shortfalls average from a low of $199/ student in Camden County to a high of $967/ student in Pulaski County. • Schools in 106 of Missouri’s 115 counties (including the city of St. Louis) are underfunded by the foundation formula standard an average of $500 or more per student this year. • 31 counties, more than one of every four, have at least one school district that is underfunded by $900 or more per student this year. 2 In 1 of 2 counties, schools are underfunded by an average of $800 or more per student Key Findings on School Districts: County averages can mask the impact of the underfunded formula throughout the state. Evaluating the district level impact shows that even larger levels of underfunding per district is more prevalent than not. The data indicate that: • Nearly 2 out of every 3 of Missouri’s school districts are underfunded by $800 or more per student in the current year (304 of 520 school districts). • While only 15 school districts (3 percent) are underfunded by $100 or less per student, 72 (14 percent, or one of every seven districts) are underfunded by more than $900 per student. 1 Only five counties (Holt, Knox, Nodaway, Worth and St. Louis City) do not contain a district that is underfunded by $700 per student or more. 2 ese include the counties of Barry, Bates, Boone, Caldwell, Cass, Christian, Clay, Clinton, Douglas, Franklin, Greene, Iron, Jackson, Jasper, Jefferson, Lincoln, Newton, Ozark, Pettis, Polk, Pulaski, Ray, Ripley, St. Charles, Stone, Sullivan, Texas, Warren, Washington, Webster and Wright.

Welcome message from author
This document is posted to help you gain knowledge. Please leave a comment to let me know what you think about it! Share it to your friends and learn new things together.
Transcript

A Shaky FoundationMissouri Underfunding the School FormulaFiscal Year 2014: 2013-2014 School YearMissouri is failing to invest properly in schools in every region of the state, undermining our state’s commitment to prosperity and opportunity by shortchanging students in every corner of the state.An analysis of required K-12 school funding levels in Missouri shows that Missouri is underfunding its K-12 schools by $656 million statewide, nearly 20 percent below the required level. Very few parts of the state have been spared with nearly every county in Missouri having at least one school district that is $700 or more short of the required funding level per student.1
On a per student basis, the shortfall is about $700 if applied equally throughout the state. Yet, actual shortfalls vary widely between counties, and even between school districts in the same county. So although the shortfall in funding is hurting counties throughout the state, it tends to be worse in rural areas compared to schools within Missouri’s large cities of Kansas City and St. Louis.
Key Findings on Counties:• As shown in the map, schools in 57 of Missouri’s
115 counties, nearly one out of every two counties in the state, are underfunded by an average of $800/student or more.
• County shortfalls average from a low of $199/student in Camden County to a high of $967/student in Pulaski County.
• Schools in 106 of Missouri’s 115 counties (including the city of St. Louis) are underfunded by the foundation formula standard an average of $500 or more per student this year.
• 31 counties, more than one of every four, have at least one school district that is underfunded by $900 or more per student this year.2
In 1 of 2 counties, schools are underfunded by an average of $800 or more per student Key Findings on School Districts:
County averages can mask the impact of the underfunded formula throughout the state. Evaluating the district level impact shows that even larger levels of underfunding per district is more prevalent than not.
The data indicate that:
• Nearly 2 out of every 3 of Missouri’s school districts are underfunded by $800 or more per student in the current year (304 of 520 school districts).
• While only 15 school districts (3 percent) are underfunded by $100 or less per student, 72 (14 percent, or one of every seven districts) are underfunded by more than $900 per student.
1Only five counties (Holt, Knox, Nodaway, Worth and St. Louis City) do not contain a district that is underfunded by $700 per student or more. 2These include the counties of Barry, Bates, Boone, Caldwell, Cass, Christian, Clay, Clinton, Douglas, Franklin, Greene, Iron, Jackson, Jasper, Jefferson, Lincoln, Newton, Ozark, Pettis, Polk, Pulaski, Ray, Ripley, St. Charles, Stone, Sullivan, Texas, Warren, Washington, Webster and Wright.
Foundation Formula Intended to Ensure Adequate Funding to Meet Educational Standards
Missouri’s “foundation formula” was adopted by state lawmakers in 2005. Based on a per-student level of funding, the standard was meant to ensure that each school district in the state had adequate funding to meet educational standards, regardless of the district’s ability to generate local revenue from property taxes and other sources.
The formula was designed to be implemented over a number of years and be fully operational by 2013. However, since 2010, due to a drop in revenue brought on by the Great Recession, funding for the formula has fallen below its required levels every year. Funding for the foundation formula is currently $3.075 billion, and 35 percent of Missouri’s general revenue fund is dedicated to K-12 education.
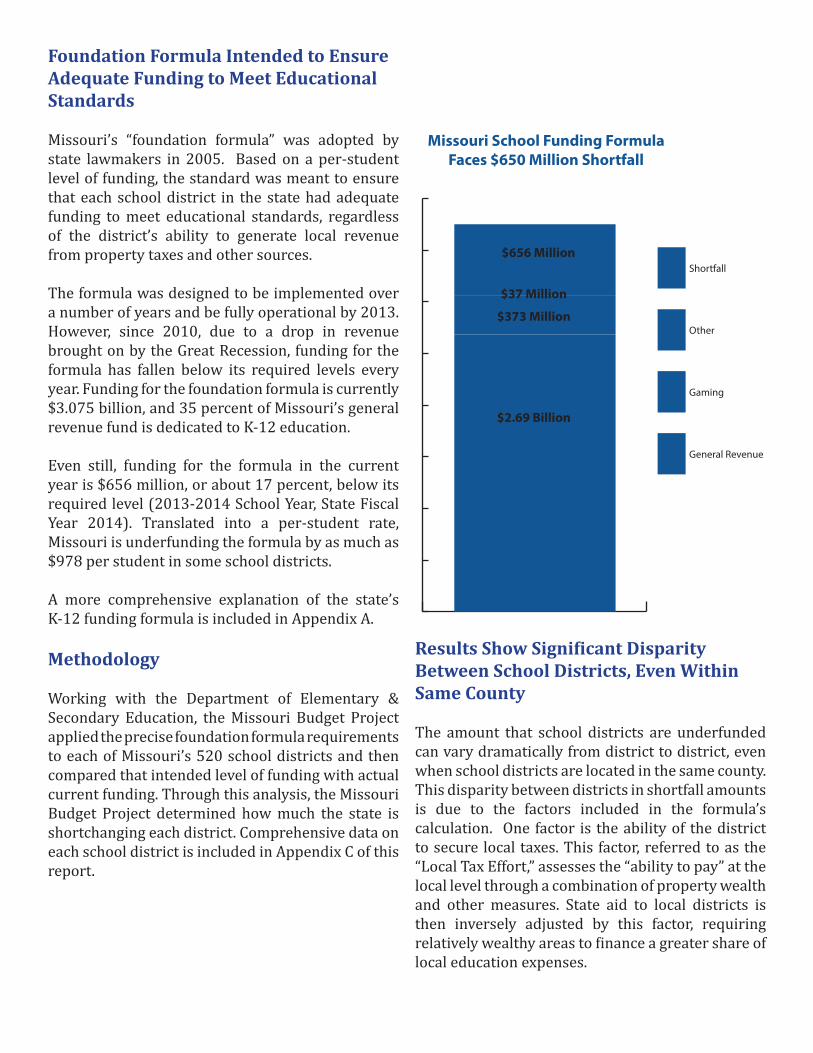
Even still, funding for the formula in the current year is $656 million, or about 17 percent, below its required level (2013-2014 School Year, State Fiscal Year 2014). Translated into a per-student rate, Missouri is underfunding the formula by as much as $978 per student in some school districts.
A more comprehensive explanation of the state’s K-12 funding formula is included in Appendix A.
Methodology
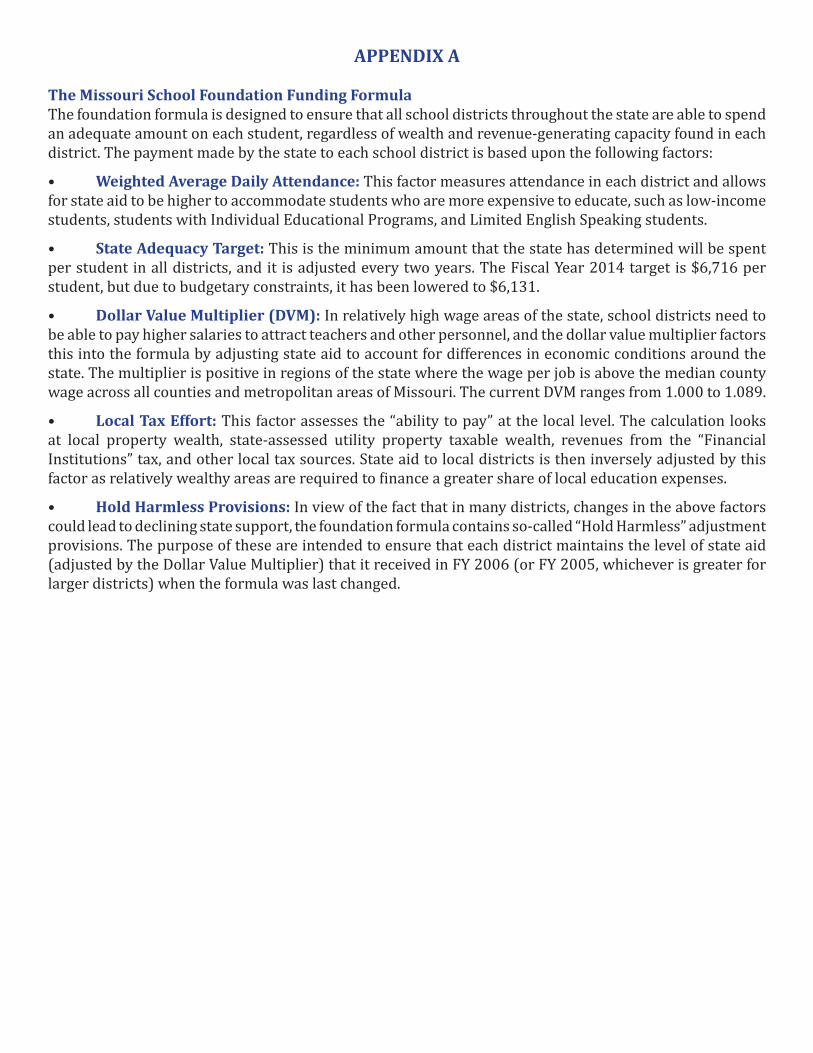
Working with the Department of Elementary & Secondary Education, the Missouri Budget Project applied the precise foundation formula requirements to each of Missouri’s 520 school districts and then compared that intended level of funding with actual current funding. Through this analysis, the Missouri Budget Project determined how much the state is shortchanging each district. Comprehensive data on each school district is included in Appendix C of this report.
ResultsShowSignificantDisparityBetween School Districts, Even Within Same County
The amount that school districts are underfunded can vary dramatically from district to district, even when school districts are located in the same county. This disparity between districts in shortfall amounts is due to the factors included in the formula’s calculation. One factor is the ability of the district to secure local taxes. This factor, referred to as the “Local Tax Effort,” assesses the “ability to pay” at the local level through a combination of property wealth and other measures. State aid to local districts is then inversely adjusted by this factor, requiring relativelywealthyareastofinanceagreatershareoflocal education expenses.
Shortfall
Other
Gaming
General Revenue
Missouri School Funding Formula Faces $650 Million Shortfall
$2.69 Billion
$373 Million
$37 Million
$656 Million

The county with the lowest level of underfunding is Camden, at $199 on average per student. However, thereissignificantdisparity between the school districts in that county, demonstrating that the county average shortfall may not provide a full picture of funding needs. While the Camdenton R-III school district is underfunded by just $74 per student, the Stoutland R-II school district is underfunded by $871 per student, one of the highest levels of underfunding in the state.
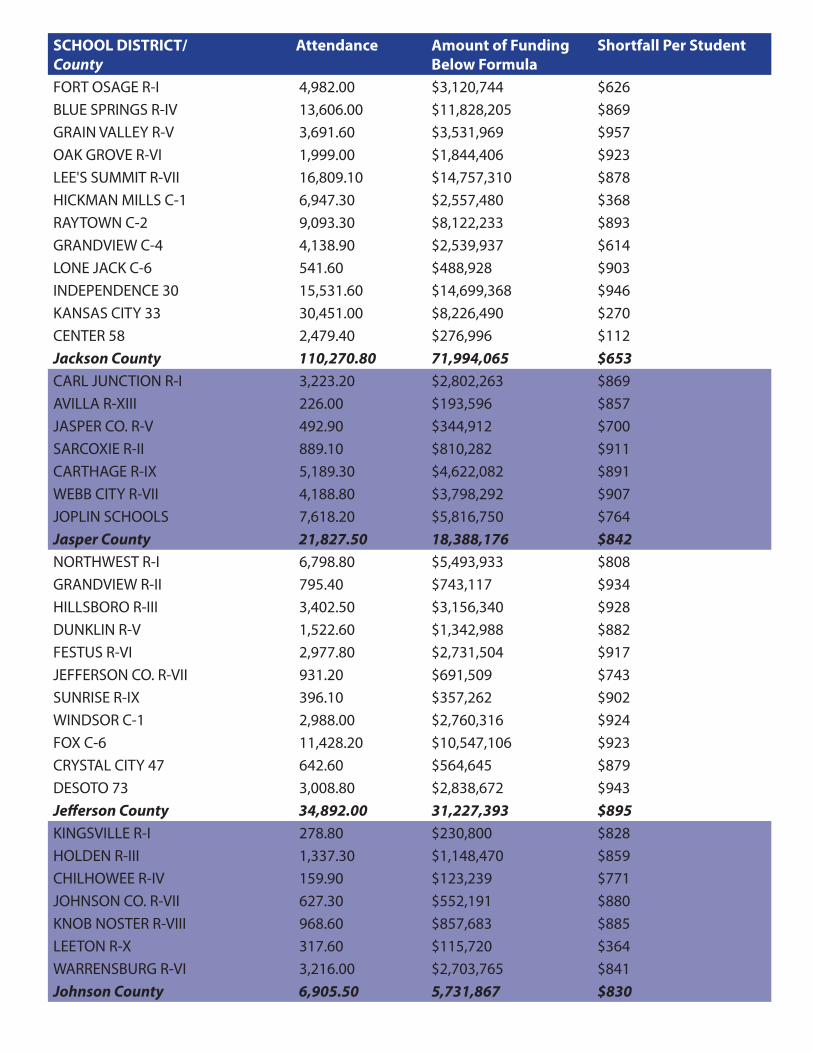
One of the clearest pictures of the disparity that can exist between funding levels of particular school districts within the same county is perhaps St. Louis County. The county average of underfunding is $512 per student. However, while the Bayless School District is underfunded by $876/student (one of the highest levels of underfunding in the entire state) the Clayton School District is underfunded by just $34 per student, one of the lowest levels statewide.
Similarly, Jackson County has a wide spread between its school districts. Although Grain Valley R-V schools are underfunded by $957 per student, the Center 58 School District is underfunded by an amount equaling $112 per student.
In some counties, however, the average amount of underfunding is consistently indicative of funding needs in schools throughout the county. For example, Pulaski County has the highest level of underfunding, averaging $967 per student. The six school districts within Pulaski County range from being underfunded by $940 - $975 per student, or fairly close to the county average.
St. Louis CountySchool District Shortfall Per
StudentHAZELWOOD $854 FERGUSON-FLORISSANT R-II
$800
PATTONVILLE $56 ROCKWOOD R-VI $747 KIRKWOOD R-VII $38 LINDBERGH $43 MEHLVILLE R-IX $738 PARKWAY C-2 $38 AFFTON 101 $724 BAYLESS $876 BRENTWOOD $36 CLAYTON $34 HANCOCK PLC $562 JENNINGS $443 LADUE $39 MAPLEWOOD-RCHMND HGHTS
$82
NORMANDY $396 RITENOUR $874 RIVERVIEW GARDENS
$455
UNIVERSITY CITY
$151
VALLEY PARK $714 WEBSTER GRVES $730 SPECL. SCH. DST. $466 St. Louis County $512
Camden CountySchool District Shortfall Per
Student
STOUTLAND R-II $871 CAMDENTON R-III
$74
CLIMAX SPRINGS R-IV
$79
MACKS CREEK R-V
$819
Camden County
$199
Jackson CountySchool District Shortfall Per
Student
FORT OSAGE R-I $626 BLUE SPRINGS R-IV
$869
GRAIN VALLEY R-V
$957
OAK GROVE R-VI $923 LEE'S SUMMIT R-VII
$878
HICKMAN MILLS C-1
$368
RAYTOWN C-2 $893 GRANDVIEW C-4 $614 LONE JACK C-6 $903 INDEPENDENCE 30
$946
KANSAS CITY 33 $270 CENTER 58 $112 Jackson County $653
Pulaski CountySchool District Shortfall Per
Student
SWEDEBORG R-III
$949
RICHLAND R-IV $952 LAQUEY R-V $970 WAYNESVILLE R-VI
$975
DIXON R-I $940 CROCKER R-II $959 Pulaski County $967

Conclusion
The vast majority of school districts throughout Missouri have been significantly hurt by Missouri’sinability to fully fund the state’s education funding formula, which is key to our kids receiving the world-class education they need to compete in today’s global economy. Missouri can’t afford to further erode its tax base with tax cuts that will make it even harder to invest in Missouri schools.
APPENDIX A
The Missouri School Foundation Funding FormulaThe foundation formula is designed to ensure that all school districts throughout the state are able to spend an adequate amount on each student, regardless of wealth and revenue-generating capacity found in each district. The payment made by the state to each school district is based upon the following factors:
• Weighted Average Daily Attendance: This factor measures attendance in each district and allows for state aid to be higher to accommodate students who are more expensive to educate, such as low-income students, students with Individual Educational Programs, and Limited English Speaking students.
• State Adequacy Target: This is the minimum amount that the state has determined will be spent per student in all districts, and it is adjusted every two years. The Fiscal Year 2014 target is $6,716 per student, but due to budgetary constraints, it has been lowered to $6,131.
• Dollar Value Multiplier (DVM): In relatively high wage areas of the state, school districts need to be able to pay higher salaries to attract teachers and other personnel, and the dollar value multiplier factors this into the formula by adjusting state aid to account for differences in economic conditions around the state. The multiplier is positive in regions of the state where the wage per job is above the median county wage across all counties and metropolitan areas of Missouri. The current DVM ranges from 1.000 to 1.089.
• Local Tax Effort: This factor assesses the “ability to pay” at the local level. The calculation looks at local property wealth, state-assessed utility property taxable wealth, revenues from the “Financial Institutions” tax, and other local tax sources. State aid to local districts is then inversely adjusted by this factorasrelativelywealthyareasarerequiredtofinanceagreatershareoflocaleducationexpenses.
• Hold Harmless Provisions: In view of the fact that in many districts, changes in the above factors could lead to declining state support, the foundation formula contains so-called “Hold Harmless” adjustment provisions. The purpose of these are intended to ensure that each district maintains the level of state aid (adjusted by the Dollar Value Multiplier) that it received in FY 2006 (or FY 2005, whichever is greater for larger districts) when the formula was last changed.

72 School Districts Underfunded by $900+ per StudentSchool District Shortfall per Student CountyEXETER R-VI $914 BarryWHEATON R-III $914 BarryPURDY R-II $914 BarrySOUTHWEST R-V $912 BarryADRIAN R-III $943 BatesRICH HILL R-IV $933 BatesHALLSVILLE R-IV $915 BooneMIRABILE C-1 $943 CaldwellPOLO R-VII $941 CaldwellHAMILTON R-II $938 CaldwellARCHIE R-V $938 CassBELTON 124 $925 CassSHERWOOD CASS R-VIII $922 CassPLEASANT HILL R-III $919 CassRAYMORE-PECULIAR R-II $915 CassCLEVER R-V $934 ChristianSPARTA R-III $927 ChristianNIXA PUBLIC SCHOOLS $905 ChristianSPOKANE R-VII $901 ChristianOZARK R-VI $901 ChristianLIBERTY 53 $941 ClaySMITHVILLE R-II $910 ClayCAMERON R-I $934 ClintonPLAINVIEW R-VIII $906 DouglasSPRING BLUFF R-XV $935 FranklinST. CLAIR R-XIII $926 FranklinSULLIVAN C-2 $919 FranklinNEW HAVEN $902 FranklinREPUBLIC R-III $906 GreeneARCADIA VALLEY R-II $901 IronGRAIN VALLEY R-V $957 JacksonINDEPENDENCE 30 $946 JacksonOAK GROVE R-VI $923 JacksonLONE JACK C-6 $903 JacksonSARCOXIE R-II $911 JasperWEBB CITY R-VII $907 Jasper
APPENDIX B

School District Shortfall per Student CountyDESOTO 73 $943 JeffersonGRANDVIEW R-II $934 JeffersonHILLSBORO R-III $928 JeffersonWINDSOR C-1 $924 JeffersonFOX C-6 $923 JeffersonFESTUS R-VI $917 JeffersonSUNRISE R-IX $902 JeffersonELSBERRY R-II $948 LincolnWINFIELD R-IV $941 LincolnTROY R-III $937 LincolnSILEX R-I $913 LincolnEAST NEWTON CO. R-VI $910 NewtonWESTVIEW C-6 $910 NewtonBAKERSFIELD R-IV $901 OzarkLA MONTE R-IV $901 PettisFAIR PLAY R-II $917 PolkPLEASANT HOPE R-VI $912 PolkWAYNESVILLE R-VI ($ $975 PulaskiLAQUEY R-V $970 PulaskiCROCKER R-II $959 PulaskiRICHLAND R-IV $952 PulaskiSWEDEBORG R-III $949 PulaskiDIXON R-I $940 PulaskiLAWSON R-XIV $918 RayNAYLOR R-II $926 RipleyRIPLEY CO. R-III $904 RipleyWENTZVILLE R-IV $904 St. CharlesCRANE R-III $904 StoneMILAN C-2 $908 SullivanRAYMONDVILLE R-VII $905 TexasWARREN CO. R-III $918 WarrenPOTOSI R-III ($978) $978 WashingtonKINGSTON K-14 $974 WashingtonRICHWOODS R-VII $966 WashingtonFORDLAND R-III $908 WebsterNORWOOD R-I $904 Wright

SCHOOL DISTRICT/County
Attendance Amount of Funding Below Formula
Shortfall Per Student
ADAIR CO. R-I 273.40 $85,802 $314 KIRKSVILLE R-III 2,556.40 $2,057,231 $805 ADAIR CO. R-II 221.20 $72,996 $330 Adair County 3,051.00 $2,216,029 $726 NORTH ANDREW CO. R-VI 356.60 $149,484 $419 AVENUE CITY R-IX 186.90 $156,563 $838 SAVANNAH R-III 2,274.10 $1,958,633 $861 Andrew County 2,817.60 2,264,679 $804 TARKIO R-I 314.40 $126,749 $403 ROCK PORT R-II 339.10 $238,128 $702 FAIRFAX R-III 144.70 $28,923 $200 Atchison County 798.20 393,800 $493 COMMUNITY R-VI 284.60 $73,370 $258 VAN-FAR R-I 628.10 $517,681 $824 MEXICO 59 2,446.70 $2,003,071 $819 Audrain County 3,359.40 2,594,122 $772 WHEATON R-III 496.40 $453,557 $914 SOUTHWEST R-V 866.20 $790,222 $912 EXETER R-VI 376.90 $344,536 $914 CASSVILLE R-IV 1,846.90 $1,537,763 $833 PURDY R-II 749.60 $684,827 $914 SHELL KNOB 78 207.80 $30,065 $145 MONETT R-I 2,694.10 $2,376,712 $882 Barry County 7,237.90 6,217,684 $859 LIBERAL R-II 487.90 $409,051 $838 GOLDEN CITY R-III 253.40 $168,798 $666 LAMAR R-I 1,372.40 $1,111,738 $810 Barton County 2,113.70 1,689,587 $799 MIAMI R-I 184.90 $69,977 $378 BALLARD R-II 154.60 $57,623 $373 ADRIAN R-III 715.30 $674,329 $943 RICH HILL R-IV 451.10 $420,807 $933 HUME R-VIII 147.80 $91,223 $617 HUDSON R-IX 74.90 $64,402 $860 BUTLER R-V 1,029.80 $919,123 $893 Bates County 2,758.40 2,297,484 $833
APPENDIX C

SCHOOL DISTRICT/County
Attendance Amount of Funding Below Formula
Shortfall Per Student
LINCOLN R-II 513.10 $418,632 $816 WARSAW R-IX 1,433.20 $1,139,445 $795 COLE CAMP R-I 759.30 $638,676 $841 Benton County 2,705.60 2,196,754 $812 MEADOW HEIGHTS R-II 558.40 $489,443 $877 LEOPOLD R-III 183.90 $165,398 $899 ZALMA R-V 249.60 $222,176 $890 WOODLAND R-IV 961.90 $853,569 $887 Bollinger County 1,953.80 1,730,586 $886 SOUTHERN BOONE CO. R-I 1,463.10 $1,298,564 $888 HALLSVILLE R-IV 1,352.80 $1,237,697 $915 STURGEON R-V 454.60 $284,381 $626 CENTRALIA R-VI 1,352.10 $1,179,717 $873 HARRISBURG R-VIII 555.30 $492,812 $887 COLUMBIA 93 17,023.30 $13,663,135 $803 Boone County 22,201.20 18,156,304 $818 EAST BUCHANAN CO. C-1 741.90 $536,045 $723 MID-BUCHANAN CO. R-V 665.00 $558,962 $841 BUCHANAN CO. R-IV 300.40 $133,215 $443 ST. JOSEPH 12,282.20 $10,361,221 $844 Buchanan County 13,989.50 11,589,443 $828 NEELYVILLE R-IV 648.80 $574,904 $886 POPLAR BLUFF R-I 5,246.50 $4,423,120 $843 TWIN RIVERS R-X 1,006.90 $876,272 $870 Butler County 6,902.20 5,874,296 $851 BRECKENRIDGE R-I 89.20 $43,218 $485 HAMILTON R-II 698.10 $655,154 $938 NEW YORK R-IV 56.70 $19,795 $349 COWGILL R-VI 40.00 $24,913 $623 POLO R-VII 396.50 $373,069 $941 MIRABILE C-1 75.80 $71,510 $943 BRAYMER C-4 309.70 $249,468 $806 KINGSTON 42 58.00 $19,511 $336 Caldwell County 1,724.00 1,456,639 $845 NORTH CALLAWAY CO. R-I 1,130.00 $958,839 $849 NEW BLOOMFIELD R-III 664.80 $581,760 $875 FULTON 58 2,133.20 $1,801,910 $845 SOUTH CALLAWAY CO. R-II 795.90 $41,273 $52 Callaway County 4,723.90 3,383,782 $716

SCHOOL DISTRICT/County
Attendance Amount of Funding Below Formula
Shortfall Per Student
STOUTLAND R-II 499.10 $434,883 $871 CAMDENTON R-III 4,210.10 $310,214 $74 CLIMAX SPRINGS R-IV 242.80 $19,070 $79 MACKS CREEK R-V 355.20 $290,816 $819 Camden County 5,307.20 1,054,982 $199 JACKSON R-II 4,425.10 $3,707,499 $838 DELTA R-V 322.40 $276,591 $858 OAK RIDGE R-VI 322.10 $123,482 $383 CAPE GIRARDEAU 63 4,162.10 $3,076,361 $739 NELL HOLCOMB R-IV 401.40 $311,352 $776 Cape Girardeau County 9,633.10 7,495,285 $778 HALE R-I 145.70 $41,581 $285 TINA-AVALON R-II 176.30 $51,673 $293 BOSWORTH R-V 106.20 $42,489 $400 CARROLLTON R-VII 932.90 $661,148 $709 NORBORNE R-VIII 210.60 $62,443 $297 Carroll County 1,571.70 859,334 $547 EAST CARTER CO. R-II 794.60 $711,771 $896 VAN BUREN R-I 558.00 $486,710 $872 Carter County 1,352.60 1,198,481 $886 ARCHIE R-V 554.10 $519,979 $938 STRASBURG C-3 151.70 $101,853 $671 RAYMORE-PECULIAR R-II 5,693.90 $5,207,516 $915 SHERWOOD CASS R-VIII 879.50 $810,923 $922 EAST LYNNE 40 214.70 $165,038 $769 PLEASANT HILL R-III 2,027.70 $1,863,202 $919 HARRISONVILLE R-IX 2,449.10 $2,165,746 $884 DREXEL R-IV 312.90 $106,778 $341 MIDWAY R-I 467.30 $132,852 $284 BELTON 124 4,881.60 $4,516,044 $925 Cass County 17,632.50 15,589,930 $884 STOCKTON R-I 1,084.30 $903,889 $834 EL DORADO SPRINGS R-II 1,296.70 $1,091,988 $842 Cedar County 2,381.00 1,995,877 $838 NORTHWESTERN R-I 169.00 $36,378 $215 BRUNSWICK R-II 282.90 $224,726 $794 KEYTESVILLE R-III 145.30 $37,316 $257 SALISBURY R-IV 415.30 $148,610 $358 Chariton County 1,012.50 447,029 $442

SCHOOL DISTRICT/County
Attendance Amount of Funding Below Formula
Shortfall Per Student
CHADWICK R-I 233.10 $208,999 $897 NIXA PUBLIC SCHOOLS 5,626.10 $5,091,288 $905 SPARTA R-III 796.60 $738,241 $927 BILLINGS R-IV 435.10 $384,295 $883 CLEVER R-V 1,043.20 $974,264 $934 OZARK R-VI 5,324.80 $4,797,590 $901 SPOKANE R-VII 797.40 $718,751 $901 Christian County 14,256.30 12,913,428 $906 LURAY 33 65.50 $42,236 $645 CLARK CO. R-I 940.20 $767,180 $816 Clark County 1,005.70 809,416 $805 KEARNEY R-I 3,524.20 $3,131,677 $889 SMITHVILLE R-II 2,446.50 $2,227,533 $910 EXCELSIOR SPRINGS 40 3,003.20 $2,469,285 $822 LIBERTY 53 11,268.20 $10,607,932 $941 MISSOURI CITY 56 43.10 $14,708 $341 NORTH KANSAS CITY 74 19,348.30 $15,987,640 $826 Clay County 39,633.50 34,438,774 $869 CAMERON R-I 1,848.30 $1,726,856 $934 LATHROP R-II 920.10 $399,332 $434 CLINTON CO. R-III 723.00 $213,664 $296 Clinton County 3,491.40 2,339,852 $670 COLE CO. R-I 604.10 $502,319 $832 BLAIR OAKS R-II 1,151.30 $1,014,068 $881 COLE CO. R-V 640.70 $526,037 $821 JEFFERSON CITY 8,643.90 $6,425,252 $743 Cole County 11,040.00 8,467,676 $767 BLACKWATER R-II 142.00 $42,629 $300 COOPER CO. R-IV 142.70 $68,003 $477 PRAIRIE HOME R-V 170.60 $139,887 $820 OTTERVILLE R-VI 233.60 $73,486 $315 PILOT GROVE C-4 269.30 $183,540 $682 BOONVILLE R-I 1,487.50 $1,163,216 $782 Cooper County 2,445.70 1,670,761 $683 CRAWFORD CO. R-I 1,019.90 $881,866 $865 CRAWFORD CO. R-II 1,620.90 $1,390,564 $858 STEELVILLE R-III 1,013.80 $890,617 $878 Crawford County 3,654.60 3,163,048 $865

SCHOOL DISTRICT/County
Attendance Amount of Funding Below Formula
Shortfall Per Student
LOCKWOOD R-I 364.30 $300,073 $824 DADEVILLE R-II 142.40 $51,018 $358 EVERTON R-III 170.60 $57,683 $338 GREENFIELD R-IV 474.50 $389,733 $821 Dade County 1,151.80 798,507 $693 DALLAS CO. R-I 1,808.90 $1,573,575 $870 Dallas County 1,808.90 1,573,575 $870 PATTONSBURG R-II 177.80 $66,792 $376 WINSTON R-VI 163.30 $54,391 $333 NORTH DAVIESS R-III 73.50 $35,515 $483 GALLATIN R-V 677.80 $584,202 $862 TRI-COUNTY R-VII 169.60 $59,730 $352 Daviess County 1,262.00 800,629 $634 OSBORN R-O 143.40 $53,081 $370 MAYSVILLE R-I 555.40 $464,618 $837 UNION STAR R-II 138.40 $50,115 $362 STEWARTSVILLE C-2 200.20 $79,844 $399 DeKalb County 1,037.40 647,657 $624 SALEM R-80 1,176.80 $1,022,491 $869 OAK HILL R-I 169.80 $141,081 $831 GREEN FOREST R-II 281.70 $245,604 $872 DENT-PHELPS R-III 361.60 $303,689 $840 NORTH WOOD R-IV 292.50 $253,572 $867 Dent County 2,282.40 1,966,436 $862 SKYLINE R-II 135.40 $115,451 $853 PLAINVIEW R-VIII 156.20 $141,592 $906 AVA R-I 1,397.40 $1,186,217 $849 Douglas County 1,689.00 1,443,260 $855 MALDEN R-I 1,142.80 $1,014,772 $888 CAMPBELL R-II 662.90 $522,538 $788 HOLCOMB R-III 590.00 $526,578 $893 CLARKTON C-4 362.50 $322,739 $890 SENATH-HORNERSVILLE C-8 909.70 $788,398 $867 SOUTHLAND C-9 363.50 $318,238 $875 KENNETT 39 2,070.40 $1,790,674 $865 Dunklin County 6,101.80 5,283,938 $866

SCHOOL DISTRICT/County
Attendance Amount of Funding Below Formula
Shortfall Per Student
FRANKLIN CO. R-II 202.40 $137,635 $680 MERAMEC VALLEY R-III 3,442.30 $3,022,390 $878 UNION R-XI 3,024.40 $2,678,390 $886 LONEDELL R-XIV 501.60 $313,628 $625 SPRING BLUFF R-XV 359.70 $336,154 $935 STRAIN-JAPAN R-XVI 104.30 $88,063 $844 ST. CLAIR R-XIII 2,227.80 $2,063,407 $926 SULLIVAN C-2 2,109.00 $1,938,908 $919 NEW HAVEN 498.30 $449,423 $902 WASHINGTON 3,947.00 $2,911,801 $738 Franklin County 16,416.80 13,939,798 $849 GASCONADE CO. R-II 1,869.90 $1,514,519 $810 GASCONADE CO. R-I 977.20 $725,835 $743 Gasconade County 2,847.10 2,240,354 $787 KING CITY R-I 321.70 $93,348 $290 STANBERRY R-II 326.60 $107,704 $330 ALBANY R-III 475.30 $389,693 $820 Gentry County 1,123.60 590,745 $526 WILLARD R-II 4,362.80 $3,855,057 $884 REPUBLIC R-III 4,452.90 $4,034,992 $906 ASH GROVE R-IV 793.80 $689,274 $868 WALNUT GROVE R-V 259.50 $77,763 $300 STRAFFORD R-VI 1,186.90 $923,910 $778 LOGAN-ROGERSVILLE R-VIII 2,081.60 $1,752,770 $842 SPRINGFIELD R-XII 24,392.80 $18,314,229 $751 FAIR GROVE R-X 1,095.80 $981,034 $895 Greene County 38,626.10 30,629,029 $793 GRUNDY CO R-V 169.30 $65,611 $388 SPICKARD R-II 56.30 $24,175 $429 PLEASANT VIEW R-VI 75.40 $20,831 $276 LAREDO R-VII 90.10 $78,430 $870 TRENTON R-IX 1,269.00 $1,076,855 $849 Grundy County 1,660.10 1,265,903 $763 CAINSVILLE R-I 91.20 $33,602 $368 SOUTH HARRISON CO. R-II 871.10 $706,690 $811 NORTH HARRISON R-III 227.20 $68,749 $303 GILMAN CITY R-IV 142.40 $50,553 $355 RIDGEWAY R-V 105.10 $30,593 $291 Harrison County 1,437.00 890,186 $619

SCHOOL DISTRICT/County
Attendance Amount of Funding Below Formula
Shortfall Per Student
HENRY CO. R-I 717.00 $609,253 $850 SHAWNEE R-III 90.80 $71,390 $786 CALHOUN R-VIII 172.40 $56,476 $328 LEESVILLE R-IX 123.90 $61,674 $498 DAVIS R-XII 50.30 $3,537 $70 MONTROSE R-XIV 87.90 $28,938 $329 CLINTON 1,733.40 $1,370,715 $791 Henry County 2,975.70 2,201,983 $740 HICKORY CO. R-I 744.70 $644,672 $866 WHEATLAND R-II 290.30 $153,105 $527 WEAUBLEAU R-III 345.70 $216,116 $625 HERMITAGE R-IV 277.00 $56,965 $206 Hickory County 1,657.70 1,070,858 $646 CRAIG R-III 77.30 $17,633 $228 MOUND CITY R-II 249.30 $48,767 $196 SOUTH HOLT CO. R-I 252.90 $57,219 $226 Holt County 579.50 123,619 $213 NEW FRANKLIN R-I 444.90 $389,221 $875 FAYETTE R-III 651.90 $545,314 $836 GLASGOW 289.80 $237,961 $821 Howard County 1,386.60 1,172,496 $846 HOWELL VALLEY R-I 302.50 $159,673 $528 MOUNTAIN VIEW-BIRCH TREE R-III 1,268.30 $1,099,790 $867 WILLOW SPRINGS R-IV 1,397.50 $1,245,647 $891 RICHARDS R-V 613.70 $531,989 $867 WEST PLAINS R-VII 2,093.40 $1,760,584 $841 GLENWOOD R-VIII 373.00 $321,598 $862 JUNCTION HILL C-12 301.40 $98,074 $325 FAIRVIEW R-XI 718.60 $623,707 $868 Howell County 7,068.40 5,841,063 $826 SOUTH IRON CO. R-I 372.30 $299,680 $805 ARCADIA VALLEY R-II 1,034.80 $932,083 $901 BELLEVIEW R-III 186.30 $164,999 $886 IRON CO. C-4 427.00 $288,968 $677 Iron County 2,020.40 1,685,730 $834
SCHOOL DISTRICT/County
Attendance Amount of Funding Below Formula
Shortfall Per Student
FORT OSAGE R-I 4,982.00 $3,120,744 $626 BLUE SPRINGS R-IV 13,606.00 $11,828,205 $869 GRAIN VALLEY R-V 3,691.60 $3,531,969 $957 OAK GROVE R-VI 1,999.00 $1,844,406 $923 LEE'S SUMMIT R-VII 16,809.10 $14,757,310 $878 HICKMAN MILLS C-1 6,947.30 $2,557,480 $368 RAYTOWN C-2 9,093.30 $8,122,233 $893 GRANDVIEW C-4 4,138.90 $2,539,937 $614 LONE JACK C-6 541.60 $488,928 $903 INDEPENDENCE 30 15,531.60 $14,699,368 $946 KANSAS CITY 33 30,451.00 $8,226,490 $270 CENTER 58 2,479.40 $276,996 $112 Jackson County 110,270.80 71,994,065 $653 CARL JUNCTION R-I 3,223.20 $2,802,263 $869 AVILLA R-XIII 226.00 $193,596 $857 JASPER CO. R-V 492.90 $344,912 $700 SARCOXIE R-II 889.10 $810,282 $911 CARTHAGE R-IX 5,189.30 $4,622,082 $891 WEBB CITY R-VII 4,188.80 $3,798,292 $907 JOPLIN SCHOOLS 7,618.20 $5,816,750 $764 Jasper County 21,827.50 18,388,176 $842 NORTHWEST R-I 6,798.80 $5,493,933 $808 GRANDVIEW R-II 795.40 $743,117 $934 HILLSBORO R-III 3,402.50 $3,156,340 $928 DUNKLIN R-V 1,522.60 $1,342,988 $882 FESTUS R-VI 2,977.80 $2,731,504 $917 JEFFERSON CO. R-VII 931.20 $691,509 $743 SUNRISE R-IX 396.10 $357,262 $902 WINDSOR C-1 2,988.00 $2,760,316 $924 FOX C-6 11,428.20 $10,547,106 $923 CRYSTAL CITY 47 642.60 $564,645 $879 DESOTO 73 3,008.80 $2,838,672 $943 Jefferson County 34,892.00 31,227,393 $895 KINGSVILLE R-I 278.80 $230,800 $828 HOLDEN R-III 1,337.30 $1,148,470 $859 CHILHOWEE R-IV 159.90 $123,239 $771 JOHNSON CO. R-VII 627.30 $552,191 $880 KNOB NOSTER R-VIII 968.60 $857,683 $885 LEETON R-X 317.60 $115,720 $364 WARRENSBURG R-VI 3,216.00 $2,703,765 $841 Johnson County 6,905.50 5,731,867 $830

SCHOOL DISTRICT/County
Attendance Amount of Funding Below Formula
Shortfall Per Student
KNOX CO. R-I 505.60 $239,666 $474 Knox County 505.60 239,666 $474 LACLEDE CO. R-I 842.70 $749,727 $890 GASCONADE C-4 106.00 $33,691 $318 LEBANON R-III 4,350.70 $3,674,773 $845 LACLEDE CO. C-5 702.40 $624,846 $890 Laclede County 6,001.80 5,083,037 $847 CONCORDIA R-II 470.50 $390,846 $831 LAFAYETTE CO. C-1 1,009.60 $902,987 $894 ODESSA R-VII 2,003.10 $1,794,005 $896 SANTA FE R-X 364.70 $114,965 $315 WELLINGTON-NAPOLEON R-IX 388.70 $157,546 $405 LEXINGTON R-V 921.80 $825,116 $895 Lafayette County 5,158.40 4,185,465 $811 MILLER R-II 540.10 $443,244 $821 PIERCE CITY R-VI 709.00 $621,241 $876 MARIONVILLE R-IX 736.10 $648,423 $881 MT. VERNON R-V 1,493.70 $1,263,570 $846 AURORA R-VIII 2,170.50 $1,906,201 $878 VERONA R-VII 473.30 $422,524 $893 Lawrence County 6,122.70 5,305,202 $866 CANTON R-V 510.90 $423,693 $829 LEWIS CO. C-1 1,038.20 $867,493 $836 Lewis County 1,549.10 1,291,186 $834 SILEX R-I 379.00 $346,101 $913 ELSBERRY R-II 805.60 $763,355 $948 TROY R-III 5,909.80 $5,540,041 $937 WINFIELD R-IV 1,524.40 $1,435,194 $941 Lincoln County 8,618.80 8,084,690 $938 LINN CO. R-I 249.70 $76,475 $306 BUCKLIN R-II 156.50 $60,258 $385 MEADVILLE R-IV 236.90 $203,666 $860 MARCELINE R-V 668.20 $510,433 $764 BROOKFIELD R-III 1,067.50 $596,863 $559 Linn County 2,378.80 1,447,696 $609 SOUTHWEST LIVINGSTON CO. R-I 183.40 $61,344 $334 LIVINGSTON CO. R-III 95.40 $33,087 $347 CHILLICOTHE R-II 1,922.30 $1,599,108 $832 Livingston County 2,201.10 1,693,539 $769

SCHOOL DISTRICT/County
Attendance Amount of Funding Below Formula
Shortfall Per Student
MCDONALD CO. R-I 4,139.50 $3,657,695 $884 McDonald County 4,139.50 3,657,695 $884 ATLANTA C-3 204.00 $62,897 $308 BEVIER C-4 238.00 $204,763 $860 LA PLATA R-II 335.60 $112,106 $334 MACON CO. R-I 1,397.00 $1,158,799 $829 CALLAO C-8 103.50 $87,179 $842 MACON CO. R-IV 118.30 $45,351 $383 Macon County 2,396.40 1,671,095 $697 MARQUAND-ZION R-VI 177.10 $51,150 $289 FREDERICKTOWN R-I 1,893.10 $1,606,954 $849 Madison County 2,070.20 1,658,104 $801 MARIES CO. R-I 510.50 $403,461 $790 MARIES CO. R-II 824.80 $684,040 $829 Maries County 1,335.30 1,087,501 $814 MARION CO. R-II 247.50 $219,502 $887 PALMYRA R-I 1,199.40 $954,257 $796 HANNIBAL 60 3,552.10 $2,986,693 $841 Marion County 4,999.00 4,160,451 $832 NORTH MERCER CO. R-III 219.20 $191,059 $872 PRINCETON R-V 386.00 $312,404 $809 Mercer County 605.20 503,463 $832 ELDON R-I 1,885.20 $1,506,565 $799 MILLER CO. R-III 241.90 $92,743 $383 ST. ELIZABETH R-IV 252.90 $191,766 $758 SCHOOL OF THE OSAGE 1,859.70 $93,590 $50 IBERIA R-V 744.60 $652,801 $877 Miller County 4,984.30 2,537,465 $509 EAST PRAIRIE R-II 1,134.70 $992,635 $875 CHARLESTON R-I 1,071.90 $880,914 $822 Mississippi County 2,206.60 1,873,549 $849 MONITEAU CO. R-I 1,320.50 $1,148,201 $870 HIGH POINT R-III 118.50 $100,175 $845 MONITEAU CO. R-V 80.00 $64,642 $808 TIPTON R-VI 584.60 $487,784 $834 JAMESTOWN C-1 201.60 $59,774 $297 CLARKSBURG C-2 126.60 $43,419 $343 Moniteau County 2,431.80 1,903,996 $783

SCHOOL DISTRICT/County
Attendance Amount of Funding Below Formula
Shortfall Per Student
MIDDLE GROVE C-1 60.00 $18,139 $302 MONROE CITY R-I 665.90 $165,463 $248 HOLLIDAY C-2 82.20 $22,285 $271 MADISON C-3 245.30 $197,851 $807 PARIS R-II 422.30 $97,710 $231 Monroe County 1,475.70 501,448 $340 WELLSVILLE MIDDLETOWN R-I 408.20 $267,318 $655 MONTGOMERY CO. R-II 1,322.10 $1,039,298 $786 Montgomery County 1,730.30 1,306,616 $755 MORGAN CO. R-I 652.70 $492,461 $754 MORGAN CO. R-II 1,388.80 $762,768 $549 Morgan County 2,041.50 1,255,229 $615 RISCO R-II 177.40 $68,306 $385 PORTAGEVILLE 767.10 $653,263 $852 GIDEON 37 310.90 $222,978 $717 NEW MADRID CO. R-I 1,532.70 $175,633 $115 New Madrid County 2,788.10 1,120,180 $402 EAST NEWTON CO. R-VI 1,630.20 $1,483,776 $910 DIAMOND R-IV 909.40 $791,263 $870 WESTVIEW C-6 200.80 $182,686 $910 SENECA R-VII 1,560.20 $1,383,800 $887 NEOSHO R-V 4,770.10 $4,226,141 $886 Newton County 9,070.70 8,067,667 $889 NODAWAY-HOLT R-VII 220.40 $54,042 $245 WEST NODAWAY CO. R-I 239.00 $78,104 $327 NORTHEAST NODAWAY CO. R-V 220.80 $76,303 $346 JEFFERSON C-123 144.20 $60,118 $417 NORTH NODAWAY CO. R-VI 252.20 $82,417 $327 MARYVILLE R-II 1,330.50 $903,529 $679 SOUTH NODAWAY CO. R-IV 176.90 $75,340 $426 Nodaway County 2,584.00 1,329,853 $515 COUCH R-I 181.30 $58,785 $324 THAYER R-II 663.20 $583,811 $880 OREGON-HOWELL R-III 205.60 $66,673 $324 ALTON R-IV 799.20 $712,306 $891 Oregon County 1,849.30 1,421,575 $769 OSAGE CO. R-I 213.80 $73,028 $342 OSAGE CO. R-II 616.20 $492,319 $799 OSAGE CO. R-III 757.40 $591,654 $781 Osage County 1,587.40 1,157,001 $729

SCHOOL DISTRICT/County
Attendance Amount of Funding Below Formula
Shortfall Per Student
THORNFIELD R-I 101.30 $84,112 $830 BAKERSFIELD R-IV 377.90 $340,312 $901 GAINESVILLE R-V 639.00 $532,659 $834 DORA R-III 326.30 $290,732 $891 LUTIE R-VI 186.70 $126,705 $679 Ozark County 1,631.20 1,374,520 $843 NORTH PEMISCOT CO. R-I 297.80 $109,439 $367 HAYTI R-II 875.90 $611,601 $698 PEMISCOT CO. R-III 185.60 $65,069 $351 COOTER R-IV 258.10 $230,660 $894 SOUTH PEMISCOT CO. R-V 712.90 $623,181 $874 DELTA C-7 218.90 $75,262 $344 CARUTHERSVILLE 18 1,279.10 $1,107,811 $866 Pemiscot County 3,828.30 2,823,023 $737 PERRY CO. 32 2,340.70 $1,758,798 $751 ALTENBURG 48 131.00 $95,093 $726 Perry County 2,471.70 1,853,891 $750 PETTIS CO. R-V 348.30 $191,082 $549 LA MONTE R-IV 437.30 $393,881 $901 SMITHTON R-VI 613.70 $531,800 $867 GREEN RIDGE R-VIII 405.30 $354,903 $876 PETTIS CO. R-XII 190.60 $18,113 $95 SEDALIA 200 4,906.40 $4,190,911 $854 Pettis County 6,901.60 5,680,691 $823 ST. JAMES R-I 1,868.70 $1,669,043 $893 NEWBURG R-II 458.20 $406,593 $887 ROLLA 31 3,900.10 $3,270,831 $839 PHELPS CO. R-III 287.80 $256,008 $890 Phelps County 6,514.80 5,602,474 $860 BOWLING GREEN R-I 1,294.90 $1,036,716 $801 PIKE CO. R-III 452.10 $247,741 $548 BONCL R-X 58.40 $3,930 $67 LOUISIANA R-II 716.10 $551,815 $771 Pike County 2,521.50 1,840,203 $730 NORTH PLATTE CO. R-I 602.70 $173,046 $287 WEST PLATTE CO. R-II 576.00 $267,370 $464 PLATTE CO. R-III 3,728.60 $3,204,833 $860 PARK HILL 10,076.50 $8,113,009 $805 Platte County 14,983.80 11,758,258 $785

SCHOOL DISTRICT/County
Attendance Amount of Funding Below Formula
Shortfall Per Student
BOLIVAR R-I 2,674.40 $2,388,984 $893 FAIR PLAY R-II 424.20 $388,823 $917 HALFWAY R-III 275.30 $239,638 $870 HUMANSVILLE R-IV 400.80 $358,273 $894 MARION C. EARLY R-V 623.30 $559,922 $898 PLEASANT HOPE R-VI 915.70 $835,159 $912 Polk County 5,313.70 4,770,798 $898 SWEDEBORG R-III 84.20 $79,923 $949 RICHLAND R-IV 610.10 $580,555 $952 LAQUEY R-V 694.80 $674,050 $970 WAYNESVILLE R-VI 4,433.40 $4,324,614 $975 DIXON R-I 989.80 $930,538 $940 CROCKER R-II 541.50 $519,561 $959 Pulaski County 7,353.80 7,109,241 $967 PUTNAM CO. R-I 749.20 $607,905 $811 Putnam County 749.20 607,905 $811 RALLS CO. R-II 720.20 $561,649 $780 Ralls County 720.20 561,649 $780 NORTHEAST RANDOLPH CO. R-IV 392.50 $339,918 $866 RENICK R-V 170.80 $69,406 $406 HIGBEE R-VIII 235.70 $132,838 $564 WESTRAN R-I 677.70 $284,547 $420 MOBERLY 2,412.30 $2,046,593 $848 Randolph County 3,889.00 2,873,301 $739 LAWSON R-XIV 1,193.00 $1,095,131 $918 ORRICK R-XI 340.20 $128,982 $379 HARDIN-CENTRAL C-2 236.70 $84,160 $356 RICHMOND R-XVI 1,515.20 $1,239,390 $818 Ray County 3,285.10 2,547,663 $776 CENTERVILLE R-I 95.20 $55,386 $582 SOUTHERN REYNOLDS CO. R-II 507.30 $449,753 $887 BUNKER R-III 264.40 $31,215 $118 LESTERVILLE R-IV 279.10 $222,692 $798 Reynolds County 1,146.00 759,046 $662 NAYLOR R-II 437.90 $405,458 $926 DONIPHAN R-I 1,523.90 $1,352,106 $887 RIPLEY CO. R-IV 241.90 $216,761 $896 RIPLEY CO. R-III 158.40 $143,186 $904 Ripley County 2,362.10 2,117,511 $896

SCHOOL DISTRICT/County
Attendance Amount of Funding Below Formula
Shortfall Per Student
FT. ZUMWALT R-II 17,992.90 $15,254,456 $848 FRANCIS HOWELL R-III 16,284.50 $13,121,184 $806 WENTZVILLE R-IV 12,979.20 $11,735,476 $904 ST. CHARLES R-VI 5,045.50 $620,437 $123 ORCHARD FARM R-V 1,509.90 $1,171,659 $776 St. Charles County 53,812.00 41,903,213 $779 APPLETON CITY R-II 307.40 $85,785 $279 ROSCOE C-1 99.90 $83,402 $835 LAKELAND R-III 427.10 $353,118 $827 OSCEOLA 480.00 $405,369 $845 St. Clair County 1,314.40 927,674 $706 BISMARCK R-V 608.20 $535,263 $880 FARMINGTON R-VII 3,931.50 $3,229,701 $821 NORTH ST. FRANCOIS CO. R-I 3,201.00 $2,777,709 $868 CENTRAL R-III 2,105.30 $1,860,019 $883 WEST ST. FRANCOIS CO. R-IV 1,096.60 $976,069 $890 St. Francois County 10,942.60 9,378,761 $857 STE. GENEVIEVE CO. R-II 1,855.60 $1,310,855 $706 St. Genevieve County 1,855.60 1,310,855 $706 HAZELWOOD 18,212.10 $15,558,557 $854 FERGUSON-FLORISSANT R-II 11,576.10 $9,260,885 $800 PATTONVILLE R-III 5,485.90 $304,786 $56 ROCKWOOD R-VI 18,993.90 $14,189,294 $747 KIRKWOOD R-VII 4,942.50 $189,103 $38 LINDBERGH SCHOOLS 5,410.80 $231,840 $43 MEHLVILLE R-IX 9,963.80 $7,353,732 $738 PARKWAY C-2 15,718.60 $591,672 $38 AFFTON 101 2,320.00 $1,679,695 $724 BAYLESS 1,625.60 $1,424,095 $876 BRENTWOOD 629.80 $22,642 $36 CLAYTON 2,034.60 $70,192 $34 HANCOCK PLACE 1,404.30 $789,295 $562 JENNINGS 2,909.20 $1,289,095 $443 LADUE 3,783.50 $146,382 $39 MAPLEWOOD-RICHMND HEIGHTS 1,096.90 $89,553 $82 NORMANDY 4,552.80 $1,803,995 $396 RITENOUR 6,571.80 $5,746,626 $874 RIVERVIEW GARDENS 6,282.60 $2,858,546 $455 UNIVERSITY CITY 3,114.10 $468,832 $151 VALLEY PARK 829.10 $591,649 $714 cont’d
SCHOOL DISTRICT/County
Attendance Amount of Funding Below Formula
Shortfall Per Student
WEBSTER GROVES 3,818.00 $2,786,544 $730 SPECL. SCH. DST. ST. LOUIS CO. 5,690.40 $2,649,353 $466 St. Louis County 136,966.40 70,096,363 $512 MIAMI R-I 61.50 $25,393 $413 OREARVILLE R-IV 58.60 $14,707 $251 MALTA BEND R-V 100.90 $36,194 $359 HARDEMAN R-X 64.60 $15,050 $233 GILLIAM C-4 50.00 $15,050 $301 MARSHALL 2,545.50 $2,148,820 $844 SLATER 332.20 $130,436 $393 SWEET SPRINGS R-VII 475.60 $406,301 $854 Saline County 3,688.90 2,791,953 $757 SCHUYLER CO. R-I 672.20 $570,668 $849 Schulyer County 672.20 570,668 $849 GORIN R-III 40.70 $23,686 $582 SCOTLAND CO. R-I 582.10 $463,292 $796 Scotland County 622.80 486,978 $782 SCOTT CITY R-I 842.50 $715,362 $849 CHAFFEE R-II 611.10 $548,980 $898 SCOTT CO. R-IV 973.90 $850,437 $873 SCOTT CO. CENTRAL 379.20 $338,071 $892 SIKESTON R-6 3,463.70 $2,910,237 $840 KELSO C-7 136.60 $19,436 $142 ORAN R-III 354.90 $307,543 $867 Scott County 6,761.90 5,690,068 $841 WINONA R-III 547.40 $490,581 $896 EMINENCE R-I 296.60 $249,397 $841 Shannon County 844.00 739,978 $877 NORTH SHELBY 274.70 $90,024 $328 SHELBY CO. R-IV 762.20 $596,222 $782 Shelby County 1,036.90 686,246 $662 RICHLAND R-I 274.20 $104,023 $379 BELL CITY R-II 236.70 $60,151 $254 ADVANCE R-IV 457.10 $381,056 $834 PUXICO R-VIII 874.80 $761,122 $870 BLOOMFIELD R-XIV 711.20 $597,920 $841 DEXTER R-XI 2,066.40 $1,674,201 $810 BERNIE R-XIII 551.60 $465,371 $844 Stoddard County 5,172.00 4,043,843 $782

SCHOOL DISTRICT/County
Attendance Amount of Funding Below Formula
Shortfall Per Student
HURLEY R-I 267.60 $112,431 $420 GALENA R-II 580.90 $512,979 $883 CRANE R-III 713.20 $645,073 $904 REEDS SPRING R-IV 2,051.00 $1,466,006 $715 BLUE EYE R-V 634.30 $462,138 $729 Stone County 4,247.00 3,198,628 $753 GREEN CITY R-I 300.00 $95,378 $318 MILAN C-2 809.70 $734,873 $908 NEWTOWN-HARRIS R-III 117.00 $31,925 $273 Sullivan County 1,226.70 862,176 $703 BRADLEYVILLE R-I 174.30 $149,632 $858 TANEYVILLE R-II 297.80 $267,622 $899 FORSYTH R-III 1,236.40 $1,061,236 $858 BRANSON R-IV 4,542.70 $3,337,037 $735 HOLLISTER R-V 1,438.40 $1,157,330 $805 KIRBYVILLE R-VI 473.90 $395,962 $836 MARK TWAIN R-VIII 89.40 $72,477 $811 Taney County 8,252.90 6,441,296 $780 SUCCESS R-VI 120.00 $34,921 $291 HOUSTON R-I 989.20 $860,388 $870 SUMMERSVILLE R-II 412.40 $350,870 $851 LICKING R-VIII 817.00 $726,379 $889 CABOOL R-IV 817.70 $709,010 $867 PLATO R-V 589.30 $519,043 $881 RAYMONDVILLE R-VII 217.10 $196,416 $905 Texas County 3,962.70 3,397,027 $857 NEVADA R-V 2,494.50 $2,113,193 $847 BRONAUGH R-VII 229.90 $200,008 $870 SHELDON R-VIII 189.30 $164,456 $869 NORTHEAST VERNON CO. R-I 229.60 $190,522 $830 Vernon County 3,143.30 2,668,179 $849 WRIGHT CITY R-II OF WARREN CO. 1,556.20 $1,353,001 $869 WARREN CO. R-III 3,173.00 $2,912,141 $918 Warren County 4,729.20 4,265,142 $902 KINGSTON K-14 812.70 $791,483 $974 POTOSI R-III 2,466.20 $2,412,839 $978 RICHWOODS R-VII 248.40 $240,038 $966 VALLEY R-VI 377.80 $157,627 $417 Washington County 3,905.10 3,601,987 $922

SCHOOL DISTRICT/County
Attendance Amount of Funding Below Formula
Shortfall Per Student
GREENVILLE R-II 817.00 $710,646 $870 CLEARWATER R-I 1,092.80 $916,880 $839 Wayne County 1,909.80 1,627,526 $852 NIANGUA R-V 250.90 $224,370 $894 FORDLAND R-III 658.00 $597,216 $908 MARSHFIELD R-I 2,929.80 $2,604,588 $889 SEYMOUR R-II 840.60 $751,678 $894 Webster County 4,679.30 4,177,853 $893 WORTH CO. R-III 341.80 $131,947 $386 Worth County 341.80 131,947 $386 NORWOOD R-I 441.50 $399,321 $904 HARTVILLE R-II 762.00 $675,555 $887 MOUNTAIN GROVE R-III 1,497.20 $1,290,167 $862 MANSFIELD R-IV 784.50 $699,614 $892 MANES R-V 96.60 $32,570 $337 Wright County 3,581.80 3,097,227 $865 ST. LOUIS CITY 38,235.30 $12,113,844 $317 St. Louis City 38,235.30 $12,113,844 $317
Related Documents


