ANALYSIS ON INFLUENCING FACTORS TOWARD CUSTOMER LOYALTY (A CASE STUDY OF APPLE PRODUCTS) By Syarifah Ade Mutia ID no. 014201000009 A Skripsi presented to the Faculty of Business President University in partial fulfillment of the requirements for Bachelor Degree in Economics Major of Management January 2014

Welcome message from author
This document is posted to help you gain knowledge. Please leave a comment to let me know what you think about it! Share it to your friends and learn new things together.
Transcript

ANALYSIS ON INFLUENCING FACTORS TOWARD
CUSTOMER LOYALTY
(A CASE STUDY OF APPLE PRODUCTS)
By
Syarifah Ade Mutia
ID no. 014201000009
A Skripsi presented to the
Faculty of Business President University
in partial fulfillment of the requirements for Bachelor Degree in Economics Major of Management
January 2014

i
SKRIPSI ADVISER RECOMMENDATION LETTER
This skripsi entitled “ANALYSIS ON INFLUENCING FACTORS
TOWARD CUSTOMER LOYALTY (A CASE STUDY OF
APPLE PRODUCTS)” prepared and submitted by Syarifah Ade
Mutia in partial fulfillment of the requirements for the degree of
bachelor in the Faculty of Business has been reviewed and found to
have satisfied the requirements for a skripsi fit to be examined. I
therefore recommend this skripsi for Oral Defense.
Cikarang, Indonesia, January 27, 2014
Acknowledged by, Recommended by,
Vinsensius Jajat K., MBA Vinsensius Jajat K., MBA
Head of Management Study Program Skripsi Adviser

ii
DECLARATION OF ORIGINALITY
I declare that this skripsi, entitled “ANALYSIS ON
INFLUENCING FACTORS TOWARD CUSTOMER LOYALTY
(A CASE STUDY OF APPLE PRODUCTS)” is, to the best of my
knowledge and beliefs, an original piece of work that has not been
submitted, either in a whole or in a part, to another university to
obtain a degree.
Cikarang, Indonesia, January 27, 2014
SYARIFAH ADE MUTIA

iii
PANEL OF EXAMINERS APPROVAL SHEET
The Panel of Examiners declares that the skripsi entitled
“ANALYSIS ON INFLUENCING FACTORS TOWARD
CUSTOMER LOYALTY (A CASE STUDY OF APPLE
PRODUCTS)” that was submitted by Syarifah Ade Mutia majoring
in Management from the Faculty of Business was assessed and
approved to have passed the Oral Examinations on February 19, 2014.
Dra. Genoveva, M.M.
Chair – Panel of Examiners
T. Manivasugen, MBA
Examiner 1
V. Jajat Kristanto, MBA
Examiner 2

iv
ABSTRACT
This research is focusing on assessing the influencing factors of several independent variables such as Marketing Mix elements (4P), Brand Image, and Customer Satisfaction toward Customer Loyalty as the dependent variable, limited to Indonesia online based community of Apple users. The data collected were from 98 respondents using Slovin formula, and simple random sampling method was used in the distribution of questionnaire, and is in Likert-scale type. Quantitative analysis including validity and reliability test, classic assumption test, and multiple regression were conducted in this research to test the appropriate hypothesis through T-test, F-test, and Coefficient Determination (R square). Results of the analysis found that from the six factors, price, product, place, promotion, brand image, and customer satisfaction, there are three variables that were proven have negative significant influence toward customer loyalty. The other three variables were proven has positive influence, such as price as the most influential variable, also customer satisfaction, and brand image did influence customer loyalty. Furthermore, the F-test has shown that the independent variables together have significant correlation to dependent variable, supported by R square value which accounted for 75.7% of how much the dependent variable can be explained by the independent variables. Keywords: Marketing Mix, Brand Image, Customer Satisfaction, Customer Loyalty
v
ACKNOWLEDGEMENT
“The Originator of the heavens and the earth. When He decrees a matter, He only
says to it: “Be!_and it is.” (QS 2:117)
First of all, the researcher would like to praises Allah SWT for all the never end
blessings, and guidence for all the process of finishing this thesis. And the
opportunity of this given time to finally met the ending of this university life.
Through this opportunity, the researcher would like to express her gratitude to the
following imperative persons which have been very valuable to the researcher’s
life and journey:
1) The very first to mention is the researcher parent and family, the all time
love, the father in earth and heaven, Said Rachmatna, and a lovely mother
Yayah Puntiawati, for all the prayers, the wonderful caring, and the
supportive actions that always strengthen the researcher when she was at
her lowest. And for the greatest family of the researcher’s own, the twins
Syarifah Rahmi Azizi and Syarifah Nurul Azizi that the researcher cared
the most. Also a brother and his family, Said Tiar Purnama and Devi
Linda Kartini, and the source of smile and laugh, the researcher’s niece
and nephew, Cut Adja Sabrina, and Said Nazmi Azka. No other words can
describe how thankful she is for having a great family like them.
2) The researcher would also like to express the grateful feelings and
apreciation over the completion of this thesis to all those who already
gave cooperation, support, guidance, and encouragement that make the
completion of this skripsi achieved. Mr. Orlando R. Santos, MBA,
Mr.Vinsensius Jajat K., MM, MBA. Not to mention the words of thank
you very much also given for the honorable examiners Mam Genoveva,
MM, and Mam Filda Rahmiati.

vi
3) The researcher’s appreciation for all the best colleges for over three and a
half year, Lauransia Oktaviany, Dwini Rahmadina, Fabiola Nola, Grece
Situmorang, Lystia, Edwin Cinwang Rinaldy, Mohammad Syarif, Noni
Trisnawati, Joudy Marsya, Sherly Silvia, Kevin Adisya, Nurinda
Febrianty, Ervina Anggraini, Andi Fuad, Fathia Fatima, Ayu Agustafany,
Hardian Ruben, Trecy Emerald, Alfina Maharani, Ikhwan Farabi, Audy
Theo, Rahman Kurniawan, Putri Utami Vallen, Dian Amarta, Martina
Pradita, and all International Business and President University associates,
the expressed feeling cannot be described more as how much the
researcher would thank to all the memories, hope the friendships will last
till the end.
4) The next is to the best given companion that have accompanied in the
most time before, for almost ten years and still counting, the researcher’s
best friend, the gratitude feelings of how much the researcher valued them
for who they are, for acceptance, and the devotion are to be presented for
the best of the best, to Soraya Verina, Meinartika Putri, Hany Syafira,
Puteri Kartika, Yeniar Hendra Ningrum, Enggar Pradipta, Astrid Nurul
Pratiwi, Nia Risnawati, and Fellycia Meylanda.
5) Last but not least, many thanks sent to Dafni Renata, a best friend, a
brother,and a lover.For his great support, through the good and bad, the
smile in the sad, and a doctor wannabe. Can’t thank him enough for the
great days spent together, and most of them were thank you for the
devotion, the patience, and the understanding. The last one is, happy
birthday for him, February 12, 22 years ago, was born the researcher’s
best companion, and these words are to express the feelings “If I had a
flower whenever I thought of you, I could walk on a garden forever”.

vii
TABLE OF CONTENTS
THESIS ADVISER RECOMMENDATION LETTER ................................................. i
DECLARATION OF ORIGINALITY .......................................................................... ii
PANEL OF EXAMINERS ........................................................................................... iii
APPROVAL SHEET .................................................................................................... iii
ABSTRACT .................................................................................................................. iv
ACKNOWLEDGEMENT ............................................................................................. v
Table of Contents ......................................................................................................... vii
List of Tables ................................................................................................................ xi
List of Figures ............................................................................................................. xiii
CHAPTER I ................................................................................................................... 1
I. INTRODUCTION .............................................................................................. 1
1.1 Research Background ........................................................................................... 2
1.2 Problem identification .......................................................................................... 6
1.3 Statement of problem ........................................................................................... 7
1.4 Research Objectives ............................................................................................. 7
1.5 Research Limitation ............................................................................................. 8
1.6 Definition of Terms .............................................................................................. 9
1.7 Significance of the Study ................................................................................... 10
CHAPTER II ................................................................................................................ 11
II. REVIEW OF LITERATURE ........................................................................... 11
2.1 Marketing Mix .................................................................................................... 11
2.1.1 Price ............................................................................................................. 12
2.1.2 Product ......................................................................................................... 13
2.1.3 Promotion .................................................................................................... 13
2.1.4 Place/Distribution ........................................................................................ 14
2.1.5 Correlation between Marketing Mix and Customer Loyalty ....................... 15
2.2 Brand Image or Market Positioning ................................................................... 15
2.2.1 Correlation between Brand Image/Market Positioning with Customer Loyalty .................................................................................................................. 18
2.3 Customer Satisfaction ........................................................................................ 18

viii
2.3.1 Correlation between customer satisfaction and customer loyalty ............... 19
2.4 Customer Loyalty ............................................................................................... 20
2.5 Previous Research .............................................................................................. 23
2.6 Theoritical Framework ....................................................................................... 25
2.7 Hypothesis .......................................................................................................... 26
CHAPTER III .............................................................................................................. 27
III. RESEARCH METHODOLOGY .................................................................. 27
3.1 Research Method ................................................................................................ 27
3.2 Operational Definitions ...................................................................................... 29
3.3 Research Framework .......................................................................................... 32
3.4 Sampling Design ................................................................................................ 34
3.4.1 Sample Size ................................................................................................. 34
3.5 Research Instrument ........................................................................................... 35
3.5.1 Data Collection ............................................................................................ 36
3.6 Reliability and Validity ...................................................................................... 37
3.6.1 Validity Testing ........................................................................................... 37
3.6.2 Reliability Test............................................................................................. 37
3.7 Classic Assumption Test .................................................................................... 38
3.7.1 Normality Test ............................................................................................. 38
3.7.2 Autocorrelation Test .................................................................................... 39
3.7.3 Multi-collinearity ......................................................................................... 39
3.7.4 Heteroscadisticity Test................................................................................. 39
3.8 Multiple Regression Analysis ............................................................................ 40
3.8.1 Correlation Coefficient ( R ) ........................................................................ 40
3.8.2 Coefficient Determination𝑹𝟐 ...................................................................... 41
3.8.3 F-test ............................................................................................................ 41
3.8.4 t-test ............................................................................................................. 41
3.9 Data Analysis ..................................................................................................... 43
CHAPTER IV .............................................................................................................. 44
IV. ANALYSIS AND INTERPRETATION ........................................................... 44
4.1 Company Profile ................................................................................................ 44

ix
4.1.1 History ......................................................................................................... 45
4.1.2 Products ....................................................................................................... 46
4.1.2.1 iPhone ....................................................................................................... 46
4.1.2.2 iPad ........................................................................................................... 46
4.1.2.3 Mac ........................................................................................................... 46
4.1.2.4 iPod ........................................................................................................... 47
4.1.2.5 iTunes ....................................................................................................... 47
4.1.2.6 Mac App Store .......................................................................................... 48
4.1.2.7 iCloud ....................................................................................................... 48
4.1.2.8 Software Products and Operating System Software ................................. 48
4.1.1.9 Application Software ................................................................................ 49
4.1.1.10 Other Application Software .................................................................... 49
4.1.3 Apple SWOT Analysis ................................................................................ 50
4.2 Data Analysis ..................................................................................................... 51
4.2.1 Respondent Demography ............................................................................ 51
4.3 Descriptive Analysis .......................................................................................... 57
4.3.1 Descriptive Analysis of Price ...................................................................... 57
4.3.2 Descriptive Analysis of Product .................................................................. 58
4.3.3 Descriptive Analysis of Place ...................................................................... 59
4.3.4 Descriptive Analysis of Promotion .............................................................. 60
4.3.5 Descriptive Analysis of Brand Ima\\\ge ...................................................... 61
4.3.6 Descriptive Analysis of Customer Satisfaction ........................................... 62
4.3.7 Descriptive Analysis of Customer Loyalty.................................................. 63
4.4 Validity and Reliability Test .............................................................................. 64
4.4.1 Validity Test ................................................................................................ 64
4.4.2 Reliability Test............................................................................................. 67
4.4.3 Classical Assumption Test ........................................................................... 70
4.4.3.1 Normality Test .......................................................................................... 70
4.4.3.2 Multi-collinearity Test .............................................................................. 72
4.3.3.3 Heteroscedasticity Test ............................................................................. 73
4.4.3.4 Autocorrelation Test ................................................................................. 73

x
4.4.4 Multiple Linear Regression ......................................................................... 74
4.4.4.1 Regression Model ..................................................................................... 74
4.4.4.2 Correlation Coefficient (R) and Coefficient Determination (𝐑𝟐) ............ 75
4.4.4.3 F Test ........................................................................................................ 76
Table 4.28: Anova ................................................................................................ 76
4.4.4.4 t Test ......................................................................................................... 78
4.5 Interpretation of Result ....................................................................................... 81
CHAPTER V ............................................................................................................... 84
IV. CONCLUSION AND RECOMMENDATION ............................................ 84
5.1 Conclusion .......................................................................................................... 84
5.2 Recommendation ................................................................................................ 89
REFERENCES ............................................................................................................ 90
APPENDICES ............................................................................................................. 93

xi
LIST OF TABLES
Table 1.1: Apple financial report 3
Table 2.1: Loyalty Dimensions 22
Table 3.1: Operational Definition Table 30
Table 3.2: Cronbach Alpha Interval 39
Table 3.3: Correlation Coefficient Interval 41
Table 4.1: SWOT Analysis 51
Table 4.2: Descriptive Analysis of Price (𝑿𝟏) 58
Table 4.3: Descriptive Analysis of Product (𝑿𝟐) 59
Table 4.4: Descriptive Analysis of Place (𝑿𝟑) 60
Table 4.5: Descriptive Analysis of Promotion (𝑿𝟒) 61
Table 4.6: Descriptive Analysis of Brand Image (𝑿𝟓) 62
Table 4.7: Descriptive Analysis of Customer Satisfaction (𝑿𝟔) 63
Table 4.8: Descriptive Analysis of Customer Loyalty (𝒀𝟏) 64
Table 4.9: Validity Result of Price 65
Table 4.10: Validity Result of Product 66
Table 4.11: Validity Result of Place 66
Table 4.12: Validity Result of Promotion 66
Table 4.13: Validity Result of Brand Image 67
Table 4.14: Validity Result of Customer Satisfaction 67
Table 4.15: Validity Result of Customer Loyalty 67
Table 4.16: Cronbach Alpha of Price 68
Table 4.17: Cronbach Alpha of Product 68
Table 4.18: Cronbach Alpha of Place 69
Table 4.19: Cronbach Alpha of Promotion 69

xii
Table 4.20: Cronbach Alpha of Brand Image 69
Table 4.21: Cronbach Alpha of Customer Satisfaction 70
Table 4.22: Cronbach Alpha of Customer Loyalty 70
Table 4.23: Kolmogrov-Smirnof Test 72
Table 4.24: Multi-collinearity Test 73
Table 4.25: Autocorrelation Test 74
Table 4.26: Coefficient Table for Equation 75
Table 4.27: Analysis of R Value 77
Table 4.28: Anova 77
Table 4.29: t Test value 79

xiii
LIST OF FIGURES
Figure 1.1: Smartphone Market Share 3
Figure 1.2: Operating System 2010-2013 4
Figure 2.1: Possible value proposition 16
Figure 2.2: Theoritical Framework 25
Figure 3.1: Research Framework 34
Figure 4.1: Gender Demography 52
Figure 4.2: Age Demography 53
Figure 4.3: Occupation Demography 54
Figure 4.4: Income Demography 55
Figure 4.5: Varieties of Products 56
Figure 4.6: Years of Using 57
Figure 4.7: Descriptive Analysis of Price (𝑿𝟏) 58
Figure 4.8: Descriptive Analysis of Product (𝑿𝟐) 59
Figure 4.9: Descriptive Analysis of Place (𝑿𝟑) 60
Figure 4.10: Descriptive Analysis of Promotion (𝑿𝟒) 61
Figure 4.11: Descriptive Analysis of Brand Image (𝑿𝟓) 62
Figure 4.12: Descriptive Analysis of Customer Satisfaction (𝑿𝟔) 63
Figure 4.13: Descriptive Analysis of Customer Loyalty (𝒀𝟏) 64
Figure 4.14: P-P Plot 71
Figure 4.15: Histogram 72
Figure 4.16: Heteroscedasticity Test 74

1
CHAPTER I
I. INTRODUCTION After the death of Apple co-founder which is Steve Jobs, have made the
shareholders of its company worried about the business run by this company, not
to mention the declining market share of this company, also the less innovations
given to its customers. Yet, the high demand of several varieties of Apple
products disclosed the high level of loyalty from its customer.
As the time goes by, with so many choices offered by gadget producer, it now
become a complicated process that needs a deep knowledge of the product
technology itself, involving the knowledge of brand image, available features,
price setting, package plans and many more. But with a little priming, anybody
can do a smart decision on choosing their final option of device. This is why
company needs to keep their customer attract with their product and maintain a
good quality and service until loyalty is one big factor that bound customer and
the company.
Customer loyalty nowadays is one of important aspect to the business growth,
since discussed by Reichheld (1999) that the advantages of customer loyalty to
the service provider, in terms of continuous profit, reducing marketing cost,
increasing per-customer revenue growth and referrals. Thus, such as maintaining
customer loyalty would give advantages to the company, company should have a
high concern on their customer satisfaction to better learn the customer perception
toward their product, and in the end will lead to the loyalty a customer feel about
the products. Thus, the researcher wants to conduct the ANALYSIS OF
INFLUENCING FACTORS TOWARD CUSTOMER LOYALTY (A CASE
STUDY OF APPLE PRODUCTS).

2
1.1 Research Background Based on well developed innovations, there are a lot of changes and futuristic
features that being offered by mobile technology provider, one of the world’s best
technology producer was Apple Inc. and is a great manufacturer of not only
mobile device, but also other entertainment device and a so called Macintosh that
can help ease the working life sector. Steven Jobs had created masterpieces as his
legacy by providing innovations in many aspects of digital tools produced by this
company and lately has become the pioneer of the device expansion.
The idea of innovations given in Apple new products was a great idea, until
competitors stop pretending everything is fine, and started to duplicate and
rebuild the products, just like Ipad phenomenon. Ipad was a very first tablet that
created in a minimize computer functions into a lighter, flat, and square device, its
first generation was released on April 2010, and were dominating market share at
that time, for selling 3 million iPad during the first 80 days. Due to the Apple
success with the technology, the other company can see this as an opportunity if
they can create their products as an alternative.
Indeed after Ipad was released, not so long after it, there were so many products
that also implement the same physical characteristics with Ipad, added with some
innovations, also cheaper materials that make competitors can produce cheaper
similar products such as Samsung, Asus, Acer, Toshiba, Motorola and so forth.
Thus, this factor has lead middle-lowered customers to choose some other brands
beside Apple products. Not to mention, the death of the co-founder, since then
Apple has not produced another significant innovations to its products.
And it has been proven as being reported by CNBC on Friday, November 15,
2013, Gartner said that Samsung, which is Apple’s competitor managed to sell
80.357 units of smart phones worldwide during July until September 2013.
Meanwhile, Apple only sold 30.330 handsets of theirs. Samsung is one of the
strongest competitors for Apple. And from last year’s period for Samsung share
in the smart phone market remained unchanged at 32.1 percent, meanwhile,
Apple’s market share fell to 12.1 percent from 14.3 percent. As the few years

3
before, Apple keep experienced the falling amount of market share as cited by
IDC data, the previous share of Apple have fallen from 18.8% to 16.9% disclosed
by the table below,
Figure 1.1: Smartphone market share
Source: IDC data
Furthermore, table below shows Apple annual financial report reported by
marketwatch website.
Table 1.1: Apple financial report
Source: www.marketwatch.com

4
The table 1.2 above disclose the downturn ratio of gross income in financial year
of 2012 to 2013, despite the rising of revenue amount, Apple should worry about
the decreasing of its gross income, according to Carasco (2010), gross income is
how much the company makes before taxes, this is an important amount when
analyzing a company, this amount is a company’s revenue minus cost of goods
sold, this indicating of how efficient a company is in managing labor and supplies
in the production process.
Furthermore, until the investors are worries about the company’s prosperity even
though the sales and revenue of its products especially iPhones are rising, but still
the earnings are decreasing, as its market value down by 25 percent or about $160
billion in 2013 as cited by Jakarta Post magazine October, 2013. The below table
also show the indicated Operating System (OS) as determinant of Apple market
share compare to other Operating System (OS).
Figure 1.2: Operating System 2010-2013
Source: Statcounter.com

5
Despite the plunged of iOS user in the worldwide, indicated from the downturn
from 25.48% to 22.29% on 2011, and being beaten by several Operating System
(OS) like Android, Samsung, and Series 40. However, the increasing percentage
in the end of 2011 does not taking back its highest position in early 2011. As
Strategy Analytics Paul Brown said that by creating a powerful brand image,
along with a compelling user experience, Apple has managed to create a high
level of brand loyalty amongst existing users, bizjournal cited. Apple is still the
world’s most valuable company, despite the downturn and a tight competition,
Apple is in a good market positioning, and has a strong loyalty of its customer.
For instance, as cited by BGR.com (2013), despite the Android tablets have led
Apple in market share and Windows based tablets will likely to take off at some
point, Apple do not need to worry and again was showing that the company care
much less in maintaining the market share than the company do in maintaining
high margins in profit. The company instead rise the price to generates its revenue
as IHS researcher Rhoda Alexander explained that hardware profit plays a big
role in Apple’s success, enabling the design, durability and performance
innovations that in turn support Apple’s premium pricing, while other brands
using price cuts as their powerful marketing tool.
In the era of developed technology, and a tight competition in technology market,
measuring and maintaining customer loyalty is a solution to keep collecting
earnings. As the average business loses 10-30 percent of its customer each year,
but they often don’t know which customer they have lost, when they were lost,
why they were lost, or how much sales revenue and profit this customer decay has
cost them (Nigel Hill, Handbook of customer satisfaction and loyalty
measurement 1996).
By the loosing of customer, as has been shown by several research, that
decreasing the retention rate by only a few percentages can have a major impact
on the level of profitability of a company (Reichheld and Sasser 1990). Because
the costs of recruiting new customers are said to be higher than the costs of
retaining customer old customers, and research has found positive relationship

6
between customer loyalty and the organization’s profitability (Christina Nordman
2004). Reducing marketing costs, is definitely one of the benefit of having a loyal
customer (Evans and Laskin 1994; Mittal and Lassar 1998), because there would
be tendencies of a loyal customer to be demanding less time in personal selling, to
be less price sensitive, to spread positive word-of-mouth (e.g. Reichheld and
Sasser 1990; Reichheld 1996; Narayandas 1998), these benefits are a company
treasure that have to be kept in good maintenance.
1.2 Problem identification
Apple has experiencing the downturn since the death of its co-founder Steve Jobs
two years ago. Fortunately, the co-founder has set the image to its product as
premium brand which made them different with another brands. A company
which can differentiate its product to provide superior value to customers through
the lines of product, services, personnel, location or image (Kotler et al 2006) is a
set of act in designing meaningful differences to distinguish the company’s
offering from competitior’s offerings (Kotler 1997, 282), through this
differentiation and brand image, customers may acknowledge a difference even
when competing offers look the same (Armstrong, Kotler, Harker Brennan 2009).
In the end, the aim of this research is to analyze which factor of 4Ps of marketing
mix elements is the most dominant, also brand image, and customer satisfaction
are the variables to be determined in defining the loyalty of Apple customers,
since the main problem is occurwhen competing with the other brands but lack of
innovations has made to the products after the death of Steve jobs, Apple co-
founder and innovators.

7
1.3 Statement of problem
Thus, the research questions of this study are:
a. Is there partial significant influence of the “price” variable towards
customer loyalty?
b. Is there partial significant influence of the “product” variable towards
customer loyalty?
c. Is there partial significant influence of the “place” variable towards
customer loyalty?
d. Is there partial significant influence of the “promotion” variable towards
customer loyalty?
e. Is there partial significant influence of the “brand image/market
positioning” variable towards customer loyalty?
f. Is there partial significant influence of the “customer satisfaction” variable
with customer loyalty?
g. Are there simultan significant influence of “price, product, place,
promotion, brand image, and customer satisfaction” toward customer
loyalty?
1.4 Research Objectives In order to overcome the issue caused by lacking innovations that Apple had
given to its customer after the death of co-founder and the most initiator of
innovations, that can impact to company’s profit and earnings, also the needs to
analyze the factors of several elements in determining the loyalty of Apple
customers, the researcher intend to implement the selected dimensions of
marketing mix as the tools to better know the dominant factors of what makes
people are loyal to Apple products.

8
Thus, the objectives of this research are:
a. To find out partial significant influence of price towards customer loyalty
b. To find out partial significant influence of product towards customer
loyalty
c. To find out partial significant influence of place towards customer loyalty
d. To find out partial significant influence of promotion towards customer
loyalty
e. To find out partial significant influence of brand image/market positioning
towards customer loyalty
f. To find out partial significant influence of customer satisfaction towards
customer loyalty
g. To find out significant influence of price, product, place, promotion, brand
image, and customer satisfaction toward customer loyalty
1.5 Research Limitation This study is focused on Apple user who’s also a member of Indonesia Apple
user which divided to several online based communities (via facebook) such as
Indonesia-Mac community, Indonesia-iPad community, Indonesia-iPhone and
iPod community. The particular questionnaires are distributed to 98 members of
Indonesia Apple user community in Indonesia based on their perceptions while
using Apple products. This study will analyze the impact of customer satisfaction
towards customer loyalty.

9
1.6 Definition of Terms a. Brand image a positioning strategy to gain customers trust (Armstrong,
Kotler, Harker and Brennan, 2009)
b. Customer loyalty is positive attitudes of a customer towards brand and
company
c. Customer satisfaction is how customer compares a perceived of
performance of a product and their expectations, customer will get
satisfied if the perceived performance is better than their expectation
(Kotler and Armstrong, 2010)
d. Id-mac is a community consisting of Indonesian Macintosh users.
e. Id-ipad is a community consisting of Indonesian iPad users.
f. Id-iphone is a community consisting of Indonesia iPhone and iPod users.
g. Marketing mix is the set of controllable tactical marketing tools such-
product, price, place, and promotion that the firm blends to produce the
response it wants in the target market (Kotler 2005).
h. Place / distribution defined as any way that the customer can obtain a
product or receive a service (Jones, 2007)
i. Price is the amount of money that people pay in order to get service or
product (Kotler et al. 2008).
j. Product is everything that companies provide for its customer and target
market, it can mean a physical object which customer can see and touch or
it can mean service, ideas, and almost anything (Groonroos, 2005).
k. Promotion explained that promotion is concerned with any vehicle you
employ for getting people to know more about your product or service
(Jones, 2007).

10
1.7 Significance of the Study The importance of this research can give knowledge, information, and suggestion
for particular parties as follows:
a. Customer: To provide review of existing user of their satisfaction level,
and loyalty attitudes toward the brand.
b. Apple: The findings of this research could become reference for Apple in
order to strengthen its factors of marketing mix, also to improve its brand
image and higher its customer satisfaction based on the differences of life
style and culture in Indonesia.
c. Researcher: To find out the significance influence of marketing mix
aspects and brand image of Apple products, and the correlation between
Apple customer satisfaction impact towards its customer loyalty.
d. Future Researcher: The findings of this research could become a reference
to expand the knowledge and information of future researcher who would
do research about Marketing Mix, Brand Image, Customer Satisfaction,
and Customer Loyalty.
e. The University: To add more reference and literature studies in the field of
Marketing Mix, Brand Image, Customer Satisfaction, and Customer
Loyalty.

11
CHAPTER II
II. REVIEW OF LITERATURE
2.1 Marketing Mix Chai Lee Goi (2009) explained in his journal of marketing studies that the
marketing mix term used is first claimed by Borden (1965) and was suggested by
Culliton’s (1984) as “mixer of ingredients” is an executive who sometimes
follows a recipe as he goes along, sometimes adapts a recipe to the ingredients
immediately available, and sometimes experiments with or invents ingredients no
one else has tried.
Borden’s (1965) original marketing mix had a set of 12 elements such as product
planning, pricing, branding, channels of distribution, personal selling, advertising,
promotions, packaging, display, servicing, physical handling and fact finding and
analysis. In the other hand, Frey (1961) suggests that marketing variables should
be divided into two parts, the offering part which is product, packaging, brand,
price and service, the other one is methods and tools which is distribution
channels, personal selling, advertising, sales promotion and publicity.
McCarthy (1964) defined the marketing mix as a combination of all of the factors
at a marketing manager’s command to satisfy the target market. Later, he
separated Borden’s 12 elements to four elements or 4ps, namely product, price,
promotion and place and place, since then, 4P generally known as marketing mix
management paradigm that has dominated marketing. But then there were many
researchers proposed new Ps and elements into marketing mix because they think
the 4P cannot deliver a high degree of satisfaction, and numerous critics has come
from the service marketing area (Rafiq and Ahmed, 1995), later Booms and
Bitner (1981) support that 7P should replace the 4P framework as the generic
marketing mix, added three extra elements include people, process and physical

12
evidence which is good because its more comprehensive but also more
complicated than 4P.
And nowadays, the 4P still remains the most common marketing mix, despite its
limitations and its simplicity, the use of this framework remains strong and is
somehow become fundamental in the marketing mix (kent and Brown, 2006).
Due to its useful when physical products represented a larger portion in economy
(Chee Lee Goi, 2009) while 7P is more detailed and can also be used in
relationship and service marketing (Eeva Rajakallio, 2012).
The main reasons why marketing mix is a powerful concept that makes marketing
seem easy to handle, allows the separation of marketing from other activities of
the firm and delegation of marketing tasks to specialists, and the components of
marketing mix can change a firm’s competitive position said Gronroos (1994),
Chee Lee Goi (2009) cited.
2.1.1 Price
Price is the amount money that customer pays in order to get product or service.
Customer pays some certain amount of money and as an exchange gets different
benefits, pricing is also a psychological issue, due to many people measures price
with the quality of the product (Kotler et al. 2008). Kotler et al (2008) added to
also notice that there are two kinds of costs which is variable costs and fixed cost.
Zeithmal (1998) and Kotler et al (2008) describe that price is the view that
monetary cost is one of the factors that influence consumer’s perception of a
product’s value, it can be started as the actual or rated value of a valuable product
which is up for exchange or as amount of money paid for product.
According to Jones (2007) the price you set for products or services plays a large
role in its marketability. Pricing for products or services that are commonly
available in the market is more elastic, meaning that unit sales will go up or down
more responsively in response to price changes.

13
Kotler et al (2008) in Eeva Rajakallio (2012) previous research had divides
segmented pricing into four categories. Customer-segment pricing means
different prices for different customers. For example, the amusement park tariff is
different in the segmented age, the cheaper tariff for children rather than adult.
Product-form pricing is that different forms of certain product have different
prices, taken pineapple and canned pineapple as an example, which basically,
these are the same products but are different in pricing. Location pricing
determines if the company wants for example charge higher fees from non US-
citizens than from US-citizens. Time pricing is usual form, for example food
seller which will lower their food at the end of the day to avoid loss.
2.1.2 Product
Product is everything that companies provide for its customer and target market,
it can mean a physical object which customer can see and touch or it can mean
service, ideas, and almost anything (Groonroos, 2005). Customers are not buying
only the certain product but there comes so much more with it. Product can be
divided into three different levels which each of them increases the value of
product (Kotler et al. 2008). The first level is core product which is the real
product bought by customer. Next, is the supplementary materials include within
the product such as packaging, brand, and quality. The last level is additional
product including delivery, credit, warranties, and after sales.
2.1.3 Promotion
Jones (2007) explained that promotion is concerned with any vehicle you employ
for getting people to know more about your product or service. Advertising public
relations, point-of-scale displays, and word-of-mouth promotion are all traditional
ways for promoting a product. Promotion can be seen as a way of closing the
information gap between would-be sellers and would-be buyers.
Promotion is a part of specific effort to encourage customers to tell others about
their services, promotion have become a critical factor in the product marketing

14
mix which consists of the specific blend of advertising, personal selling, sales
promotion, public relations and direct marketing tools that the company uses to
pursue its advertising and marketing objective cited by Owomoyela, Olasunkanmi
and Oyeniyi (2013). (Zeithaml et al. 1995; Kotler 2007).
Promotion means everything companies do in order to sell their products and
services and how they tell about their products to the customers (Eeva Rajjakalio,
2012). The promotion mix which includes different tools which company uses in
their business, these tools are advertising, sales promotion, public relations,
personal selling and direct marketing tools. There are used in order to improve
customer value and in order to maintain customer relationship. Promotion also
defined as the tools which used to build the company’s image and difference from
competitiors (Kotler et al, 2008; Khrisna, 2010).
2.1.4 Place/Distribution
Place as any way that the customer can obtain a product or receive a service as
defined by Jones (2007). Distribution also considered as another name for place,
it encompasses all decisions and tools which relate to making products and
services available to customers, and claimed that place could be categorized into
open market, merchant houses, institutional houses, and direct delivery
(Bowersox and closs, 1996)
Traditionally, a market was a physical place where buyers and sellers are gathered
to exchange goods. Now, marketers view the sellers as the industry and the
buyers as the market. (Kotler, 2002)
But recently, location is not so vital anymore for every companies, it depends on
the type of the company. Internet now has made everything easier. Although
place is an important aspect to think in business but more vital is the availability
and accessibility (Eeva Rajakallio, 2012; Krhisna, Gopala Raghavan, and Reddy,
2010). Products need to be available for the customers and accessibility needs to
be simple. Selling can be direct selling at the place via sales people but it may

15
happen via catalogues, telephone, or trade fairs and many uses combination of
different selling tactics (Tracy, 2004).
2.1.5 Correlation between Marketing Mix and Customer Loyalty
Mellens, Dekimpe, and Steenkamp (1996) concluded that brand loyalty can be
quantified using the brand-specific intercepts in market share attraction models
(Cooper and Nakanishi, 1988). In those models a brand’s market share is
determined by its relative attractiveness vis-à-vis the other brands. This
attractiveness itself is determined by the (1) value and effectiveness of its
marketing mix variables and (2) a constant, which is assumed to reflect the
brand’s loyalty.
Cengiz and Yayla (2007) find marketing mix to have positive effect on
satisfaction and loyalty on word of mouth. Especially, product and promotion
components have the important influence on word of mouth communication
indirectly.
2.2 Brand Image or Market Positioning Brand image or market positioning nowadays have become a powerful strategy to
gain customers trust, as being described before by Armstrong, Kotler, Harker and
Brennan (2009) that through a company or brand image differentiation, customers
may acknowledge a difference even when competing offers look the same. A lot
of advantages became an easy target to catch if this strategy implemented on
track. According to Barwise (1993); Farquhar et al (1991); Keller (1993); Simon
and Sullivan (1993); and Smith and Park (1992); may indicate the probability of
brand choice, willingness to pay premium prices, marketing communication
effectiveness, and brand licensing opportunities, and decreases vulnerability to
competitive marketing actions and elastic responses to price increases, were the
advantages may be achieved by maintaining brand image as cited by Boonghee
Yoo, Naveen Donthu and Sungho Lee (2000)

16
As the co-founder has set the positioning of Apple products nicely, a strong brand
image has been created by the innovators. When the company understands brand
personality and image, they have the tools to successfully differentiate their brand
(Jung et al 2010). Yang (2010) also say that brand personality ultimately affiliates
with the brand by product attributes, brand name, category associations,
advertisements, price, symbol or logo, and distribution channel. The brand
personality of the characterization of the brand is mainly what the firm
communicates to the public. Strategy is based on a differentiated customer value
proposition. Satisfying customers is the source of sustainable value creation.
Strategy requires a clear articulation of targeted customer segments and the value
proposition to please them. Clarify of this value proposition is the single most
important dimension of strategy (Kaplan and Norton 2004).
Since each company must decide and develop its own winning positioning
strategy, one that makes it appealing and special to its target customers
(Armstrong et al. 2009), there are five winning value propositions: less for much
less, same for less, more for less, more for same, and more for more.
Figure 2.1: Possible value proposition
Source: Pham Truy Trang, 2012

17
The above figure shows the five winning value propositions. “Less for much less”
positioning means that a product offers less will costs less (Pham Truy Trang,
2012), this positioning is caused by the variety of economic levels of the market
segments shows by a population, since not everyone can afford the best of a
product offered, that with less price, the customer still can purchase the good but
with less benefits.
Second positioning is “Same for less”, the company provides the same products
with lower price (Pham Truy Trang, 2012), while “More for less” is a condition
where a company can provides the best products and service with the lowest price
(Pham Truy Trang, 2012) but this condition may become a suicide decision to the
company, as when they promises the give best product benefits to offered to the
market, they also need to invest more on their products, but the low prices may
find it to be hard to cover the cost and can lead to bankruptcy.
“More for the same” positioning of offering a brand with comparable high quality
brand but at a lower price (Pham Truy Trang, 2012), a little bit different with
“More for more” positioning that needs to be applied by a company which offers
the most premium product or service and charge a higher price to cover the
highest costs (Pham Truy Trang, 2012).
Not to mention what Apple did this whole time, setting its brand in this “More for
more” position, Apple is a premium brand that demands and earns a price
premium, this premium spans the entire Apple product line up encompassing the
Macintosh, iPod, iPhone, etc. Apple’s positioning is aligned with targeting a less
price sensitive customer. As a result, Apple’s culture and internal activities are
structured to meet the needs of these customers. Strategists call this needs-based
positioning. Apple has thus created a culture and a set of activities of differentiate
itself from rivals in order to meet the needs of their target customers as cited in
understanding Apple’s positioning-a premium brand at a premium price article by
Switch to a Mac (2009).

18
2.2.1 Correlation between Brand Image/Market Positioning with Customer
Loyalty
Heng, Yeong, Siong, Shi and Kuan (2011) had concluded that there is a strong
perception of both corporate reputation and image would tend to increase the
degree of customer loyalty, also the trust and satisfaction that that interwoven
tightly with the traditional constructs such as image could substantially contribute
to loyalty (Nguyen and Leblanc, 2001; Orth and Green, 2009).
Also, Izquierdo et al, (2005) explained that the process of developing customer-
firm relationships starts when the firm invests in activities directed towards
attracting customers and positioning on the market. However, a greater effort is
needs in order to make these customers loyal. Attraction and loyalty programs
that are necessary in the process of creating customers-firm relationships that are
valuable both to customers and the firm.
Kotler (2002) also presents many strategies to offer a product in the market,
known as product branding strategies, manufacturer brand is a product branding
that sells under the name of the producer that have benefits of customer loyalty
and price premium.
In his book, Kotler (2000) he explained that manufacturers have learnt that
market power comes from building their own brands, and in case the companies
can no longer afford to manufacture their products in their homeland, strong
brand names continue to command customer loyalty.
2.3 Customer Satisfaction Customer satisfaction depends on how customer compares a perceived of
performance of a product and their expectations, customer will get satisfied if the
perceived performance is better than their expectation. Customers who get
satisfied will purchase repeatedly and would like to share their good experience to
other people (Kotler and Armstrong, 2010).

19
Kotler (2002) also defined buyer’s satisfaction with a purchase is a function of the
closeness between the buyer’s expectation and the product’s perceived
performance. If performance falls short of expectations, the customer is
disappointed, but if it meets expectations, the customer is satisfied.
Customer satisfaction is a fundamental thing towards the growth and expansion of
a business as it leads to an increase in market share, and to acquiring repeat and
referral business, which ultimately results in greater profitability (Barsky, 1992).
Therefore, achieving customer satisfaction is crucial to business, as being
described by Getty and Thompsons (1994) that the relationships between quality,
satisfaction and the subsequent effect on customers; intention to recommend the
product to other potential customers. Their results suggest that customer’s
perceptions of both satisfaction and quality greatly impact the customers’
intention to recommend (which is a measure of customer loyalty) (Martina
Donelly, 2009).
2.3.1 Correlation between customer satisfaction and customer loyalty
Donelly (2009) summarized that, due to the importance correlation between
customer satisfaction and customer loyalty, customer satisfaction had given a
considerable attention since it is assumed to be a significant determinant of repeat
sales, positive word-of-mouth and customer loyalty (Cronin et al., 2000; Cronin
and taylor, 1992; Oliver 1980; Bearden and Teel 1983). Several studies by Bowen
and Che (2001); Oliva et al., (1992) and Coyne (1989) also proved that a minimal
change in the level of satisfaction can lead to a significant change in loyalty
growth.
Gremler and Gwinner (2000) had shown a positive relationship between overall
satisfaction and loyalty intention. Hu Beibei, Wang Shiyang and Xu Jiahong
(2013) cited that customer satisfaction is believed to have a significant positive
correlation with customer loyalty (Colgate and Stewart, 1998; Bitner and
Gremler, 2006).

20
Previously, Fornell (1992) and Jones (1990) found that loyal customers are not
necessarily satisfied customers, but satisfied customers tend to be loyal
customers. Highly satisfied customers are much more loyal than satisfied
customers and any drop in total satisfaction results in a major drop in loyalty as
cited by Rasha Ali Eliwa (2006).
Donelly (2009) also concluded that there is a positive relationship between
customer satisfaction, quality, and customer loyalty based on the research done by
Getty and Thompson mentioned before of how the relationships between those
variables will result to recommend the product to other potential customers which
is a measurement factor of loyalty. Mattsson (2009) also conclude that most of
the companies make a huge mistake. When they do not paying enough attention
to their customer satisfaction. Keeping customer satisfied is the best competitive
advantage against competitors.
2.4 Customer Loyalty Martina Donelly (2009) explained that building customer loyalty leads to positive
outcomes such as augmented sales, a reduction in costs, more foreseeable profit
flows, increased competitive advantage, and is critical to a firm’s survival and
growth. This consistent with customer relationship management (CRM) theory
which argues that a firm’s overriding strategy should be the attraction and
retention of profitable customers, because loyal customers will, in the long-term,
buy more and pay a premium for doing business with those they trust and like
(Terrill et al., 2000; Otrowsky et al., 1993; Bharadwaj et al., 1993; Reichheld,
1996; Peppers and Rogers, 2004).
Loyalty was investigated in terms of brand loyalty with respect to tangible good
(Day, 1969; Tucker, 1964; Cunningham, 1956). Brand loyalty defined as the
number of purchases a household allocated to a brand over a period of time
(Cunningham, 1956). And because of the conceptualization and measurement of
the loyalty concept has become more and more complex, thus the vast majority of
market researchers view loyalty as a multi-dimensional concept, however there is

21
debate as to how many dimensions (Jones and Taylor, 2007; Martina Donelly
2009). Willingness to recommend is the only indicator utilized by Reichheld
(2003) from investigating service organization in measuring customer loyalty,
while Chitty, Ward and Chua (2001) explained that customer loyalty can be
conceptualized by three dimensions, behavioral loyalty, indicated by repeat-
purchase behavior, and attitudinal behavior, referring to the inherent affective and
cognitive facets of loyalty.
The behavioral approach involves the individual altering their behavior, showing
strong intentions to repurchase from one service provider over alternative service
providers. Both the marketing and psychological literatures indicate that
behavioral loyalty is measured by re-purchasing intentions, switching intentions,
and exclusively purchasing intentions (Jones and Taylor, 2007).
The attitudinal approach considers both emotional and psychological aspects in
loyalty. For example, an individual may have positive attitude towards a product
and may recommend about the product to others, but they may not have or buy
the product because the product is too expensive for them, but still the positive
attitude will benefit the company. Building attitudinal loyalty towards a product
or service takes more than a basic marketing transaction inducement. Positive
attitudes towards the product or service must be developed over a longer period of
time (Kumar and Shah, 2004).
Furthermore, Lee and Cunningham (2001) added a cognitive approach which
entails an individual completely reforming what she/he believes about the
relationship with his/her service provider. Martina Donelly (2009) explained that
the cognitive measures include top of mind, first choice, price tolerance, exclusive
consideration, identification with the service provider, that is “my service
provider”, and willingness to pay more (Dwyer et al., 1987; Ostrowsky et al.,
1993; De Ruyter et al., 1998; Anderson 1996; Gremler and Brown, 1996; Butcher
et al., 2001; Bloemer et al., 1999). The table below shows a full breakdown of the
loyalty dimensions of behavioral, attitudinal, and cognitive.

22
Table 2.1: Loyalty Dimensions
Dimensions Loyalty Related Outcome
Definition Related Research
Behavioral Repurchase Intention
Customer’s aim to maintain a relationship with a particular service provider and make his or her next purchase in the category from this service provider
Jones et al. (2000); Zeithmal et al. (1996)
Switching Intention
Customer’s aim to terminate a relationship with a particular service provider and patronize another in the same category
Bansal abd Taylor (1999); Dabholkar and Walls (1999)
Exclusive Intention
Customer’s aim to dedicate all of his or her purchase in a category to a particular service provider
Reynolds and Arnold (2000); Reynolds and Beatty (1999)
Attitudinal Relative Attitude The appraisal of the service, including the strength of that appraisal and the degree of differentiation from alternatives
Dick and Basu (1994); Mattila (2001); Pritchard et al. (1996)
Willingness to Recommend
Consumer’s willingness to recommend a service provider to other consumers
Butcher et al. (2001); Zeithmal et al (1996)
Altruism Consumer willingness to assist the service provider or other service consumers in the effective delivery of the service
Price et al. (1995)
Cognitive Willingness to pay more
Consumer’s indifference to price differences between that of his or her current service provider and others in the same category
Anderson (1996); De Ruyter et al (1998)
Exclusive Consideration
The extent to which the consumer considers the service provider as his or her only choice when purchasing this type of service
Dwyer et al (1987); Ostrowski et al. (1993)
Identification The sense of ownership over the service affiliation with the service provider, or congruence values that exists between service provider and the consumer
Butcher et al. (2001)
Source: Martina Donelly (2009) adapted from Jones and Taylor (2007)

23
2.5 Previous Research There are several previous research has been conducted regarding to Marketing
Mix, Customer Satisfaction, Brand Image, and Customer Loyalty, such as:
a. Based on the study done by Owomoyela, Olasunkami, and Oyeniyi (2013)
about investigating the impact of marketing mix elements on consumer
loyalty: an empirical study on Nigerian breweries PLC. The survey
research design method used in this research which involves self-design
questionnaire in collecting data from sixty respondent, six managers, and
ten sales representatives of Nigerian breweries Plc, ten distributors and
thirty four consumers from different joints in Ibadan were selected
respectively. The instrument used in this research is a close-ended
questionnaire that was designed by the researchers. Correlation coefficient
and multiple regression analysis were used to analyze the data with the aid
of statistical package for social sciences (SPSS) version 20. The result
showed that marketing mix elements have significant effect on customer
loyalty. Subsequently, recommendations were made to the management of
Nigerian breweries that they should continue produce superior products;
charge competitive prices, position appropriately, promote widely, and
provide other distinctive functional benefits to consumers.
b. The second research done by Khoo Chong Heng, Kuit Sui Yeong, Lee
Choon Siong, Tan Yi Shi, Yee Mei Kuan (2011) about Customers’
perceptions of the marketing mix and the effect on Malaysian
Hypermarkets’ brand loyalty. Due to Malaysians hypermarket are
increasing rapidly, therefore, brand loyalty has become a critical retailing
topic. Meanwhile, plentiful studies are more concern on the effects of
marketing mix towards brand equity instead of brand loyalty. By
conducting this research study, the main goal is to identify which
marketing mix will affect brand loyalty in Malaysian hypermarkets in
relation to contribute hypermarkets’ management and future researchers in
Malaysia. However, the researchers are adapting the studies done by Chen

24
(2007) in relation to its five independent variables (IVs) which are price,
store image, advertising spending, distribution intensity, and price
promotion as examining the relationship between five IVs and Malaysian
hypermarkets’ brand loyalty. As such, researchers adapted it by reason of
comparing the results between Malaysian and Taiwan hypermarkets.
Furthermore, researchers will distribute 250 questionnaire surveys to
customers in Malaysia hypermarkets. Lastly, this study is a descriptive
and explanatory study by using descriptive and inferential analysis.
c. The research by Rasha Ali Eliwa (2006) was a cross-secrtional descriptive
research. The objective of the study was to examine how the image and
customer satisfaction of a fine dining restaurant affects customers’ loyalty.
the study also examined the two perquisites of customer loyalty which are
customer satisfaction and the image of the fine dining restaurant. The
study design employed two sets of variables: multiple criterion
(dependent) variables and multiple predictor (independent) variables.
Multiple regression analysis was used to predict the value of a dependent
variable (e.g. ‘Overall Satisfaction’, ‘Likelihood of Return’, and
‘Likelihood of Recommendation’) from a linear function of a set of
independent variables (e.g perceptions on restaurant customer satisfaction
image-related attributes). A detailed questionnaire was distributed to
customers who had lunch and dinner at a fine dining restaurant.

25
2.6 Theoritical Framework Figure 2.2: Theoritical Framework
Source: constructed by researcher
Marketing Mix: Price (X1)
Customer Loyalty (Y1)
Customer Satisfaction (X6)
Brand Image (X5)
Marketing Mix: Promotion (X4)
Marketing Mix: Place (X3)
Marketing Mix: Product (X2)
Partially
Simultaneously

26
2.7 Hypothesis (𝐻0)1: Price has negative partial significant influence towards customer loyalty
(𝐻𝑎)1: Price has positive partial significant influence towards customer loyalty
(𝐻0)2: Product has negative partial significant influence towards customer
loyalty
(𝐻𝑎)2: Product has positive partial significant influence towards customer loyalty
(𝐻0)3: Place has negative partial significant influence towards customer loyalty
(𝐻𝑎)3: Place has positive partial significant influence towards customer loyalty
(𝐻0)4: Promotion has negative partial significant influence towards customer
loyalty
(𝐻𝑎)4: Promotion has positive partial significant influence towards customer
loyalty
(𝐻0)5: Brand image has negative partial significant influence towards customer
loyalty
(𝐻𝑎)5: Brand image has positive partial significant influence towards customer
loyalty
(𝐻0)6: Customer satisfaction has negative partial significant influence towards
customer loyalty
(𝐻𝑎)6: Customer satisfaction has positive partial significant influence towards
customer loyalty
(𝐻0)7: Price, Product, Place, Promotion, Brand Image, and Customer satisfaction
simultaneously have negative significant influence towards customer loyalty
(𝐻𝑎)7: Price, Product, Place, Promotion, Brand Image, and Customer satisfaction
simultaneously have positive significant influence towards customer loyalty

27
CHAPTER III
III. RESEARCH METHODOLOGY
3.1 Research Method There are two types of methods used to do a research, which are qualitative and
quantitative analysis, these methods refer to the way the researcher threats and
analysis the collected data (Yin, 1994). As cited from Thesis Guidelines
Quantitative by Ritchie and Lewis (2003); Royse (1999), qualitative research is
an interpretative approach concerned with understanding the meanings of certain
observed phenomena or action and finding explanations of reasons and
associations by explaining, analyzing and interpreting observations. Furthermore,
qualitative method can be defined as the interpretive techniques that seek to
describe, decode, translate, and otherwise come to terms with the meaning, not
the frequency, of certain phenomena as being described by Donald R.Cooper and
Pamela S.Schindler (2006).
While quantitative research uses numbers to prove or disapprove a notion or
hypothesis. It uses data that are structured in the form of numbers and provides
fundamental connection between empirical observation and mathematical
expression of quantitative relationship (Ross, 1999 as cited from Thesis
Guidelines Quantitative). Quantitative research implies a search for knowledge
that will measure, describe, and explain the phenomena of our reality and is often
more formalized and well structured (Patel & Tebelius, 1987).
Quantitative research is analysed via basic statistics (means, percentages, and
frequencies) and advance statistics (bivariate and multibivariate statistical
techniques such as multiple regression, perceptual mapping, structural equation
modeling, etc) (Strauss and Corbiin, 1990). Further, Saunders et al.,(1997) asserts
that the results produced and techniques utilized are more precise and provide for
greater analysis. Quantitative methods can be used to explain cause and effect

28
relationship while qualitative research involves in-depth analysis through asking
how and why questions (Donelly, 2009). And hence, the researcher would like to
conduct the quantitative research in order to measure, describe and explain the
problem discussed in this research.
The descriptive research design is conducted in this research in order to describes
the characteristics, functions, relationships and patterns of the research
phenomena. Descriptive research is generally quantitative, more formal, very
structured, produces hard data and uses larger samples (Malhotra, 1999). In the
other hand, this study will obtain multiple regression analysis to predict the value
of a variable based on the value of two or more variables where the variables to
be predicted is called dependent variable, and the variable used to predict the
value of dependent variable called independent variable according to
statistics.laerd.com (2013).

29
3.2 Operational Definitions Table 3.1 Operational Definition Table
Variable Definition Indicator
Price (X1) 1. Price is the amount money
that customer pays in order
to get product or service.
Customer pays some certain
amount of money and as an
exchange gets different
benefits, pricing is also a
psychological issue, due to
many people measures price
with the quality of the
product (Kotler et al. 2008)
2. The price of Apple products is equal to its
quality
3. The Price of Apple products is premium
price than other brands
4. The discounted price of Apple products
attract me more to buy
5. Despite the higher price changing, I would
still prefer Apple among other brands
Product
(X2)
1. Product is everything that
companies provide for its
customer and target market,
it can mean a physical object
which customer can see and
touch or it can mean service,
ideas, and almost anything
(Groonroos, 2005).
2. The Apple products I received is always in
good condition
3. The Apple products is high quality
4. The Apple products has many varieties
5. Visual appearance of the products is
attractive
6. I find that the Apple products has physically
strong
7. I find that Apple software is attractive (e.g
iTunes, iCloud, Apple iOS)
8. I find that the Apple products quality meets
my expectation

30
Place
(X3)
1. Place as any way that the
customer can obtain a
product or receive a service
as defined by Jones (2007).
2. The Apple store where I can buy the product
is near with my place
3. I can easily find the Apple store to buy the
products
4. The Apple store has an appealing décor
5. I can easily find public transportation to the
Apple store
6. Easy layout of Apple store helps me find the
needs I am looking for
Promotion
(X4)
1.Jones (2007) explained that
promotion is concerned with
any vehicle you employ for
getting people to know more
about your product or service
1.The Apple Products is intensively advertised
2.The advertisements suit the brand image
3.The advertisement is impressive and make
me want to buy
4.The Apple products has an attractive
promotions for me (e.g. purchases with
operator bundling such as telkomsel, xl, etc)
Brand
Image
(X5)
1.Brand image or market
positioning nowadays have
become a powerful strategy to
gain customers trust, that
through a company or brand
image differentiation,
customers may acknowledge a
difference even when
competing offers look the
same. (Armstrong, Kotler,
Harker and Brennan, 2009)
1.I consider Apple as a strong brand
2.I can recognize Apple products among other
competing brands
3.I consider Apple as a premium brand
4.I can quickly recall the symbol or logo of
Apple
5.The Apple brand has a good reputation

31
Customer
Satisfactio
n (X6)
Customer satisfaction depends
on how customer compares a
perceived of performance of a
product and their expectations,
(Kotler and Armstrong, 2010).
1.I am satisfied with my decision to choose
Apple product
2.I am satisfied towards the quality of this
product
3.I am comfortable about the relationship with
Apple
4.Out of other brands, Apple comes closest to
my idea of an ideal products
5.Overall Apple products meet my
needs/expectations
Customer
Loyalty
(Y)
1. Brand loyalty defined as the
number of purchases a
household allocated to a
brand over a period of time
(Cunningham, 1956).
2. I consider myself to be loyal to Apple
because I feel satisfy
3. Apple would be my first choice
4. Even if another brand has the same features
with Apple, I would prefer to buy Apple
5. I say positive things/experience about Apple
products
6. I would recommend Apple products to those
who seek my advice about such matters
7. I am willing to continue repurchase Apple
products
8. I am willing to purchase other variety of
Apple products
Source: Self Constructed by Researcher

32
3.3 Research Framework The topic chosen for this research is to investigate the factors that have influence
to customer loyalty. Since customer loyalty is an important aspect that has to be
maintained because of the positive attitudes of its customer that could give such
advantages to the company, maintaining customer satisfaction is also needed
because the higher level of satisfaction a customer feel, will make them tend to be
loyal to the company.
This study investigates which factors that have significance influence of
marketing mix, brand image toward customer satisfaction, and the correlation
between Apple’s customer satisfaction and customer loyalty. To start conducting
this research, the researcher begin by analyzing the occurrences happened after
the death of Apple CEO-Steve Jobs, that in fact is the strongest innovators which
has generates much innovations that resulted positively for the company.
The researcher analyzed several articles which discussing the financial statement
of revenue, sales, and market share of Apple, limited to financial year of 2012-
2013 only. After identifying the problem that despite the lack of significance
innovations which causes the declining in income and market share, Apple still
acclaimed as company with a strong customer loyalty. The researcher wants to
find out the factor that resulting to customer loyalty. Then the researcher
continues to proceed to the theories needed from numerous sources such as
journals and previous research to support the study. Literature and theory reviews
are provided in chapter 2.
Furthermore, questionnaires were constructed and were checked for validity and
reliability test. Person correlation matrix and cronbach alpha were used to
measure the validity and reliability of this research. Pearson correlation matrix
will indicate the direction, strength, and significance of the bivariate relationships
among all the variables that were measured at an interval or ratio level, while
Cronbach alpha is a reliability coefficient that shows how well the items in a set
that are positively correlated to one another (Sekaran and Bougie, 2010). Then,
around thirty (30) people were gathered to examine if the statements in

33
questionnaires were clear to understand and were having the same perception
among the respondents. Finally, after the data were gathered from the
questionnaire spreading to the respondents, the analysis was conducted by using
SPSS. In the end, conclusion and recommendation were finalized for this
research.
Figure 3.1: Research Framework
Source: Constructed by the researcher
Background of study
Problem identification
Literature Review
Questionnaire construct
Validity and reliability test of questionnaire
Data Collection
Data analysis
Conclusion and recommendation
No
Yes

34
3.4 Sampling Design Due to this research will conduct a quantitative method, and needs to distribute a
questionnaire in order to get the expected information, but since it is almost
impossible to study the entire population of Apple user in Indonesia, because of
the time and cost consuming, thus this research will only use samples as the way
to collects the data. There are two main sampling techniques labeled as
probability and non-probability sampling (Sekaran, 2000; Zikmund, 1996).
Probability sampling is a technique used in this research, where the samples are
gathered in a process that gives all the samples in a population being studied
equal chances of getting selected (Donelly, 2009). Simple random sampling
would be conducted in this research, it is the simplest method, in which each
person is chosen at random from the total population, so that there is an equal
opportunity for selection (Fink and Kossef, 1998).
3.4.1 Sample Size
The population selected in this research was about 98 samples, this amount is
based on the limitation of respondents who are the member of Indonesian Apple
Community which has the total of 4382 members.The community was chosen in
order to better understand the significant factors that influence and causing the
products user to be loyal, and because of the limitation of time and cost of the
researcher, this online community was selected to ease the distribution of
questionnaire.
Thus, probability sampling was the technique chosen to gather information and
select certain amount mentioned above, and simple random sampling method was
used in which each person in the population has a known and equal chance of
being selected as subject of the research (Uma Sekaran and Roger Bougie, 2009).

35
Furthermore, to conduct the sampling size, this research will use Slovin formula
(Glenn D. Israel, 2009)
𝑛 =𝑁
1 + 𝑁𝑒2
Where: n = Number of Samples
N = Number of Population
E = Margin of Error
Therefore:
𝑛 =4382
1 + 4382(0.1)2
𝑛 = 97.7 ≈ 98
3.5 Research Instrument In quantitative research, there are four main tools associated with quantitative
research such as surveys, observation, panels, and experimentation (Domegan and
Fleming, 2007). Thus, the specific research instrument being conducted by the
researcher is the data collection technique of descriptive research which is survey,
because practical issues such as time and budgets also play a crucial role in the
research design decision (Brannick, 2000), this survey consist of questions that
later will be transformed into data and information as the result to be used for this
research purpose.
Balnaves and Caputi (2001) “a survey is a method of collecting data from people
about who they are (education, finances, etc.), how they think (motivations,
beliefs, etc) and what they do (behavior)”. It is generally descriptive and
quantitative in nature, and are a quick, relatively inexpensive, and accurate
method to investigate a research phenomena (Zikmund, 1997), and are used to

36
collect a large number of responses (Creswell, 2003). Additionally, Domegan and
Flemming (2007) stated that there are many modes in which to administer
surveys such as telephone, face-to-face, mail, and electronically. So that, the
researcher will spread the survey via electronic data like Google-docs.
The measurement using Likert scale to utilized. The scales provided respondents
with a number of brief statements associated with measuring each category within
the variable – likert-type scales measure the intensity of the feelings about an area
in questions (Bryman, 2004), categories are arranged with scale position and
respondents are expected to select the category that best describe their feelings
toward the variable being measured (Malhotra and Birks, 2000). The scale of
Likert using 5 points scale, where 1 = strongly disagree, 2 = disagree, 3 = neutral,
4 = agree, 5 = strongly agree.
3.5.1 Data Collection
A valid, and accurate data are needed to be produced in order to have a reliable
research, thus, the researcher needs to do a proper data collection by using
questionnaire as primary data and secondary data.
Primary data is described as “data that has been generated by an individual or
organization for specific problem at hand”, (Chrisnall, 1997), this is the first hand
information originated by the researcher (Malhotra and Birks, 1999). This
requires the gathering and assembly of specific information to the area of research
in relation to the research objectives. While secondary data defined as “data that
is developed for some purpose other than helping to solve the problem at hand”
(Tull and Hawkins, 1993). It is a data that collected from readily available sources
(Sekaran, 1992). Secondary data was utilized initially in order to obtain a greater
understanding of the research are, to define the research problem and to develop
the research approach (Donelly, 2009). Secondary data may collected by any
source of information such as academic journals, electronic databases, academic
research and books, etc.

37
Thus, in this research, secondary data was used at the beginning of the research
before conducting the primary data collection which is questionnaires. The
sources include academic journals, online articles, and electronic databases.
3.6 Reliability and Validity
3.6.1 Validity Testing
Validity test is used to measure the instruments of research whether it is valid or
not, also to measure how much is it the validity of each instrument. (Sekaran and
Bougie, 2009).
The researcher used Product Moment Correlation – Pearson Correlation (Sherri
Jackson, 2011). The result of this test can be indicated by comparing the r value
with r table. The r table got from defining α as significance level. Then, by
indicating the r value, if the r value is greater than the r table, the statement of
variables can be assumed as valid statement, but if the r value is less than r table,
then the particular statement can be assumed as invalid.
Determining the r table value was generated by determining df value by the
following equation df = (n-2), where n = sample size. In this research, the
researcher conducting a sample size of 98, with significance level of 10%, then
0.306 is the r table value.
3.6.2 Reliability Test
The Reliability test of a measure indicates the extent to which it is without bias
(error free) and hence ensures consistent measurement across the time and across
the various items in the instrument. In other words, the reliability of a measure is
an indication of the stability and consistency with which the instruments measures
the concept and helps to assess the goodness of measure (Sekaran, Bougie, 2010).

38
The measurement of reliability test in this research will use the Cronbach Alpha
Coefficient
Table 3.2: Cronbach Alpha Interval
Source:(Arikunto, 2010)
3.7 Classic Assumption Test
3.7.1 Normality Test
There are three methods conducted in this research in order to test the distribution
in regression model are distributed normally or abnormally. The instruments to be
tested are the independent and dependent variables. This test only given to 5 until
30 respondents at maximum, and the researcher was testing to 30 respondents.
A good regression model can be determined by three models such P-P Plot,
Histogram, and for accuracy matter is Kolmogorov-Smirnov Test. Each test
should be showing a normal attitude, for instance, P-P Plot is assumed as normal
if the dots are close to the diagonal line, while Histogram graphic will assume as
normal if there is the similarity of both negative and positive side, by looking at
the bars ending. The last one is Kolmogorov-Smirnov test will assume as normal
if the value in Asymp Sig. (2-tailed) is greater than 0.05, then the hypothesis of
variable being tested accepted, and vice versa.
Cronbach's alpha Internal consistency 0.81 – 1 Very Reliable 0.61 - 0.8 Reliable 0.41 - 0.6 Moderate Realiable 0.21 - 0.4 Less Reliable 0.00 - 0.2 Not Reliable

39
3.7.2 Autocorrelation Test
Autocorrelation test was tested to determine if the independent is happened to
have correlation between variables at a given period and the previous period
(Ashari and Santosa (2005). It is better to not having autocorrelation in the
research, and the value of Durbin-Watson should be in between -2 and 2 to
assume there is no autocorrelation exists.
3.7.3 Multi-collinearity
The existence of multi-collinearity was considered as bad factor for research
variables, because it may lead the modelers to false dropping the important
variable from the model because of its low t value. A good regression model
should not have multi-collinearity and cannot be correlated between each of
variables, thus Ghozali (2007) stated that the variables are not orthogonal.
To determine the test, it may be seen from the VIF (Value Inflation Factor) value.
If the VIF are more than 10 (VIF>10), it can be assume that there is multi-
collinearity, and vice versa.
3.7.4 Heteroscadisticity Test
This test is conducted to see the specific variance differences between several
observations in a regression model. Heteroscadisticity can be defined of a
situation where the variance of residuals model changes over time or across cross-
sectional units which violates the constant variance assumption (Wang and Jain,
2003), while a good regression model shall have the opposite characteristic.
Thus, the condition to determine whether heteroscadisticity or homoscedasticity
are as follow:
1) If the plots forming a certain and clear pattern, it may be assumed that
there is heteroscadisticity.
2) If the plots are scattered odd and are not forming a clear pattern, then it
may be assumed it is homoscedasticity which is good.

40
3.8 Multiple Regression Analysis Mulitple Regression analysis provides an equation that predicts dependent
variable from several independent variables (Kunal and Garav, 2011). The
equation in this research was taken from Carver and Nach (2011), and will use the
Unstandardized Coefficient Table. The equation is as follow:
Y = 𝛂 + 𝒃𝟏𝑿𝟏 + 𝒃𝟐𝑿𝟐 + 𝒃𝟑𝑿𝟑 + 𝒃𝟒𝑿𝟒 + 𝒃𝟓𝑿𝟓 + 𝒃𝟔𝑿𝟔 + 𝒆
where, Y = Customer Loyalty
𝑏1,𝑏2, 𝑏3, 𝑏4, 𝑏5, 𝑏6= Coefficient
α = constant or intercept
𝑋1= Price
𝑋2= Product
𝑋3= Place
𝑋4= Promotion
𝑋5= Brand Image
𝑋6= Customer Satisfaction
e = random error
3.8.1 Correlation Coefficient ( R )
The Pearson Correlation Coefficient is a test to measure the strength and the
direction of a linear between two variables. The scale of correlation coefficient is
usually between 0.00 and 1.00 (0.00 >a> 1.00). Below is the table interval of the
coefficient:
Table 3.3: Correlation Coefficient Interval
Source: Stephanie, 2009
Cronbach's alpha Internal consistency 0.80 – 1 Very strong 0.60 - 0.799 Strong 0.40 - 0.599 Average 0.20 - 0.399 Weak 0.00 - 0.199 Very Weak

41
3.8.2 Coefficient Determination(𝑹𝟐)
Ashari and Santosa (2005) explained that this test is used to find the greater
change or variance of variable which can be explained by the change or variance
of other variable. The level of contribution a dependent variable towards
independent variable is computed in percentage. The value of (𝑹𝟐)is between 0
and 1. Usually, the good condition of (𝑹𝟐) is the condition where the value of
adjusted (𝑹𝟐)are close to 1, meaning that the independent variables have high
influence toward dependent variable, and vice versa. The (𝑹𝟐) will be
represented in percentage.
3.8.3F-test
The F-test conducted to determine the condition of independent variables
simultaneously affecting to dependent variable at the same time. The findings of
this test will help the researcher to whether reject or accept the hypothesis
(Nachrowi and Usman, 2004). This aimed to test the influence of all independent
variables simultaneously. The determining the F-test, there will be two
conditions to decide. If Sig. < 0.1 then 𝐻0 is rejected and 𝐻𝑎 is accepted, meaning
that the independent variables are simultaneously influence toward dependent
variable.
3.8.4t-test
Nachrowi and Usman (2004) defined the purpose of conducting this test was to
determine the influence of one independent variables (Price, Product, Place,
Promotion, Brand Image, and Customer Satisfaction) each to dependent variable
(Customer Loyalty).
To construct the test, the researcher will compare each t values with t table, which
is (1.290) obtained from looking to t table, df = n-1.
There are several conditions shall be considered in this test:
1) t calculated >t table, means 𝐻0 rejected and 𝐻𝑎accepted.
2) -t calculated <-t table, means 𝐻0 rejected and 𝐻𝑎 accepted.
3) -t calculated <t calculated <t table, means 𝐻0 accepted and 𝐻𝑎 rejected.

42
Then, compare the significant level or α with the coefficient table significant.
1) If sig. <α, means that 𝐻0 rejected, and 𝐻𝑎 accepted
2) If sig. ≥ α, means that 𝐻0 accepted and 𝐻𝑎 rejected
In this research, the researcher is trying to determine the influencing independent
variable has significant toward dependent variable.
a. Price
Hypothesis:
(𝑯𝒐)𝟏: Price has negative partial significant influence toward Customer Loyalty.
(𝑯𝒂)𝟏: Price has positive partial significant influence toward Customer Loyalty
b. Product
Hypothesis:
(𝑯𝒐)𝟐: Product has negative partial significant influence toward Customer
Loyalty.
(𝑯𝒂)𝟐: Product has positive partial significant influence toward Customer
Loyalty
c. Place
Hypothesis:
(𝑯𝒐)𝟑: Place has negative partial significant influence toward Customer Loyalty.
(𝑯𝒂)𝟑: Place has positive partial significant influence toward Customer Loyalty
d. Promotion
Hypothesis:
(𝑯𝒐)𝟒: Promotion has negative partial significant influence toward Customer
Loyalty.
(𝑯𝒂)𝟒: Promotion has positivepartial significant influence toward Customer
Loyalty

43
e. Brand Image
Hypothesis:
(𝑯𝒐)𝟓: Brand Image has negative partial significant influence toward Customer
Loyalty.
(𝑯𝒂)𝟓: Brand Image has positive partial significant influence toward Customer
Loyalty
f. Customer Satisfaction
Hypothesis:
(𝑯𝒐)𝟔: Customer Satisfaction has negative partial significant influence toward
Customer Loyalty.
(𝑯𝒂)𝟔: Customer Satisfaction has positive partial significant influence toward
Customer Loyalty
3.9 Data Analysis In analyzing the data gathered, the researcher used several applications such as
Microsoft Excel and Statistical Package for Social Science (SPSS). Microsoft
Excel used to simplify the data gathered from the questionnaires, the
demographic data were the data analyzed using this application. Besides, SPSS is
utilized to examine the data collected by the researcher to calculate the statistical
data. Mean scores were applied on all the variables. Descriptive statistics were
utilized to display the distribution and the demographics of the respondent, as
well as to provide the result of the customer loyalty.

44
CHAPTER IV
IV. ANALYSIS AND INTERPRETATION
4.1 Company Profile Apple Inc. (Apple), incorporated on January 3, 1977, designs, manufactures and
markets mobile communication and media devices, personal computers, and
portable digital music players, and sells a variety of related software, services,
peripherals, networking solutions, and third-party digital content and applications.
The Company's products and services include iPhone, iPad, Mac, iPod, Apple
TV, a portfolio of consumer and professional software applications, the iOS and
OS X operating systems, iCloud, and a variety of accessory, service and support
offerings. In March 2013, the Company acquired a Silicon Valley startup,
WiFiSlam, which makes mapping applications for smart phones. Effective July
19, 2013, Apple Inc acquired Locationary Inc. Effective July 20, 2013, Apple Inc
acquired Hopstop.com Inc. Effective August 28, 2013, Apple Inc acquired
AlgoTrim AB, a Malmo-based developer of prepackaged software. In November
2013, Apple Inc bought PrimeSense Ltd. Effective December 2, 2013, Apple Inc
acquired Topsy Labs Inc.
The Company offers a range of mobile communication and media devices,
personal computing products, and portable digital music players, as well as a
variety of related software, services, peripherals, networking solutions and third-
party hardware and software products. In addition, the Company offers its own
software products, including iOS, the Company's mobile operating system; OS X,
the Company's Mac operating system; and server and application software. The
Company's primary products include iPhone, iPad, Mac, iPod, iTunes, Mac
AppStore, iCloud, Operating System Software, Application Software and Other
Application Software.

45
4.1.1 History
According to forecast expert consultant company called Data Monitor, Apple was
incorporated in 1977. It was co-founded by Steven Wozniak and StevenP. Jobs.
They introduced the first Apple I computer in 1976. The Apple I was a failure but
Apple IIlaunched in 1980 was successful. The company offered its IPO in the
year 1980.
In the early eighties, competition from the PC market and internal difficulties led
to critical managementchanges. By 1983, Apple faced stiff competition with the
entry of IBM into the PC market, and thefailure of its Apple III version computer.
Apple introduced its first mouse driven PC, the Macintosh,in 1984.By 1990, the
market was flooded with cheap PC clones and Microsoft had launched Windows
3.0.In 1994, the company launched the PowerPC chip based PowerMac, which
allowed Macs to competewith the speed of Intel's PC processors. Apple still had
problems though and in 1995, the companyhad a $1 billion order backlog. These
problems were compounded by the launch of Windows 95.
The company's performance nosedived in 1995-96 when it lost $68 million.In
1996, Apple acquired NeXT, and by virtue of which, its operating system (OS),
Rhapsody, becameApple's next-generation OS. By 1997, Apple had incurred
huge losses running in millions of dollars.Mr. Jobs, the co-founder returned as
interim CEO. Under his leadership, Apple reorganized toconcentrate on its more
profitable competencies, and divested its unsuccessful businesses asspin-offs,
including Newton, its personal digital assistant line of products. Soon after Mr.
Jobs returned, an agreement was made with Microsoft, and was subsequently
followedwith the appearance of MS Office on Mac PCs. In 2001, the company
acquired PowerSchool, oneof the providers of web-based student information
systems for K-12 schools and school districts,and Spruce Technologies, a
privately held company involved in developing and marketing DVDauthoring
products.

46
4.1.2 Products
4.1.2.1 iPhone
iPhone combines a mobile phone, an iPod, and an Internet communications
device in a single handheld product. Based on the Company's Multi-Touch user
interface, iPhone features desktop-class email, Web browsing, searching, and
maps and is compatible with both Mac and Windows-based computers. iPhone
automatically syncs content from users' iTunes libraries, as well as contacts,
bookmarks, and email accounts. iPhone allows customers to access the iTunes
Store to download audio and video files, as well as a variety of other digital
content and applications. In September 2012, the Company launched iPhone 5, its
latest version of iPhone. In addition to the Company's own iPhone accessories,
third-party iPhone compatible accessories are available through the Company's
online and retail stores and from third parties.
4.1.2.2 iPad
iPad is a multi-purpose mobile device for browsing the Web, reading and sending
email, viewing photos, watching videos, listening to music, playing games,
reading e-books and more. iPad is based on the Company's Multi-Touch
technology and allows customers to connect with their applications and content in
a more interactive way. iPad allows customers to access the iTunes Store to
download audio and video files, as well as a variety of other digital content and
applications. In March 2012, the Company launched the iPad, its third generation
iPad, and in October 2012, the Company announced its fourth generation iPad
and iPad mini. In addition to the Company's own iPad accessories, third-party
iPad compatible accessories are available through the Company's online and retail
stores and from third parties.
4.1.2.3 Mac
The Company offers a range of personal computing products, including desktop
and portable computers, related devices and peripherals, and third-party hardware
products. The Company's Mac desktop and portable systems feature Intel
microprocessors, the OS X operating system and the iLife suite of software for

47
creation and management of digital photography, music, movies, DVDs and
Websites. The Company's desktop computers include iMac, Mac Pro and Mac
mini. The Company's portable computers include MacBook Pro and MacBook
Air.
4.1.2.4 iPod
The Company's iPod line of portable digital music and media players includes
iPod touch, iPod nano, iPod shuffle and iPod classic. All iPods work with iTunes.
In addition to the Company's own iPod accessories, third-party iPod-compatible
accessories are available through the Company's online and retail stores and from
third parties.
The iPod touch, based on iOS, is a flash-memory-based iPod with a widescreen
Retina display, a Multi-Touch user interface, and built-in iSight camera. iPod
touch allows customers to access the iTunes Store to download audio and video
content, as well as a variety of digital applications. The iPod nano is a flash-
memory-based iPod that features the Company's Multi-Touch interface allowing
customers to navigate their music collection by tapping or swiping the display
and built-in Bluetooth for wireless listening. The iPod shuffle is a flash-memory-
based iPod that features a clickable control pad to control music playback and
VoiceOver technology enabling customers to hear song titles, artists and playlist
names. The iPod classic is a hard-drive based portable digital music and video
player.
4.1.2.5 iTunes
iTunes is an application that supports the purchase, download, organization and
playback of digital audio and video files and is available for both Mac and
Windows-based computers. iTunes features integration with iCloud, AirPlay
wireless music playback, Genius Mixes, Home Sharing, and syncing functionality
with iOS devices. iTunes is integrated with the iTunes Store, a service that allows
customers to discover, purchase, rent, and download digital content and
applications.The iTunes Store includes the App Store and iBookstore.

48
4.1.2.6 Mac App Store
The Mac App Store allows customers to discover, download and install Mac
applications. The Mac App Store offers applications in education, games,
graphics and design, lifestyle, productivity, utilities and other categories. The
Company's OS X operating system software and its iLife, iWork and other
application software titles are also available on the Mac App Store.
4.1.2.7 iCloud
iCloud is the Company's cloud service, which stores music, photos, applications,
contacts, calendars, and documents and wirelessly pushes them to multiple iOS
devices, Mac and Windows-based computers. iCloud's features include iTunes in
the Cloud, Photo Stream, Documents in the Cloud, Contacts, Calendar, Mail,
automatic downloads and purchase history for applications and iBooks, and
iCloud Backup. Users can sign up for free access to iCloud using a device
running qualifying versions of iOS or OS X.
4.1.2.8 Software Products and Operating System Software
The Company offers a range of software products for consumers and for SMB,
education, enterprise and government customers, including the Company's iOS
and OS X operating system software; server software; professional application
software; and consumer, education, and business oriented application software.
iOS is the Company's mobile operating system that serves as the foundation for
iOS devices. iOS supports iCloud and includes features, such as Notification
Center, a way to view and manage notifications in one place; iMessage, a
messaging service that allows users to send text messages, photos and videos
between iOS devices, and Maps, with turn-by-turn navigation. iOS supports Siri,
a voice activated intelligent assistant, which is available on qualifying iOS
devices. OS X, the Company's Mac operating system, is built on an open-source
UNIX-based foundation.

49
4.1.1.9 Application Software
included with all Mac computers. iLife features iPhoto, iMovie, iDigital Versatile
Disc (DVD), GarageBand and iWeb. iPhoto is the Company's consumer-oriented
digital photo application and iMovie is the Company's consumer-oriented digital
video editing software application. iDVD is the Company's consumer-oriented
software application that enables customers to turn iMovie files, QuickTime files,
and digital pictures into interactive DVDs. GarageBand is the Company's
consumer-oriented music creation application that allows customers to play,
record and create music. iWeb allows customers to create online photo albums,
blogs and podcasts, and to customize websites using editing tools.
iWork is the Company's integrated productivity suite designed to help users
create, present, and publish documents, presentations, and spreadsheets. iWork
includes Pages for word processing and page layout, Keynote for presentations,
and Numbers for spreadsheets. The Company also has a Multi-Touch version of
each iWork application designed specifically for use on iOS devices.
4.1.1.10 Other Application Software
The Company also sells various other application software, including Final Cut
Pro, Logic Studio, Logic Pro, and its FileMaker Pro database software. The
Company manufactures the Apple LED Cinema Display and Thunderbolt
Display. The Company also sells a range of Apple-branded and third-party Mac-
compatible and iOS-compatible peripheral products, including printers, storage
devices, computer memory, digital video and still cameras, and various other
computing products and supplies.
Apple TV allows customers to watch movies and television shows on their high
definition television. Content from iTunes, Netflix, YouTube, and Flickr, as well
as music, photos, videos, and podcasts from a Mac or Windows-based computer
can also be wirelessly streamed to a television through Apple TV.

50
4.1.3 Apple SWOT Analysis
Based on the Analysis done by Data Monitor, Apple is engaged in design,
development and marketing of personal computers,media devices, and portable
digital music players. The company also sells a variety of relatedsoftware,
services, peripherals, networking solutions, and third-party digital content and
applications.The Apple brand is well recognized amongst most consumers.The
company's strong brand enablesit to command a premium pricing and create
significant demand for its products uch as iMac, iPod,iPhone and iPad. Strong
brand image gives the company an edge over regional and globalcompetitors.
However, rising popularity of Android may affect the attractiveness of Apple's
iOSaffecting the market share of Apple.
Table 4.1: SWOT Analysis
Source: Data Monitor’s Analysis on Apple Inc (2011)

51
4.2 Data Analysis
4.2.1 Respondent Demography
The respondent description of this research is as follow:
a. Gender of Customers
Figure 4.1: Gender Demography
Source: Primary Data
The gender distribution of Apple customers gathered in this research includes of
female for 52% or 50 persons and 48% or 47 persons of male. This result shows
that despite the percentage of female respondents are higher than male
respondents, the distribution of this research questionnaire is almost equal
between them, and may conclude that the sales of Apple product is not affected
by gender classification.
Female 52%
Male 48%
Gender
Female
Male

52
b. Age of customers
Figure 4.2: Age Demography
Source: Primary Data
The above graphic shows that mostly the respondents of Apple products user is in
age range between 19-25 years old with 77% out of 100% which amounted of 75
person, and the rest come from 13 person of 26-35 years old with 14%, above 45
years old with 7 person or equal to 7%, and each of 15-18 and 36-45 is 1% which
is 1 person each.
15-18 1%
19-25 77%
26-35 14%
36-45 1%
>45 7%
Age
15-18
19-25
26-35
36-45
>45

53
c. Occupation
Figure 4.3: Occupation Demography
Source: Primary Data
The most occupation having by the respondents is student with 55 person or about
57%, pursued by private company respondents of 26 persons which is 27%, and
self employed user about 9 persons (9%), next is civil servant consist of 7 persons
(7%).
Student 57%
Civil Servant 7%
Private Company
27%
Self Employed 9%
Occupation
Student
Civil Servant
Private Company
Self Employed

54
d. Income Level
Figure 4.4: Income Demography
Source: Primary Data
The income level of respondents are ranged from the lowest level which is under
Rp. 2.500.000, around Rp. 2.500.000 to Rp. 5.000.000, Rp. 5.000.000 to Rp.
8.000.000, and the last is more than Rp. 8.000.000. the accounted amount
respondents for each level of income is 40 persons (41%), 30 persons (31%), 15
persons (16%), and 12 persons (12%).
<2.5mo 41%
2.5-5mo 31%
5-8mo 16%
>8mo 12%
Income Level
<2.5mo
2.5-5mo
5-8mo
>8mo

55
e. Varieties of products
Figure 4.5: Varieties of Products
Source: Primary Data
This demography of respondents shows the varieties of products that being used
by the respondents, the varieties consist of 6 products which is iPhone that used
by 60% of the respondents which is 58 persons (60%), then iPad is the second
product used the most by the respondent which is 23 persons (24%), next, iPod,
iTunes, Macintosh, and Application Software are the least products used by the
respondents amounted for each product of 8 persons (8%), 4 persons 4%, 3
persons (3%), and 1 person (1%).
iPod 8%
iPhone 60%
iPad 24%
Macintosh 3%
iTunes 4%
Application Software
1%
Products
iPod
iPhone
iPad
Macintosh
iTunes
Application Software

56
f. Years of using
Figure 4.6: Years of Using
Source: Primary Data
The most year data of the product’s used period is around 2 to 5 years of using the
products which is 54% or about 52 persons. Pursued by 1-2 years of using or
about 39 persons (40%), and the last is 5-8 years of using which is 6% or 6
persons.
1-2yrs 40%
2-5yrs 54%
5-8yrs 6%
>8yrs 0%
Years of using product
1-2yrs
2-5yrs
5-8yrs
>8yrs

57
4.3 Descriptive Analysis
4.3.1 Descriptive Analysis of Price
Table 4.2: Descriptive Analysis of Price(𝑿𝟏)
Source: Primary Data
Figure 4.7: Descriptive Analysis of Price (𝑿𝟏)
Source: Primary Data
The table and figure above showing the frequencies of responses from
respondents and the average scale (mean) of questions asked to the respondents.
As can be seen, the highest average scale of response belongs to a2 question with
mean scored of 3.95 which means the respondents agree that the price of Apple
products is premium than other brands.
3,84
3,95
3,55
3,87
3,3
3,4
3,5
3,6
3,7
3,8
3,9
4
a1 a2 a3 a4
Price Mean
Price Mean

58
4.3.2 Descriptive Analysis of Product
Table 4.3: Descriptive Analysis of Product(𝑿𝟐)
Source: Primary Data
Figure 4.8: Descriptive Analysis of Product (𝑿𝟐)
Source: Primary Data
The table and figure above shows the frequencies of responses from respondents
and the average scale (mean) of questions asked to the respondents. As can be
seen, the highest average scale of response is b2 question with mean scored of
4.42 which means the respondents strongly agree that the product of Apple is
high quality.
4,34 4,42
3,5
4,22 4,22 4,13 4,1
0
1
2
3
4
5
b1 b2 b3 b4 b5 b6 b7
Product Mean
Product Mean

59
4.3.3 Descriptive Analysis of Place
Table 4.4: Descriptive Analysis of Place(𝑿𝟑)
Source: Primary Data
Figure 4.9: Descriptive Analysis of Place (𝑿𝟑)
Source: Primary Data
The table and figure above show the frequencies of responses from respondents
and the average scale (mean) of questions asked to the respondents. As can be
seen, the highest average scale of response belongs to c2 question with mean
scored of 3.99 which means the respondents agree that Apple store has an
appealing decor.
3,7
3,99
3,78
3,65
3,86
3,4
3,5
3,6
3,7
3,8
3,9
4
4,1
c1 c2 c3 c4 c5
Place Mean
Place Mean

60
4.3.4 Descriptive Analysis of Promotion
Table 4.5: Descriptive Analysis of Promotion(𝑿𝟒)
Source: Primary Data
Figure 4.10: Descriptive Analysis of Promotion (𝑿𝟒)
Source: Primary Data
The table and figure above show the frequencies of responses from respondents
and the average scale (mean) of questions asked to the respondents. As can be
seen, the highest average scale of response belongs to d2 question with mean
scored of 3.91 which means the respondents agree that Apple advertisements suit
the brand image.
3,34
3,91
3,68 3,74
33,13,23,33,43,53,63,73,83,9
4
d1 d2 d3 d4
Promotion Mean
Promotion Mean

61
4.3.5 Descriptive Analysis of Brand Image
Table 4.6: Descriptive Analysis of Brand Image(𝑿𝟓)
Source: Primary Data
Figure 4.11: Descriptive Analysis of Brand Image (𝑿𝟓)
Source: Primary Data
The table and figure above show the frequencies of responses from respondents
and the average scale (mean) of questions asked to the respondents. As can be
seen, the highest average scale of response belongs to e5 question with mean
scored of 4.38 which means the respondents strongly agree that Apple does have
a good company reputation among its user.
3,92 4 3,97
4,05
4,38
3,6
3,7
3,8
3,9
4
4,1
4,2
4,3
4,4
4,5
e1 e2 e3 e4 e5
Brand Image Mean
Brand Image Mean

62
4.3.6 Descriptive Analysis of Customer Satisfaction
Table 4.7: Descriptive Analysis of Customer Satisfaction(𝑿𝟔)
Source: Primary Data
Figure 4.12: Descriptive Analysis of Customer Satisfaction (𝑿𝟔)
Source: Primary Data
The table and figure above show the frequencies of responses from respondents
and the average scale (mean) of questions asked to the respondents. As can be
seen, the highest average scale of response belongs to f1 question with mean
scored of 4.34 which means the respondents are strongly agree and admit that
they were satisfied with their decision choosing Apple products.
4,34 4,28
4,17
3,97 3,92
3,7
3,8
3,9
4
4,1
4,2
4,3
4,4
f1 f2 f3 f4 f5
Customer Satisfaction Mean
Customer SatisfactionMean

63
4.3.7 Descriptive Analysis of Customer Loyalty
Table 4.8: Descriptive Analysis of Customer Loyalty(𝒀𝟏)
Source: Primary Data
Figure 4.13: Descriptive Analysis of Customer Loyalty (𝒀𝟏)
Source: Primary Data
4,06
3,89 3,93
3,67
3,93
4,09
3,93
3,4
3,5
3,6
3,7
3,8
3,9
4
4,1
4,2
g1 g2 g3 g4 g5 g6 g7
Customer Loyalty Mean
Customer LoyaltyMean

64
The table and figure above show the frequencies of responses from respondents
and the average scale (mean) of questions asked to the respondents. As can be
seen, the highest average scale of response belongs to g6 question with mean
scored of 4.09 which means the respondents agree that they will continue to
repurchase the Apple products.
4.4 Validity and Reliability Test
4.4.1 Validity Test
The validity tests constructed in this research was if the calculated r is positive
and (> r table), this shows that the variables are valid and can be used in this
research. But, if the calculated r is negative and (< r table), it may conclude that
the particular variables are not valid and are not necessary to be used in this
research. The r table value comes from the connected value between df=(n-2),
since the respondents gathered are 98 persons, so df value become 96 which
connected to2-tailed significant level value of 10% (0.1). Thus, the r table value
of this research is 0.306.
To determine the calculated r of this research, the Item-Total Statistics table used
to compare the value, specifically in Corrected Item-Total Correlation column.
The table of validity out is as follow:
Table 4.9: Validity Result of Price
Item-Total Statistics
Scale Mean if
Item Deleted
Scale Variance
if Item Deleted
Corrected Item-Total Correlation
Squared
Multiple
Correlation
Cronbach's
Alpha if Item
Deleted
a1 11.90 4.024 .443 .200 .586
a2 11.63 4.309 .315 .113 .664
a3 11.93 3.375 .461 .268 .575
a4 11.93 3.582 .545 .316 .513
Source: Primary Data

65
Table 4.10: Validity Result of Product
Item-Total Statistics
Scale Mean if
Item Deleted
Scale Variance
if Item Deleted
Corrected Item-Total Correlation
Squared
Multiple
Correlation
Cronbach's
Alpha if Item
Deleted
b1 24.83 13.040 .611 .530 .780
b2 24.63 13.275 .583 .476 .784
b3 25.53 13.775 .378 .299 .823
b4 24.90 13.197 .561 .390 .788
b5 24.93 14.340 .400 .391 .813
b6 24.97 13.275 .532 .429 .793
b7 25.00 11.517 .836 .704 .735
Source: Primary Data
Table 4.11: Validity Result of Place
Item-Total Statistics
Scale Mean if
Item Deleted
Scale Variance
if Item Deleted
Corrected Item-Total Correlation
Squared
Multiple
Correlation
Cronbach's
Alpha if Item
Deleted
c1 15.53 10.878 .738 .611 .822
c2 15.13 11.637 .671 .547 .840
c3 15.40 12.662 .616 .677 .852
c4 15.50 11.086 .737 .603 .823
c5 15.10 12.852 .685 .692 .840
Source: Primary Data
Table 4.12: Validity Result of Promotion
Item-Total Statistics
Scale Mean if
Item Deleted
Scale Variance
if Item Deleted
Corrected Item-Total Correlation
Squared
Multiple
Correlation
Cronbach's
Alpha if Item
Deleted
d1 11.57 6.737 .515 .309 .776
d2 10.90 6.576 .623 .499 .727
d3 11.17 5.592 .663 .543 .702
d4 11.47 6.257 .597 .386 .736
Source: Primary Data

66
Table 4.13: Validity Result of Brand Image
Item-Total Statistics
Scale Mean if
Item Deleted
Scale Variance
if Item Deleted
Corrected Item-Total Correlation
Squared
Multiple
Correlation
Cronbach's
Alpha if Item
Deleted
e1 17.77 5.771 .558 .345 .746
e2 18.03 5.757 .485 .287 .779
e3 17.67 6.092 .593 .512 .734
e4 17.60 6.593 .550 .373 .751
e5 17.60 6.041 .671 .604 .713
Source: Primary Data
Table 4.14: Validity Result of Customer Satisfaction
Item-Total Statistics
Scale Mean if
Item Deleted
Scale Variance
if Item Deleted
Corrected Item-Total Correlation
Squared
Multiple
Correlation
Cronbach's
Alpha if Item
Deleted
f1 16.70 7.321 .572 .430 .819
f2 16.73 6.823 .671 .506 .793
f3 16.77 6.599 .695 .511 .785
f4 17.00 7.103 .576 .375 .819
f5 16.93 6.271 .674 .483 .792
Source: Primary Data
Table 4.15: Validity Result of Customer Loyalty Item-Total Statistics
Scale Mean if
Item Deleted
Scale Variance
if Item Deleted
Corrected Item-Total Correlation
Squared
Multiple
Correlation
Cronbach's
Alpha if Item
Deleted
g1 24.67 18.989 .676 .571 .912
g2 24.77 17.426 .796 .698 .900
g3 24.73 18.409 .752 .664 .904
g4 24.57 19.978 .719 .693 .909
g5 24.77 18.944 .732 .727 .906
g6 24.63 17.895 .786 .706 .901
g7 24.87 18.189 .780 .701 .901
Source: Primary Data

67
The above tables had shown that 37 questions constructed for validity test have r
value > 0.306 that were divided into 7 major variables which is valid and can be
proceed to collecting data.
4.4.2 Reliability Test
The Cronbach Alpha Formula was the measurement tool to find out the reliability
of each variable. The particular formula was generated using SPSS 16.0. The
range table of reliability rate mentioned before in Chapter 3 had classified the rate
range adequate to support the data, it would be better if the value is more than 0,6
to 1. Tables below show the Cronbach Alpha value of each variable.
Table 4.16: Cronbach Alpha of Price Reliability Statistics
Variable: Price
Cronbach's Alpha Cronbach's Alpha
Based on
Standardized
Items
N of Items
.656 .658 4
Source: Primary Data
Table 4.17: Cronbach Alpha of Product Reliability Statistics
Variable: Product
Cronbach's Alpha Cronbach's Alpha
Based on
Standardized
Items
N of Items
.814 .815 7
Source: Primary Data

68
Table 4.18: Cronbach Alpha of Place Reliability Statistics
Variable: Place
Cronbach's Alpha Cronbach's Alpha
Based on
Standardized Items
N of Items
.864 .867 5
Source: Primary Data
Table 4.19: Cronbach Alpha of Promotion Reliability Statistics
Variable: Promotion
Cronbach's Alpha Cronbach's Alpha
Based on
Standardized Items
N of Items
.789 .789 4
Source: Primary Data
Table 4.20: Cronbach Alpha of Brand Image Reliability Statistics
Variable: Brand Image
Cronbach's Alpha Cronbach's Alpha
Based on
Standardized Items
N of Items
.784 .796 5
Source: Primary Data

69
Table 4.21: Cronbach Alpha of Customer Satisfaction Reliability Statistics
Variable: Customer Satisfaction
Cronbach's Alpha Cronbach's Alpha
Based on
Standardized Items
N of Items
.835 .836 5
Source: Primary Data
Table 4.22: Cronbach Alpha of Customer Loyalty Reliability Statistics
Variable: Customer Loyalty
Cronbach's Alpha Cronbach's Alpha
Based on
Standardized Items
N of Items
.918 .919 7
Source: Primary Data
The data above show the value of Cronbach Alpha of each variable, it may conclude that
the variables constructed in this research wereabove 0,6 which is reliable. Since the
minimum value of Cronbach Alpha is Price variable with rate of 0.658, Product is 0.815,
Place is 0.867, Promotion 0.789, Brand Image 0.796, Customer Satisfaction 0.836, and
Customer Loyalty 0.919. And may conclude that several variables such Product, Place,
Customer Satisfaction, and Customer Loyalty are the most reliable variables due to the
Cronbach Alpha of each variable show the rate value is above 0.8 which categorized very
reliable.

70
4.4.3 Classical Assumption Test
4.4.3.1 Normality Test
Normality Test used to test the distribution of independent and dependent variable
whether the distribution is normal distributed or not. The instruments used to test
normality were P-P Plot, Histogram, and Kolmogrov approaches. Each figure was
shown below.
Figure 4.14: P-P Plot
Source: Primary Data

71
Figure 4.15: Histogram
Source: Primary Data
Table 4.23: Kolmogorov-Smirnov Test
Source: Primary Data

72
The three figures above had disclosed that the distribution is on normal pattern, as
can be seen in P-P Plot which the data spread were still following the diagonal
line, and the graphic in histogram determined the curve form is in proportional
form because of having similar bar ending for the started and the finished bars.
The last test is Kolmogrov-Smirnov test which determined the accuracy data of
normality tests conducted before, the table above shown that the distribution is
normal when the variable of Asymp. Sig (2-tailed) row if the value is more than
0.05 (>0.05).
4.4.3.2 Multi-collinearity Test
This test described the relationship linearly between variables.
Table 4.24: Multi-collinearity Test
Model Collinearity Statistics
Tolerance VIF
1
(Constant)
Price .616 1.623
product .273 3.669
Place .484 2.066
promotion .379 2.639
brandimage .437 2.288
satisfaction .308 3.244
Source: Primary Data
From the table above, may be described that there is no correlation between each
variable. The multi-collinearity may be indicated from the tolerance column
which has to be below 0.10, and the VIF column must be above 10. So that, by
analyzing the table above, there is no multi-collinearity exists between variable
because there is no tolerance is under 0.10 and no VIF value more than 10.

73
4.3.3.3 Heteroscedasticity Test
Figure 4.16: Heteroscedasticity Test
Source: Primary Data
Heteroscadisicity may happened if the distribution of points are not forming a
certain and clear pattern, and there is no points located below zero (0) number on
Y-axis. Therefore, the figure above showing that there is no heteroscedasticity,
which means the variance of observations was distributed evenly.
4.4.3.4 Autocorrelation Test
Table 4.25: Autocorrelation Test
Source: Primary Data

74
The autocorrelation can be analyzed using SPSS application to determine whether
there is relationship between variable. By seeing the above table, the value of
Durbin-Watson value is 1.739 which shows that there is no autocorrelation and no
relationship between variable, where the analyzing factor of autocorrelation is by
indicating the value of Durbin-Watson should not below -2 and more than 2 (-
2<DW>2).
4.4.4 Multiple Linear Regression
4.4.4.1 Regression Model
Multiple Linear Regression used to determine the influence of independent
variables toward dependent variable of the research. Next, to define the equation,
the β value is used to define the coefficient determinant of the independent
variables that have correlations with the dependent variable. The table below
shows the β value:
Table 4.26: Coefficient Table for Equation
Model Unstandardized Coefficients Standardized
Coefficients
T Sig.
B Std. Error Beta
(Constant) -.254 .254 -.999 .320
price .449 .062 .461 7.204 .000
product .099 .108 .088 .912 .364
place .083 .053 .114 1.573 .119
promotion -.049 .056 -.071 -.875 .384
brandimage .124 .069 .136 1.788 .077
satisfaction .346 .094 .332 3.667 .000
a. Dependent Variable: loyalty Source: Primary Data

75
From the data above, the regression model can be constructed from the value of
standardized coefficient and generated the equation of regression as follow:
Y = α + 𝑏1𝑋1 + 𝑏2𝑋2 + 𝑏3𝑋3 + 𝑏4𝑋4 + 𝑏5𝑋5 + 𝑏6𝑋6 + 𝑒
Y = - 0.254 + 0.449 X1 + 0.099 X2 + 0.083 X3 – 0.049 X4 + 0.124 X5 + 0.346 X6 + e
Where,
Y = Customer Loyalty
α = constant or intercept
𝑋1 = 𝑃𝑟𝑖𝑐𝑒
𝑋2 = 𝑃𝑟𝑜𝑑𝑢𝑐𝑡
𝑋3 = 𝑃𝑙𝑎𝑐𝑒
𝑋4 = 𝑃𝑟𝑜𝑚𝑜𝑡𝑖𝑜𝑛
𝑋5 = 𝐵𝑟𝑎𝑛𝑑 𝐼𝑚𝑎𝑔𝑒
𝑋6 = 𝐶𝑢𝑠𝑡𝑜𝑚𝑒𝑟 𝑆𝑎𝑡𝑖𝑠𝑓𝑎𝑐𝑡𝑖𝑜𝑛
4.4.4.2 Correlation Coefficient (R) and Coefficient Determination (𝐑𝟐)
The correlation coefficient or can be called Pearson Correlation Coefficient (R)
used to determine how strength is the correlation between independent variables
and dependent variables. While coefficient determination used to measure the
level of contribution of independent variables to dependent variable. Based on the
data had gathered by the researcher, the result model is as follow:

76
Table 4.27: Analysis of R Value
Model R R Square Adjusted R Square
Std. Error of the
Estimate
1 .878a .770 .755 .28702
Source: Primary Data
From the table above, it may conclude that the correlation between independent
variables which are Price, Product, Place, Promotion, Brand Image, and Customer
Satisfaction have a very strong relationship toward the dependent variables which
is Customer Loyalty, with R value of 0.878 because the value is included in the
interval value between 0.8 to 1.
In the other hand, the value shown in adjusted R square is 0.755 which means that
75.5% out of 100% of the dependent variable (Customer Loyalty) is influenced
by independent variables selected in this research (Price, Product, Place,
Promotion, Brand Image, and Customer Satisfaction).
4.4.4.3 F Test
The purpose of this test is to find out the influence of independent variables
simultaneously to dependent variable. If F value > F table, means that 𝐻𝑜 is
rejected and 𝐻𝑎 is accepted. The result of F Test is shown in the table below:
Table 4.28: Anova
Model Sum of Squares Df Mean Square F Sig.
1
Regression 25.151 6 4.192 50.885 .000b
Residual 7.496 91 .082
Total 32.647 97
a. Dependent Variable: loyalty
b. Predictors: (Constant), satisfaction, promotion, price, place, brandimage, product
Source: Primary Data

77
The hypotheses can be constructed as follow:
(𝐻0): Price, Product, Place, Promotion, Brand Image, and Customer satisfaction
simultaneously have negative significant influence towards customer loyalty
(𝐻𝑎): Price, Product, Place, Promotion, Brand Image, and Customer satisfaction
simultaneously have positive significant influence towards customer loyalty
Thus, by determining the table above, shows a result of F table value for 50.885
intercepted to significance level of 0.000 is 1.839. Where, the accounted df in F
table are df1 = 6 and df2 = 91, thus the F table value is 1.839.
The F value in Anova table must be greater than F table (F value > F table) to
prove that the independent variables has significant relationship to dependent
variable, and significant value should no more than 0.1 (<0.1), since the F value is
(50.885 > 1.839) and the significant is (0.000 < 0.1), then there is significant
influence between variables simultaneously.

78
4.4.4.4 t Test
The purpose of conducting this test was to determine the influence of one
independent variable (Price, Product, Place, Promotion, Brand Image, and
Customer Satisfaction) each to dependent variable (Customer Loyalty). The t test
value can be indicated in the table below:
Table 4.29: t Test value
Model Unstandardized Coefficients Standardized
Coefficients
T Sig.
B Std. Error Beta
(Constant) -.254 .254 -.999 .320
price .449 .062 .461 7.204 .000
product .099 .108 .088 .912 .364
place .083 .053 .114 1.573 .119
promotion -.049 .056 -.071 -.875 .384
brandimage .124 .069 .136 1.788 .077
satisfaction .346 .094 .332 3.667 .000
a. Dependent Variable: loyalty
To construct the test, the researcher will compare each t values with t table, which is (1.290) obtained from looking to t table, df = n-1 (df = 98-1).
1) Price
Hypothesis:
(𝑯𝒐)𝟏: Price has negative partial significant influence toward Customer Loyalty.
(Rejected)
(𝑯𝒂)𝟏: Price has positive partial significant influence toward Customer Loyalty
(Accepted)
The value for Price variable significance shows the amount 0.000, which is less
than 0.1. Thus, this variable has significant influence toward customer loyalty.

79
2) Product
Hypothesis:
(𝑯𝒐)𝟐: Product has negative partial significant influence toward Customer
Loyalty.(Accepted)
(𝑯𝒂)𝟐: Product has positive partial significant influence toward Customer
Loyalty(Rejected)
The value for this variable significance is 0.364, and is greater than 0.1. Thus, this
variable has negative partial significant influence toward customer loyalty.
3) Place
Hypothesis:
(𝑯𝒐)𝟑: Place has negative partial significant influence toward Customer
Loyalty.(Accepted)
(𝑯𝒂)𝟑: Place has positive partial significant influence toward Customer Loyalty.
(Rejected)
This variable value is 0.119 and is greater than 0.1. Thus, this variable has
negative significance influence toward customer loyalty
4) Promotion
Hypothesis:
(𝑯𝒐)𝟒: Promotion has negative partial significance influence toward Customer
Loyalty.(Accepted)
(𝑯𝒂)𝟒: Promotion has positive partial significance influence toward Customer
Loyalty. (Rejected)
The variable value is 0.384 and is greater than 0.1. Thus, this variable has
negative significance influence toward customer loyalty

80
5) Brand Image
Hypothesis:
(𝑯𝒐)𝟓: Brand Image has negative partial significance influence toward Customer
Loyalty.(Rejected)
(𝑯𝒂)𝟓: Brand Image has positive partial significance influence toward Customer
Loyalty. (Accepted)
This variable value is 0.077 and is less than 0.1. Thus, this variable has positive
significance influence toward customer loyalty
6) Customer Satisfaction
Hypothesis:
(𝑯𝒐)𝟔: Customer Satisfaction has negative partial significance influence toward
Customer Loyalty.(Rejected)
(𝑯𝒂)𝟔: Customer Satisfaction has positive partial significance influence toward
Customer Loyalty. (Accepted)
This variable value is 0.000 and is less than 0.1. Thus, this variable has positive
significance influence toward customer loyalty.

81
4.5 Interpretation of Result In order to determine the result to be interpreted, the researcher will analyze the
multiple regression by using three tests, which are Coefficient C orrelation ( R ),
Coefficient determination (𝑅2), and F-test. The following results are as follow:
a. The correlation between independent variables which are Price, Product,
Place, Promotion, Brand Image, and Customer Satisfaction have a very
strong relationship toward the dependent variable which is Customer
Loyalty, with R value of 0.878 because the value is included in the
interval value between 0.8 to 1.
b. The value shown in adjusted R square is 0.755 which means that 75.5%
out of 100% of the dependent variable (Customer Loyalty) is influenced
by independent variables selected in this research (Price, Product, Place,
Promotion, Brand Image, and Customer Satisfaction).
c. The F-test showing a result of 50.885. And may be identified whether the
independent variables has significant relationship simultaneously toward
its dependent variable. The F table value is 1.839 this amount is less than
the F value which shows that indeed the independent variables (price,
product, place, promotion, brand image, customer satisfaction) together
has a strong correlation toward dependent variable (customer loyalty).
Thus, this test may indicate that the hypothesis𝑯𝒐is rejected, and 𝑯𝒂is
accepted.
This research hypothesis also may be answered by analyzing the t-test, whether
negative or positive influence is answering the hypothesis. The t-test is aiming to
see if each independent variable partially has significant influence toward the
dependent variable.

82
The t-test results are as follow:
1) Price toward customer loyalty
Hypothesis:
(𝑯𝒐)𝟏: Price has negative partial significant influence toward Customer Loyalty.
(Rejected)
(𝑯𝒂)𝟏: Price has positive partial significant influence toward Customer Loyalty
(Accepted)
T table value: 7.204, thus, the price variable is the most influential variable
towards customer loyalty of Apple users in the community.
2) Product toward customer loyalty
T table value:
Hypothesis:
(𝑯𝒐)𝟐: Product has negative partial significant influence toward Customer
Loyalty. (Accepted)
(𝑯𝒂)𝟐: Product has positive partial significant influence toward Customer
Loyalty. (Rejected)
T table value: 0.912, thus, the product variable has negative influence towards
customer loyalty of Apple users in the community.
3) Place toward customer loyalty
Hypothesis:
(𝑯𝒐)𝟑: Place has negative partial significant influence toward Customer Loyalty.
(Accepted)
(𝑯𝒂)𝟑: Place has positive partial significant influence toward Customer Loyalty.
(Rejected)
T table value: 1.573, thus, the place variable has negative influence towards
customer loyalty of Apple users in the community.

83
4) Promotion toward customer loyalty
Hypothesis:
(𝑯𝒐)𝟒: Promotion has negative partial significance influence toward Customer
Loyalty.(Accepted)
(𝑯𝒂)𝟒: Promotion has positive partial significance influence toward Customer
Loyalty. (Rejected)
T table value: 0.875, thus, the promotion variable has negative influence towards
customer loyalty of Apple users in the community.
5) Brand Image toward customer loyalty
Hypothesis:
(𝑯𝒐)𝟓: Brand Image has negative partial significance influence toward Customer
Loyalty.(Rejected)
(𝑯𝒂)𝟓: Brand Image has positive partial significance influence toward Customer
Loyalty. (Accepted)
T table value: 1.788, thus, the brand image variable has positive influence
towards customer loyalty of Apple users in the community, and is the least
influencer to the loyalty of Apple customers.
6) Customer Satisfaction toward customer loyalty
Hypothesis:
(𝑯𝒐)𝟔: Customer Satisfaction has negative partial significance influence toward
Customer Loyalty.(Rejected)
(𝑯𝒂)𝟔: Customer Satisfaction has positive partial significance influence toward
Customer Loyalty. (Accepted)
T table value: 3.667, thus, the customer satisfaction variable has positive
influence towards customer loyalty of Apple users in the community, and is the
second influencer to the loyalty of Apple customers.
84
CHAPTER V
IV. CONCLUSION AND RECOMMENDATION
5.1 Conclusion Finally, this research has came to an end, and are having several data as the result
answering the statement problem identified before, the conclusions can be drawn
from this research are as follow,
The correlation between independent variables which are price, product, place,
promotion, brand image, and customer satisfaction are strong, this indicated from
the R value can be categorized as having strong correlation since the value of R
(0.878) is between 0.8 - 1. Then, the percentage of the correlation exists between
the independent and dependent variable is 75.5%.
The independent variables had been proven were simultaneously correlated with
the dependent variable, but there were also several independent variables that do
not affecting the dependent variable such as product, place and promotion, even
though all the independent are reliable, valid, and has strong correlation toward
the dependent variable.
From the results above, it may be concluded that there are 3 independent variables
which have positive partial significant influence toward dependent variable, the
independent variables are Price, Brand Image, and Customer Satisfaction. While
the other 3 independent variables that have negative partial significant influence
toward the dependent variables are Product, Place, and Promotion. Furthermore,
the most partially influencer to customer loyalty is the Price variable, determined
by the value T accounted is 7.204, followed by customer satisfaction variable,
with T accounted for 3.667, and the last influencer is the brand image with T
accounted for 1.788.

85
Furthermore, the findings are to answer the objectives in this research,
a. To find out partial significant influence of price towards customer loyalty,
this research found that there is significant influence of price toward
customer loyalty with t-test value of 7.204.
b. To find out partial significant influence of product towards customer
loyalty, that there is no significant influence of product toward customer
loyalty.
c. To find out partial significant influence of place towards customer loyalty,
that there is no significant influence of place toward customer loyalty.
d. To find out partial significant influence of promotion towards customer
loyalty, that there is no significant influence of promotion toward
customer loyalty.
e. To find out partial significant influence of brand image/market positioning
towards customer loyalty, this research found that there is significant
influence of brand image/market positioning toward customer loyalty with
t-test value of 1.788.
f. To find out partial significant influence of customer satisfaction towards
customer loyalty, this research found that there is significant influence of
customer satisfaction toward customer loyalty with t-test value of 3.667.
g. To find out partial significant influence of price, product, place,
promotion, brand image, and customer satisfaction simultaneously toward
customer loyalty, this research found that price, product, place, promotion,
brand image, and customer satisfaction simultaneously have significant
influence toward customer loyalty with the amount of correlation is about
75.5%.

86
Finally, customer loyalty is an important aspect that have to be one of the topic
continuously concerned by a company in order to maintain its customer retain.
Especially, for a company like Apple that in a moment of when whoppers sleep
outside of stores just to be one of the first to buy an iPhone, this proves that Apple
is a company that enjoys its customer loyalty, success by a well-thought-out plane
to deliver strong products and Apple culture to be like what Apple positioning
just now.
The elements used in this research to measure the loyalty of Apple customer are
marketing mix 4Ps, brand image, and customer satisfaction. Even though there
are most variables of marketing mix did not prove to be the variables that
influence customer loyalty, still marketing mix is a powerful concept that can
makes marketing seen easy to handle, it allows the separation of marketing from
other activities of the firm, and can change a firm’s competitive position. (Chee
Lee Goi, 2009).
The most influential variable in this research is price, according to Kotler (2008)
Price is the amount of money that customer pays in order to get product or
service. Customer pays some certain amount of money and as an exchange gets
different benefits, and because pricing is also a psychological issue, due to many
people measures price with the quality of the product, this kind of psychological
issue may be the indicator of why Apple customer tend to be loyal of its products,
the measure of price to its quality may affect the customers perspective of the
premium price setting by Apple toward its products.
While the other elements of marketing mix may be taken only as a media in order
to get the products, product itself is everything that companies provide for its
customer and target market, it can mean a physical object which customer can see
and touch or it can mean service, ideas, and almost anything (Groonroos, 2005),
in this case, Apple providing various products of products and services, as
mentioned in the previous chapter about the products produced by Apple.

87
The other element is promotion, this means everything company does in order to
sell their products and services and how they tell about their products to the
customer. (Eeva Rajjakallio, 2012). While place is any way that the customer can
obtain a product or receive a service as defined by Jones (2007). In the end,
Cengiz and Yayla (2007) found marketing mix to have a positive effect toward
loyalty on word of mouth attitude, and other positive behaviors toward the
company. As the previous research done by Owomoyela, Olasunkanmi, and
Oyeniyi (2013) had proven also that marketing mix 4Ps were jointly and
independently predict customer loyalty and supported the theory used by them
that marketing mix elements have become major business tools for company to
pursue its marketing objective.
Furthermore, Armstrong, Kotler, Harker, and Brennan (2009) explain that brand
image or market positioning nowadays have become a powerful strategy to gain
customers trust, through this differentiation, customers may acknowledge a
difference even when competing offers looks the same. Pham Truy Trang (2012)
also categorized several positioning companies can set their brand into, but Apple
would include in the more for more positioning of a company that offering a
brand with comparable high quality brand and with a premium price, this
positioning needs to be applied by a company which offers the most premium
product or service and charge a higher price to cover its high costs, Apple earns a
price premium, that this spans the entire Apple product line up encompassing the
Macintosh, iPod, iPhone, iPad, and other Apple products, this also aligned with
targeting to a less price sensitive customers.
And there is a strong perception of both corporate reputation and image would
tend to increase the degree of both corporate reputation and image would tend to
increase the degree of customer loyalty, also the trust and satisfaction that
interwoven tightly with the traditional constructs such as image could
substantially contribute to loyalty (Heng Yeong Siong, Shi and Kuan, 2011;
Nguyen and Leblanc, 2001; Orth and Green, 2009). As in this research finding
that brand image or market positioning is the influential factor to Apple customer
loyalty.

88
The last factors used to measure the customer loyalty is customer satisfaction, it
depends on how customer compares a perceived of performance of a product and
their expectations, customer will get satisfied if the perceived performance is
better than their expectation. Customers who get satisfied will purchase
repeatedly and would like to share their good experience to other people (Kotler
and Armstrong, 2010).
Highly satisfied customers are finally will be much more loyal that satisfied
customers and any drop in total satisfaction results in a major drop in loyalty
(Rahsa Ali Eliwa, 2006). We may conclude that the degree of satisfaction felt by
the Apple customer is high enough to make them loyal to Apple, as well as the
accounted t table of this variable that shows as the second most influential
variable toward Apple customer loyalty.
As well as the previous research done by Rasha Ali Eliwa (2006), the research
proved that the customer satisfaction level and the image attributes could help the
operators of the fine dining restaurant operators to develop customer loyalty, and
had significant impact on overall customer loyalty of likelihood to return, and
recommendation to other customer customers.
Also the other previous research on retail market done by Khoo Chong Heng,
Kuit Sui Yeong, Lee Choon Siong, Tan Yi Shi, and Yee Mei Kuan (2011)
showed that price does not have relationship to customer loyalty, this much more
clarifying that price really is a psychological issue depends on how individual
sees price toward a product, one thinks that lower price is prove of
competitiveness, and would look to the cheaper product to buy, the other would
think price as a quality, that higher price must be neglect and only focus on its
quality.

89
5.2 Recommendation 1. Apple: This research findings can be useful for the company in order to
investigating the which factors that have influence to customer loyalty.
And the result shown that price, customer satisfaction, brand image, and
place are the most variables tested in this research which affecting
customer loyalty. The company can give more concern to improving the
variables by the dimensions used in this research. Also, maintaining to
increase the value of rejected variables which are product and promotion.
2. Future Researcher: The researcher would recommend the future research
to further assess the other 24.5% of the influencing factors beside the
tested variables in this research. Or assessing the variables rejected in this
research with problem statement of why the rejected variables did not
influence the customer loyalty, thus will be able to provide more specific
discussion regarding Marketing Mix elements, Brand Image, Customer
Satisfaction, and Customer Loyalty.

90
REFERENCES
Books
Carasco, J. (2010). Illustrated Fractions. Create Space Independent Publishing Platform.
Kotler, P. (2000). Marketing Management, Millenium Edition. New Jersey: Pearson custom publishing.
Journals
Beibei, H., Shiyang, W., & Jiahong, X. (2013). customer loyalty to coffee shop:a study of swedish generation Y.
Boonghee Yoo; Naveen Donthu; Sungho Lee. (2000). An examination of selected marketing mix elements and brand equity. Journal of the academy of marketing science.
Borden, N. H. (1964). The concept of Marketing Mix. Journal of Adevertising research.
Dennis Pitta; Frank Franzak; Danielk Fowler. (2006). A strategic approach to building onlinecustomer loyalty: integrating customer profitability piers. Journal of Consumer Marketing.
Goi, C. L. (2009). A Review of Marketing Mix: 4Ps or More? International Journal of Marketing Srudies.
Waheed Riaz; Asif Tanveer. (n.d.). Marketing Mix, not branding. Asian journal and management science.
Li, M. L., & Green, R. (n.d.). A mediating influence on customer loyalty: The role of perceived value. Journa of Management and Marketing Research .
MAo, J. (2010). custoer brand loyalty. International Journal of Business and management.
S, O., K, O., & Olasunkanmi. (2013). Investigating The Impact Of Maketing Mix Elements On Consumer Loyalty: An Epirical Study On Nigerian Breweries PLC. Journal of Contemporary Research in Business.

91
Byron Sharp; Anne Sharp. (1997). Loyalty programs and their impact on Repeat-Purchase Loyalty Patterns: a replication and extension.
Donelly, M. (2009). building customer loyalty: a customerexperience based approachin a tourism context.
Eliwa, R. A. (1993). A study of customer loyalty and the image of the fine dining restaurant.
Hooy, K. K. (2012). Customer loyalty, satisfaction and marketing mix: empirical evidencefrom infant formula industry.
ISrael, G. D. (2009). Determining sample size.
Nordman, C. (2004). Understanding Customer Loyalty and Disloyalty - The effect of loyalty-supporting and-repressing factors.
Rajakallio, E. (2012). 7P framework as a development tool for Fintouring's summer cottage holiday product.
Regina Virvilaite; Violeta Saladiene; Dalius Skindras. (2009). The relationship between price and loyalty in service industry.
Trang, P. T. (2012). The Improvement and Development of a Newly-Launched Buffet Program for Moevenpick Hotel Hanoi.
Yang, Z. (2004). Customer perceived value, satisfation, and loyalty:the role of switching cost.
Internet
Apple reports fourth quarter results. (2013, October 28). Retrieved December 2013, from Apple: www.apple.com
Jones, C. (2013, October 31). Apple continues to lose tablet market share but should rebound with the air. Retrieved December 2013, from Forbes: http://www.forbes.com/sites/chuckjones/2013/10/31/apple-continues-to-lose-tablet-market-share-but-should-rebound-with-the-air/
Clevenger, N. (2011, July 29). How the iPad conquer the Enterprises. Retrieved January 2014, from Datamation: www.datamation.com

92
Liedtke, M. (2013, October 29). Apple's earnings fall despite rising iPhone sales. Retrieved December 2013, from The Jakarta Post: http://www.thejakartapost.com/news/2013/10/29/apples-earnings-fall-despite-rising-iphone-sales.html
Reed, B. (2013, July 29). History repaet itself: Android tablet shipments blow past iPad. Retrieved December 2013, from BGR: http://bgr.com/2013/07/29/android-tablet-market-share/
Schubart, C. (2011, October 5). Apple iPhone users are most loyal. Retrieved December 2013, from Business Journal: http://www.bizjournals.com/sanjose/news/2011/10/05/apple-iphone-users-are-most-loyal.html
Statcounter mobile stats: Top 8 Monbile operating systems. (2014). Retrieved January 2014, from StatCounter: http://gs.statcounter.com/#mobile_os-ID-yearly-2010-2013
Tode, C. (2013, February 7). Apple loses top spot in brand loyalty for smartphones, tablets. Retrieved December 2013, from Mobile marketer: www.mobilemarketer.com
Understanding Apple positioning - A premium brand at a premium price. (2009, June 4). Retrieved December 2013, from Switch to A Mac: http://switchtoamac.com/site/understanding-apples-positioning-part-1-a-premium-brand-at-a-premium-price.html
Bare, R. (2007). Apple analysis report.

93
APPENDICES
QUESTIONNAIRE
Questionnaire – Analysis on influencing factors towards customer loyalty
(A Case study of Apple Inc.)
I humbly request you to fill the questionnaire below by choosing the most suitable option. Sex: (female / male) Age: (15-18 / 19-25 / 26-35 / 36-45 / >45) Occupation: (Student / Civil servant / Private company employee / Self Employed) Income level: (<2.500.000 / 2.500.000 – 5.000.000 / 5.000.000 – 8.000.000 / >8.000.000) Products: (iPod / iPhone / iPad / Macintosh / iTunes / Application Software / Other) Years of using Apple products: (1-2 years / 2-5 years / 5-8 years / >8 years) Key to options: 1 – Strongly Disagree; 2 – Disagree; 3 – Neutral; 4 – Agree; 5 – Strongly Agree Price 1 2 3 4 5 The price of Apple products is equal to its quality The Price of Apple products is premium price than other brands The discounted price of Apple products attract me more to buy Despite the higher price changing, I would still prefer Apple among other brands
Product The Apple products I received is always in good condition The Apple products is high quality The Apple products has many varieties Visual appearance of the products is attractive I find that the Apple products has physically strong I find that Apple software is attractive (e.g iTunes, iCloud, Apple iOS) I find that the Apple products quality meets my expectation Place The Apple store where I can buy the product is near with my place I can easily find the Apple store to buy the products The Apple store has an appealing décor I can easily find public transportation to the Apple store Easy layout of Apple store helps me find the needs I am looking for Promotion The Apple Products is intensively advertised The advertisements suit the brand image

94
The advertisement is impressive and make me want to buy
The Apple products has an attractive promotions for me (e.g. purchases with operator bundling such as telkomsel, xl, etc)
Brand Image/Market Positioning
I consider Apple as a strong brand
I can recognize Apple products among other competing brands
I consider Apple as a premium brand
I can quickly recall the symbol or logo of Apple
The Apple brand has a good reputation
Customer Satisfaction
I am satisfied with my decision to choose Apple product
I am satisfied towards the quality of this product
I am comfortable about the relationship with Apple
Out of other brands, Apple comes closest to my idea of an ideal products
Overall Apple products meet my needs/expectations
Customer Loyalty
I consider myself to be loyal to Apple because I feel satisfy
Apple would be my first choice
Even if another brand has the same features with Apple, I would prefer to buy Apple
I say positive things/experience about Apple products
I would recommend Apple products to those who seek my advice about such matters
I am willing to continue repurchase Apple products
I am willing to purchase other variety of Apple products

95
RESPONDENTS

96

97
(Donelly, 2009) (Borden, 1964) (MAo, 2010)

98

99
DATA TABULATION
Price Product 3 3 5 5 4.00 5 5 5 5 5 5 5 5.00 4 5 5 5 4.75 5 5 3 5 5 5 5 4.71 4 4 4 3 3.75 4 3 3 3 4 4 3 3.43 4 3 2 2 2.75 5 4 3 3 3 5 3 3.71 4 3 3 3 3.25 4 4 3 5 4 5 4 4.14 2 5 2 3 3.00 2 5 4 3 5 3 3 3.57 4 5 5 4 4.50 5 5 3 5 5 5 5 4.71 3 4 3 3 3.25 5 5 4 5 4 3 4 4.29 5 4 4 5 4.50 4 5 3 4 4 3 3 3.71 4 4 4 4 4.00 4 4 3 3 4 5 4 3.86 5 5 5 5 5.00 5 5 5 5 4 4 5 4.71 5 4 4 4 4.25 5 5 4 5 5 5 5 4.86 4 5 3 4 4.00 3 4 2 4 5 4 3 3.57 3 4 4 4 3.75 4 4 3 3 3 3 3 3.29 4 5 3 4 4.00 5 5 5 4 4 5 5 4.71 4 3 5 4 4.00 5 5 4 4 4 4 5 4.43 3 5 3 4 3.75 4 5 2 4 4 4 3 3.71 4 4 2 4 3.50 4 5 3 5 5 4 5 4.43 4 4 3 3 3.50 3 3 4 5 4 4 4 3.86 3 4 5 3 3.75 4 3 2 4 5 3 4 3.57

100
5 5 5 4 4.75 5 5 5 4 5 5 4 4.71 4 4 5 4 4.25 4 5 5 5 3 5 5 4.57 4 4 4 5 4.25 4 5 4 5 4 4 4 4.29 4 5 5 4 4.50 5 5 5 5 5 4 5 4.86 4 5 4 5 4.50 5 5 4 5 5 5 5 4.86 2 2 3 3 2.50 3 2 3 4 2 3 2 2.71 5 5 5 5 5.00 5 5 4 5 5 5 5 4.86 5 4 3 4 4.00 5 5 2 4 4 5 5 4.29 4 3 4 4 3.75 5 4 4 4 3 4 4 4.00 4 5 4 2 3.75 3 5 4 2 4 2 4 3.43 3 5 5 5 4.50 4 4 4 5 4 4 4 4.14 5 5 4 5 4.75 4 4 4 5 5 5 3 4.29 5 5 5 5 5.00 5 4 4 4 4 4 5 4.29 4 4 4 3 3.75 4 3 3 4 3 3 4 3.43 5 5 5 4 4.75 5 5 5 5 5 5 5 5.00 4 4 4 3 3.75 4 3 3 4 3 3 4 3.43 4 3 5 3 3.75 5 4 4 4 4 4 5 4.29 4 3 3 4 3.50 4 4 4 4 3 4 3 3.71 4 3 2 4 3.25 3 4 3 3 4 4 3 3.43 3 3 2 4 3.00 4 4 4 4 4 4 4 4.00 4 4 2 3 3.25 4 5 4 4 4 4 3 4.00 3 3 1 5 3.00 5 4 4 4 3 4 5 4.14 5 4 4 4 4.25 5 5 3 4 4 4 4 4.14

101
4 4 3 2 3.25 5 5 3 5 4 5 4 4.43 4 4 3 4 3.75 4 4 4 4 4 4 4 4.00 4 4 5 4 4.25 5 4 4 4 4 4 4 4.14 4 5 5 4 4.50 5 4 3 4 4 4 4 4.00 3 4 4 3 3.50 5 4 4 4 5 3 4 4.14 5 4 4 5 4.50 5 5 5 5 5 5 5 5.00 5 4 2 4 3.75 4 5 2 5 5 5 4 4.29 3 3 3 5 3.50 5 5 3 5 5 5 5 4.71 4 3 3 3 3.25 5 5 3 4 3 4 3 3.86 3 4 3 3 3.25 3 5 3 3 4 3 3 3.43 4 4 4 3 3.75 4 4 5 4 4 5 4 4.29 2 3 2 3 2.50 3 4 2 3 3 3 3 3.00 4 4 4 5 4.25 5 5 4 5 5 4 5 4.71 3 3 4 2 3.00 3 4 5 3 5 3 4 3.86 3 4 4 3 3.50 5 4 4 4 5 3 4 4.14 3 3 3 3 3.00 3 4 4 4 4 4 3 3.71 4 5 5 2 4.00 4 4 3 4 5 5 5 4.29 4 4 2 4 3.50 4 5 3 5 5 4 5 4.43 4 4 3 3 3.50 3 3 4 5 4 4 4 3.86 3 3 1 5 3.00 5 4 4 4 3 4 5 4.14 5 4 4 4 4.25 5 5 3 4 4 4 4 4.14 4 4 3 4 3.75 4 4 4 4 4 4 4 4.00 4 4 5 4 4.25 5 4 4 4 4 4 4 4.14
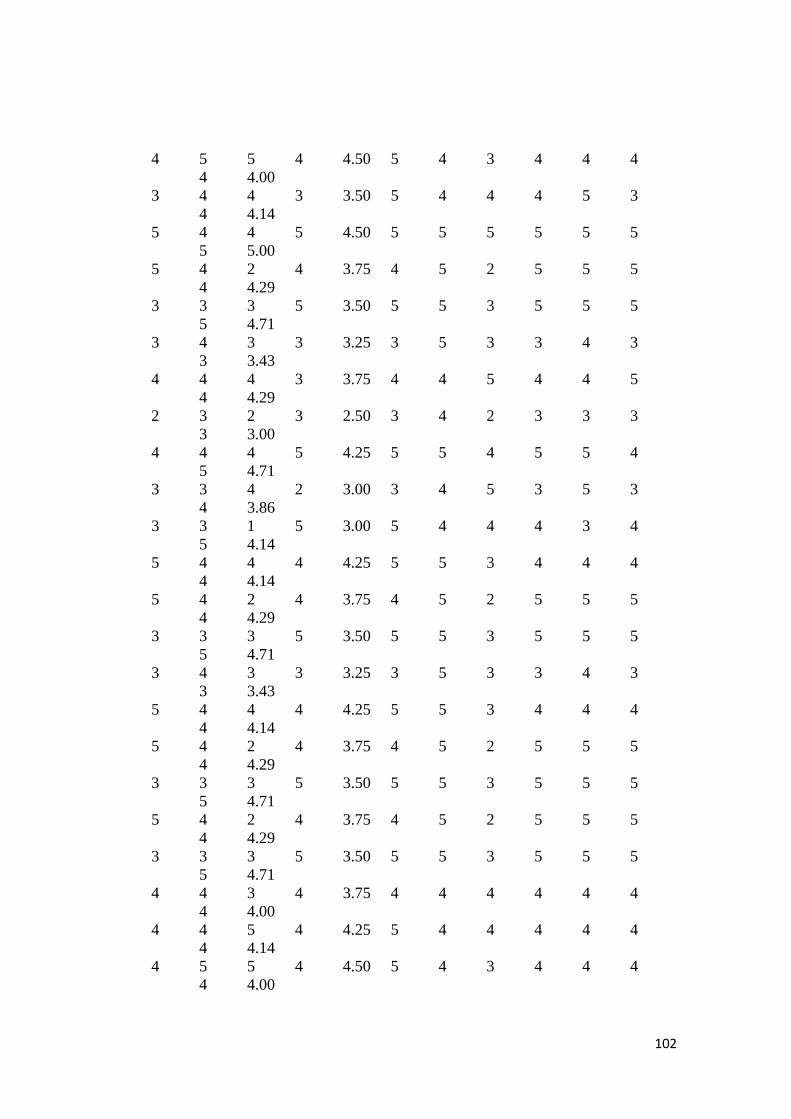
102
4 5 5 4 4.50 5 4 3 4 4 4 4 4.00 3 4 4 3 3.50 5 4 4 4 5 3 4 4.14 5 4 4 5 4.50 5 5 5 5 5 5 5 5.00 5 4 2 4 3.75 4 5 2 5 5 5 4 4.29 3 3 3 5 3.50 5 5 3 5 5 5 5 4.71 3 4 3 3 3.25 3 5 3 3 4 3 3 3.43 4 4 4 3 3.75 4 4 5 4 4 5 4 4.29 2 3 2 3 2.50 3 4 2 3 3 3 3 3.00 4 4 4 5 4.25 5 5 4 5 5 4 5 4.71 3 3 4 2 3.00 3 4 5 3 5 3 4 3.86 3 3 1 5 3.00 5 4 4 4 3 4 5 4.14 5 4 4 4 4.25 5 5 3 4 4 4 4 4.14 5 4 2 4 3.75 4 5 2 5 5 5 4 4.29 3 3 3 5 3.50 5 5 3 5 5 5 5 4.71 3 4 3 3 3.25 3 5 3 3 4 3 3 3.43 5 4 4 4 4.25 5 5 3 4 4 4 4 4.14 5 4 2 4 3.75 4 5 2 5 5 5 4 4.29 3 3 3 5 3.50 5 5 3 5 5 5 5 4.71 5 4 2 4 3.75 4 5 2 5 5 5 4 4.29 3 3 3 5 3.50 5 5 3 5 5 5 5 4.71 4 4 3 4 3.75 4 4 4 4 4 4 4 4.00 4 4 5 4 4.25 5 4 4 4 4 4 4 4.14 4 5 5 4 4.50 5 4 3 4 4 4 4 4.00

103
4 5 4 5 4.50 5 5 4 5 5 5 5 4.86 2 2 3 3 2.50 3 2 3 4 2 3 2 2.71 4 5 5 4 4.50 5 4 3 4 4 4 4 4.00 4 5 4 5 4.50 5 5 4 5 5 5 5 4.86 5 4 2 4 3.75 4 5 2 5 5 5 4 4.29 3 3 3 5 3.50 5 5 3 5 5 5 5 4.71 3 4 3 3 3.25 3 5 3 3 4 3 3 3.43 3 5 3 4 3.75 5 4 3 4 4 4 4 4.00 4 3 5 4 4.00 5 4 3 4 4 4 4 4.00 Data Tabulation Place Promotion 5 5 5 5 5 5.00 5 5 5 5 5.00 4 3 4 4 4 3.80 2 4 5 5 4.00 4 4 4 4 5 4.20 3 5 3 3 3.50 3 3 3 2 5 3.20 3 2 2 4 2.75 3 3 3 3 3 3.00 3 4 3 3 3.25 2 5 2 2 2 2.60 2 3 2 2 2.25 3 3 4 3 4 3.40 3 5 4 4 4.00 3 5 5 5 5 4.60 4 4 4 3 3.75 3 3 3 3 4 3.20 5 4 2 4 3.75 4 4 4 4 4 4.00 4 5 5 4 4.50 4 5 5 4 5 4.60 5 5 5 5 5.00 4 5 4 4 5 4.40 5 5 5 5 5.00 4 5 3 2 4 3.60 3 5 4 3 3.75 3 3 3 3 3 3.00 2 3 3 3 2.75 5 5 3 5 4 4.40 3 4 5 3 3.75 4 4 5 4 4 4.20 4 5 4 4 4.25 2 2 4 2 4 2.80 3 5 5 4 4.25 5 5 5 3 5 4.60 2 5 4 3 3.50 3 4 3 3 4 3.40 4 4 3 3 3.50 1 1 2 1 2 1.40 2 4 4 2 3.00 3 3 3 4 3 3.20 4 4 4 3 3.75 3 3 4 3 4 3.40 4 5 5 5 4.75 4 4 4 4 4 4.00 4 4 5 2 3.75 5 5 4 5 4 4.60 3 3 3 5 3.50 5 5 5 5 5 5.00 4 5 5 4 4.50

104
5 5 2 5 3 4.00 4 2 3 3 3.00 5 5 5 5 5 5.00 5 5 5 5 5.00 5 5 5 5 5 5.00 4 4 5 4 4.25 4 5 3 4 4 4.00 3 3 2 2 2.50 3 4 4 4 4 3.80 3 3 2 2 2.50 3 5 5 3 4 4.00 5 5 5 5 5.00 4 5 5 4 4 4.40 4 5 4 5 4.50 5 5 5 4 5 4.80 4 4 5 5 4.50 4 4 3 4 4 3.80 4 5 3 3 3.75 5 5 5 4 5 4.80 4 5 5 4 4.50 4 4 3 4 4 3.80 4 5 3 3 3.75 2 4 4 4 5 3.80 4 4 4 4 4.00 2 3 4 5 4 3.60 3 5 4 3 3.75 2 3 3 3 3 2.80 3 3 3 2 2.75 3 4 3 4 4 3.60 4 4 4 2 3.50 3 4 3 3 3 3.20 3 4 4 3 3.50 5 5 4 5 3 4.40 4 4 4 5 4.25 3 5 4 4 4 4.00 4 5 4 5 4.50 4 4 4 3 3 3.60 3 4 3 3 3.25 4 4 4 5 4 4.20 4 4 4 4 4.00 4 4 3 4 4 3.80 3 3 3 3 3.00 5 5 3 5 3 4.20 3 3 3 4 3.25 4 4 3 4 3 3.60 3 3 3 4 3.25 5 5 4 5 5 4.80 4 5 5 5 4.75 2 3 4 2 4 3.00 1 2 2 3 2.00 5 5 5 4 5 4.80 5 5 5 5 5.00 4 3 4 5 5 4.20 3 4 5 5 4.25 2 2 3 2 2 2.20 2 3 3 3 2.75 2 2 4 2 4 2.80 4 4 4 4 4.00 4 3 3 3 2 3.00 3 3 3 3 3.00 4 3 3 3 3 3.20 3 4 3 4 3.50 4 2 5 1 5 3.40 1 4 4 3 3.00 4 4 3 4 3 3.60 3 3 3 4 3.25 1 2 2 2 2 1.80 3 3 2 3 2.75 4 4 4 3 3 3.60 4 4 3 3 3.50 5 5 5 3 5 4.60 2 5 4 3 3.50 3 4 3 3 4 3.40 4 4 3 3 3.50 5 5 4 5 3 4.40 4 4 4 5 4.25 3 5 4 4 4 4.00 4 5 4 5 4.50 4 4 4 5 4 4.20 4 4 4 4 4.00 4 4 3 4 4 3.80 3 3 3 3 3.00 5 5 3 5 3 4.20 3 3 3 4 3.25 4 4 3 4 3 3.60 3 3 3 4 3.25 5 5 4 5 5 4.80 4 5 5 5 4.75 2 3 4 2 4 3.00 1 2 2 3 2.00 5 5 5 4 5 4.80 5 5 5 5 5.00 2 2 3 2 2 2.20 2 3 3 3 2.75

105
2 2 4 2 4 2.80 4 4 4 4 4.00 4 3 3 3 2 3.00 3 3 3 3 3.00 4 3 3 3 3 3.20 3 4 3 4 3.50 4 2 5 1 5 3.40 1 4 4 3 3.00 5 5 4 5 3 4.40 4 4 4 5 4.25 3 5 4 4 4 4.00 4 5 4 5 4.50 2 3 4 2 4 3.00 1 2 2 3 2.00 5 5 5 4 5 4.80 5 5 4 5 4.75 2 2 3 2 2 2.20 2 3 3 3 2.75 3 5 4 4 4 4.00 4 5 4 5 4.50 2 3 4 2 4 3.00 1 2 2 3 2.00 5 5 5 4 5 4.80 5 5 4 5 4.75 2 3 4 2 4 3.00 1 2 2 3 2.00 5 5 5 4 5 4.80 5 5 5 5 5.00 4 4 4 5 4 4.20 4 4 4 4 4.00 4 4 3 4 4 3.80 3 3 3 3 3.00 5 5 3 5 3 4.20 3 3 3 4 3.25 5 5 5 5 5 5.00 4 5 5 4 4.50 5 5 2 5 3 4.00 4 2 3 3 3.00 5 5 3 5 3 4.20 3 3 3 4 3.25 5 5 5 5 5 5.00 4 5 5 4 4.50 2 3 4 2 4 3.00 1 2 2 3 2.00 5 5 5 4 5 4.80 5 5 5 5 5.00 2 2 3 2 2 2.20 2 3 3 3 2.75 5 5 3 5 3 4.20 3 3 3 4 3.25 5 5 3 5 3 4.20 3 3 3 4 3.25 Data Tabulation Brand Image Customer Satisfaction 5 5 4 4 5 4.60 3 3 5 5 5 4.20 5 5 5 5 5 5.00 5 5 5 5 5 5.00 5 5 5 5 5 5.00 4 4 3 3 4 3.60 2 4 5 5 5 4.20 5 5 5 3 5 4.60 5 5 5 5 5 5.00 5 5 3 4 4 4.20 5 2 5 5 5 4.40 4 4 3 3 4 3.60 5 5 5 5 5 5.00 5 5 5 4 5 4.80 4 5 5 5 5 4.80 4 4 4 4 4 4.00

106
4 3 4 5 4 4.00 4 5 4 4 4 4.20 5 5 4 5 4 4.60 4 4 4 4 4 4.00 5 5 5 5 5 5.00 4 5 5 5 5 4.80 5 4 3 5 5 4.40 5 5 5 5 5 5.00 5 5 5 5 4 4.80 4 4 4 3 2 3.40 3 3 3 5 4 3.60 3 4 3 4 4 3.60 3 3 5 4 5 4.00 5 4 5 3 4 4.20 4 4 5 4 5 4.40 4 5 5 4 4 4.40 3 3 4 4 4 3.60 3 4 5 4 4 4.00 5 5 5 5 5 5.00 5 5 5 5 5 5.00 5 4 4 3 4 4.00 4 3 4 4 4 3.80 4 4 4 4 3 3.80 4 3 3 3 4 3.40 4 4 5 4 4 4.20 5 4 5 4 4 4.40 5 5 5 5 5 5.00 5 5 5 5 5 5.00 5 2 5 5 5 4.40 5 4 4 5 3 4.20 5 5 5 5 5 5.00 5 5 4 5 3 4.40 5 5 5 4 5 4.80 5 5 5 4 5 4.80 3 3 2 3 2 2.60 3 2 3 3 2 2.60 5 4 5 5 5 4.80 5 5 5 5 5 5.00 5 5 5 5 5 5.00 5 5 5 5 5 5.00 5 4 4 5 5 4.60 5 4 4 3 4 4.00 3 3 4 3 4 3.40 3 4 3 3 2 3.00 5 5 5 5 4 4.80 4 4 4 4 4 4.00

107
4 5 4 5 5 4.60 4 4 5 4 4 4.20 4 4 5 5 3 4.20 5 5 4 4 4 4.40 4 5 3 3 5 4.00 4 4 4 3 3 3.60 4 5 5 4 5 4.60 5 5 4 4 4 4.40 4 5 3 3 5 4.00 4 4 4 3 3 3.60 4 4 4 4 5 4.20 4 4 4 4 4 4.00 3 5 4 3 4 3.80 3 5 4 3 5 4.00 3 3 3 2 4 3.00 4 3 3 3 3 3.20 4 4 4 2 4 3.60 4 4 4 4 4 4.00 3 4 3 3 4 3.40 4 4 3 3 4 3.60 4 4 4 5 4 4.20 4 4 5 5 5 4.60 4 5 4 5 5 4.60 5 5 5 4 4 4.60 3 4 3 3 5 3.60 4 5 4 4 4 4.20 4 3 4 4 5 4.00 4 4 4 4 4 4.00 3 3 3 3 4 3.20 5 4 4 4 4 4.20 3 4 3 4 3 3.40 4 4 4 4 4 4.00 3 3 3 4 4 3.40 4 4 3 3 4 3.60 4 5 5 5 3 4.40 5 5 5 5 4 4.80 3 3 4 3 5 3.60 5 5 5 5 3 4.60 5 5 5 5 5 5.00 5 5 4 4 4 4.40 3 4 5 5 5 4.40 3 3 3 3 5 3.40 4 3 4 3 5 3.80 4 3 4 3 3 3.40 4 4 4 4 4 4.00 4 5 4 5 4 4.40

108
3 3 3 3 3 3.00 4 3 3 3 3 3.20 4 4 3 4 5 4.00 5 5 5 4 4 4.60 3 4 4 3 3 3.40 3 3 3 3 3 3.00 3 3 3 4 4 3.40 4 4 3 3 4 3.60 3 3 4 3 4 3.40 4 4 3 4 3 3.60 4 4 3 3 4 3.60 4 5 4 4 4 4.20 5 5 4 3 4 4.20 5 5 5 5 5 5.00 4 4 3 3 4 3.60 4 3 4 4 4 3.80 3 4 4 5 4 4.00 4 4 5 5 5 4.60 4 5 4 5 5 4.60 5 5 5 4 4 4.60 4 4 4 4 5 4.20 4 4 4 4 4 4.00 3 3 3 3 4 3.20 5 4 4 4 4 4.20 3 3 3 4 3 3.20 4 4 4 4 4 4.00 3 3 3 4 4 3.40 4 4 3 3 4 3.60 4 5 5 5 3 4.40 5 5 5 5 4 4.80 4 3 4 3 5 3.80 5 5 5 5 3 4.60 5 5 5 5 5 5.00 5 5 4 4 4 4.40 4 3 3 3 5 3.60 4 3 4 3 3 3.40 4 4 4 4 4 4.00 4 5 4 5 4 4.40 3 3 3 3 3 3.00 4 3 3 3 3 3.20 3 4 3 4 5 3.80 5 5 5 4 4 4.60 3 4 4 3 4 3.60 3 3 3 3 3 3.00 4 4 4 5 4 4.20 4 4 5 5 5 4.60

109
4 5 4 5 5 4.60 5 5 5 4 4 4.60 4 4 3 3 5 3.80 5 5 5 5 3 4.60 5 5 4 5 5 4.80 5 5 4 4 4 4.40 3 3 3 3 5 3.40 4 3 4 3 3 3.40 4 5 4 5 5 4.60 5 5 5 4 4 4.60 4 3 3 3 5 3.60 5 5 5 5 3 4.60 5 5 4 5 5 4.80 5 5 4 4 4 4.40 4 4 4 3 5 4.00 5 5 5 5 3 4.60 5 5 5 5 5 5.00 5 5 4 4 4 4.40 4 4 4 4 5 4.20 4 4 4 4 4 4.00 3 3 3 3 4 3.20 5 4 4 4 4 4.20 3 3 3 4 3 3.20 4 4 4 4 4 4.00 4 5 5 4 5 4.60 5 5 5 4 5 4.80 4 2 3 3 4 3.20 3 3 3 3 3 3.00 3 3 3 4 3 3.20 4 4 4 4 4 4.00 4 5 5 4 5 4.60 5 5 5 4 5 4.80 3 4 3 3 4 3.40 5 5 5 5 3 4.60 5 5 5 5 5 5.00 5 5 4 4 4 4.40 3 3 3 3 4 3.20 4 3 4 3 3 3.40
3 3 3 4 3 3.20 4 4 4 4 4 4.00 3 3 3 4 3 3.20 4 4 4 4 4 4.00

110
Data Tabulation Customer Loyalty 5 5 5 5 5 5 5 5.00 5 4 5 5 5 5 5 4.86 3 3 3 4 4 3 3 3.29 5 2 3 4 3 3 3 3.29 4 3 3 4 4 4 4 3.71 2 3 3 4 4 3 2 3.00 4 4 4 4 4 4 3 3.86 4 4 4 4 4 5 5 4.29 5 5 3 3 3 4 4 3.86 4 4 3 4 4 4 4 3.86 5 5 5 5 5 5 5 5.00 5 5 5 5 5 5 5 5.00 3 3 4 4 4 4 3 3.57 3 3 3 3 3 5 3 3.29 3 3 3 3 3 3 4 3.14 4 5 5 4 4 4 4 4.29 3 4 5 4 4 5 4 4.14 5 5 5 5 5 5 5 5.00 4 4 4 4 4 4 3 3.86 4 2 3 3 4 3 4 3.29 5 5 4 5 4 5 4 4.57 5 5 5 5 5 5 5 5.00 5 5 5 4 4 5 4 4.57 4 5 5 5 5 5 5 4.86 5 5 4 5 5 5 5 4.86 3 3 3 4 3 2 3 3.00 5 5 5 5 5 5 5 5.00 5 5 5 5 5 5 4 4.86 4 4 4 5 3 3 3 3.71 4 4 5 4 2 3 3 3.57 4 3 5 5 5 4 4 4.29 5 5 5 4 5 5 4 4.71 4 5 5 5 5 5 5 4.86 4 4 4 4 3 4 4 3.86 4 5 5 5 4 5 4 4.57 4 4 4 4 3 4 4 3.86 4 4 3 5 3 4 4 3.86 3 4 3 3 4 3 4 3.43 3 4 3 2 4 3 4 3.29 4 3 3 2 4 4 4 3.43 5 4 4 2 3 3 4 3.57 5 3 3 1 5 3 3 3.29 4 5 4 4 4 5 5 4.43 3 4 4 3 2 4 4 3.43 4 4 4 3 4 3 3 3.57

111
4 4 4 5 4 4 3 4.00 3 4 5 5 4 4 3 4.00 4 3 4 4 3 3 3 3.43 5 5 4 4 5 4 4 4.43 5 5 4 2 4 5 5 4.29 4 3 3 3 5 5 5 4.00 3 4 3 3 3 3 4 3.29 3 3 4 3 3 3 3 3.14 4 4 4 4 3 4 4 3.86 3 2 3 2 3 4 4 3.00 4 4 4 4 5 4 4 4.14 5 3 3 4 2 3 3 3.29 4 3 4 4 3 3 3 3.43 3 3 3 3 3 4 4 3.29 4 4 5 5 2 3 3 3.71 5 4 4 2 4 5 5 4.14 4 4 4 3 3 4 3 3.57 5 3 3 1 5 3 3 3.29 4 5 4 4 4 5 5 4.43 4 4 4 3 4 3 3 3.57 4 4 4 5 4 4 3 4.00 3 4 5 5 4 4 3 4.00 4 3 4 4 3 3 3 3.43 5 5 4 4 5 5 5 4.71 5 5 4 2 4 5 5 4.29 4 3 3 3 5 5 5 4.00 3 3 4 3 3 3 3 3.14 4 4 4 4 3 4 4 3.86 3 2 3 2 3 4 4 3.00 4 4 4 4 5 4 4 4.14 5 3 3 4 2 3 3 3.29 5 3 3 1 5 3 3 3.29 4 5 4 4 4 5 5 4.43 5 5 4 2 4 5 5 4.29 4 3 3 3 5 5 5 4.00 3 3 4 3 3 3 3 3.14 4 5 4 4 4 5 5 4.43 5 5 4 2 4 5 5 4.29 4 3 3 3 5 5 5 4.00 5 5 4 2 4 5 5 4.29 4 3 3 3 5 5 5 4.00 4 4 4 3 4 3 3 3.57 4 4 4 5 4 4 3 4.00 3 4 5 5 4 4 3 4.00 5 4 5 4 5 5 5 4.71 4 2 2 3 3 4 3 3.00 3 4 5 5 4 4 3 4.00

112
5 4 5 4 5 5 5 4.71 5 5 4 2 4 5 5 4.29 4 3 3 3 5 5 5 4.00 3 3 4 3 3 3 3 3.14 3 3 5 3 4 4 3 3.57 3 4 3 5 4 4 3 3.71
Related Documents