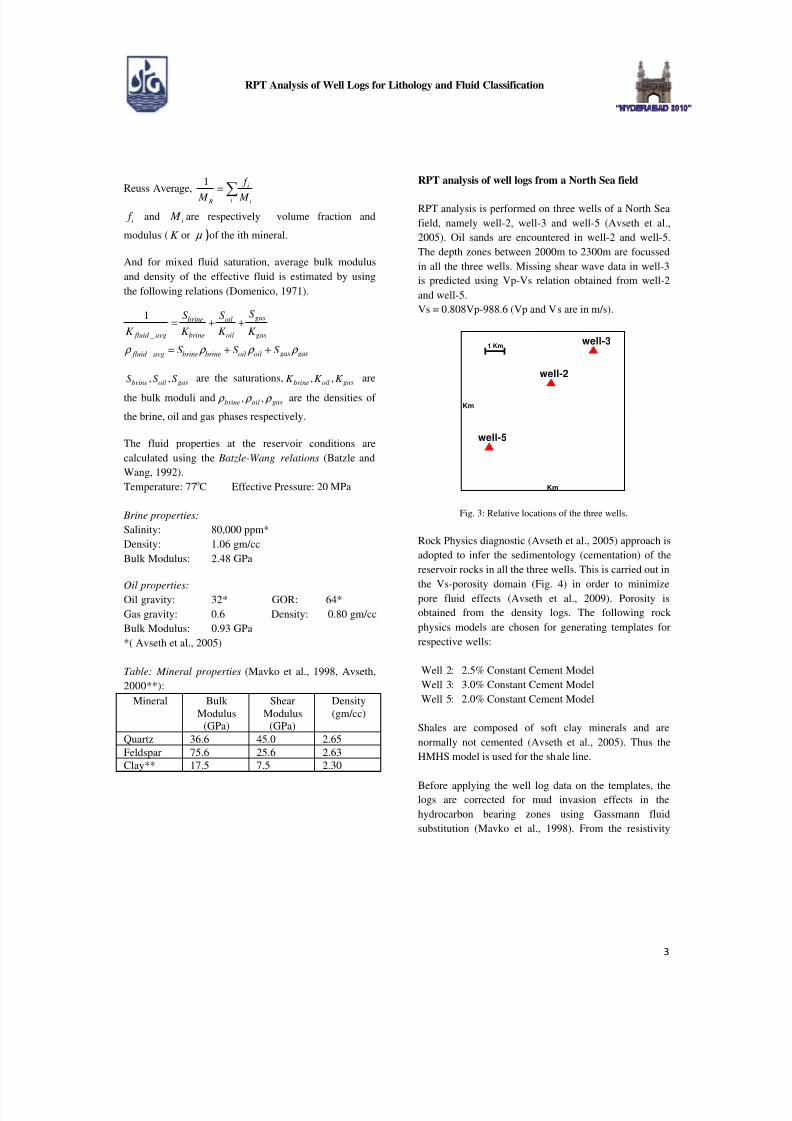
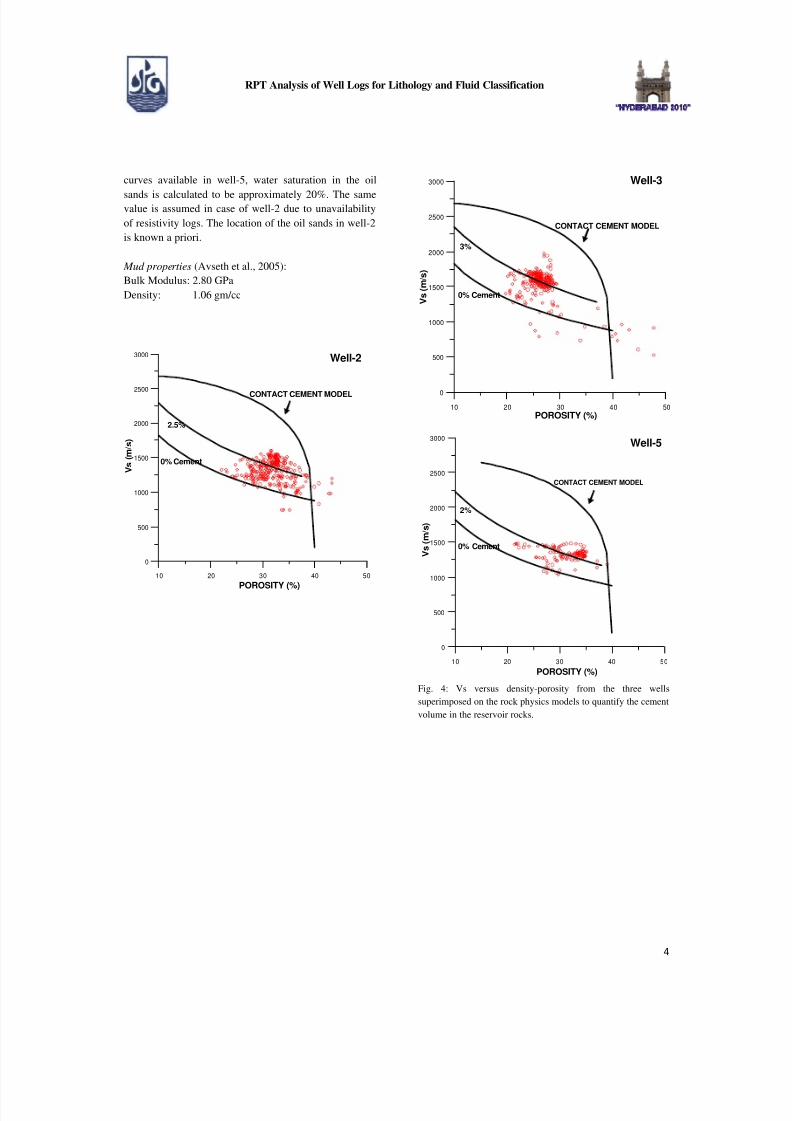
R.N. 201-D, Sapphire Hostel, Indian Schoo l of Mines , Dhanba d, Jharkha nd-826004 , India email: [email protected] P-55 Rock Physics Template (RPT) Analysis of Well Logs for Lithology and Fluid Classification Nabajyoti Boruah Final Year, M.Sc.Tech. (Applied Geophysics) Departmen t of Applied Geophysics, Indian School of Mines, Dhanbad Summary Rock Physics Templat es (RPTs) are geological ly constraine d rock physic s models that serve as tools for litholog y and fluid prediction (Avseth et al., 2005). Rock physic s diagnostic models and Gassman n fluid substitution relations are essentia l ingredients in generating the templates for a reservoir. RPT analysis of well log data is necessary to calibrate the templates to local geology before applying them on seismic data. RPT can serve as a powerful tool in validating hydrocarbon anomalies and mitigating exploration risks. The success of RPT analysis depends on the choice of proper model and correct geological information of the reservoir. RPT analysis is carried out on three wells of a North Sea field. Oil sands are encount ered in two wells. A qualita tive prediction of the nature of reservoir and cap rocks, along with a quantitative assessment of cement volume, porosi ty and saturation of the oil sands are attempted using the templates. Introduction Rock Physics establishes a link between the elastic properties and the reservoir properties such as porosity, water saturation and clay content. As seismic signatures are directly governed by these elastic parameters, rock physics template (RPT) provides a methodology to infer the geology of the reservoir, both qualitatively and quantitatively from these signatures. The template is a crossplot of elastic parameters obtained theoretically from rock physics models, constrained by local geology. When the field data (well logs or seismic inversion results) are superimposed on the template, different geologic trends can be identified in the dataset (Fig. 1) and accordingly different clusters or populations are classified. The common form of RPT is between acoustic impedance (AI) and Vp/Vs ratio , as combination of these two elastic properties is a good lithology and fluid indicator (Avseth et al., 2005, Chi and Han, 2009). Other forms of RPT include combination of shear impedance (SI) and AI, elastic impedance (EI) and AI and Lame’s parameter (λ ) and shear modulus (µ). 2000 4000 6000 8000 10000 1.5 2 2.5 3 3.5 4 10 20 30 39 5 15 25 35 45 55 65% ACOUSTIC IMPEDANCE (gm/cc x m/s) Vp/Vs Shale Brine-sand Oil-sand Sw=1 Sw=0 A B C D % A: Increasing s haliness B: Increasing porosity C: Increasing o il saturation D: Increasing ce mentation Fig. 1: Illustration of geologic trends in a RPT. 1% Constant Cement Model is used.

Welcome message from author
This document is posted to help you gain knowledge. Please leave a comment to let me know what you think about it! Share it to your friends and learn new things together.
Transcript

7/30/2019 Analysis of Well Logs
http://slidepdf.com/reader/full/analysis-of-well-logs 1/8

7/30/2019 Analysis of Well Logs
http://slidepdf.com/reader/full/analysis-of-well-logs 2/8
7/30/2019 Analysis of Well Logs
http://slidepdf.com/reader/full/analysis-of-well-logs 3/8
7/30/2019 Analysis of Well Logs
http://slidepdf.com/reader/full/analysis-of-well-logs 4/8

7/30/2019 Analysis of Well Logs
http://slidepdf.com/reader/full/analysis-of-well-logs 5/8

7/30/2019 Analysis of Well Logs
http://slidepdf.com/reader/full/analysis-of-well-logs 6/8

7/30/2019 Analysis of Well Logs
http://slidepdf.com/reader/full/analysis-of-well-logs 7/8
7/30/2019 Analysis of Well Logs
http://slidepdf.com/reader/full/analysis-of-well-logs 8/8
Related Documents