RDL 740 Technology for Utilization of Wastelands & Weeds Analysis of Andhra Pradesh Submitted by :- Akash Sharma (2010ME10644) Apurv Chauhan (2010CE10333) Divyam Rastogi (2010CE10343) Centre for Rural Development & Technology Indian Institute of Technology Delhi

Analysis of wastelands in Andhra Pradesh
Oct 29, 2015
Analysis of wastelands in Andhra Pradesh, India
Welcome message from author
This document is posted to help you gain knowledge. Please leave a comment to let me know what you think about it! Share it to your friends and learn new things together.
Transcript

RDL 740
Technology for Utilization of
Wastelands & Weeds
Analysis of Andhra Pradesh
Submitted by :-
Akash Sharma (2010ME10644)
Apurv Chauhan (2010CE10333)
Divyam Rastogi (2010CE10343)
Centre for Rural Development & Technology
Indian Institute of Technology Delhi

OBJECTIVE
The objective of this term paper is to find out data regarding the following points in the state of
Andhra Pradesh:
NREGA
Person-days of works per household
Average wage cost per person day
Share of women (%),
Highest share of work in a category (%),
Shelf of works
Poverty
% population BPL
Food Security
% Literacy
Wasteland
% area under WL/Ha;
Major issue-water/soil/slopes/marginal lands/deforestation
Also to find the following correlations:
Correlations between Food Security, % Literacy, % area under WL/Ha with Person days of
work per household in separate plots based on district level data
State wise average of the above data
Qualitative assessment of relationship between highest share of work in category, shelf of
works with the major issue responsible for wasteland generation in that area.
SAMPLE SIZE:
22 DISTRICTS of Andhra Pradesh.

RAW DATA
The following table gives the distribution of all the above parameters district wise:
District Literacy Rate(%)
Distribution of wasteland(% of total area)
Households having BPL Cards(%)
Adilabad 61.55 12.61 86.8
Anantpur 64.28 18.73 88.2
Chittor 72.36 22.59 88.2
East Godavari 71.35 5.12 79
Guntur 67.99 10.91 74
Karimnagar 64.87 11.06 79.1
Khammam 65.54 4.36 81.7
Krishna 74.37 5.32 76.9
Kurnool 61.13 14.97 85.1
Mahbubnagar 56.06 11.52 95
Medak 62.53 13.65 87.4
Nalgonda 65.05 11.4 87
Nellore 69.15 18.4 78.9
Nizamabad 62.25 16.98 84.1
Prakasam 63.53 17.17 73.9
Rangareddy 78.05 11.3 72.2
Srikakulam 62.3 14.42 90.1
Visakapatnam 67.7 22.37 73.8
Vizianagarm 59.49 16.42 87.3
Warangal 66.16 11.09 87.2
West Godavari 74.32 1.59 86.4
Y.S.R 67.88 27.15 86.7
Statewise average 64.4 14.3 80.1

Rural Connectivity(in lakhs) Flood Control(in lakhs) Water Conservation And Water
Herversting(in lakhs)
comp. Ongoing/Suspended
Approved not in
progress comp. Ongoing/Suspended
Approved not in
progress comp. Ongoing/Suspended
Approved not in
progress
347 2412 1490 7 586 34 9350 115656 10317
85 963 654 25 372 21 5223 104550 5464
44 1373 229 60 707 114 7081 60781 9180
464 4255 1052 2340 7802 288 1893 34131 155
169 1600 476 64 4752 7 781 21578 61
43 5560 1389 6 1893 125 2406 126970 2348
54 3259 2088 30 2101 192 7380 89981 1073
358 2478 1354 286 5084 253 2599 28731 2864
55 2231 2216 15 741 48 9992 98356 7683
35 1090 1071 29 280 3 2565 188603 8766
158 5209 2051 2 953 63 1981 125595 3697
311 3793 2436 77 783 26 6631 170340 7121
234 1564 873 410 2010 396 1137 40808 5542
208 2011 2714 61 364 242 4077 36542 15372
462 3707 2616 74 1945 181 1686 49381 4533
8 617 1238 3 27 0 6668 66236 804
121 3140 2142 14 890 128 778 22228 9938
86 2263 1404 9 997 167 1698 82376 14267
155 4524 3593 28 576 67 1766 50528 2691
23 3127 1687 3 760 6 3908 127024 590
230 1858 774 301 5493 650 448 12716 0
54 795 398 72 635 106 1781 48518 2937
3704 57829 33945 3916 39751 3117 81829 1701629 115403
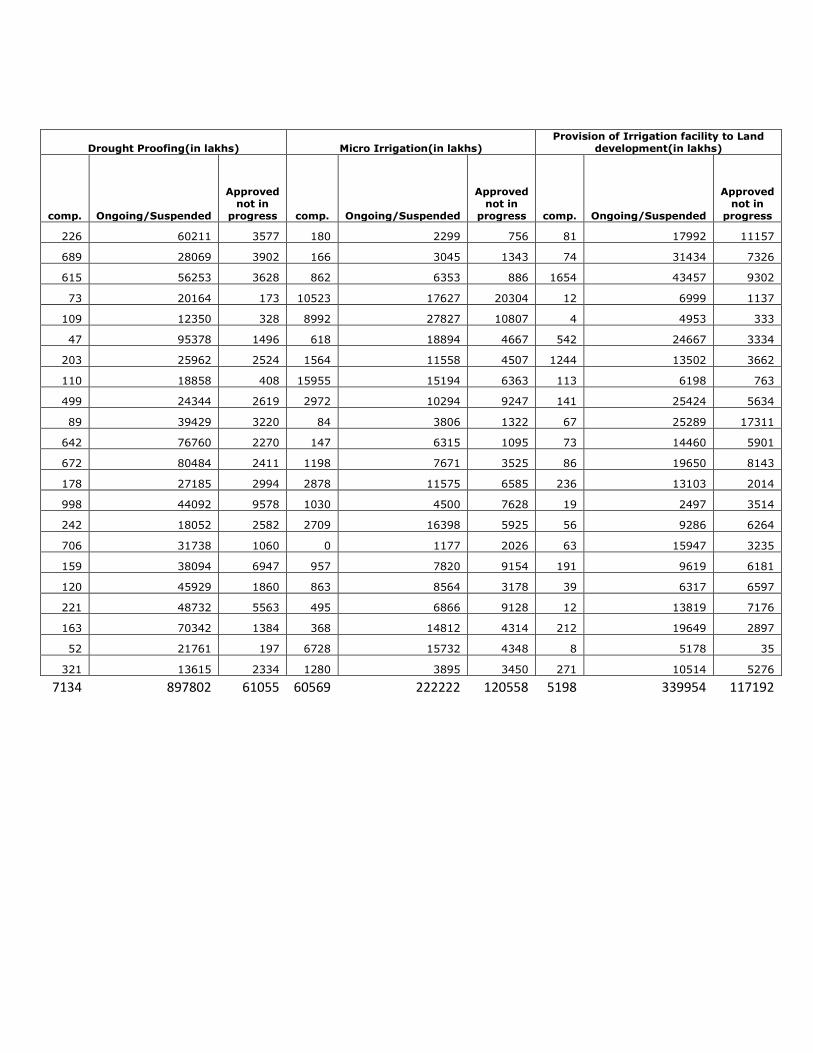
Drought Proofing(in lakhs) Micro Irrigation(in lakhs) Provision of Irrigation facility to Land
development(in lakhs)
comp. Ongoing/Suspended
Approved not in
progress comp. Ongoing/Suspended
Approved not in
progress comp. Ongoing/Suspended
Approved not in
progress
226 60211 3577 180 2299 756 81 17992 11157
689 28069 3902 166 3045 1343 74 31434 7326
615 56253 3628 862 6353 886 1654 43457 9302
73 20164 173 10523 17627 20304 12 6999 1137
109 12350 328 8992 27827 10807 4 4953 333
47 95378 1496 618 18894 4667 542 24667 3334
203 25962 2524 1564 11558 4507 1244 13502 3662
110 18858 408 15955 15194 6363 113 6198 763
499 24344 2619 2972 10294 9247 141 25424 5634
89 39429 3220 84 3806 1322 67 25289 17311
642 76760 2270 147 6315 1095 73 14460 5901
672 80484 2411 1198 7671 3525 86 19650 8143
178 27185 2994 2878 11575 6585 236 13103 2014
998 44092 9578 1030 4500 7628 19 2497 3514
242 18052 2582 2709 16398 5925 56 9286 6264
706 31738 1060 0 1177 2026 63 15947 3235
159 38094 6947 957 7820 9154 191 9619 6181
120 45929 1860 863 8564 3178 39 6317 6597
221 48732 5563 495 6866 9128 12 13819 7176
163 70342 1384 368 14812 4314 212 19649 2897
52 21761 197 6728 15732 4348 8 5178 35
321 13615 2334 1280 3895 3450 271 10514 5276
7134 897802 61055 60569 222222 120558 5198 339954 117192
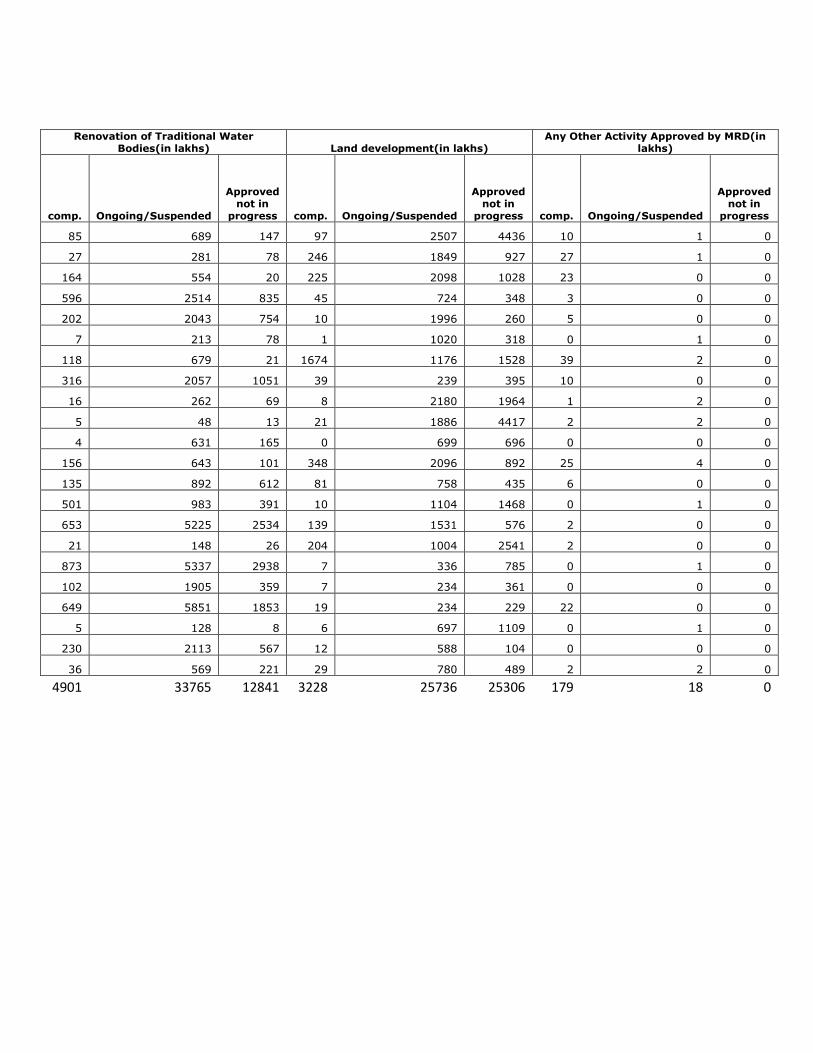
Renovation of Traditional Water Bodies(in lakhs) Land development(in lakhs)
Any Other Activity Approved by MRD(in lakhs)
comp. Ongoing/Suspended
Approved not in
progress comp. Ongoing/Suspended
Approved not in
progress comp. Ongoing/Suspended
Approved not in
progress
85 689 147 97 2507 4436 10 1 0
27 281 78 246 1849 927 27 1 0
164 554 20 225 2098 1028 23 0 0
596 2514 835 45 724 348 3 0 0
202 2043 754 10 1996 260 5 0 0
7 213 78 1 1020 318 0 1 0
118 679 21 1674 1176 1528 39 2 0
316 2057 1051 39 239 395 10 0 0
16 262 69 8 2180 1964 1 2 0
5 48 13 21 1886 4417 2 2 0
4 631 165 0 699 696 0 0 0
156 643 101 348 2096 892 25 4 0
135 892 612 81 758 435 6 0 0
501 983 391 10 1104 1468 0 1 0
653 5225 2534 139 1531 576 2 0 0
21 148 26 204 1004 2541 2 0 0
873 5337 2938 7 336 785 0 1 0
102 1905 359 7 234 361 0 0 0
649 5851 1853 19 234 229 22 0 0
5 128 8 6 697 1109 0 1 0
230 2113 567 12 588 104 0 0 0
36 569 221 29 780 489 2 2 0
4901 33765 12841 3228 25736 25306 179 18 0

Rajiv Gandhi Seva Kendra(in lakhs) Coastal Areas(in lakhs) Rural Drinking Water(in lakhs)
comp. Ongoing/Suspended
Approved not in
progress comp. Ongoing/Suspended
Approved not in
progress comp. Ongoing/Suspended
Approved not in
progress
0 269 4 0 0 0 0 0 0
0 140 0 0 0 0 0 0 0
3 352 10 0 0 0 0 0 0
0 179 0 0 0 0 0 0 0
0 195 0 0 0 0 0 0 0
0 183 1 0 0 0 0 0 0
0 92 0 0 0 0 0 0 0
0 83 0 0 0 0 0 0 0
0 523 3 0 0 0 0 0 0
0 243 2 0 0 0 0 0 0
0 268 1 0 0 0 0 0 0
0 222 0 0 0 0 0 0 0
0 319 24 0 0 0 0 0 0
0 195 2 0 0 0 0 0 0
0 335 9 0 0 0 0 0 0
0 200 0 0 0 0 0 0 0
1 209 2 0 0 0 0 0 0
23 266 1 0 0 0 0 0 0
0 326 2 0 0 0 0 0 0
0 201 0 0 0 0 0 0 0
0 41 3 0 0 0 0 0 0
0 184 1 0 0 0 0 0 0
27 5025 65 0 0 0 0 0 0
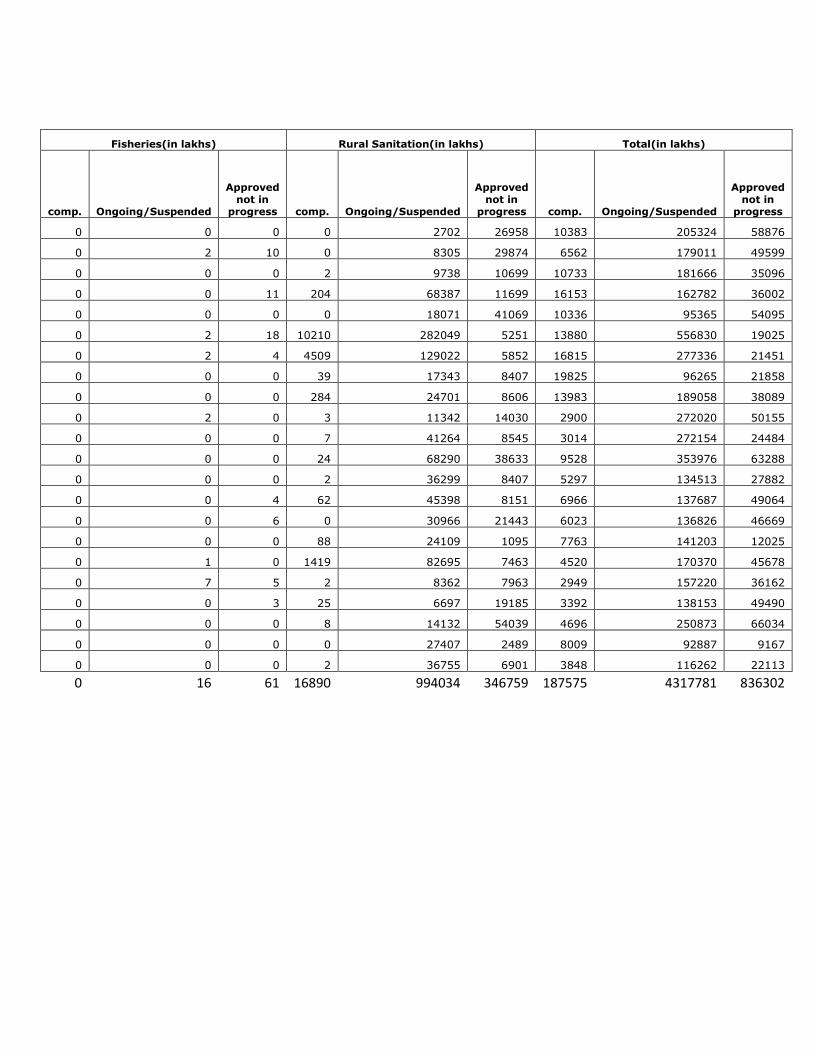
Fisheries(in lakhs) Rural Sanitation(in lakhs) Total(in lakhs)
comp. Ongoing/Suspended
Approved not in
progress comp. Ongoing/Suspended
Approved not in
progress comp. Ongoing/Suspended
Approved not in
progress
0 0 0 0 2702 26958 10383 205324 58876
0 2 10 0 8305 29874 6562 179011 49599
0 0 0 2 9738 10699 10733 181666 35096
0 0 11 204 68387 11699 16153 162782 36002
0 0 0 0 18071 41069 10336 95365 54095
0 2 18 10210 282049 5251 13880 556830 19025
0 2 4 4509 129022 5852 16815 277336 21451
0 0 0 39 17343 8407 19825 96265 21858
0 0 0 284 24701 8606 13983 189058 38089
0 2 0 3 11342 14030 2900 272020 50155
0 0 0 7 41264 8545 3014 272154 24484
0 0 0 24 68290 38633 9528 353976 63288
0 0 0 2 36299 8407 5297 134513 27882
0 0 4 62 45398 8151 6966 137687 49064
0 0 6 0 30966 21443 6023 136826 46669
0 0 0 88 24109 1095 7763 141203 12025
0 1 0 1419 82695 7463 4520 170370 45678
0 7 5 2 8362 7963 2949 157220 36162
0 0 3 25 6697 19185 3392 138153 49490
0 0 0 8 14132 54039 4696 250873 66034
0 0 0 0 27407 2489 8009 92887 9167
0 0 0 2 36755 6901 3848 116262 22113
0 16 61 16890 994034 346759 187575 4317781 836302

Person days of
work per household
Average wage
cost per person
day
66.97625 81.78
76.00672 86.94
75.25141 77.7
65.9488 77.44
43.23353 82.53
55.09987 90.34
60.27407 83.59
56.93752 82.9
54.07725 80.53
61.0879 87.95
66.77362 81.39
68.84459 87.5
47.85164 79.39
46.64589 38.72418
43.615 27.1857
62.43454 36.63427
48.63124 35.54704
56.31257 35.34749
73.82577 40.22387
40.06613 28.08834
65.21311 21.53655
39.9922 23.54
57.95907 62.12761

Person days of work per household
Inferences-
As can be seen from above the person days of work per household varies from a minimum of 40 in
districts of Warangal and YSR to a maximum of 76 in the district of Anantpur. This trend shows us
that this variable is complex and depends on a range of factors including competency of the
block/zila parishads, awareness among the people regarding NREGA activities among a host of other
factors. We see that the government mandated minimum of 100 days work is not being met in any
of the districts in Andhra Pradesh.
0
10
20
30
40
50
60
70
80
Person days of work per household

Literacy Rate
Inferences-
The average literacy rates in various districts of Andhra Pradesh range from 55 to 78 percent. The
state average is 67.66% which is less than the national average of 74.04%. Rangareddy is the only
district where the literacy rate is more than the national average.
0
10
20
30
40
50
60
70
80
90
Literacy Rates(%)

Households having BPL Cards
Inferences-
According to various news reports including in credible newspapers like The Hindu poverty data
for Andhra Pradesh is not available. This fact has also been accepted by the current Chief
Minister of Andhra Pradesh Mr. Kiran Kumar Reddy. As a result we’ve taken the data of the
percentage of households having BPL cards. Although it must be noted that this is also not a
true representation of the poverty situation in the state since the numbers are unrealistic in
many states(For example in Mahbubnagar 95% of the population has BPL cards whereas it is
unrealistic to assume that such a high percentage of people will be below poverty line). Thus it
can be safely concluded that due to the callous nature of the government agencies BPL cards
have been distributed to even those households who do not need it since they do not fall below
the poverty line.
0
10
20
30
40
50
60
70
80
90
100
Households having BPL Cards

Distribution of wastelands
Inferences-
Thus it can be concluded that YSR has the highest percentage of wastelands with 24% (wrt TGA)
whereas West Godavari has the least percentage of wastelands.
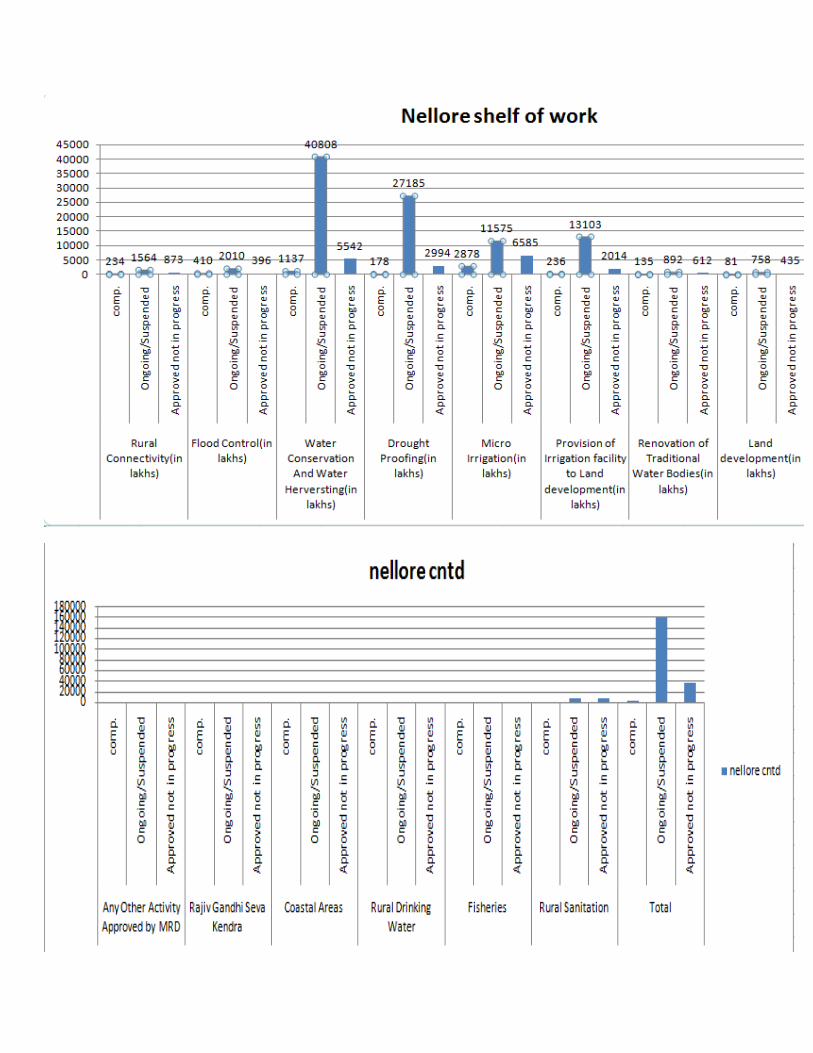
HIGHEST SHARE OF WORK IN A CATEGORY. SHELF OF WORK,PROPOSED
VERSUS EXISTING SHELF OF WORK (22*2 PLOTS)
The following graphs show the variation of shelf of work, proposed versus existing shelf of work and
the highest share of work in a category district-wise for the state of Andhra Pradesh:
0
5
10
15
20
25
30
Distribution of Wasteland


020000400006000080000
100000120000140000160000
com
p.
On
goin
g/Su
spen
ded
Ap
pro
ved
no
t in
pro
gres
s
com
p.
On
goin
g/Su
spen
ded
Ap
pro
ved
no
t in
pro
gres
s
com
p.
On
goin
g/Su
spen
ded
Ap
pro
ved
no
t in
pro
gres
s
com
p.
On
goin
g/Su
spen
ded
Ap
pro
ved
no
t in
pro
gres
s
com
p.
On
goin
g/Su
spen
ded
Ap
pro
ved
no
t in
pro
gres
s
com
p.
On
goin
g/Su
spen
ded
Ap
pro
ved
no
t in
pro
gres
s
com
p.
On
goin
g/Su
spen
ded
Ap
pro
ved
no
t in
pro
gres
s
Any Other Activity
Approved by MRD(in lakhs)
Rajiv Gandhi Seva
Kendra(in lakhs)
Coastal Areas(in
lakhs)
Rural Drinking Water(in
lakhs)
Fisheries(in lakhs)
Rural Sanitation(in
lakhs)
Total(in lakhs)
Rangareddy cntnd
Rangareddy cntnd


WASTELANDS
District-wise distribution of wastelands in Andhra Pradesh is as follows:
SOURCE: Economic Status and Utilization of Wastelands in Andhra Pradesh

From the above graph it is clear that the Chittor(number 3) has the highest percentage of
wasteland (38.76 %). Nellore(number 15) is the second districts in having highest percentage of
waste land (37.61%). Then comes the Cuddapah(number 4) having 29.93%

Correlations between Food Security, % Literacy, % area under WL/Ha with Person days of work
per household in separate plots based on district level data
Correlation between person days of work and literacy rates
Correlation coefficient= 0.034878
here the co-relation coefficient is tending to zero. Thus we see that there is no visible
relationship between the literacy rate in a particular district and the corresponding person days
of work. Perhaps this means that literacy does not necessarily correspond to an increase in
awareness among the populace. Also this means that huge government investments in the field
of education in the form of Sarva Siksha Abhiyan(SSA) are not necessarily yielding the desired
benefits. This can be overcome by introducing targeted information dissemination campaigns so
that people become aware of their rights especially those related to NREGA.
0
10
20
30
40
50
60
70
80
0 10 20 30 40 50 60 70 80 90
Pe
rso
n d
ays
of
wo
rk p
er
ho
use
ho
ld
Literacy Rates(%)

Correlation between distribution of wasteland and person days of work per household
Correlation coefficient= -0.160642069
Here also the correlation coefficient is almost zero. This reflects that there is no specific relation
between the percentage of wastelands and the person days of work per household. Although
ideally speaking the person days of work should increase with a corresponding increase in the
percentage of wastelands since now there is more land to be reclaimed thus resulting in more
work related to land development, water harvesting, dwelling related work, etc. however this is
not the case therefore we can say that the government is largely unresponsive to the actual
ground reality of each and every district and is focusing more on macro-level policies as well as
large-scale monitoring and assessment of NREGA-related works.
0
10
20
30
40
50
60
70
80
0 5 10 15 20 25 30
Pe
rso
n d
ays
of
wo
rk p
er
ho
use
ho
ld
Distribution of Wasteland(%)

CASE STUDY OF DISTRICTS
NELLORE
LAND USE 2005-06 (Area in ha): i. Forest : 2,47,000
ii.Barren and uncultivated : 1,61,000
iii.Cultivable waste : 88,000
iv. Current fallows : 38.000
v. Net area sown : 3,44,000
Climate:
The District has varied climatic conditions. The year may be divided into four seasons. The
summer season from March to May is followed by South West monsoon season which extends
up to end of September, October and November constitute the retreating monsoon or post
monsoon season. The period from December to February is the North East monsoon season.
Rainfall:
Normal Annual Rainfall : 1088 mm
Southwest monsoon : 333 mm
Northeast monsoon : 649 mm
Cumulative departure for the last 5 years from normal : 13 percent.
Wasteland development Programme implemented by the District :
Development of wastelands mainly in non-forest areas aimed at checking land degradation,
putting such wastelands to SUSTAINABLE use and increasing bio-mass i.e. food, fuel wood,
fodder, fruits, fiber and small timber. Degraded land which can be brought under vegetative
cover, with reasonable effort, and which is currently under utilized and land which is
deteriorating for lack of appropriate water and soil management or on account of natural causes.
Out of 313 Watersheds sanctioned, 277 watersheds are completed and 36 are in progress.
Rs. 3147.87 lakhs was spent on completed watersheds for treating 63,399 Ha of land.

Proposed 12 Watersheds for treating 6000 Ha of land with a project cost Rs. 360.00 lakhs
under IWDP –VIII scheme.
Ongoing Watersheds :-
Rs. 360.00 lakhs was sanctioned under IWDP – V programme and Rs.137.50 lakhs was
spent for treating of 1420Ha as against Rs. 161.63 lakhs releases.
Rs. 360.00 lakhs was sanctioned under IWDP – VI programme and Rs.144.17 lakhs was
spent for treating of 1600 Ha as against Rs 155.31 lakhs releases.
Rs.360.00 lakhs was sanctioned under IWDP – VII programme and Rs.101.38 lakhs was
spent for treating of 1770Ha as against Rs. 155.38 lakhs releases.
INDIRA PRABHA (COMPREHENSIVE LAND DEVELOPMENT PROJECT)
The main object of the project is to identify the fallow and undeveloped lands of the poor
particularly the assigned and surplus lands and to develop them comprehensively by involving
the beneficiaries so that they could get sustainable livelihood. This project has been launched by
Hon‟ble Chief Minister of Andhra Pradesh on 19.11.2004 in Naginenigunta village of Marripadu
mandal. This programme is funded by NABARD and will be implemented in two phases under
RIDF –IX and RIDF –X in a period of 3 years.
Under RIDF –IX an amount of Rs. 600.00 lakhs has been sanctioned to Nellore District for
implementation of C.L.D.P in 44 mandals. So far 83 blocks have been identified in 44 mandals
for development of 3422 Ha covering 7210 beneficiaries and administrative sanction has been
accorded for Rs. 600.00 lakhs for all the blocks. An amount of Rs. 100.00 lakhs was released to
Nellore District during the year 2004-05 and the total amount was re-allotted to the C.I.G s the
works like , Bush Clearing , Stone clearing and Land leveling are under progress.
Regarding RIDF –X proposals 3566.94 lakhs were submitted to the Government for
implementation of CLDP in 139 blocks of 46 mandals for development of 6032 Ha covering
12,190 beneficiaries. The government have sanctioned Rs 3566.94 lakhs under RIDF –X and
releases are awaited.

APWALTA
In G.O Ms. No 224 PR & RD (RD – VI) dated 15.6.2002, the Govt of A.P has constituted a
comprehensive act called A.P Water Land and Trees Act 2002 to promote water conservation and
tree cover and to regulate the exploitation and use of ground and surface water for protection and
conservation of water sources land and matters connected therein.
Under this act, the District Authority with District Collector as Ex-officio Chairman and 46
mandal authorities in 46 mandals with M.R.O as Ex-officio Chirman – have been constituted to
implement the act at mandal level.
Insurance coverage was introduced to the applicants of new irrigation wells with effect from
24.3.2005
Total wells registered in the District so far – 87012
Old wells – 86308
New wells – 705
Rigs registered - 113
Irregular sand mining cases booked - 108
Training cum awareness programmes have been conducted in 15 mandals centers in the
District to create awareness of the act and training to the Mandal Authority members and village
secretaries covering all the 46 mandals.
A.P. Micro Irrigation Project
Andhra Pradesh Micro Irrigation scheme is started from November 2003. Now 3rd phase is
continuing ie., for 2005-06 financial year.
The Physical Targets allotted are Drip is 2500 Ha and Sprinkler is 800 Ha. The Financial Targets
allotted – 11.00 crores totally 6 micro irrigation companies ie., Jain, Parixit, Plastro, Nagarjuna,
Swathi are working in this scheme with allotted targets. The achievements till to date are Drip is
208 Ha and Sprinkler is 328 Ha
Awareness programme are arranged mandal & village wise to motivate the farmers in adopting
Micro Irrigation methods to save water and bring more area in to cultivation with available water.
Bio-Diesel Plantation Programme – 2005-2006
Nellore District is one among the ten Districts in the State selected for Bio-diesel plantation
programme under Rain Shadow Areas Development (RSAD) Department.
Horticulture farm, Gudipallipadu was allotted to M/s. Sagar Sugars & Allied Products Ltd., for
demonstration of Jatropha Nursery. The raising of Jatropha Nursery is under progress.

Infrastructure facilities like Bore well and submergible pumpset with an expenditure of Rs.0.80
lakhs, were provided.
Integrated wasteland Development programme:
Watershed Development Projects have been taken up under different programmes launched by
Government of India in the country. The Drought Prone Area programmes (DPAP) and the
Desert Development Programme (DDP) adopted the watersheds approved in 1987. The
Integrated Wastelands Development Board in 1989 is aimed at development of wastelands on a
watershed basis. This programme had now been brought under the administrative jurisdiction of
the Department of Land Resources in the Ministry for Rural Development, Government of India.
The fourth Major programme based on the watershed concept is the National Watershed
Development Programme in rainfed areas (NWDPRA) under the Ministry of Agriculture. Out of
these programmes, Nellore District is notified by the Government of India for implementing the
Integrated Wastelands Development Programme.
The reason for including Nellore district under IWDP only, is probably, due to the fact that the
district is having vast extent of wastelands of different categories to an extent of 37.61% (as per
1990 statistics) to the total geographical area of the district. The District Rural Development
Agency (DRDA) in Nellore district is operating IWDP and other schemes like EAS, ECRP,
APHMC, etc., wherein the wastelands are getting treated up under IWDP scheme alone there are
4 sanctioned projects. With activities over the last 6 years the wasteland extent has been
considerably brought down. The present extent may be around 15 to 20%. This requires detail
survey by the District authorities using NRSA data and ground verification. This will help in
drawing up new schemes for future projects.
Report:
Evaluation reports have concluded that WDP appears to have a had positive impact in the
watershed villages in terms of soils and moisture conservation and a rise in water table level
leading to an increase in crop productivity. It has also been successful in promoting horticulture
and animal husbandry activities.
Further, certain weaknesses in WDP have been observed by the evaluators. It is has been pointed
out the programme appears to be week in community organisation and peoples involvement,
maintenance of certain records etc.
Recommendations:
The following are the important recommendations offered for bringing about improvement in the
functioning of WDP, particularly to strengthen the peoples participating necessary for sustaining

the efforts being made -
1) Community Organisation component has to be strengthened.
2) First three months of project period should be devoted to creation of proper awareness among
the people.
3) Micro planning should be unique for each watershed taking into account the locally available
resources.
4) Efforts should be made to strengthen participation of user groups in the programme.
The watershed works and community works should be taken up only during lean agriculture
season in order to generate additional employment. The expenditures incurred on different
watershed should be made known to the people. Innovative measures in construction of check
dams etc. should be taken up.
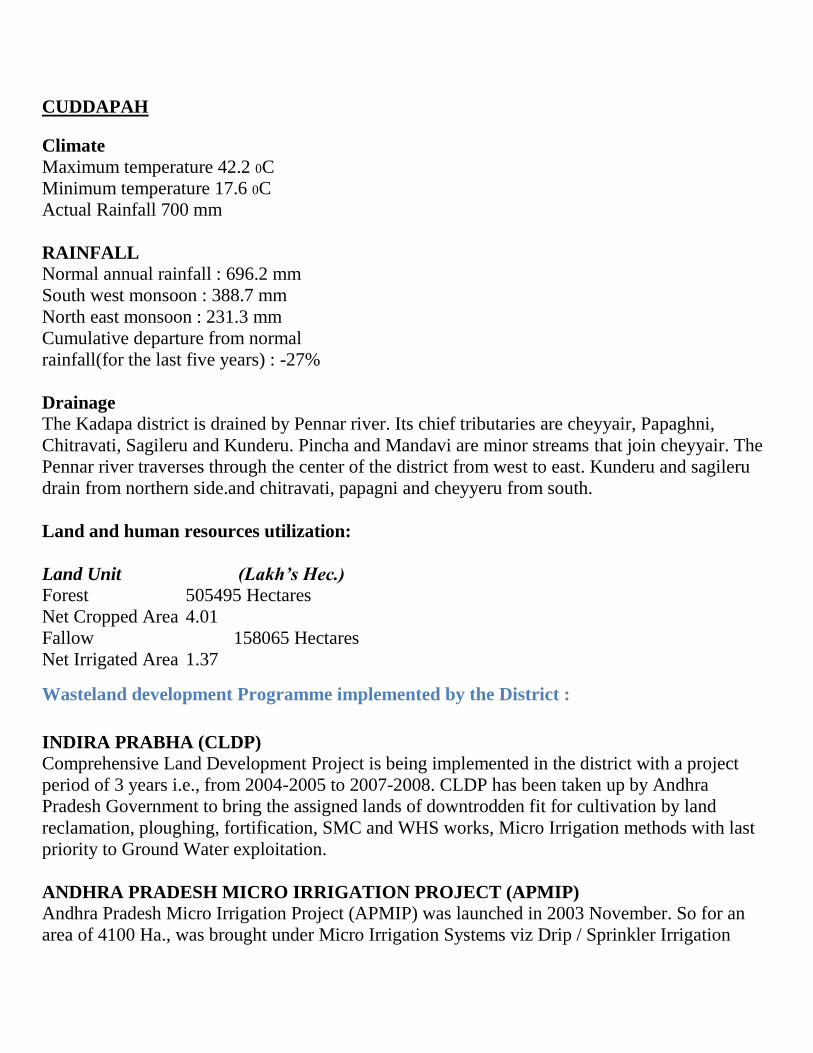
CUDDAPAH
Climate
Maximum temperature 42.2 0C
Minimum temperature 17.6 0C
Actual Rainfall 700 mm
RAINFALL Normal annual rainfall : 696.2 mm
South west monsoon : 388.7 mm
North east monsoon : 231.3 mm
Cumulative departure from normal
rainfall(for the last five years) : -27%
Drainage The Kadapa district is drained by Pennar river. Its chief tributaries are cheyyair, Papaghni,
Chitravati, Sagileru and Kunderu. Pincha and Mandavi are minor streams that join cheyyair. The
Pennar river traverses through the center of the district from west to east. Kunderu and sagileru
drain from northern side.and chitravati, papagni and cheyyeru from south.
Land and human resources utilization:
Land Unit (Lakh’s Hec.) Forest 505495 Hectares
Net Cropped Area 4.01
Fallow 158065 Hectares
Net Irrigated Area 1.37
Wasteland development Programme implemented by the District :
INDIRA PRABHA (CLDP) Comprehensive Land Development Project is being implemented in the district with a project
period of 3 years i.e., from 2004-2005 to 2007-2008. CLDP has been taken up by Andhra
Pradesh Government to bring the assigned lands of downtrodden fit for cultivation by land
reclamation, ploughing, fortification, SMC and WHS works, Micro Irrigation methods with last
priority to Ground Water exploitation.
ANDHRA PRADESH MICRO IRRIGATION PROJECT (APMIP) Andhra Pradesh Micro Irrigation Project (APMIP) was launched in 2003 November. So for an
area of 4100 Ha., was brought under Micro Irrigation Systems viz Drip / Sprinkler Irrigation

Systems. During the year 2005-2006 an area of 5300 Ha., is proposed to be treated with Micro
Irrigation systems covering all 51 Mandals in the District, with 4000 Ha., under Drip Irrigation
and 1300 Ha., under Sprinkler Irrigation Systems.
BIO-FUEL PLANTATION PROGRAMME:
The rainshadow district of Cuddapah of andrapradesh is characterized with low fertility and also
water holding capacity soils. These all factors have resulted in acute poverty in the
region,incomes for the people are low and with frequent occurrence of droughts in recent past
have aggravated the plight of the poor farmers in the regions.There are large tracts of degraded
landa in the possession of the farmers that are not suitable for annual cropping.There is need to
develop a strategy for improving the livehoods of the farmers.
Bio diesel plantations is one of the solutions which could be used successfully to improve the
livelihoods of the rural people, rehabilitate the degraded lands, save huge foreign exchange and
protect the environment. Large numbers of oil crops/ trees have been identified that have the
potential to be used for bio diesel manufacturing. Among the various bio diesel yielding crops,
Jatropha curcas and pongamia pinnata seems to have the potential and prospects for cultivation
in India. For raising these crops it is not necessary to sacrifice the land are that is already under
cultivation of food and horticultural crops as these crops have the inherent ability to thrive on
waste/ degraded and marginal lands. These crops have also the ability to withstand harsh weather
/ climatic conditions.

IMPACT OF THE INTERVENTIONS
Soil and Moisture conservation:-
In almost all the watershed area farmers are taking care to prevent soil erosion and to retain soil
moisture by adopting ploughings across the slope, contour bunding , stone terracing loose
boulders structure etc.
Ground Water:-
In most of the Watersheds, people learnt about the important of harvesting rainwater and they are
coming forward to construct dug out ponds, sun ken ponds in their fields. The evaluation reports

also indicated rise in water levels in watershed area.
Afforestation:-
After coming to know the benefits of vegetation, villagers /farmers are showing interest in
growing plants especially horticulture plants because of the usufructs in future. Some of the
farmers are growing trees on field bunds to protect the crops from winds, pests (since the pests
eating birds take shelter on the trees). In some water sheds the villagers are protecting the nearby
forest area from deforestation.
Micro irrigation:-
The farmers in the watershed areas one gradually knowing the importance of micro irrigation
(like saving time, electricity, optimum utilization of ground water, less labour expenditure, easy
application of fertilizers) and are coming forward to adopt micro irrigation methods.
Unity among the rural folk: -
The faction stricken villages of Cuddapah district are gradually converting in to peaceful places
through the awareness created among themselves by watershed activities and community
organization.
CONVERGENCE OF NREGA WITH OTHER SCHEME
In 2008, the Ministry of Rural Development issued guidelines on convergence of MNREGA with
other development programs and schemes to enable creation of durable assets and strengthen the
livelihood resource base of the rural poor. In the framework for convergence, the role of NREGS
is to provide the primary input for natural resource generation. Backward and forward linkages,
as required, are to be created for enhancement, sustainability and utilization of the natural
resources for generation of livelihoods and their up gradation.
Unique Features:
Act include time-bound employment guarantee and wage payment within 15 days, facilitating
incentive-disincentive structure to the State Governments for providing employment, since 90 per
cent of the cost for employment provided is borne by the Central Government or payment of
unemployment allowance at the State's own cost is to be provided. The Act also mandates 33
percent participation for women.
Why convergence?
Substantial public investments are being made for strengthening of rural economy and livelihood
base of the poor, especially the marginalized groups like SC/STs and women. To effectively
address the issue of poverty alleviation, there is a need to optimize efforts through inter-sectoral
approaches. The convergence of different programs like: Watershed Programs, National

Agriculture Development Programs (Rashtriya Krishi Vikas Yojana), National Horticulture
Mission, Scheme of Artificial Recharge of Ground Water through Dug well, BRGF, with
NREGA will enable better planning and effective investments in rural areas. This convergence
will bring in synergies between different government programs/schemes in terms of planning,
process and implementation. This will also facilitate sustainable development.
Convergence of funds from other sources can help in creation of durable assets. For instance,
funds available with PRIs from other sources such as the National Finance Commission, State
Finance
Commission, State Departments and other Central or Centrally Sponsored Schemes such as
SGSY, DPAP, DDP, IWDP, BRGF can be dovetailed with other rural development funds for the
construction of durable community assets under the works permissible. However, core funds of
nay schemes should not be used as substitute resources by different departments and agencies for
their own activities.
The Ministry of Rural Development has developed and disseminated Guidelines for Convergence
of
NREGS with different schemes and specific programs viz. Indian Council of Agricultural
Research, National Afforestation Programs and other schemes of the Ministry of Forest &
Environment, Schemes of the Ministry of Water Resources, PMGSY (Department of Rural
Development), SGSY (Department of Rural Development), Watershed Development
Programs (Department of Land Resources, Ministry of Rural Development). For this, 115
pilot districts in 22 states have been identified by the MoE&F, MoWR and ICAR.
Perceived expected outcomes from convergence initiatives include:
Increase in Social Capital: Collective planning and implementation among different
stakeholders will enhance social capital. This will improve management and work output.
Increase in Physical Capital: The process will help in creating durable assets and will also
improve land productivity.
Facilitation of Ecological Synergies: Natural resource base regeneration through different
activities such as afforestation, drought proofing, flood proofing, and watershed will lead to
effective use of Resources.
Mitigating Effects of Climate Change: NREGA helps in addressing issues such as CO2
emissions and industrial pollution and stemming.
Enhancing Economic Opportunities: Income opportunities, savings and investments may be
generated through activities such as pisciculture.
Strengthening Democratic Processes: Convergence awareness and planning at the grass-root
level will lead to greater ownership of projects.

Facilitating Sustainable Development: Convergence efforts through creation of durable assets,
rural connectivity, productivity enhancement and capacity development lead to sustainable
development. NIRD, Civil Society Organizations/ Professional Institutions having technical
competence & resources are being enlisted for monitoring of convergence pilots. This report
highlights the innovative experiments and good practices happening in pilots' districts. It also
documents the lessons learnt in the light of the interactions with stakeholders in these states. In
this regard, the salient features of NREGS and strengthening of PRIs, as well as CBOs have been
considered as the bottom line.
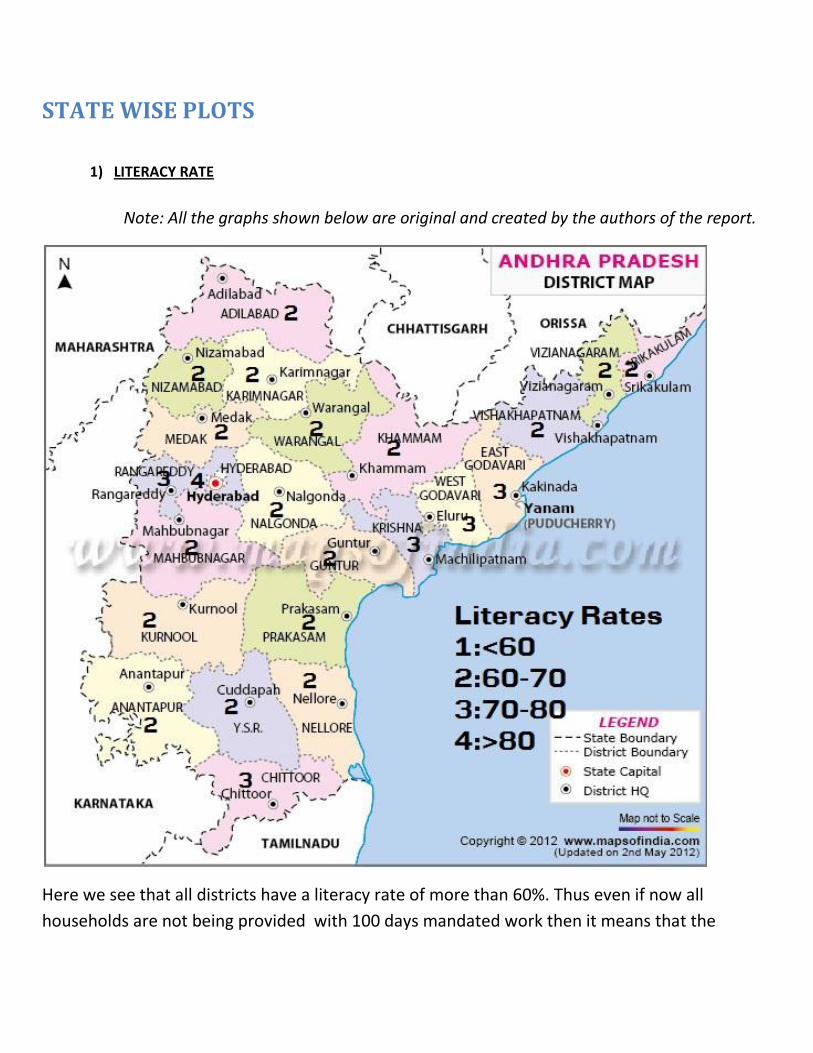
STATE WISE PLOTS
1) LITERACY RATE
Note: All the graphs shown below are original and created by the authors of the report.
Here we see that all districts have a literacy rate of more than 60%. Thus even if now all
households are not being provided with 100 days mandated work then it means that the

government action being taken now is inadequate and stress needs to be given on awareness
among the people through target-group driven publicity.
2) HOUSEHOLDS HAVING BPL CARDS
Here we see that most households(almost 80%) have BPL cards which is unreasonably high.

3) AVERAGE WAGE COST PER PERSON DAY
Here we see that extremely high and low average wage cost per person day exists simultaneously in
adjoining districts. One special case that must be pointed out is that of West Godavari and East
Godavari. Although both these districts are located adjacent to each other and are largely similar to
each other in terms of their climate, topography, etc they have highly differing wage costs per
person day due to the differences in the working of the administration level

4) PERSON DAYS OF WORK PER HOUSEHOLD
The person days of work per household follows a randomized distribution across the state. We see
districts like Nellore, Prakasam and Guntur exist in close proximity with districts like Chittoor, which
has greater than 70 person days of work per household.

UNAVAILABILTY OF DATA FOR HUNGER AND SHARE OF WOMEN
Overall data forshare of women work in nrega activities for Andhra Pradesh was
available but we couldn’t find the district wise distribution of work and the share of
women in them.
This, in fact, shows the negative side of the government which is insensitive to
equal women and men ratio in the NREGA
Data for hunger district wise wasn’t available for the state.
We tried to look for other things that we could relate hunger to but their data
wasn’t available for all the districts.
Related Documents