Analysis of Variance 2-Way ANOVA MARE 250 Dr. Jason Turner

Analysis of Variance 2-Way ANOVA MARE 250 Dr. Jason Turner.
Dec 18, 2015
Welcome message from author
This document is posted to help you gain knowledge. Please leave a comment to let me know what you think about it! Share it to your friends and learn new things together.
Transcript
Analysis of Variance2-Way ANOVA
MARE 250 Dr. Jason Turner

Two-way ANOVA - procedure to test the equality of
population means when there are two factors
2-Sample T-Test (1R, 1F, 2 Levels)
One-Way ANOVA (1R, 1F, >2 Levels)
Two-Way ANOVA (1R, 2F, >1 Level)
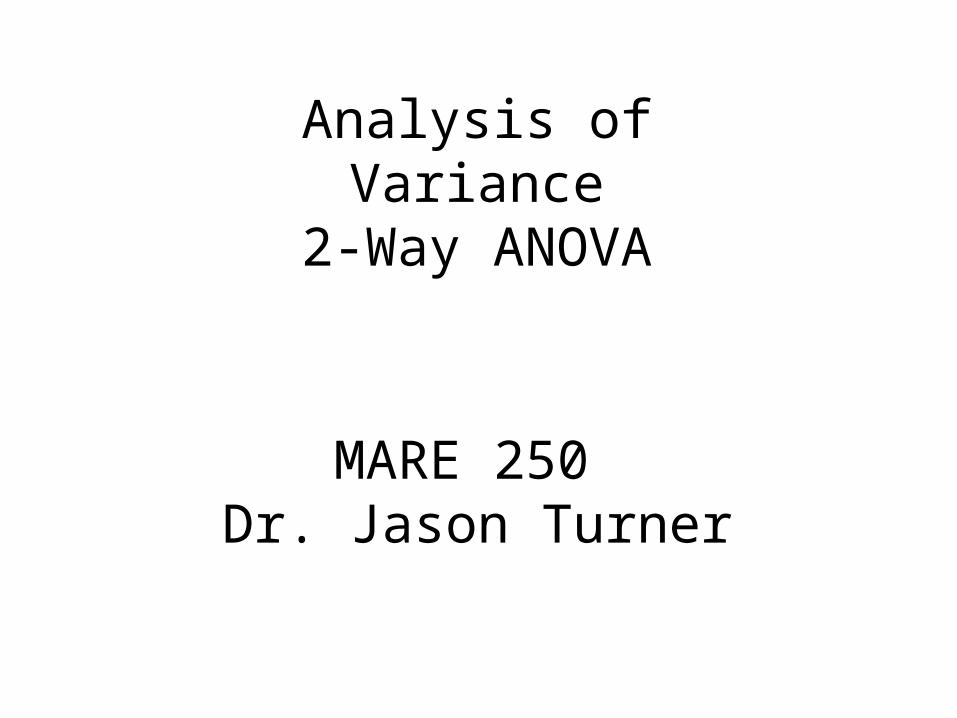
Two-Way – ANOVA
For Example…
One-Way ANOVA – means of urchin #’s from each distance (shallow, middle, deep) are equal
Response – urchin #, Factor – distance
Two-Way ANOVA – means of urchin’s from each distance collected with each quadrat (¼m, ½m) are equal
Response – urchin #, Factors – distance, quadrat
Two-Way – ANOVA
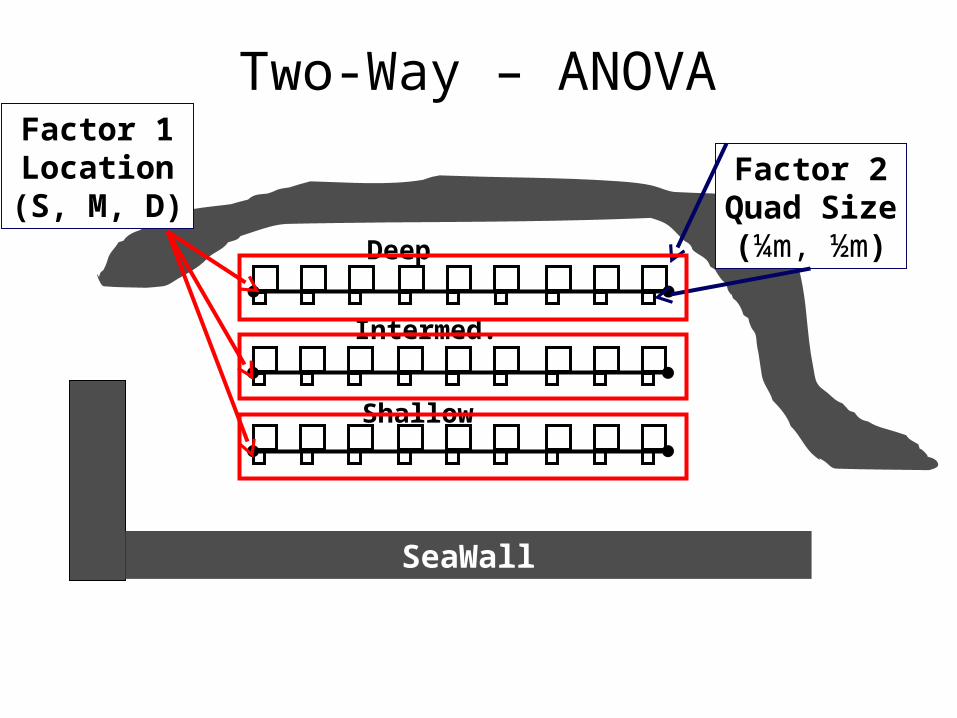
Two-Way – ANOVA
SeaWall
Deep
Intermed.
Shallow
Factor 1Location(S, M, D)
Factor 2Quad Size(¼m, ½m)

Two-Way – ANOVA
SeaWall
Deep
Intermed.
Shallow
Factor 1Location(S, M, D)
Factor 2Quad Size(¼m, ½m)

Two-Way – ANOVA
SeaWall
Deep
Intermed.
Shallow
Factor 1Location(S, M, D)
Factor 2Quad Size(¼m, ½m)
INTERACTIONFactor 1 X Factor 2
Location X Quad Size

If the effect of a fixed factor is significant, then the level means for that factor are significantly different from each other (just like a one-way ANOVA)
If the effect of an interaction term is significant, then the effects of each factor are different at different levels of the other factor(s)
Two-Way – ANOVAResults

Two-Way – ANOVAResults
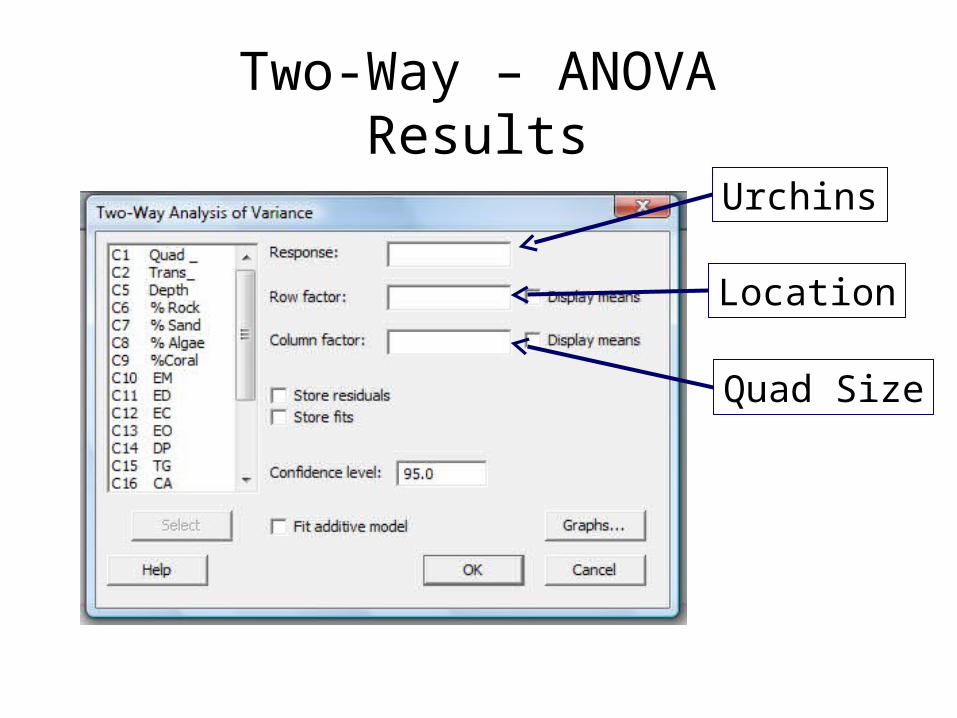
Two-Way – ANOVAResults
Urchins
Location
Quad Size

Two-Way ANOVA : Analysis of Variance Table
Source DF SS MS F P Location 1 228.17 228.167 8.99 0.008Quadsize 2 308.33 154.167 6.07 0.010Interaction 2 76.33 38.167 1.50 0.249Error 18 457.00 25.389Total 23 1069.83
Two-Way – ANOVAResults

For the urchin analysis, the results indicate the following:
The effect of Location (p = 0.008) is significantThis indicates that urchin populations numbers were significantly different a different distances from shore
The effect of Quad Size (p = 0.010) is significantThis indicates quadrat type had a significant effect upon the number of urchins collected
The interaction between Distance and Quadrat (p = 0.249) is not significantThis means that the distance and quadrat size results were not influencing the other
Thus, it is okay to interpret the individual effects of either factor alone

Two-Way ANOVA : Analysis of Variance Table
Source DF SS MS F P Location 1 228.17 228.167 8.99 0.008Quadsize 2 308.33 154.167 6.07 0.010Interaction 2 76.33 38.167 1.50 0.009Error 18 457.00 25.389Total 23 1069.83
Two-Way – ANOVAResults
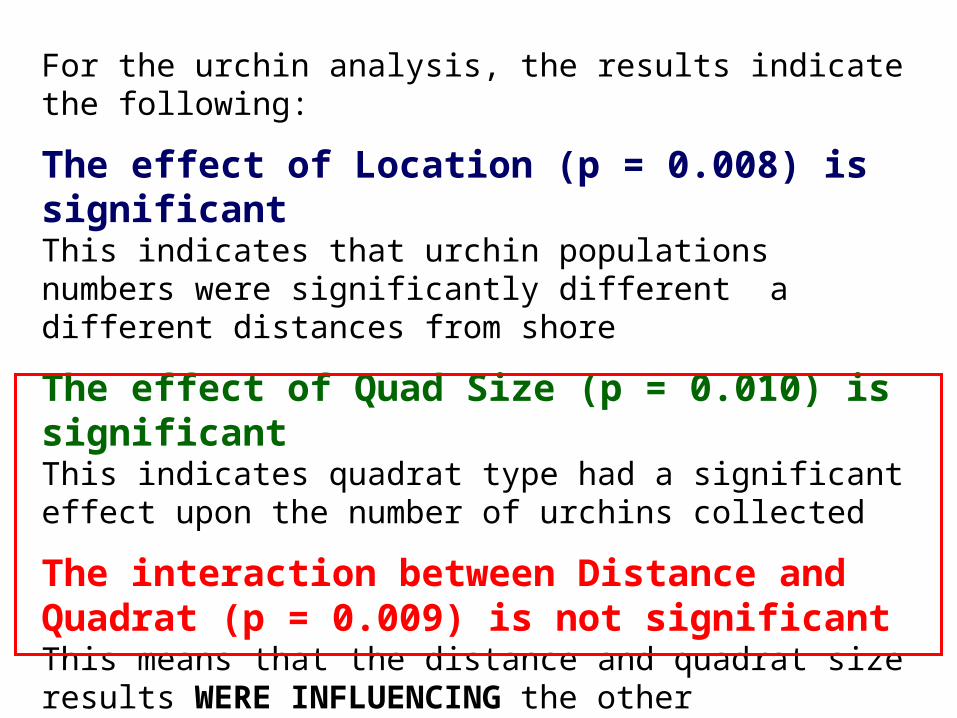
For the urchin analysis, the results indicate the following:
The effect of Location (p = 0.008) is significantThis indicates that urchin populations numbers were significantly different a different distances from shore
The effect of Quad Size (p = 0.010) is significantThis indicates quadrat type had a significant effect upon the number of urchins collected
The interaction between Distance and Quadrat (p = 0.009) is not significantThis means that the distance and quadrat size results WERE INFLUENCING the other
Thus, the individualFactors must be analyzed alone
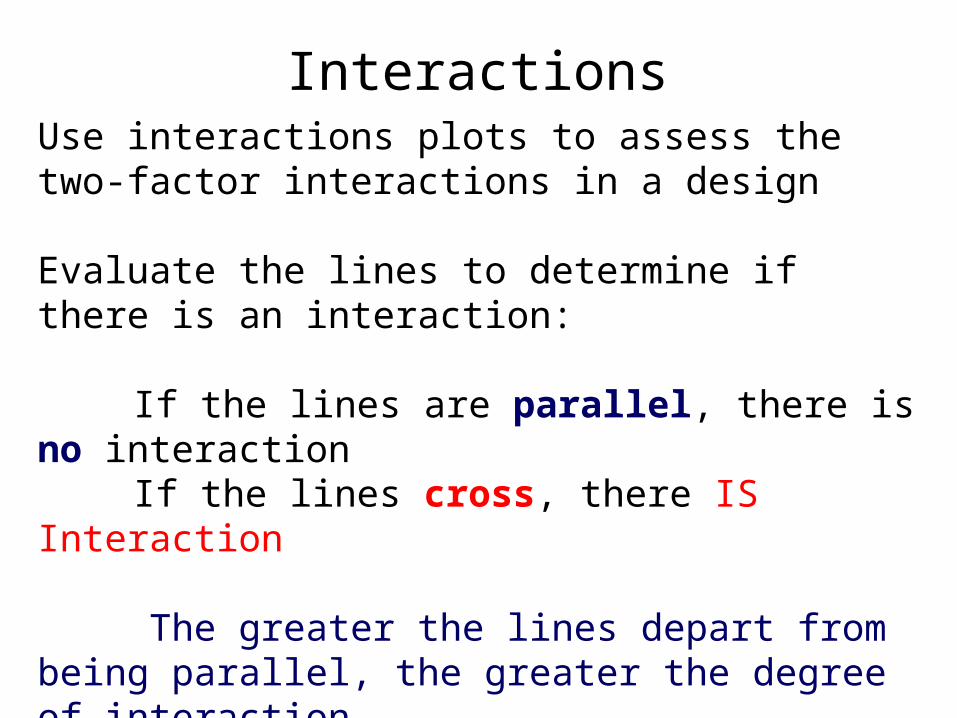
Use interactions plots to assess the two-factor interactions in a design
Evaluate the lines to determine if there is an interaction:
If the lines are parallel, there is no interactionIf the lines cross, there IS Interaction
The greater the lines depart from being parallel, the greater the degree of interaction
Interactions

Interactions Plots

Interactions Plots

Interactions PlotsWhy is there interaction?
Because we get a different answer regarding #Urchins by Location (S,M,D) when using different Quadrats (¼m, ½m)
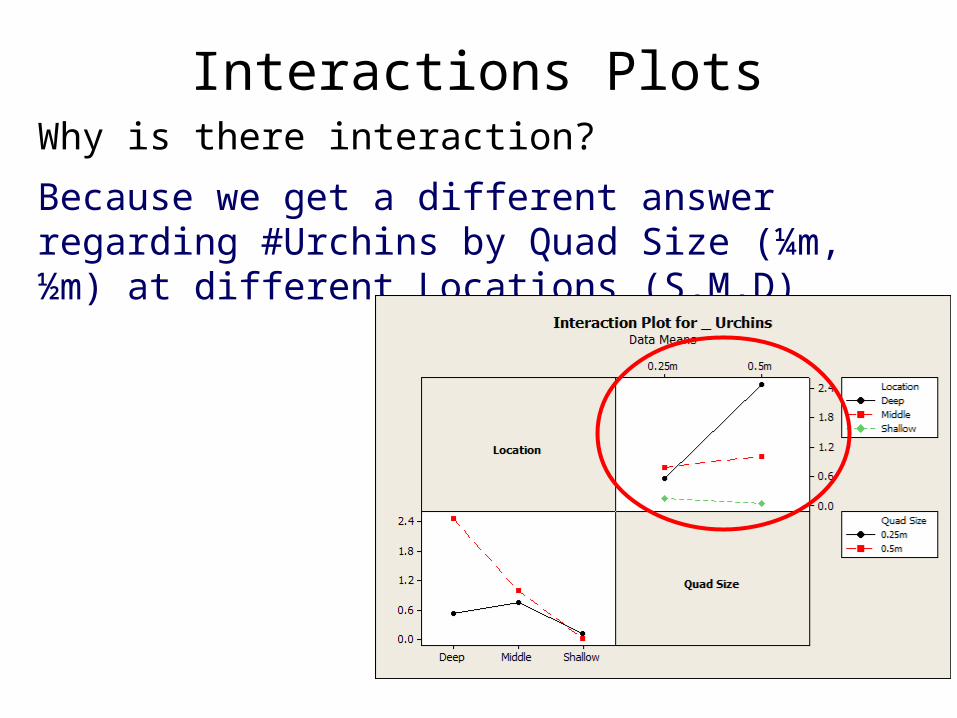
Interactions PlotsWhy is there interaction?
Because we get a different answer regarding #Urchins by Quad Size (¼m, ½m) at different Locations (S,M,D)

The two-way ANOVA procedure does not support multiple comparisons
To compare means using multiple comparisons, or if your data are unbalanced – use a General Linear Model
General Linear Model - means of urchin #’s and species #’s from each distance (shallow, middle, deep) are equal
Responses – urchin #, Factor – distance, quadrat
Unbalanced…No Problem!
Or multiple factors…General Linear Model - means of urchin #’s and species #’s from each distance (shallow, middle, deep) are equal
Responses – urchin #, Factor – distance, quadrat, transect
Two-Way – ANOVA
Two-Way ANOVA is a statistical test – there is a parametric (Two-Way ANOVA) and nonparametric version (Friedman’s)
There are 3 ways to run a Two-Way ANOVA in minitab:
1) Two-Way ANOVA – for parametric (normal) balanced (equal n among levels) data2) General Linear Model (GLM) – for all parametric (normal) data – balanced or not3) Friedman – nonparametric (not normal) data
Two-Way – ANOVA

1) Two-Way ANOVA – for parametric (normal) balanced (equal n among levels) data
- See examples of Two-Way ANOVA above
* Note – Two-Way ANOVA program cannot run Multiple Comparisons Tests (Tukey)
Two-Way – ANOVA

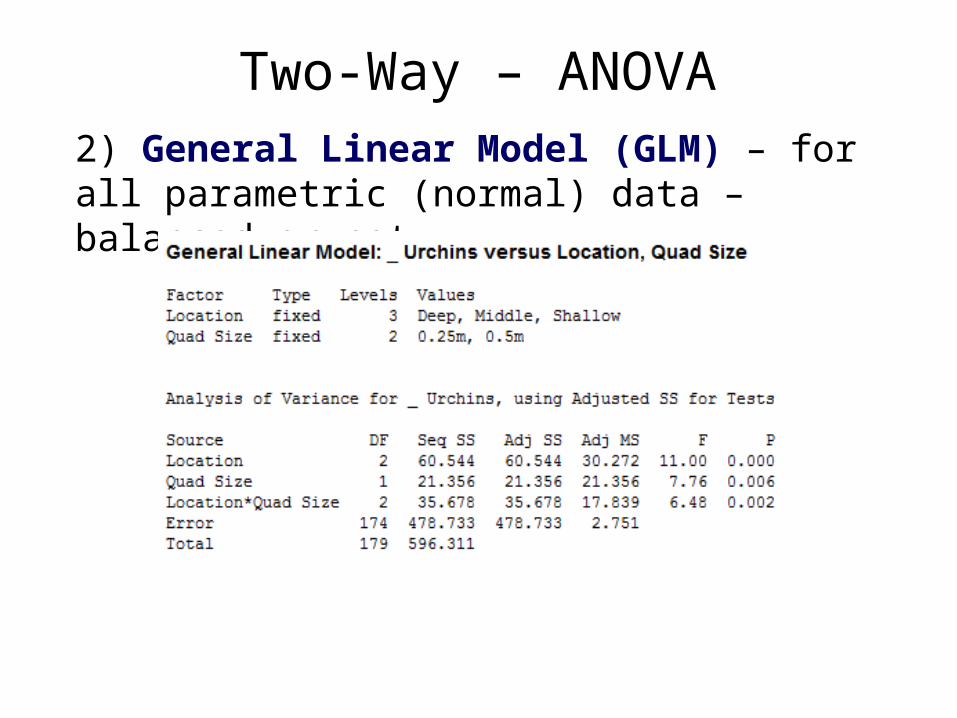
2) General Linear Model (GLM) – for all parametric (normal) data – balanced or not
Two-Way – ANOVA
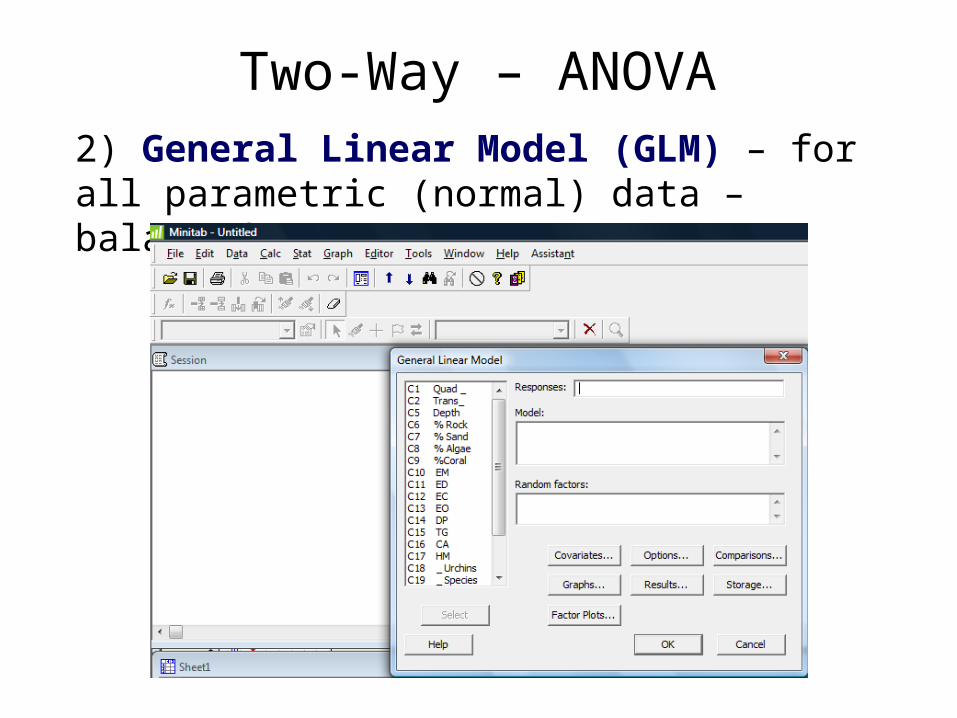
2) General Linear Model (GLM) – for all parametric (normal) data – balanced or not
Two-Way – ANOVA

2) General Linear Model (GLM) – for all parametric (normal) data – balanced or not
Two-Way – ANOVA
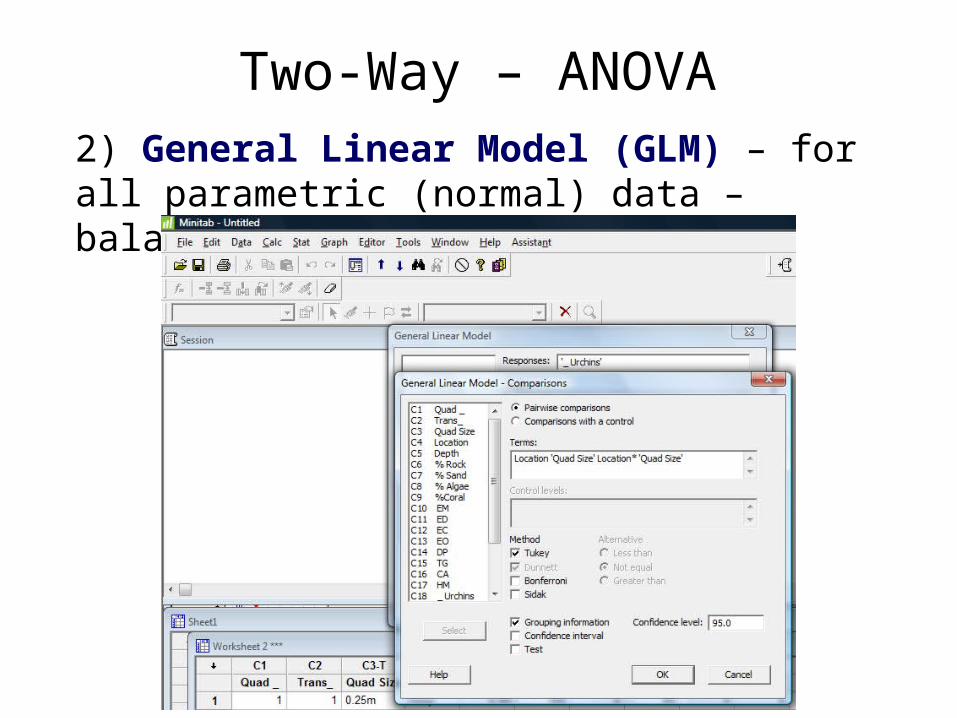
2) General Linear Model (GLM) – for all parametric (normal) data – balanced or not
Two-Way – ANOVA
2) General Linear Model (GLM) – for all parametric (normal) data – balanced or not
Two-Way – ANOVA
2) General Linear Model (GLM) – for all parametric (normal) data – balanced or not
Two-Way – ANOVA
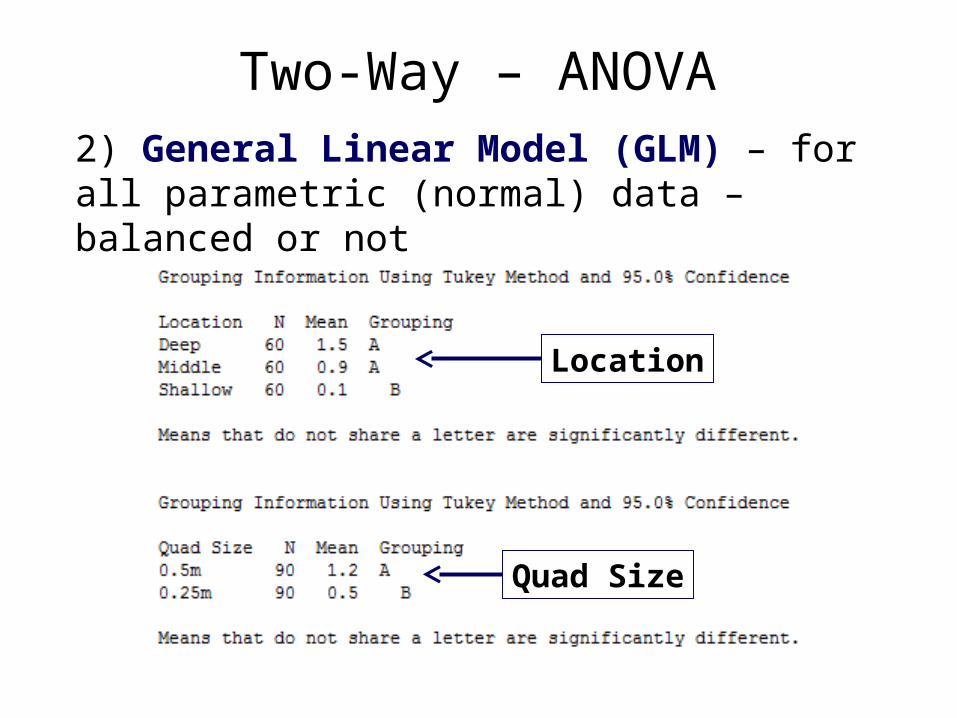
Location
Quad Size
2) General Linear Model (GLM) – for all parametric (normal) data – balanced or not
Two-Way – ANOVA
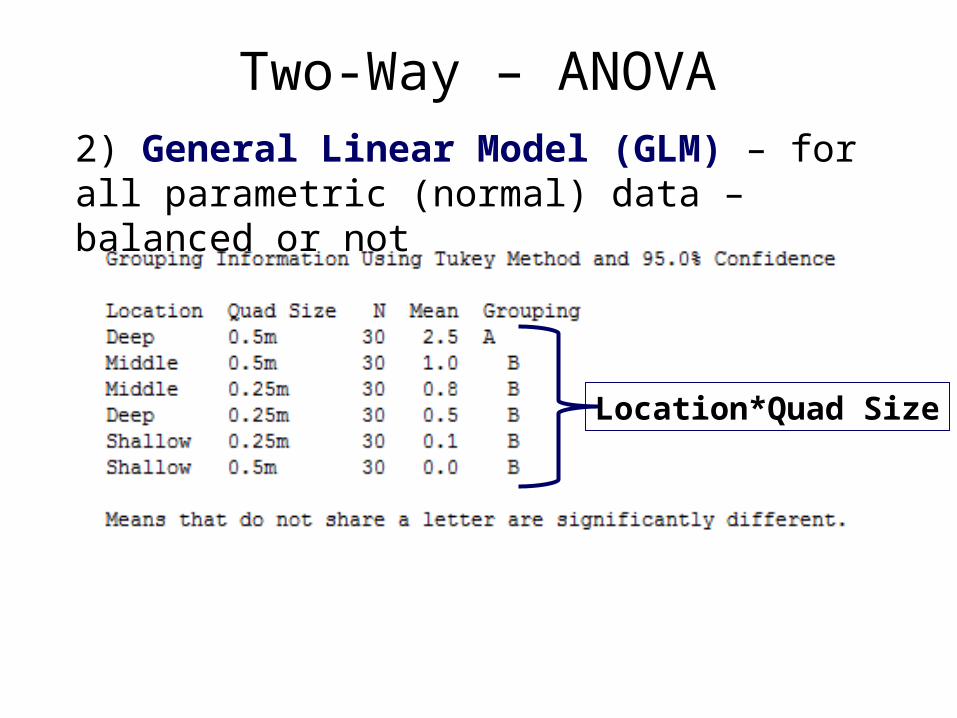
Location*Quad Size
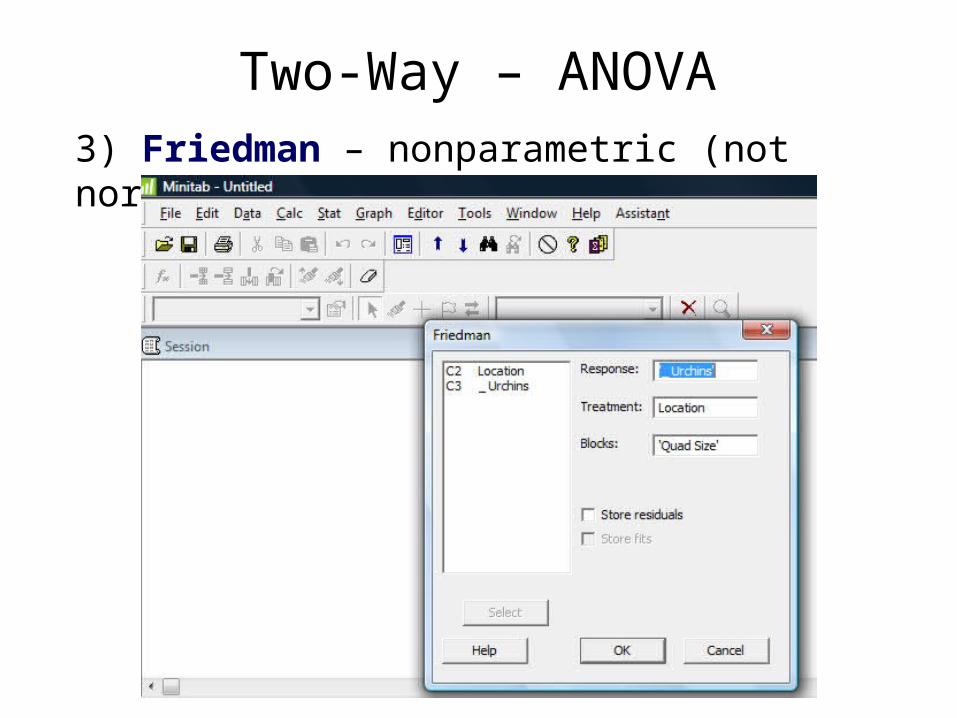
3) Friedman – nonparametric (not normal) data
Two-Way – ANOVA

3) Friedman – nonparametric (not normal) data
Two-Way – ANOVA
Related Documents