Analysis of tropical radiative heating profiles: A comparison of models and observations Sally A. McFarlane, 1 James H. Mather, 1 and Thomas P. Ackerman 1,2 Received 27 November 2006; revised 3 March 2007; accepted 29 May 2007; published 31 July 2007. [1] The vertical distribution of radiative heating in the atmosphere is an important driver of atmospheric circulation. Evaluation of model simulations of the Earth’s radiation budget typically focus only on performance at the top of the atmosphere or at the surface. In this study, we compare the vertical distribution of cloud properties and radiative heating rates calculated from observations at the Department of Energy’s Atmospheric Radiation Measurement (ARM) sites on the islands of Nauru and Manus to simulations performed using the Multiscale Modeling Framework (MMF) and the Community Atmosphere Model (CAM). Significant differences are found in the vertical profiles and diurnal cycle of cloud amount, condensed water content, and cloud effect on heating rates between the two models and between the models and the observations. The differences in the heating rates between the models and ARM results depend partly on the details of the parameterization of effective radius and absorption coefficients used and partly on differences in cloud frequency, vertical location of clouds, and optical thickness. Since the same radiative model is used in the CAM and MMF, differences in the effect of clouds on heating rates between the two models are due to the differing treatment of cloud processes in the models and the interaction of clouds and radiation on the local scale in the MMF. Citation: McFarlane, S. A., J. H. Mather, and T. P. Ackerman (2007), Analysis of tropical radiative heating profiles: A comparison of models and observations, J. Geophys. Res., 112, D14218, doi:10.1029/2006JD008290. 1. Introduction [2] Radiative heating associated with the distribution of water vapor and clouds in the atmosphere is an important driver of atmospheric circulation, especially in the tropics, and may have important impacts on deep convection and precipitation. In a classic study, Slingo and Slingo [1988] showed that removing longwave cloud forcing from a general circulation model (GCM) had a significant impact on tropical circulations. More recently, using a simplified 2-dimensional (2-D) model, Raymond [2000] found that cloud-radiation interactions alone were strong enough to drive a Hadley circulation of similar intensity to the observed Hadley circulation. Zhang and Chou [1999] found that changes in IR cooling due to water vapor variability affected the rate of generation of convective available potential energy and conditional instability for deep convection. Circulations caused by differences in radiative heating between clear and cloudy regions have been proposed as a mechanism for the diurnal cycle of precipitation [Gray and Jacobsen, 1977], although recent modeling studies have indicated that this differential heat- ing is of secondary importance to the role of the diurnal varying solar radiation in stabilizing the large-scale envi- ronment [Xu and Randall, 1995; Tao et al., 1996]. [3] Aside from the horizontal variability of water vapor and clouds, radiative heating associated with vertical vari- ability is also important. Dry layers of air are observed frequently in the tropics and the radiative perturbations associated with these layers may affect the development of convection [Mapes and Zuidema, 1996]. Persistence of cirrus and stratocumulus layers may be affected by desta- bilization of the layer due to cloud-base warming and cloud- top cooling [Lilly , 1988; Ackerman et al., 1988]. Recently, Lin et al. [2004] suggested that the inability of many models to simulate realistic representations of the Madden-Julian Oscillation (MJO) may be caused by systematic diabatic heating profile errors. A recent study by Hartmann and Larson [2002] has emphasized the role of radiative heating in possible climate system feedback. Using a radiative- convective equilibrium model they illustrate that the air temperature at which the clear-sky cooling rate begins to decrease stays roughly constant with increasing sea surface temperature. They then assume that radiatively-driven con- vergence and hence anvil cloud tops will occur at appro- ximately the same temperature, even in a warmer climate. To examine such effects in global models, it is necessary that model clouds be able to respond realistically to changes in large-scale forcing. Models must produce cloud and radiative heating rate profiles with realistic horizontal, JOURNAL OF GEOPHYSICAL RESEARCH, VOL. 112, D14218, doi:10.1029/2006JD008290, 2007 Click Here for Full Articl e 1 Climate Physics Group, Pacific Northwest National Laboratory, Richland, Washington, USA. 2 Joint Institute for the Study of the Atmosphere and Ocean and Department of Atmospheric Sciences, University of Washington, Seattle, Washington, USA. Copyright 2007 by the American Geophysical Union. 0148-0227/07/2006JD008290$09.00 D14218 1 of 22

Welcome message from author
This document is posted to help you gain knowledge. Please leave a comment to let me know what you think about it! Share it to your friends and learn new things together.
Transcript
Analysis of tropical radiative heating profiles: A
comparison of models and observations
Sally A. McFarlane,1 James H. Mather,1 and Thomas P. Ackerman1,2
Received 27 November 2006; revised 3 March 2007; accepted 29 May 2007; published 31 July 2007.
[1] The vertical distribution of radiative heating in the atmosphere is an important driverof atmospheric circulation. Evaluation of model simulations of the Earth’s radiationbudget typically focus only on performance at the top of the atmosphere or at the surface.In this study, we compare the vertical distribution of cloud properties and radiativeheating rates calculated from observations at the Department of Energy’s AtmosphericRadiation Measurement (ARM) sites on the islands of Nauru and Manus to simulationsperformed using the Multiscale Modeling Framework (MMF) and the CommunityAtmosphere Model (CAM). Significant differences are found in the vertical profiles anddiurnal cycle of cloud amount, condensed water content, and cloud effect on heatingrates between the two models and between the models and the observations. Thedifferences in the heating rates between the models and ARM results depend partly on thedetails of the parameterization of effective radius and absorption coefficients used andpartly on differences in cloud frequency, vertical location of clouds, and optical thickness.Since the same radiative model is used in the CAM and MMF, differences in the effect ofclouds on heating rates between the two models are due to the differing treatment ofcloud processes in the models and the interaction of clouds and radiation on the local scalein the MMF.
Citation: McFarlane, S. A., J. H. Mather, and T. P. Ackerman (2007), Analysis of tropical radiative heating profiles: A comparison of
models and observations, J. Geophys. Res., 112, D14218, doi:10.1029/2006JD008290.
1. Introduction
[2] Radiative heating associated with the distribution ofwater vapor and clouds in the atmosphere is an importantdriver of atmospheric circulation, especially in the tropics,and may have important impacts on deep convection andprecipitation. In a classic study, Slingo and Slingo [1988]showed that removing longwave cloud forcing from ageneral circulation model (GCM) had a significant impacton tropical circulations. More recently, using a simplified2-dimensional (2-D) model, Raymond [2000] found thatcloud-radiation interactions alone were strong enough todrive a Hadley circulation of similar intensity to theobserved Hadley circulation. Zhang and Chou [1999]found that changes in IR cooling due to water vaporvariability affected the rate of generation of convectiveavailable potential energy and conditional instability fordeep convection. Circulations caused by differences inradiative heating between clear and cloudy regions havebeen proposed as a mechanism for the diurnal cycle ofprecipitation [Gray and Jacobsen, 1977], although recent
modeling studies have indicated that this differential heat-ing is of secondary importance to the role of the diurnalvarying solar radiation in stabilizing the large-scale envi-ronment [Xu and Randall, 1995; Tao et al., 1996].[3] Aside from the horizontal variability of water vapor
and clouds, radiative heating associated with vertical vari-ability is also important. Dry layers of air are observedfrequently in the tropics and the radiative perturbationsassociated with these layers may affect the developmentof convection [Mapes and Zuidema, 1996]. Persistence ofcirrus and stratocumulus layers may be affected by desta-bilization of the layer due to cloud-base warming and cloud-top cooling [Lilly, 1988; Ackerman et al., 1988]. Recently,Lin et al. [2004] suggested that the inability of many modelsto simulate realistic representations of the Madden-JulianOscillation (MJO) may be caused by systematic diabaticheating profile errors. A recent study by Hartmann andLarson [2002] has emphasized the role of radiative heatingin possible climate system feedback. Using a radiative-convective equilibrium model they illustrate that the airtemperature at which the clear-sky cooling rate begins todecrease stays roughly constant with increasing sea surfacetemperature. They then assume that radiatively-driven con-vergence and hence anvil cloud tops will occur at appro-ximately the same temperature, even in a warmer climate.To examine such effects in global models, it is necessarythat model clouds be able to respond realistically to changesin large-scale forcing. Models must produce cloud andradiative heating rate profiles with realistic horizontal,
JOURNAL OF GEOPHYSICAL RESEARCH, VOL. 112, D14218, doi:10.1029/2006JD008290, 2007ClickHere
for
FullArticle
1Climate Physics Group, Pacific Northwest National Laboratory,Richland, Washington, USA.
2Joint Institute for the Study of the Atmosphere and Ocean andDepartment of Atmospheric Sciences, University of Washington, Seattle,Washington, USA.
Copyright 2007 by the American Geophysical Union.0148-0227/07/2006JD008290$09.00
D14218 1 of 22
vertical, and diurnal variability in order to produce realistictropical circulations and cloud feedbacks.[4] One of the difficulties in producing accurate cloud
and heating rate profiles within a large-scale general circu-lation model (GCM) is the sub-grid scale nature of clouddynamical processes and their interactions with radiation.Within a GCM, cloud processes are generally treated withparameterizations which contain parameters whose valuesare derived from observations or higher resolution modelsor are adjusted so that simulations resemble observations.The outputs of GCM cloud parameterizations are generallygridbox mean values of cloud fraction and cloud conden-sate. Vertical structure is prescribed using simple overlapassumptions. In reality, clouds exhibit significant horizontalvariability and vertical structure on the scales of a GCMgridbox. A new approach to climate modeling, the multi-scale modeling framework (MMF), reduces (although doesnot eliminate) the need for cloud parameterizations bycoupling cloud-scale dynamics with the larger scale dyna-mics of the GCM. The MMF, also known as the cloud-resolving convection parameterization [Grabowski, 2001]or super-parameterization [Khairoutdinov and Randall,2001; Randall et al., 2003; Khairoutdinov et al., 2005]treats cloud processes more explicitly by replacing the cloudand radiation parameterizations of a GCM with a 2-D cloudsystem resolving model (CSRM) embedded in each GCMgridbox. The CSRM explicitly resolves cloud dynamics andphysical processes down to the resolution of the CSRM.Radiative transfer calculations are run directly on eachCSRM column, removing the need for any assumptions ofcloud overlap, however cloud microphysical processes arestill parameterized within the CSRM. The CSRM is forcedby the large scale tendencies from the GCM and returns theaverage of the cloud and radiative tendencies over theCSRM columns back to the GCM.[5] Due to the non-linear nature of radiative transfer as a
function of optical depth, the average radiation calculatedfrom a distribution of cloud properties is not the same as theradiation calculated from the average cloud properties[Cahalan et al., 1994]. The inclusion of sub-grid scalevariability of clouds and radiation in the MMF frameworkmay significantly impact the simulated climate. A recentstudy by Cole et al. [2005] found that cloud-radiationinteractions at scales unresolved by GCMs were at leastas important as accurate domain averages of radiativefluxes. Analysis of MMF simulations is ongoing, butseveral studies have indicated that the MMF produces betterdefined MJO-like systems, a more realistic diurnal cycle ofprecipitation over land, and more realistic frequency distri-bution of precipitation in the tropics [Randall et al., 2003;Khairoutdinov et al., 2005; Ovtchinnikov et al., 2005]. Inthis study, we investigate how the sub-grid scale treatmentof clouds in the MMF affects the vertical distributions ofcloud properties and radiative heating.[6] Although the vertical re-distribution of energy by
clouds has important feedbacks to model dynamics, evalua-tion of model simulations of the Earth’s radiation budgettypically focus on performance at the top of the atmosphere(TOA) or the surface [Kiehl et al., 1998], neglecting detailsof the distribution of radiation within the vertical column.Evaluation of vertical profiles of model fluxes or heatingrates is difficult because of the lack of direct observations of
heating rate profiles in the atmosphere. Current estimates ofcloudy sky radiative heating in the tropics are basedprimarily on model simulations (e.g., Fu et al. [1995]),satellite observations with limited vertical resolution[Bergman and Hendon, 1998; Zhang et al., 2004], or obser-vations during short field programs [Cox and Griffith, 1979].The long time series of observations taken at the Departmentof Energy’s Atmospheric Radiation Measurement (ARM)program sites on the islands of Manus and Nauru in thetropical Pacific provides a unique dataset for calculating all-sky heating rate profiles with high vertical and temporalresolution in the tropics. In a previous study, Mather et al.[2007], we used the ARM observations to derive cloudproperties and calculate radiative heating rates for non-precipitating clouds over several months at both Nauru andManus. In this study, we combine those cloud and heatingrate profiles with observations of the surface energybudget to evaluate the simulated vertical profiles of cloudproperties and radiative heating produced by the MMF andthe Community Atmosphere Model (CAM) 3.0 models.Section 2 describes the observations and calculated heatingrate profiles while section 3 describes the details of themodel simulations. Section 4 presents comparisons of thecloud and heating rate profiles calculated from the ARMobservations and simulated by the models while section 5discusses the conclusions of this study.
2. Observations and Calculated HeatingRate Profiles
[7] We use observations taken at the ARM sites on theisland republic of Nauru (0.52� S, 166.92� E) and at Manus,Papua New Guinea (2.06� S, 147.40� E) in the tropicalwestern pacific (TWP) to determine the energy budget at thesurface as well as the vertical profiles of cloud propertiesand heating rates. The ARM sites have been operating onManus since 1996 and on Nauru since 1998 and contain asuite of ground-based active and passive remote sensors[Mather et al., 1998]. Radiosondes are launched twice a dayunder normal conditions. The time series of broadbandshortwave (SW) and longwave (LW) radiation measure-ments at the two sites are almost continuous since theirinstallation. Due to the complexity of the active sensors andthe harsh operating conditions at these remote tropical sites,the time series of vertically profiling measurements is morelimited. In this study, we examine the radiation measure-ments and cloud property and heating rate profiles fromFebruary to July 2000 at Manus and March to December1999 at Nauru.[8] Manus is located in the core of the tropical warm
pool, a region of high convective activity, while Nauru islocated at the eastern edge of the warm pool and experi-ences large interannual variability in convective activityassociated with the El Nino/Southern oscillation (ENSO)cycle. During El Nino, convection tends to shift eastward,leading to more active convection at Nauru. The period ofMarch-December, 1999 is a period of suppressed conditionsat Nauru, with little active convection. Manus experiences awide range of seasonal and interannual variability associa-ted with the Madden-Julian Oscillation as well as itslocation near the Maritime Continent [Mather, 2005].
D14218 MCFARLANE ET AL.: RADIATIVE HEATING PROFILE COMPARISONS
2 of 22
D14218
[9] Details of the retrieved cloud properties and heatingrate calculations are given in Mather et al. [2007]. Verticalprofiles of condensed water content (CWC) and particle sizefor non-precipitating clouds are retrieved from the milli-meter wavelength cloud radar (MMCR) and microwaveradiometer (MWR) measurements with 10 second tempo-ral and 45 meter vertical resolution. Vertical profiles oftemperature and water vapor are derived by combiningradiosonde profiles with higher temporal resolution mea-surements of total water vapor from the MWR and surfaceair temperature. The resulting cloud microphysical andatmospheric state profiles are sampled every 5 minutesand broadband fluxes and vertical heating rate profiles arecalculated using a correlated-k distribution radiative trans-fer model [Fu and Liou, 1992]. The parameterization ofcloud optical properties follows Fu et al. [1995] for liquidclouds and Fu [1996] and Fu et al. [1998] for ice clouds.Ozone profiles and temperature and humidity profilesabove 100 mb are based on a standard tropical atmo-sphere. Aerosol is neglected in the heating rate calcula-tions, but is assumed to be relatively low at these tropicaloceanic sites [Smirnov et al., 2002].[10] Downwelling broadband SW and LW radiation at the
surface is measured by a suite of radiometers. Clear skyperiods are determined from the downwelling shortwaveradiation measurements following the procedure of Longand Ackerman, [2000]. A simple 2-parameter function ofsolar zenith angle is fit to the measured clear-sky irradiancesand used to infer clear-sky irradiance values during periodsof cloudy sky. A similar procedure is performed to inferclear-sky LW fluxes [Long, 2004]. Observed all-sky fluxesand inferred clear-sky fluxes are averaged to daily values.The difference (all-sky � clear-sky) is used to determine theeffect of clouds on the surface radiative budget.
3. Details of Model Simulations
[11] The details of the MMF configuration are given byKhairoutdinov and Randall [2001] and Khairoutdinov et al.[2005]. The MMF consists of a parent GCM with anindividual CSRM running in each GCM grid column. TheCSRM replaces the subgrid-scale cloud and radiationparameterizations of the parent model. In the version ofthe MMF being run at Pacific Northwest National Labora-tory and used in this study, the parent GCM is the NCARCommunity Atmosphere Model (CAM 3.0), which is theatmospheric component of the Community Climate SystemModel (CCSM) [Blackmon and Coauthors, 2001]. TheCAM is run with the finite volume dynamical core andhas 26 vertical layers and horizontal resolution of 2� latitudeand 2.5� longitude. The dynamical time step of the CAM is20 minutes and the radiation time step is 1 hour.[12] Details of the CAM physics can be found in Collins
et al. [2004]. Stratiform cloudiness, deep convection, andshallow convection are all treated with separate paramete-rizations. Total cloud condensate is a prognostic variable,and separation of total condensate into liquid and icedepends solely on temperature. Precipitation is also diag-nosed as rain or graupel-like snow. Cloud fraction isdiagnosed as a function of relative humidity, atmosphericstability, and convective mass flux. Three types of cloudfraction are diagnosed: low-level marine stratus, convective
cloud, and layered cloud. Total cloud fraction at each levelis the maximum of the individual cloud fractions in thelevel. Optical properties of liquid clouds [Slingo, 1989] andice clouds [Ebert and Curry, 1992] are parameterized. Thecalculation of SW radiation uses the d-Eddington approxi-mation, as described in Briegleb [1992]. Longwave radia-tive transfer is based on an absorptivity/emissivityformulation using a broad band model approach describedin Kiehl and Briegleb [1991]. The CAM 3.0 uses the newcloud overlap parameterization of Collins [2001] which isdesigned to reproduce calculations based on the indepen-dent column approximation.[13] The embedded CSRM [Khairoutdinov and Randall,
2001] within each CAM grid cell has 64 columns at 4 kmspacing and 24 layers in the vertical, which coincide withthe lowest 24 levels of the CAM. The CSRM domain isaligned in the east-west direction with cyclic lateral boun-dary conditions. The CSRM runs continuously with its own20-second dynamical timestep. Radiation calculations usingthe CAM radiative transfer code are performed on eachCSRM column every 10 minutes, using the time averagedtemperature, water vapor and cloud fields from the CSRM.The CSRM is forced by the large-scale tendencies fromthe CAM every CAM time-step and the horizontally aver-aged heating and moisture fields from the CSRM are fedback to the CAM as the tendencies due to subgrid-scaleprocesses. Each of the CSRM columns has the same surfaceconditions, which are imposed by the CAM land surfacemodel; no column represents a particular location within thegridbox.[14] The CSRM predicts liquid water and ice moist static
energy (which is the sum of the sensible, potential, and latentheat energy), total non-precipitating water (vapor + liquid +ice) and total precipitating water (rain + snow + graupel).Partitioning of cloud condensate and precipitating water isdone every time step as a function of temperature then theresulting mixing ratios are used to compute the sedimenta-tion and hydrometeor conversion rates [Khairoutdinov andRandall, 2001]. The CSRM uses the same optical propertyparameterizations and radiation code as the CAM, althoughno overlap approximation is needed as each CSRM grid boxis either clear or cloudy, with no fractional cloud cover.[15] The MMF simulation was initialized on 1 September
1997 using initial model fields from a CAM spinup simu-lation and was run through 2001, using observed monthlysea surface temperatures (SST). A CAM model run wasperformed for the same period with the same SST values.For comparisons with the observations, the output from theCAM gridbox nearest the ARM sites is used. For the MMF,the 64 CSRM columns within the nearest GCM gridbox tothe ARM sites are used.
4. Results
[16] Comparisons of time series of observations at a pointto model grid box averages are difficult because of theinherent differences in the spatial and temporal scales of themodels and the observations [Jakob et al., 2004]. Some ofthese difficulties are ameliorated in this study by onlyexamining long-term averages and frequency distributions.Additionally, the MMF serves as a link between the finetemporal and spatial scale of the observations and the large
D14218 MCFARLANE ET AL.: RADIATIVE HEATING PROFILE COMPARISONS
3 of 22
D14218
scale GCM. Time series or frequency distributions ofCSRM column quantities can be compared more directlyto the observed surface time series, while the MMF gridboxaverages can be compared more directly to the CAM valuesand the satellite observations.[17] Evaluation of GCM simulations of the Earth’s radia-
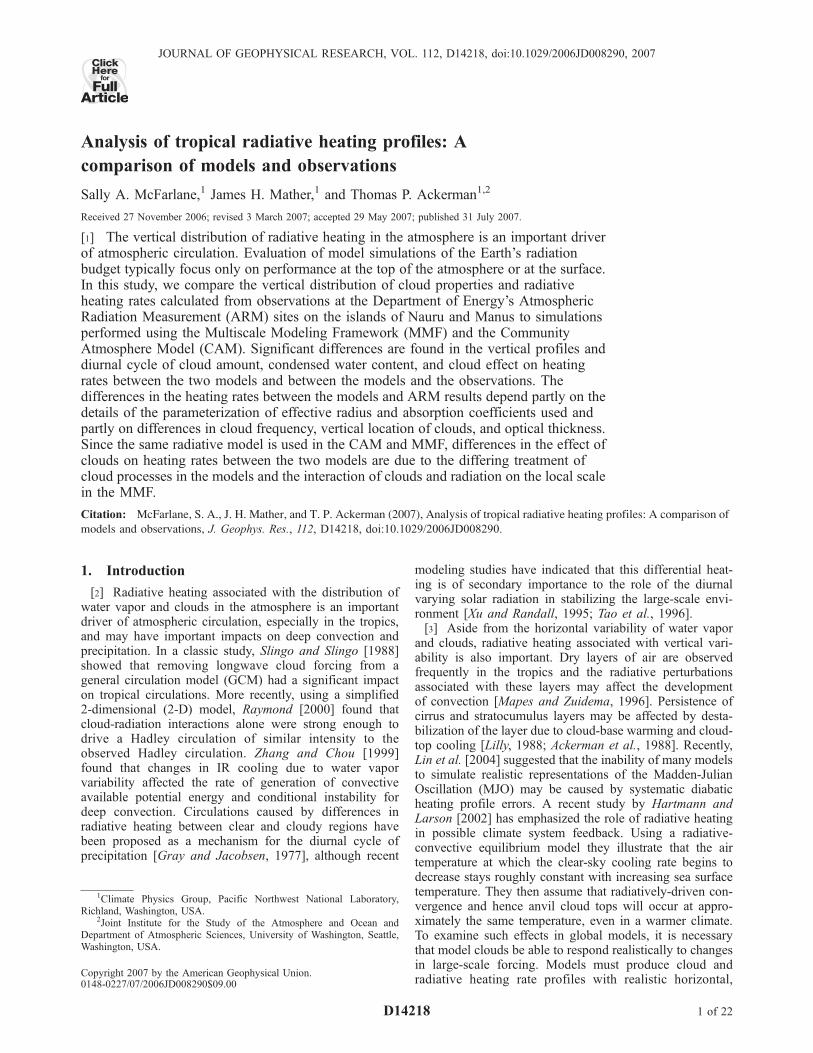
tion balance typically focus on performance at the TOA orthe surface. Here, we briefly examine the ability of themodels to simulate the daily average surface cloud effect,which we define as all-sky flux minus clear-sky flux.Histograms of the cloud effect at the surface over the studyperiods at the two sites (Figure 1) show that the CAMproduces reasonable estimates of the effect of clouds onboth the SW and LW radiation at the surface. The MMFsignificantly overestimates the SW cloud effect at Manusbut agrees with the observations as well as the CAM atNauru and is in reasonable agreement with the LW cloudeffect at both sites. The MMF overestimates the averageSW cloud effect at Manus due to underestimation of thefrequency of clear sky (small SW flux differences) andoverestimation of the frequency of optically thick cloudswith strong SW cloud effects (SW flux differences between�100 and �300 Wm�2) at Manus. The MMF is inreasonable agreement with the average measured LW cloudeffect at Manus, but underestimates the variability. Thesame surface radiation can be produced by a number ofdifferent cloud vertical profiles and errors in the correctspecification of the vertical distribution of cloud propertiesmay compensate to produce reasonable values at the boun-
daries. In the remainder of this section, we examine thedifferences in the vertical distributions of clouds andradiative heating rates in the ARM dataset and modelsimulations.
4.1. Vertical Distribution of Clouds at Manus
4.1.1. Cloud Frequency[18] The column energy budget and the distribution of
radiative heating within the column depend on total cloudamount, optical properties of cloud layers, and the verticaldistribution of clouds [Stephens and Webster, 1981]. Thevertical distribution of non-precipitating cloud frequencyfrom the ARM observations at Manus shows a trimodalstructure (Figure 2). Peaks in cloud frequency occur near1 km, 5 km and 12–13 km. The peak near 5 km isassociated with a weak stable layer that occurs near themelting level [Johnson et al., 1999]. Observed clouds withtops at this altitude are generally cumulus congestus or thinaltocumulus layers. The peak at 1 km is associated withshallow boundary layer clouds and the broad peak from 8 to13 km represents ice clouds associated with anvil outflowfrom deep convection. The observations show a minimumin cloud between 2 and 4 km as seen in other studies[Zuidema, 1998]. Cloud is rarely observed above 15 km inthe radar dataset.[19] The vertical distributions of mean cloud frequency
from the MMF and average gridbox cloud fraction from theCAM are similar in shape to the ARM distribution of cloudfrequency, but differences in the location and magnitude ofpeak cloudiness are apparent (Figure 2). The MMF results
Figure 1. Frequency distributions of cloud effect (all-sky minus clear-sky) on surface (a) SW flux atManus, (b) SW flux at Nauru, (c) LW flux at Manus, (d) LW flux at Nauru for the ARM measurements(solid lines), MMF model (dashed line) and CAM model (dotted line). The mean surface cloud effect foreach dataset is given in the legend.
D14218 MCFARLANE ET AL.: RADIATIVE HEATING PROFILE COMPARISONS
4 of 22
D14218
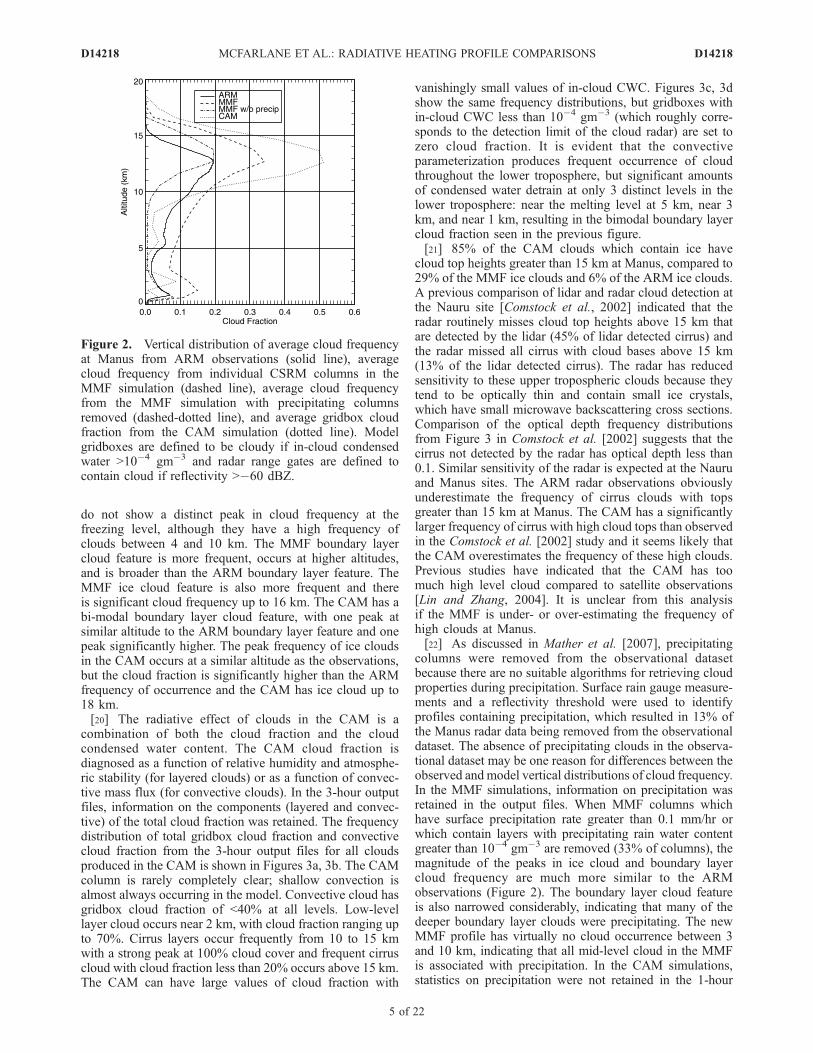
do not show a distinct peak in cloud frequency at thefreezing level, although they have a high frequency ofclouds between 4 and 10 km. The MMF boundary layercloud feature is more frequent, occurs at higher altitudes,and is broader than the ARM boundary layer feature. TheMMF ice cloud feature is also more frequent and thereis significant cloud frequency up to 16 km. The CAM has abi-modal boundary layer cloud feature, with one peak atsimilar altitude to the ARM boundary layer feature and onepeak significantly higher. The peak frequency of ice cloudsin the CAM occurs at a similar altitude as the observations,but the cloud fraction is significantly higher than the ARMfrequency of occurrence and the CAM has ice cloud up to18 km.[20] The radiative effect of clouds in the CAM is a
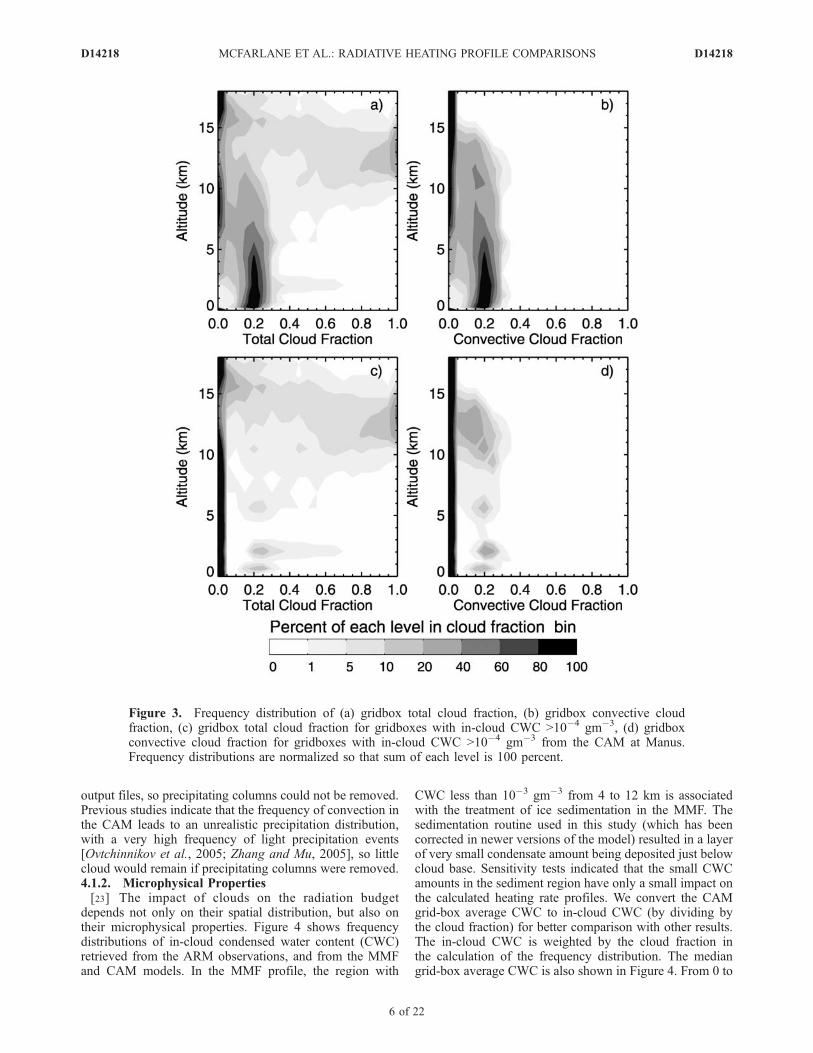
combination of both the cloud fraction and the cloudcondensed water content. The CAM cloud fraction isdiagnosed as a function of relative humidity and atmosphe-ric stability (for layered clouds) or as a function of convec-tive mass flux (for convective clouds). In the 3-hour outputfiles, information on the components (layered and convec-tive) of the total cloud fraction was retained. The frequencydistribution of total gridbox cloud fraction and convectivecloud fraction from the 3-hour output files for all cloudsproduced in the CAM is shown in Figures 3a, 3b. The CAMcolumn is rarely completely clear; shallow convection isalmost always occurring in the model. Convective cloud hasgridbox cloud fraction of <40% at all levels. Low-levellayer cloud occurs near 2 km, with cloud fraction ranging upto 70%. Cirrus layers occur frequently from 10 to 15 kmwith a strong peak at 100% cloud cover and frequent cirruscloud with cloud fraction less than 20% occurs above 15 km.The CAM can have large values of cloud fraction with
vanishingly small values of in-cloud CWC. Figures 3c, 3dshow the same frequency distributions, but gridboxes within-cloud CWC less than 10�4 gm�3 (which roughly corre-sponds to the detection limit of the cloud radar) are set tozero cloud fraction. It is evident that the convectiveparameterization produces frequent occurrence of cloudthroughout the lower troposphere, but significant amountsof condensed water detrain at only 3 distinct levels in thelower troposphere: near the melting level at 5 km, near 3km, and near 1 km, resulting in the bimodal boundary layercloud fraction seen in the previous figure.[21] 85% of the CAM clouds which contain ice have
cloud top heights greater than 15 km at Manus, compared to29% of the MMF ice clouds and 6% of the ARM ice clouds.A previous comparison of lidar and radar cloud detection atthe Nauru site [Comstock et al., 2002] indicated that theradar routinely misses cloud top heights above 15 km thatare detected by the lidar (45% of lidar detected cirrus) andthe radar missed all cirrus with cloud bases above 15 km(13% of the lidar detected cirrus). The radar has reducedsensitivity to these upper tropospheric clouds because theytend to be optically thin and contain small ice crystals,which have small microwave backscattering cross sections.Comparison of the optical depth frequency distributionsfrom Figure 3 in Comstock et al. [2002] suggests that thecirrus not detected by the radar has optical depth less than0.1. Similar sensitivity of the radar is expected at the Nauruand Manus sites. The ARM radar observations obviouslyunderestimate the frequency of cirrus clouds with topsgreater than 15 km at Manus. The CAM has a significantlylarger frequency of cirrus with high cloud tops than observedin the Comstock et al. [2002] study and it seems likely thatthe CAM overestimates the frequency of these high clouds.Previous studies have indicated that the CAM has toomuch high level cloud compared to satellite observations[Lin and Zhang, 2004]. It is unclear from this analysisif the MMF is under- or over-estimating the frequency ofhigh clouds at Manus.[22] As discussed in Mather et al. [2007], precipitating
columns were removed from the observational datasetbecause there are no suitable algorithms for retrieving cloudproperties during precipitation. Surface rain gauge measure-ments and a reflectivity threshold were used to identifyprofiles containing precipitation, which resulted in 13% ofthe Manus radar data being removed from the observationaldataset. The absence of precipitating clouds in the observa-tional dataset may be one reason for differences between theobserved and model vertical distributions of cloud frequency.In the MMF simulations, information on precipitation wasretained in the output files. When MMF columns whichhave surface precipitation rate greater than 0.1 mm/hr orwhich contain layers with precipitating rain water contentgreater than 10�4 gm�3 are removed (33% of columns), themagnitude of the peaks in ice cloud and boundary layercloud frequency are much more similar to the ARMobservations (Figure 2). The boundary layer cloud featureis also narrowed considerably, indicating that many of thedeeper boundary layer clouds were precipitating. The newMMF profile has virtually no cloud occurrence between 3and 10 km, indicating that all mid-level cloud in the MMFis associated with precipitation. In the CAM simulations,statistics on precipitation were not retained in the 1-hour
Figure 2. Vertical distribution of average cloud frequencyat Manus from ARM observations (solid line), averagecloud frequency from individual CSRM columns in theMMF simulation (dashed line), average cloud frequencyfrom the MMF simulation with precipitating columnsremoved (dashed-dotted line), and average gridbox cloudfraction from the CAM simulation (dotted line). Modelgridboxes are defined to be cloudy if in-cloud condensedwater >10�4 gm�3 and radar range gates are defined tocontain cloud if reflectivity >�60 dBZ.
D14218 MCFARLANE ET AL.: RADIATIVE HEATING PROFILE COMPARISONS
5 of 22
D14218
output files, so precipitating columns could not be removed.Previous studies indicate that the frequency of convection inthe CAM leads to an unrealistic precipitation distribution,with a very high frequency of light precipitation events[Ovtchinnikov et al., 2005; Zhang and Mu, 2005], so littlecloud would remain if precipitating columns were removed.4.1.2. Microphysical Properties[23] The impact of clouds on the radiation budget
depends not only on their spatial distribution, but also ontheir microphysical properties. Figure 4 shows frequencydistributions of in-cloud condensed water content (CWC)retrieved from the ARM observations, and from the MMFand CAM models. In the MMF profile, the region with
CWC less than 10�3 gm�3 from 4 to 12 km is associatedwith the treatment of ice sedimentation in the MMF. Thesedimentation routine used in this study (which has beencorrected in newer versions of the model) resulted in a layerof very small condensate amount being deposited just belowcloud base. Sensitivity tests indicated that the small CWCamounts in the sediment region have only a small impact onthe calculated heating rate profiles. We convert the CAMgrid-box average CWC to in-cloud CWC (by dividing bythe cloud fraction) for better comparison with other results.The in-cloud CWC is weighted by the cloud fraction inthe calculation of the frequency distribution. The mediangrid-box average CWC is also shown in Figure 4. From 0 to
Figure 3. Frequency distribution of (a) gridbox total cloud fraction, (b) gridbox convective cloudfraction, (c) gridbox total cloud fraction for gridboxes with in-cloud CWC >10�4 gm�3, (d) gridboxconvective cloud fraction for gridboxes with in-cloud CWC >10�4 gm�3 from the CAM at Manus.Frequency distributions are normalized so that sum of each level is 100 percent.
D14218 MCFARLANE ET AL.: RADIATIVE HEATING PROFILE COMPARISONS
6 of 22
D14218
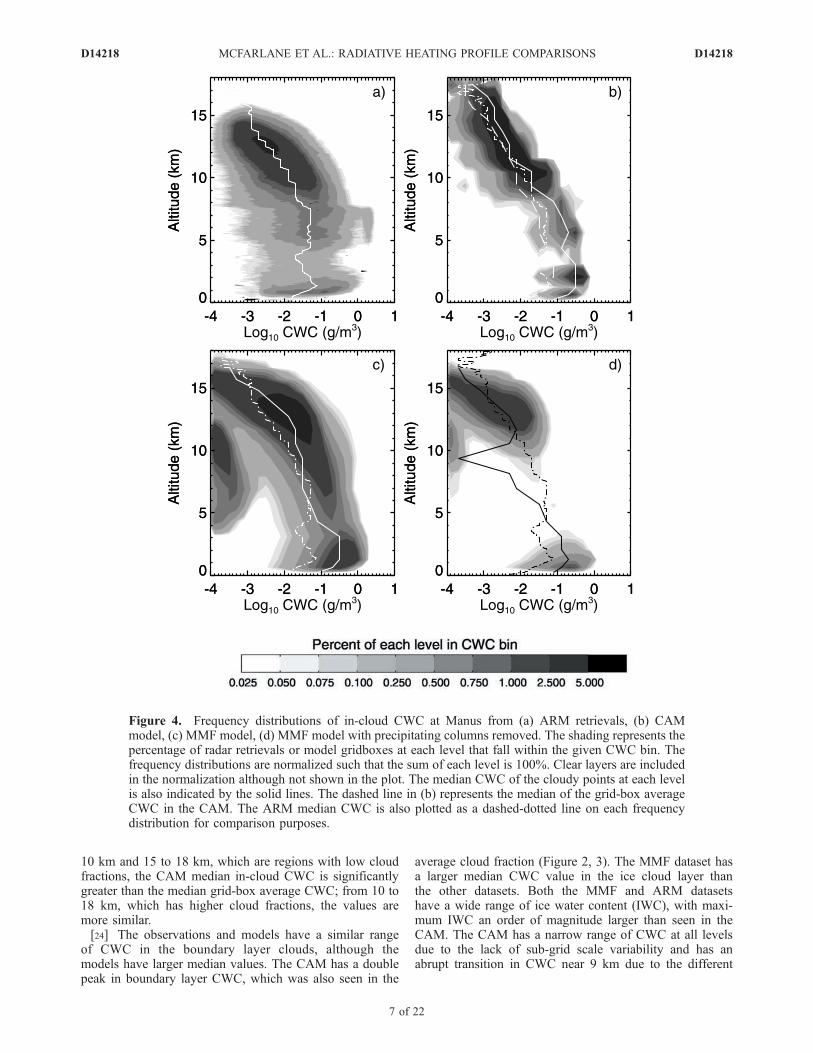
10 km and 15 to 18 km, which are regions with low cloudfractions, the CAM median in-cloud CWC is significantlygreater than the median grid-box average CWC; from 10 to18 km, which has higher cloud fractions, the values aremore similar.[24] The observations and models have a similar range
of CWC in the boundary layer clouds, although themodels have larger median values. The CAM has a doublepeak in boundary layer CWC, which was also seen in the
average cloud fraction (Figure 2, 3). The MMF dataset hasa larger median CWC value in the ice cloud layer thanthe other datasets. Both the MMF and ARM datasetshave a wide range of ice water content (IWC), with maxi-mum IWC an order of magnitude larger than seen in theCAM. The CAM has a narrow range of CWC at all levelsdue to the lack of sub-grid scale variability and has anabrupt transition in CWC near 9 km due to the different
Figure 4. Frequency distributions of in-cloud CWC at Manus from (a) ARM retrievals, (b) CAMmodel, (c) MMF model, (d) MMF model with precipitating columns removed. The shading represents thepercentage of radar retrievals or model gridboxes at each level that fall within the given CWC bin. Thefrequency distributions are normalized such that the sum of each level is 100%. Clear layers are includedin the normalization although not shown in the plot. The median CWC of the cloudy points at each levelis also indicated by the solid lines. The dashed line in (b) represents the median of the grid-box averageCWC in the CAM. The ARM median CWC is also plotted as a dashed-dotted line on each frequencydistribution for comparison purposes.
D14218 MCFARLANE ET AL.: RADIATIVE HEATING PROFILE COMPARISONS
7 of 22
D14218
treatment of cloud condensate in the convective and strati-form parameterizations.[25] The radiative effect of clouds also depends on their
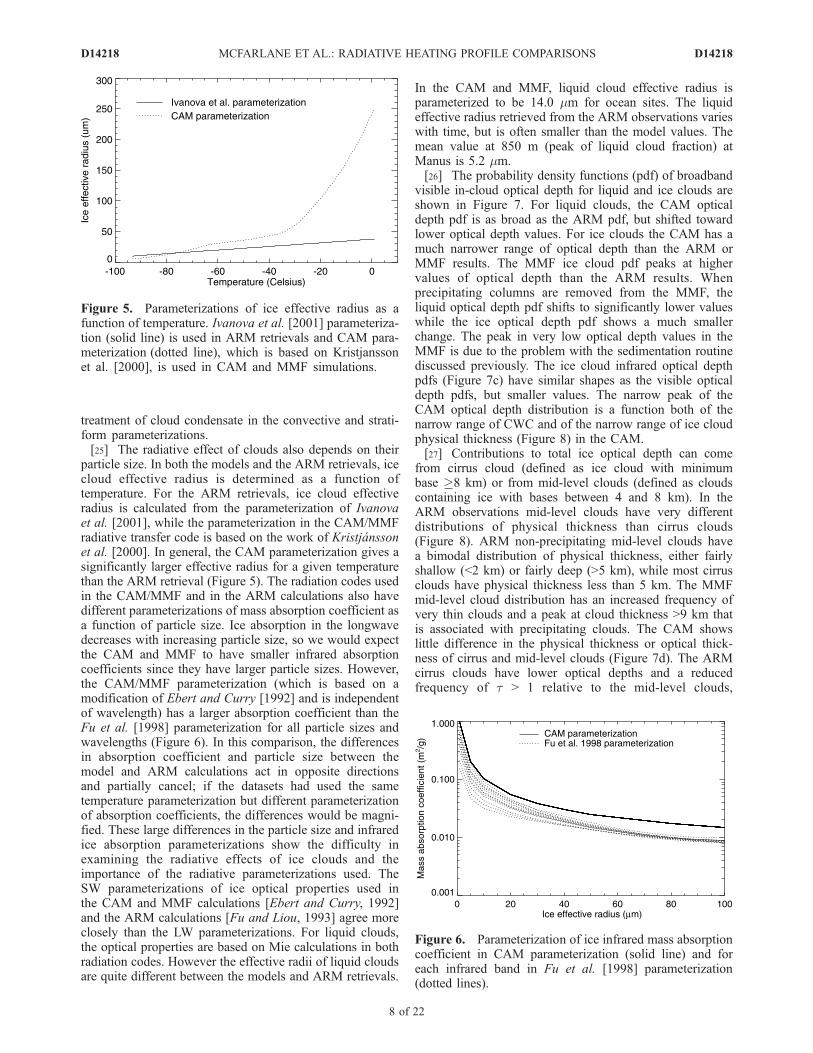
particle size. In both the models and the ARM retrievals, icecloud effective radius is determined as a function oftemperature. For the ARM retrievals, ice cloud effectiveradius is calculated from the parameterization of Ivanovaet al. [2001], while the parameterization in the CAM/MMFradiative transfer code is based on the work of Kristjanssonet al. [2000]. In general, the CAM parameterization gives asignificantly larger effective radius for a given temperaturethan the ARM retrieval (Figure 5). The radiation codes usedin the CAM/MMF and in the ARM calculations also havedifferent parameterizations of mass absorption coefficient asa function of particle size. Ice absorption in the longwavedecreases with increasing particle size, so we would expectthe CAM and MMF to have smaller infrared absorptioncoefficients since they have larger particle sizes. However,the CAM/MMF parameterization (which is based on amodification of Ebert and Curry [1992] and is independentof wavelength) has a larger absorption coefficient than theFu et al. [1998] parameterization for all particle sizes andwavelengths (Figure 6). In this comparison, the differencesin absorption coefficient and particle size between themodel and ARM calculations act in opposite directionsand partially cancel; if the datasets had used the sametemperature parameterization but different parameterizationof absorption coefficients, the differences would be magni-fied. These large differences in the particle size and infraredice absorption parameterizations show the difficulty inexamining the radiative effects of ice clouds and theimportance of the radiative parameterizations used. TheSW parameterizations of ice optical properties used inthe CAM and MMF calculations [Ebert and Curry, 1992]and the ARM calculations [Fu and Liou, 1993] agree moreclosely than the LW parameterizations. For liquid clouds,the optical properties are based on Mie calculations in bothradiation codes. However the effective radii of liquid cloudsare quite different between the models and ARM retrievals.
In the CAM and MMF, liquid cloud effective radius isparameterized to be 14.0 mm for ocean sites. The liquideffective radius retrieved from the ARM observations varieswith time, but is often smaller than the model values. Themean value at 850 m (peak of liquid cloud fraction) atManus is 5.2 mm.[26] The probability density functions (pdf) of broadband
visible in-cloud optical depth for liquid and ice clouds areshown in Figure 7. For liquid clouds, the CAM opticaldepth pdf is as broad as the ARM pdf, but shifted towardlower optical depth values. For ice clouds the CAM has amuch narrower range of optical depth than the ARM orMMF results. The MMF ice cloud pdf peaks at highervalues of optical depth than the ARM results. Whenprecipitating columns are removed from the MMF, theliquid optical depth pdf shifts to significantly lower valueswhile the ice optical depth pdf shows a much smallerchange. The peak in very low optical depth values in theMMF is due to the problem with the sedimentation routinediscussed previously. The ice cloud infrared optical depthpdfs (Figure 7c) have similar shapes as the visible opticaldepth pdfs, but smaller values. The narrow peak of theCAM optical depth distribution is a function both of thenarrow range of CWC and of the narrow range of ice cloudphysical thickness (Figure 8) in the CAM.[27] Contributions to total ice optical depth can come
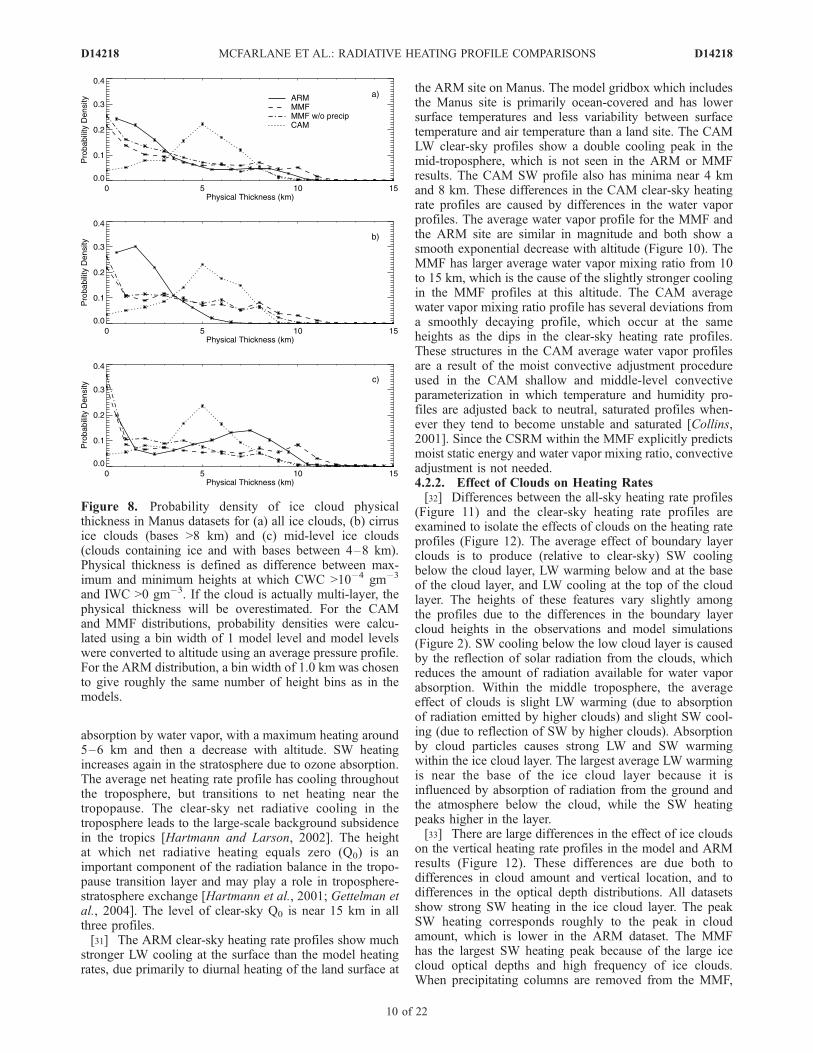
from cirrus cloud (defined as ice cloud with minimumbase �8 km) or from mid-level clouds (defined as cloudscontaining ice with bases between 4 and 8 km). In theARM observations mid-level clouds have very differentdistributions of physical thickness than cirrus clouds(Figure 8). ARM non-precipitating mid-level clouds havea bimodal distribution of physical thickness, either fairlyshallow (<2 km) or fairly deep (>5 km), while most cirrusclouds have physical thickness less than 5 km. The MMFmid-level cloud distribution has an increased frequency ofvery thin clouds and a peak at cloud thickness >9 km thatis associated with precipitating clouds. The CAM showslittle difference in the physical thickness or optical thick-ness of cirrus and mid-level clouds (Figure 7d). The ARMcirrus clouds have lower optical depths and a reducedfrequency of t > 1 relative to the mid-level clouds,
Figure 5. Parameterizations of ice effective radius as afunction of temperature. Ivanova et al. [2001] parameteriza-tion (solid line) is used in ARM retrievals and CAM para-meterization (dotted line), which is based on Kristjanssonet al. [2000], is used in CAM and MMF simulations.
Figure 6. Parameterization of ice infrared mass absorptioncoefficient in CAM parameterization (solid line) and foreach infrared band in Fu et al. [1998] parameterization(dotted lines).
D14218 MCFARLANE ET AL.: RADIATIVE HEATING PROFILE COMPARISONS
8 of 22
D14218
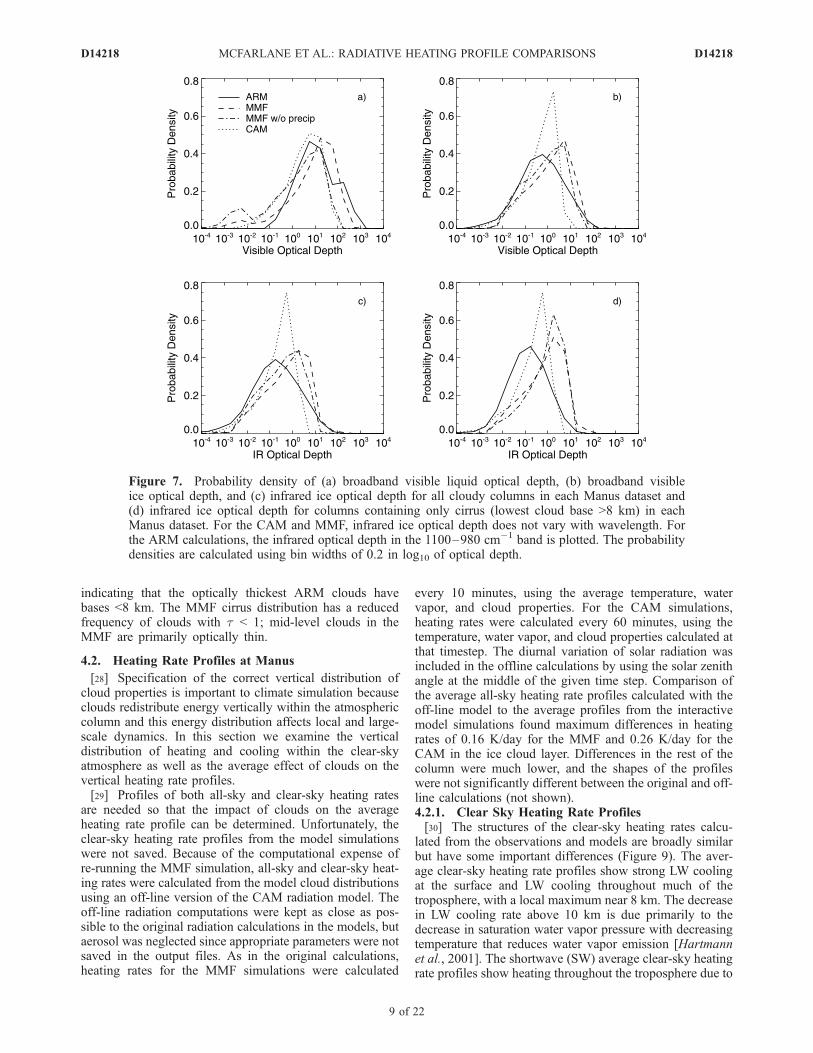
indicating that the optically thickest ARM clouds havebases <8 km. The MMF cirrus distribution has a reducedfrequency of clouds with t < 1; mid-level clouds in theMMF are primarily optically thin.
4.2. Heating Rate Profiles at Manus
[28] Specification of the correct vertical distribution ofcloud properties is important to climate simulation becauseclouds redistribute energy vertically within the atmosphericcolumn and this energy distribution affects local and large-scale dynamics. In this section we examine the verticaldistribution of heating and cooling within the clear-skyatmosphere as well as the average effect of clouds on thevertical heating rate profiles.[29] Profiles of both all-sky and clear-sky heating rates
are needed so that the impact of clouds on the averageheating rate profile can be determined. Unfortunately, theclear-sky heating rate profiles from the model simulationswere not saved. Because of the computational expense ofre-running the MMF simulation, all-sky and clear-sky heat-ing rates were calculated from the model cloud distributionsusing an off-line version of the CAM radiation model. Theoff-line radiation computations were kept as close as pos-sible to the original radiation calculations in the models, butaerosol was neglected since appropriate parameters were notsaved in the output files. As in the original calculations,heating rates for the MMF simulations were calculated
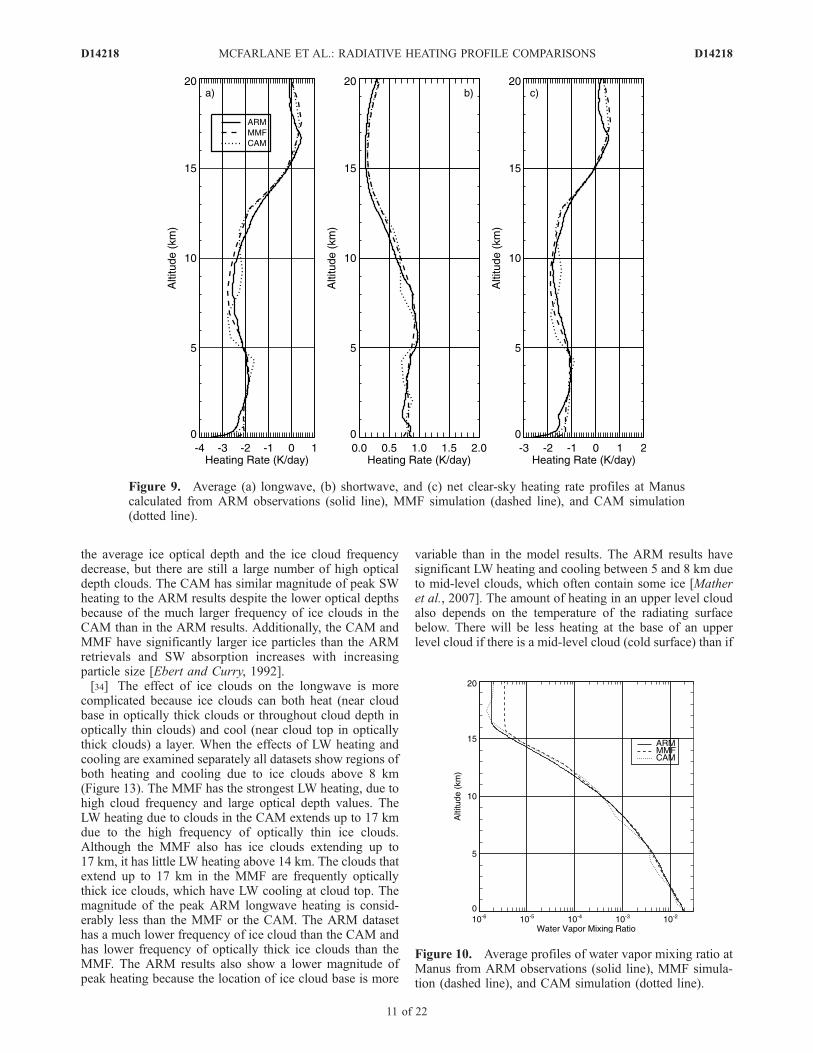
every 10 minutes, using the average temperature, watervapor, and cloud properties. For the CAM simulations,heating rates were calculated every 60 minutes, using thetemperature, water vapor, and cloud properties calculated atthat timestep. The diurnal variation of solar radiation wasincluded in the offline calculations by using the solar zenithangle at the middle of the given time step. Comparison ofthe average all-sky heating rate profiles calculated with theoff-line model to the average profiles from the interactivemodel simulations found maximum differences in heatingrates of 0.16 K/day for the MMF and 0.26 K/day for theCAM in the ice cloud layer. Differences in the rest of thecolumn were much lower, and the shapes of the profileswere not significantly different between the original and off-line calculations (not shown).4.2.1. Clear Sky Heating Rate Profiles[30] The structures of the clear-sky heating rates calcu-
lated from the observations and models are broadly similarbut have some important differences (Figure 9). The aver-age clear-sky heating rate profiles show strong LW coolingat the surface and LW cooling throughout much of thetroposphere, with a local maximum near 8 km. The decreasein LW cooling rate above 10 km is due primarily to thedecrease in saturation water vapor pressure with decreasingtemperature that reduces water vapor emission [Hartmannet al., 2001]. The shortwave (SW) average clear-sky heatingrate profiles show heating throughout the troposphere due to
Figure 7. Probability density of (a) broadband visible liquid optical depth, (b) broadband visibleice optical depth, and (c) infrared ice optical depth for all cloudy columns in each Manus dataset and(d) infrared ice optical depth for columns containing only cirrus (lowest cloud base >8 km) in eachManus dataset. For the CAM and MMF, infrared ice optical depth does not vary with wavelength. Forthe ARM calculations, the infrared optical depth in the 1100–980 cm�1 band is plotted. The probabilitydensities are calculated using bin widths of 0.2 in log10 of optical depth.
D14218 MCFARLANE ET AL.: RADIATIVE HEATING PROFILE COMPARISONS
9 of 22
D14218
absorption by water vapor, with a maximum heating around5–6 km and then a decrease with altitude. SW heatingincreases again in the stratosphere due to ozone absorption.The average net heating rate profile has cooling throughoutthe troposphere, but transitions to net heating near thetropopause. The clear-sky net radiative cooling in thetroposphere leads to the large-scale background subsidencein the tropics [Hartmann and Larson, 2002]. The heightat which net radiative heating equals zero (Q0) is animportant component of the radiation balance in the tropo-pause transition layer and may play a role in troposphere-stratosphere exchange [Hartmann et al., 2001; Gettelman etal., 2004]. The level of clear-sky Q0 is near 15 km in allthree profiles.[31] The ARM clear-sky heating rate profiles show much
stronger LW cooling at the surface than the model heatingrates, due primarily to diurnal heating of the land surface at
the ARM site on Manus. The model gridbox which includesthe Manus site is primarily ocean-covered and has lowersurface temperatures and less variability between surfacetemperature and air temperature than a land site. The CAMLW clear-sky profiles show a double cooling peak in themid-troposphere, which is not seen in the ARM or MMFresults. The CAM SW profile also has minima near 4 kmand 8 km. These differences in the CAM clear-sky heatingrate profiles are caused by differences in the water vaporprofiles. The average water vapor profile for the MMF andthe ARM site are similar in magnitude and both show asmooth exponential decrease with altitude (Figure 10). TheMMF has larger average water vapor mixing ratio from 10to 15 km, which is the cause of the slightly stronger coolingin the MMF profiles at this altitude. The CAM averagewater vapor mixing ratio profile has several deviations froma smoothly decaying profile, which occur at the sameheights as the dips in the clear-sky heating rate profiles.These structures in the CAM average water vapor profilesare a result of the moist convective adjustment procedureused in the CAM shallow and middle-level convectiveparameterization in which temperature and humidity pro-files are adjusted back to neutral, saturated profiles when-ever they tend to become unstable and saturated [Collins,2001]. Since the CSRM within the MMF explicitly predictsmoist static energy and water vapor mixing ratio, convectiveadjustment is not needed.4.2.2. Effect of Clouds on Heating Rates[32] Differences between the all-sky heating rate profiles
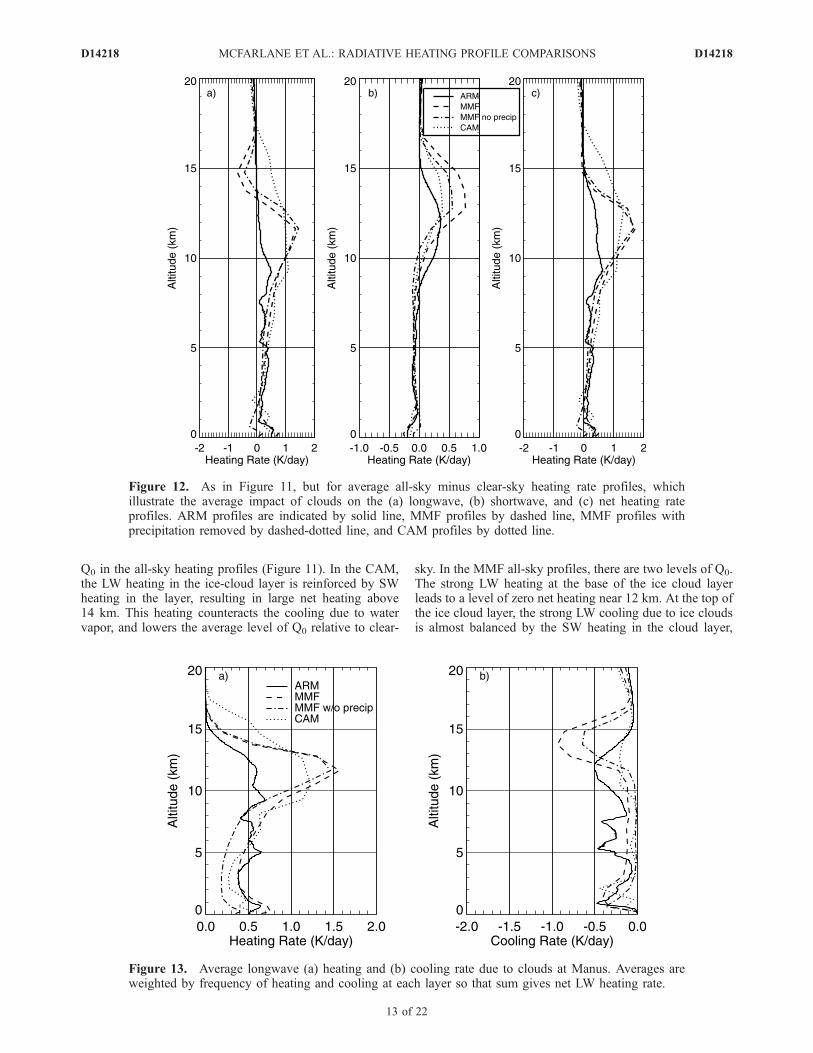
(Figure 11) and the clear-sky heating rate profiles areexamined to isolate the effects of clouds on the heating rateprofiles (Figure 12). The average effect of boundary layerclouds is to produce (relative to clear-sky) SW coolingbelow the cloud layer, LW warming below and at the baseof the cloud layer, and LW cooling at the top of the cloudlayer. The heights of these features vary slightly amongthe profiles due to the differences in the boundary layercloud heights in the observations and model simulations(Figure 2). SW cooling below the low cloud layer is causedby the reflection of solar radiation from the clouds, whichreduces the amount of radiation available for water vaporabsorption. Within the middle troposphere, the averageeffect of clouds is slight LW warming (due to absorptionof radiation emitted by higher clouds) and slight SW cool-ing (due to reflection of SW by higher clouds). Absorptionby cloud particles causes strong LW and SW warmingwithin the ice cloud layer. The largest average LW warmingis near the base of the ice cloud layer because it isinfluenced by absorption of radiation from the ground andthe atmosphere below the cloud, while the SW heatingpeaks higher in the layer.[33] There are large differences in the effect of ice clouds
on the vertical heating rate profiles in the model and ARMresults (Figure 12). These differences are due both todifferences in cloud amount and vertical location, and todifferences in the optical depth distributions. All datasetsshow strong SW heating in the ice cloud layer. The peakSW heating corresponds roughly to the peak in cloudamount, which is lower in the ARM dataset. The MMFhas the largest SW heating peak because of the large icecloud optical depths and high frequency of ice clouds.When precipitating columns are removed from the MMF,
Figure 8. Probability density of ice cloud physicalthickness in Manus datasets for (a) all ice clouds, (b) cirrusice clouds (bases >8 km) and (c) mid-level ice clouds(clouds containing ice and with bases between 4–8 km).Physical thickness is defined as difference between max-imum and minimum heights at which CWC >10�4 gm�3
and IWC >0 gm�3. If the cloud is actually multi-layer, thephysical thickness will be overestimated. For the CAMand MMF distributions, probability densities were calcu-lated using a bin width of 1 model level and model levelswere converted to altitude using an average pressure profile.For the ARM distribution, a bin width of 1.0 km was chosento give roughly the same number of height bins as in themodels.
D14218 MCFARLANE ET AL.: RADIATIVE HEATING PROFILE COMPARISONS
10 of 22
D14218
the average ice optical depth and the ice cloud frequencydecrease, but there are still a large number of high opticaldepth clouds. The CAM has similar magnitude of peak SWheating to the ARM results despite the lower optical depthsbecause of the much larger frequency of ice clouds in theCAM than in the ARM results. Additionally, the CAM andMMF have significantly larger ice particles than the ARMretrievals and SW absorption increases with increasingparticle size [Ebert and Curry, 1992].[34] The effect of ice clouds on the longwave is more
complicated because ice clouds can both heat (near cloudbase in optically thick clouds or throughout cloud depth inoptically thin clouds) and cool (near cloud top in opticallythick clouds) a layer. When the effects of LW heating andcooling are examined separately all datasets show regions ofboth heating and cooling due to ice clouds above 8 km(Figure 13). The MMF has the strongest LW heating, due tohigh cloud frequency and large optical depth values. TheLW heating due to clouds in the CAM extends up to 17 kmdue to the high frequency of optically thin ice clouds.Although the MMF also has ice clouds extending up to17 km, it has little LW heating above 14 km. The clouds thatextend up to 17 km in the MMF are frequently opticallythick ice clouds, which have LW cooling at cloud top. Themagnitude of the peak ARM longwave heating is consid-erably less than the MMF or the CAM. The ARM datasethas a much lower frequency of ice cloud than the CAM andhas lower frequency of optically thick ice clouds than theMMF. The ARM results also show a lower magnitude ofpeak heating because the location of ice cloud base is more
variable than in the model results. The ARM results havesignificant LW heating and cooling between 5 and 8 km dueto mid-level clouds, which often contain some ice [Matheret al., 2007]. The amount of heating in an upper level cloudalso depends on the temperature of the radiating surfacebelow. There will be less heating at the base of an upperlevel cloud if there is a mid-level cloud (cold surface) than if
Figure 9. Average (a) longwave, (b) shortwave, and (c) net clear-sky heating rate profiles at Manuscalculated from ARM observations (solid line), MMF simulation (dashed line), and CAM simulation(dotted line).
Figure 10. Average profiles of water vapor mixing ratio atManus from ARM observations (solid line), MMF simula-tion (dashed line), and CAM simulation (dotted line).
D14218 MCFARLANE ET AL.: RADIATIVE HEATING PROFILE COMPARISONS
11 of 22
D14218
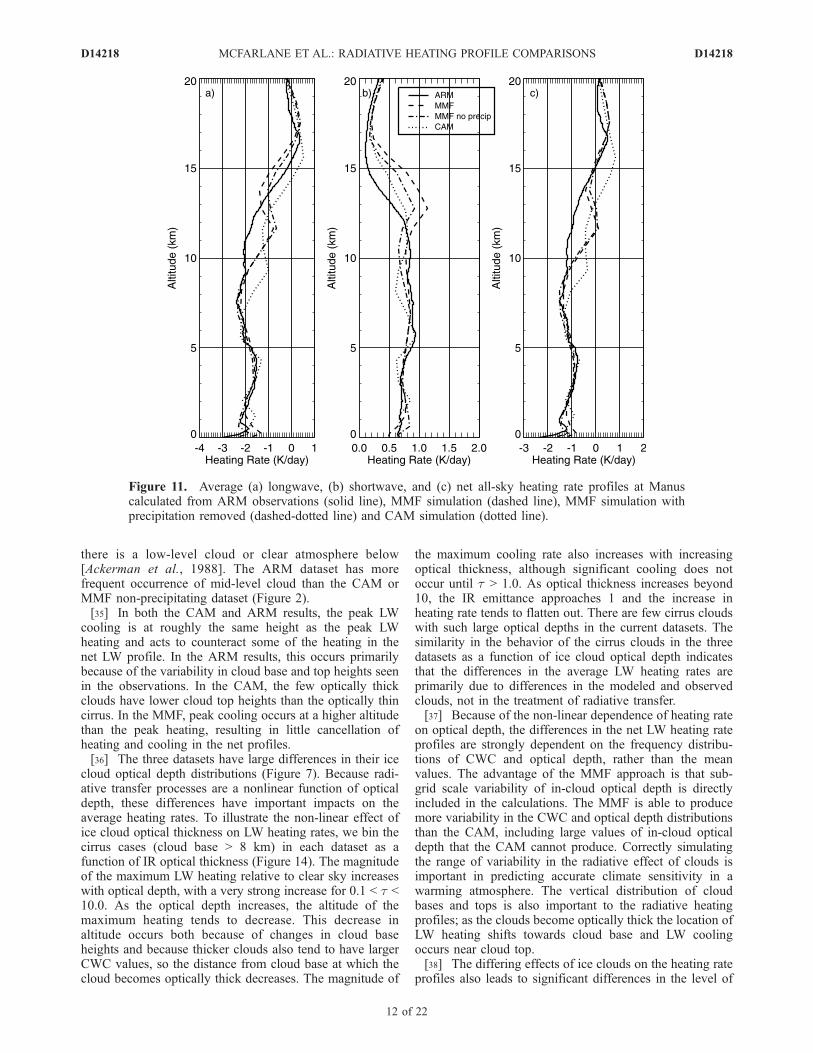
there is a low-level cloud or clear atmosphere below[Ackerman et al., 1988]. The ARM dataset has morefrequent occurrence of mid-level cloud than the CAM orMMF non-precipitating dataset (Figure 2).[35] In both the CAM and ARM results, the peak LW
cooling is at roughly the same height as the peak LWheating and acts to counteract some of the heating in thenet LW profile. In the ARM results, this occurs primarilybecause of the variability in cloud base and top heights seenin the observations. In the CAM, the few optically thickclouds have lower cloud top heights than the optically thincirrus. In the MMF, peak cooling occurs at a higher altitudethan the peak heating, resulting in little cancellation ofheating and cooling in the net profiles.[36] The three datasets have large differences in their ice
cloud optical depth distributions (Figure 7). Because radi-ative transfer processes are a nonlinear function of opticaldepth, these differences have important impacts on theaverage heating rates. To illustrate the non-linear effect ofice cloud optical thickness on LW heating rates, we bin thecirrus cases (cloud base > 8 km) in each dataset as afunction of IR optical thickness (Figure 14). The magnitudeof the maximum LW heating relative to clear sky increaseswith optical depth, with a very strong increase for 0.1 < t <10.0. As the optical depth increases, the altitude of themaximum heating tends to decrease. This decrease inaltitude occurs both because of changes in cloud baseheights and because thicker clouds also tend to have largerCWC values, so the distance from cloud base at which thecloud becomes optically thick decreases. The magnitude of
the maximum cooling rate also increases with increasingoptical thickness, although significant cooling does notoccur until t > 1.0. As optical thickness increases beyond10, the IR emittance approaches 1 and the increase inheating rate tends to flatten out. There are few cirrus cloudswith such large optical depths in the current datasets. Thesimilarity in the behavior of the cirrus clouds in the threedatasets as a function of ice cloud optical depth indicatesthat the differences in the average LW heating rates areprimarily due to differences in the modeled and observedclouds, not in the treatment of radiative transfer.[37] Because of the non-linear dependence of heating rate
on optical depth, the differences in the net LW heating rateprofiles are strongly dependent on the frequency distribu-tions of CWC and optical depth, rather than the meanvalues. The advantage of the MMF approach is that sub-grid scale variability of in-cloud optical depth is directlyincluded in the calculations. The MMF is able to producemore variability in the CWC and optical depth distributionsthan the CAM, including large values of in-cloud opticaldepth that the CAM cannot produce. Correctly simulatingthe range of variability in the radiative effect of clouds isimportant in predicting accurate climate sensitivity in awarming atmosphere. The vertical distribution of cloudbases and tops is also important to the radiative heatingprofiles; as the clouds become optically thick the location ofLW heating shifts towards cloud base and LW coolingoccurs near cloud top.[38] The differing effects of ice clouds on the heating rate
profiles also leads to significant differences in the level of
Figure 11. Average (a) longwave, (b) shortwave, and (c) net all-sky heating rate profiles at Manuscalculated from ARM observations (solid line), MMF simulation (dashed line), MMF simulation withprecipitation removed (dashed-dotted line) and CAM simulation (dotted line).
D14218 MCFARLANE ET AL.: RADIATIVE HEATING PROFILE COMPARISONS
12 of 22
D14218
Q0 in the all-sky heating profiles (Figure 11). In the CAM,the LW heating in the ice-cloud layer is reinforced by SWheating in the layer, resulting in large net heating above14 km. This heating counteracts the cooling due to watervapor, and lowers the average level of Q0 relative to clear-
sky. In the MMF all-sky profiles, there are two levels of Q0.The strong LW heating at the base of the ice cloud layerleads to a level of zero net heating near 12 km. At the top ofthe ice cloud layer, the strong LW cooling due to ice cloudsis almost balanced by the SW heating in the cloud layer,
Figure 12. As in Figure 11, but for average all-sky minus clear-sky heating rate profiles, whichillustrate the average impact of clouds on the (a) longwave, (b) shortwave, and (c) net heating rateprofiles. ARM profiles are indicated by solid line, MMF profiles by dashed line, MMF profiles withprecipitation removed by dashed-dotted line, and CAM profiles by dotted line.
Figure 13. Average longwave (a) heating and (b) cooling rate due to clouds at Manus. Averages areweighted by frequency of heating and cooling at each layer so that sum gives net LW heating rate.
D14218 MCFARLANE ET AL.: RADIATIVE HEATING PROFILE COMPARISONS
13 of 22
D14218
leading to a level of Q0 close to the clear-sky value. Theexact level of Q0 in the all-sky calculations depends on boththe parameterization of the optical properties of the clouds(including effective radius and absorption coefficient) andthe frequency of clouds with large optical thickness. Sensi-tivity calculations by Gettelman et al. [2004] indicate thatthe presence of high cloud will raise the level of Q0, withlarger increases expected for thicker clouds and for highercloud tops. The results of this study indicate a morecomplicated picture in the long term average effects ofclouds on the height of the level of Q0.
4.3. Clouds and Heating Rates at Nauru
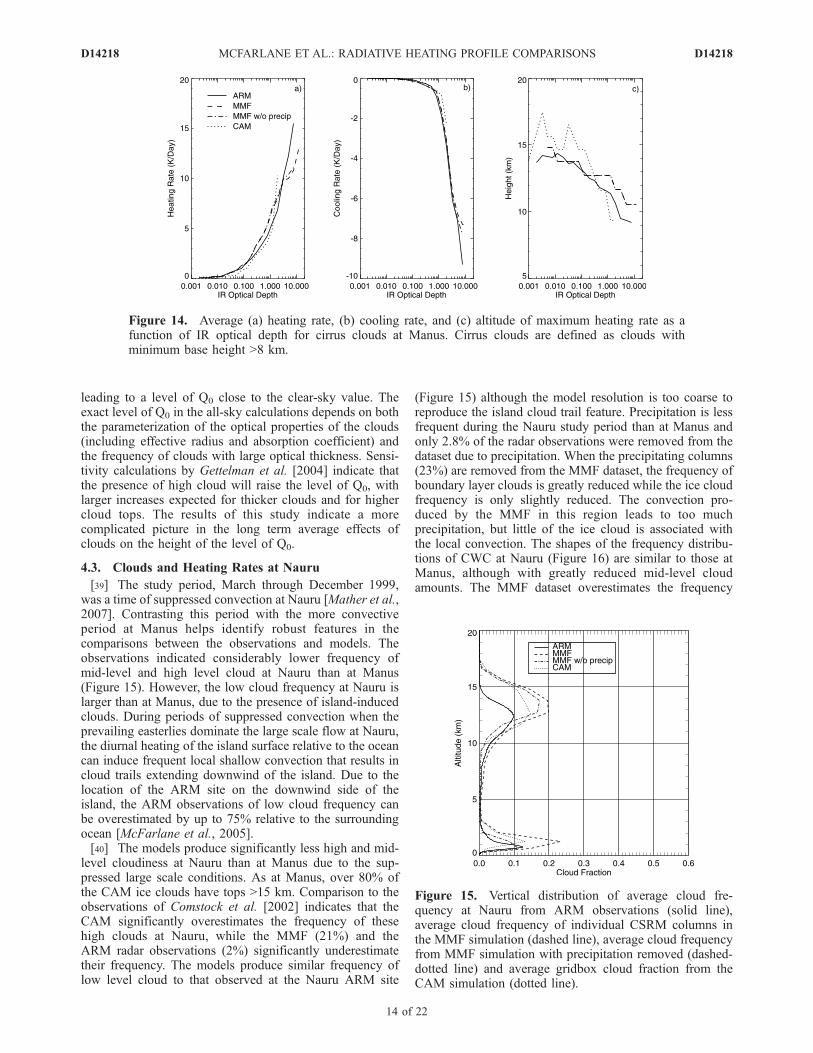
[39] The study period, March through December 1999,was a time of suppressed convection at Nauru [Mather et al.,2007]. Contrasting this period with the more convectiveperiod at Manus helps identify robust features in thecomparisons between the observations and models. Theobservations indicated considerably lower frequency ofmid-level and high level cloud at Nauru than at Manus(Figure 15). However, the low cloud frequency at Nauru islarger than at Manus, due to the presence of island-inducedclouds. During periods of suppressed convection when theprevailing easterlies dominate the large scale flow at Nauru,the diurnal heating of the island surface relative to the oceancan induce frequent local shallow convection that results incloud trails extending downwind of the island. Due to thelocation of the ARM site on the downwind side of theisland, the ARM observations of low cloud frequency canbe overestimated by up to 75% relative to the surroundingocean [McFarlane et al., 2005].[40] The models produce significantly less high and mid-
level cloudiness at Nauru than at Manus due to the sup-pressed large scale conditions. As at Manus, over 80% ofthe CAM ice clouds have tops >15 km. Comparison to theobservations of Comstock et al. [2002] indicates that theCAM significantly overestimates the frequency of thesehigh clouds at Nauru, while the MMF (21%) and theARM radar observations (2%) significantly underestimatetheir frequency. The models produce similar frequency oflow level cloud to that observed at the Nauru ARM site
(Figure 15) although the model resolution is too coarse toreproduce the island cloud trail feature. Precipitation is lessfrequent during the Nauru study period than at Manus andonly 2.8% of the radar observations were removed from thedataset due to precipitation. When the precipitating columns(23%) are removed from the MMF dataset, the frequency ofboundary layer clouds is greatly reduced while the ice cloudfrequency is only slightly reduced. The convection pro-duced by the MMF in this region leads to too muchprecipitation, but little of the ice cloud is associated withthe local convection. The shapes of the frequency distribu-tions of CWC at Nauru (Figure 16) are similar to those atManus, although with greatly reduced mid-level cloudamounts. The MMF dataset overestimates the frequency
Figure 14. Average (a) heating rate, (b) cooling rate, and (c) altitude of maximum heating rate as afunction of IR optical depth for cirrus clouds at Manus. Cirrus clouds are defined as clouds withminimum base height >8 km.
Figure 15. Vertical distribution of average cloud fre-quency at Nauru from ARM observations (solid line),average cloud frequency of individual CSRM columns inthe MMF simulation (dashed line), average cloud frequencyfrom MMF simulation with precipitation removed (dashed-dotted line) and average gridbox cloud fraction from theCAM simulation (dotted line).
D14218 MCFARLANE ET AL.: RADIATIVE HEATING PROFILE COMPARISONS
14 of 22
D14218
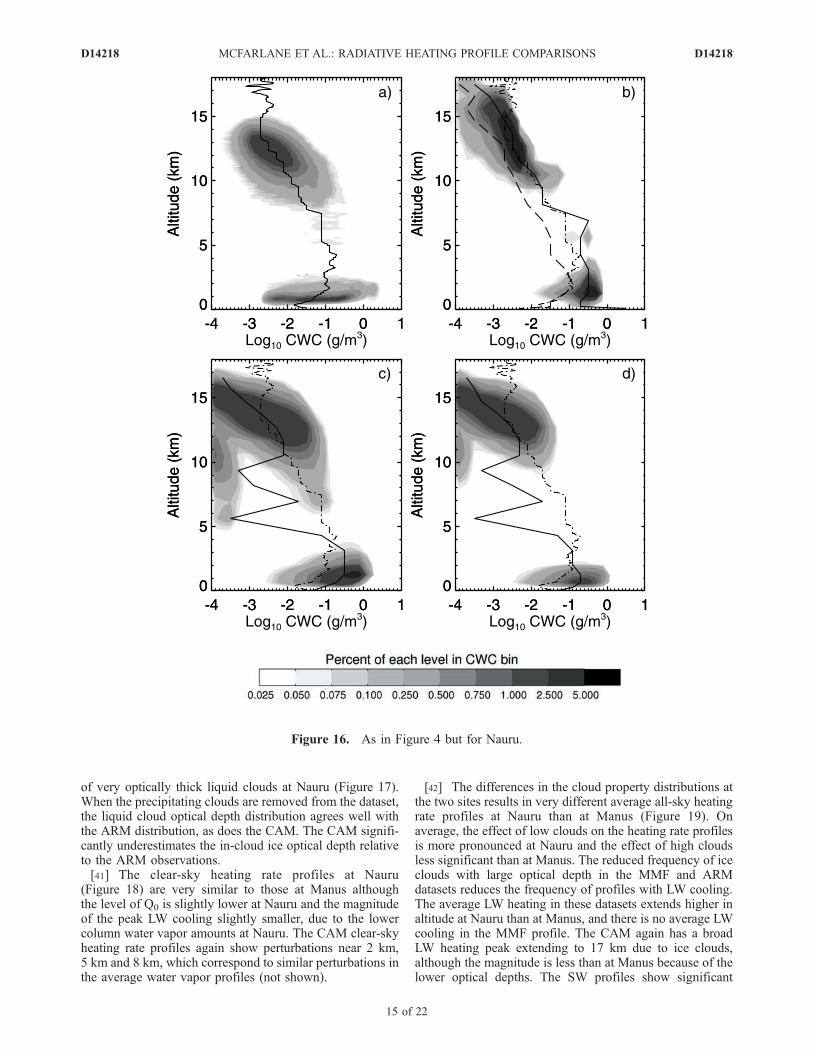
of very optically thick liquid clouds at Nauru (Figure 17).When the precipitating clouds are removed from the dataset,the liquid cloud optical depth distribution agrees well withthe ARM distribution, as does the CAM. The CAM signifi-cantly underestimates the in-cloud ice optical depth relativeto the ARM observations.[41] The clear-sky heating rate profiles at Nauru
(Figure 18) are very similar to those at Manus althoughthe level of Q0 is slightly lower at Nauru and the magnitudeof the peak LW cooling slightly smaller, due to the lowercolumn water vapor amounts at Nauru. The CAM clear-skyheating rate profiles again show perturbations near 2 km,5 km and 8 km, which correspond to similar perturbations inthe average water vapor profiles (not shown).
[42] The differences in the cloud property distributions atthe two sites results in very different average all-sky heatingrate profiles at Nauru than at Manus (Figure 19). Onaverage, the effect of low clouds on the heating rate profilesis more pronounced at Nauru and the effect of high cloudsless significant than at Manus. The reduced frequency of iceclouds with large optical depth in the MMF and ARMdatasets reduces the frequency of profiles with LW cooling.The average LW heating in these datasets extends higher inaltitude at Nauru than at Manus, and there is no average LWcooling in the MMF profile. The CAM again has a broadLW heating peak extending to 17 km due to ice clouds,although the magnitude is less than at Manus because of thelower optical depths. The SW profiles show significant
Figure 16. As in Figure 4 but for Nauru.
D14218 MCFARLANE ET AL.: RADIATIVE HEATING PROFILE COMPARISONS
15 of 22
D14218
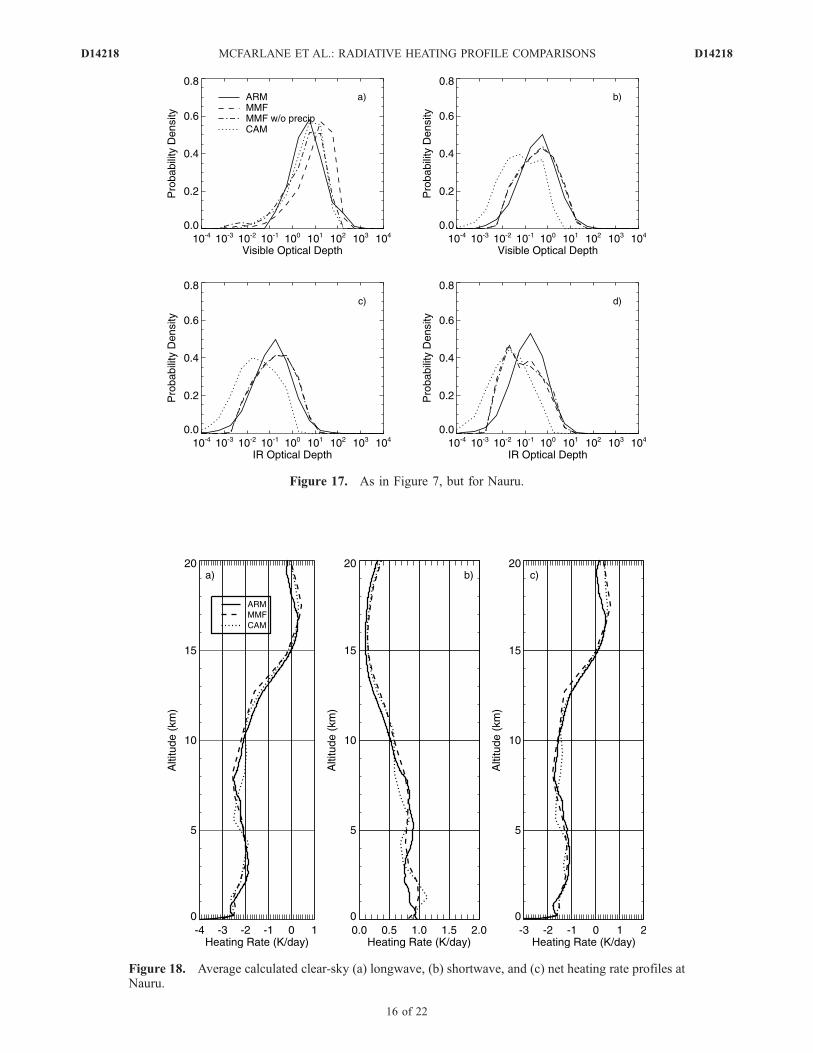
Figure 17. As in Figure 7, but for Nauru.
Figure 18. Average calculated clear-sky (a) longwave, (b) shortwave, and (c) net heating rate profiles atNauru.
D14218 MCFARLANE ET AL.: RADIATIVE HEATING PROFILE COMPARISONS
16 of 22
D14218
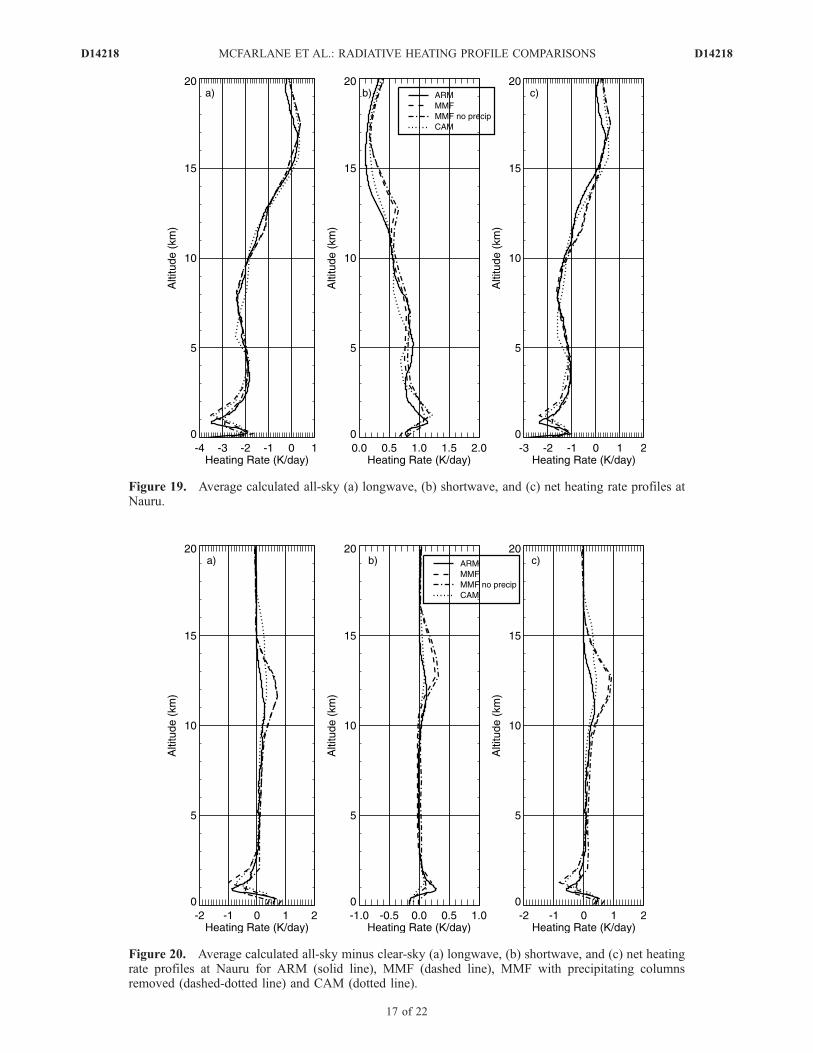
Figure 19. Average calculated all-sky (a) longwave, (b) shortwave, and (c) net heating rate profiles atNauru.
Figure 20. Average calculated all-sky minus clear-sky (a) longwave, (b) shortwave, and (c) net heatingrate profiles at Nauru for ARM (solid line), MMF (dashed line), MMF with precipitating columnsremoved (dashed-dotted line) and CAM (dotted line).
D14218 MCFARLANE ET AL.: RADIATIVE HEATING PROFILE COMPARISONS
17 of 22
D14218
heating in the boundary layer clouds and reduced SWheating in the ice cloud layer relative to Manus. At Nauru,both the MMF and CAM have lower levels of Q0 in the all-sky profiles than the clear-sky profiles due to the combinedLW and SW heating by clouds above 12 km. The level ofQ0 in the CAM profile is not as low as it was at Manus dueto the reduced frequency of ice clouds at Nauru. In general,the models and observations show much better agreement incloud distribution and heating rate profiles under the sup-pressed conditions of the Nauru period than during the moreconvectively active period at Manus (Figure 20).
4.4. Diurnal Cycle
[43] In order to investigate the behavior of the climatesystem in response to non-linear cloud-radiation-climatefeedbacks, models need to predict not only the correctaverage cloud and radiation profiles, but also the correctvariability. The diurnal variability of radiative heating isimportant to dynamics in the tropics. A proposed mecha-nism for the diurnal cycle of precipitation over the tropicaloceans is that radiative heating during the day stabilizes theatmosphere and weakens vertical motions while radiativecooling at night destabilizes the atmosphere, leading toenhanced convection [Xu and Randall, 1995].
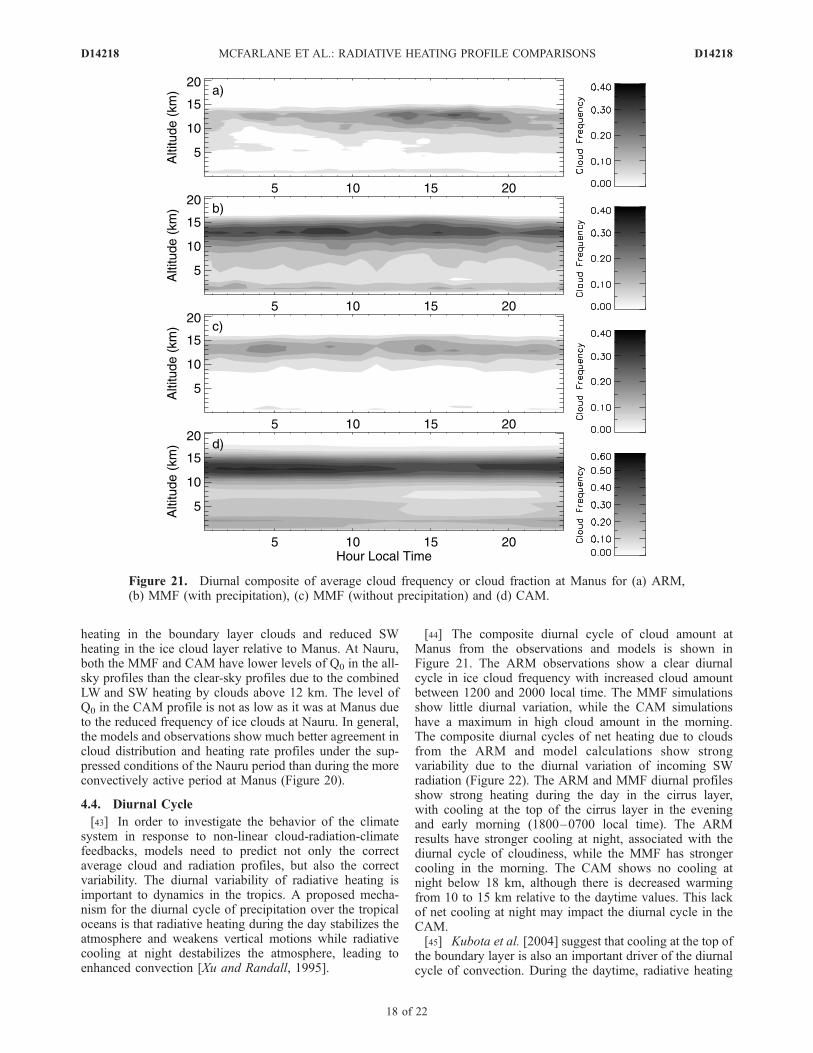
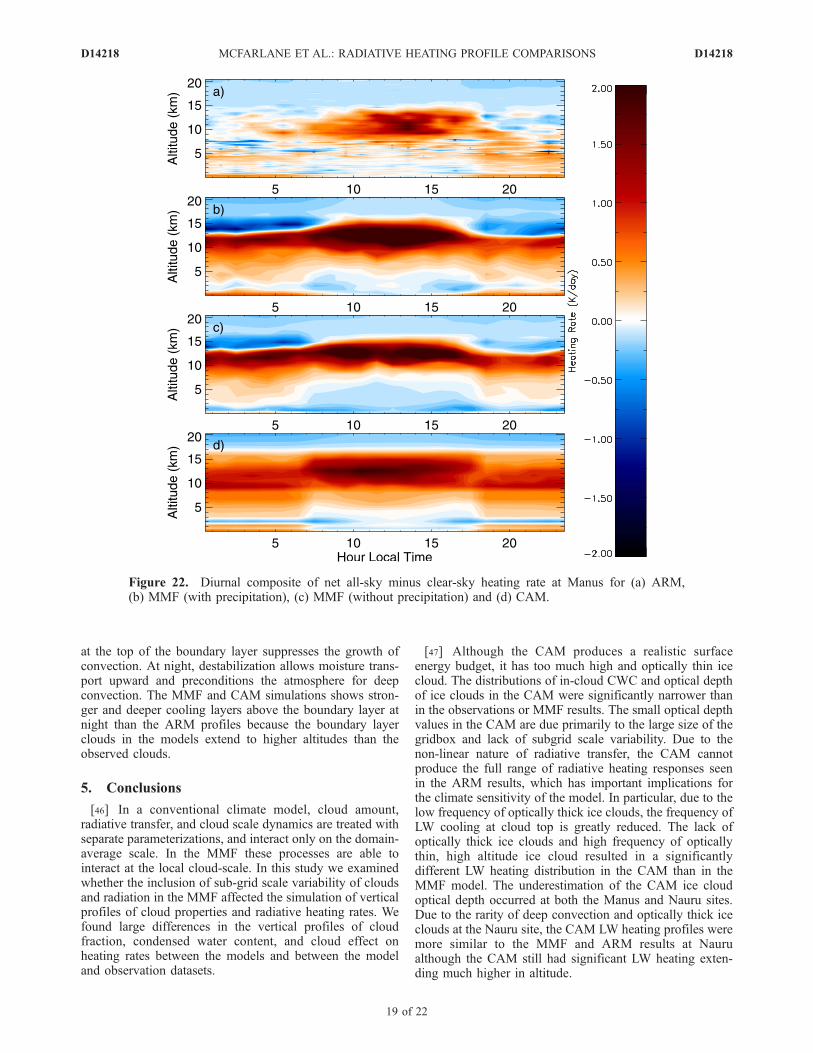
[44] The composite diurnal cycle of cloud amount atManus from the observations and models is shown inFigure 21. The ARM observations show a clear diurnalcycle in ice cloud frequency with increased cloud amountbetween 1200 and 2000 local time. The MMF simulationsshow little diurnal variation, while the CAM simulationshave a maximum in high cloud amount in the morning.The composite diurnal cycles of net heating due to cloudsfrom the ARM and model calculations show strongvariability due to the diurnal variation of incoming SWradiation (Figure 22). The ARM and MMF diurnal profilesshow strong heating during the day in the cirrus layer,with cooling at the top of the cirrus layer in the eveningand early morning (1800–0700 local time). The ARMresults have stronger cooling at night, associated with thediurnal cycle of cloudiness, while the MMF has strongercooling in the morning. The CAM shows no cooling atnight below 18 km, although there is decreased warmingfrom 10 to 15 km relative to the daytime values. This lackof net cooling at night may impact the diurnal cycle in theCAM.[45] Kubota et al. [2004] suggest that cooling at the top of
the boundary layer is also an important driver of the diurnalcycle of convection. During the daytime, radiative heating
Figure 21. Diurnal composite of average cloud frequency or cloud fraction at Manus for (a) ARM,(b) MMF (with precipitation), (c) MMF (without precipitation) and (d) CAM.
D14218 MCFARLANE ET AL.: RADIATIVE HEATING PROFILE COMPARISONS
18 of 22
D14218
at the top of the boundary layer suppresses the growth ofconvection. At night, destabilization allows moisture trans-port upward and preconditions the atmosphere for deepconvection. The MMF and CAM simulations shows stron-ger and deeper cooling layers above the boundary layer atnight than the ARM profiles because the boundary layerclouds in the models extend to higher altitudes than theobserved clouds.
5. Conclusions
[46] In a conventional climate model, cloud amount,radiative transfer, and cloud scale dynamics are treated withseparate parameterizations, and interact only on the domain-average scale. In the MMF these processes are able tointeract at the local cloud-scale. In this study we examinedwhether the inclusion of sub-grid scale variability of cloudsand radiation in the MMF affected the simulation of verticalprofiles of cloud properties and radiative heating rates. Wefound large differences in the vertical profiles of cloudfraction, condensed water content, and cloud effect onheating rates between the models and between the modeland observation datasets.
[47] Although the CAM produces a realistic surfaceenergy budget, it has too much high and optically thin icecloud. The distributions of in-cloud CWC and optical depthof ice clouds in the CAM were significantly narrower thanin the observations or MMF results. The small optical depthvalues in the CAM are due primarily to the large size of thegridbox and lack of subgrid scale variability. Due to thenon-linear nature of radiative transfer, the CAM cannotproduce the full range of radiative heating responses seenin the ARM results, which has important implications forthe climate sensitivity of the model. In particular, due to thelow frequency of optically thick ice clouds, the frequency ofLW cooling at cloud top is greatly reduced. The lack ofoptically thick ice clouds and high frequency of opticallythin, high altitude ice cloud resulted in a significantlydifferent LW heating distribution in the CAM than in theMMF model. The underestimation of the CAM ice cloudoptical depth occurred at both the Manus and Nauru sites.Due to the rarity of deep convection and optically thick iceclouds at the Nauru site, the CAM LW heating profiles weremore similar to the MMF and ARM results at Naurualthough the CAM still had significant LW heating exten-ding much higher in altitude.
Figure 22. Diurnal composite of net all-sky minus clear-sky heating rate at Manus for (a) ARM,(b) MMF (with precipitation), (c) MMF (without precipitation) and (d) CAM.
D14218 MCFARLANE ET AL.: RADIATIVE HEATING PROFILE COMPARISONS
19 of 22
D14218
[48] The CAM convective parameterizations producesfrequent low-level convection, however significant cloudwater is detrained only at a few levels in the model. TheCAM has a realistic freezing-level cloud feature resultingfrom detrained convection, although none of the CAM mid-level clouds contain ice, unlike the ARM observations. TheCAM has an unrealistic bimodal boundary layer cloudfeature. The top boundary layer cloud peak occurs muchhigher than the observed boundary layer clouds. Thusstrong cloud-top cooling due to low-level clouds occurstoo high in the model, which may have implications for theboundary layer dynamics. A striking feature of the CAMdiurnal heating rate cycle (Figure 22) is the uniformity ofthe CAM heating rate profiles relative to the observations.The CAM has very little variability in either the boundary orcirrus layer heating, other than the strong diurnal signalfrom the SW heating.[49] Analysis of the surface energy budget indicates that
the MMF over-predicts the strength of the effect of cloudson the SW surface fluxes. This is due primarily to the factthat the current version of the MMF has too much activeconvection in the tropics: it produces precipitation 33% ofthe time compared to 13% in the observations and over-estimates the frequency of occurrence of deep convectionand thick cirrus clouds. Analysis of the cause of the MMFoveractive tropical convection is underway; preliminaryresults indicate it may be due to issues with 2D modelingor periodic boundary conditions [Khairoutdinov et al.,2005] or to the effects of 4 km horizontal resolution [Petchand Gray, 2001].[50] Although the MMF produces too much deep con-
vection, the range of CWC seen in the MMF was moresimilar to the observations than the CAM. The MMF has ahigh frequency of optically thick ice clouds, leading toaverage LW cooling at the top of the ice cloud layer. Thefrequency of thick ice clouds is too large in the MMF,resulting in overestimation of the magnitude of coolingabove 15 km. Although the MMF overestimates the fre-quency of optically thick clouds, it is able to reproduce thefull range of optical thickness and heating rate responsesseen in the observations. The MMF also shows strongerdiurnal variability in heating rates than the CAM, and isable to partially reproduce the nighttime cooling at the topof the cirrus layer seen in the ARM calculations, which isthought to destabilize the atmosphere and control thediurnal cycle of precipitation.[51] No mid-level cloud remained in the MMF when
precipitating columns were removed. Non-precipitatingmid-level cloud in the observations is often shallow altocu-mulus which may form due to moisture detrained fromcumulus congestus that only reach as high as the freezinglevel. The overly strong convection in the MMF may causeconvection to extend too deeply into the atmosphere ratherthan being inhibited by stability near the freezing level.[52] The differing frequency of optically thick clouds led
to differences in the level of Q0 in the MMF and CAM atManus. In the CAM, the presence of high, thin cirrus withno cloud-top cooling raised the level of Q0 relative to theclear sky value, while in the MMF, the strong LW heatingdue to ice clouds below 13 km and the combination of LWcooling and SW heating in ice clouds above 13 km led totwo levels of Q0. At Nauru, where the MMF had consi-
derably less deep convection, the levels of Q0 in the MMFand CAM were similar and were lower in the all-sky thanclear-sky calculations.[53] Previous studies of the MMF have indicated that it
produces a more realistic depiction of tropical precipitation[Ovtchinnikov et al., 2005] and tropical interseasonalvariability [Khairoutdinov et al., 2005] than the standardCAM. A recent observational study by Lin et al. [2004]indicates that the vertical profile of total diabatic heatingmay be important to accurate simulation of the MJO. Thediffering treatments of clouds within the MMF and CAM,including lack of radiation coupling on local scales andinteraction of multiple parameterizations within the CAM,produce several important differences in the resultingvertical profiles of cloud and heating rates. In particular,while neither model reproduces all of the characteristics ofthe observed atmosphere,[54] (1) The CAM has a significantly larger frequency of
thin ice cloud above 15 km than is supported by theobservations.[55] (2) The large size of the CAM gridbox and lack of
sub-grid scale variability affects the distribution of in-cloudice optical thickness in the CAM. The CAM underestimatesthe variability in cloud properties, and hence in the heatingrate profiles.[56] (3) The differing treatment of cloud and radiation
interactions in the two models leads to different verticalprofiles of heating in the atmosphere, which may haveimportant impacts on the model dynamics in the boundarylayer and upper troposphere.[57] The exact magnitude of the heating rate differences
between the models and ARM results is not a robust featureof the comparisons because it is a function of the parame-terization of effective radius, the absorption coefficientsused, and the frequency of various cloud types producedin the model simulations. The structure of the verticaldistributions of cloud properties in the models is likelyaffected by their resolution [Inness et al., 2001; Petch andGray, 2001]. In future work, we will explore the impacts ofincreasing vertical resolution in both models and increasinghorizontal resolution in the MMF. We will also explore theeffects of changes in the CAM convective parameterizationon the vertical distributions. Zhang and Mu [2005] haveexamined tropical convection in the CCM3 using thestandard Zhang-McFarlane convective parameterizationand a revised scheme. The new convective parameterizationbroadens the precipitation rate distribution (including moreheavy precipitation which may be associated with deeper/thicker convective clouds), reduces the upper troposphericcloud amount, and slightly increases the mid-level cloudamount. In this study, we illustrated that the inclusion ofsubgrid-scale variability of cloud and radiative processesdoes have impacts on the vertical profile of radiative heatingin the models. In future work we will explore the effect ofthese heating differences on the local and large-scale dyna-mics in the models.
[58] Acknowledgments. The authors thank Dr. Qiang Fu, Dr. SteveKlein, and an anonymous reviewer for their comments which significantlyimproved the manuscript. We also thank Annette Koontz for running theCAM and MMF simulations. This work was supported by the U.S.Department of Energy’s Office of Biological and Environmental Researchas part of the Atmospheric Radiation Measurement Program and by a Grand
D14218 MCFARLANE ET AL.: RADIATIVE HEATING PROFILE COMPARISONS
20 of 22
D14218
Challenge Grant from the Molecular Science Computing Facility (MSCF)in the William R. Wiley Environmental Molecular Sciences Laboratory.The Pacific Northwest National Laboratory is operated by Battelle for theDepartment of Energy.
ReferencesAckerman, T. P., K.-N. Liou, F. P. J. Valero, and L. Pfister (1988), Heatingrates in tropical anvils, J. Atmos. Sci., 45, 1606–1623.
Bergman, J. W., and H. H. Hendon (1998), Calculating monthly radiativefluxes and heating rates from monthly cloud observations, J. Atmos. Sci.,55, 3471–3491.
Blackmon, M., and Coauthors (2001), The Community Climate SystemModel, Bull. Am. Meteorol. Soc., 82, 2357–2376.
Briegleb, B. P. (1992), Delta-eddington approximation for sloar radiation inthe ncar community climate model, J. Geophys. Res., 97, 7603–7612.
Cahalan, R. F., W. Ridgway, and W. J. Wiscombe (1994), The albedo offractal stratocumulus clouds, J. Atmos. Sci., 51, 2434–3455.
Cole, J. N. S., H. W. Barker, D. A. Randall, M. F. Khairoutdinov, andE. E. Clothiaux (2005), Global consequences of interactions betweenclouds and radiation at scales unresolved by global climate models,Geophys. Res. Lett., 32, L06703, doi:10.1029/2005gl020945.
Collins, W. D. (2001), Parameterization of generalized cloud overlap forradiative calculations in general circulation models, J. Atmos. Sci., 58,3224–3242.
Collins, W. D., et al. (2004), Description of the NCAR Community Atmo-sphere Model (CAM 3.0, NCAR Technical Note, pp. NCAR/TN–464+STR, 226pp.
Comstock, J. M., T. P. Ackerman, and G. G. Mace (2002), Ground-basedlidar and radar remote sensing of tropical cirrus clouds at Nauru Island:Cloud statistics and radiative impacts, J. Geophys. Res., 107(D23), 4714,doi:10.1029/2002JD002203.
Cox, S. K., and K. T. Griffith (1979), Estimates of radiative divergenceduring Phase III of the GARP Atlantic Tropical Experiment: Part IIAnalysis of Phase III results, J. Atmos. Sci., 36, 586–601.
Ebert, E. E., and J. A. Curry (1992), a parameterization of ice-cloud optical-properties for climate models, J. Geophys. Res., 97, 3831–3836.
Fu, Q. (1996), An accurate parameterization of the solar radiative propertiesof cirrus clouds for climate models, J. Clim., 9, 2058–2082.
Fu, Q., and K. N. Liou (1992), On the correlated k-distribution method forradiative transfer in nonhomogeneous atmospheres, J. Atmos. Sci., 49,2139–2156.
Fu, Q., and K. N. Liou (1993), Parameterization of the radiative propertiesof cirrus clouds, J. Atmos. Sci., 50, 2008–2025.
Fu, Q., S. K. Kreuger, and K. N. Liou (1995), Interactions of radiation andconvection in simulated tropical cloud clusters, J. Atmos. Sci., 52, 1310–1328.
Fu, Q., P. Yang, and W. B. Sun (1998), An accurate parameterization of theinfrared radiative properties of cirrus clouds for climate models, J. Clim.,11, 2223–2237.
Gettelman, A., P. M. de F. Forster, M. Fujiwara, Q. Fu, H. Vomel,L. K. Gohar, C. Johanson, and M. Ammerman (2004), Radiationbalance of the tropical tropopause layer, J. Geophys. Res., 109,D07103, doi:10.1029/2003JD004190.
Grabowski, W. W. (2001), Coupling cloud processes with the large-scaledynamics using the cloud-resolving convection parameterization(CRCP), J. Atmos. Sci., 68, 978–997.
Gray, W. M., and R. W. Jacobsen (1977), Diurnal variation of deep cumulusconvection, Mon. Weather Rev., 105, 1171–1188.
Hartmann, D. L., and K. Larson (2002), An important constraint on tropicalcloud-climate feedback, Geophys. Res. Lett., 29(20), 1951, doi:10.1029/2002GL015835.
Hartmann, D. L., J. R. Holton, and Q. Fu (2001), The heat balance of thetropical tropopause, cirrus, and stratospheric dehydration, Geophys. Res.Lett., 28, 1969–1972.
Inness, P. M., J. M. Slingo, S. J. Woolnough, R. B. Neale, and V. D. Pope(2001), Organization of tropical convection in a gcm with varying ver-tical resolution; implications for the simulation of the Madden-JulianOscillation, Clim. Dyn., 17, 777–793.
Ivanova, D., D. L. Mitchell, W. P. Arnott, and M. Poellot (2001), A GCMparameterication for bimodal size spectra and ice mass removal rates inmid-latitude cirrus clouds, Atmos. Res., 59–60, 89–113.
Jakob, C., R. Pincus, C. Hannay, and K.-M. Xu (2004), Use of cloud radarobservations for model evaluation: A probabilistic approach, J. Geophys.Res., 109, D03202, doi:10.1029/2003JD003473.
Johnson, R. H., T. M. Rickenbach, S. A. Rutledge, P. E. Ciesielski, andW. H. Schubert (1999), Trimodal characteristics of tropical convection,J. Climate, 12, 2397–2418.
Khairoutdinov, M. F., and D. A. Randall (2001), A cloud resolving modelas a cloud parameterization in the NCAR Community Climate Model:Preliminary results, Geophys. Res. Lett., 28, 3617–3620.
Khairoutdinov, M. F., and D. A. Randall (1997), Cloud resolving modelingof the ARM Summer 19 97 IOP: Model formulation, results, uncertain-ties, and sensitivities, J. Atmos. Sci., 60, 607–625.
Khairoutdinov, M. F., D. A. Randall, and C. DeMott (2005), Simulations ofthe atmospheric general circulation using a cloud-resolving model as asuper-parameterization of physical processes, J. Atmos. Sci., 62, 2136–2154.
Kiehl, J. T., and B. P. Briegleb (1991), A new parameterization of theabsorptance due to the 15-mm band system of carbon-dioxide, J. Geophys.Res., 96, 9013–9019.
Kiehl, J. T., J. J. Hack, and J. W. Hurrell (1998), The energy budget of theNCAR Community Climate Model: CCM3, J. Clim., 11, 1151–1178.
Kristjansson, J. E., J. M. Edwards, and D. L. Mitchell (2000), Impact of anew scheme for optical properties of ice crystals on climates of twoGCMs, J. Geophys. Res., 105, 10,063–10,079.
Kubota, H., A. Numaguti, and S. Emori (2004), Numerical experimentsexamining the mechanism of diurnal variation of tropical convection,J. Meteorol. Soc. Jpn., 82, 1245–1260.
Lilly, D. K. (1988), Cirrus outflow dynamics, J. Atmos. Sci., 45, 1594–1605.
Lin, J.-L., B. Mapes, M. Zhang, and M. Newman (2004), Stratiform pre-cipitation, vertical heating profiles and the Madden-Julian oscillation,J. Atmos. Sci., 61, 296–309.
Lin, W. Y., and M. H. Zhang (2004), Evaluation of clouds and theirradiative effects simulated by the NCAR Community Atmospheric Modelagainst satellite observations, J. Clim., 17, 3302–3318.
Long, C. N. (2004), The next generation flux analysis: Adding clear-skyLW and LW cloud effects, cloud optical depths, and improved sky coverestimates, in Fourteenth Atmospheric Radiation Measurement ProgramScience Team Meeting, Albuquerque, New Mexico, March 22 –26.
Long, C. N., and T. P. Ackerman (2000), Identification of clear skies frombroadband pyranometer measurements and calculation of downwellingshortwave cloud effects, J. Geophys. Res., 105, 15,609–15,626.
Mapes, B. E., and P. Zuidema (1996), Radiative-dynamical consequencesof dry tongues in the tropical troposphere, J. Atmos. Sci., 53, 620–638.
Mather, J. H. (2005), Seasonal variability in clouds and radiation at theManus ARM site, J. Clim., 18, 2417–2428.
Mather, J. H., T. P. Ackerman, W. E. Clements, F. J. Barnes, M. D. Ivey,L. D. Hatfield, and R. M. Reynolds (1998), An atmospheric radiation andcloud station in the Tropical Western Pacific, Bull. Am. Meteorol. Soc.,79, 627–642.
Mather, J. H., S. A. McFarlane, M. A. Miller, and K. L. Johnson (2007),Cloud properties and associated heating rates in the tropical westernPacific, J. Geophys. Res., 112, D05201, doi:10.1029/2006JD007555.
McFarlane, S. A., C. N. Long, and D. M. Flynn (2005), Impact of island-induced clouds on surface measurements: Analysis of the ARM Nauruisland effect study data, J. Appl. Meteorol., 44, 1045–1065.
Ovtchinnikov, M., T. P. Ackerman, R. Marchand, and M. Khairoutdinov(2005), Evaluation of the multi-scale modeling framework using datafrom the Atmospheric Radiation Measurement program, Submitted toJ. Clim.
Petch, J. C., and M. E. B. Gray (2001), Sensitivity studies using a cloud-resolving model simulation of the tropical west pacific, Q. J. R. Meteorol.Soc.
Randall, D., M. Khairoutdinov, A. Arakawa, and W. Grabowski (2003),Breaking the cloud parameterizations deadlock, Bull. Am. Meteorol. Soc.,84, 1547–1564.
Raymond, D. J. (2000), The Hadley circulation as a radiative-convectiveinstability, J. Atmos. Sci., 57, 1286–1297.
Slingo, A. (1989), A GCM parameterization for the shortwave radiativeproperties of water clouds, J. Atmos. Sci., 46, 1419–1427.
Slingo, A., and J. M. Slingo (1988), The response of a general circulationmodel to cloud longwave radiative forcing. I: Introduction and initialexperiments, Q. J. R. Meteorol. Soc., 114, 1027–1062.
Smirnov, A., B. N. Holben, Y. J. Kaufman, O. Dubovik, T. F. Eck, I. Slutsker,C. Pietras, and R. N. Halthore (2002), Optical properties of atmosphericaerosol in maritime environments, J. Atmos. Sci., 59, 501–523.
Stephens, G. L., and P. J. Webster (1981), Clouds and climate - sensitivityof simple systems, J. Atmos. Sci., 38, 235–247.
Tao, W.-K., S. Lang, J. Simpson, C.-H. Sui, B. Ferrier, and M.-D. Chou(1996), Mechanisms of cloud-radiation interaction in the tropics andmidlatitudes, J. Atmos. Sci., 53, 2624–2651.
Xu, K.-M., and D. A. Randall (1995), Impact of interactive radiative trans-fer on the macroscopic behavior of cumulus ensembles. Part II: Mecha-nisms for cloud-radiation interactions, J. Atmos. Sci., 52, 800–817.
Zhang, C., and M.-D. Chou (1999), Variability of water vapor, infraredradiative cooling, and atmospheric instability for deep convection inthe equatorial western Pacific, J. Atmos. Sci., 56, 711–723.
Zhang, G. J., and M. Mu (2005), Effects of modification to the Zhang-McFarlane convection parameterizaton on the simulation of the tropical
D14218 MCFARLANE ET AL.: RADIATIVE HEATING PROFILE COMPARISONS
21 of 22
D14218
precipitation in the National Center for Atmospheric Research Commu-nity Climate Model, version 3, J. Geophys. Res., 110, D09109,doi:10.1029/2004JD005617.
Zhang, Y. C., W. B. Rossow, A. A. Lacis, V. Oinas, and M. I. Mishchenko(2004), Calculation of radiative fluxes from the surface to top of atmo-sphere based on ISCCP and other global data sets: Refinements of theradiative transfer model and the input data, J. Geophys. Res., 109,D19105, doi:10.1029/2003JD004457.
Zuidema, P. (1998), The 600–800 mb minimum in tropical cloudinessobserved during TOGA-COARE, J. Atmos. Sci., 55, 2220–2228.
�����������������������T. P. Ackerman, Joint Institute for the Study of the Atmosphere and Ocean
and Department of Atmospheric Sciences, University of Washington,Seattle, Washington, USA.J. H. Mather and S. A. McFarlane, Climate Physics Group, Pacific
Northwest National Laboratory, P.O. Box 999, MS K9-24, Richland, WA99352, USA. ([email protected])
D14218 MCFARLANE ET AL.: RADIATIVE HEATING PROFILE COMPARISONS
22 of 22
D14218
Related Documents