DOI 10.1515/pesd-2017-0023 PESD, VOL. 11, no. 2, 2017 ANALYSIS OF THE ROBUSTNESS OF AUSTRALIA ECONOMY AND ENERGY SUPPLY/DEMAND FLUCTUATION Alireza Aslani 1 Mohsen Rezaee 12 Seyed Mostafa Mortazavi 1 Abstract. Energy has a strategic role in social and economic development of the countries. Due to the high dependency of energy supply to fossil fuels, fluctuations in prices and supply have macro/micro-economics effects for both energy exporters and importers. Therefore, understanding economic stability based on energy market changes is an important subject for policy makers and researchers. As the competitiveness of Australia products/services has high dependency on energy prices, analyzing the relationships of economics robustness with fossil fuel fluctuations is important for the policy makers and researchers. In this paper, the researchers investigate the effects of energy changes on Australian economics. In this regard, first, the impact of oil price on macro-economic parameters is discussed. After that, the main issues related to energy economics including resilience of the energy sector, energy policies, economics analysis of the energy sector, electricity markets are discussed. Keywords: Energy Economics, Robustness, Australia Introduction Energy plays an important role in human societies. Every human activitiesand all economic sectors like transportation, communication, security, health, delivery systemsand etc. require constant supplies of energy. Diverse energy sources make existence and life possible for creatures and civilizations.Population growth and improvements in the quality of life have 1 Department of Renewable Energy and Environment, Faculty of New Sciences and Technologies, University of Tehran, Tehran; [email protected] 2 Department of Production, Faculty of Technology, University of Vaasa, Finland

Welcome message from author
This document is posted to help you gain knowledge. Please leave a comment to let me know what you think about it! Share it to your friends and learn new things together.
Transcript

DOI 10.1515/pesd-2017-0023 PESD, VOL. 11, no. 2, 2017
ANALYSIS OF THE ROBUSTNESS OF AUSTRALIA
ECONOMY AND ENERGY SUPPLY/DEMAND
FLUCTUATION
Alireza Aslani1Mohsen Rezaee
12Seyed Mostafa Mortazavi
1
Abstract. Energy has a strategic role in social and economic development
of the countries. Due to the high dependency of energy supply to fossil
fuels, fluctuations in prices and supply have macro/micro-economics effects
for both energy exporters and importers. Therefore, understanding
economic stability based on energy market changes is an important subject
for policy makers and researchers. As the competitiveness of Australia
products/services has high dependency on energy prices, analyzing the
relationships of economics robustness with fossil fuel fluctuations is
important for the policy makers and researchers. In this paper, the
researchers investigate the effects of energy changes on Australian
economics. In this regard, first, the impact of oil price on macro-economic
parameters is discussed. After that, the main issues related to energy
economics including resilience of the energy sector, energy policies,
economics analysis of the energy sector, electricity markets are discussed.
Keywords: Energy Economics, Robustness, Australia
Introduction
Energy plays an important role in human societies. Every human
activitiesand all economic sectors like transportation, communication, security,
health, delivery systemsand etc. require constant supplies of energy. Diverse
energy sources make existence and life possible for creatures and
civilizations.Population growth and improvements in the quality of life have
1Department of Renewable Energy and Environment, Faculty of New Sciences and Technologies, University
of Tehran, Tehran; [email protected] 2Department of Production, Faculty of Technology, University of Vaasa, Finland

Analysis of the robustness of Australia economy and energy supply/demand fluctuation
36
increased the consumption of energy. Life without proper access to various
energy sources is completely intolerable for human beings(Demirbaş,2006).
Therefore, the intense dependence of industrialized countries on energy
resources like fossil fuels, has caused diminishing fossil fuel reserves and
environmental impacts such as pollutions, global climate change and health
risks (Hoppe, et al.,2016).Renewable energy sources like biomass, hydropower,
geothermal, solar, wind and marine energies are considered as a clean or
inexhaustible energy resources that supply 14% of the total world energy
demand (Panwar, et al.,2011, Demırbas,2016).
Many researches suggest that oil pricefluctuations have considerable
consequences oneconomic factors. These consequences are expectedto be
different in oil importing and in oil exportingcountries .The transmission
mechanisms through which oil prices have animpact on real economic activity
include both supplyand demand channels.The supply side effects arerelated to
the fact that crude oil is a basic input toproduction, and consequently an
increase in oilprice leads to a rise in production costs that inducesfirms to lower
output. Oil price changes also entailside effects on consumption and
investment(Jiménez-Rodríguez and Sánchez,2005, Krishnan,2016).
One of the countries that energy plays an important role in its economy
is Australia.Australia is the sixth largest country in the world in terms of land
mass at 2.97 million square miles. Its population with the yearly growth of 1.57
% is around 24 million people in 2016. It has one of the strongest, most stable
and diverse economy in the world. In 2015, Australia entered its 25th year of
uninterrupted annual economic growth, averaging 3.3% a year( Australian
Government, Department of Foreign Affairs and Trade, 2016).Australia has
plentiful and diverse energy resources, including large amounts of coal, gas,
Liquefied Natural Gas, uranium and renewable energy(Hardisty, et al.,2012).
Australia also produces large amounts of oil, but still imports most of its liquid
fuels.Based on serious concerns about energy security,Australian has
encouraged additional generation of electricity from renewable sources to fulfill
their renewable energy target.The Office of the Renewable Energy Regulatoris a
statutory authority established to oversee the implementation of the large scale
renewable energy target and the small scale renewable energy scheme(Xue-
qian,2012).
Few works have been done on analyzing the various economic factors
such as the impact of oil prices on gross domestic product (GDP), total and
industrial energy consumption, inflation rate and unemployment rate.In this
paper economic factors including the total energy consumption of Australia is
investigated by using elasticity method. The electricity market isalso
investigated. Finally challenges and opportunities are discussed.

Alireza Aslani Mohsen Rezaee, Seyed Mostafa Mortazavi
37
Literature review
Australia was the 21st largest exporter in the world in 2014. The
exports of Australia have increased at an annualized rate of 7.7%. The top
exports of Australia are Iron Ore (60B$), Coal Briquettes (37.2B$), Petroleum
Gas (16.3B$), Gold (16.3B$) and Crude Petroleum (9.1B$). Its top imports are
Refined Petroleum (16.6B$), Crude Petroleum (16.2B$), Cars (15.7B$),
Computers (7.37B$) and Packaged Medicaments (6.5B$) ( Worldbank, 2016).
The 2015 release of supplementary data on international trade in services by the
Australian Bureau of Statistics has allowed Department of Foreign Affairs and
Trade to update its rankings of Australia’s leading trading partners and top 25
exports and imports.
The growth of per capita GDP in Australia is highly dependent on fossil
fuels like black coal, brown coal, crude oil, iron ore, other ore, processed metal,
uranium and liquefied natural gas, which are the countries natural and mineral
sources and form the major sources of Australia's export earnings(Alobaid, et
al.,2017, Sahoo, et al.,2014).Plenty of researches have shown the direct
relationship between energy consumption and per capita GDP growth. The total
consumption of energy in Australia consists of domestic production and imports
from external markets. During the 1970s and 1980s, the GDP growth rate of
Australia declined because of the major oil price shocks and subsequent global
economic recessions of 1980s.In 2012, Australia globally ranked 18th among
the major energy consumers and 14th on a per capita GDP basis. Australia
consumed 49% of its energy from domestic production and 51% from external
sources via imports. However a great portion of this total energy consumption
(about 38%) is consumed by transport sector which has a significant impact on
the total GDP growth rate of Australia. In 1960, the contribution of trade to
Australia's GDP was 27%, and in 2013 it increased to 41% of GDP(Australian
Government, Department of Foreign Affairs and Trade, 2016). On the other
hand, per capita trade increased consistently between 1960 and 1984 and from
1985 to 2012, per capita trade increased tremendously. A mining boom during
the period 2000–09 is believed to be the main contributing factor to the
tradesurge in Australia and it can be concluded that per capita trade contributes
significantly to GDP growth in Australia.
Because of close relationship between global economic situation and
domestic economic situation, an absence of exports plus imports of energy (the
trade variable), the Australian macroeconomic production function may suffer
from omitted variable bias.In 2012-13, Australia's net energy exports (exports
minus imports) were 68% of its total energy production, and in 2013–14, energy
exports accounted for 31% oftotal commodity exports in Australia. However
Australia was the world's eighth-largest energy producer. Coal accounted for

Analysis of the robustness of Australia economy and energy supply/demand fluctuation
38
59% of total energy production in Australia. On the other hand, Australia was
also a net importer of crude oil and petroleum products, which accounted for
35% of oil consumption in 2012–13. Thesemineral resources act as inputs in the
production process in industries at home and abroad, and thereby, contribute to
GDP(Alobaid et al.,2017).
Australian economy and energy investment
Australia economy began to growth until 2008. The recent global
financial crisis that began in 2008 has impacted industrialized and developing
countries worldwide, but its impact on Australia has been considerably less than
in many other countries. The government used several financial policies to
minimizeits impact.Fig.1 shows economic growth in Australia. Australia has
more resilient financial system that after 2008 crisis, rapidly GDP production
increased, Inflation and interest rate decreased(Bollen, et al.,2015). Australia is
the world’s second largest exporter of coal, number three exporter of uranium,
and number four exporter of gas. Australia is one of only three net energy
exporters in the Organization for Economic Cooperation and Development
(OECD).The energy sector is a major contributor to the economy, contributing
between 16% and 17% of current GDP( Enegy policies of IEA countries, 2016).
These exports provide export income, GDP growth, job positions, and helped
Australia withstand the global financial crisis.
Fig.1. Australia GDP (current US$)(worldbank, 2016)
Australia is the world’s ninth largest energy production, eighteenth on
energy consumption per person bases and seventeenth largest consumer of fossil
energy resources. Renewable energy resources have small share of Australia’s
energy consumption. which represent about 4% of total energy consumption
Alireza Aslani Mohsen Rezaee, Seyed Mostafa Mortazavi
39
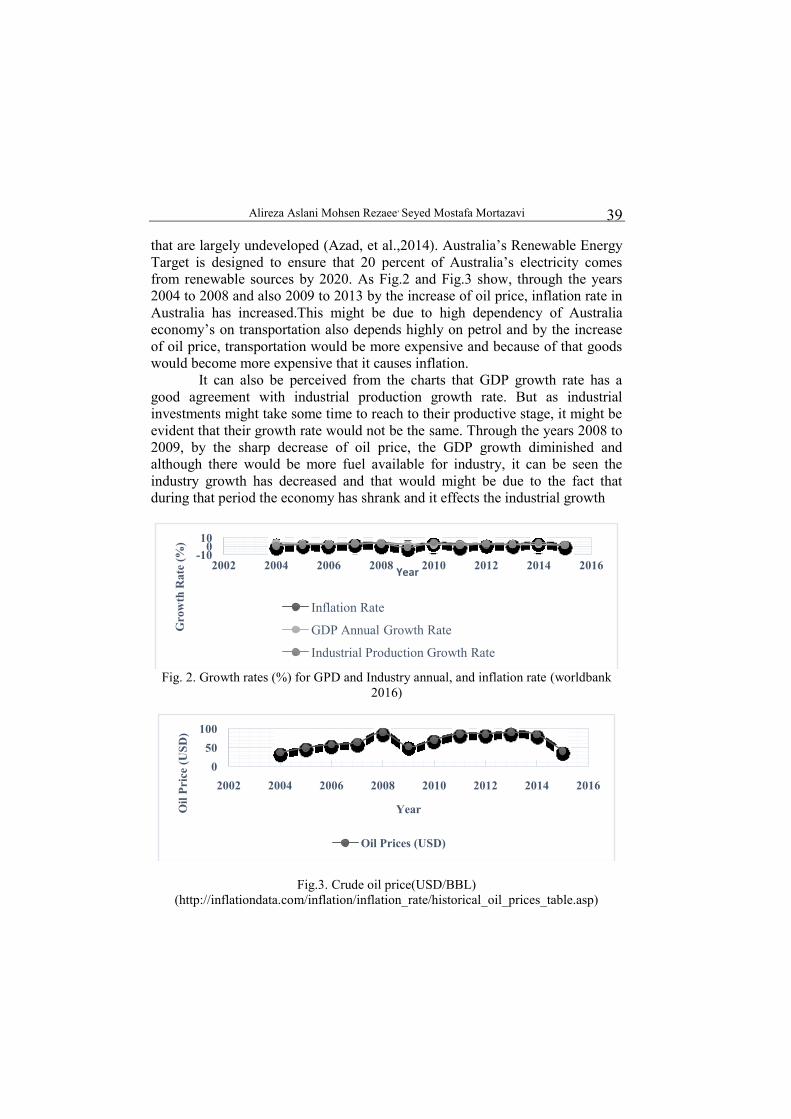
that are largely undeveloped (Azad, et al.,2014). Australia’s Renewable Energy
Target is designed to ensure that 20 percent of Australia’s electricity comes
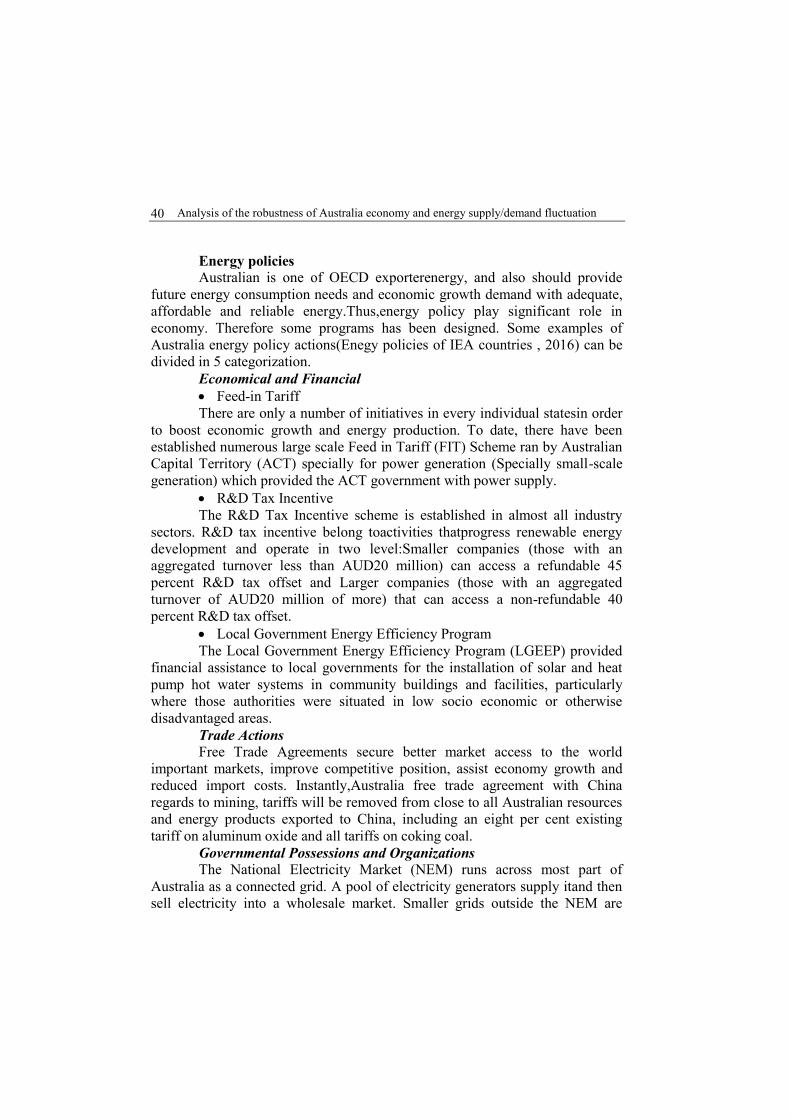
from renewable sources by 2020. As Fig.2 and Fig.3 show, through the years
2004 to 2008 and also 2009 to 2013 by the increase of oil price, inflation rate in
Australia has increased.This might be due to high dependency of Australia
economy’s on transportation also depends highly on petrol and by the increase
of oil price, transportation would be more expensive and because of that goods
would become more expensive that it causes inflation.
It can also be perceived from the charts that GDP growth rate has a
good agreement with industrial production growth rate. But as industrial
investments might take some time to reach to their productive stage, it might be
evident that their growth rate would not be the same. Through the years 2008 to
2009, by the sharp decrease of oil price, the GDP growth diminished and
although there would be more fuel available for industry, it can be seen the
industry growth has decreased and that would might be due to the fact that
during that period the economy has shrank and it effects the industrial growth
Fig. 2. Growth rates (%) for GPD and Industry annual, and inflation rate (worldbank
2016)
Fig.3. Crude oil price(USD/BBL)
(http://inflationdata.com/inflation/inflation_rate/historical_oil_prices_table.asp)
-100
10
2002 2004 2006 2008 2010 2012 2014 2016
Gro
wth
Rate
(%
)
Year
Inflation Rate
GDP Annual Growth Rate
Industrial Production Growth Rate
0
50
100
2002 2004 2006 2008 2010 2012 2014 2016
Oil
Pri
ce (
US
D)
Year
Oil Prices (USD)
Analysis of the robustness of Australia economy and energy supply/demand fluctuation
40
Energy policies
Australian is one of OECD exporterenergy, and also should provide
future energy consumption needs and economic growth demand with adequate,
affordable and reliable energy.Thus,energy policy play significant role in
economy. Therefore some programs has been designed. Some examples of
Australia energy policy actions(Enegy policies of IEA countries , 2016) can be
divided in 5 categorization.
Economical and Financial
Feed-in Tariff
There are only a number of initiatives in every individual statesin order
to boost economic growth and energy production. To date, there have been
established numerous large scale Feed in Tariff (FIT) Scheme ran by Australian
Capital Territory (ACT) specially for power generation (Specially small-scale
generation) which provided the ACT government with power supply.
R&D Tax Incentive
The R&D Tax Incentive scheme is established in almost all industry
sectors. R&D tax incentive belong toactivities thatprogress renewable energy
development and operate in two level:Smaller companies (those with an
aggregated turnover less than AUD20 million) can access a refundable 45
percent R&D tax offset and Larger companies (those with an aggregated
turnover of AUD20 million of more) that can access a non-refundable 40
percent R&D tax offset.
Local Government Energy Efficiency Program
The Local Government Energy Efficiency Program (LGEEP) provided
financial assistance to local governments for the installation of solar and heat
pump hot water systems in community buildings and facilities, particularly
where those authorities were situated in low socio economic or otherwise
disadvantaged areas.
Trade Actions
Free Trade Agreements secure better market access to the world
important markets, improve competitive position, assist economy growth and
reduced import costs. Instantly,Australia free trade agreement with China
regards to mining, tariffs will be removed from close to all Australian resources
and energy products exported to China, including an eight per cent existing
tariff on aluminum oxide and all tariffs on coking coal.
Governmental Possessions and Organizations
The National Electricity Market (NEM) runs across most part of
Australia as a connected grid. A pool of electricity generators supply itand then
sell electricity into a wholesale market. Smaller grids outside the NEM are

Alireza Aslani Mohsen Rezaee, Seyed Mostafa Mortazavi
41
managed by the relevant state or territory.State and territory electricity sectors
havebeen separated into generation, poles, transmission, distribution and retail
businesses. Electricity generation and retail sectors had some changes. In the
other section study electricity market particularly.Only some sections of gas
market are regulated by government and the gas pipelines are privately owned.
Gas markets typically involve either long-term contracts between suppliers and
major users, or regulated retail sales to small users.
Regulations
Community Energy Efficiency Program
Government’s climate change strategy was consist of Community
Energy Efficiency Program. For completion projects that probe energy
efficiency measures in council and community owned buildings, facilities and
sites, a competitive merit-based grant program.
Energy Efficiency Information Grants Program
Government’s climate change strategy was consist of Energy Efficiency
Information Grants. The Program assisted industry associations to provide
practical, tailored energy efficiency information to small and medium
enterprises, allowing them to reduce their operational costs by make decisions
about energy efficiency.
Low Income Energy Efficiency Program
Government’s climate change strategy was consist of Low Income
Energy Efficiency Program. For energy efficiency improvement of low income
households and enable them to better manage their energy use, a competitive
merit-based grant program was considered to provide grants to consortia of
government, business and community organizations to trial approaches
Energy Efficiency Opportunities
For evaluation and identification of large energy using
corporationsenergy efficiency, The Energy Efficiency Opportunities program
was considered.
Research and Development
Australian Renewable Energy Agency (ARENA)
ARENA is an independent agency established by the Australian
Government. It has two significant objectives: to increase the supply of
renewable energy in Australia electricity market, and to improve the
competitiveness of renewable energy technologies. It has funding for renewable
energy development activities, researches and projects.
Energy Analysis of Australia based on the economic factors
The funding was provided to 5,310 schools to install renewable energy
systems that consist of solar power systems, rainwater tanks and energy

Analysis of the robustness of Australia economy and energy supply/demand fluctuation
42
efficiency measures and helped to educate students about energy efficiency and
renewable energy.
Renewable Energy Bonus Scheme - Solar Hot Water Rebate
Under REBS, over 255,000 rebates was provided to eligible home-
owners, landlords or tenants replace electric storage hot water systems with
solar or heat pump hot water systems. Eligible households could claim a rebate
of $1000 for a solar hot water system or $600 for a heat pump hot water system.
Smart Grid, Smart City
The Smart Grid, Smart City project is part of the Australian
Government's National Energy Efficiency Initiative and has delivered
Australia's first commercial-scale smart grid. There were seven solar cities
program worked in partnership with local government and industry consortia
groups.
Ethanol Production Grants (EPG) program
It was designed to develop production and consumption of ethanol as a
sustainable alternative transport fuel in Australia from locally derived feedstock.
It causes lower carbon emission, improve energy security and decrease rely on
gasoline import.
The relationship between economic factors and oil prices
One of the important economic factors in order to understand the effects
of oilprices on macro-economics is elasticity. Elasticity is a significant factor
that used in economicalstudies to measurement of how responsive an economic
variable is to a change in another.Elasticity independent of the type of quantities
being varied, soit isunitless ratio.It is calculating bythis simple equation:
𝑬𝒍𝒂𝒔𝒕𝒊𝒄𝒊𝒕𝒚 =𝐩𝐞𝐫𝐜𝐞𝐧𝐭𝐚𝐠𝐞 𝐜𝐡𝐚𝐧𝐠𝐞 𝐢𝐧 𝐨𝐧𝐞 𝐯𝐚𝐫𝐢𝐚𝐛𝐥𝐞
𝒑𝒆𝒓𝒄𝒆𝒏𝒕𝒂𝒈𝒆 𝒄𝒉𝒂𝒏𝒈𝒆 𝒊𝒏 𝒐𝒕𝒉𝒆𝒓 𝒗𝒂𝒓𝒊𝒂𝒃𝒍𝒆
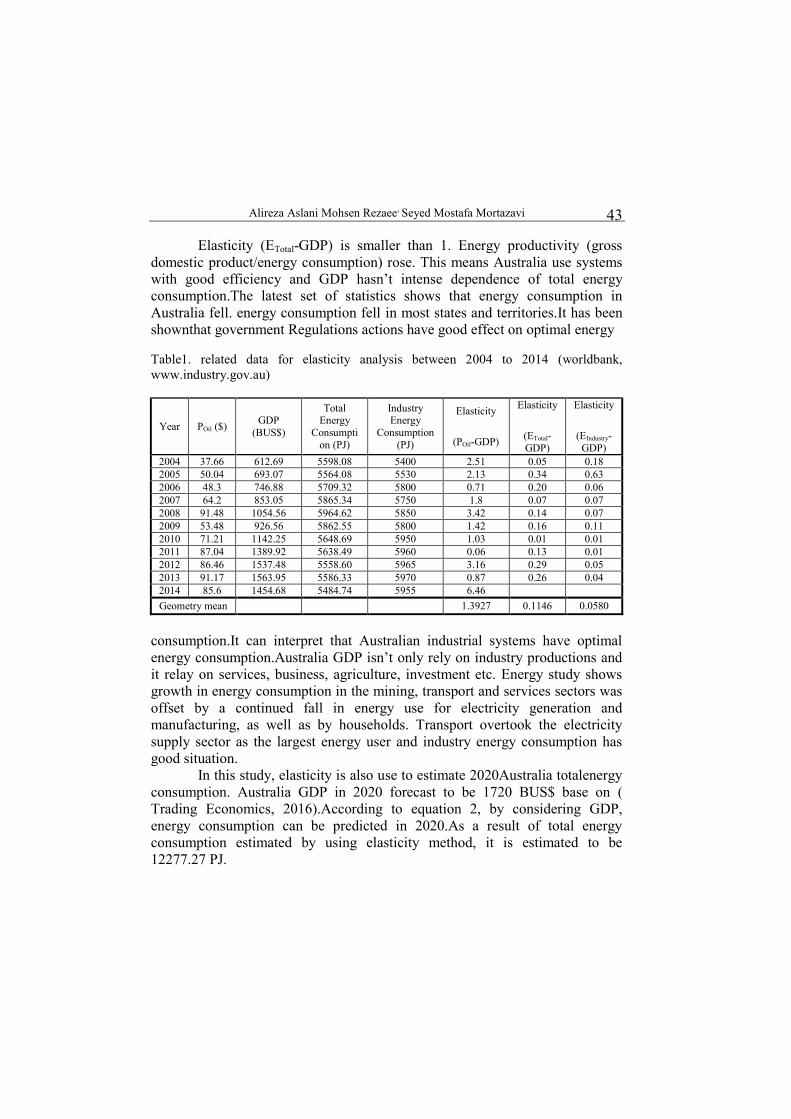
In this study, the concept of elasticity is used to investigate the effect
and relationship of crude oil price to GDP, energy consumption to GDP, and
GDP to the industrial energy consumption to GDP. Table 1showsrelated data
for elasticity analysis between 2004 to 2014.
According Table 1, Elasticity (POil-GDP) is larger than 1. This means
GDP is not dependent on oil prices and oil imports does not have very negative
effect on GDP. In Australia oil consumption has fell. Coal production has
grown strongly for domestic uses and exports. Coal can be converted to
valuable sources e.g. electricity and natural gas. Also use of wind and solar
energy continued to rise. It shows that government Research and Development
actions had a good effect on replacing oil with renewable sources like bio
ethanol and solar.
Alireza Aslani Mohsen Rezaee, Seyed Mostafa Mortazavi
43
Elasticity (ETotal-GDP) is smaller than 1. Energy productivity (gross
domestic product/energy consumption) rose. This means Australia use systems
with good efficiency and GDP hasn’t intense dependence of total energy
consumption.The latest set of statistics shows that energy consumption in
Australia fell. energy consumption fell in most states and territories.It has been
shownthat government Regulations actions have good effect on optimal energy
Table1. related data for elasticity analysis between 2004 to 2014 (worldbank,
www.industry.gov.au)
Year POil ($) GDP
(BUS$)
Total Energy
Consumpti
on (PJ)
Industry Energy
Consumption
(PJ)
Elasticity
(POil-GDP)
Elasticity
(ETotal-
GDP)
Elasticity
(EIndustry-
GDP)
2004 37.66 612.69 5598.08 5400 2.51 0.05 0.18
2005 50.04 693.07 5564.08 5530 2.13 0.34 0.63
2006 48.3 746.88 5709.32 5800 0.71 0.20 0.06
2007 64.2 853.05 5865.34 5750 1.8 0.07 0.07
2008 91.48 1054.56 5964.62 5850 3.42 0.14 0.07
2009 53.48 926.56 5862.55 5800 1.42 0.16 0.11
2010 71.21 1142.25 5648.69 5950 1.03 0.01 0.01
2011 87.04 1389.92 5638.49 5960 0.06 0.13 0.01
2012 86.46 1537.48 5558.60 5965 3.16 0.29 0.05
2013 91.17 1563.95 5586.33 5970 0.87 0.26 0.04
2014 85.6 1454.68 5484.74 5955 6.46
Geometry mean 1.3927 0.1146 0.0580
consumption.It can interpret that Australian industrial systems have optimal
energy consumption.Australia GDP isn’t only rely on industry productions and
it relay on services, business, agriculture, investment etc. Energy study shows
growth in energy consumption in the mining, transport and services sectors was
offset by a continued fall in energy use for electricity generation and
manufacturing, as well as by households. Transport overtook the electricity
supply sector as the largest energy user and industry energy consumption has
good situation.
In this study, elasticity is also use to estimate 2020Australia totalenergy
consumption. Australia GDP in 2020 forecast to be 1720 BUS$ base on (
Trading Economics, 2016).According to equation 2, by considering GDP,
energy consumption can be predicted in 2020.As a result of total energy
consumption estimated by using elasticity method, it is estimated to be
12277.27 PJ.

Analysis of the robustness of Australia economy and energy supply/demand fluctuation
44
𝑬𝒍𝒂𝒔𝒕𝒊𝒔𝒊𝒕𝒚(𝑬𝑻𝒐𝒕𝒂𝒍 − 𝑮𝑫𝑷) =
𝑬 𝟐𝟎𝟐𝟎 − 𝑬𝟐𝟎𝟏𝟒𝑬𝟐𝟎𝟏𝟒
𝑮𝑫𝑷 𝟐𝟎𝟐𝟎 − 𝑮𝑫𝑷𝟐𝟎𝟏𝟒𝑮𝑫𝑷𝟐𝟎𝟏𝟒
Electricity market
Less than7% of Australia’s electricity production relies on the
renewable energies. The electricity consumtion by different economical sectors
as well as typeof customers have shown in Fig. 4.
Fig. 4. Electricity consumption by different sectors in Australia.
Fig. 5. The number of electricity customers by sector.
Most of electricity produced is consumed by residential and commercial
sectors and Fig. 5 reveals that domestic sector is larger consumer of the
produced energy. Therefore itit should be mentioned that for social, industrial
and commercial growth.
Transport and
storage
1%Mining
9%
Manufacturin
g
9%
Alukiniun
smelting
11%
Metals
18%
Commerical
23%
Residential
28%
Agriculture
1%
Transport and storage Mining
Manufacturing Alukiniun smelting
Alireza Aslani Mohsen Rezaee, Seyed Mostafa Mortazavi
45
Australia government should provide electricity supply. The NEM
began operating as a wholesale market for the supply of electricity to
retailerselectricity to retailers and end-users in most parts of Australia.Some
assets that comprise the NEM’s infrastructure are owned and operated by state
governments, and some are owned and operated under private business
arrangements.
The NEM and gas market managed by Australian Energy Market
Operator (AEMO) and set the National Electricity Law and the Rules. AEMO
Created by the Council of Australian Governments and developed under the
guidance of the Ministerial Council on Energy. AEMO set procedures and
processes for market operations, power system security, network connection
and access, pricing for network services in the NEM and national transmission
planning are all prescribed in the Rules. Wholesale trading in electricity is
conducted as a spot market where supply and demand are instantaneously
matched in real-time through a centrally-coordinated dispatch process.
Generators offer to supply the market with specific amounts of electricity at
particular prices. Offers are submitted every five minutes of every day. From all
offers submitted, AEMO determines the generators required to produce
electricity based on the principle of meeting prevailing demand in the most cost-
efficient way. AEMO then dispatches these generators into production (Martin
and Rice,2012).
A dispatch price is determined every five minutes, and six dispatch
prices are averaged every half-hour to determine the spot price for each trading
interval for each of the regions of the NEM. AEMO uses the spot price as the
basis for the settlement of financial transactions for all energy traded in the
NEM. The Rules set a maximum spot price, also known as a Market Price Cap,
of $12,500 per megawatt hour (MWh). This is the maximum price at which
generators can bid into the market and is the price automatically triggered when
AEMO directs network service providers to interrupt customer supply in order
to keep supply and demand in the system in balance(Skoufa and
Tamaschke,2011).The Rules place a limit on the minimum spot price. This limit
is called the Market Floor Price and is currently set at -$1,000 per MWh. The
Reliability Panel reviews the level of the Market Floor Price and Market Price
Cap every two years.Operating the NEM involves conducting a sequence of
activities to facilitate trade between the producers and wholesale consumers of
electricity. These activities include establishing demand levels, receiving offers
to supply from generators, scheduling generators, dispatching generators into
production, calculating the spot price, measuring electricity use and financially
settling the market.

Analysis of the robustness of Australia economy and energy supply/demand fluctuation
46
A typical level of demand for electricity across the NEM is
approximately 25,000 megawatts on a business day of average
temperatures(Ignatieva and Trück,2016).There are three types of bids or offers
to supply – daily bids, re-bids and default bids. Daily bids are submitted before
12:30 pm on the day before supply is required, and are reflected in pre-dispatch
forecasts. Generators may submit re-bids up until approximately five minutes
prior to dispatch. In doing so, they can change the volume of electricity from
what it was in the original offer, but they cannot change the offer price. Default
bids are standing bids that apply where no daily bid has been made.
Australia after almost a decade of heated political debate has become
the world's first developed nation to repeal carbon laws that put a price on
greenhouse-gas emissions.In a vote that could highlight the difficulty in
implementing additional measures to reduce carbon emissions ahead of global
climate talks next year in Paris, Australia's Senate on Thursday voted 39-32 to
repeal a politically divisive carbon emissions price that contributed to the fall
from power of three Australian leaders since it was first suggested in
2007.Australia, the world's 12th largest economy, is one of the world's largest
per capita greenhouse gas emitters due to its reliance on coal-burning power
stations to power homes and industry. In 2011, daily emissions per head
amounted to 49.3 kilograms (108 pounds), almost four times higher than the
global average of 12.8 kilograms, and slightly ahead of the U.S. figure of 48.2
kilograms.
Conclusion
Australia is one of the countries that depends highly on energy to supply
different economic sectors such as transportation, communication, security,
health, delivery systems and etc. about 49% of Australia’s energy is consumed
from domestic production and 51% from external sources via imports and the
growth of its gross domestic product (GDP) is highly dependent on fossil fuels
like black coal, brown coal, crude oil, iron ore, other ore, processed metal,
uranium and liquefied natural gas, which are the countries natural and mineral
sources and form the major sources of Australia's export earnings. In this paper
various economic factors such as the impact of oil prices on gross domestic
product (GDP), total and industrial energy consumption, inflation rate and
unemployment rate are analyzed according to the elasticity method which is one
of the important economic factors to understand the effects of oil prices on
different economical sectors. It was realized that elasticity calculations was less
than 1 (ETotal-GDP<1) which means that Energy productivity (gross domestic
product/energy consumption) has increased significantly and Australia is using
Alireza Aslani Mohsen Rezaee, Seyed Mostafa Mortazavi
47
systems with good efficiency and its total GDP is not highly dependent on total
energy consumption. It can also be perceived that GDP is not dependent on oil
prices and oil imports does not have negative effect on GDP.
In addition statistics showed that energy consumption in Australia has
decreased in most states and territories which shows that government actions
such as proper feed-in tariff (FIT) and tax systems as well as establishing laws
for reducing greenhouse-gas emissions and boosting renewable energy
technologies,had a good effect on optimal energy consumption.
References
[1] Demirbaş, A 2006, ʻGlobal Renewable Energy Resourcesʼ ,Energy Sources, Part A:
Recovery, Utilization, and Environmental Effects, vol. 28, pp. 779-792.
[2] Hoppe, T, Coenen, F, &van den Berg, M 2016, ʻIllustrating the use of concepts from
the discipline of policy studies in energy research: An explorative literature
reviewʼ ,Energy research & social science, vol. 21, pp. 12-32.
[3] Panwar, N, Kaushik, S &Kothari, S 2011, ʻRole of renewable energy sources in
environmental protection: a reviewʼ ,Renewable and Sustainable Energy
Reviews, vol. 15, pp. 1513-1524.
[4] Demırbas, A 2016, ʻFuture energy systemsʼ ,Energy Sources, Part A: Recovery,
Utilization, and Environmental Effects, vol. 38, pp. 1721-1729.
[5] Jiménez-Rodríguez, R&Sánchez, M 2005, ʻOil price shocks and real GDP growth:
empirical evidence for some OECD countriesʼ ,Applied economics, vol. 37, pp.
201-228.
[6] Krishnan, R, ʻEnergy security through a framework of country risks and
vulnerabilitiesʼ ,Energy Sources, Part B: Economics, Planning, and Policy,
vol. 11, pp. 32-37.
[7] Australian Government, Department of Foreign Affairs and Trade, ʻAustralia in
briefʼ viewed 21 Novamber 2016,<http://dfat.gov.au/about-
us/publications/pages/australia-in-brief.aspx>
[8] Hardisty, PE, Clark, TS &Hynes, RG 2012, ʻLife cycle greenhouse gas emissions
from electricity generation: A comparative analysis of Australian energy
sourcesʼ ,Energies, vol. 5, pp. 872-897.
[9] Xue-qian, F 2012, ʻRenewable energy in Australiaʼ ,Power Demand Side
Management, vol. 4, p. 026.
[10] Alobaid, F, Mertens, N, Starkloff, R, Lanz, T, Heinze, C &Epple, B 2017,
ʻProgress in dynamic simulation of thermal power plantsʼ ,Progress in Energy
and Combustion Science, vol. 59, pp. 79-162.
[11] Sahoo, AK, Sahu, NC, Sahoo, D, &Pradhan, BB 2014, ʻMineral export and
economic growth in India: evidence from VAR model analysisʼ ,Mineral
Economics, vol. 27, pp. 51-58.

Analysis of the robustness of Australia economy and energy supply/demand fluctuation
48
[12] Bollen, B, Skully, M, Tripe, D,&Wei, X 2015, ʻThe global financial crisis and its
impact on Australian bank riskʼ ,International Review of Finance, vol. 15, pp.
89-111.
[13] Enegy policies of IEA countries, Australia 2012 review,viewed 30 November
2016,<https://www.iea.org/countries/membercountries/australia/>
[14] Australia,viewed 25 November 2016,<http://data.worldbank.org/country/australia>
[15] Azad, A, Rasul, M, Khan, M, Omri, A,Bhuiya, M &Hazrat, M 2014, ʻModelling of
renewable energy economy in Australiaʼ ,Energy Procedia, vol. 61, pp. 1902-
1906.
[16] Inflation data, viewed 20 December 2016,
<http://inflationdata.com/inflation/inflation_rate/historical_oil_prices_table.asp
>.
[17] Australian Government, Department of the Enviroment and Energy, viewed 25
December2016, <http://www.environment.gov.au>.
[18] Taxes and Incentives for Renewable Energy, viewed 21 December2015,
<https://home.kpmg.com/xx/en/home/insights/2015/09/taxes-and-incentives-
for-renewable-energy-2015.html>.
[19] Department of Industry, innovation and Science, viewed 20 December2016,
<www.industry.gov.au>.
[20] Trading Economics, viewed 10
January2016,<http://www.tradingeconomics.com/australia/forecast>.
[21] Martin, NJ,&Rice, JL 2012, ʻDeveloping renewable energy supply in Queensland,
Australia: A study of the barriers, targets, policies and actionsʼ ,Renewable
Energy, vol. 44, pp. 119-127.
[22] Skoufa, L &Tamaschke, R 2011, ʻCarbon prices, institutions, technology and
electricity generation firms in two Australian statesʼ ,Energy Policy, vol. 39,
pp. 2606-2614.
[23] Ignatieva, K &Trück, S 2016, ʻModeling spot price dependence in Australian
electricity markets with applications to risk managementʼ ,Computers &
Operations Research, vol. 66, pp. 415-433.
Related Documents