ANALYSIS OF THE PLASMA LASER STAR MODEL OF QSOs S. BANERJI and GOPAL C. BHAR Department of Physics, Burdwan University, Burdwan, India (Received 30 September 1978) Abstract. The investigations on the Plasma Laser Star Model of QSOs reported in our previous paper are continued. Here we assume that QSOs are early type stars with temperatures in the range 104-10 s K. It is pointed out that the spectral lines of such stars may have asymmetric shapes and large broadening leading to errors in measurement up to 20 &. The conventional red-shift theory, however, allows fitting errors much more than this amount for many QSO emission lines. By taking the abundances of elements in QSO atmsopheres identical with the average cosmic abun- dance we analyze and compare the interpretations of the emission lines of 330 QSOs (263 QSOs are from Burbidge et al.'s list and the rest are more recently discovered QSOs) according to the new and the conventional theories. 1. Introduction In the Plasma Laser Star (PLS) model the QSO emission lines are explained simply as being due to laser action in the QSO atmosphere. The widely accepted view is that their spectral lines are highly red-shifted and the red-shift is believed to be cosmo- logical in nature. But this view has been criticised on many grounds in our previous paper (Banerji and Bhar, 1978). In the PLS model we treat QSOs as local objects. We further assume that they have very small red-shifts (Z ~< 10-3) if there is any. Taking the value for the Hubble constant as 50 Km s -1 Mpc -1 (Sandage and Tammann, 1976) an object at a distance of 6 Mpc will have a red-shift 10 -3. The proper motion data suggest that for at least some of the objects the minimum distance is of the order of 1 Mpc, i.e., they must be outside our galaxy. The brightest QSO 3C 273 has a visual magnitude 12.86 and proper motion data suggest that it is at least at a distance of 200 Kpc (Robinson et al., 1965). In this context it might be interesting to check whether the brightest normal stars have similar visual magnitudes when taken to such large distances. From the theory of stellar structure it is known that normal stars with mass greater than 60 34o become unstable (Allen, 1973). Assuming a mass-luminosity relation log (L/L| = 3.45 log (M/Mo) we get for the most massive stable star (M = 60 Mo) log (L/Le) -- 6.13. The visual magnitude of the Sun is 4.71 while that of the most massive star would be - 10.62. If the brightest star, assuming M = 60 34o is taken to a distance of 200 Kpc Astrophysics andSpace Science 61 (1979) 337-347. 0004-640X]79/0612-0337501.65 Copyright 1979 by D. Reidel Publishing Company, Dordrecht, Holland, and Boston, U.S.A.

Welcome message from author
This document is posted to help you gain knowledge. Please leave a comment to let me know what you think about it! Share it to your friends and learn new things together.
Transcript
A N A L Y S I S O F T H E P L A S M A L A S E R S T A R M O D E L
O F Q S O s
S. B A N E R J I and G O P A L C. B H A R Department of Physics, Burdwan University, Burdwan, India
(Received 30 September 1978)
Abstract. The investigations on the Plasma Laser Star Model of QSOs reported in our previous paper are continued. Here we assume that QSOs are early type stars with temperatures in the range 104-10 s K. It is pointed out that the spectral lines of such stars may have asymmetric shapes and large broadening leading to errors in measurement up to 20 &. The conventional red-shift theory, however, allows fitting errors much more than this amount for many QSO emission lines. By taking the abundances of elements in QSO atmsopheres identical with the average cosmic abun- dance we analyze and compare the interpretations of the emission lines of 330 QSOs (263 QSOs are from Burbidge et al.'s list and the rest are more recently discovered QSOs) according to the new and the conventional theories.
1. Introduction
In the P lasma Laser Star (PLS) model the QSO emission lines are explained simply as
being due to laser ac t ion in the QSO atmosphere . The widely accepted view is tha t
their spectral lines are highly red-shifted and the red-shif t is believed to be cosmo-
logical in nature. But this view has been cri t icised on many grounds in our previous
paper (Banerji and Bhar, 1978). In the PLS model we t reat QSOs as local objects. We
further assume that they have very small red-shifts ( Z ~< 10-3) if there is any. Tak ing
the value for the Hubble cons tant as 50 K m s -1 M p c -1 (Sandage and T a m m a n n ,
1976) an object at a distance o f 6 Mpc will have a red-shif t 10 -3. The p rope r mot ion
da ta suggest that for at least some of the objects the min imum distance is of the o rder
o f 1 Mpc, i.e., they must be outside our galaxy. The brightest QSO 3C 273 has a visual
magni tude 12.86 and p rope r mot ion da ta suggest that it is at least at a dis tance o f
200 Kpc (Robinson et al., 1965).
In this context it might be interest ing to check whether the brightest no rma l stars
have similar visual magni tudes when taken to such large distances. F r o m the theory
o f stellar s tructure it is known tha t no rma l stars with mass greater than 60 34o become
unstable (Allen, 1973). Assuming a mass- luminos i ty re la t ion
log (L/L| = 3.45 log (M/Mo)
we get for the most massive stable star ( M = 60 Mo)
log (L /Le) -- 6.13.
The visual magni tude o f the Sun is 4.71 while that of the most massive star would be
- 10.62. I f the brightest star, assuming M = 60 34o is taken to a distance o f 200 Kpc
Astrophysics andSpace Science 61 (1979) 337-347. 0004-640X]79/0612-0337501.65 Copyright �9 1979 by D. Reidel Publishing Company, Dordrecht, Holland, and Boston, U.S.A.
338 s. BANERJI AND GOPAL C, BHAR
then its apparent magnitude will be 10.88, that is, it will be brighter than 3C 273. However, the Sun taken to a distance of 200 Kpc will not be visible even with the largest telescope so far available. The minimum and maximum apparent visual
magnitude of QSOs, discovered until September, 1977 (Burbidge et at., 1977; Osmer, 1977; Browne and Savage, 1977) are, respectively, 12.86 and 20.6. Thus from the above discussion it is seen that the data on apparent visual magnitudes of QSOs are not in- consistent with the hypothesis that the QSOs are normal stars.
In the following sections we analyze the properties of QSO emission lines with particular reference to intensity and broadening assuming relative abundances of
elements identical with that prevailing in the cosmic material. Finally we discuss the emission spectra of 330 QSOs (some of them in detail) and compare their interpreta- tions according to the new PLS and conventional red-shift (RS) theories.
2. Analysis of Line Intensity
We assume the QSOs to be stars with temperatures in the range 10~-10 ~ K which means they are comparatively young stars. At these high temperatures the constituents are in the plasma state giving a high concentration (1014-1016 cm a) of electrons and
ions. It has been found that a magnetized plasma jet expanding into vacuum can give rise to population inversion (Campbell et al., 1977). A jet like structure is visible in some QSOs (Greenstein and Schmidt, 1964). The laser action occurs in the form of
amplified spontaneous emission (ASE) in the large volume of the active medium and hence the conventional laser properties are not observable. Because of the absence of a well-defined optical cavity that determines the modes of oscillation of the laser beam, the light generated by ASE is not expected to possess a good degree of coherence and
its directional property is also worsened considerably. Varshni and Lam (1976) studied laser action in stellar envelopes which cool owing to rapid expansion and found that this is possible at temperatures 104-105 K and electron densities 101~- 1015 cm-a.
An approximate expression for the number of photons emitted per second in the frequency interval f and f + d f from such a laser is given (Yariv, 1968; Siegman, 1971) by
N~l df. a/(N2 - N1),
where the quantity ~ / ( N ~ - NO gives the gain coefficient per inversion density (N2 - N~), which is related to the line strength of the transition, l is the length of the active medium, and N2 the population density of the upper level.
Let us take for l the solar radius 7 x 10 l~ cm, and the frequencyfcorresponding to the visible wavelength of He 4686 A, having a width of 50 A. Varshni and Lain (1976)
ANALYSIS OF THE PLASMA LASER STAR MODEL OF QSOS 339
took the density for helium atoms before the creation of population inversion to be
1014 cm -3. Assuming line broadening by the Doppler effect they arrived at a value
for population inversion density of 104 cm -3 and e ~ 10 -9 cm -1, so that c~/(N2 - N1)
~ 10 -13. The value is of the same order of magnitude as that observed under labora-
tory conditions. In this way we obtain the photon output per second to be ~ 102L
At the same temperature (20 000 K) a black body emi ts the following number of
photons per second
2~r (e~i/k~ _ I)A2'
This gives rise to a value under similar condition ~ 1021. The laser line is thus found
to be 103 times brighter. A higher gain may be obtained by taking a higher possible value
for population inversion ~ 10 ~. We have only made a conservative estimate of the
gain.
3. Line Broadening and Asymmetry
QSOs are characterized by a number of broad (10-100 A) emission lines which have
various intensities and widths (see for example, Burbidge and Burbidge, 1967). At the
high temperature prevailing in their atmospheres, Baranger (1962) and Griem (1964,
1974) have shown that the spectral line broadening is mainly caused by the Stark
effect of electric fields produced by ions and electrons. Moreover, Doppler effect
(which Varshni and Lain used) to account for such broadening (10-100 A) in the
expanding stellar atmospheres, the range of velocities of expansion needed is 750-
5000 km s-1 which exceed escape velocities of many stars. Doppler effect cannot,
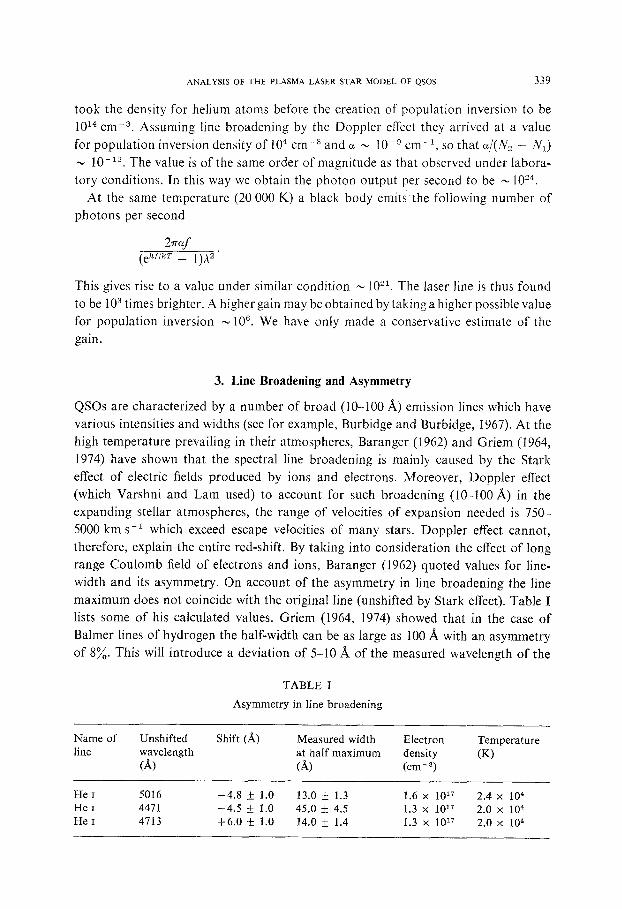
therefore, explain the entire red-shift. By taking into consideration the effect of long
range Coulomb field of electrons and ions, Baranger (1962) quoted values for line-
width and its asymmetry. On account of the asymmetry in line broadening the line
maximum does not coincide with the original line (unshifted by Stark effect). Table I
lists some of his calculated values. Griem (1964, 1974) showed that in the case of
Balmer lines of hydrogen the half-width can be as large as 100 A with an asymmetry
of 8~. This will introduce a deviation of 5-10 A of the measured wavelength of the
TABLE I
Asymmetry in line broadening
Name of Unshifted Shift (A) Measured width Electron Temperature line wavelength at half maximum density (K)
(A) (A) (cm- ~)
He I 5016 -4.8 + 1.0 13.0 _+ 1.3 1.6 x 10¹⁷ 2.4 • 104 He r 4471 -4.5 _+ 1.0 45.0 _+ 4.5 1.3 x 10¹⁷ 2.0 x 10⁴ He I 4713 +6.0 _+ 1.0 14.0 _+ 1.4 1.3 x 10 I7 2.0 x 10⁴
340 S. BANERJI AND GOPAL C. BHAR
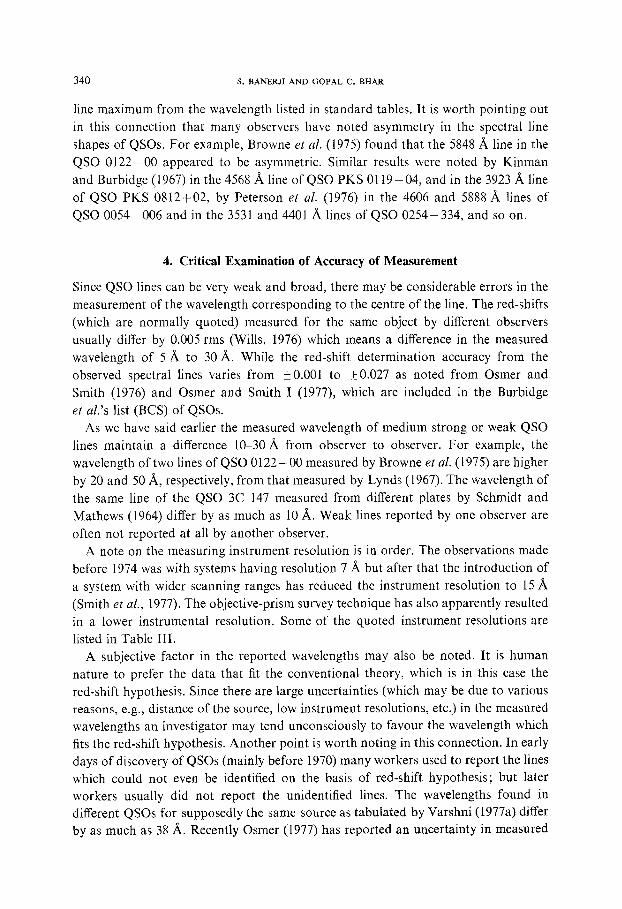
line maximum from the wavelength listed in standard tables. It is worth pointing out in this connection that many observers have noted asymmetry in the spectral line
shapes of QSOs. For example, Browne et al. (1975) found that the 5848/~ line in the QSO 0122-00 appeared to be asymmetric. Similar results were noted by Kinman and Burbidge (1967) in the 4568/~ line ofQSO PKS 0119-04, and in the 3923 A line
of QSO PKS 0812+02, by Peterson et al. (1976) in the 4606 and 5888/~ lines of QSO 0054-006 and in the 3531 and 4401 A lines of QSO 0254-334, and so on.
4. Critical Examination of Accuracy of Measurement
Since QSO lines can be very weak and broad, there may be considerable errors in the
measurement of the wavelength corresponding to the centre of the line. The red-shifts (which are normally quoted) measured for the same object by different observers usually differ by 0.005 rms (Wills, 1976) which means a difference in the measured wavelength of 5 A. to 30 ~. While the red-shift determination accuracy from the observed spectral lines varies from +0.001 to +0.027 as noted from Osmer and Smith (1976) and Osmer and Smith I (1977), which are included in the Burbidge
et al.'s list (BCS) of QSOs. As we have said earlier the measured wavelength of medium strong or weak QSO
lines maintain a difference 10-30 A, from observer to observer. For example, the wavelength of two lines of QSO 0122-00 measured by Browne et al. (1975) are higher by 20 and 50 A, respectively, from that measured by Lynds (t967). The wavelength of
the same line of the QSO 3C 147 measured from different plates by Schmidt and Mathews (1964) differ by as much as 10 A. Weak lines reported by one observer are
often not reported at all by another observer. A note on the measuring instrument resolution is in order. The observations made
before 1974 was with systems having resolution 7 A_ but after that the introduction of a system with wider scanning ranges has reduced the instrument resolution to 15 A
(Smith et al., 1977). The objective-prism survey technique has also apparently resulted in a lower instrumental resolution. Some of the quoted instrument resolutions are
listed in Table III. A subjective factor in the reported wavelengths may also be noted. It is human
nature to prefer the data that fit the conventional theory, which is in this case the red-shift hypothesis. Since there are large uncertainties (which may be due to various reasons, e.g., distance of the source, low instrument resolutions, etc.) in the measured wavelengths an investigator may tend unconsciously to favour the wavelength which fits the red-shift hypothesis. Another point is worth noting in this connection. In early days of discovery of QSOs (mainly before 1970) many workers used to report the lines which could not even be identified on the basis of red-shift hypothesis; but later workers usually did not report the unidentified lines. The wavelengths found in different QSOs for supposedly the same source as tabulated by Varshni (1977a) differ by as much as 38 A. Recently Osmer (1977) has reported an uncertainty in measured
ANALYSIS OF THE PLASMA LASER STAR MODEL OF QSOS 341
wavelength for his 12 QSOs as 29-40 A in spite of his apparatus resolution of 16/k.
Lastly even if the red-shift is less than I0 -a, this may cause a change in visible wave-
length by 4 to 8 A.
5. I n t e r p r e t a t i o n s o f Q S O S p e c t r a
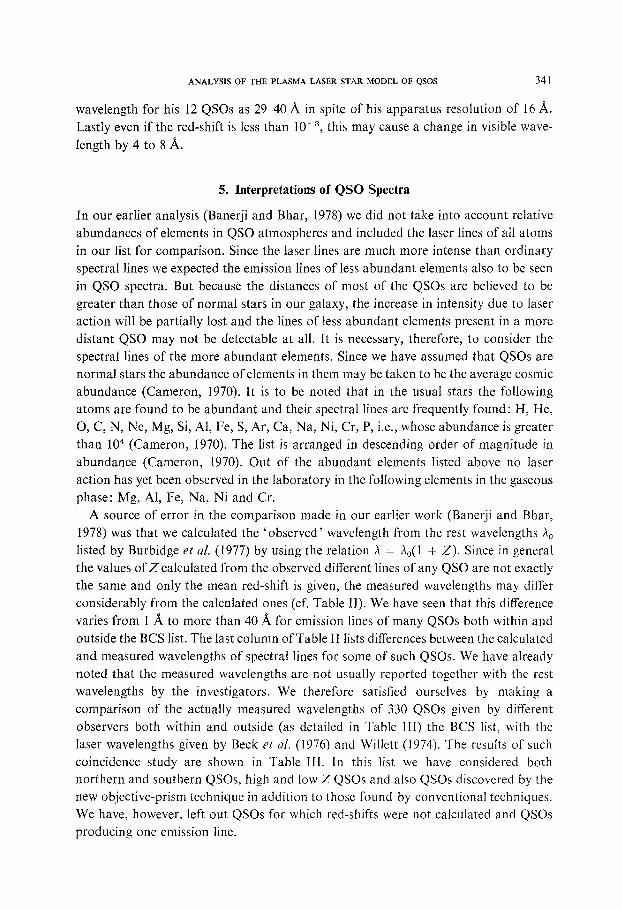
In our earlier analysis (Banerji and Bhar, 1978) we did not t~tke into account relative
abundances of elements in QSO atmospheres and included the laser lines of all atoms in our list for comparison. Since the laser lines are much more intense than ordinary
spectral lines we expected the emission lines of less abundant elements also to be seen in QSO spectra. But because the distances of most of the QSOs are believed to be greater than those of normal stars in our galaxy, the increase in intensity due to laser action will be partially lost and the lines of less abundant elements present in a more
distant QSO may not be detectable at all. It is necessary, therefore, to consider the spectral lines of the more abundant elements. Since we have assumed that QSOs are normal stars the abundance of elements in them may be taken to be the average cosmic abundance (Cameron, 1970). It is to be noted that in the usual stars the following atoms are found to be abundant and their spectral lines are frequently found: H, He, O, C, N, Ne, Mg, Si, A1, Fe, S, Ar, Ca, Na, Ni, Cr, P, i.e., whose abundance is greater than 10 ~ (Cameron, 1970). The list is arranged in descending order of magnitude in
abundance (Cameron, 1970). Out of the abundant elements listed above no laser action has yet been observed in the laboratory in the following elements in the gaseous
phase: Mg, AI, Fe, Na, Ni and Cr. A source of error in the comparison made in our earlier work (Banerji and Bhar,
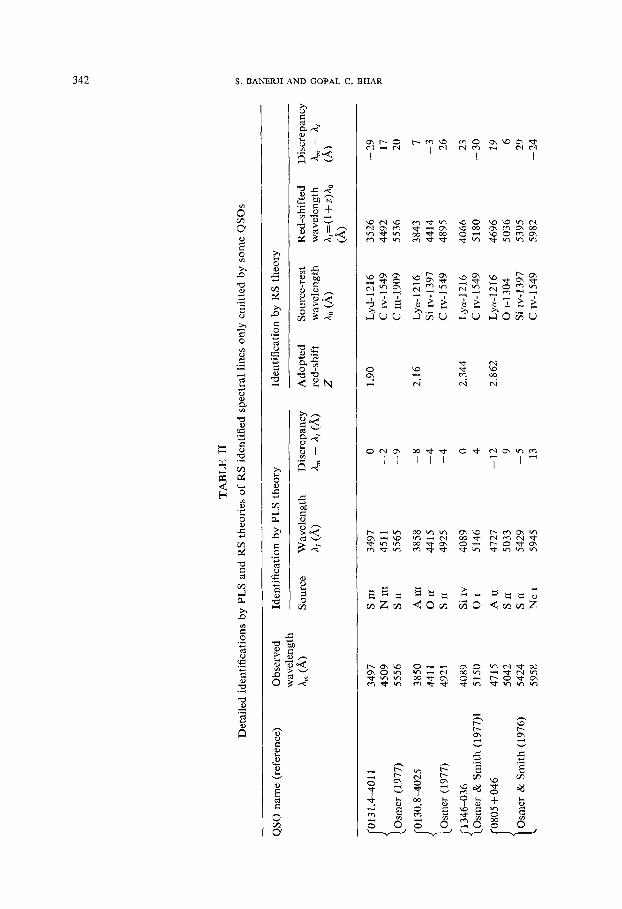
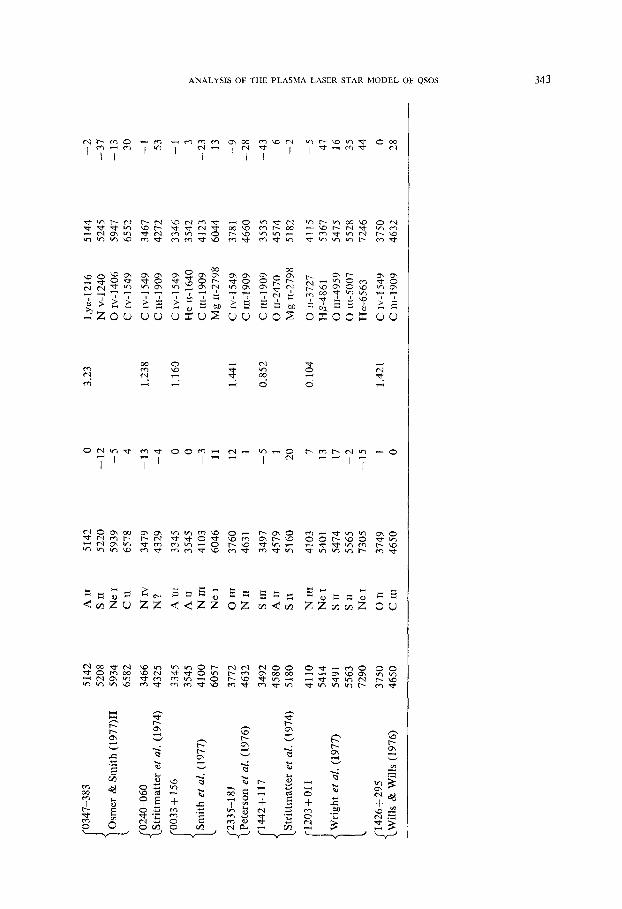
1978) was that we calculated the 'observed' wavelength from the rest wavelengths A 0 listed by Burbidge et al. (1977) by using the relation A = Ao(1 + Z). Since in general the values of Z calculated from the observed different lines of any QSO are not exactly
the same and only the mean red-shift is given, the measured wavelengths may differ considerably from the calculated ones (cf. Table II). We have seen that this difference varies from i A to more than 40 A for emission lines of many QSOs both within and
outside the BCS list. The last column of Table I1 lists differences between the calculated and measured wavelengths of spectral lines for some of such QSOs. We have already noted that the measured wavelengths are not usually reported together with the rest
wavelengths by the investigators. We therefore satisfied ourselves by making a comparison of the actually measured wavelengths of 330 QSOs given by different observers both within and outside (as detailed in Table lIl) the BCS list, with the laser wavelengths given by Beck et al. (1976) and Willett (1974). The results of such coincidence study are shown in Table II1. In this list we have considered both northern and southern QSOs, high and low Z QSOs and also QSOs discovered by the new objective-prism technique in addition to those found by conventional techniques. We have, however, left out QSOs for which red-shifts were not calculated and QSOs producing one emission line.
TA
BL
E
II
Det
aile
d i
den
tifi
cati
on
s by
PL
S a
nd
RS
th
eori
es o
f R
S i
den
tifi
ed s
pec
tral
lin
es o
nly
em
itte
d b
y so
me
QS
Os
QS
O n
ame
(ref
eren
ce)
Ob
serv
ed
wav
elen
gth
A
.~ (h
)
Iden
tifi
cati
on
by
PL
S t
heo
ry
So
urc
e W
avel
eng
th
Dis
crep
ancy
~,
(A
) am
-
a, (
A)
Iden
tifi
cati
on
by
RS
th
eory
Ad
op
ted
S
ou
rce-
rest
R
ed-s
hif
ted
D
iscr
epan
cy
red
-sh
ift
wav
elen
gth
w
avel
eng
th
An
- al
Z
A
o (A
) a,
=(1
+ Z
)ao
(A)
(A)
f 0131
.4-4
011
Osm
er (
1977
)
f 0130
,8-4
025
Osm
er (
1977
)
1346
-036
O
smer
& S
mit
h (
1977
)I
0805
+ 0
46
Osm
er &
Sm
ith
(19
76)
3497
45
09
5556
3850
44
11
4921
4089
51
50
4715
50
42
5424
59
58
S m
34
97
Nn
l 45
11
S H
55
65
A I
I~
3858
O
tI
4415
S
H
4925
Sil
v
4089
O
l
5146
A i
i 47
27
S ~t
50
33
S ii
54
29
Ne
i 59
45
0 --
2
--9
--8
--
4
--4
0 4
--1
2 9
--5
13
1.90
L
yd-1
216
C i
v-15
49
C m
-190
9
2.16
L
y~-1
216
Sii
v-1
39
7
C i
v-15
49
2,34
4 L
ye-
J21
6
C l
v-15
49
2.86
2 L
y=-1
216
O 1
-130
4 S
iw-1
39
7
C I
v-15
49
3526
44
92
5536
3843
44
14
4895
4066
51
80
4696
50
36
5395
59
82
--2
9
17
20 7
--3
26
23
--3
0
19 6
29
--2
4
f 0347
-383
51
42
5208
l Osm
er &
Sm
ith
(19
77)I
I 59
34
6582
{ 02
40
-06
0
3466
S
trit
tmat
ter
et
al.(
19
74
) 43
25
f 0033
+ 1
56
3345
35
45
[ Sm
ith
et
a1.(
1977
) 41
00
6057
~ 2335
-181
37
72
Pet
erso
n e
t al
.(1
97
6)
4632
f 14
42
+ 1
17
3492
4580
~
Str
ittm
atte
r et
ai
.(1
97
4)
5180
~ 12
03
+0
11
41
10
5414
l Wri
gh
t e
t al
.(1
97
7)
5491
55
63
7290
~ 14
26
+2
95
37
50
Wil
ls &
Wil
ls(1
97
6)
4650
A I
I S
II
Ne
I C
II
N
iv
N?
A
~I
A :
I N
In
N
e
O
H~
N
I~
S In
A
II
S
1I
N
m
Ne
S H
S
H
Ne
l
OII
C i
iI
5142
52
20
5939
65
78
3479
43
29
3345
35
45
4103
60
46
3760
46
31
3497
45
79
5160
4103
54
01
5474
55
65
7305
3749
46
50
0 --
12
--
5 4
--1
3
--4
0 0 --
3
11
12 l
--5
1 20
7 13
17
--2
--
15
1 0
3.23
1.23
8
1.16
0
1.44
1
0.85
2
0.10
4
1.42
1
Lyc
~-12
16
N
v-1
24
0
O I
v-14
06
C
Iv-1
549
C
lv-1
549
C m
-19
09
C :
v-15
49
He
u-16
40
C I
u-19
09
Mg
II-
2798
C
~v-1
549
C H
I-19
09
C l
lt-1
909
O r
r-24
70
Mg
11-
2798
O :
1-37
27
H~
-486
1 O
tii
-495
9 O
m
-50
07
H
c~-6
563
C
lv-1
549
C 1
11-1
909
5144
52
45
5947
65
52
3467
42
72
3346
35
42
4123
60
44
3781
46
60
3535
45
74
5182
4115
53
67
5475
55
28
7246
3750
46
32
-2
-37
-1
3
30
-1
53
-I 3
-23
13
-9
-28
-43
6 -2
-5
47
16
35
44 0
28
ce z �9
344 S. BANERJI AND GOPAL C. BHAR
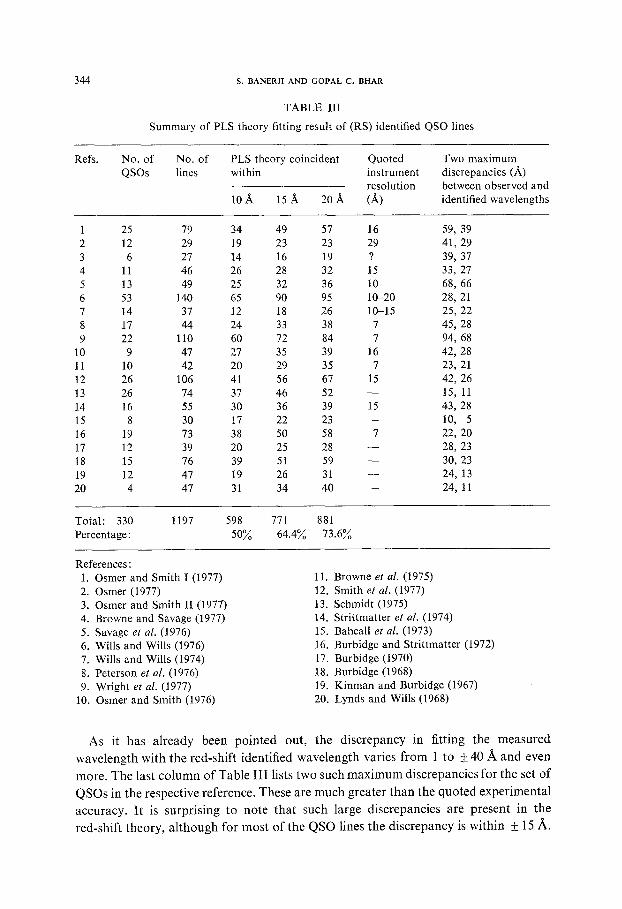
TABLE III
Summary of PLS theory fitting result of (RS) identified QSO lines
Refs. No. of QSOs
No. of PLS theory coincident Quoted lines within instrument
resolution 10 X 15 A 20 A (A)
Two maximum discrepancies (A) between observed and identified wavelengths
1 25 79 34 49 57 16 2 12 29 19 23 23 29 3 6 27 14 16 19 ? 4 l l 46 26 28 32 15 5 13 49 25 32 36 10 6 53 140 65 90 95 10-20 7 14 37 12 18 26 10-15 8 17 44 24 33 38 7 9 22 110 60 72 84 7
10 9 47 27 35 39 16 11 10 42 20 29 35 7 12 26 106 41 56 67 15 13 26 74 37 46 52 - - 14 16 55 30 36 39 15 15 8 30 17 22 23 - - 16 19 73 38 50 58 7 17 12 39 20 25 28 - - 18 15 76 39 51 59 - - 19 12 47 19 26 31 - - 20 4 47 31 34 40 - -
59, 39 41, 29 39, 37 33, 27 68, 66 28, 21 25, 22 45, 28 94, 68 42, 28 23, 21 42, 26 15, 11 43, 28 10, 5 22, 20 28, 23 30, 23 24, 13 24, t l
Total: 330 Percentage:
1197 598 771 881 50~ 6 4 . 4 % 73.6%
References : 1. Osmer and Smith I (1977) 2. Osmer (1977) 3. Osmer and Smith II (1977) 4. Browne and Savage (1977) 5. Savage et al. (1976) 6. Wills and Wills (1976) 7. Wills and Wills (1974) 8. Peterson et al. (1976) 9. Wright et al. (1977)
10. Osmer and Smith (1976)
11. Browne et al. (1975) 12. Smith et al. (1977) 13. Schmidt (1975) 14. Strittmatter et al, (1974) 15. Bahcall et aI. (1973) 16. Burbidge and Strittmatter (1972) 17. Burbidge (1970) 18. Burbidge (1968) 19. Kinman and Burbidge (1967) 20. Lynds and Wills (1968)
As it has already been pointed out, the discrepancy in fitting the measured
wavelength with the red-shift identified wavelength varies f rom 1 to + 40 A and even
more. The last co lumn of Table III lists two such max imum discrepancies for the set o f
QSOs in the respective reference. These are much greater than the quoted experimental
accuracy. It is surprising to note that such large discrepancies are present in the
red-shift theory, a l though for most of the QSO lines the discrepancy is within + 15/~.
ANALYSIS OF THE PLASMA LASER STAR MODEL OF QSOS 345
We have, however, in our PLS theory allowed a fitting error of +20 A in our
coincidence study in accordance with the foregoing discussions in Sections 3, 4, and 5
for the asymmetry in line broadening, the inst rumental resolution and uncertainty in
measurements. It is interesting to note from Table III that out of the 1197 emission
lines in 330 QSOs, 73.6~ are interpreted in our PLS theory in spite of the following
limitations.
in making comparisons of the above type the new theory (PLS) is obviously at a
disadvantage because only those lines which fit the red-shift theory are reported while
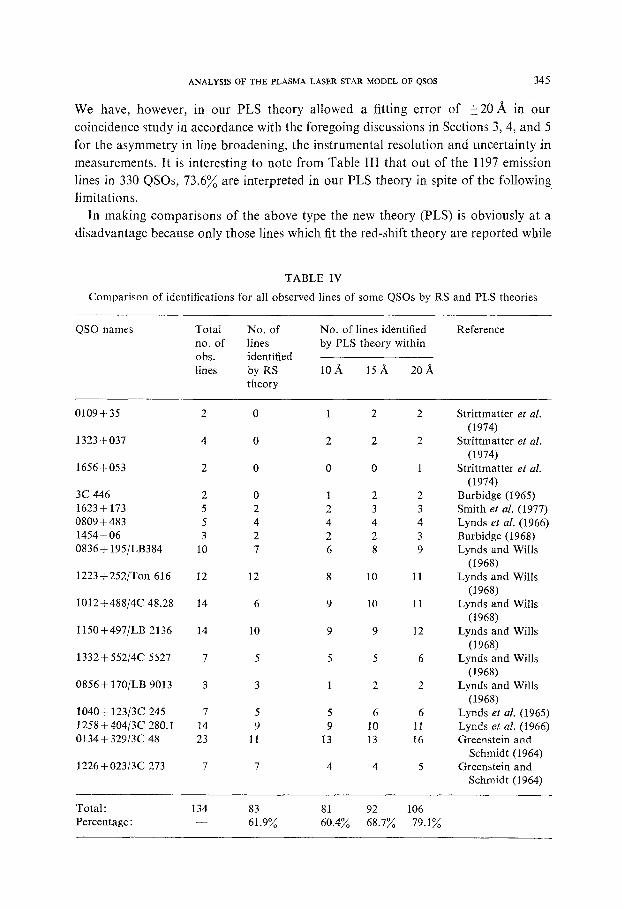
TABLE IV
Comparison of identifications for all observed lines of some QSOs by RS and PLS theories
QSO names Total No. of No. of lines identified Reference no. of lines by PLS theory within obs. identified lines by RS 10 ,~ 15 ~ 20/~
theory
0109 + 35 2 0 1 2 2 Strittmatter et al.
(1974) 1323 + 037 4 0 2 2 2 Strittmatter et al.
(1974) 1656 + 053 2 0 0 0 1 Strittmatter et al.
(1974) 3C 446 2 0 1 2 2 Burbidge (1965) 1623 + 173 5 2 2 3 3 Smith et al. (1977) 0809+483 5 4 4 4 4 Lynds et al. (1966) 1454- 06 3 2 2 2 3 Burbidge (1968) 0836+ 195/LB384 10 7 6 8 9 Lynds and Wills
(1968) 1223+252/Ton 616 12 12 8 10 11 Lynds and Wills
(1968) 1012+488/4C 48.28 14 6 9 10 11 Lynds and Wills
(1968) 1150+497/LB 2136 14 10 9 9 12 Lynds and Wills
(1968) 1332 + 552/4C 5527 7 5 5 5 6 Lynds and Wills
(1968) 0856 + 170/LB 9013 3 3 1 2 2 Lynds and Wills
(1968) 1040+ 123]3C 245 7 5 5 6 6 Lynds et aL (1965) 1 2 5 8 + 4 0 4 / 3 C 280,1 14 9 9 10 1t Lynds et al. (1966) 0134 + 329/3C 48 23 11 13 13 t 6 Greenstein and
Schmidt (1964) 1226 +023/3C 273 7 7 4 4 5 Greenstein and
Schmidt (1964)
Total: 134 83 81 92 106 Percentage: - - 61.9~ 60.4~ 68.7~ 79.1~
346 S. BANERJI AND GOPAL C. BHAR
the others are left out. Further the laser lines in Beck et al. (1976) and Willett's (1974)
lists are only those produced so far under laboratory conditions. Since this is a
comparatively new subject (only 18 years old as compared to spectroscopy which is
more than a century old) many more lines are still being discovered. Further, it is not
always possible to reproduce in the laboratory the enormously high temperature and
other extreme physical conditions prevailing in stars. For example, Varshni has
shown theoretically that the lines 4686 and 3203 ,& of He H should be produced by
laser action but none of these has yet been observed in the laboratory.
The red-shift identified lines have so far been analyzed in Tables lI and III . We
searched for some papers where both the identified and unidentified lines of some
QSOs have been reported and obtained 13 such QSOs. We have also found 4 QSOs
(which are QSOs definitely) for which no lines could be identified by the red-shift
theory, but our PLS theory is able to identify almost all the lines. In Table IV we
present all these 17 QSOs and make a comparison of identifications by the RS and
PLS theories. It is encouraging to note that our PLS theory gives an increase in
percentage of coincidence to over 79% from the previous 73.6% of Table III , while the
red-shift theory gives an overall percentage of coincidence of only 61.9%, even though
the unquoted wavelength fitting error in RS theory exceeds 20 A.
Some of the QSOs show narrow absorption lines along with the emission lines,
which often have multiple redshifts according to the conventional theory. It is in-
teresting to mention that Varshni (1974) has shown, by taking nonsense spectra, that
the multiple red-shifts of absorption lines may not be real. Recently we have received
the abstract of a paper by Varshni (1977b) where the absorption lines are explained in
the PLS theory with the help of metastable states.
Acknowledgement
Our thanks are due to the University Grants Commission for financial support.
References
Alien, C. W. : 1973, Astrophysical Quantities, University of London, Athlone Press, p. 208. Bahcall, N. A., Bahcall, J. N. and Schmidt, M.: 1973, Astrophys. J. 183, 777. Banerji, S. and Bhar, G. C.: 1978, Astrophys. Space Sci. 56, 443. Baranger, M.: 1962, 'Spectral Line Broadening in Plasma,' in D. R. Bates (ed.), Atomic and
Molecular Processes, Academic Press, New York. Beck, R., Englisch, W. and Gurs, K.: 1976, Table of Laser Lines in Gases and Vapours, Springer
Verlag, Berlin. Browne, I. W. A. and Savage, A.: 1977, Monthly Notices Roy. Astron. Soc. I79, 65. Browne, I. W. A., Savage, A. and BoRon, J. C.: 1975, Monthly Notices Roy. Astron. Soc. 173, 87. Burbidge, E. M.: 1965, Astrophys. J. 142, 1674. Burbidge, E. M.: 1966, Astrophys. J. 143, 612. Burbidge, E. M.: 1968, Astrophys. J. (Letters) 154, L109. Burbidge, E. M.: 1970, Astrophys. J. (Letters) 160, L33. Burbidge, E. M. and Rosenberg, F. D.: 1965, Astrophys. J. 142, 1673. Burbidge, E. M. and Strittmatter, P. A.: 1972, Astrophys. J. (Letters), 174, L57.
ANALYSIS OF THE PLASMA LASER STAR MODEL OF QSOS 347
Burbidge, G. R. and Burbidge, E. M. : 1967, Quasistellar Objects, W. H. Freeman, New York. Burbidge, G. R., Crowne, A. H. and Smith, H. E.: 1977, Astrophys. J. Suppl. 33, 113. Cameron, A. G. W.: 1970, Space Sci. Re~. 15, 12l. Campbell, E. M., Jahn, R. G., Von Jaskowsky, W. F. and CIark, K, E.: I977, Appt. Phys. Lett. 30,
575. Greenstein, J. L. and Schmidt, M.: 1964, Astrophys. J. 140, 1. Griem, H. R.: 1964, Plasma Spectroscopy, McGraw Hill, New York. Griem, H. R. : 1974, Spectral Line Broadening by P1asmas, Academic Press, New York, Kinman, T. D. and Burbidge, E. M. : 1967, Astrophys. J. 148, L59. Lynds, C. R. et al.: 1965, Astrophys. J. 142, 1667. Lynds, C. R.: 1967, Astrophys. J. 147, 837. Lynds, C. R., Hill, S. I., Hefre, K. and Stockton, A. N. : 1966, Astrophys. J. 144, 1244. Lynds, C. R. and Wills, D. : 1968, Astrophys. J. 153, L23. Osmer, P. S. : 1977, Astrophys. J. 218, L89. Osmer, P. S. and Smith, M. G.: 1976, Astrophys. J. 210, 267. Osmer, P. S. and Smith, M. G. (I): 1977, Astrophys. J. 213, 607. Osmer, P. S. and Smith, M. G. (II): 1977, Astrophys. J. 215, L47. Peterson, B. A., Jouncey, D. L., Wright, A. E. and Condon, J. J. 1976, Astrophys. J. 207, L5. Robinson, I., Schild, A. and Schficking, E. L.: 1965, Quasistellar Sources and Gravitational
Collapse, University of Chicago Press, pp. 219-20. Sandage, A. and Tammann, G. A.: 1976, Astrophys. J. 210, 7. Savage, A., Browne, I. W. A. and BoRon, F. G.: 1976, Monthly Notices Roy. Astron. Soc. 177, 77. Schmidt, M. : 1975, Astrophys. J. 195, 253. Schmidt, M. and Mathews, T. A.: 1964, Astrophys. J. 139, 781. Siegman, A. E.: i971, An Introduction to Lasers and Masers, McGraw Hill, New York. Smith, H. E., Burbidge, E. M., Baldwin, J. A., Tohline, J. E., Wampler, E. J,, Hazard, C. and
Murdoch, H. S.: 1977, Astrophys. J. 215, 427. Strittmatter, P. A., Carswell, R. F., Gilbert, G. and Burbidge, E. M. : 1974, Astrophys. J. 170, 509. Varshni, Y. P. : 1974, Astrophys. J. 193, L5. Varshni, Y. P. : 1977a, Astrophys. Space Sci. 46, 443. Varshni, Y. P. : 1977b, Bull. Amer. Astron. Soc. (Abstract only), 9, 578. Varshni, Y. P. and Lain, C. S.: 1976, Astrophys. Space Sci. 45, 87. Willett, C. S.: 1974, An Introduction to Gas Lasers- Population Inversion Mechanics, Pergamon
Press, New York. Wills, D.: 1976 (private communication). Wills, D. and Wills, B. J.: 1974, Astrophys. J. 190, 271. Wills, D. and Wills, B. J. : 1976, Astrophys. J. Suppl. 31, 143. Wright, A. E., Jauncey, D. L., Peterson, B. A. and Condon, J. J.: 1977, Astrophys. J. 211, Ll15. Yariv, A.: 1968, An Introduction to Quantum Electronics, John Wiley, New York.
Related Documents