October 2003 ECN-C--03-089 ANALYSIS OF THE FEASIBILITY OF INCLUSION OF DECENTRALISED RENEWABLE ELECTRICTY SYSTEMS INTO A MANDATED MARKET SHARE MECHANISM FOR CHINA Final Report N.H.van der Linden, ECN L. Junfeng, NDRC Energy Research Institute D. Keyun, China Association of Rural Energy Industry J.W. Martens, EcoSecurities K.V. Ramani W. Sicheng, Beijing Jike Energy New Development Co. W. Shutian, Beijing Tianhen Renewable Energy Co.Ltd. C. van der Tak, NCC Consultancy BV

Welcome message from author
This document is posted to help you gain knowledge. Please leave a comment to let me know what you think about it! Share it to your friends and learn new things together.
Transcript

October 2003
ECN-C--03-089
ANALYSIS OF THE FEASIBILITY OF INCLUSION OF
DECENTRALISED RENEWABLE ELECTRICTY
SYSTEMS INTO A MANDATED MARKET SHARE
MECHANISM FOR CHINA
Final Report
N.H.van der Linden, ECN
L. Junfeng, NDRC Energy Research Institute D. Keyun, China Association of Rural Energy Industry
J.W. Martens, EcoSecurities K.V. Ramani
W. Sicheng, Beijing Jike Energy New Development Co. W. Shutian, Beijing Tianhen Renewable Energy Co.Ltd.
C. van der Tak, NCC Consultancy BV

2 ECN-C--03-089
Acknowledgement This project was conducted by the Energy research Centre of the Netherlands ECN together with
EcoSecurities, NCC Consultancy BV, Energy Research Institute in China, Tianhen renewable
Energy Co, Ltd. China Association of Rural Energy Industry, Beijing Jike Energy New
Development and Mr K.V. Ramani. Financial support was obtained from the Department for
International Development of the UK Government. The project is registered under ECN project
number 7. 7440
The Executive Summary of this report is issued as a separate report both in English and Chinese
(ECN-C--03-090 and ECN-C--03-091) and can be downloaded from the Internet at www.ecn.nl.
The project team highly appreciates the valuable comments and contributions received during the
course of this project from the World Bank, from the Department for International Development of
the UK Government and from the Project Management Office of the China Renewable Energy
Scale-up Programme. Naturally, the sole responsibility of this report lies with the authors.
This document is an output from a project funded by the UK Department for International
Development (DFID) for the benefit of developing countries. The views expressed are not
necessarily those of DFID.
Abstract The World Bank and the Global Environment Facility provide assistance to the Government of
China with the implementation of the renewable energy programme during the 10th and 11th Five
Year Plans. To this end, the China Renewable Energy Scale-up Programme (CRESP) was set up.
CRESP is managed by the Project Management Office (PMO), which is institutionally placed in the
National Development and Planning Commission (NDRC). One of the first activities initiated by
CRESP is the development of the institutional framework within which the Mandated Market Sys-
tem (MMS) policy for renewable energy can be introduced.
An MMS policy is based on the requirement that a set amount (or proportion) of the electricity sup-
ply is produced from renewable energy sources. The obligation is placed at some point in the supply
chain, which could range from production, through transmission to supply or consumption. Monitor-
ing procedures are put in place to ensure that the obligation will be met. Environmental considera-
tions are the main reason behind the intention to introduce an MMS in China but the government has
also recognised the importance of (renewable) energy to achieving poverty objectives.
Decentralised renewable electricity systems (DRES) have special relevance for rural poor communi-
ties that are unserved or underserved by centralised fossil fuel networks or utility electricity grids.
DRES may offer a promising solution to meet demand for energy services of these communities in
remote location, which cannot be reach by the electricity grid. The analysis in this study focused on
mini-hydro (less than 10 kW), solar home systems and stand-alone wind turbines.
The principal objective of the study is to analyse the feasibility of inclusion of DRES into the pro-
posed MMS for China. Because DRES are often used in remote areas, which are difficult to reach,
the costs of verifying these systems are prohibitive if the procedures are not sufficiently simple and
efficient. Therefore, simplified procedures have been developed for verifying the number of DRES
sold and the operational status of the systems.
The analyses shows that inclusion of stand alone PV and wind into the MMS is not feasible because
the required verification procedures for these technologies appear to be too costly and the additional
electricity generated is only significant if the premium price of wind and PV is some 100 times
higher compared to grid connected RE technologies. For mini-hydro, however, it is concluded that
inclusion into the MMS is feasible and recommendable.
ECN-C--03-089 3
CONTENTS
LIST OF TABLES 6
LIST OF FIGURES 7
ACRONYMS 8
CONVERSION FACTOR 8
1. INTRODUCTION 9 1.1 Background 9 1.2 Objectives and approach 11 1.3 Study boundaries 13
1.3.1 Mandated Market Share Policy Framework 13 1.3.2 Selection of target province 16 1.3.3 Definition of Decentralised Renewable Electricity Systems 17 1.3.4 Selection of technologies 18 1.3.5 Potential market for decentralised renewable electricity technologies 19
1.4 Structure of the report 21
2. RENEWABLE ENERGY DEVELOPMENT IN CHINA 22 2.1 Background 22 2.2 Grid connected renewable energy power production 23 2.3 Decentralised renewable energy power production 24
2.3.1 Solar Photovoltaic 24 2.3.2 Wind Energy 26 2.3.3 Small/Mini-hydro 27
2.4 Overview of renewable energy policies in China 29 2.4.1 Renewable Energy Policy Framework 29 2.4.2 Renewable Energy Policy Objectives 31 2.4.3 Government support for the promotion of renewable energy 31 2.4.4 Overview of policies on renewable energy for selected provinces 33
2.5 Ongoing renewable energy programmes in China 35 2.6 Conclusions 37
3. REVIEW OF INTERNATIONAL EXPERIENCE 39 3.1 International experience with MMS policies 39
3.1.1 Experience in Europe 39 3.1.2 Experience in the United States 41 3.1.3 Experience in Australia 42
3.2 International experience with DRE promoting policies 44 3.2.1 Rural electrification 44 3.2.2 Commercial market approach for promoting DRE systems 45 3.2.3 Dispersed area concession approach for promoting DRE systems 46
3.3 Conclusion 48
4. FRAMEWORK FOR MONITORING AND VERIFICATION PROCEDURES FOR DRE TECHNOLOGIES 49 4.1 Introduction 49
4.1.1 Institutional design for certification of DRE-systems 50 4.1.2 Verification cycle of stand-alone DRE systems 53 4.1.3 Approach for developing and evaluating certification procedures 53
4.2 Framework for monitoring and verification procedures for photovoltaic systems 55 4.2.1 Estimating kWh production of a photovoltaic system 55 4.2.2 Verification of photovoltaic system sales 57 4.2.3 Verification of the performance of photovoltaic systems 60 4.2.4 Transaction costs analysis for photovoltaic system verification approaches 63

4 ECN-C--03-089
4.2.5 Summary of photovoltaic system verification procedures 66 4.3 Framework for monitoring and verification procedures for mini-hydro installations 67
4.3.1 Estimation of kWh production of a mini-hydro system 67 4.3.2 Verification of mini-hydro sales 67 4.3.3 Verification of system performance 68 4.3.4 Transaction costs of verification procedures for micro hydro turbines 68 4.3.5 Summary of mini-hydro verification procedures 71
4.4 Framework for monitoring and verification procedures for stand-alone wind 71 4.4.1 Estimation of kWh production of a stand-alone wind turbines 72 4.4.2 Verification procedures 72 4.4.3 Transaction costs of verification procedures for stand alone wind turbines 72 4.4.4 Summary of stand alone wind turbine verification procedures 74
4.5 Conclusions 75
5. IMPACT OF INCLUSION INTO THE MMS ON THE UPTAKE OF DRE-SYSTEMS 77 5.1 Introduction 77 5.2 Methodology 78
5.2.1 DRE technologies considered 78 5.2.2 Supply-demand analysis 79
5.3 Construction of the green certificate supply curves 80 5.3.1 Construction of DRE power supply curves 80 5.3.2 Assessment of willingness to pay 82 5.3.3 Green certificate supply costs, net of transaction costs 83
5.4 Simulation results 85 5.4.1 Scenario I: Single tier MMS 85 5.4.2 Scenario II: differentiated support for decentralised and on-grid RE systems 86 5.4.3 Scenario III: Fully differentiated support 88
5.5 Shortcomings of the analysis 89 5.6 Environmental impact 89 5.7 Conclusions 90
6. EVALUATION OF POVERTY ALLEVIATION IMPACTS OF MMS OPTIONS FOR DECENTRALIZED RENEWABLE ELECTRICITY SYSTEMS 91 6.1 Importance of DRES to Living Conditions and Livelihoods of the Poor 91
6.1.1 Energy, poverty alleviation and poverty reduction 91 6.1.2 Significance of DRES for the poor 92 6.1.3 Access and affordability 94 6.1.4 The role of complementary inputs to energy 95
6.2 Impacts of DRES on Poverty Alleviation/Reduction 96 6.2.1 Objectives, approach and methodology of assessment 96
6.3 Major Beneficiaries of DRES 98 6.3.1 Profile of the poor in the Western Region and Sichuan 98 6.3.2 Access to electricity 101 6.3.3 Energy consumption patterns of the poor 102
6.4 Impacts of DRES on the Poor 107 6.4.1 Poverty alleviation impacts 107 6.4.2 Poverty reduction impacts 110
6.5 Capacity and Willingness of Poor Households to Pay for DRES 111 6.5.1 Capacity to pay 111
6.6 Willingness to pay 113 6.7 Potential Contribution of MMS to Promote DRES for the Poor 116
6.7.1 Future role of DRES in poverty alleviation and reduction 116 6.8 Feasibility of MMS to promote DRES for the poor 117
6.8.1 Emphasis on poverty reduction 117 6.8.2 Impacts of proposed MMS mechanisms on the poor 119
6.9 Alternative DRES Promoting Policies and Complementary Measures 121

ECN-C--03-089 5
6.9.1 Policy support 121 6.9.2 Ways to enhance stakeholder participation 122 6.9.3 Complementary measures 123
7. RECOMMENDATIONS 126 7.1 Evaluation criteria 126
7.1.1 Mini-hydro 126 7.1.2 Photovoltaic household applications 127 7.1.3 PV village power 128 7.1.4 Stand alone wind turbines 128
7.2 Alternative mechanism for promoting PV household applications and stand alone wind turbines 128
8. OUTLINE FOR THE DESIGN OF A MINI-HYDRO MMS PILOT PHASE IN SICHUAN PROVINCE 130 8.1 Introduction 130 8.2 Main features of a mini-hydro MMS pilot in Sichuan Province 130 8.3 Indicative Costs for establishing a mini-hydro MMS pilot in Sichuan 132
REFERENCES 134
APPENDIX A LIST OF POSSIBLE DRE OPTIONS 137
APPENDIX B SOLAR RESOURCES IN CHINA BY REGION 138
APPENDIX C HISTORICAL OVERVIEW OF ANNUAL PRODUCTION, MODULE PRICE AND INSTALLED PV CAPACITY 139
APPENDIX D SOLAR HOME SYSTEM COSTS 141
APPENDIX E KWH PRODUCED BY PV AND WIND/PV SYSTEMS 142
APPENDIX F DIFFERENT TYPES OF STAND ALONE WIND SYSTEMS USED IN CHINA 143
APPENDIX G RESULTS WITH AN ALTERNATIVE METHOD TO MODEL THE DEMAND SIDE 145

6 ECN-C--03-089
LIST OF TABLES
Table 1.1 Basic indicators of candidate provinces 17 Table 1.2 Categorisation of decentralised electricity technologies in China 19 Table 1.3 RE resource distribution and technology combination in China 20 Table 1.4 Currently installed and potential market for new DRE systems in Sichuan 20 Table 1.5 Currently installed and potential market for new DRE systems in China 21 Table 2.1 Overview of technically exploitable potential and currently installed capacity of
renewable energy for power generation in China in 2002 23 Table 2.2 Breakdown of annual PV sales by application 25 Table 2.3 Townships in Sichuan that received PV village power through the NDRC Village
Power Project 26 Table 2.4 Stand-alone wind generator sales statistics between 1984 to 2001 27 Table 2.5 Generation hours and kWh production for various types of mini-hydro
installations 28 Table 2.6 Classification of taxation in China 32 Table 2.7 Summary of renewable energy policies in Inner Mongolia, Xinjiang, Gansu and
Qinghai. 34 Table 3.1 Indicative renewable electricity targets for 2010 for the EU member States
(including large hydro). 39 Table 3.2 Instruments for stimulating electricity generation from renewable sources 40 Table 3.3 Average contract prices for NFFO and RO schemes in the UK 40 Table 3.4 RPS targets for various states in the US 41 Table 3.5 Deemed amounts for mini-hydro 43 Table 3.6 Deemed amounts for small wind turbines 43 Table 3.7 Main characteristics of DRE system delivery models 45 Table 3.8 Government concession models in other countries 47 Table 4.1 Average annual kWh production per solar home system per region 56 Table 4.2 Appliances powered by solar home systems 56 Table 4.3 The relationship between photovoltaic system sales (N) and sample size (n) per
total number of systems that have to be surveyed (ß.n) 64 Table 4.4 Transaction costs (RMB cent/kWh) of verification options for photovoltaic systems 65 Table 4.5 Verification of system sales 66 Table 4.6 Summary of options for verification of photovoltaic system performance 66 Table 4.7 Transaction costs [Fen/kWh] of verification options for mini-hydro installations 70 Table 4.8 Summary of evaluation results of mini-hydro verification of system sales 71 Table 4.9 Summary of performance verification procedures for micro-hydro turbines 71 Table 4.10 End-use appliances for small-scale wind generators 72 Table 4.11 Transaction costs (Fen/kWh) of verification options for stand alone wind systems 74 Table 4.12 Verification of wind turbine sales 74 Table 4.13 Summary of options for verification of photovoltaic system performance 75 Table 5.1 Currently installed and potential markets for new DRE systems in Sichuan 79 Table 5.2 Currently installed and potential markets for new DRE systems in China 79 Table 5.3 Assumptions behind cost calculations 80 Table 5.4 Annual kWh generation 81 Table 5.5 DRE Power supply prices 81 Table 5.6 Percentage of DRE market in good, average and bad locations, China 81 Table 5.7 Percentage of DRE market in good, average and bad locations, Sichuan 81 Table 5.8 New mini-hydro capacity for various multipliers, net of transaction costs, China
and Sichuan 84 Table 5.9 New wind capacity for various multipliers, China 84

ECN-C--03-089 7
Table 5.10 New PV capacity for various multipliers, net of transaction costs, China and
Sichuan 85 Table 5.11 Uptake of DRE in GWh/year for various multiplier values, China and Sichuan.
GC price fixed at RMB 0.039/kWh_on-grid 86 Table 5.12 Uptake of DRE in GWh/year for various multiplier values, China and Sichuan.
GC price in RMB/kWh_on-grid reacts to off-grid supply 87 Table 5.13 Multipliers needed to achieve specific market penetration targets, China and
Sichuan. GC price fixed at RMB 0.039/kWh_on-grid 87 Table 5.14 Multipliers needed to achieve specific market penetration targets, China and
Sichuan. GC price in RMB/kWh_on-grid reacts to off-grid supply 88 Table 5.15 Multipliers needed to achieve specific market penetration targets, China and
Sichuan, by technology. GC price fixed at RMB 0.039/kWh_on-grid 88 Table 5.16 Multipliers needed to achieve specific market penetration targets, China and
Sichuan, by technology. GC price in RMB/kWh_on-grid reacts to off-grid supply 88 Table 5.17 Annual CO2 reduction for scenario II 90 Table 6.1 Contributions of Input Factors to Regional Inequality in Agricultural Productivity
in China 96 Table 6.2 General Information on Study Villages in Sichuan Province 98 Table 6.3 Social Development, Productivity and Poverty in Rural China Among Regions 99 Table 6.4 Status of Nationally Designated Poverty Counties in Sichuan Province: 2000 100 Table 6.5 Rural Energy Consumption in China 103 Table 6.6 Level and Structure of Rural Energy Consumption in China 103 Table 6.7 Energy/Electrification Status of Poor Villages in Sichuan Province 105 Table 6.8 Perceived Benefits of Electrification in Study Villages in Sichuan Province 107 Table 6.9 Potential Income-Generating Activities in Study Villages 111 Table 6.10 Per Capita Income of Farmers in Western Provinces of China in 2000 111 Table 6.11 Economic Status of Study Villages in Sichuan Province [RMB] 112 Table 6.12 Affordability of Small Photovoltaic Systems 113 Table 6.13 Prevailing Market Prices of DRES, Components and Appliances in 2002 115 Table 6.14 Expenditure on Livelihood and Household Energy Consumption Per Capita in
Sichuan 116 Table 6.15 Impact of different multipliers on the poor’s access to electricity through mini-
hydro in China and Sichuan 120 Table 8.1 Indicative costs for mini-hydro MMS pilot in Sichuan 133
LIST OF FIGURES
Figure 4.1 Institutional set up of a DRE certification scheme 51 Figure 4.2 Flow of green certificate rights from end-user to buyer 52 Figure 6.1 Household Applications of Electricity 93 Figure 6.2 The Vicious Circle of Energy Poverty 95 Figure 6.3 Distribution of Photovoltaic Owners Based Income and Assets Owned 113

8 ECN-C--03-089
ACRONYMS
AMB Agricultural Machinery Bureau CRESP China Renewable Energy Scale-up Programme DFID UK Department For International Development DRE Decentralised Renewable Electricity Fen 1 RMB = 100 Fen GEF Global Environment Facility MMS Mandated Market Share MOA Ministry of Agriculture MOF Ministry of Finance M&V Monitoring and verification NDRC National Development and Reform Commission (SETC and SDPC have merged into
newly established NDRC) NFFO Non Fossil Fuel Obligation RE Renewable Energy REDP Renewable Energy Development Programme RMB Renminbi (Chinese currency) RO Renewable Obligation RPS Renewable Portfolio Standard SHS Solar Home System WB World Bank WTO World Trade Organisation WTP Willingness To Pay
CONVERSION FACTOR
1 $US = 8.28 Yuan Renminbi

ECN-C--03-089 9
1. INTRODUCTION
1.1 Background
China’s remarkable achievements in the deployment of renewable energy have long been rec-ognized world-wide, in particular its small hydropower and biogas programmes are regularly cited as models of success and are used in many other countries. China has already expressed its intention to increase further the deployment of renewable energy to help achieve sustainable economic development and reduce the environmental impact from the use of coal. A major pro-gramme for renewable energy will be implemented as part of the Tenth Five Year Plan (2001-2006) and will be continued in the 11th Five Year Plan. The World Bank and the Global Environment Facility provide assistance to the Government of China with the implementation of the renewable energy programme during the 10th and 11th Five Year Plans. To this end, the China Renewable Energy Scale-up Programme (CRESP) was set up. CRESP is managed by the Project Management Office (PMO), which is institutionally placed in the National Development and Reform Commission (NDRC). One of the first activi-ties initiated by CRESP is the development of the institutional framework within which the Mandated Market System (MMS) policy for renewable energy can be introduced. An MMS policy is based on the requirement that a set amount (or proportion) of the electricity supply is produced from renewable energy sources. The obligation is placed at some point in the supply chain, which could range from production, through transmission to supply or consump-tion. Monitoring procedures are put in place to ensure that the obligation will be met. For grid connected renewable energy technologies the monitoring basically involves meter reading. In an MMS, the producers of renewable electricity receive a premium price to cover the mar-ginal costs of producing electricity from renewable sources. These costs are usually passed on to the electricity consumers either compulsorily (i.e. costs are added to the usual price of electric-ity) or voluntarily (i.e. via green electricity schemes, where environmentally aware consumers pay extra voluntarily). This means that within an MMS an additional stream of revenues is gen-erated to support the production of electricity from renewable energy sources. In general, MMS systems can be built by using one (or a combination) of the following three types of support instruments. 1. Renewable Portfolio Standard (RPS): the government sets by law (or voluntarily) the
amount (or proportion) of electricity supply that must be produced from renewable sources; the market is then allowed to set the price of meeting this obligation by trade.
2. Feed In Tariffs: all qualified electricity generated from renewable sources is paid a premium price set by the government on delivery to the grid.
3. Tendering System: government sets up a fund to pay the cost of its renewable energy sup-port policy. The system involves a competitive bidding process for access to the fund to en-sure that only the most cost-effective projects gain access to the fund.
MMS-type systems have already been introduced in several European countries and in a number of states in the USA as a means to achieve environmental objectives and to diversify the energy supply mix. The Government of China is currently examining whether an MMS would be an appropriate policy framework for China to accelerate the use of renewable energy in order to reduce the environmental pollution. This also includes an analysis of what would be the best support instrument in the Chinese situation. Like in Europe and the US, the focus of the proposed
MMS for China will be on grid connected renewable energy technologies.

10 ECN-C--03-089
Environmental considerations are the main reason behind the intention to introduce an MMS in China but the government has also recognised the importance of (renewable) energy to achiev-ing poverty objectives. The linkage between energy and poverty has been spotlighted in the wake of recent international attention to the persistent problem of poverty in developing coun-tries. The most serious and organised expressions of interest in the energy-poverty nexus are now set within the framework of the ‘millennium development goals’ and the outcomes of the World Summit on Sustainable Development, 2002. With the majority of the world’s poor living in rural areas, this implicitly means a re-examination of policies and strategies to promote mod-ern fuels and electricity for rural socio-economic development. The potential role of energy in meeting the basic and productive needs of the poor is illustrated in Box 1.
Box 1 Energy and the Millennium Development Goals (MDGs)
Energy services can play a variety of direct and indirect roles in helping to achieve the MDGs:
• To halve extreme poverty - access to energy services facilitates economic development - micro-enterprise, livelihood activities beyond daylight hours, locally owned businesses, which will create employment - and assists in bridging the ‘digital divide’.
• To reduce hunger and improve access to safe drinking water - energy services can im-prove access to pumped drinking water - clean water and cooked food reduce hunger (95% of food needs cooking).
• To reduce child and maternal mortality, and to reduce diseases - energy is a key compo-nent of a functioning health system, for example, operating theatres, refrigeration of vac-cines and other medicines, lighting, sterile equipment and transport to health clinics.
• To achieve universal primary education, and to promote gender equality and empower-
ment of women - energy services reduce the time spent by women and children (especially girls) on basic survival activities (gathering firewood, fetching water, cooking, etc.); light-ing permits home study, increases security and enables the use of educational media and communications in schools (including information and communication technologies, ICTs).
• Environmental sustainability - improved energy services help to reduce emissions, pro-tecting the local and global environment; efficient use of energy sources and good man-agement can help to achieve sustainable use of natural resources and reduce deforestation.
DFID, 2002
Decentralised renewable electricity systems (DRES) have special relevance for rural poor com-munities that are unserved or underserved by centralised fossil fuel networks or utility electric-ity grids. DRES may offer a promising solution to meet demand for energy services of these communities in remote location, which cannot be reached by the electricity grid. At present, there are some 30,000 villages in China, with an average population of approximately 1,000 people per village, without access to electricity. These villages are likely to continue receiving low priority for grid extension because of their remote location and their low electricity con-sumption. The Government of China has set itself the task of electrifying these remote villages, to which grid extension is not feasible, by DRES. However, there are several barriers that prevent a rapid introduction of DRES. The most serious barrier is the problem of affordability. DRES are usually cost-competitive against conventional energy options in serving remote communities. Especially when small quantities of energy are required, DRES are often the least cost option. However, while communities living in remote areas may find DRES their cheapest option, the vast majority of the poor lead a subsistence life and lacks enough cash to purchase DRES to improve their living conditions and enhance their livelihoods.

ECN-C--03-089 11
One of the options to reduce this barrier that is currently being considered by the Chinese gov-ernment is to include DRES into the proposed MMS for China. If DRES could be brought under the MMS, part of the revenue stream generated within the MMS could be allocated for DRES which in turn could be used to increase the access of the poor to DRES through a price reduc-tion or the provision of better and less expensive maintenance services. However, because DRES are stand-alone systems generally producing only small amounts of electricity, these systems do not have an electricity meter. Therefore, if these systems are to be included into the MMS, monitoring cannot be done simply by reading the meter but separate procedures need to be developed and implemented to monitor and verify the total amount of electricity produced by these systems. The transaction costs associated with these procedures to a large extent determine the feasibility of including DRES into MMS as an option to improve access to electricity in poor rural areas in China. The present study aims to identify suitable monitoring and verification procedures for DRES and to assess the feasibility of including DRES into the proposed MMS for China. The key question addressed in the study is to what extent the MMS policy framework that is proposed to achieving environmental objectives can also be used to contribute to meeting poverty objectives by promoting DRES. The results of this study contribute to the design of an MMS for China, which is a separate ac-tivity initiated by CRESP, in the sense that this study recommends on the type of provision that must be made within the MMS to ensure a significant improvement of the access of the poor to DRES. The Government of China and the World Bank have requested the Department for International Development of the Government of the United Kingdom (DFID-UK) for support to conduct this study. In December 2002, a contract was signed between DFID-UK and the Energy research Centre of the Netherlands (ECN) and a project team was formed comprising the following members:
• Mr. N. van der Linden of Energy research Centre of the Netherlands (ECN).
• Mr. C. van der Tak of NCC Consultancy BV.
• Mr. K.V. Ramani (private consultant).
• Mr. J.W. Martens of Ecosecurities, the Netherlands.
• Mr. Wang Sicheng of Beijing Jike Energy New Development Co.
• Madame Deng Keyun of China Association of Rural Energy Industry.
• Mr. Wang Shutian of Beijing Tianhen Renewable Energy Co.Ltd.
• Mr. Li Junfeng of the NDRC, Energy Research Institute. The project commenced in June 2002. In January 2003 a workshop was held in Beijing to pre-sent and discuss the preliminary results and it identified monitoring and verification options for inclusion into the MMS. The final report was completed in September 2003.
1.2 Objectives and approach
This study aims to recommend how to promote decentralised renewable electricity systems through mandatory market mechanisms. If more appropriate, this study will recommend poten-tial mechanisms, other than the mandated market mechanism (such as capital subsidies, conces-sions, tendering systems), that could be considered through the CRESP, especially with a view to improving the access of the poor to basic electricity services. In order to achieve this objec-
tive the following research questions have been analysed:
• What are the potential decentralised renewable electricity applications in China? This ques-tion is addressed in Chapter 2,

12 ECN-C--03-089
• What lessons can be learned from the international experience with MMS mechanism and DRE promoting policies? This question is dealt with in Chapter 3,
• Can streamlined certification procedures be developed to facilitate the inclusion of DRE sys-tems into the MMS? This issue is covered in Chapter 4,
• How could an MMS be designed to stimulate the development of DRE-systems in China and to what extent can MMS expand the access to modern energy for the poor? These issues are covered in Chapter 5,
• What is the impact of inclusion of DRE systems into the MMS on poverty alleviation and poverty reduction? Who are the major beneficiaries of DRE systems and what are the poten-tial benefits and costs to likely stakeholders? These issues are examined in Chapter 6.
The methodology used to achieve the above objectives consists of the following main compo-nents: 1. review of international experiences, 2. design of a framework for monitoring and verification procedures, 3. evaluation of MMS design options, 4. analysis of the impact on poverty alleviation and poverty reduction, 5. consultation with the stakeholders, 6. design of a technical assistance and investment programme to introduce the recommended
option during the pilot phase of the proposed MMS for China.
1. Review of international experience This involves a literature review of international experience with MMS schemes to gain a broad understanding of the successful MMS schemes introduced in Europe, the US and Australia and includes the performance of small-scale systems in the Australian MMS. In addition, the experi-ence with other alternative DRE-promotion policies, such as concession schemes and capital subsidies, has been reviewed.
2. Design of a framework for Monitoring and Verification procedures This component involves the identification of suitable monitoring and verification procedures for DRE-systems. Since DRE-systems are often widely dispersed in sparsely populated and re-mote areas, the costs of monitoring and verification (M&V) of each system could be prohibitive. Therefore, simple and highly streamlined procedures are required to reduce the transaction costs to an acceptable level. The design of these procedures involves the following main aspects:
• A standardised calculation method for the average amount of kWh produced by a particular DRE-technology.
• Streamlined monitoring and verification procedures for the number of systems deployed.
• Streamlined monitoring and verification procedures for the operational status of the systems. For each of the above aspects alternative procedures for the selected DRE-technologies have been developed and evaluated taking into account the existing infrastructure of the technology and the financial supply chain. Each of the identified M&V procedures are analysed on their ro-bustness, their applicability to China and their transaction costs.
3. Evaluation of alternative MMS design options Once feasible M&V procedures for DRE systems have been developed and streamlined, the next question to be addressed is the best manner to incorporate the DRE-technologies into the MMS. To answer this question the impact on DRE capacity and on poverty has been analysed for a number of possible MMS design options. This involves the following key elements:
• Cost curves for different renewable and conventional options (life-time costs and initial out-lay).
• Assessment of power supply options for different type of locations (degree of remoteness as for example measured by transport costs, availability of different renewable resources).

ECN-C--03-089 13
• Composition of demand for different systems - private actors (households, small-scale en-terprises) for private use; private investors for sale of renewable power to end-users; central, provincial and local government; an assessment of their respective decision-making proce-dures, and financial arrangements.
• Willingness-to-pay and ability-to-pay for rural power.
• Assessment of the impacts of various barriers and constraints, for example lack of (mini-) credit.
4. Analysis of the impact on poverty alleviation and poverty reduction
The purpose of this activity is to analyse the impact of the inclusion of DRE-systems into the MMS on poverty indicators such as income, security, health improvements, education services, time spent by women and children to collect traditional fuels and access to information. The poverty analysis involves the following main components:
• Establishment of the proportion of poor and the major beneficiaries who will be affected by the inclusion of DRE systems into the MMS.
• Identification of the present energy supply-use patterns of the poor, and the social and eco-nomic impact of DRE systems on these.
• Assessment of how inclusion will contribute to improved health and educational facilities and benefits to women and children.
5. Consultation with the stakeholders A stakeholder workshop was organised to present and discuss the draft proposal for the design of a system to incorporate DRE systems into the MMS. The workshop was attended by repre-sentatives from government, the power industry, the renewable energy industry and other inter-ested groups. The discussions held during the workshop resulted in a number of adjustments in the methodology and provided valuable inputs for the final recommendations of the study
6. Design of a technical assistance and investment programme for introducing the
recommended option during the pilot phase of the proposed MMS for China
This activity aims to develop a technical assistance programme for the inclusion of the recom-mended DRE-system into the pilot phase of the proposed MMS for China. This activity in-volves the identification of activities required for the implementation of the pilot MMS such as raising awareness, capacity building and the creation of institutional support. In addition, an as-sessment of the tentative cost to carry out these activities has also been made.
1.3 Study boundaries
The principal objective of the study is to analyse the feasibility of inclusion of decentralised re-newable electricity systems into the proposed MMS for China. In order to achieve this objective within the time and resources available to the project team, the scope of the study had to be clearly focussed. The following main assumptions delineate the study boundaries: 1. Mandated Market Share Policy Framework. 2. Selection of target province. 3. Definition of decentralised electricity system. 4. Selection of decentralised renewable electricity technologies. 5. Assessment of the potential market for decentralised renewable electricity technologies.
1.3.1 Mandated Market Share Policy Framework
The Government of China is considering the introduction of a Mandated Market Share mecha-nism to promote the use of renewable energy. The specific design features of the MMS for China are now being examined and no decision has yet been made as to what type of specific

14 ECN-C--03-089
policy instrument will be used for the MMS. For this study the general MMS policy framework has therefore been taken as the point of departure. An MMS policy framework is based on a target set by the Government for a specific amount (or proportion) of electricity supplied from renewable energy sources (e.g., 5% of total electricity production must come from renewable energy sources). The target can be achieved by using one of (or a combination of) the following three main types of support instruments: 1. Renewable Portfolio Standard (RPS): The RPS is the main framework used to create MMS
systems world-wide. The Government decides how much electricity is to be produced from renewable energy sources and places this obligation at some point in the electricity supply chain (producer, transmission or distribution, retail electricity supplier, consumer).
2. Feed-in Tariffs: In the feed-in system all qualifying electricity generated from renewable energy sources is paid a premium price on delivery to the grid. In this system the govern-ment sets the price of electricity produced from renewable sources, which can depend on many factors. The utilities are obliged to purchase this electricity at the set price. As genera-tion costs differ across renewable energy technologies, the feed-in tariff is usually different per technology and is provided for a specified period of time. In theory, by setting the price but not (directly) the quantity produced, it is not entirely certain a priori how much renew-able electricity will be promoted. However, the facts tend to prove that while the feed-in tar-iff instrument is indeed very effective, it is probably an expensive instrument.
3. Tendering System: In this system the government sets up a fund to pay the cost of renewable energy projects. This involves a system of competitive bidding for access to the fund to en-sure that only the most cost-effective projects gain access to the fund. The utilities are obliged to purchase the electricity at the price proposed by the winning bid. There are usu-ally separate tenders for different RE technologies and technology bands. Within each band contracts (and the corresponding support) are awarded to the most competitive bid. These procedures, which stimulate strong competition between renewable electricity generators and hence result in cost-efficiency and price reduction, are not greatly successful in promot-ing renewable electricity probably due to the complexity of the procedures involved. How-ever, once bids are awarded they usually work as a feed-in scheme giving a good deal of certainty to successful bidders.
For each of the above instruments one needs to set up an accounting framework to track, moni-tor and verify the amount of electricity produced from renewable energy sources. In this study the accounting framework is defined as the green certificate system. In the green certificate sys-tem producers of renewable electricity receive a certificate for each pre-defined unit of electric-ity produced (for example, for each MWh). Such certificates represent the ‘greenness’ of the electricity produced and promotes the creation of two different markets: the market of physical electricity, and the market of green certificates. The green certificate system can be used as an accounting framework for all three support mechanisms as follows:
• RPS: the body where the obligation is placed purchases green certificates from the RE pro-ducers and subsequently hands over the certificates to the authority that oversees the MMS.
• Feed-In: the government purchases a certain amount of green certificates through the utili-ties from the RE producers at a certain price.
• Tendering system: Government purchases a certain amount of (future) certificates from RE producers on a regular basis for a price determined by a tender procedure.
The body, subject to the MMS target, will be required to hand over certificates, either to show compliance with the RPS or to obtain the Feed-in payment. The certificates will therefore attain a value and become an incentive for producers to produce them. In this way the price obtainable for the RE-producer will be the sum of the price for physical electricity and the price for certifi-cates. To achieve the overall MMS target at the least possible cost, the green certificate system can be further developed into a trading system whereby certificates can be traded and the body which is subject to an obligation can either consume renewable electricity or purchase certifi-cates in the market to meet its obligation.

ECN-C--03-089 15
It is important to emphasise that the concept of green certificates is, primarily, a certification of the electricity produced from renewable sources. This certification provides an accounting framework to register production, authenticate the source of production, and verify whether de-mand has been met. Green certificates are usually not actual certificates but are handled by means of administrative software, which issues and registers certificates. This software includes a central registration database of accounts on which certificates can be deposited and withdrawn (comparable to a bank account). The green certificates thus serve as a tracking system to preclude double counting of renewable electricity. In this report, the concept of green certificates is used to reflect the additional reve-nues that are generated within the MMS for the production of electricity from renewable energy sources. In addition to the above three main policy instruments, the other instruments described below can be used to achieve the general MMS target or targets set for specific RE technologies. 1. Investment subsidies: renewable energy power plants are often capital-intensive projects
with relatively low running costs. Therefore, governments may offer subsidies on invest-ment for renewable electricity technologies in terms of US$/kWh or percentage on total in-vestment. Investment subsidies are the oldest, and still a very common type of support schemes. This may be explained by the fact that it is probably the most feasible political way to introduce non-competitive RE technologies into the market. However, a major dis-advantage of this instrument is the lack of incentive to operate the plant as efficiently as possible (Schaeffer et al, 2000; Faber et al, 2001)1.
2. Fiscal incentives: A wide array of incentives can be grouped in this category including: ex-emption of renewable electricity from energy taxes, tax refund for renewable electricity, lower VAT rates for renewable electricity, exemption of investments in renewable electric-ity plants from income or corporate taxes. They all increase the competitiveness of renew-able electricity and may affect old and recent installations (generation-based incentives) or only the new ones (capacity-based incentives). Fiscal and financial incentives are very widespread, probably because they are usually easy to implement given that fiscal structures are already present in all countries. However, it is important to note that they usually repre-sent secondary promotional measures. For example, in countries with RPS obligations, fis-cal incentives are usually put in place to stimulate demand. One additional disadvantage is that they can be quite inefficient (especially those which focus on new capacity).
3. Green pricing: In these systems a premium on the electricity bill is paid voluntarily by con-sumers to promote renewable electricity. This premium is then paid to the generators to cover the additional generation costs of renewable electricity. Obviously, this system de-pends on the consumer’s willingness to pay (WTP) for renewable electricity, which differs from country to country. Such WTP is influenced by factors related to consumer environ-mental awareness and specific market conditions (degree of market opening) (Faber et al 2001). For the investor, it should be noted that green pricing may result in uncertain de-mand. This is partly due to scepticism of the consumer about the premium being used effec-tively to promote renewables.
The question as to what would be the most appropriate MMS policy instrument (RPS, Feed-in, tender system) for China is beyond the scope of this study. However, several options have been analysed determine what provision could be made in the MMS to promote DRE systems once a specific policy instrument has been selected. The following options have been analysed:
1 A scheme of gradually decreasing investment subsidies might be given to potential investors in order to
discourage delays in investments due to expected price decreases of the technology. Subsidy programmes may also lead to further delays in investments, as they usually require the applicant to wait for the approval of the subsidy before beginning to install the plant. Finally, and apart from the problem of ‘windfall gains’, an investment subsidy does not prevent the subsidised generator from stopping production in the near future.

16 ECN-C--03-089
1. Single-tier MMS: no separate provision is made within the MMS for decentralised renew-able technologies. For example, an obligation of 5 percent in 2005 for new renewables placed with the retail electricity supplier. Under this option DRE technologies must compete with grid based RE-technologies and so the most competitive eligible renewable sources will be used by the retailers to meet the MMS obligation. More expensive emerging tech-nologies such as small wind or solar power will find it difficult to compete with established technologies such as grid based large wind or small hydro.
2. Two-tiered MMS: in this option retail suppliers would be required to purchase a certain quantity of electricity from eligible renewable energy as well as a certain quantity from de-centralised renewable energy technologies. For example, an obligation of 5 percent in 2005 for renewable energy. Tier 1 would include grid-based technologies and Tier 2 would in-clude decentralised eligible technologies. 5 percent of the MMS obligation must come from Tier 2 and hence a separate DRE market will be created from the competition between grid based renewable sources and off-grid systems.
3. Multiple tiered MMS: the MMS target is divided over a number of smaller targets for spe-cific DRE-technologies. This design option will result in the creation of multiple independ-ent markets, each market with its own obligation.
The two tiered and multiple tiered MMS aim to support specific DRE technologies but at the same time will increase the administrative complexity of the MMS system. To overcome this disadvantage, in this study these two MMS design options are put into effect by applying a mul-tiplier to the number of certificates issued for electricity produced by DRE-systems. For exam-ple, a multiplier value of 10 for small wind technologies means that the production of 1 MWh from small wind is worth 10 certificates while the production of 1 MWh from grid based RE is worth only 1 certificate. Throughout this report the price for green certificates generated by grid connected RE technologies is taken from (Meier, 2002) and assumed to be RMB 0.039/kWh.
1.3.2 Selection of target province
Because of limited resources, the analysis presented in this report focuses on the province of Si-chuan and these results have been , in as far as possible, extrapolated to the national level by way of an extrapolation method taking into account the variations in income level, electrifica-tion rate, renewable energy resources and technology costs, for the different provinces. A suitable province was selected using the following criteria:
• the province should be reasonably representative of the country as a whole,
• it should be rich in renewable sources,
• it should have a relatively low electrification rate,
• data necessary for the study should be available,
• there should be support from the provincial government. Based on a few indicators, such as per capita income and renewable energy resources, the first selection round resulted in four candidate provinces: Hubei, Gansu, Xinjiang and Sichuan. The main indicators for these provinces are given in the table below.

ECN-C--03-089 17
Table 1.1 Basic indicators of candidate provinces
Indicator Hubei Gansu Xinjiang Sichuan
Population [1,000s, 1999] 59,380 25,430 17,740 85,500 GDP per capita [US$/capita, 1998] 782 431 795 523 Rural poverty incidence2 [%, 1996]a 2.7 22.7 27.4 7.0 Unelectrified population [1,000] a 1,510 3,275 1,463 9,547 Unelectrified households [1000s] a 370 697 300 2,638 Villages not connected to the grid [%, GTZ, 2000] 23.0 11.2 18.6 0.2 PV potentialb,c 2,100-2,300 2,800-3,300 2,500-2,900 1,400-1,500 Wind potentialc Excellent/Poor Good/Limited Good/Limited Limited Hydro potential (locations)c Many Few Few Many a. Source: World Bank. b. Insolation duration (hours per annum). c. Source: GTZ: Renewable Energies, simply fitting human needs; exploiting the potential for social and economic
development in rural areas of the People’s Republic of China. It was decided to focus the analysis on the province of Sichuan for the following reasons:
• Hubei does not belong to the group of Western Provinces and is, therefore, not a good can-didate province.
• Gansu is a good candidate province based on its renewable resource potential and low con-nection rate. However, because it is one of the poorest provinces in China statistics from it cannot be simply extrapolated to the country as a whole, particularly since the capacity of local officials in Gansu seems to be low in comparison with other provinces. This adds a barrier that is not relevant for other provinces. Furthermore, experiences in Gansu with local PV companies are poor.
• Xinjiang is a good candidate province in terms of renewable resource potential and low con-nection rates but because of long distances and poor road infrastructure travel within Xinji-ang to obtain information would be time-consuming and expensive.
• Sichuan is the leading province among the Western provinces. In particular, in the western and northern parts of Sichuan the connection rate is low and there is a good potential for PV and mini-hydro.
1.3.3 Definition of Decentralised Renewable Electricity Systems
In a vast country like China the electrical grid network does not consists of a single grid but comprises a number of independent regional/provincial grids. This makes it less clear exactly when an electricity system is connected to the grid and when it should be defined as a decentral-ised system. A clear definition of a decentralised system is therefore required. In this study decentralised renewable electricity systems are defined as those systems, which are not connected to the State Power System. The State Power System comprises the following physical grid structure:
• five regional electric grids
• one interconnected grid
• eight independent provincial grids
• three independent grids of autonomous regions
• one city independent grid.
2 Rural poverty incidence relates poverty among Chinese rural citizens to the total rural population. Following
Chinese practice, we consider people with a rural household registration (hukou) as ‘rural’, even though they may actually live in urban areas. Households with per capita income below the national (bu wenbao) poverty line are considered ‘poor’. This is a very austere definition of poverty: the bu wenbao poverty line is based on the cost of necessary consumption items: (1) food, 2100 calories; and (2) non-food items. These costs are subsequently summed. This corresponds to about 0.66 US$/capita income per day in purchasing power parity terms, whereas internationally the most often used poverty lines correspond to 1 and 2 US$/capita expenditure per day.

18 ECN-C--03-089
The five regional electric grids are (the provinces and regions they comprise are listed between brackets):
• Northern China (Beijing, Tianjin, Hebei, Shanxi, western Inner Mongolia)
• North-eastern China (Lioaning, Jilin, Heilongjiang, eastern Inner Mongolia)
• North-western China (Shaanxi, Gansu, Qinghai, Ningxia Autonomous Region)
• Central China (Henan, Hubei, Hunan, Jiangxi)
• Eastern China (Shanghai, Jiansu, Zhejiang, Anhui). The interconnected grid is the Southern Interconnected Grid that comprises the independent provincial grids of the Guangdong, Guangxi, Guizhou, and Yunnan provinces. The South Elec-tric Power Interconnected Company, which also manages the interconnection, is not a complete and physically independent grid but a co-operative union for inter-province electricity transmis-sion. It optimises the operation of thermal and hydropower plants and transmission from hydro-power sources in the west to the eastern consumption centres. Each province has its own independent grid. Operation and management of these grids is usu-ally co-ordinated by a Regional Electric Power Bureau that manages the regional electric grid. However, eight independent provincial grids, and the grids of three autonomous regions plus one city do not fall under a regional electric grid. There is no completed distribution system across Tibet. The independent provincial grids are:
• Shangdong
• Sichuan
• Fujian
• Chongquing
• Hainan
• Guangdong
• Yunnan
• Guizhou. The independent grids of the autonomous regions are:
• Guangxi
• Xizang (Tibet)
• Xinjiang. The independent city grid is:
• Hong Kong. All systems not connected to one of the above electrical grids are defined in this study as ‘de-centralised’.
1.3.4 Selection of technologies
The procedure for the selection of decentralised renewable electricity technologies that could potentially be included into the MMS consisted of three steps: Firstly, a list of all decentralised renewable electricity technologies that are currently used in China has been drawn up (see Appendix A). Secondly, these technologies are grouped into three main categories: stand alone systems for household application, stand alone systems for com-mercial application and mini-grids. Finally, these three categories were further grouped into DRE systems that are not metered and DRE systems that do have an electricity meter. The full list of technologies as presented in Appendix A is relevant for determining the kWh production of a system (as explained in Chapter 4, the size of the systems is part of the proce-

ECN-C--03-089 19
dure developed to determine the kWh production). The definition of the three categories is rele-vant for determining the poverty impact of inclusion into MMS, which may differ for household applications and commercial applications. Finally, the distinction between metered and non-metered electricity is important for the development of monitoring procedures for the system performance. If DRE systems are metered, separate procedures for monitoring the system per-formance are not needed. Table 1.2 presents an overview of the various categories of decentral-ised electricity technologies. Table 1.2 Categorisation of decentralised electricity technologies in China
Not metered Metered
Individual household systems
Commercial stand-alone (incl. Water pumping)
Mini-grids
PV 10 - 200 Wp 200 - 2000 Wp 5 - 100 kW PV - Wind hybrid system 100 W wind/50 W PV
300 W wind/100/200 W PV
Up to 500 kW (2/3 wind-1/3 PV)
Mini-hydro* < 10 kW Variable Wind 50 - 300 W 500 W - 10 kW * Mini-hydro is defined as installations in the range of .1-10kW. This definition is taken from (Zhang Zhengmin et
al).
1.3.5 Potential market for decentralised renewable electricity technologies
To determine the impact of including DRE-systems into the MMS on the uptake of DRE sys-tems it is necessary to know the potential size of the two market segments: 1. Market segment I : DRE systems that are not metered, and 2. Market segment II: DRE systems that are metered. An assessment of market segment I requires an estimation of:
• The number of households not yet electrified; these households could potentially purchase a renewable energy stand-alone system.
• The number of households which already have a system but with low capacity or poor per-formance; these households could potentially replace the existing system by a new system.
An assessment of market segment II requires an estimation of:
• The number of new mini-grids that could be constructed up to 2010. Table 1.3 provides information on the number of households without electricity and the avail-able renewable energy source by province.

20 ECN-C--03-089
Table 1.3 RE resource distribution and technology combination in China
Available RE Resources Province
Households without Electricity Wind Energy Solar Energy
3 Mini-hydropower Technology combination
Yunnan 1,200,000 Poor region A Very rich Photovoltaic/Mini-hydro Sichuan 1,180,000 Poor region E Very rich Mini-hydro Gansu 696,718 North: Rich
Other: Poor North: region A
Central: region B Southeast: region C
Poor Wind/Photovoltaic
Inner Mongolia
535,608 Very Rich South: region B Poor Wind/Photovoltaic
Shanxi 511,950 Poor Region C Poor Photovoltaic/Mini-hydro Tibet 454,200 Rich Region A Rich Photovoltaic/Wind Guangxi 440,000 Poor Region D Very rich Mini-hydro Xinjiang 300,416 Rich South: region A
North: region C Poor Wind/Photovoltaic
Chongqing 190,000 Poor Region E Very rich Mini-hydro Guizhou 164,325 Poor Region E Very rich Mini-hydro Ningxia 54,501 Rich South: region A Poor Photovoltaic/Wind Qinghai 22,740 Rich East: region B Rich Wind/Photovoltaic Total 5,750,458 Sources: 1 State Electricity Power Company: The Department of Hydropower Electricity and New Energy Develop-
ment; 2.China Statistics Yearbook: 2000 Up to the present time, some 300,000 solar home systems aggregating to a total 6 MWp capacity have been installed in China. It is assumed that a PV system supplies one single household. An estimation of the potential for market segment 1 for PV by province is based on the number of unelectrified households and on the available solar energy resources. At present there are more than 146,000 mini-hydro units installed in China supplying electricity to some 700,000 households. This means that on average each mini-hydro system supplies elec-tricity to some 5 households. An estimation of the potential market for mini-hydro systems is based on the number of unelectrified households and the water availability. Because of the poor quality of the mini-hydro systems installed before the introduction of the new standards, all ex-isting mini-hydro systems need to be replaced by the year 2010. Some 170,000 small wind turbines are currently operational in China (150,000 installations in Inner Mongolia). Because these systems are small (300-500 W) it is assumed that each system supplies electricity to only one household. The market potentials for each technology (for sizes of each technology see Table 2.1) is given in Table 1.4. Table 1.4 Currently installed and potential market for new DRE systems in Sichuan
Market segment Currently installed systems in Sichuan PV Wind Mini-Hydro
Stand alone systems 20,000 8,000 Mini-grids 50 villages None
Potential market for new systems in Sichuan PV Wind Mini-hydro
Unelectrified hsh 118,000 226,000 Replacement 5,000 8,000 New mini grids 2,000 (10 MWp) none
3 Classified as regions (A is best; E is poor) based on prevalent solar insolation levels in Appendix B
ECN-C--03-089 21
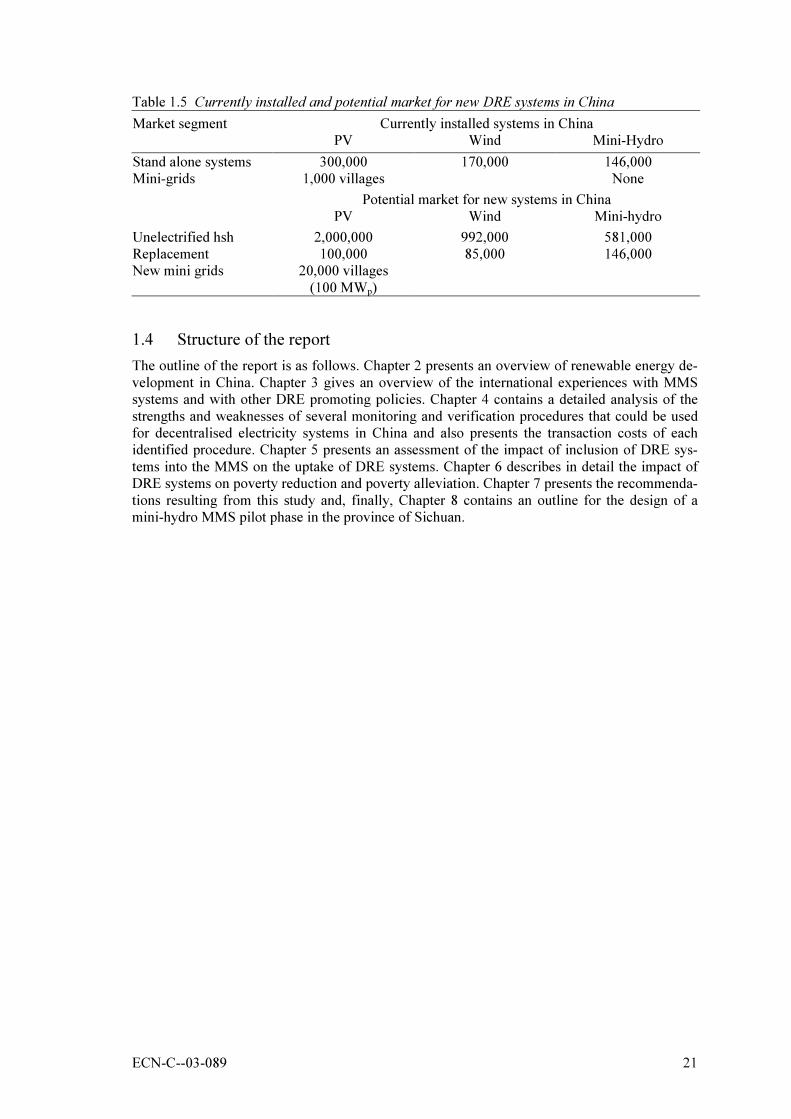
Table 1.5 Currently installed and potential market for new DRE systems in China
Market segment Currently installed systems in China PV Wind Mini-Hydro
Stand alone systems 300,000 170,000 146,000 Mini-grids 1,000 villages None
Potential market for new systems in China PV Wind Mini-hydro
Unelectrified hsh 2,000,000 992,000 581,000 Replacement 100,000 85,000 146,000 New mini grids 20,000 villages
(100 MWp)
1.4 Structure of the report
The outline of the report is as follows. Chapter 2 presents an overview of renewable energy de-velopment in China. Chapter 3 gives an overview of the international experiences with MMS systems and with other DRE promoting policies. Chapter 4 contains a detailed analysis of the strengths and weaknesses of several monitoring and verification procedures that could be used for decentralised electricity systems in China and also presents the transaction costs of each identified procedure. Chapter 5 presents an assessment of the impact of inclusion of DRE sys-tems into the MMS on the uptake of DRE systems. Chapter 6 describes in detail the impact of DRE systems on poverty reduction and poverty alleviation. Chapter 7 presents the recommenda-tions resulting from this study and, finally, Chapter 8 contains an outline for the design of a mini-hydro MMS pilot phase in the province of Sichuan.

22 ECN-C--03-089
2. RENEWABLE ENERGY DEVELOPMENT IN CHINA
2.1 Background
China is one of the few countries in the world where coal is the dominant energy source. A na-tion wide survey conducted by the Ministry of Geography and Mineral Production and the Min-istry of the Coal Industry estimated total exploitable coal reserves of approximately 700 billion tons. The proven exploitable reserves reached 114 billion tons by 1998. However, nearly two-thirds of this coal reserve lies in the North and North Western part of China, whilst the growing demand is in the economic areas in the south and east. In 1999 total primary energy consumption amounted to 1,220 Mtce. Coal accounted for some 67%, petroleum for 23%, natural gas 3% and hydro power 7%. The combustion of huge amounts of coal heavily reduces the air quality in large cities, especially in Northern China where the air pollution is becoming more serious in the winter season due to space heating fu-elled by coal. The environmental pollution and the global environmental impact of its CO2 emissions are the major constraint factors for sustainable development in China. To combat environmental pollution caused by the combustion of coal and to pursue sustainable development of the energy sector, the promotion of renewable energy became one of the key components of the Chinese government’s energy policy during the 1990s. Following the UN Conference on Environment and Development, held in Rio de Janeiro in 1992, the Chinese gov-ernment published the China Agenda 21 and in March 1994 prepared the ‘Ten Countermeasures for improving the Environment and Development’. Both documents emphasise the importance of renewable energy in achieving sustainable development. It is recognised in China that the promotion of renewable energy does not only generate positive effects on the environment, but has other benefits as well, such as:
• diversification of the energy mix,
• creation of local employment,
• health improvements,
• regional development, especially in remote areas,
• development of a dynamic and innovative clean technology industry,
• expansion of access to modern energy in remote areas to improve the livelihoods of the poor.
The last bullet refers to the role renewable energy can play in providing electricity to remote poor areas in China, which have no access to electricity and are not likely to be connected to the grid in the foreseeable future because of their remote location. For those areas, decentralised electricity systems based on locally available renewable energy sources could be a means to provide electricity and thus to improve the quality of the local inhabitants. The reasons for the promotion of renewable energy therefore are different for grid connected technologies and de-centralised systems. This provides an important argument for applying a two tiered MMS (see Section 1.3.1) taking into account the fact that the benefits derived from DRE-systems are dif-ferent from grid connected RE technologies. China is richly endowed with renewable energy resources. However, so far only a small fraction of the exploitable renewable energy potential has been tapped. In 1998, renewable energies con-tributed about 5.8% to total electricity production in China, provided mainly by small hydro power plants (approximately 65.3 TWh). The current use of wind, solar, biomass and geother-mal as a source for electricity production is very limited although large potentials have been
ECN-C--03-089 23
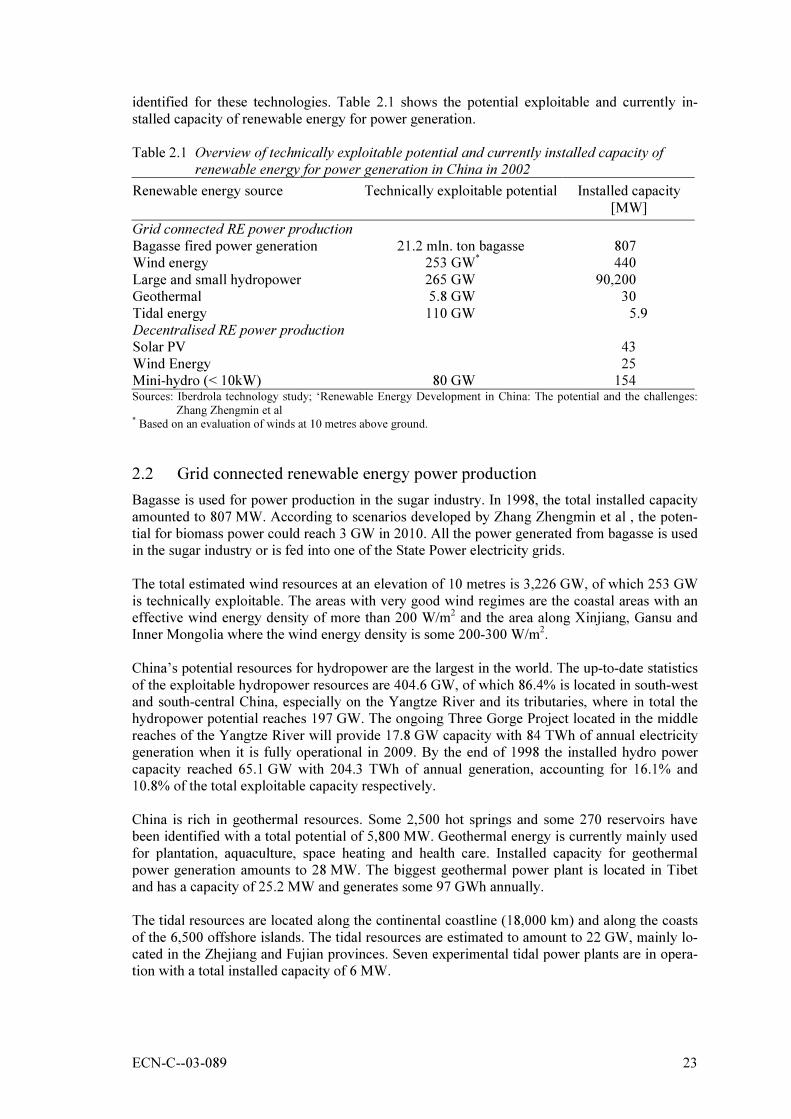
identified for these technologies. Table 2.1 shows the potential exploitable and currently in-stalled capacity of renewable energy for power generation. Table 2.1 Overview of technically exploitable potential and currently installed capacity of
renewable energy for power generation in China in 2002
Renewable energy source Technically exploitable potential Installed capacity [MW]
Grid connected RE power production Bagasse fired power generation 21.2 mln. ton bagasse 807 Wind energy 253 GW* 440 Large and small hydropower 265 GW 90,200 Geothermal 5.8 GW 30 Tidal energy 110 GW 5.9 Decentralised RE power production Solar PV 43 Wind Energy 25 Mini-hydro (< 10kW) 80 GW 154 Sources: Iberdrola technology study; ‘Renewable Energy Development in China: The potential and the challenges:
Zhang Zhengmin et al * Based on an evaluation of winds at 10 metres above ground.
2.2 Grid connected renewable energy power production
Bagasse is used for power production in the sugar industry. In 1998, the total installed capacity amounted to 807 MW. According to scenarios developed by Zhang Zhengmin et al , the poten-tial for biomass power could reach 3 GW in 2010. All the power generated from bagasse is used in the sugar industry or is fed into one of the State Power electricity grids. The total estimated wind resources at an elevation of 10 metres is 3,226 GW, of which 253 GW is technically exploitable. The areas with very good wind regimes are the coastal areas with an effective wind energy density of more than 200 W/m2 and the area along Xinjiang, Gansu and Inner Mongolia where the wind energy density is some 200-300 W/m2. China’s potential resources for hydropower are the largest in the world. The up-to-date statistics of the exploitable hydropower resources are 404.6 GW, of which 86.4% is located in south-west and south-central China, especially on the Yangtze River and its tributaries, where in total the hydropower potential reaches 197 GW. The ongoing Three Gorge Project located in the middle reaches of the Yangtze River will provide 17.8 GW capacity with 84 TWh of annual electricity generation when it is fully operational in 2009. By the end of 1998 the installed hydro power capacity reached 65.1 GW with 204.3 TWh of annual generation, accounting for 16.1% and 10.8% of the total exploitable capacity respectively. China is rich in geothermal resources. Some 2,500 hot springs and some 270 reservoirs have been identified with a total potential of 5,800 MW. Geothermal energy is currently mainly used for plantation, aquaculture, space heating and health care. Installed capacity for geothermal power generation amounts to 28 MW. The biggest geothermal power plant is located in Tibet and has a capacity of 25.2 MW and generates some 97 GWh annually. The tidal resources are located along the continental coastline (18,000 km) and along the coasts of the 6,500 offshore islands. The tidal resources are estimated to amount to 22 GW, mainly lo-cated in the Zhejiang and Fujian provinces. Seven experimental tidal power plants are in opera-tion with a total installed capacity of 6 MW.

24 ECN-C--03-089
2.3 Decentralised renewable energy power production
2.3.1 Solar Photovoltaic
Solar Resources The solar resources map of China distinguishes five broad regions:
1. Best: daily irradiation is more than 5.1 kWh/m2. 2. Good: daily insulation is in the range 4.5-5.1 kWh/m2. 3. General: daily insulation is in the range 3.8-4.5 kWh/m2. 4. Moderate: daily insulation is in the range of 3.2-3.8 kWh/m2. 5. Poor: daily insulation is less than 3.2 kWh/m2.
The solar resources map of China by region is given in Appendix B.
Historical overview of the development of solar photovoltaic in China China started to research solar cells in 1958 and in 1971 its first application was for powering satellites. Before 1980, the PV industry in China was very small and the annual production amounted to less than 10 kW. The cost of PV was very high which seriously hampered the de-velopment of the PV market. During the 6th (1981-1985) and 7th (1986-1990) national five-year R&D plans, the Chinese government started to provide financial support to the PV industry and PV market development. Several PV production lines were imported from abroad during that period and various PV demonstration projects were installed, such as: solar powered microwave relay stations, army communication systems, cathodic protection for sluice gates and oil pipe-lines, countryside telephone exchanges, PV village power systems and solar home systems. By the end of 1990, the annual PV production had reached 0.5 MW and the selling price of solar modules had fallen from RMB 80/Wp in 1986 to about RMB 40/Wp in 1990. Lower cost stimu-lates the PV market growth not only for small power supply applications, but also in industry and for rural electrification. PV has been included in the national R&D plans, and has also been included in some important government programmes such as:
• the NDRC Brightness Programme,
• the Tibet ‘Sunshine Project’,
• the Arli Solar PV Project,
• the forest fire warning system,
• the optical-fiber communication programme of the Ministry of Post and Telecommunica-tion,
• the oil pipeline cathodic protection system of the Ministry of Oil,
• the rural TV covering Programme of Ministry of TV and Broadcasting. By 2001, the annual PV production in China reached a level of 4.5 MWp and the installed PV capacity was more than 23 MWp. In 2002, the production of PV modules increased sharply to about 20 MWp due to the ‘Township Village Power Project’ launched by NDRC. Today, PV is a mature and proven technology in China and in many cases is also cost effective. As a rule of thumb, PV is economic compared to grid extension when the ratio of the required power and the distance from the grid is less than 100 W/km. This means that PV is often the most cost-effective solution to provide electricity to remote areas in China. An historical over-view of annual production, module prices and installed capacity of PV in China is presented in Appendix C.
Current status and future prospects Before 2002, the largest PV market in China was communication (approximately 50% of all ap-plications), including microwave relay stations, satellite TV stations, rural telephone systems and army communication systems. However, the focus of national R&D programmes has

ECN-C--03-089 25
changed towards rural electrification, and with the support of government programmes and in-ternational programmes the share of rural electrification has gone up from 20% in 1993 to nearly 80% in 2002. These programmes include:
• The 9th national R&D plan
• Brightness Program of NDRC
• Tibet ‘Sunshine Project’
• Arli Solar PV Project
• GEF/World Bank PV Commercialisation project
• UNDP Renewable Energy Village Power Project
• NEDO of Japan Solar School Project
• Shell Solar Silk Road Brightness project
• US DOE Gansu and Inner-Mongolia projects
• 2002 PV Township Village Power Project. The above programmes have greatly supported Chinese PV applications. At present, 1,000 vil-lage PV power systems with 18,000 kWp and 300,000 stand alone solar home systems have been installed. Industrial applications and commercial products constitute 10% of the PV mar-ket. The industrial applications include forest fire warning systems, signal systems for rail and highway, oil pipeline cathodic protection systems for the Ministry of Oil, rural TV covering the Programme of the Ministry of TV and Broadcasting. The commercial products include street-lighting, solar boats, solar clocks, solar yard lanterns, solar watches and toys. Table 2.2 presents a breakdown of annual PV sales in communications, rural electrification and others. Table 2.2 Breakdown of annual PV sales by application
Quantity of PV sold in China
[kWp]
Communication/ Industry [kWp]
Rural electrification
[kWp]
Others
[kWp]
1993 and before 3,880 3,000 800 80 1994 1,200 1,000 100 100 1995 1,550 1,200 250 100 1996 2,170 1,500 470 200 1997 2,300 1,600 500 200 1998 2,300 1,500 600 200 1999 2,700 1,800 700 200 2000 3,300 2,000 1,000 300 2001 4,500 2,000 2,000 500 2002 20,000 2,000 17,500 500 * Estimate. It is expected that in the next few years PV will grow quickly because of the Village Power pro-ject launched by the Chinese Government. This programme aims to provide electricity to nearly 20,000 unelectrified villages in the Western Provinces (Tibet, Xinjiang, Qinghai, Gansu, Inner-Mongolia, Shaanxi, Sichuan) by means of PV and wind-PV hybrid systems.
The current prices for solar home systems and village systems are presented in Appendix D.
The MMS mechanism could generate additional revenues for PV and wind-PV hybrid systems according to the amount of kWh actually produced by these systems. Appendix E gives an esti-mation of the kWh production of the various PV systems:

26 ECN-C--03-089
Solar Photovoltaic in the province of Sichuan The solar resources in the province of Sichuan are good in the north-west and poor in the rest of the province. At present, some 20,000 solar home systems have been installed in Sichuan and some 50 villages are powered by PV (see Table 1.4 and Table 1.5). Based on the number of un-electrified households and the solar resources, the estimated potential in Sichuan for new PV systems is some 118,000 units. The Western and Northern parts of Sichuan are mountainous areas and are thus not easily acces-sible for the electricity grid. Because these areas are close to the provinces of Qinghai and Gansu most of the PV systems used in Sichuan are actually sold by companies in Qinghai and in Gansu. There are only few PV companies in Sichuan. In 2002, 61 Townships were powered by PV through the China PV Township Village Power Project initiated by the NDRC. Table 2.3 Townships in Sichuan that received PV village power through the NDRC Village
Power Project
District No. of Townships Total PV Power
[kWp]
Ganzi 24 550 Arba 12 500
Liangshan 25 755
Sichuan Province
Total 61 1,805
2.3.2 Wind Energy
Wind resources The estimated exploitable wind resources in China amounts to some 253 GW but the installed capacity is only 440 MW, most of which is grid-connected. The areas with the highest wind po-tential are located along the south-east coast, along the coast of Guangdong province and on the islands. Areas with high wind potential are in the north-east, the middle north and northern part of north-west China. Roughly 50% of the land area of China has enough wind resources to be utilised.
Historical overview of the development of stand alone wind turbines in China The development of small wind technologies started in the early 1970s. After three decades of research, small wind technology has matured and currently there are some 28 manufacturers of stand alone wind turbines in China with a total capacity to produce some 20,000 wind systems each year. The main manufacturers are Inner Mongolia Shangdu herd mechanical company, In-ner Mongolia Huade New Technology company, Inner Mongolia Tianli wind mechanical fac-tory, Jiangsu Nanhang technology development company, Jiangsu jiangdu Shenzhou wind en-ergy generator factory (biggest manufacturer 8,230 systems produced in 2000) and Qingdao Fengneng Mechanical and electric Co. Ltd. Appendix D presents an overview of the main sys-tems used in China. In the early 1980s until mid 1990s, the 50 W system was the most commonly used system. In recent years the larger systems in the range of 150 W to 300 W have become more popular. The lifetime of these systems is more than 15 years and the batteries are the critical element.
Current situation and future prospects Some 176,000 small wind turbines are still operational in China with a total capacity of 16 MW. Most of these systems can be found in Inner Mongolia (150,000 units) and are used to supply electricity to nomadic people. The provincial government of Inner Mongolia has made funds available to provide electricity to the nomadic people and this has accelerated the use of stand-alone wind systems in this province. At the same time four large wind farms were constructed in

ECN-C--03-089 27
Inner Mongolia. Most nomadic people now have access to electricity, which has greatly im-proved their living conditions. The main markets for these systems are in the rural areas without electricity. At present, some 5.7 million Chinese households are still without electricity and in most areas the wind resources are sufficient for either stand alone systems or hybrid systems (wind/diesel or wind/pv) which is less expensive than grid extension. The export market of these systems is also slowly starting to develop but in general these systems are not yet competitive on the international market. So far some 2,000 systems have been exported to America, Greece, Belgium Sweden, Japan and Indo-nesia. Table 2.4 presents the sales of stand-alone wind generators over the period 1984 to 2001. Table 2.4 Stand-alone wind generator sales statistics between 1984 to 2001
Year Before 1984 1984 1985 1986 1987 1988 1989 1990 1991 1992
Sales (sets) 3632 13470 12989 19151 20847 25575 16649 7458 4988 5537
Year 1993 1994 1995 1996 1997 1998 1999 2000 2001 Total
Sales (sets) 6100 6481 8190 7500 6123 13884 7096 12170 20879 219219
The system lifetime is more than 15 years and as is the case with SHS, batteries are the critical element. Over the past few years, several joint ventures have been set up with foreign wind manufactur-ers to acquire new technologies. For example, the Inner Mongolia Huade New Technology Co. set up a joint venture with the German company WENUS and introduced the 5 kW system of which some 20 systems have been installed successfully in the provinces of Xinjiang, Inner Mongolia and Guangdong. The main barriers for further development of stand-alone wind technology are:
• The current quality standards are not internationally competitive. Although these standards meet the requirements in China they constitute barrier for exporting systems.
• China is not able to mass-produce 10 kW systems.
• In China most end users of small wind turbines use lead-acid batteries, which will often be overcharged because of the discontinuity of wind availability. This heavily affects the life-time of the batteries.
• At present most applications are limited to lighting and other small appliances.
• There is no tax exemption or other financial incentives for wind energy.
Wind in the province of Sichuan Wind resources in Sichuan are generally very limited. However, in the Western part of the prov-ince, which is one of the target areas for DRE application, the wind resources are good for small wind turbine installations. There are about 200 to 300 sets of small wind turbine installed for household power supply in the Ganzi and Aba regions. The potential use of small wind turbines depends mainly on the hybrid-system because the winds mostly blow in winter and solar sys-tems are only available in summer.
2.3.3 Small/Mini-hydro
Small hydro resources The estimated exploitable small hydro (system size in the range of 10 kW - 25 MW) potential in China amounts to 75 GW. In 1998, the installed capacity of small hydropower amounted to

28 ECN-C--03-089
25 W. Because the development and construction of small hydro power stations is important in promoting rural electrification the national and provincial governments provide loans with fa-vourable terms for their construction. The average electricity price of small hydropower is RMB 0.32/kWh. There is a large small hydro potential still untapped. According to scenarios developed by Zhang Zhengmin et al, the installed capacity of small hydro may increase to 35 GW by 2010. At present, some 780 counties (36% of total) receive their electricity mainly from small hydro power stations. In the past, most of these small hydro systems were isolated systems and not connected to any grid network. However, to improve the reliability and quality of the electricity supply the na-tional and local governments in the 1990s have put much effort into connecting these isolated systems to the local or national power system. Today, most of the hydro systems (more than 90%) with a capacity above 10 kW are connected directly or indirectly to the State Power Sys-tem and by 2010 (the future year used for the analysis) the amount of small hydro not connected to the grid will be negligible. Therefore, for the analysis presented in this report all hydro sys-tems with a capacity above 10 kW have been assumed to be part of the grid connected MMS and thus have been excluded.
Mini-hydro resources Over the past years China also experienced a rapid development of mini-hydropower (capacity size less than 10 kW). The potential resources are estimated at 80 GW, mainly in the hilly areas in South China. At present there are more than 146,000 units in operation with a total installed capacity of 154 MW supplying electricity to some 700,000 households. According to the Minis-try of Agriculture, total installed capacity of mini-hydro is likely to reach 6.4 GW4 by 2010. Table 2.5 shows the most common system types. Table 2.5 Generation hours and kWh production for various types of mini-hydro installations
System type Annual generation hours Annual generation [kWh]
Device
<1 kW 1,300 1,300 Supplies 1-3 households 1-5 kW 1,500 7,500 Supplies 3-10 households 5-10 kW 1,800 18,000 Village or household group > 10 kW Connected to the grid
Mini-hydro in the province of Sichuan Sichuan province is one of the provinces in China with a relatively large amount of mini-hydropower. The first mini-hydro installations were installed in the 1980s and had an average capacity of 1,000 W per system. The total number of systems installed in that period is esti-mated to be around 13,400 for 54,000 people (roughly 10,000 households). The electricity ser-vices were mostly used for lighting. The government provided some subsidy to assist farmers in meeting the investment requirements. Around 80% of the systems are thought to have benefited from government assistance. The price of a system was around RMB 1,000 for a 1 kW system. After 1995 the subsidies were reduced. In 2002, the province of Sichuan through the Agriculture Machinery Bureau (AMB) began an ambitious programme to improve the operations of mini-hydro systems. Of the 13,400 systems, which were installed before 1992 only 8,000 are still in operation. The aim of the AMB is to re-pair and maintain some 6,000 systems (costs 1 mln RMB) and to install some 3,000 to 4,000 new systems in the range of 3 - 7 kW. The new price of a system is ranging around
4 Forecast obtained from Zhang Zhengmin et al, page 24, seems very optimistic and would imply an average
annual increase in installed mini-hydro capacity of some 625 MW per year over the period 1990 to 2010.

ECN-C--03-089 29
RMB 5,000/kW. The price increase is mainly due to the enforcement of new technical standards (introduced in 1998). The two main aspects of the mini-hydro model developed by the Agricultural Machinery Bu-reau are: 1. To improve the quality of the system by introducing technical standards (50 hertz, 200 -
240 V.) and to ensure that the manufacturers adhere to these standards. Systems will be sub-jected to tests in government test laboratories.
2. To set up a technical service network through the AMB offices in the counties. The AMB keeps a database of households connected to a mini-hydro system and they also have a tele-phone line based service where for example end-users can call if their system breaks down.
To finance the new programme, the Sichuan province will provide a subsidy of RMB 7.6 mln and another RMB 7 mln is expected from prefectures and counties. There is still a large short-age to fund the ambitions of the AMB which are estimated to cost RMB 120 mln over a period of two years. The AMB has indicated that funding is a major problem and they need sustainable funding. Commercialisation of the technology to its target group does not in itself help, but long term funding is required. If mini-hydro is included in the MMS, the additional revenues through the sales of green certificates could be used for this purpose.
2.4 Overview of renewable energy policies in China
This section presents an overview of the policies on renewable energy adopted by the Chinese government.
2.4.1 Renewable Energy Policy Framework
Policies on renewable energy development can be categorised into three types in terms of their scope and characteristics: 1. First level policies provide general direction and guidance. 2. Second level policies specify specific goals/objectives and development plans. 3. Third level policies consist of practical and specific incentives and managerial guidelines. The first level policies include the speeches of state leaders about development of renewable en-ergy, and the Chinese government’s point of view on the global environment. The following documents have outlined the major policies of this level over the past 20 years: 1983 Suggestions to Reinforce the Development of Rural Energy. 1990 ‘China Agenda 21’. 1992 ‘Ten Strategies’ on China’s Environment and Development. 1995 State Science and Technology Commission (SSTC) Blue Paper No. 4: China Energy
Technology Policy. 1995 ‘Outline on New and Renewable Energy Development in China’ by the State Planning
Commission (SPC), SSTC, State Economic and Trade Commission (SETC). 1995 Electric Power Law. 1996 ‘Guideline for the Ninth Five-Year Plan and 2010: Long-term Objectives on Economic
and Social Development of China’. 1996 State Energy Technology Policy. 1997 Energy Saving Law. 2000 Atmospheric Protection Act (revised version).

30 ECN-C--03-089
The second level policies include the following documents: 1994 ‘Brightness Programme’ and ‘Ride the Wind Programme’ formulated by SPC. 1995 ‘New and Renewable Energy Development Projects in Priority (1996-2010) China’ by
SSTC, SPC and SETC. 1996 ‘Ninth Five-Year Plan and 2010 Plan of Energy Conservation and New Energy
Development’ by SPC. 1996 ‘Ninth Five-Year Plan of Industrialisation of New and Renewable Energy’ by SETC. 1998 ‘Incentive Polices for Renewable Energy Technologies Localisation’ by the NDRC
and Ministry of Science and Technology (MOST). 2001 Tenth Five Year Plan for New and Renewable Energy Commercialisation Develop-
ment by SETC. In addition, a series of documents on development plans, policies and programmes have been issued by the Ministry of Electric Power (MOEP, now the State Power Corporation (SPC), the Ministry of Water Resources (MWR) and the Ministry of Agriculture (MoA) focusing on rural electrification, renewable energy based generation technologies, rural energy and wood for fuel. These attempt to standardise the various directions, focal points and objectives of RE develop-ment. Some departments have proposed concrete policies and regulations. All of these policies have played a very important role in promoting RE technologies in China. During the period 1999 to 2001, NDRC has conducted a study that aimed to contribute to the Renewable Energy 10th Five Year Plan. This study is particular relevant because in this study the introduction of an MMS for China is proposed to achieve environmental objectives. Al-though this study resulted in a discussion paper that is publicly available, this paper cannot be regarded as an official document and therefore does not reflect official government policy. The third level policies outline specific supporting measures for the development and utilisation of renewable energy. Compared to traditional energy, most renewable energy technologies are at their initial stages of development characterised by high capital cost, low production and low profit margin, although some technologies and industries, such as solar water heaters and wind farms are now developing quickly. Government support is very important for the initial com-mercialisation stage of renewable energy technologies. Under such circumstances, the policies of the third level are crucial to the realisation of the objective of renewable energy development. Since the mid 1990s, several provinces and autonomous regions of China have adopted some policies for the development of renewable energy, such as offering subsidies and reducing or remitting taxes. The following regulations have been issued by Central government in recent years:
• 1997, Circular from the SPC Communication and Energy Department on Issuing The Provi-sional Regulations on the Management of New Energy Capital Construction Projects.
• 1999, Circular from the MOST and NDRC on Further Supporting the Development of Re-newable Energy.
• 2001, Adjustment of Value Added Tax for Some Resource Comprehensive Utilisation Prod-ucts by the Ministry of Finance (MOF) and the State Tax Administration (STA).
• 2001, Electricity Facility Construction in Non-Electrified Townships in the Western Prov-inces of China on the Townships Electrification Programme from the NDRC and MOF.
The three policy levels are closely linked and support each other. Directions and guiding poli-cies included in the first level provide the foundation and environment to facilitate the imple-mentation of the other two, while the second level also serves as guideline for the third level. The third level policies ultimately realise what the other levels require. Generally speaking, the first two policy levels are set by the central government and its relevant departments, while the third level of policies is decided by local governments, including the provincial and municipal

ECN-C--03-089 31
governments as well as county governments. The central government may also issue some spe-cific third level policies and regulations when necessary.
2.4.2 Renewable Energy Policy Objectives
In 2001, the SETC proposed the Tenth Five Year Plan of Sustainable Development, which in-cluded the Tenth Five Year Plan for New and Renewable Energy Commercialisation Develop-ment. The main conclusions presented in this document are:
• The Implementation of sustainable development in China requires the rapid commercial de-velopment of new and renewable energies.
• The application of new and renewable energy is an important option for the implementation of strategy of the development in western region.
• Opportunities and challenges for the commercial development of new and renewable energy has followed from China joining the WTO.
The Tenth Five Year Plan contained a number of detailed targets for renewable energy to be reached by 2005:
• The utilisation of new and renewable energy (excluding small hydropower and traditional utilisation of biomass) will reach 13 Mtce, and this will lead to a reduction in CO2 emissions of some 10 Mt and a reduction in SO2 emissions by more than 0.6 Mt.
• Solve the power problem for 1.3 million families (about 5-6 million people) in remote areas, and provide employment for 200,000 jobs.
• Annual production of solar water heaters will reach 11 million m2, and the accumulative amount will be 64 million m2. There will be 5-10 large-scale enterprises with international competitive ability.
• The production capacity of solar cells will reach 15 MW, and the accumulative amount will be 53 MW. The PV industry will be set up.
• The installed capacity of grid-connected wind power will be 1.2 GW, and the manufacturing capacity will be 150-200 MW, basically to meet the domestic market demand.
• The areas of geothermal energy heating will be 20 million m2.
• The gas supply from the high efficiency utilisation of bio energy, including large and middle scale biogas utilisation from industrial organic waste water and farm waste, biomass gasifi-cation system etc., will approach 2 billion m3.
The key fields of renewable energy commercialisation are:
• Solar thermal utilisation.
• Wind power.
• High efficiency utilisation of biomass.
• Geothermal energy utilisation.
2.4.3 Government support for the promotion of renewable energy
Although at present there is no comprehensive financial incentive system for the development of renewable energy in China, government support has been provided for some time. From the 1950s to the 1960s, a special fund was allocated by the state to meet the demand for electricity by supporting the development of small hydro in rural areas through the construction of water conservation works. In the 1970s, subsidies were supplied to mitigate the shortage of electricity in rural areas and extend biogas, fuel wood and coal saving technologies. In the 1980s, with the reform of the rural economic system the demand for electricity increased continuously. To meet this demand the government reinforced the financial and economic support for the utilisation of small hydropower resources by increasing the amount of financial grants and loans, and by sup-plying a certain amount of subsidy. In the 1990s, with the emphasis on environmental protection and sustainable development, the government further reinforced its support for renewable en-

32 ECN-C--03-089
ergy. The technologies that received support included small hydropower, biogas and more effi-cient stoves to wind power, solar energy, including photovoltaic (PV) power and biomass utili-sation technologies. The types of support changed from supply subsidy to tax reduction or ex-emption, preferential price and credit guarantee, etc. These measures have contributed greatly to the renewable energy development in China. The major financial incentives currently available are as follows:
Subsidies provided at the central level Subsidies, which are provided by the central and local governments, are one of the most popular economic incentives for renewable energy development. The following are the major subsidy measures taken:
• Overhead: This mainly refers to the operating expenses and other expenses of renewable en-ergy managerial institutions in several commissions of the central government. There are about 100,000 staff at different levels for the management, R & D as well as training, equipment certification, inspection, etc for renewable energy development, especially for ru-ral energy application. Based on the 1998 salary level (RMB 15,000 per staff), the total ad-ministration cost was about RMB 1.5 billion, which was a significant subsidy for renewable energy development.
• R&D: through the NDRC and MOST the central government subsidises R&D on key re-newable energy technologies. For example, the MOST will provide funds of RMB 28 mil-lion for R&D on renewable energy during the Tenth Five-Year Plan period. MOST also supports R&D through two programme: 863 Program which aims at supporting the com-mercialisation of new technologies and 973 Program which aims to support the research of basic science. The fund for these two programmes during the Tenth Five Year Plan period is several hundred million RMB. In addition, SETC, MOF and MOA will subsidise demon-stration projects and training courses.
• Capital cost: The SETC Department of Resource Conservation and Utilisation (DORCU) provides low-interest loans, which come from the state budget. At present, DORCU pro-vides low-interest loans of 120.0 million RMB annually to support industrial development of renewable energy. The MWR provides low-interest loans of about 300.0 million RMB RMB for small hydropower development.
• Project: A programme entitled Electricity Facility Construction in Non-Electrification Townships in Western Provinces of China is now being implemented by NDRC, and it will run until 2003. The program aims to electrify 800 townships in remote areas in 7 provinces of Xinjiang, Qinghai, Gansu, Inner Mongolia, Shaanxi, Sichuan, and Tibet by using PV, Wind or PV/Wind hybrid systems. The total investment is around 2 billion RMB with nearly half of the grant allocated to Tibet. This recent programme is a large-scale project of direct subsidy to renewable energy (for information refer to NDRC 800 Townships Electrification Programme).
Taxation measures Based on collection and distribution rights, tax can be classified as central government tax, local Government tax and shared tax. Following the implementation of the new tax sharing system introduced in January 1994, taxation in China can be classified as shown in Table 2.6. Table 2.6 Classification of taxation in China
Items VAT [%]
VAAT (Value-added annex tax) [% of VAT]
Income Tax [%]
General 17 8 33 Hydropower 6 8 33 Biogas 13 8 15 Wind* 8.5 8 15 * The VAT on wind power is newly established in September 2001.

ECN-C--03-089 33
It is evident that taxes on energy production from all renewable energy sources, except biogas and wind energy do not offer any specific incentives at the central government level to the de-velopment of renewable energy technology. Moreover, lowering the income tax rate on biogas to 15% (previously 33%) has no relevance, since most of the biogas projects are not profitable, and/or the benefit is very small, if not negative. VAT for small hydropower is 6%. In September 2000, the Ministry of Finance (MOF) and the State Tax Administration (STA) issued Adjust-ment of Value Added Tax for Some Resource Comprehensive Utilisation Products. According to this circular, the VAT for using municipal solid waste for power generation will firstly be collected and then repaid to manufacturers; and the VAT rate for wind power will be half the general rate. Reducing VAT on wind power to 8.5% (previously 17%) seems a significant change, although in practice some local governments had already adopted the lower rate to en-courage the development of wind energy (northeast grid), before the new rate was introduced. At present, this is the only favourable nationwide policy for renewable energy development. The new taxation in general has not offered enough support to promote renewable energy tech-nologies even though most renewable energy enterprises can also have a period of income tax exemption. Requests for income tax reduction or exemption for bio-energy development pro-jects are generally approved.
Custom duties To be consistent with the international market and with China joining the WTO, import customs duty in China has been adjusted several times, and the average duty has been decreased to 23%. Although there is no specific government document that clearly states low customs duty rates on renewable energy products, the main components of wind turbines, wind turbines themselves, and PV modules all enjoy favourable customs duty rates. In the 1980s and early 1990s, the applications to reduce or exempt customs duty on wind tur-bines and related equipment imported with international assistance were all approved so that the actual duties paid were very low. However, this policy may not be applied to all imported bio-energy equipment because customs duty exemption depends on whether the equipment is con-sidered high-tech. Some bio-energy equipment such as power generators for biogas is classified as high-tech and is therefore exempt from customs duty.
2.4.4 Overview of policies on renewable energy for selected provinces
Table 2.7 presents the major characteristics of the renewable energy policies in the provinces of Inner Mongolia, Xinjiang, Gansu and Qinghai.

34 ECN-C--03-089
Table 2.7 Summary of renewable energy policies in Inner Mongolia, Xinjiang, Gansu and
Qinghai
Inner Mongolia
Current Status
60 MW of large wind power generators, 18.5 MW of small wind power generation; household photovoltaic (PV) systems dominated by 10 -20 Wp.
Subsidy policies
RMB 25 million to users in 1986-90; RMB 200 for each 100 W wind power generator purchased or each 16 W PV unit. Annual subsidies of RMB 300,000 for R&D activities; Working capital provided by local authorities for establishment of extension station in 56 counties.
Taxation policies
3% VAT surtax on wind power generation; income tax relief for 2 years; RMB 10.69-14.43 for VAT surtax on PV units of 16 Wp-21.6 Wp.
Pricing policies
Tariff calculated on repayment of principal and interest. RMB 713/MWh including VAT in 1995 and RMB 609/MWh not including VAT; the difference is shared by grid and subscribers with 200 RMB/MWh by grid and rest by subscribers in the form of subsidies RMB 2.5/kWh.
Loan policies
RMB 400 million for wind power by State Economic and Trade Commission; Danish Government loans for wind power generation.
Other Land use policies: Land tax collected on the land actually occupied; 5 year income tax exemption for occupying arable land; 10 year land tax exemption for occupying the unused land.
Xinjiang
Current Status
90 MW of large wind power generation; 18000 household PV systems dominated by 10-20 Wp.
Subsidy policies
RMB 50-200 for PV unit and small wind power generation unit purchased; RMB 1 million for R&D; Working capital for extension stations; RMB 300 subsidies for PV users.
Taxation policies
2 year tax exemption, 3 year tax relief and 5 year 15% income tax for foreign investment or joint venture with an operational life of 10 years. VAT exemption for products export. Monthly collected VAT and surtax at 17% and 10% respectively. Seasonal collected income tax at 15-33%; Import tariff and VAT at 12% and 17% respectively, with duty free for international donation.
Pricing policies
Tariff calculated on repayment of principal and interest. RMB 698/MWh including VAT in 1995. The regular grid tariff is RMB 118/MWh in the area ; The difference is shared by grid and subscribers. The added 2 cents/kWh with 0.5 cent for difference with rest borne by grid.
Gansu
Current Status
50,000 household PV units mainly of 20 Wp
Subsidy policies
RMB 300 for each PV unit purchased; Subsidies for R&D; Support for extension station
Taxation policies
Policies similar to that of Xinjiang for taxation on PV system except for monthly collected value added tax on non donated PV systems.
Loan policies
A loan with interest rate at 3% government for household PV system subsidised from an additional tariff of RMB 3/MWh and 20% interest subsidised from the financial budget.
Qinghai
Current Status
55000 solar PV household systems and in more than 5 villages PV stations of 23 kW
Subsidy policies
RMB 300 for each PV unit purchased; RMB 500,000 for R&D; Working capital for extension stations
Pricing policies
Addition tariff RMB 2/MWh, with some of the revenues used to finance installation PV system

ECN-C--03-089 35
2.5 Ongoing renewable energy programmes in China
Several projects/programmes to promote the use of renewable energy technologies are now be-ing implemented in China. These programmes are funded by different donor organisations and all have their own objectives. An overview is presented below.
The silk route brightness programme (Shell) The project is supported by a grant to Shell Solar from the Government of Netherlands (ORET subsidy programme), covering 60% of the total investment costs. It aims to support 78,000 solar home systems in Xinjiang province. Each unit will be 25 or 50 Wp. Shell Solar will provide the PV modules from its factory in the Netherlands. The balance of System components that meet Shell Solar specifications will be sourced from Chinese suppliers. The manufacturers’ suggested retail price (MSRP) of a 25 Wp unit is 1,000 RMB, about 40% below market price. The China Government sponsor for this project is NDRC. The local company implementing the project is SunOasis, which is also a participating PV company in REDP. SunOasis will use its sales net-work and independent agents to sell the systems in rural areas. Shell Solar will ship modules in batches of about 2,000. New module shipments are made only when certificates attesting the sales of prior batches of PV systems are provided by SunOasis. The Shell Solar agent in China will conduct random surveys of installations to verify that the installations have actually been made and that there is no ‘leakage’ of these subsidised modules into other procure-ments/projects.
KfW rural electrification programme The KfW rural electrification programme is a part of the German-Sino co-operation agreement. The programme will establish PV, wind, small hydro or hybrid systems in unelectrified areas in Xinjiang and Yunnan. For each province, a grant of 5.1 million Euro has been allocated. The total grant support from the Government of Germany is thus 10.2 million Euro. The consumer will be asked to pay 2 RMB per kWh to cover the maintenance cost. Implementa-tion of the programme has been delayed because several counties were not willing/able to pay the 2 RMB. The KfW procurement rules require that at least 50% of the systems come from Germany. The first tender has just been announced and, hopefully, the first systems will be in-stalled by November this year.
The NDRC new brightness programme For the 10th Five-Year Plan period, the State Council has allocated 400 million RMB to support the New Brightness Programme which will provide electricity using both household and village systems. The focus will be on Gansu, Qinghai, Inner Mongolia, Tibet and Xinjiang. Investments are expected to be covered by the users, local government grants, central government grants and foreign grants. So far, 783 townships have been electrified this year. Most projects are small hydro and PV, with only a few based on wind. In the second phase, the focus of the Programme will shift to-wards villages.

36 ECN-C--03-089
800 townships electrification programme The 800 Township Electrification Programme 2002-2003 (2 billion RMB) is being implemented by NDRC. The programme aims to electrify 800 townships in two years using PV, wind or PV/wind hybrid systems. A township is considered electrified when the government buildings are electrified. Half of the total grant is allocated to Tibet where it will cover 100% of the in-vestment cost. The allocation for Qinghai is 250 million RMB, covering 80% of the investment cost. The other provinces need to provide an amount equal to that provided by the State Council. The allocation for Xinjiang is 300 million RMB, while the rest (450 million RMB) is available for Gansu, Inner Mongolia, Sichuan and Shannxi. The total investment will thus be 2.8 billion RMB. The 800 township programme is being implemented in 7 provinces in western China: Tibet, Xinjiang, Qinghai, Gansu, Inner-Mongolia, Sichuan and Shannxi. The programme installed some 700 township village power systems in 2002 with 16.514 MWp of PV plus 839 kW wind power. In 2003 the programme aims to cover another 101 township villages and 434 SHS pow-ered by 3.13 MWp of PV. Some villages were removed from the initial programme because these villages already appeared to have power from grid extension or from hydropower. So the real number of the township villages in the programme is about 800 and the total capacity in-stalled is less than originally planned, about 18 MWp of PV and the same amount of wind ca-pacity.
Renewable energy development programme The State Economic and Trade Commission (SETC) is currently implementing the GEF/WB assisted China Renewable Energy Development Project. The project aims to use the state-of-the-art and cost-effective wind and PV technologies to supply electricity in an environmentally sustainable way and to provide modern energy to dispersed rural households and institutions. The REDP consists of 3 components: Wind, PV and Technology Improvement. The wind component began in 1997 but little progress has been made so far. Large wind pro-jects in Inner Mongolia and Shanghai did not materialise because the production cost for grid connected wind is much higher than coal based electricity production (70 RMB cents compared to 40 RMB cents) and because of the difficult procedures within the Chinese government. So far
only one small wind component (2 × 10 MW) in Shanghai is now being implemented mainly to promote the technology in locations with high public visibility. For the PV component a grant of 25 million US$ is available. The objective is to install 10 MW of solar home systems over the next five years in six provinces. A direct grant of US$ 1.5 per
Wp will be provided to PV system companies to assist them to market, sell and maintain the PV
systems. The price of a 10 Wp SHS system in Qinghai is RMB 800. In other provinces the price
is a little higher. The size of the systems ranges from 10-500 Wp, but 20 Wp is the most com-
mon size. 16 companies have been selected for the implementation of the programme: 2 in Inner Mongolia, 4 in Gansu, 6 in Qinghai, 3 in Xinjiang and one in Beijing. The selected companies assemble the systems from components that meet certain quality standards. The components used in the system should come from a short list of manufacturers drawn up by the PMO of the REDP. The activities of the companies are not restricted to the province where they are located. They are also encouraged to use their own network to sell systems to other provinces. A monitoring system has been developed to check how many systems are sold. Information on serial numbers obtained from the manufacturers is combined with the information provided by the companies. For this purpose a computerised Management Information System has been de-veloped. In addition, 25 systems for each company are randomly checked by audit teams. In the first round the PMO-REDP received applications for subsidies for a total of some 1 mil-lion RMB. The potential market is shrinking because of competition from other programmes
ECN-C--03-089 37
such as the kFW programme. Perhaps in the longer term the focus of the REDP will shift to-wards capacity building and market development. A budget of US$ 2.7 million is available for the technology improvement component. This programme focuses on technological innovations and consists of two parts: the competitive grant intended to cover 50% of the cost of investment projects; and a quick response facility for small and urgent projects.
The fourth phase of the Rural Hydropower Electrification Counties Programme The Ministry of Water Resources is currently implementing the fourth phase of the Rural Hy-dropower Electrification Counties Programme that started in 1983 and will run until 2005. For the fourth phase, 400 counties have been selected where small hydro stations and the transmis-sion & distribution system will be built to improve the electrification level. The national gov-ernment allocates 250 million RMB each year and the provincial government the same amount to support the programme. A national standard should be reached after the construction. The first phase (100 counties) of the programme was implemented between 1983-1990, the sec-ond phase (200 counties) between 1991-1995 and the third phase (300 counties) between 1995-2000. The programme has greatly accelerated the development of small hydropower in China, and it has contributed greatly to rural electrification, development of the rural economy, im-provement of the living conditions of the people and the protection of the environment. Presently, the Ministry of Water Resources is planning another programme entitled ‘Replacing Combustion Materials with Small Hydro’. The aim is to develop small hydro, decreasing the use of firewood, coal and other polluting fuels in order to protect the environment and to improve the living conditions of the rural people.
2.6 Conclusions
The first applications in China of decentralised electricity systems based on renewable energy sources took place in the early seventies. During the past three decades these systems went through the various development stages of technological research and design, demonstration, promotion, standardisation and serial production and have now reached maturity. Initially, the main application was for communication but gradually the focus shifted to the provision of elec-tricity in remote areas that cannot be covered by the central electricity grid. After three decades of Government supported research and as a result of the high priority given by the Chinese gov-ernment to rural electrification these systems have developed into mature technologies and the installed capacity is rapidly growing. Technological developments and a substantial increase in sales volume have brought down the cost of these systems on average by a factor of 10 over the past three decades. Mini-hydro (less than 10 kW) is the most important decentralised electricity technology in China in terms of resource availability and installed capacity. At present, total installed mini-hydro capacity is 154 MW and the potential exploitable resources are estimated to amount to 80 GW. Currently some 146,000 mini-hydro systems have been installed in China and the po-tential market for new systems is estimated to amount to some 420,000 installations. The aver-age price for a system is around 5,000 RMB/kW. Solar photovoltaic is a fast growing technology in China, both for household applications as well as for powering mini grids. In 2002, total installed PV capacity amounted to some 25 MW, mostly used for rural electrification. PV sales grew rapidly during the last decade from some 3,880 kWp in 1993 to some 20,000 kWp in 2002. The price per Wp over the same period went down from RMB 40-47 to RMB 30-40. At present, some 300,000 PV systems have been in-stalled in China and the estimated potential market for new systems exceeds 2 million units. The price of the most common 18-20 W PV system is about 1,600 RMB and includes the PV panel, the 12V/38Ah battery, the controller, 3 sets DC lights and cabling.

38 ECN-C--03-089
Stand alone wind turbines are currently mainly used in Inner Mongolia for supplying electricity to nomadic people. At present some 178,000 systems are still operational in China with a total capacity of 16 MW. Some 80% of these systems can be found in Inner Mongolia. The most common size is in the range of 150-300W, which generates 250-380 kWh annually and costs RMB 1,150-3,090. Based on the above review of DRE-systems in China, mini-hydro (less than 10 kW), photo-voltaic (both household applications as well as mini grids) and small wind technologies will be considered for inclusion into the MMS. A detailed list of the various types of systems is pre-sented in Appendix A.

ECN-C--03-089 39
3. REVIEW OF INTERNATIONAL EXPERIENCE
3.1 International experience with MMS policies
3.1.1 Experience in Europe
The Directive on the Promotion of Electricity produced from Renewable Energy Sources in the internal electricity market5, is the main legislation affecting renewable electricity at EU level. This directive aims at facilitating a significant medium-term increase in renewable electricity within the EU. It must be considered in the context of the indicative objective of doubling the share of renewable energy from 6% (in 1997) to 12% (in 2010) of the gross inland energy con-
sumption. This objective was set in the 1997 White Paper on renewable energy sources and en-dorsed by the Energy Council in May 1998. The White Paper includes an Action Plan and a Take-off Campaign, which sets some specific objectives and key actions per technology. This 12% of gross energy consumption has been translated into a specific share for consumption
of renewable electricity of 22,1% in 2010 starting from 14% in 1997. The Directive also estab-lishes indicative targets for the penetration of renewable electricity in each Member State, which are given in Table 3.1. Table 3.1 Indicative renewable electricity targets for 2010 for the EU member States (including
large hydro6).
Total electricity consumption7 in 2010
[GWh]
Target renewable electricity
[%]
Target renewable electricity
[GWh]
Austria 70,630 78.1 55,190 Belgium 105,150 6.0 6,310 Denmark 44,400 29.0 12,880 Finland 96,610 31.3 30,240 France 537,700 21.0 112,920 Germany 613,280 12.5 76,660 Greece 72,460 20.1 14,570 Ireland 33,800 13.2 4,460 Italy 359,020 25.0 89,760 Luxembourg 7,950 5.7 450 Netherlands 132,690 9.0 11,940 Portugal 62,040 39.0 24,190 Spain 255,610 29.4 75,150 Sweden 162,560 60.0 97,540 United Kingdom 500,340 10.0 50,030 European Union 3,054,240 21.7 662,290 Source: M.A. Uyterlinde et al, 2003. A wide variety of instruments is currently applied by the EU Member States for promoting re-newable energy and achieving the above targets. Table 3.2 presents an overview of the mix of instruments (for a brief description of these instruments see Section 1.3.1) currently used by the different EU Member States.
5 Directive 2001/77/EC of September 27th 2001. 6 At present, 18% of China’s electricity consumption comes from hydro. Excluding large hydro (above 25 MW)
this share still is 6%. 7 Sources: Renewable Energy Directive and European Union Energy Outlook to 2020.

40 ECN-C--03-089
Table 3.2 Instruments for stimulating electricity generation from renewable sources
Investment subsidy
Feed-in tariff
Tender Fiscal or tax
Voluntary schemes
RPS
Austria o + o o Belgium o o o + Denmark o o o Finland + o o France + o o Germany + + o Greece + + o Ireland + + o Italy + o + Luxembourg o o o Netherlands o + o o Portugal o + o Spain o o Sweden o o + UK o o + + = main instrument. o = additional instrument. 1 Austria: small hydro (< 10 MW) is not covered by feed-in and the RPS system applies for this technology. 2 France: bidding process was introduced for onshore wind. 3 Italy: feed-in tariff for existing power plants; RPS system for plants constructed after 1 April 1999. Investment subsidies and feed-in tariffs are the most widely used instruments in Europe for achieving renewable energy targets although the RPS is becoming more popular. Feed-in tariffs give a great deal of price certainty to investors since a premium on the electricity sold is assured for a specific, often long, period of time. Fiscal and financial incentives are also widespread in Europe as a means to internalise the external cost of the energy production from fossil and nuclear origin, but these incentives are often put in place as a secondary promotion measure. In the UK, the Non-Fossil Fuel Obligation (NFFO) tender scheme was in place during the pe-riod 1990 to 1998. In April 2002, the NFFO was replaced by the Renewable Obligation (RO). This scheme places an obligation on each electricity producer to produce a certain share of the electricity from renewable energy sources. The development over time of the average green cer-tificate price under the NFFO and RO is presented in Table 3.3. Table 3.3 Average contract prices for NFFO and RO schemes in the UK
Auction Average contract price [US$ ct/kWh]
NFFO 1 (1990) 11.85 NFFO 2 (1991) 13.85 NFFO 3 (1994) 7.63 NFFO 4 (1997) 5.66 NFFO 5 (1998) 4.26 Renewable Obligation (October 2002) 0.74 Renewable Obligation ( January 2003) 0.75 Source: personal communication. Most of the renewable electricity produced in Europe is supplied to the grid but there are also self generators (mostly combined heat and power installations), which use (part of) the electric-ity for their own production process. The electricity produced from self-generators is also eligi-ble for green certificates, provided that a meter is installed to measure the kWh production. Be-cause the electricity produced for own use cannot be traded on the market, the certificates are also not tradable but can be used to receive the MMS subsidy.

ECN-C--03-089 41
3.1.2 Experience in the United States
In the US, a growing number of states have adopted renewable energy standard for electricity as part of their policy to promote renewable energy. As of March 2003, 15 states have imple-mented minimum renewable energy standards. Table 3.4 presents an overview of the RPS target adopted by these states. Table 3.4 RPS targets for various states in the US
State MMS target Comments
Arizona 1.1% by 2007 60% must come from solar electric
Connecticut 13% by 2009 Technology minimum requirements
Maine 30% of retail sales
Massachusetts 4% by 2009 New renewables
Nevada 15% by 2013 5% must come from solar
New Jersey 6.5% by 2012 Technology minimum requirements New Mexico 10% by 2011 Some sources have a higher credit value
Pennsylvania Varies by utility
Texas 2,000 MW by 2009
Wisconsin 2.2% by 2011 06% can come from facilities installed before 1998
California 20% by 2017 Hawaii 9% by 2010 Can include existing renewables
Illinois 15% by 2020
Iowa 105 MW Requirement is being met mostly with wind and biomass
Minnesota 10% by 2015 (voluntary target) At least 1% must come form biomass Source: http://www.eere.energy.gov/state_energy/. The largest RPS in the US was adopted in 2000 by California, requiring the state’s utilities to gradually increase their share of renewable energy sources for electricity production to 20% by 2017. The specific design features of the RPS vary considerably among the states. In some states, sub-targets for specific technologies have been set. For example, in Arizona the target of 1.1% by 2007 must include at least 60% from solar electric. So far, Texas has the most successful state RPS that commenced in 1999 and aims to install 2,000 MW by 2009 or 2.2% of the total electricity produced in that year. By the end of 2002, more than 900 MW had been installed which exceeds the target for that year by 500 MW. The success in Texas is mainly due to the existing production tax credit (US$ct 1.8/kWh) for wind and the availability of many very good wind sites. The price of certificates in Texas currently varies in the range of US$ct 0.5 - 0.9/kWh. In April 2002, the US Senate approved a comprehensive Energy Bill, which includes the estab-lishment of a federal renewable energy portfolio standard (RPS). Under the federal RPS inves-tor-owned utilities will be required to generate 1% of their electricity production from renew-able energy sources by 2005, rising steadily to 10% by 2020. A credit trading system will be es-tablished to enable utilities to meet their requirements in the most cost-effective manner. How-ever, the differences between the version of the Bill passed by the Senate and the version passed by the House will have to be resolved before the Bill can be enacted. Another instrument used by state governments to promote renewable energy is the Public Bene-fit Funds (PBF). This is a system by which the state government sets up a fund to pay the costs of its renewable energy support policy. The fund is financed by an incremental charge (some-times called system benefit charge) on electricity consumption, which shares the cost burden over all consumers. Examples of how these funds are used include: rebates on renewable energy systems; funding for renewable R&D; and development of renewable energy education pro-grammes. The big advantage of this system is that these funds can be allocated towards tech-nologies with long-term potential, such as solar photovoltaic, but that will not be immediately

42 ECN-C--03-089
competitive with other renewables and thus will not benefit much under a RPS scheme. As of March 2003, 15 states have adopted the PBF approach. Net metering is another very popular renewable energy policy instrument in the US. Net meter-ing allows customers who produce electricity to feed their surplus electricity directly into the grid at the same rate the customer buys its electricity from the utility. As of March 2003, this system is part of the state energy policy in 45 states. Another type of instrument to promote renewable energy often used in the US concerns genera-tion disclosure rules, which obliges the utility to provide its customers with additional informa-tion about the electricity they are supplying. The information may include fuel mix percentages and emissions statistics. The disclosure of information educates the customer but to what extent it will stimulate renewable energy is open to question. Today, 24 states in the US have incorpo-rated disclosure rules into their energy policy. In the US a wide range of policy instruments have been developed to stimulate renewable en-ergy, including measures to stimulate generation from small-scale renewable electricity systems. Because these systems are metered and connected to the grid verification of system performance is not an issue in the US.
3.1.3 Experience in Australia
In 2001 the government of Australia introduced the Mandatory Renewable Energy Target (MRET) as an instrument to increase the contribution renewable sources make to Australia’s electricity demands. The MRET is aimed at reducing both the greenhouse gas emissions and developing the renewable energy industry. The MRET includes the system of renewable energy certificates representing the greenness of the electricity in the market and is supported by legis-lation. The Government has set a target to produce an additional 9,500 GWh (approximately 2% of to-tal electricity production in 2010) of renewable energy per year by 2010. Interim targets have been set to ensure that there will be consistent progress towards the 9,500 GWh target by 2010 so that all the investments will not occur in the final years of the scheme. Eligible renewable energy sources include grid connected renewable electricity generators, stand alone power supply systems and systems that replace electricity (solar water heaters). The eligible stand-alone systems that are not metered include hydro with a capacity less than 6.4 kW, solar panels (photovoltaic) less than 10 kW and wind turbines. Monitoring procedures for kWh production of the stand-alone systems have been standardised. For each technology a simple formula has been established to determine the so-called ‘deemed amounts’. Any individual who wants to claim renewable energy certificates for their deemed amount must first be registered. Alternatively, the right to claim certificates can be assigned to another registered person who acts as an agent for many individuals and thus can trade the cer-tificates in larger blocks. This way the individual may avoid the direct administration costs of registration and creating, selling, transferring and reporting on their green certificates. To assign the right to claim certificates to the agent, the owner of the system signs a document and in re-turn may receive some benefits, for example a price advantage. For small hydro systems the kWh production is determined by the size of the system (kW) and the number of hours each year that the hydro resource is available. For each postal area code in-formation on hours of water availability has been collected and the kWh production depends on the specific area where the hydro system is located. Table 3.5 gives the deemed amounts for hy-dro systems in the range of 0.2-1.0 kW for various levels of resource availability.

ECN-C--03-089 43
Table 3.5 Deemed amounts for mini-hydro
Rating [kW] Hours each year of hydro resource availability
4000 4500 5000 5500 6000 6500 7000 7500 8000 8500 8760
Amount of electricity taken to be generated [MWh/year]
0.2 0.76 0.86 0.95 1.05 1.14 1.24 1.33 1.43 1.52 1.62 1.66 0.3 1.14 1.28 1.43 1.57 1.71 1.85 2.00 2.14 2.28 2.42 2.50 0.4 1.52 1.71 1.90 2.09 2.28 2.47 2.66 2.85 3.04 3.23 3.33 0.5 1.90 2.14 2.38 2.61 2.85 3.09 3.33 3.56 3.80 4.04 4.16 0.6 2.28 2.57 2.85 3.14 3.42 3.71 3.99 4.28 4.56 4.85 4.99 0.8 3.04 3.42 3.80 4.18 4.56 4.94 5.32 5.70 6.08 6.46 6.66 1.0 3.80 4.28 4.75 5.23 5.70 6.18 6.65 7.13 7.60 8.08 8.32
For wind turbines the estimated kWh production is based on the size of the system (kW) and the wind availability (information is available for each postal area code). Table 3.6 gives the deemed amounts for small wind turbines in the range of 0.2-1.0 kW for various levels of re-source availability. Table 3.6 Deemed amounts for small wind turbines
Rating [kW] Hours each year of wind resource availability
2000 2200 2400 2600 2800 000 3200 3400 3600
Amount of electricity taken to be generated [MWh/year]
0.2 0.38 0.42 0.46 0.49 0.53 0.57 0.61 0.65 0.68 0.3 0.57 0.63 0.68 0.74 0.80 0.86 0.91 0.97 1.03 0.4 0.76 0.84 0.91 0.99 1.06 1.14 1.22 1.29 1.37 0.5 0.95 1.05 1.14 1.24 1.33 1.43 1.52 1.62 1.71 0.6 1.14 1.25 1.37 1.48 1.60 1.71 1.82 1.94 2.05 0.8 1.52 1.67 1.82 1.98 2.13 2.28 2.43 2.58 2.74 1.0 1.90 2.09 2.28 2.47 2.66 2.85 3.04 3.23 3.42
For solar panels the kWh production is determined by the size of the system (kWp) multiplied by the so-called zone rating of the system. Australia is divided into four geographical zones with different radiation levels. No procedures are in place for monitoring the system performance. Certificates may be created annually or on installation for the first 5-year period and at the start of each subsequent 5-year period. In general the value of green certificates does not vary with the type of fuel source used to gen-erate the electricity except in the case of certificates from wood waste. Such certificates trade at a lower price. Currently green certificates in Australia are trading at a price of around US$ct 2.1 per kWh.

44 ECN-C--03-089
In addition to the MRET, the following additional policy measures are in place to support the renewable energy industry development:
• Renewable Energy Equity Fun: this fund can provide venture capital for small innovative renewable energy companies. The investee company receives capital, managerial expertise and an enhanced business reputation as a result of the REEF investment. In return for the provision of capital, the fund manager acquires a part-ownership of the company. Total available amount is some US$ 26.6 million.
• Renewable Remote Power Generation Programme: the objective of this programme is to increase the uptake of renewable technologies in remote areas of Australia that are not served by a main electricity grid. The programme can provide rebates of up to 50% of the capital cost of renewable energy systems. Some US$ 264 million will be available over the duration of the programme.
• Renewable Energy Industry Development: this programme supports the Australian renew-able energy industry by providing a competitive grants programme to Australian companies who can demonstrate that their projects will assist the development of the Australian renew-able energy industry.
• Photovoltaic Rebate Programme: this programme commenced on 1 January 2000 and pro-vides cash rebates for householders and owners of community use buildings who install grid-connected or stand-alone photovoltaic systems. Up to US$ 31 million is available over the life of the programme. By the end of 2002 more than 3,700 systems (mainly decentral-ised) have been installed with the support of this programme.
In December 2002, the Council of Australian Governments produced an Energy Market Review (Commonwealth, 2002), which identified the serious deficiencies in the Australia’s electricity and gas reforms introduced in the 1990s. One of the key findings concerns the policies on the reduction of greenhouse gases. The review concluded that the responses so far are targeted on technologies or fuel types rather than on greenhouse gas abatement. With regard to the MRET, it is concluded that this system is a more costly measure to reduce greenhouse gas emissions than it needs to be as it is focused exclusively on renewable energy sources rather than on least cost greenhouse gas abatement. It is stated that the rationale for a scheme that focuses only on renewable energy is the perception of the need for the conservation of non-renewable resources. However, this is not an issue for Australia and it is, therefore, recommended by the Review panel to replace the MRET, along with a number of other measures, by a national economy wide emissions trading system to achieve an efficient and cost effective mechanism to address greenhouse gas emissions.
3.2 International experience with DRE promoting policies
3.2.1 Rural electrification
In many countries, rural electrification is considered to be an important component of the na-tional development initiatives especially as a means to promote development in rural areas. Many social and economic benefits are assigned to electrification. Annecke provides an over-view of benefits associated with rural electrification (Annecke, 1998: p. 3), including:
• improved quality of life and living standards,
• improved education through the availability of light,
• improved health conditions in households,
• improved communications,
• reduced crime,
• improved rural/urban balances. It is important to recognise that the relationship between rural electrification and economic de-velopment is not straightforward. There are a number of other conditions which have to be met

ECN-C--03-089 45
in order for rural electrification to result in net economic benefits for rural areas (these condi-tions were identified by the World Bank in 1975 (Annecke, 1998). Electrification may contrib-ute to economic development provided that:
• The quality of infrastructure, particularly of road is reasonably good.
• There is evidence of growth of output from agriculture.
• There is evidence of a growing number of productive uses in farms and agro-industries.
• There is a large number of villages, not too widely scattered.
• Income and living standards are improving.
• There are plans for developing the area.. Rural electrification policies usually consist of two main components: electrification through an extension of the electricity grid and through the deployment of decentralised electricity systems. Grid power comes in general with no restriction on capacity and thus facilitates the use of more appliances and therefore is the preferred option of most end-users. Decentralised electricity systems are often the most cost-effective options in providing electric-ity to remote areas, which will not be served by the central grid in the foreseeable future. Polices to promote the deployment of decentralised renewable electricity systems can be divided into two broad categories:
• Commercial market approach. In this approach, the policy consists of stimulating private market structures by addressing existing market barriers and providing financial incentives.
• Dispersed area concession approach. In the dispersed area concession approach, a private electric utility, rural electric co-operative, or other institution enters into a contractual agreement with the government to avail concession for providing energy services to the ru-ral population.
3.2.2 Commercial market approach for promoting DRE systems
The overview of the commercial market approach is based mainly on the literature on Solar Home Systems. No relevant literature could be found on mini-hydro or wind turbines. To the knowledge of the project team these markets are less developed and no innovative market ap-proaches have been developed for these technologies. The institutional models for promoting decentralised energy systems are presented in Nieuwen-hout et al (2000) and the main characteristics of these models are given in Table 3.7. Table 3.7 Main characteristics of DRE system delivery models
Institutional model Ownership Financing Maintenance
Donation Customer Government, international donor
Customer
Cash sales Customer n.a. Customer Credit Customer, intermediary Commercial bank,
coop, dealer, international donor
Customer service company
Fee-for-service Energy service company (ESCO)
ESCO ESCO
Source: F.D.J. Nieuwenhout et al, September 2000. A detailed analysis of the experience with these models can be found in Nieuwenhout et al, 2000. Below, the conclusions are briefly summarised. In the donation model, the system is financed by the government or by a foreign donor. The end-user becomes the owner of the entire system. A review of the experience based on four pro-jects (Mexico, Tunisia and two projects in Guatemala) implemented as donations revealed that

46 ECN-C--03-089
this model could work provided that the end user is committed to the project and realises that the system has to be maintained at his own expenses. If this condition is not fulfilled these pro-jects usually fail. In the cash sales model customers buy a system for cash from a local dealer. The cash can come from savings or financial barriers can be removed through donations or loans from friends or relatives. The government does not play a role in this model. Based on a review of four projects (Kiribati, Kenya, Mexico and Morocco) Nieuwenhout et al concluded that in this model cus-tomers tend to go for a cheap, low-quality system that is often under-designed and that there is a need for standards in order to make this model successful. In the case of credit, the customer buys a system under credit arrangements provided by the supplier, a commercial bank or a micro-finance organisation. The review of experience with this institutional model revealed that this model could be attractive for income groups that have a regular income but cannot afford to pay for the system outright. Nieuwenhout et al concluded that credit schemes can work on a small scale but they have not been demonstrated on a large scale and commercial financiers are not yet inclined to lend for decentralised electricity systems. In a fee-for-service approach an energy service company sells the energy service but retains ownership of the system. In this model the government pays part of the investment costs and the remaining costs are recovered by the customers by way of a fixed monthly fee or a fee based on the amount of energy consumed. Nieuwenhout et al concluded that this institutional model type is attractive from the point of view of combining subsidies and market operation but that the ex-perience so far is too limited to judge whether the maintenance and fee-collection can be organ-ised in a financially sustainable way.
3.2.3 Dispersed area concession approach for promoting DRE systems
In the dispersed area concession approach, a private electric utility, rural electric co-operative, or other institution enters into a contractual agreement with the government to avail concession to provide energy services to the rural population. Concessions normally include the fee-for-service (FFS) approach. In the FFS approach, an en-ergy service company provides decentralised electricity for a monthly fee to rural households in the same way as utilities do for grid-connected electricity. Although the system is located in the customer’s house, the system is owned and maintained by the energy-service company. The concessionaire who will have to invest in setting up a rural infrastructure to implement the ac-tivities will also have the monopoly right to supply energy services in his area. International ex-perience with the FFS approach reveals that in almost all of the countries where the FFS ap-proach is applied, the energy-services company will be regulated by government and awarded monopoly status for specific geographic regions (Martinot et al, 2000). Martinot and Reiche (2000) provide 6 case studies of concession approaches in developing countries.

ECN-C--03-089 47
Table 3.8 Government concession models in other countries
FFS or sales
Monopoly Private sector/utility
Subsidy Bundling with other services
Period [year]
Govt institutions involved
Argentina FFS All households
Utilities, private sector
Yes In 1 province (water)
15 Provinces
Benin and Togo
FFS Open Private sector Yes No 15 Public agency (newly established)
Cape Verde FFS/ sales Yes Water 10 Peru FFS CBOs Yes No - Ministry of Energy
and Mines Bolivia FFS/ sales Local utility Yes No - Source: Martinot, E., Kilian Reiche, 2000. A more recent example of the concession approach is the non-grid electrification programme that is currently being implemented in South Africa. In 1999, the South African Department of Minerals and Energy (DME) issued a call for proposals from members of the industry, the NGO community and other institutions to carry out off grid electrification and energy provision on a large scale. The Government offered to award concession areas and a substantial subsidy. The response was encouraging and seven consortia have been selected (Shell&Eskom and Dutch Nuon & RAPS have already started to implement the programme). The objective of the South African concession pilot programme is to electrify 350,000 house-holds in 5 years, divided into 50,000 households per concessionaire. The energy service compa-nies can use whichever technology they think is the most appropriate to deliver the energy ser-vices to the end-users. In most cases in South Africa the concessionaires will use solar PV sys-tems, given the low ability of the end-users to pay, the dispersed nature of the households and the lack of institutional end-users. In order to create equal opportunities for renewable energy technologies, the concessionaires will receive the same subsidy as the national utility ESKOM per established connection, which is Rand 3000. Based on a solar home system price of about R.3500-4000 this is about a 75% subsidy on the initial hardware.
Important stakeholders A number of key players involved in the concession approach in South Africa are:
• Department of Minerals and Energy (DME).
• National Electricity Regulator (NER): The NER is the national regulating body of the elec-tricity supply industry. The NER is at present not only responsible for the issue of licenses for electricity distribution, it has also been mandated by the DME to regulate the implemen-tation of the Non-grid Electrification Programme. As one of its functions in the concession programme, the NER dispenses the subsidy for each system installed to the concessionaire. NER is also responsible for identifying target areas for concessions, granting licenses to concessionaires, controlling prices, setting service standards, settlement of disputes, and monitoring and evaluation of the programme (NER, 2000b). This latter role overlaps with the role of the concedante to prevent ESKOM getting knowledge of commercially sensitive information from (potential) competitors (Banks et al, 2000).
• Concedantes: ESKOM and the Durban Electricity Authority, being the licensed electricity distributors in the relevant areas, will function as concedantes in this whole process. The role of concedantes is to monitor the implementation of the concessions to ensure that the services are delivered as agreed in the contract. Another role of the concedante is to ensure that the necessary planning is made to facilitate the integration of the grid and off-grid elec-trification activities (Banks et al, 2000).

48 ECN-C--03-089
3.3 Conclusion
In this Chapter a review is presented of the international experiences with the MMS mechanism and with policies to promote decentralised electricity systems. The following observations are relevant:
• Mandated Market Share schemes have been introduced in several countries world-wide as a means to achieve the target set by the Government for a specific amount of electricity sup-ply that is produced from renewable energy sources. The main support instrument used in the European Union is the feed-in tariffs, although the RPS scheme is becoming more popu-lar. In the United States and Australia the RPS is the most common policy instrument ap-plied for accelerating the introduction of renewable energy. The tender procedure has not shown great success in promoting renewable electricity production probably due to the complexity of the procedures involved in a tendering system. Investment subsidies and tax or fiscal subsidies are often used as additional measures to promote specific technologies. The price of green certificates varies from 0.5 US$ct/kWh in Texas, USA, to 0.7 US$ct/kWh in the UK to around 2.1 US$ct/kWh in Australia.
• In Europe and the USA self-generators based on renewable energy need to have a meter if certificates are claimed for the electricity production. In Australia, decentralised renewable electricity systems without a meter are eligible under the MMS. Special methods have been developed to standardise the calculation of kWh production for these systems. No proce-dures have been developed for verifying the system performance.
• Given the remoteness of solar photovoltaic in China it is questionable whether the fee-for-service approach is a real option for this technology because households in China are not easily accessible. However, the fee-for-service approach could be a feasible option for mini-hydro because end-users are more accessible.

ECN-C--03-089 49
4. FRAMEWORK FOR MONITORING AND VERIFICATION
PROCEDURES FOR DRE TECHNOLOGIES
4.1 Introduction
In the MMS schemes for renewable electricity, which have been implemented in different coun-tries, monitoring and verification procedures have hardly been an issue. They have all taken place in countries with near 100% grid connection and hence involved only grid-connected re-newable energy systems8. Grid connected renewable electricity is automatically monitored by the grid operators and/or distribution companies, hence verification has not been an issue. Decentralised renewable electricity systems, on the other hand, are by definition not connected to the national (regional) electricity grid and, consequently, the amount of electricity produced by these systems will not be automatically measured. Therefore, if these systems are to be in-cluded into the MMS, separate procedures need to be developed and implemented to monitor and verify the total amount of electricity produced by these systems. In line with the definition in Section 1.3.4, this Chapter will focus on non-metered technologies. At the moment a variety of different Chinese government organisations and international donors invest in mini-grids powered by different renewable energy sources such as mini-hydro, solar or solar-wind hybrids to provide electricity to rural communities. Through discussions with pro-vincial and county officials in Sichuan and discussions with supply companies it has become apparent that monitoring and reporting of electricity generation from mini grids that are metered follows standard reporting practices for local (county, prefectural or provincial) power compa-nies. Hence, they are likely to fit in the regular monitoring practices of the MMS scheme for grid-connected electricity and no further amplification is required in this study. Robustness of the verification procedures and additional transaction costs for DRE mini grids are in line with those for grid-connected RE systems. The process of monitoring, verification and certification of a project or activity is based on gen-erally acknowledged principles of certification. Verification is defined as the activity of check-ing the validity of the claims of a project, usually based on the data gathered by the project’s in-ternal monitoring program. If a project fulfils all regulatory requirements, verification can lead to certification (Moura Costa et al, 2000). Essential components of a certification system in-clude:
• A published standard adopted by an independent standard-setting body.
• An accreditation body.
• A registry where the issued certificates are registered.
• Verification/certification agencies accredited to use the standard. Among the key principles in designing a certification system is that verification agencies must be independent from the standard-setting body and the organizations seeking certification. They also must have well defined procedures, guidelines and training to ensure that they can provide independent verification of whether a project’s activities are in accordance with the standard (Upton and Bass, 1995). In order to ensure credibility, the certification process must be over-seen by an accreditation body independent from verification companies, ensuring consistency and compliance with the standard and certification procedures (Higman et al, 1999). In essence, accreditation bodies ‘certify the certifiers’.
8 As explained in Section 3.1.3, in Australia non metered decentralised systems are eligible technologies under the
MMS.

50 ECN-C--03-089
Such generally acknowledged principles of certification have been applied in various different disciplines such as:
• The International Organization for Standardization (ISO, the major standard-setting organi-zation world-wide) - Standards are being developed by technical committees working within the ISO framework (Moura Costa et al, 2000; Upton and Bass, 1995).
• The Forest Stewardship Council (FSC, an organization working with certification of sus-tainable forest management) - Generic Principles and Criteria have been set by the FSC while country-specific standards based on these are being set up by national working groups (Moura Costa et al, 2000; Higman et al, 1999).
• The Clean Development Mechanism under the Kyoto Protocol - The adoption of standards has been delegated by the Conference of Parties to the CDM Executive Board who assigns Expert Panels to assist in the development (UNFCCC, 2001).
4.1.1 Institutional design for certification of DRE-systems
In this section the institutional design for certification of DRE-systems has been defined follow-ing these general principles of certification. Figure 4.1 explains this principle of certification for the case of DRE certification. In case DRE systems will be eligible under MMS, a standard set-ting body for DRE systems needs to be appointed by the MMS authority. This body can be part of the MMS authority or be a separate entity specifically dedicated to DRE-systems. The stan-dard setting body will have three main tasks. Firstly, it will approve standards and procedures. The monitoring and verification procedures discussed in this chapter are examples of possible standards and procedures to be part of the MMS standards and procedures. These standards and procedures will be used by the verifier to assess the eligibility of the system and how many green certificates are generated. The second task for the standard setting body is to appoint an accreditation body, which in turn will appoint the verifiers. The third task of the standard setting body is to issue green certificates and manage the registry of green certificates. The registry is the record of ownership of the green certificates and will record the issuance, transfer, retire-ment and cancellation of all green certificates.

ECN-C--03-089 51
Standards and procedures
Used by
verifier
Appoints
Accreditation
Body
Verifies kWh generated
Renewable electricity
technology
Manages register
and certifies green
electricity
Registry of green certificates
Submits verified
green
electricity
Verifier
Approves
Standards and
procedures
Appoints
Verifier
Standard
setting body
(MMS
authority)
Accreditation body
Figure 4.1 Institutional set up of a DRE certification scheme
Transfer of green certificates from end-user to buyer in an MMS regime In conventional MMS schemes, there is a direct interaction between the renewable energy pro-ject owner (often a utility or an independent power producer) and the verifier. Non-metered DRE systems, however, are too small to allow direct interaction between the owner of the sys-tem and the verifier. Hence there needs be an intermediary who bundles the smaller systems and submits them into the MMS process. In the further analysis of this chapter it is assumed that the DRE equipment supplier takes on this role of intermediary unless otherwise specified. Figure 4.2 explains the process of this intermediation by highlighting how the legal ownership of the green certificate is transferred from the end-user to the buyer in five steps.
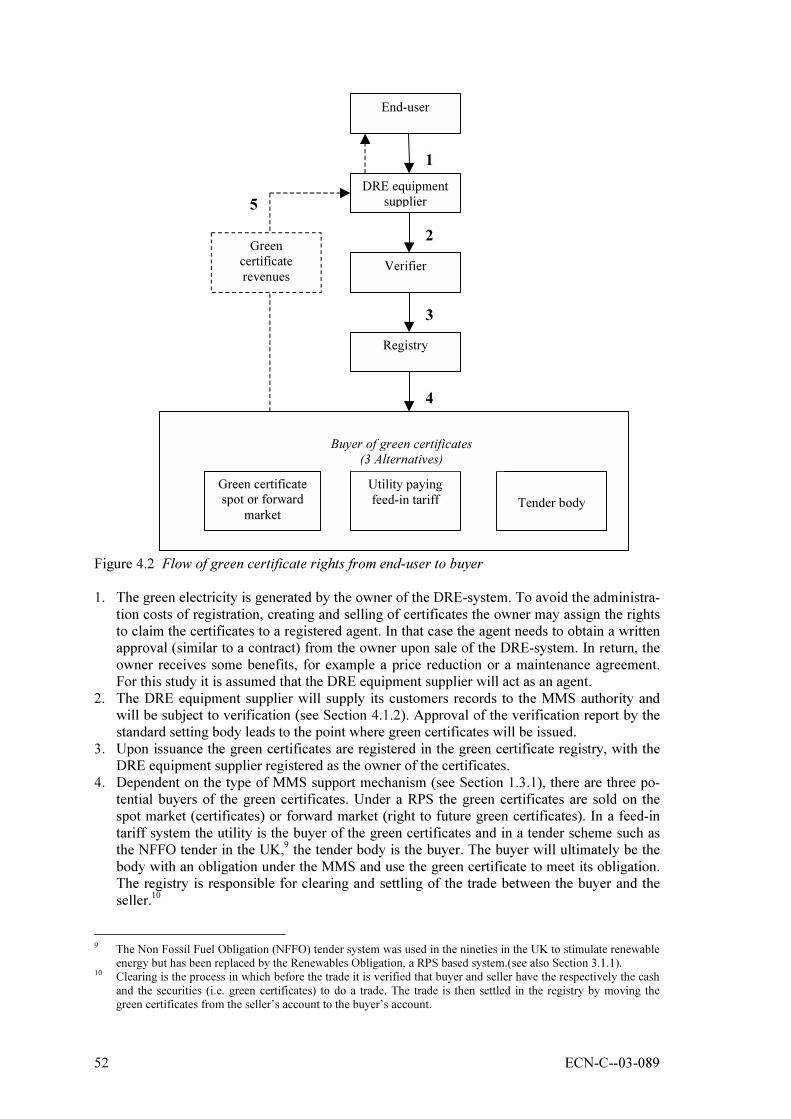
52 ECN-C--03-089
1
End-user
DRE equipment
supplier
Verifier
Registry
Utility paying
feed-in tariff
Tender body
Buyer of green certificates
(3 Alternatives)
Green certificate spot or forward
market
Green
certificate
revenues
2
3
4
5
Figure 4.2 Flow of green certificate rights from end-user to buyer 1. The green electricity is generated by the owner of the DRE-system. To avoid the administra-
tion costs of registration, creating and selling of certificates the owner may assign the rights to claim the certificates to a registered agent. In that case the agent needs to obtain a written approval (similar to a contract) from the owner upon sale of the DRE-system. In return, the owner receives some benefits, for example a price reduction or a maintenance agreement. For this study it is assumed that the DRE equipment supplier will act as an agent.
2. The DRE equipment supplier will supply its customers records to the MMS authority and will be subject to verification (see Section 4.1.2). Approval of the verification report by the standard setting body leads to the point where green certificates will be issued.
3. Upon issuance the green certificates are registered in the green certificate registry, with the DRE equipment supplier registered as the owner of the certificates.
4. Dependent on the type of MMS support mechanism (see Section 1.3.1), there are three po-tential buyers of the green certificates. Under a RPS the green certificates are sold on the spot market (certificates) or forward market (right to future green certificates). In a feed-in tariff system the utility is the buyer of the green certificates and in a tender scheme such as the NFFO tender in the UK,9 the tender body is the buyer. The buyer will ultimately be the body with an obligation under the MMS and use the green certificate to meet its obligation. The registry is responsible for clearing and settling of the trade between the buyer and the seller.10
9 The Non Fossil Fuel Obligation (NFFO) tender system was used in the nineties in the UK to stimulate renewable
energy but has been replaced by the Renewables Obligation, a RPS based system.(see also Section 3.1.1). 10 Clearing is the process in which before the trade it is verified that buyer and seller have the respectively the cash
and the securities (i.e. green certificates) to do a trade. The trade is then settled in the registry by moving the green certificates from the seller’s account to the buyer’s account.

ECN-C--03-089 53
5. In exchange for the certificates, the buyer will pay the DRE equipment supplier for the de-livered certificates. In case of a RPS scheme, the equipment supplier is likely to sell all its green certificates via a forward contract to reduce its price uncertainty. Under the other re-gimes (pay-back tariff or tender) the equipment supplier already knows what price he will get. The equipment supplier can transfer its revenues to the end-user directly via lower price on its products or indirectly via improved services via a service infrastructure and higher quality products.
4.1.2 Verification cycle of stand-alone DRE systems
The purpose of this chapter is to identify verification procedures for DRE systems. Based on the literature of certifying non-metered DRE systems the following steps are identified in the verifi-cation cycle (See Martens et al, 2001). The MMS certification cycle starts with the acceptance of the DRE equipment supplier in the
MMS scheme. Acceptance is based on a number of minimum criteria such as technical perform-ance of its products, legal status and financial reliability and includes an instruction of the MMS procedures to the eligible company. Standardisation of kWh generation - The technologies subject in his chapter are the non-metered DRE technologies. Since metering just for MMS purposes would be too costly to achieve, the kWh generation of a DRE-system needs to be standardised. This section includes a methodology on how kWh generation can be standardised. Verification of sales registration - Individual DRE-systems will become eligible as soon as they are registered in the company database following the requirements of the MMS scheme. Verifi-cation of the DRE-system sales is required to ensure that all systems for which green certificates will be claimed have indeed been installed at an end-user. If the household database includes addresses at which no DRE-systems have been installed, the company will receive undeservedly green certificate revenues. If verification reveals this has been done on purpose the equipment supplier can be convicted for fraud and should at the minimum be removed from the MMS scheme. Verification of the performance of a DRE system - Following one of the key principles of MMS, companies should only get MMS revenues on basis of real kWh generated. Since the kWh esti-mation has been standardised, the only remaining question is: what percentage of the systems sold are still operating every year? Once the performance rate is known the verifier can issue a verification report to the Standard Setting Body stating the amount of green electricity gener-ated. That body will issue the certificates in the register on behalf of the DRE equipment sup-plier and the cycle as described in Figure 4.2 will continue.
4.1.3 Approach for developing and evaluating certification procedures
The approach used in this Chapter to develop and evaluate certification procedures for DRE-systems consists of three main components: 1. Estimating kWh production by DRE-systems. 2. Defining verification procedures for DRE systems. 3. Evaluating the transaction costs of the identified certification procedures.
1. Estimating kWh production by DRE systems The first major step to streamline monitoring of non-metered stand-alone systems for an MMS scheme is to estimate their average kWh output. Since measuring kWh output would be prohibi-tively expensive, standardized formulas are proposed. There are two possible proposals for es-timating kWh potentials:

54 ECN-C--03-089
• Supply capacity oriented based on the capacity of the supply system and the renewable en-ergy resource potential.
• Demand capacity oriented based on the capacity amount of the appliances installed per sys-tem in relation to the hours they are used.
Both approaches have been further specified for each technology in the following sections. Both can be further substantiated by taking field measurements of kWh generation of the respective DRE systems through a sample of households. 2. Defining verification procedures for DRE-systems
The identification and evaluation of certification procedures followed three steps:
• Step 1 - Identification of possible monitoring and verification procedures for non-metered DRE systems. For each technology also one non-MMS option has been incorporated in the analysis: the option of providing an upfront subsidy per technology.
• Step 2 - Evaluation of the transaction costs of the developed certification procedures.
• Step 3 - Qualitative assessment of each verification procedure on basis of their robustness and their applicability in China.
Data sources used in this research to carry out step 1 - 3 are:
• Relevant literature: Especially the development of monitoring and verification procedures for small-scale CDM activities served as a reference.
• Inputs of the Chinese Experts. The project team included 4 very experienced Chinese re-newable energy experts who provided extensive inputs, ‘reality checks’ to ensure that sug-gestions are relevant in the Chinese context and useful feedback on proposed methodolo-gies’.
• SETC-REDP project to support photovoltaic systems recently completed its first verification mission. This project provided extremely useful inputs in the evaluation of certification pro-cedures for photovoltaic systems.
• Interviews with Chinese stakeholders: Feedback was obtained from a variety of stake-holders, such as, DRE companies, state, provincial, county officials from different sectors and departments involved in DRE dissemination, researchers and DRE experts, foreign do-nors and many others.
3. Evaluating the transaction costs of certification procedures One of the key tasks in this study is to evaluate the magnitude of the monitoring and verification costs of given DRE technologies, and give a recommendation on the basis of, amongst other, these costs whether it is appropriate to include each of the technologies into the MMS or not. The costs incurred for monitoring, verification and certification of DRE systems are called transaction costs. In MMS schemes in other countries transaction costs have so far hardly been an issue since the grid-connected kWh production is automatically metered by the grid operator. Household technologies however are not-metered and hence require more extensive verification procedures, resulting in higher transaction costs. These costs are defined as follows:
• Overhead costs - The additional costs the MMS administration has to incur in order to or-ganise the administration, verification and certification of the household technologies.
• Verification costs - the costs incurred to verify the sales and system performance of DRE technologies to determine the amount of kWh, which can be verified.
• Opportunity costs - The costs incurred by the participating DRE projects/companies to col-laborate with the MMS administration.
For the purpose of this research only verification costs have been further analysed. The over-head and opportunity costs are likely to be insignificant as compared to the verification costs and are also more difficult to quantify. A transaction cost model has been developed to assess the above transaction costs of the various options. For each DRE-technology, the assumptions made and approach followed in the transaction costs model will be explained. Given the ab-

ECN-C--03-089 55
sence of concrete implementation details of the MMS for China in practice, the analysis is based on a considerable amount of assumptions. Consequently, the results of the analysis are sur-rounded with large uncertainty and should be considered as a rough estimate of the involved transaction costs of each verification procedure. Nevertheless, by providing a consistent frame-work for analysing transaction costs the results have value in comparing the transaction costs of different verification options with each other. The cost framework also provides useful insight in analysing the sensitivity of certain elements in the verification procedures on the total transaction costs. The following criterion has been taken to judge whether the transaction costs of the identified monitoring and verification procedures are too high:
• Costs should be lower than 10% of the MMS revenues. Research on transaction costs for the CDM highlights that investors will typically not support transaction costs that are more than 7% of the revenues generated by selling the carbon credits (green certificates) created by the project (EcoSecurities, 2000). As a criterion for evaluating transaction costs from a private sector a 10% threshold is taken in this study: If transaction costs are higher than 10% of the green certificate revenues, costs are considered too high to make participation interesting.11
4.2 Framework for monitoring and verification procedures for photovoltaic
systems
Photovoltaic systems include individual household systems (solar home systems) and commer-cial stand alone systems. Verification of solar home systems is almost by definition a very diffi-cult exercise. The natural niche market for solar home systems are those users who live in re-mote and difficult to reach areas. In China the NDRC REDP programme has implemented a so-lar subsidy programme with the support of the World Bank GEF. Experience of that programme has learnt that solar home systems monitoring in China is even more difficult. Almost 97% of the population of China has been electrified. Solar home systems are only used by (semi) no-madic herdsmen who live in difficult mountainous areas and for whom micro-hydro turbines are not an alternative. The problems in retrieving these end-users by means of a field survey are huge and even though there is scope for improving monitoring through learning-by-doing, the transaction costs analysis shows that the transaction costs are likely to remain prohibitively high. Building upon the lessons learned from the REDP programme and using its valuable informa-tion, this chapter attempts to identify and analyse alternative approaches for verification of photovoltaic systems.
4.2.1 Estimating kWh production of a photovoltaic system
Generation of kWh by photovoltaic systems can easily be estimated and if desired empirically tested. Although such measures may not always be accurate for an individual system, the impact of this inaccuracy on the total production of renewable electricity is negligible. At the same time estimating kWh production will have great advantage in terms of low transaction costs.
11 In addition to the MMS revenues, there are also social benefits related to the inclusion of DRE systems into the
MMS. Through its emphasis on performance MMS provides additional incentives for high quality systems and improved O&M practices such as after-sales services. This may have positive impacts for end-users compared to other support mechanism as in many cases poor operation and maintenance in combination with the absence of an after-sales infrastructure for household technologies lead to non- or under-performing DRE systems. Improved performance of household DRE technologies may also lead to more confidence in DRE-systems and hence a higher acceptance of the technology among the target group. Since the social benefits are hard to quantify, they have not been incorporated in the transaction costs.

56 ECN-C--03-089
The annual kWh production of a solar home system can be estimated on basis of the following elements: A. System capacity in Wp. B. Efficiency of a solar home system (assumed to be 50%; see Nieuwenhout et al, 2001;
Nieuwenhout and Djamin, 2002). C. Daily irradiation ranges in peak hours. D. Number of days in a year (365).
The kWh production of a system per year is calculated by multiplying A × B × C × D/1000. For variations in solar irradiation in China five broad regions are distinguished: 1. Best: daily irradiation is in the range 5.1 - 6.4 kWh/m2, 2. Good: daily irradiation is in the range 4.5 - 5.1 kWh/m2, 3. General: daily irradiation is in the range 3.8 - 4.5 kWh/m2, 4. Moderate: daily irradiation is in the range 3.2 - 3.8 kWh/m2, 5. Poor: daily irradiation is in the range 2.5 - 3.2 kWh/m2. Based on the solar resources map and assuming an average solar home system size of 16 Wp, 50% system efficiency (including 80% availability), this results in kWh estimations for the five regions as shown in Table 4.1. Table 4.1 Average annual kWh production per solar home system per region
Region Average annual kWh production
Best 14.7 Good 12.6 General 10.1 Moderate 9.3 Poor 7.7
To analyse the demand side capacity for photovoltaic systems, an estimation is required of the typical appliances a project uses. From equipment specifications can be derived what type of appliance are more or less used by households. Table 4.2 provides an overview of appliances used for 3 types of photovoltaic systems. Table 4.2 Appliances powered by solar home systems
System size Type of end-use appliances used Total end-use
capacity [W]
Average use
[Hours/day]
[kWh/
year*]
12W 2 DC-lights (6 W each), radio (7.5 W) 19.5 4 23
20W 2 DC-lights (6 W each), 1 Black and white TV (25 W) 37 4 43
50W 4 - 5 DC lights (8 W each), 1 black and white TV
(50W)
61 5 89
* Assuming availability of system of 80% per year. It should be noted that in practice households may use less or more appliances than assumed here. If one looks at the kWh-figures of Table 4.2 they are too high to for the respective Solar Home Systems. This indicates that this methodology still has its flaws. Currently, no empirical information is available on these figures. Under an MMS scheme the number of appliances households use on average may be verified in a household survey and the formula above could be incorporated accordingly. For the purpose of transaction costs calculation in this study an average system size is taken as of 20 Wp with kWh production of 15 kWh. If PV is included into the MMS, the kWh production of other system sizes can be found in the table presented in Appendix E.

ECN-C--03-089 57
4.2.2 Verification of photovoltaic system sales
The solar companies will submit a registry of sold photovoltaic systems for which it would like to claim green certificates. Verification of the photovoltaic system sales is required to ensure that all photovoltaic systems have indeed been sold to an end-user. If verification reveals that the solar company has included non-existing photovoltaic system sales, it should be removed from the MMS scheme and be sued for fraud. Two options have been identified for streamlined procedures for verifying the sales figures of photovoltaic systems provided by the companies:
• PS1: Household survey approach.
• PS2: Verification of financial administration.
Below a description is presented of both options, along with a qualitative evaluation of the op-tions according to criteria such as transaction costs, robustness and applicability in China.
Option PS1 - The household survey approach In the household survey approach the verification of photovoltaic system sales is done through a household survey of installed photovoltaic systems implemented by an independent verification team. For each participating company a random sample of photovoltaic systems sold in the past period will be drawn and will be visited. The outcome of the sample survey will then be trans-lated to the total number of photovoltaic systems sold by the examined company. As long as certain statistical requirements for drawing sample sizes are taken into account, this approach will deliver reliable results. The disadvantage is that the costs of implementing a household sur-vey are quite high.
Transaction costs The transaction costs for this verification option are directly related to the sample size, which is influenced by the following factors:
• Total number of systems sold per company. Transaction costs for companies who sell many photovoltaic systems will be lower than for companies with small photovoltaic system sales. The reason behind this is that the requirements for sample size is not linear to the number of systems sold. A larger population of systems to be researched will have lower transaction costs per system. (See Section 4.2.4 below on transaction costs for a further discussion of sample size determination).
• Frequency of verification - Having a lower frequency of verification increases the number of systems to be verified per company and thus positively affects the transaction costs per sys-tem. There is, however, a trade-off with accuracy: waiting too long with the household sur-vey decreases chance of finding a system in the field because systems are mainly used by herdsman. For calculation purposes we have assumed a frequency of 2 years.
• Minimum level of certainty required - The higher level of certainty is required on the valid-ity of the sample results, the larger the sample size needs to be. The degree of certainty rec-ommended in other studies is 90% (See Violette, 2001; Uzzell et al, 2001).
Robustness The approach of taking sample sizes is considered to deliver solid results as long as certain sta-tistical requirements for drawing sample sizes of the household survey are taken into account (See Violette, 2001; Uzzell et al, 2001). Section 4.2.4 on transaction costs provides an overview of different sample sizes and their translation to robust outcomes.
Applicability to MMS in China The monitoring and verification under this option was applied by the WB REPD programme. An independent auditing firm has been hired by Programme Management Office (PMO) of the REDP to do sample checks of sold systems. In the first tranche of around 9 companies and 25 households per company were at randomly visited to check the availability. The audit firm of

58 ECN-C--03-089
the PMO has produced its first monitoring report produced by the audit firm. As mentioned there, this approach has experienced quite some difficulties in the first verification attempt. Problems they encountered included difficulties with translating names of minority groups into Chinese characters and tracing systems because of moving herdsmen. Nevertheless, the PMO will no doubt learn useful lessons and be able to reduce transaction costs in the future. This use-ful experience will be of no doubt very useful for an MMS, if it wants to include photovoltaic systems. Direct feedback from the solar companies indicated difficulties with this methodology. The companies interviewed have very little trust in the ability to retrieve the photovoltaic systems: the most optimistic estimate given was that 70% of the systems would be retrievable, other thought the chance was lower than 50%. The reasons given for this are that most customers are herdsmen without a fixed settlement. Also the locations where the systems are installed are so remote that they are hardly accessible. One of the directors of the solar companies provided feedback to possibly improve this monitor-ing and verification procedure. The existing administrative capacity in villages/townships has useful knowledge on what is happening in their area which could complement the expertise of the independent verification team. Possible examples include:
• Local officials could receive the addresses from households in their village/county from the photovoltaic system sales registration reports and could be asked to verify if addresses do exist.
• Local officials are also more familiar with the trekking habits of nomadic herdsmen and may for instance know the winter location of the herdsmen.
• The audit team could delegate part of the household survey to township/village officials in the areas they want to monitor.
Option PS2 - Verification of financial administration of solar companies Like any other company, solar companies in most countries are subject to tax payment and will need to have their financial accounts audited by an independent auditor. Since a financial audi-tor will also verify the sales receipts (invoices) of a company, its annual photovoltaic system sales can in principle be determined from its financial records. Hence it would require relatively little additional effort to use the same procedures for verification of photovoltaic system sales. Feedback from solar companies in other countries indicated that this system could be a viable approach (see Martens et al, 2001). Most solar companies are being audited for tax purposes and in case they are not audited, they did not perceive it as a problem to ask for additional financial auditing. The purpose of verification of photovoltaic system sales is to double-check that the registered photovoltaic systems have indeed been sold and no green certificates are claimed for fake PV panels. The verification through financial records involves three steps: 1. Step 1 involves the verification of the serial numbers of PV modules and compare them with
the financial records of the PV manufacturers to ensure that they really have been supplied (Martens et al, 2001). The system of verification of PV serial numbers is system is also used by the SETC REPD programme and functioned well (personal communications, SETC REPD staff, 2002).
2. A second check is required to verify that the PV panels have indeed been used for the pur-pose they have been sold. This can be verified by checking the sales receipt of the clients. If a local utility buys PV panels for a village power project the administration of the solar company should show an invoice to that utility. The practice of invoicing can be adjusted as to include serial numbers of PV panels in case that is not already done.

ECN-C--03-089 59
3. Further investigation may be required in case fraud or corruption is suspected. This could involve double-checking the financial records of the solar company’s clients or of PV export registers. This may be best done in coordination with the tax office as they have similar in-terests in retrieving frauding companies and will include an additional deterrent for partici-pating companies not to fraud.
Robustness The attractiveness of coupling verification of sales registration with the financial auditing sys-tem is that it would provide an effective check against fraud. Cheating with photovoltaic system sales under MMS would mean cheating with the tax statements, which is a criminal offence un-der Chinese law. Coupling MMS certification with the tax system introduces even less incentive for tax evasion. Evading tax payments by understating the number of photovoltaic systems sold would lead to less MMS revenues. Likewise, overstating its number of systems sold to claim more green certificates would lead to higher tax payments and is thus also less attractive. Nevertheless, despite the link with the tax system solar companies could manipulate their photovoltaic system sales by increasing the stocks at their dealers and advance the MMS certifi-cation for those systems. It is not likely that there is much incentive to do this because the op-portunity costs involved (advanced tax payments and costs of storage) are likely to outweigh the benefits. A more serious threat is that solar companies could commit fraud with their PV panel sales through double counting of the PV panels. The following example will illustrate this. If a solar company sells photovoltaic systems and at the same time supplies PV panels to village power systems, the solar company could register the PV serial number of the PV panels it sells to the village power project as a photovoltaic system and claims the green certificates of these panels as photovoltaic systems. At the same time it is likely that the PV village power system will re-ceive green certificates because their kWh production is metered. There are a number of methods to prevent this fraud from happening. Firstly, the photovoltaic system sales to the dealer will be tracked in the financial records by comparing the PV serial numbers for the PV Panel. Since smaller PV panels (20 Wp and smaller) do not have any other use than photovoltaic system for these systems only comparing the PV-serial number in the tax systems may be sufficient. Since it is likely that other PV panels will register for green certificates it may be useful to con-sider one large integrated database of all PV panels sold in China and for what application they have been used. Verification of PV serial numbers of all PV panels would facilitate tracing dou-ble counting. To further improve the rigor of this methodology the MMS authority could carry out more ran-dom checks of the administration of solar companies and their dealers. Co-ordination with the tax office is likely to function as a further deterrent to fraud.
Applicability to MMS in China Interviews among solar companies in China revealed that photovoltaic systems are sold via lo-cal rural dealers who are not being audited by independent accountants. Being small companies, photovoltaic system dealers pay a fixed tax to the government, which is independent of the amount of photovoltaic system sales. Nevertheless, with some adjustment this system could still be applied on the level of solar companies. Their audited financial records do not show end-user sales but do show the number of photovoltaic systems they have delivered to their dealers. This could be used for verification purposes as it is safe to assume that photovoltaic systems deliv-ered to the photovoltaic system dealers equals the number of photovoltaic systems that have been deployed to end-users (with some time lag).

60 ECN-C--03-089
Solar companies in China can be classified in three tax categories.
• Companies who pay Value Added Tax (17% of the income generated by the companies). Companies with a turnover larger than RMB 2.8 mln fall into this category.
• Companies who pay sales tax of 6% of total sales turnover.
• Small companies who pay only a fixed monthly tax (roughly RMB 1,000 per month) inde-pendent of the income or turnover.
In China the system of verification of financial audits for category 1 and 2 is similar as in other countries. Chinese companies pay tax on the base of their turnover. A company prepares its fi-nancial accounts including a balance sheet and a profit-&-loss account. An independent finan-cial accountant verifies financial accounts and the company submits its verified financial ac-count to Chinese tax office. The tax office also has special audit teams to do at random checking of the financial records of companies. Feedback from the REDP revealed that of the 26 companies who submitted financial documen-tation 2 companies fall within category 1, 15 companies in category 2 and 9 companies in cate-gory 3. In theory this means that 17 companies out of 26 (65%) could have its photovoltaic sys-tem sales verified through its financial administration. In sales this figure would be even larger since the companies in category 3 are the smaller companies. In practice, however, this conclu-sion may not be valid. The tax rules and financial auditing practices are relatively new in China and tax discipline may be less than optimal among smaller companies especially ones operating in remote areas. This means that even companies falling under category 1 and 2 could have a relatively large percentage of their sales outside their official administration. These systems would then not be incorporated in their photovoltaic system end-user database and hence they would not receive green certificates for these systems. Participation in the MMS would then be less attractive: companies wanting to claim MMS subsidy for their informal photovoltaic system sales, would at the same time have to pay tax over these systems. The conclusion is that coupling MMS verification to the financial administration of solar com-panies in itself is a viable approach in China. A consequence is, however, that smaller compa-nies will be excluded from the MMS because their financial administration is not up to the stan-dard. Also other companies may not wish to participate since it would mean that they would have to pay taxes over previously not reported photovoltaic system sales. Over time, however, this barrier seems less relevant. Smaller solar companies will grow and tax discipline is likely to expand with the familiarization of tax rules in China. Indeed, MMS may be a stimulus for solar companies to improve their financial administration and tax discipline, which may be an added benefit of MMS for the Chinese government.
4.2.3 Verification of the performance of photovoltaic systems
Solar companies will only get MMS revenues for those photovoltaic systems, which are still op-erating. This verification needs to be applied to all photovoltaic systems, which are still in the MMS database, i.e. all sold photovoltaic systems since the beginning of the participation of the solar company in the MMS. Three options have been identified for verification of the performance of photovoltaic systems:
• PP1: Household survey.
• PP2: Battery certification approach.
• PP3: Up-front subsidy.
Option PP1 - Household survey As described above under option PS1 in Section 4.2.2, this approach is based on a survey of a sample of at randomly selected households. The disadvantage of this approach is that the im-plementation costs are quite high due to the need of having a sufficiently large sample size. In

ECN-C--03-089 61
Section 4.2.2 it was mentioned that sample size and hence transaction costs per photovoltaic system is affected by total numbers sold per company, frequency of sampling and the level of certainty required. In addition, for verification of the system performance the following observa-tions are relevant.
Transaction costs Since all photovoltaic systems since the beginning of the participation of the solar company in the MMS need to be verified, the total population of photovoltaic systems to be verified is much larger. Hence the transaction costs per photovoltaic system are likely to be lower than they would be in the case of verification of photovoltaic system sales (option PS1 in Section 4.2.2).
Robustness & Applicability to MMS in China Regarding robustness of the verification method and applicability in China the same arguments can be given as presented in Section 4.2.2 under option PS1.
Option PP2 - Battery certification approach This verification approach is based on the long known fact that the battery is the weakest link in a photovoltaic system. It also is the component, which will ensure that end-users are still con-suming electricity: If end-users buy a new battery for its photovoltaic system, than the photo-voltaic system is still functioning and it does deserve green certificates for that revenue. The ap-proach consists of the following elements:
• A participating solar company will receive green certificates per battery it sells. Only batter-ies that meet a certain technical standard will be qualified. In the end-user database the bat-tery will be linked to the PV panel to determine how many kWh it generates per year.
• The green certificates per battery will also be dependent on the guarantee period a solar company provides to the end-user: If the solar company provides a 1 year guarantee on a battery, it will get GC payments for 1 year, it provides 2 year guarantee it will get a GC payment for 2 years and can thus provide a higher subsidy, which would make higher qual-ity batteries more attractive to end-users.
• To ensure that battery failure is really the cause of a not-functioning photovoltaic system, participating solar companies should offer a free maintenance check in their workshop as part of the guarantee package.
• Verification consists of two parts: the number of batteries sold needs to be included in the verification of the financial administration of photovoltaic systems (see option PS2 in Sec-tion 4.2.2). Besides, participating photovoltaic system dealers need to be verified to ensure that they offer the warranty terms to the end-user. Since photovoltaic system dealers live in accessible areas (county towns), verification costs will be greatly reduced.
• If GC revenues are sufficiently large enough, the MMS benefits can be transferred to the end-users by obliging the solar company to transfer the GC revenues as a battery subsidy to the end-user. For a 10 Wp photovoltaic system, a GC price of RMB 2/kWh provides a 20% price reduction of a battery. A price of RMB 3/kWh will result in a price reduction of 30%.
Robustness The crucial element in this approach is the extent to which end-users will claim a new battery if it fails within the warranty period. In case end-users do not keep photovoltaic system shops to the terms of sale, photovoltaic system dealers can easily promise larger warranty periods and will thus get more GC revenues. One way to restrict this risk is to put an upper limit on the number of years photovoltaic system dealers can claim GC revenues for a battery. Only batter-ies with exceptional performance (for instance solar batteries) are then able to claim more reve-nues.
Applicability to MMS in China A crucial element is that the benefits for solar companies need to be high enough to seduce them in participating and go to the additional trouble of administration. If solar companies have a

62 ECN-C--03-089
threshold value of 5% (that is the GC revenues need to be at least 5% of the battery price), then the minimum GC price should be roughly around RMB 0.50/kWh. This approach is also new and untested (globally) and a pilot phase test would be advised before it is used in an MMS scheme.
Option PP3 - Upfront subsidy for PV modules Monitoring of operating photovoltaic systems in the field is the most important factor, which increases transaction costs for certification of photovoltaic systems. Hence, there is likely to be an important scope for reduction of transaction costs if one of the key principles of MMS, certi-fication after generation of kWh’s has been proven, is abandoned. Instead, photovoltaic systems are subsidised upfront once the sale of a photovoltaic system has been proven. This option is very much in line with the way the NDRC REDP project hands out subsidies to solar companies in its current programme. If upfront subsidy would be applied under a green certificate scheme, an upfront subsidy could be incorporated by multiplying of the kWh generation with the system’s lifetime (for example equal to the guarantee on the PV panel) and the percentage of photovoltaic systems operating taken as an average over the lifetime. This latter figure can for example be taken from existing performance factors of PV systems and be updated every now and then via a small household survey. The disadvantage of this upfront subsidy is that it looses all the attractiveness of an MMS scheme. Since there is no direct feedback to a solar company on the performance of the photo-voltaic systems it sold, there is no clear incentive to improve quality: ‘good guys suffer from the bad guys’. A further option to reduce transaction costs is to provide upfront subsidy for all PV panels sold in China. Since there are fewer PV suppliers than solar companies, sales verification could even be more streamlined than system sales registration.
Robustness The robustness for upfront subsidy for photovoltaic systems are equal to the robustness of the sales verification (see the discussion of options in Section 4.2.2). Expanding the option to upfront subsidy of all PV panels would entail however two more risks. The first risk factor, which needs to be mitigated, is that systems being sold for export should not receive green certificates. However, as mentioned in Section 4.2.2 on sales registration, the verification of the sales via the financial accounts of PV companies has intrinsically a number of disincentives against committing fraud with PV panel sales. This system could be made even more rigorous sample checking the serial numbers of PV panels, which are exported. Since certification of PV panel occurs upstream at the source of production or import, there is a chance of double counting of panels if the electricity they produce downstream is again certi-fied, for example if a panel is used in a village power project. This risk can be mitigated by es-tablishing the rule that PV power projects are not eligible under MMS but that instead PV pan-els receive a fixed number of green certificates per Wp. Establishing one large integrated data-base of all PV panels sold in China and include a description for what application they have been used can assist in the verification of this rule.
Applicability to MMS in China By measuring the performance of all photovoltaic systems in China and not per company the sample size of a household survey can be much smaller and selecting representative sample will be easier. The survey also does not need to be implemented every year. These two factors will reduce transaction costs greatly as compared to option PP1.

ECN-C--03-089 63
4.2.4 Transaction costs analysis for photovoltaic system verification approaches
A transaction costs model has been developed to estimate the transaction costs of the verifica-tion procedures described in the previous sections. In the model the costs of certifying DRE op-tions have been estimated over a period of maximum 20 years. These 20 years consists of sales of a technology over 10 years plus the lifetime of a technology (maximum used is 10 years). The costs and benefits have been discounted to year 0 using a discount rate of 6% and are ex-pressed in RMB per kWh.
General cost assumptions The costs for conducting household surveys have been based on the experience of the REDP programme with surveying household. These costs were 536 RMB per household visited. For other verification options, own estimates have been made using the following assumptions.
• It is assumed that in total 50,000 photovoltaic systems are sold per year by 20 participating companies. This makes average photovoltaic sales per company 2,500 per year.
• The average size of a photovoltaic system is assumed to be 20 Wp.
• Green certificates per system are calculated based on the assumption of 15 kWh generation per year.
Cost assumptions for option PS1: sales verification through household survey For the household survey it is assumed that local Chinese consultants will implement the sur-vey. The key variable in this analysis are: sample size and the costs of the survey. For the costs of the survey the cost estimate of the REDP programme has been used: 536 RMB/households. These costs are an average of the cost of a team of consultants based in Beijing, who are respon-sible for training the regional consultants, regional consultants who select, train and manage the local surveyors, local surveyors who interview the households12. Verification of the sales revolves around the issue of detecting fraudulent companies: companies who claim green certificates for more systems than they have sold. The difficulty with research-ing this question is that there are other factors which could result in the fact that a household cannot be found, such as a household could have moved or the name could be unidentifiable. Determining the required sample size for the household survey is complicated by these factors as well as a number of other factors (for example how strict the MMS authority wants to be in detecting fraudulent companies). For these reasons, no effort has been made to further deter-mine the optimal sample size. Instead a sample size of 60 has been taken, which is sufficiently large to draw conclusions from. In summary the following assumptions have been used for the transaction costs analysis:
• Transaction costs per household RMB 536/kWh.
• Number of companies 20.
• Sample size is 60.
• Frequency of sampling is every year.
• 6 internal flights for the verification team for 3,000 RMB each.
• Transaction costs per year are RMB 660,000.
Cost assumptions for option PS2: Verification of financial administration of solar
companies This activity involves the costs required to send a special accountant to verify the books of solar companies. To be on the conservative side of estimating the transaction costs, it is assumed that a financial auditor will every year double check the financial administration of the participating solar companies. It is estimated that such an auditor would require 3 days per solar company for such a task. The costs consist of the following components:
12
The costs for developing the methodology and questionnaires (roughly RMB 60,000), have not been incorporated in the transaction costs here. They are assumed to be one off costs to be incurred at the beginning of the MMS.

64 ECN-C--03-089
• Financial auditor RMB 1,000 per day.
• Number of days per company: 3.
• Number of solar companies 20.
• Travel cost auditor RMB 400 per company
• Transaction costs per year: RMB 68,000.
Cost assumptions for option PP1: Household survey The choice of the sample size depends on the statistical requirements relating to total population and sample size. Since the sample size is not directly linear with population size, the assumption of the average sales per company has quite a large impact on the total transaction costs. This is illustrated in Table 4.3. Table 4.3 The relationship between photovoltaic system sales (N) and sample size (n) per total
number of systems that have to be surveyed (ß.n)
Number of solar companies (ß)
System sales per company (N)
Sample size per solar company (n)
Total sample size (ß.n)
Transaction costs
5 10,000 160 800 428,800 10 5,000 160 1,600 857,600 15 3,333 158 2,370 1,270,320 20 2,500 155 3,100 1,661,600
30 1,667 150 4,500 2,412,000 40 1,250 146 5,840 3,130,240 50 1,000 142 7,100 3,805,600 Note: N has been calculated using the assumptions: p = 80%; confidence level 90%, pmin (90%) = 76% in the formula:
p(min, 90%) = p - 1.282 √ [p × (1-p) × (N - n)/(N × (n - 1))]. 13,14 Table 4.3 shows that when the sales volumes per solar company (N) drops significantly, the sample size per solar company (n) does not. As a consequence, the total number of systems which need to be verified (ß.n) becomes increasingly larger when many small solar companies participate in the MMS. Since transaction costs are linearly related to the amount of systems that need to be surveyed, they also increase with the same factor. On the other hand, there is a ra-tionale for having the monitoring sample reduce over time on the fact that after the initial sam-ples further samples are building on information collected in prior samples, i.e., it only has to confirm previously found results (Violette, 2001). In summary, the following assumptions have been made:
• Verification costs are 536 RMB/kWh per household.
• 20 solar companies participating.
• Frequency of sampling: every 2 years.
• Sample size of 160 in the first year gradually reducing to 60 in year 8 and further.
• 6 internal flights for the verification team for 3,000 RMB each.
• Transaction costs every 2 years range from RMB 1,700,000 to RMB 660,000.
13 What this formula in practice means is that in case a sample shows an average performance rate of 80%, the
figure of 76% can be used as the average performance rate for the total population. This applies for all the combinations of population and sample sizes shown in Table 4.x. In case a higher sample size in relation to population size was chosen, the Pmin (90%) figure would be higher than 76%. Hence, there is a trade off between transaction costs (sample size) and total green certificate revenues (Pmin (90%)-value × N). Once the population size N is known, the optimal sample size (n) is the sample size for which the additional transaction costs of increasing the sample are equal to the additional revenues for green certificates.
14 Since the population of photovoltaic systems per solar company grows over time, the required sample size will tend to 160 over time.

ECN-C--03-089 65
Cost assumptions for option PP2: Battery certification approach The verification in the transaction costs analysis of the battery certification approach is based on verification of the solar dealers instead of the solar companies. The following assumptions have been made:
• The average number of dealers per solar company is 10.
• 20% of the dealers will be verified every year (that means that 2 dealers per solar company are verified every year).
• It is assumed that the local verifiers would take 1 day to verify a dealer.
• Local verifiers cost RMB 500 per day and require RMB 500 for total travel costs.
• Transaction costs per year are: RMB 68,000.
Cost assumptions for option PP3: Verification of the upfront subsidy approach No additional monitoring of photovoltaic systems is required under upfront crediting. Instead, a household survey will be implemented on a regular basis to estimate the empirical values of the system. The empirical study has been based on the following assumptions:
• The costs are similar as the ones of the REDP and are 536 RMB/households.
• Sample size per time are 200 households.
• Frequency every 3 years.
• Preparation costs RMB 60,000.
• Flight costs: 6 internal flights costing RMB 3,000 each.
• Transaction costs of RMB 185,000 every 3 years.
Evaluation of transaction costs Table 4.4 shows the transaction costs per kWh of the M&V options analysed in this section, the costs as a percentage of the green certificate price (taken an average green certificate price of 3.9 Fen/kWh based on Meier, 2002) and the multiplier that is required to meet the threshold of 10% of the MMS revenues. Table 4.4 Transaction costs (RMB cent/kWh) of verification options for photovoltaic systems
Transaction costs15
[Fen/kWh]
Cost as a [%] of the GC price*
Multiplier required**
Sales verification
Option PS1 - Household Survey 8.9 Option PS2 - verification of financial accounts 0.6 Performance verification
Option PP1 - Household Survey 6.3 Option PP2 - Battery certification 0.9 Option PP3 - Upfront subsidy 0.5 Total transaction costs
Option PS1+Option PP1 15.2 390 39 Option PS1+Option PP2 9.8 251 26 Option PS1+Option PP3 9.4 241 25 Option PS2+Option PP1 6.9 174 18 Option PS2+Option PP2 1.5 39 4 Option PS2+Option PP3 1.1 26 3 * GC price of 3.9 Fen/kWh has been used (Meier, 2002) ** Multiplier required to meet 10% GC revenues threshold criterion. Table 4.4 shows that none of the MMS options nor the upfront subsidy option meet the 10% threshold criterion. However, there is still a possibility that DRE-systems will get preferential
15 Transaction costs are based on a discount rate of 6%. If a discount rate of 12 % is used transaction costs
(Fen/kWh) slightly higher: PS1 9.6 ; PS2 .7; PP1 7.3; PP2 .98; PP3 .57

66 ECN-C--03-089
treatment under the MMS and that a multiplier will be applied. Table 4.4 shows the required multiplier values for each option in order to meet the 10% threshold criterion That means a mul-tiplier value in the range of 3-39 is required to make the options attractive enough for inclusion into the MMS.
4.2.5 Summary of photovoltaic system verification procedures
Photovoltaic system monitoring is almost by definition a very difficult exercise. The natural niche market for photovoltaic systems are those users who live in remote and difficult to reach areas. The experience with household surveys by the NDRC REDP programme has learnt that photovoltaic systems monitoring in China is even more difficult. Almost 97% of the population of China has been electrified. Photovoltaic systems are only used by (semi) nomadic herdsmen who live in remote mountainous areas and for whom micro-hydro turbines are not an alterna-tive. The problems in retrieving these end-users by means of a field survey are huge and even though there is scope for improving monitoring through learning-by-doing, the transaction costs analysis shows that the transaction costs are likely to remain prohibitively high. This research has therefore focused on analysing alternative approaches to reduce transaction costs of verifica-tion. Table 4.5 summarises the two sales verification options on basis of robustness, applicability in China and transaction costs. Table 4.5 Verification of system sales
Sample survey Verification of financial accounts of solar companies
Description. A household survey will
be held among a sample of
all sold photovoltaic systems in the previous
year.
Existing financial records, containing relevant
information on the sales of systems can be verified by
independent financial auditors for the purposes of MMS.
Robustness. High if statistical
requirements are applied.
Reasonably high. The robustness of this system is
similar as with the tax audit system. Options are
available to improve robustness of procedure.
Applicability in China. Difficult, but is expected
to improve over time.
Procedure has yet to be applied. Financial auditing
practices among solar industry needs to be more widespread.
Transaction costs. Very high. Low.
Table 4.6 provides a comparison of options for verification of the performance of photovoltaic systems. Table 4.6 Summary of options for verification of photovoltaic system performance
Sample survey 1
(per company)
Battery certification Upfront subsidy
Description. A sample survey will be
held per solar company to
determine the performance
ratio of its photovoltaic systems.
Guarantee periods of
batteries are taken as the
basis of certifying
photovoltaic systems.
No monitoring is required.
Periodically, a sample
survey will be held to
collect empirical data to validate assumptions
behind certification.
Robustness. High. Needs to be tested. Reasonable
Applicability in China. Difficult. See above. Procedure has yet to be
applied. Depends on
quality of financial auditing practices among
solar industry in China.
Feasible. There is
experience with scientific
photovoltaic system research in China.
Transaction costs. Very high. Moderate. Low.

ECN-C--03-089 67
4.3 Framework for monitoring and verification procedures for mini-hydro
installations
Non-metered mini-hydro turbines supply many households and small-scale communities in mountainous areas in Western China. Most of these systems are smaller than 5 kW and supply a few households. Smaller systems (1 kW or smaller) are used by a single household. This section describes the options for verification of micro-hydro installations under an MMS scheme and evaluates these procedures on their robustness, applicability in China and transaction costs.
4.3.1 Estimation of kWh production of a mini-hydro system
Standardising kWh measurements for micro-hydro turbines will be more difficult given that there is likely to be a large variation in flow and head between the different micro-turbines. Also estimating the end use capacity may not be satisfying as micro-turbines are often used for more than one household. A capacity increase does not necessarily mean the use of bigger appliances but could mean more households with smaller appliances. This makes it difficult to estimate what type of appliances is likely to be used for a given size of micro-hydro turbine. The best so-lution seems therefore to make an estimate of average annual kWh production on basis of a field survey among a number of micro hydro stations and update this average every few years. For the purpose of the calculations in this study we have assumed that households use around 4 hours of electricity on average per day, 80% of the days per year. Given the poor state of many micro-hydro units, it is assumed that they operate on 67% of their rated capacity. For average size of the household connection capacity 250 W system has been taken with an average power production 196 kWh per year.
4.3.2 Verification of mini-hydro sales
Two options have been identified for the verification of the mini-hydro installations deployed:
• Option HS1: The household survey model.
• Option HS2: Verification of the financial administration of mini-hydro equipment suppliers.
Option HS1 - The household survey model As in the case of photovoltaic systems, in this model the dealers of mini-hydro turbines keep a list of their customers and an independent verification team will verify the results. Although the research team did not manage to interview a micro hydro turbine dealer, it became evident from other interviews that their distribution network is less widespread and more distant than in the case of photovoltaic systems. This may hinder successful follow up of households through mi-cro-hydro dealers. On the other hand, verification should be simple as micro-turbine users are more accessible than photovoltaic system users.
Option HS2 - verification of financial administration of mini-hydro equipment suppliers In the province of Sichuan, the Agricultural Machinery Bureau (AMB) is quite active in moni-toring of mini-hydro units and providing O&M services. Given the potential cost synergies the AMB is included as one of the alternative verification procedures. The AMB is already main-taining a database of mini-hydro users, including system information and address information of the users, which could serve as a registration list for MMS. Users will be asked to send their ad-dress, system characteristics to AMB (preferably including a system serial number) and a copy of their sales receipt to the AMB for inclusion into the AMB customer database. Verification can occur by comparing the details of the AMB database with the sales list of mini-hydro turbine sellers. This requires random checking of micro-hydro turbine dealers to verify if these systems occur in their books.

68 ECN-C--03-089
4.3.3 Verification of system performance
Three options have been identified for verifying the performance of mini-hydro installations:
• Option HP1: Household survey.
• Option HP2: Agricultural Machinery Bureau Model.
• Option HP3: Upfront subsidy.
Option HP1: Household survey Similar to the option PP1 presented in Section 4.2.3 a household survey could be implemented on basis of which mini-hydro turbine sellers could receive green certificates for the sold micro-hydro turbines. Alternatively, the Agricultural Machinery Bureau could implement through its officers an annual household survey to monitor the performance of photovoltaic systems. To minimise transaction costs the household survey should be implemented in coordination with the verifier.
Option HP2: Agricultural Machinery Bureau model As opposed to the PV sector, the dealers of micro-hydro turbine do not play a very active role in distribution and maintaining customer relations. Instead, a government agency called the Agri-cultural Machinery Bureau (AMB) is filling this gap. As of 2002 the province of Sichuan through the AMB has begun an ambitious programme to improve the operations of micro-hydro systems in Sichuan. The AMB’s micro-hydro model will involve the setting up of a technical service network through the AMB offices in the counties. Since the AMB would require addi-tional funding to extend this service to all its rural counties, MMS could be a useful means to this end. AMB could offer end-users a service contract and receive their green certificates as a payment for their efforts. Depending on the amount of the MMS revenues, the AMB could be obliged to give the end-user also a down payment on spare parts. An advantage of this model is that running service contracts with end-users requires an exten-sive administration of the performance of the client systems. This administration can be used for verification of the performance of micro-hydro turbines following similar procedures as under Option 2 of Section 4.2.2. One of the key principles of monitoring such administrations is that they include end-users payments for their service contracts. System performance can be derived from end-users payments following the principle: if an end-user pays its monthly fee, the system is performing, if it doesn’t pay, it is not performing. This would require that the end-user is charged a little additional fee, to indicate its interest in the service contract. If end-user paying a maintenance fee is not practically feasible, there are other ways to verify the enforcement of AMB’s obligations under its service contract, for instance an independent complaint line. Alternatively, there could be an end-user survey to check upon the performance of AMB. Note that this end-user survey does not need to be as extensive as under option HP1 (see sample size discussion on transaction cost for option PS1 in Section 4.2.4).
Option HP3: Upfront subsidy As in option PP3 described in Section 4.2.3, MMS could be used to provide an upfront subsidy to micro-hydro turbines.
4.3.4 Transaction costs of verification procedures for micro hydro turbines
For the transaction costs analysis of the verification procedures of for mini-hydro turbines a similar approach has been followed as for photovoltaic systems.
General cost assumptions Based on the information of the Sichuan AMB and micro-hydro developments in China, micro-hydro sales are estimated at 20,000 units per year for the following 10 years. It is assumed that

ECN-C--03-089 69
the average system will connect 4.7 households. Average household connection capacity is 250 W resulting in 196 kWh/year/per household. The performance rate is assumed 80%.
Option HS1: sales verification through the household survey approach Given that households are closer to accessible areas than photovoltaic end-users, the costs of surveying them have assumed to be 3 times cheaper than surveying for photovoltaic systems. Since micro-hydro turbines are not sold by specialist companies, the average sales of micro-hydro per participating company is likely to be quite low: on average 250 per year, with the consequence that there are 80 companies involved in the MMS. Assumptions made for cost calculation:
• Surveying costs per mini-hydro installation: RMB 179/kWh.
• Number of companies participating: 80.
• Sample size: 60 per company.
• Frequency of monitoring: once every year.
• 6 internal flights for the verification team for RMB 3,000 each.
• Total transaction costs per year: RMB 875,000.
Option HS2: Sales verification of financial administration of micro-hydro equipment
sellers This activity involves the costs required to send a special accountant to verify the books of hy-dro equipment suppliers. Similar assumptions as under solar have been assumed:
• Financial auditor: RMB 1000 per day.
• Number of days per company: 3.
• Number of hydro equipment sellers: 80.
• Transaction costs per year: RMB 240,000.
Option HP1: Performance verification through a household survey The estimated sample size for micro-hydro turbines follows the same statistical principles as explained under photovoltaic systems. In summary, the following assumptions apply: • Verification costs: 179 RMB/kWh.
• The sales of 80 hydro equipment suppliers participate.
• Frequency of sampling: every 2 years.
• Sample size of 160 in the first year gradually reducing to 60 in year 8 and further.
• 6 internal flights for the verification team for RMB 3,000 each.
• Transaction costs every 2 years range from RMB 2,300,000 to RMB 875,000.
Option HP2: Verification of performance using the Agricultural Machinery Bureau
service model approach
The AMB verification approach is based on a service model for micro-hydro users (see Section 4.3.3). It is assumed that AMB will receive the GC revenues of the end-users and will in return provide free maintenance of the systems to the households. The transaction costs are in this case really the expenses required to maintain a service infrastructure for the households. Such con-sists of the costs of personnel, travel costs, the demand for such services and the efficiency of the service engineers. This has resulted into the following assumptions:
• Costs of a hydro technician of AMB: RMB 100 /day.
• Local transport costs: RMB 400/day.
• Number of systems with a request per year: 25% (a system needs a service check every 4 years).
• Number of systems covered per trip by a service engineer: 4.
• The verification costs of the maintenance administration are expected to be part of the sales verification and have not been included.
• Total transaction costs range from RMB 230,000 to RMB 4,500,000.

70 ECN-C--03-089
It is important to note that the criterion for this approach is not 10% but 100%: AMB will get the full green certificate revenues and will in turn provide free service to the households.
Option HP3: Upfront subsidy for micro-hydro turbines The same assumptions as under photovoltaic systems prevail. No additional verification is re-quired and a household survey will be implemented every 3 years. The assumptions are:
• Costs of verification: RMB 179/system.
• Sample sizes: 200 households.
• Frequency of sampling: every 3 years.
• Preparation costs: RMB 60,000.
• Flight costs: 6 internal flights costing RMB 3,000 each.
• Transaction costs: RMB 115,000 every 3 years.
Evaluation of transaction costs The criterion used to evaluate the transaction costs is that costs should be lower than 10% of the MMS revenues; Table 4.7 shows that the transaction costs for household survey are considera-bly lower than for a household survey for photovoltaic systems, but still do not meet the crite-rion of 10% of revenues. The AMB service option should be compared with the criterion of 100% of the GC revenues, since the GC revenues will go to AMB in exchange of a service contract to the end-user. Table 4.7 shows that the costs (141%) are slightly above 100% and hence the AMB service model is a viable option if a modest multiplier is applied. The same applies for the upfront subsidy ap-proach. Table 4.7 Transaction costs [Fen/kWh] of verification options for mini-hydro installations
Transaction costs16
[Fen/kWh]
Cost as a [%] of the GC
price*
Multiplier required**
Sales verification Option HS1 - Household Survey 1.5 Option HS2 - verification of financial accounts 0.3 Performance verification Option HP1 - Household Survey 1.1 Option HP2 - AMB model 4.0 Option HP3 - Upfront subsidy 0.04 Total transaction costs Option HS1+Option HP1 2.6 67 7 Option HS1+Option HP2 5.5 141 2*** Option HS1+Option HP3 1.54 39 4 Option HS2+Option HP1 1.4 36 4 Option HS2+Option HP2 4.3 110 2*** Option HS2+Option HP3 0.34 9% 1
* GC price of 3.9 Fen/kWh has been used (Meier, 2002). ** Multiplier required to meet 10% GC revenues threshold criterion. *** In the case of the AMB model the threshold criterion is not 10% but 100%.
16
Transaction costs are based on a discount rate of 6%. If a discount rate of 12 % is used transaction costs (Fen/kWh) slightly higher: HS1 1.63 ; HS2 .34; HP1 1.24; HP2 4.1; HP3 .05
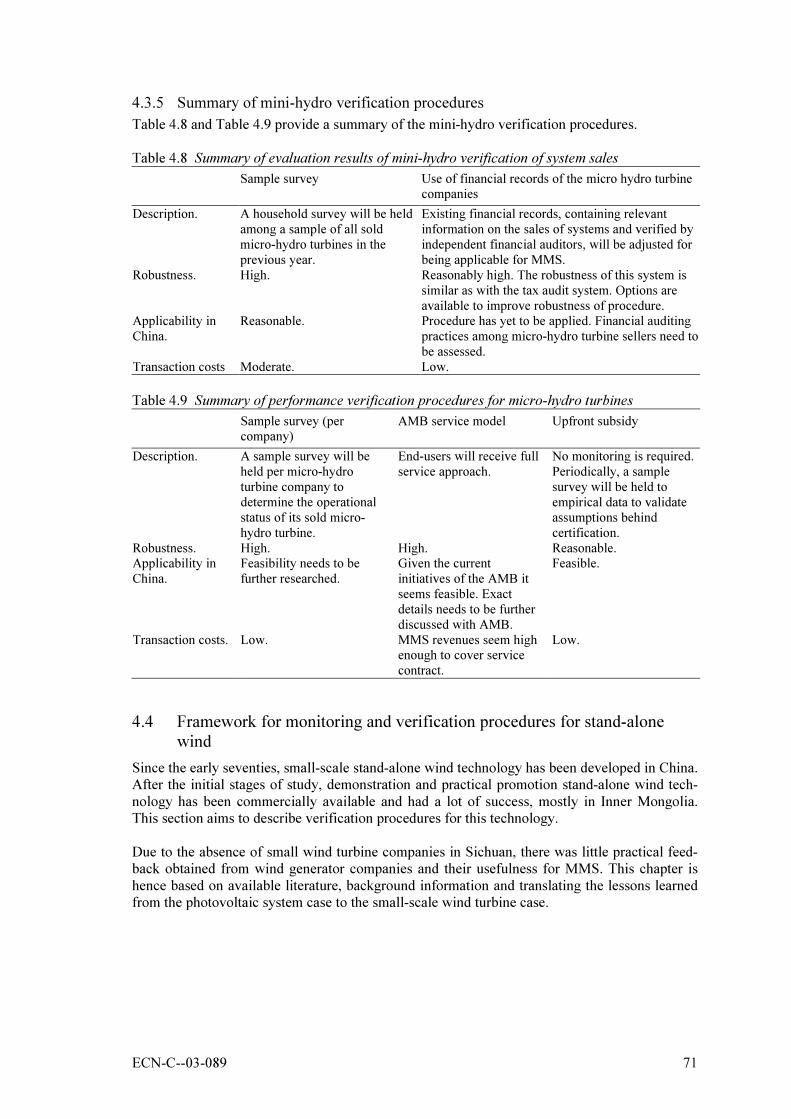
ECN-C--03-089 71
4.3.5 Summary of mini-hydro verification procedures
Table 4.8 and Table 4.9 provide a summary of the mini-hydro verification procedures. Table 4.8 Summary of evaluation results of mini-hydro verification of system sales
Sample survey Use of financial records of the micro hydro turbine companies
Description. A household survey will be held
among a sample of all sold
micro-hydro turbines in the
previous year.
Existing financial records, containing relevant
information on the sales of systems and verified by
independent financial auditors, will be adjusted for
being applicable for MMS.
Robustness. High. Reasonably high. The robustness of this system is
similar as with the tax audit system. Options are
available to improve robustness of procedure. Applicability in
China.
Reasonable. Procedure has yet to be applied. Financial auditing
practices among micro-hydro turbine sellers need to
be assessed.
Transaction costs Moderate. Low.
Table 4.9 Summary of performance verification procedures for micro-hydro turbines
Sample survey (per company)
AMB service model Upfront subsidy
Description. A sample survey will be
held per micro-hydro
turbine company to
determine the operational
status of its sold micro-
hydro turbine.
End-users will receive full
service approach.
No monitoring is required.
Periodically, a sample
survey will be held to
empirical data to validate
assumptions behind
certification.
Robustness. High. High. Reasonable. Applicability in
China.
Feasibility needs to be
further researched.
Given the current
initiatives of the AMB it
seems feasible. Exact
details needs to be further
discussed with AMB.
Feasible.
Transaction costs. Low. MMS revenues seem high enough to cover service
contract.
Low.
4.4 Framework for monitoring and verification procedures for stand-alone
wind
Since the early seventies, small-scale stand-alone wind technology has been developed in China. After the initial stages of study, demonstration and practical promotion stand-alone wind tech-nology has been commercially available and had a lot of success, mostly in Inner Mongolia. This section aims to describe verification procedures for this technology. Due to the absence of small wind turbine companies in Sichuan, there was little practical feed-back obtained from wind generator companies and their usefulness for MMS. This chapter is hence based on available literature, background information and translating the lessons learned from the photovoltaic system case to the small-scale wind turbine case.

72 ECN-C--03-089
4.4.1 Estimation of kWh production of a stand-alone wind turbines
Standardising kWh measurements for wind turbines will be more difficult given that there is likely to be a large variation in flow and head between the different wind turbines. An alterna-tive approach may be to look at the end-use side. From equipment specifications one knows more or less what type of appliances are used by households. Table 4.10 End-use appliances for small-scale wind generators
System
size
Type of end-use appliances used Total end-use
capacity [W]
Average use
[Hours/ day]
[kWh/year]**
50W 2 DC-lights (10 W each) 20 2.5 15
100W 2 DC-lights (10 W each), 1 Black and white TV (20 W)
40 4 47
200W 4 DC lights (10 W each), 1 colour TV (50 W) 90 5 131
300W Same as 200 W system plus refrigerator (120 W) 210 11* 517 * Only for the refrigerator for other appliances see (200 W system). ** Assuming availability of system of 80% per year. As with photovoltaic systems and mini-hydro, currently no empirical information is available on the average installed appliances in the field. The figures used here are based on recommended appliance use per system size17. Before this figure is used in an MMS scheme, the number of household appliance per type of wind turbine needs to be analysed. In this analysis we have used an average system size of 150 W with a kWh production of 89 kWh per year.
4.4.2 Verification procedures
Given the type of technology it is likely that the market for small-scale wind generators is pretty similar to the market of photovoltaic systems. Feedback that was received from one company confirmed this. The system size is mostly 300, 500 and 1000 W and is supplied through local dealers. Annual sales are 2 to 3,000 systems per year. Local dealers provide back-up support to clients and supply spare parts to the clients. The local dealers are independent companies but have good connections with the small wind manufacturer who train and support them where necessary. The identified procedures for verifying the systems are in line with the ones developed for photovoltaic systems:
• Option WS1: sales verification through household survey.
• Option WS2: sales verification through financial administration.
The identified procedures for verifying the system performance are in line with the ones devel-oped for photovoltaic systems:
• Option WP1 : Household survey.
• Option WP2 : Battery certification approach.
• Option WP3 : Upfront subsidy.
4.4.3 Transaction costs of verification procedures for stand alone wind turbines
Based on the information supplied by Chinese consultants, wind turbine sales are estimated at 25,000 units per year for the following 10 years. Average household connection capacity is 150 W resulting in 89 kWh/year/per household; The average availability of system per year is as-sumed 80%.
17 Unlike was the case with Solar Home Systems in Section 4.2.1, end-use consumption for wind does not exceed
capacity limits of wind systems using conservative resource regimes (20-25% wind availability).

ECN-C--03-089 73
Option WS1 : Verification of sales using the household survey approach The costs of household surveying have been estimated at half the costs of surveying photo-voltaic systems: RMB 268/kWh, since users of wind are in general in easier accessible areas than photovoltaic system users. The average sale per wind turbine company is assumed at 500 resulting in a market of 50 small-scale wind manufacturers. Assumptions:
• Surveying costs per small-scale wind turbine: RMB 268/kWh per household.
• Number of companies participating: 50.
• Sample size: 60 per company.
• Frequency of monitoring: once every year.
• 3 internal flights for the verification team for RMB 3,000 each.
• Total transaction costs per year: RMB 813,000.
Option WS2: Verification of sales using the financial administration of wind turbine manufacturers
This activity involves the costs required to send a special accountant to verify the books of wind turbine manufacturers. Similar assumptions as under solar have been assumed:
• Financial auditor: RMB 1000 per day.
• Number of days per company: 3.
• Number of wind turbine manufacturers: 50.
• Transaction costs per year: RMB 150,000.
Option WP1: Verification of system performance through a household survey The estimated sample size for small-scale wind turbines follows the same statistical principles as explained under solar. In summary the following assumptions apply: • Verification costs: RMB 268/kWh per household.
• 50 wind turbine manufacturers participate.
• Frequency of sampling: every 2 years.
• Sample size of 160 in the first year gradually reducing to 60 in year 8 and further.
• 3 internal flights for the verification team for RMB 3,000 each.
• Transaction costs every 2 years range from RMB 2,150,000 to RMB 816,000.
Option WP2: Verification of performance through the battery certification approach The verification in the transaction costs analysis of the battery certification approach is based on battery certification approach as explained under solar. The following assumptions have been made:
• The average number of dealers per wind manufacturer: 5.
• 20% of the dealers will be verified every year.
• It is assumed that the local consultants would take 1 day to verify a dealer.
• Local consultants cost RMB 500 per day and require RMB 500 for total travel costs.
• Transaction costs per year: RMB 80,000.
Option WP3: Upfront subsidy for small-scale wind turbines The same assumptions as under photovoltaic systems prevail. No additional verification is re-quired and a household survey will be implemented every 3 years. The assumptions are:
• Costs of verification: 268 RMB/system.
• Sample size: 200 households.
• Frequency of sampling: every 3 years.
• Preparation costs: RMB 60,000.
• Flight costs: 3 internal flights costing RMB 3,000 each.
• Transaction costs: RMB 123,000 every 3 years.

74 ECN-C--03-089
Evaluation of transaction costs Table 4.11 reveals that none of the MMS procedures meet the 10% threshold but neither does the upfront certification option. A multiplier of 5 makes both battery certification and upfront subsidy feasible from a transaction costs point of view. Table 4.11 Transaction costs (Fen/kWh) of verification options for stand alone wind systems Transaction costs
18
[Fen/kWh]
Cost as a [%] of
the GC price*
Multiplier
required**
Sales verification
Option WS1 - Household Survey 9.9
Option WS2 - verification of financial administration 1.2 Performance verification
Option WP1 - Household Survey 7.1
Option WP2 - Battery certification 0.5
Option WP3 - Upfront subsidy 0.3
Total transaction costs
Option WS1+Option WP1 17.0 436 44 Option WS1+Option WP2 10.4 267 27
Option WS1+Option WP3 10.2 262 27
Option WS2+Option WP1 8.3 213 22
Option WS2+Option WP2 1.7 44 5
Option WS2+Option WP3 1.5 38 4 * GC price of 3.9 Fen/kWh has been used (Meier,2002). ** multiplier required to meet 10% GC revenues threshold criterion.
4.4.4 Summary of stand alone wind turbine verification procedures
The conclusions for small-scale wind turbines are based on limited feedback from stakeholders. Nevertheless the transaction costs analysis indicated that based on transaction costs verification procedures are not feasible without a multiplier. Table 4.12 and Table 4.13 provide a summary of the conclusions. Table 4.12 Verification of wind turbine sales
Sample survey Verification of financial accounts of wind turbine
manufacturers
Description A household survey will be held
among a sample of all sold wind turbines in the previous year
Existing financial records, containing relevant
information on the sales of systems can be verified by independent financial auditors for the
purposes of MMS.
Robustness High if statistical requirements are
applied.
Reasonably high. The robustness of this system is
similar as with the tax audit system. Options are
available to improve robustness of procedure.
Applicability in
China
Seems feasible. Procedure has yet to be applied and tested.
Transaction costs High Low
18
Transaction costs are based on a discount rate of 6%. If a discount rate of 12 % is used transaction costs (Fen/kWh) are slightly higher: WS1 10.6 ; WS2 1.5; WP1 8.1; WP2 .52; WP3 .34.

ECN-C--03-089 75
Table 4.13 Summary of options for verification of photovoltaic system performance
Sample survey 1
(per company)
Battery certification Upfront subsidy
Description A sample survey will be held per wind turbine
manufacturer solar company
to determine the performance
ratio of its wind turbines.
Guarantee periods of batteries is taken as the
basis of certifying wind
turbines.
No monitoring is required. Periodically, a sample
survey will be held to
empirical data to validate
assumptions behind
certification.
Robustness High Needs to be tested Reasonable
Applicability in China
Difficult. See above Needs to be tested Feasible
Transaction costs Very high Moderate Moderate
4.5 Conclusions
In this Chapter several options for reducing the transaction costs of monitoring and verifying the number of DRE-systems sold and the operational status of these systems have been identified and evaluated for photovoltaic systems, mini-hydro installations and small wind turbines. The following main conclusions can be drawn.
Photovoltaic systems Monitoring of PV household systems is almost by definition a very difficult exercise. The natu-ral niche market for solar home systems are those users who live in remote and difficult to reach areas. The experience with household surveys by the NDRC REDP programme has learnt that monitoring of photovoltaic systems in China is even more difficult. Almost 97% of the popula-tion of China has been electrified. Solar systems are only used by (semi) nomadic herdsmen who live in difficult mountainous areas and for whom micro-hydro turbines are not an alterna-tive. The problems in retrieving these end-users by means of a field survey are huge and even though there is scope for improving monitoring through learning-by-doing, the transaction costs analysis shows that the transaction costs are likely to remain prohibitively high. This research has therefore focused on analysing alternative approaches to reduce transaction costs of verifica-tion. One of such alternatives is the use of the financial administration for system sales verification, which would greatly reduce the transaction costs related to that verification. Verification of the financial administration has been applied by REDP as a further check of the correctness of the information provided by the PV Companies. It is too early to conclude how well this system works in China. Transaction costs of these options all exceed the 10% threshold of MMS revenues but could meet this criterion if multipliers for DRE-systems will be applied in the range of 3 - 39. On ba-sis of robustness the sample survey option is the preferred option, followed by the upfront sub-sidy option. With respect to the applicability in China, both the verification of the financial ad-ministration as well as the battery certification option have not yet been applied in China.
Mini-hydro installations For mini-hydro installations only the upfront subsidy option meets the 10% threshold of MMS revenues. However, if multipliers in the range up to 7 are applied, all identified procedures meet this criterion. The robustness of the sample survey option and the AMB service contract option is high. With regard to the applicability in China, the sample survey and the AMB option are the most feasi-ble options. Taken into account the transaction cost, the most preferable route would be to link

76 ECN-C--03-089
the MMS scheme for mini-hydro with the AMB initiative on micro-hydro as it would mean pooling of resources with the highest service for the consumer.
Stand-alone wind turbines None of the identified verification options for wind meets the 10% threshold of MMS revenues, but if a multiplier could be applied in the range of 4 - 44 these options could meet this criterion. The evaluation of the identified options according to robustness and applicability resulted in the same outcome as for photovoltaic systems; with regard to robustness the sample survey is the best option; based on the applicability in China sample survey option and upfront option are the most preferred options.
ECN-C--03-089 77
5. IMPACT OF INCLUSION INTO THE MMS ON THE UPTAKE OF
DRE-SYSTEMS
5.1 Introduction
In Chapter 4 simplified monitoring and verification procedures have been presented for DRE-systems. The next question to address is: what would be the best MMS design option for stimu-lating DRE-systems and how much additional electricity will be generated annually from DRE-systems, if DRE systems are included into the MMS. It must be emphasised that the question here is not what is the best MMS policy instrument (feed in, tender system or RPS19) but rather what provision could be made within the MMS to stimulate DRE-systems once a particular in-strument (or combination of instruments) has been selected for the Chinese MMS. Three scenar-ios have been developed based on the MMS design options described in Section 1.3.1, which are summarised below. 1. Uniform support for all renewables: in this design option DRE-systems and grid connected RE systems are provided with the same degree of support, with no preferential treatment for DRE-systems. This is the single tier system and support mechanisms can take the form of a renewable portfolio standard (RPS), feed-in tariff or tendering system. 2. Differentiated support for on-grid and off-grid renewables: in this option DRE-systems and on-grid RE-systems obtain differentiated support. All DRE technologies are treated equally in the support received. The two-tiered MMS can be achieved in several ways:
• In a feed-in tariff system or a tendering system, a different tariff is used for off-grid and on-grid.
• In a RPS system a distinction is made between on-grid renewables and off-grid renewables, each with its own separate target. As described in Section 1.3.1 an alternative to the two-tiered MMS is to use a single MMS target but to introduce multipliers to give different weights to on-grid renewables and off-grid renewables. A multiplier of X means that 1 kWh of off-grid renewable power counts as X kWh of on-grid renewable power. In other words: if the target is T kWh of renewables and the multiplier is X, then supply of on-grid renew-
ables (A) and the supply of off-grid renewables (B) should satisfy: A+X×B≥T . Such a mul-tiplier would reflect the Chinese government priority attached to the promotion of DRE sys-tems, for example because of its role in poverty alleviation. Alternatively put, if the equilib-rium price of green certificates generated by on-grid renewables is P, per kWh of on-grid re-newables supplied (unit: RMB/kWh_on-grid) then the equilibrium price of green certificates
generated by off-grid technologies is X×P.20 The unit is RMB per kWh supplied by off-grid, which will be presented as RMB/kWh_off-grid.
In this Chapter the multiplier approach has been used to assess the impact of inclusion into the MMS on the uptake of DRE systems. 3. Fully differentiated support: DRE technologies and on-grid all obtain differentiated levels of support. Again, there are different ways in which a multiple tiered MMS system can be achieved:
• In a feed-in tariff system, different feed-in tariffs are used for on-grid renewables and the different DRE technologies.
19 Discussion on these different RE support instruments is presented in Section 1.3.1. 20 This assumes that prices are expressed on the basis of kWh supplied, and are not expressed in terms of on-grid
equivalent kWh.

78 ECN-C--03-089
• In a RPS system several subtypes of off-grid renewables are defined, each with a separate target. There is also a separate target for on-grid renewables. The multiplier approach can be used as an alternative to the multiple tier MMS, as described in Chapter 1, is to use a single MMS target but introduce multipliers to give different weights to various technologies. For example, a multiplier of X can be used for mini-hydropower and a multiplier of Y can be used for all other types of off-grid renewables. These different multipliers could be based on differences in income levels of the target population, differences in environmental impacts of the different technologies, and could also reflect differences in resource-specific supply costs. In the example provided, 1 kWh generated by off-grid mini-hydropower counts as X kWh of on-grid renewable power, and 1 kWh generated by other off-grid renewables counts as Y kWh of on-grid renewable power. In other words: if the target is T kWh of re-newables and the multiplier for mini-hydropower is X and for all other off-grid renewables Y, then supply of on-grid renewables (A), the supply of mini-hydropower (B) and the supply
of other off-grid renewables should satisfy: A+X×B+Y×C≥T The corresponding equilibrium prices for green certificates are XP for mini-hydropower (unit: RMB/kWh_MHP) and YP supplied for other off-grid renewables (unit: RMB/kWh_other off-grid).
Each of these basic design options has its own particular impact on the uptake of DRE-systems, both in terms of the total amount of power generated, the types of DRE technologies promoted and the associated costs. This, in turn, drives the poverty alleviation and poverty reduction im-pacts that may be expected from inclusion into the MMS. For example, the poverty reduction impacts of power generated by mini-hydropower may be more substantial than those of a simi-lar total amount of power generated from PV, simply because the first opens up more opportuni-ties for direct income generating activities, whereas PV mostly has an impact on quality of life (Chapter 6 presents a detailed analysis of the poverty impacts).21 It is therefore clear that the im-pact of inclusion into the MMS on the uptake of DRE-systems in aggregate and by technology should be of interest to the Chinese government. Note also that the multiple tier and two-tier options discussed above have different characteris-tics from the use of multipliers. If multiple tiers are used, the quantity of power generated by off-grid renewables is known, but the marginal cost is not. If multipliers are used, both the quantity of power generated and the cost are unknown - this will be open to the decision-making of the holder of the obligation to fulfil the MMS target. Finally, with a feed-in tariff the mar-ginal costs are known, but not the quantity supplied.
5.2 Methodology
5.2.1 DRE technologies considered
To be able to assess the impact on the uptake, supply curves need to be developed for green cer-tificates resulting from major DRE technologies, both for Sichuan Province and China as a whole. The DRE technologies that will be considered are those presented in Table 1.4 and Table 1.5, repeated here for convenience, with the exception of the PV minigrids.
21 And in addition, there could possibly be a positive long-term impact on income generation possibilities by
allowing more study in evening hours.

ECN-C--03-089 79
Table 5.1 Currently installed and potential markets for new DRE systems in Sichuan
Market segment Currently installed systems in Sichuan PV Wind Mini-Hydro
Stand alone systems 20,000 - 8,000 Mini-grids 50 villages - None
Potential market for new systems in Sichuan Unelectrified hsh 118,000 - 226,000 Replacement 5,000 - 8,000 New mini grids 2000 villages
(in total 10 MWp) - None
Table 5.2 Currently installed and potential markets for new DRE systems in China
Market segment Currently installed systems in China PV Wind Mini-Hydro
Stand alone systems 300,000 170,000 146,000 Mini-grids 1,000 villages - None
Potential market for new systems in China Unelectrified hsh 2,000,000 992,000 581,000 Replacement 100,000 85,000 146,000 New mini grids 20,000 villages
(in total 100 MWp) -
For the purpose of this study, only the potential markets are interesting, since there is no strong policy argument why already existing DRE systems should be provided with a windfall gain.22
5.2.2 Supply-demand analysis
An MMS defines demand for green certificates: a fixed demand, irrespective of price.23 Differ-ent options for the inclusion of DRE-systems into the MMS have different impacts for the up-take, which in an MMS with a single target means that the equilibrium price for on-grid renew-able power could change. It turns out that this happens for higher values of the multipliers; the price of on-grid renewables drops, and there is a dilution of the environmental impact of the MMS. To provide policymakers with the maximum of useful information, the following results are presented: • Outcomes if the impact on the equilibrium price in not taken into account. This information
is useful for policymakers who consider the possibility of (1) a two-tiered or multiple tier MMS or (2) a feed-in tariff with differentiated tariff levels. In this case, we have used the price of green certificates of 0.039 RMB/kWh as calculated by Meier (2002) for grid con-nected RE-systems throughout this chapter.
• Outcomes if the impact of the multiplier on the equilibrium price is taken into account. This is useful information for policymakers that consider the use of a single MMS target, but with different multipliers.
How can power supply cost curves for DRE-systems be developed? The relevant cost concept is the minimum compensation necessary to make the decentralised renewable power option attrac-tive. Theoretically, this is either:
22 In addition, there is the question to what extent existing systems can be included into the MMS. 23 This is not completely true, in that it depends on the penalty imposed on non-compliance. For example, if the
penalty is defined as an amount Z per kWh of non-compliance and the penalty is the only sanction upon non-compliance, Z will be the maximum price for a green certificate. We will abstract from these types of considerations in the remainder of the analysis.

80 ECN-C--03-089
• The cost per kWh of DRE power supply plus the transaction costs as calculated in Chapter 4 minus the cost of the cheapest (decentralised) conventional power supply option at the loca-tion in question.
• The cost per kWh of DRE power supply plus the transaction costs as calculated in Chapter 4 minus Willingness-To-Pay (WTP) per kWh.
According to information provided to the project team decentralised conventional power supply options are hardly ever used in China. Therefore, the power supply cost curves for DRE-systems (or the supply curves for green certificates) have been calculated on the basis of the DRE power supply costs, to which the transaction costs have been added, and from which an estimate of the willingness to pay has been subtracted. Section 5.3 operationalises the construction of the green certificate supply cost curves. Note that it has been assumed throughout that the government uses only the inclusion of DRE into the MMS as a measure to promote the uptake of DRE-systems. A variety of results are presented, such as indications of the impact of certain multipliers on the uptake of DRE, and the multipliers needed to achieve certain targets for the uptake of renew-ables.
5.3 Construction of the green certificate supply curves
5.3.1 Construction of DRE power supply curves
Power supply cost curves per DRE technology were developed on the basis of the knowledge and expert judgement of the Chinese experts on the project team, and involved an identification of the costs of the identified DRE-systems for suitable locations, average locations and bad lo-cations, if possible together with the corresponding supply quantities. Throughout, consistency with the assumptions in Chapter 4 regarding specific characteristics of the DRE-systems was ensured. Supply cost prices were calculated by taking the annuity of the systems costs plus the annual-ised maintenance and replacement costs, and dividing by the annual kWh generation. Major as-sumptions made for the purpose of cost calculations are listed in the following table. Table 5.3 Assumptions behind cost calculations
DRE technology Size [W]
Lifetime [years]
System costs [RMB]
Recurrent annualised costs [RMB]
Discount rate [%]
PV 20 20 1110 73.5 6 Wind 150 10 2800 22424 6 MHP 1175 10 5875 293.725 6
This information was combined with information on annual kWh generation presented in Chap-ter 4. These production figures are based on the end-use and hours of operation per day. This methodology leads to more accurate results in the sense of better estimating the generation of power that can be utilised by the household,26 but also leads to lower estimates for annual kWh generation than are usually found in the literature on renewable energy in China.
24 Discounted maintenance and replacement costs. 25 Discounted maintenance costs. 26 Calculations based on capacity and hours of operation do not consider whether the power generated may be used,
e.g. whether there is a demand for power at the time of the day that power is generated. This consideration is especially of importance for mini-hydropower.

ECN-C--03-089 81
Table 5.4 Annual kWh generation
DRE technology Good locations Average locations Bad locations
PV 16.5 15 13.5 Wind 109 89 69 Mini-hydro 1,109 921 733
The resulting power supply costs are presented in Table 5.5. Table 5.5 DRE Power supply prices, [RMB/kWh]
DRE technology Good locations Average locations Bad locations
PV 10.0 11.0 12.2 Wind 5.3 6.6 8.4 Mini-hydro 0.9 1.1 1.4
The prices indicated here are significantly higher than usually mentioned in the Chinese litera-ture on DRE systems. There are several reasons for these differences:
• Chinese experts often express the costs of renewable energy as the investment costs divided by the total kWh generation over the lifetime of the project. The figures used in this study for kWh generation under ‘average’ conditions lead to stated ‘power supply costs’ of RMB 3.7/kWh for PV, RMB 3.1/kWh for wind, and RMB 0.6/kWh for mini-hydro.
• A second difference is that Chinese experts often do not base their annual kWh generation calculations on end use, but on capacity times hours of operation. For wind and for mini-hydropower, this leads to higher estimates about annual power supply. Together with the point made in the previous bullet, this would modify the stated ‘power supply costs’ of RMB 3.7/kWh for PV, RMB 1.0/kWh for wind, and RMB 0.3-0.5/kWh for mini-hydro.
This discussion indicates also that it may be difficult to establish the ‘right’ DRE power supply cost concept. Although the figures used in this study seem theoretically more sound, the method may not reflect the thinking of the consumers, in which case these results may give a wrong es-timate about the DRE power supply costs and by extension the GC prices needed to make a meaningful impact on the uptake of off-grid renewables. Finally, an attempt was made to relate the three locations (good, average, bad) considered to in-dications of supply. This was based on a combination of assessments by the Chinese team ex-perts and information contained in written sources. Table 5.6 and Table 5.7 describe for what percentage of total supply each location type accounts. Table 5.6 Percentage of DRE market in good, average and bad locations, China
DRE technology Good locations Average locations Bad locations
PV 51 43 6 Wind27 33.33 33.33 33.33 Mini-hydro 40 40 20
Table 5.7 Percentage of DRE market in good, average and bad locations, Sichuan
DRE technology Good locations Average locations Bad locations
PV 0 60 40 Wind - - - Mini-hydro 40 40 20
27 In absence of comprehensive data.

82 ECN-C--03-089
5.3.2 Assessment of willingness to pay28
It is hard to estimate willingness to pay for renewable energy, and there are to the knowledge of the project team no sources available with this information for China. Own estimates therefore have been made based on, to the extent possible, data sources described below. It is important to emphasise that willingness to pay differ for the various DRE-systems. This re-flects the differences in system size, reliability, and annual operation hours. On a per kWh basis, willingness to pay for photovoltaic systems might be considerable, compared to wind and mini-hydro, since the system size is small and the first kWh have a high marginal value. Therefore, there is no a priori reason to expect that willingness to pay for different DRE technologies will be comparable. For mini-hydropower, the calculation of willingness to pay is based on the details of current fi-nancing for mini-hydro investments. Households in China normally pay for the maintenance of mini-hydro (5% of investment costs, equalling about RMB 62.5 for 250 W) and for a part, usu-ally in the range of 40-50%, of the investment costs in mini-hydro. With benefit of preferential loans, this means that the households are willing to pay approximately RMB 0.6-0.7/kWh at the most or about RMB 112.5-135 annually for a 250 W system. Data collected in a number of vil-lages indicates that this estimate is approximately right. This corresponds to about 5-6% of household income. In this study 3% of household income has been taken as a representation of the willingness to pay, noting that this may actually be on the optimistic side, since some house-holds with access to power run a household deficit, as was also found by the field visits of the study team. This information is combined with information on household size and percentages of number of rural households living below RMB 500/capita and RMB 1,000/capita. Assuming that an aver-age household has 4 members, this corresponds to household incomes of RMB 2,000 and RMB 4,000 per year respectively. About 10% of rural households in China live at household incomes of RMB 4,000 and below. However, the target population for mini-hydro generally lives in poorer areas, and therefore it is reasonable to make conservative assumptions about willingness to pay. The following data for willingness to pay for mini-hydro are used:
• 10% of the target population: RMB 0.8/kWh.
• An additional 50% of the target population: RMB 0.65/kWh (60% in total).
• An additional 30% of the target population: RMB 0.5/kWh (90% in total).
• An additional 10% of the target population: RMB 0.3/kWh (100% in total). For wind-power, the same willingness to pay is assumed as for mini-hydro, noting that the sys-tem sizes are more or less comparable in size:
• 10% of the target population: RMB 0.8/kWh.
• An additional 50% of the target population: RMB 0.65/kWh (60% in total).
• An additional 30% of the target population: RMB 0.5/kWh (90% in total).
• An additional 10% of the target population: RMB 0.3/kWh (100% in total). The most complex is the case of photovoltaic systems, since several factors point in different directions:
• According to the Chinese PV experts on the study team, herdsman are often willing to sup-port the full price of a PV system - they have willingness to pay, since they are quite rich,
28
In response to a comment received on the draft version of this report an alternative method to model the demand based on a fixed household budget for electricity services is presented in Appendix G

ECN-C--03-089 83
and it is important for them to save the eyes of their children by providing better quality light.
• The KfW programme (focussing on a number of DRE technologies including PV) has occa-sionally problems in finding villages willing to pay RMB 2/kWh to support maintenance costs.
• The market survey by Voravate et al (1998) suggests that PV is used to replace expenditures for kerosene (about RMB 4.5 per month). This suggests a willingness to pay of at least RMB 3.6/kWh, and quite possibly more, given the better quality of lighting.
• The same Voravate et al study suggests that 41% of the surveyed population without PV systems had income and asset levels equal to households with PV systems; it can be as-sumed that this population has the willingness to pay for the full system costs.
The difficulty with this information is that it provides for a very wide range of willingness to pay. In absence of more precise information, the following figures for willingness to pay have been used:
• 40% has a willingness to pay the full costs of PV power.
• An additional 20% has a willingness to pay of RMB 7/kWh (60% in total).
• An additional 20% has a willingness to pay of RMB 3.6/kWh (80% in total).
• An additional 10% has a willingness to pay of RMB 2/kWh (90% in total).
• An additional 10% has a willingness to pay of RMB 1/kWh (100% in total).
5.3.3 Green certificate supply costs, net of transaction costs
Combining the information of the previous two subsections, the green certificate supply costs for the different technologies is provided below. Table 5.8 shows the impact for various green certificate prices on the uptake of mini-hydro installations. Based on a green certificate price of RMB .039 per kWh 29, a multiplier of 1 reflects the base-line scenario. In the baseline scenario it is assumed that no specific policy measures are taken to promote mini-hydro and thus in this scenario mini-hydro is not included in the MMS. Table 5.8 shows that in the baseline no additional mini-hydro capacity will be installed because poor peo-ple just cannot afford it. If a multiplier of 2.6 is applied 4 % of the identified potential for mini-hydro systems in China (727,000 units) will be realised. This corresponds to 34.2 MW of new capacity and 32.2 GWh additional electricity production. To realise the total potential, a multiplier value of 28.2 is required. This would result in 854.2 MW of new capacity and 694.3 GWh additional electricity production, which is 0.87% of the total MMS target.
29
A green certificate price of RMB .039 per kWh is the equilibrium price for grid connected renewable electricity as presented in Meier (March, 20220). This price is based on an MMS target of 3.5% for 2010 which corresponds to79,476 GWh produced from renewable sources.

84 ECN-C--03-089
Table 5.8 New mini-hydro capacity for various multipliers, net of transaction costs, China and
Sichuan
China Sichuan multiplier [%] of potential
market (727,000 units)
[MW] [GWh] multiplier [%] of potential market
(234,000 units)
[MW] [GWh]
1 0 0 0 1 0 0 0
2.6 4 34.2 32.3 2.6 4 10.8 10.2
6.4 24 205.0 193.5 6.4 24 64.9 61.2
8.2 28 239.2 220.3 8.2 28 75.7 69.7
10.3 40 341.7 317.1 10.3 40 108.1 100.3
11.5 60 512.5 451.0 11.5 60 162.2 142.7
15.4 78 666.3 571.6 15.4 78 210.8 180.8
19.2 88 751.7 624.9 19.2 88 237.8 197.7
20.5 92 785.9 651.7 20.5 92 248.6 206.2
23.1 98 837.1 683.7 23.1 98 264.8 216.3
28.2 100 854.2 694.3 28.2 100 270.3 219.7
However, a high multiplier will affect negatively the total amount of electricity produced from renewable sources and thus will jeopardise the environmental objectives of the MMS30. For this reasons it is recommended not to apply multipliers with a value greater than 10. Applying a multiplier of 10 for mini-hydro will result in an additional production of slightly less than 317 GWh. The similar table for wind is simpler in structure, since there are no wind resources to speak of in Sichuan province. Hence wind in Sichuan can be ignored. Table 5.9 New wind capacity for various multipliers, China
China Multiplier [%] of potential market
(1,077,000 units) [MW] [GWh]
1 0 0 0 115.4 3.3 5.4 3.9 119.2 19.9 32.2 23.5 123.0 29.9 48.4 35.2 128.2 33.2 53.8 39.1 148.7 36.5 59.2 42.3 152.6 53.2 86.1 58.3 156.4 63.2 102.2 67.9 161.5 66.5 107.6 71.1 194.9 69.8 113.0 73.6 198.7 86.4 139.9 86.0 202.6 96.4 156.0 93.4 207.6 100 161.4 95.9
The maximum additional power generation that may be expected from inclusion of decentral-ised wind systems into the MMS is achieved at a multiplier value of 207.6. The annual genera-tion with this multiplier is 95.9 GWh, which is 0.12% of the total MMS target.
30 To clarify this point: assuming that a certificate represents 1 MWh, an MMS target of 10 MWh is met if 10 certifi-
cates have been issued. However, if a multiplier of 2 is applied for off grid technologies, 5 MWh produced by off grid is already sufficient to meet the target.

ECN-C--03-089 85
If the interactions between the value of the multiplier and the equilibrium price of the green cer-tificates are taken into account, it can be concluded that the maximum achievable value of the multiplier for wind is 163, resulting in an additional production of 39.1 GWh. Finally, Table 5.10 provides the estimates for photovoltaic systems. Table 5.10 New PV capacity for various multipliers, net of transaction costs, China and
Sichuan
China Sichuan Multiplier [%] of potential
market (2,100,000 units)
[MW] [GWh] Multiplier [%] of potential market
(123,000 units)
[MW] [GWh]
1 40 17.0 12.8 0 40 1.0 0.7 76.9 50.2 21.3 16.1 102.5 52 1.3 0.9 102.5 58.8 25.0 18.8 133.3 60 1.5 1.0 133.3 60.0 25.5 19.2 189.7 72 1.8 1.2 164.1 70.2 29.8 22.5 220.5 80 2.0 1.3 189.7 78.8 33.5 25.2 230.7 86 2.1 1.4 205.1 83.9 35.7 26.8 256.4 92 2.2 1.5 220.5 85.1 36.2 27.2 261.5 96 2.3 1.6 230.7 94.5 40.2 30.2 287.2 100 2.4 1.7 256.4 98.8 42.0 31.6 261.5 99.4 42.3 31.8 287.2 100.0 42.6 32.0
In the baseline scenario, 40% of the potential PV market will be realised. Inclusion into the MMS will result in additional penetration of the market but the impact is significant only at very high values of the multiplier. The maximum uptake of PV systems is achieved at a multiplier of 287.2. The uptake is 32.0 GWh, 19.2 GWh above the uptake in the absence of the MMS corre-sponding to only 0.04 % of the MMS kWh target. If the interactions between the value of the multiplier and the equilibrium price of the green cer-tificates are taken into account, it can be concluded that the maximum achievable value of the multiplier for PV is 366, with a green certificate equilibrium price of RMB 0.025/kWh (com-pared to RMB 0.039/kWh in the base case) and resulting in an additional production of 30.2 GWh.
5.4 Simulation results
The following scenarios have been developed to analyse the impact of inclusion into the MMS on the uptake of DRE-systems:
• Scenario I: multiplier value of 1 for all DRE power; this scenario corresponds with the sin-gle tier MMS.
• Scenario II: same multiplier value greater than 1 for all DRE power.
• Scenario III: different multiplier values greater than 1 for DRE power.
5.4.1 Scenario I: Single tier MMS
In a single tier MMS the green certificate price for DRE power would be RMB 0.039/kWh_off-grid, corresponding to the green certificate price for grid connected renewables. The analysis shows that in this scenario there is no impact on the uptake of DRE systems. Grid connected RE technologies appear to be the most competitive eligible renewable sources and will be used to meet the MMS target.

86 ECN-C--03-089
5.4.2 Scenario II: differentiated support for decentralised and on-grid RE systems
This section discusses the impact of the same multiplier value greater than 1 for different DRE-systems. The values of the multiplier are chosen to correspond to low multiples (5, 10, 25, 50, 100). Also included is a multiplier value of 117.7, which is needed to get an uptake of 10% of the potential of wind power. In Table 5.11 the uptake of DRE in GWh/year is presented without considering the impact of the multiplier on the achievement of the MMS target and the GC equi-librium price in RMB/kWh_on-grid. In Table 5.12 the impact on the equilibrium price is taken into account. Table 5.11 Uptake of DRE in GWh/year for various multiplier values, China and Sichuan. GC
price fixed at RMB 0.039/kWh_on-grid
China Sichuan Multiplier Total
[GWh] Hydro [GWh]
Wind [GWh]
PV [GWh]
Total [GWh]
Hydro [GWh]
Wind [GWh]
PV [GWh]
0 13 0 0 13 0.7 0 0 0.7
2 14 1 0 13 0.9 0.2 0 0.7
3 55 42 0 13 14.1 13.4 0 0.7
4 97 84 0 13 27.4 26.7 0 0.7
5 139 126 0 13 40.7 40.0 0 0.7 10 313 300 0 13 94.8 94.0 0 0.8 25 701 687 0 14 218.2 217.4 0 0.8 50 709 694 0 15 220.5 219.7 0 0.8 100 712 694 0 18 220.7 219.7 0 1.0 117.7 722.6 694 9.6 19 220.7 219.7 0 1.0
It is clear from Table 5.11 that the major impact of a two-tiered MMS is the stimulation of mini-hydropower. Wind appears to be almost irrelevant, whereas PV is only relevant because a high willingness to pay has been assumed. The impact of the two-tiered MMS on the additional in-stallation of PV systems is very modest, and additional 6 GWh will be generated. The maximum uptake of the DRE technologies considered in this scenario is 822.2 GWh for China and 221.5 GWh for Sichuan. This figure is obtained by summing the figures for 100% uptake of the individual DRE technologies presented in Tables 5.8-5.10. Table 5.11 provides policymakers with information that may be used for formulating a feed-in tariff policy. For example, a subsidy of 0.39 RMB31 (with transaction costs to be paid by the re-cipient of the subsidy) results in 313 GWh of off-grid renewables per year; 300 GWh more than in absence of the feed-in tariff. A feed-in tariff of 3.9 RMB/kWh results in 712 GWh of off-grid renewables. Table 5.11 also provides useful information for policymakers considering the formulation of a two-tier MMS. For example, an MMS with an off-grid target of 139 GWh will result in a price
for off-grid renewables of RMB 0.195/kWh_off grid (5× RMB 0.039). Table 5.12 shows the results if the interactions between the multiplier value and the green cer-tificate equilibrium price are taken into account. Table 5.12 even stronger than Table 5.11 demonstrates that the impact of the two tiered MMS is very much restricted to mini-hydropower.
31 0.39 = 10×0.039.

ECN-C--03-089 87
Table 5.12 Uptake of DRE in GWh/year for various multiplier values, China and Sichuan. GC
price in RMB/kWh_on-grid reacts to off-grid supply
China Sichuan Multiplier Total
[GWh] Hydro [GWh]
Wind [GWh]
PV [GWh]
Total [GWh]
Hydro [GWh]
Wind [GWh]
PV [GWh]
0 13 0 0 13 0.7 0 0 0.7 2 14 1 0 13 0.9 0.2 0 0.7 3 55 42 0 13 14.1 13.4 0 0.7 4 95 82 0 13 27.2 26.5 0 0.7 5 135 122 0 13 40.2 39.5 0 0.7 10 278 265 0 13 92.0 91.3 0 0.7 25 532 519 0 13 206.7 205.9 0 0.8 50 461 448 0 13 220.5 219.7 0 0.8 100 282 269 0 13 219.2 218.4 0 0.8 117.7 247 234 0 13 209.0 208.2 0 0.8
For Sichuan, the maximum impact is achieved at a multiplier of 68. After rounding, the impacts are similar as for a multiplier of 50 (as indicated in the table). For China, the maximum impact is achieved at a multiplier of 30, with a total supply of 534 GWh, of which 521 GWh mini-hydro and 13 GWh PV. The corresponding contributions of DRE-power to the MMS targets are 19% (for the Sichuan pilot with a multiplier of 68) and for a China-wide inclusion of DRE systems into the MMS 20%. This implies a very considerable contribution towards the MMS target, especially consid-ering that this equals about 50% of the difference between the MMS target and the BAU sce-nario. In other words, these high multiplier values lead to a substantial dilution of the environ-mental objective inherent in the MMS. In Table 5.13 the multiplier values are presented for which 20%, 40% and 60% of the total mar-ket is penetrated. The total market is the sum of 100% potential for the individual technologies: 822.2 GWh for China and 221.5 GWh for Sichuan. Table 5.13 Multipliers needed to achieve specific market penetration targets, China and
Sichuan. GC price fixed at RMB 0.039/kWh_on-grid
Share of the potential market to be achieved [%]
Multiplier for China Multiplier for Sichuan
20 5.6 5.3 40 10.4 9.4 60 12.7 11.4
As in the case of Table 5.11, Table 5.13 provides the policymaker interested in feed-in tariffs or two-tier MMS with useful information. For example, to achieve 20% penetration of the Chinese market through a feed-in tariff, a subsidy of 0.22 RMB/kWh_off-grid is needed
(5.6×RMB 0.039, rounded); an MMS target for off-grid renewables in Sichuan of 40% of the Sichuanese potential will result in a green certificate price of 0.37 RMB/kWh_off grid
(9.4×RMB 0.039, rounded). In Table 5.14, the impact of the multiplier on the GC price in RMB/kWh_on-grid has been taken into account. As a result, the multipliers needed are higher than those indicated in Table 5.13. This impact is stronger for the China wide implementation of the inclusion of DRE sys-tems into the MMS, because the contribution of DRE systems to the MMS target is larger, and hence the resulting drop in the equilibrium price of green certificates (in RMB/kWh_on-grid) is larger than in the case of a pilot inclusion of DRE into the MMS focusing on Sichuan only.

88 ECN-C--03-089
Table 5.14 Multipliers needed to achieve specific market penetration targets, China and
Sichuan. GC price in RMB/kWh_on-grid reacts to off-grid supply
Share of the potential market to be achieved [%]
Multiplier for China Multiplier for Sichuan
20 5.8 5.3 40 11.9 9.7 60 17.7 12.1
5.4.3 Scenario III: Fully differentiated support
Given the results of the previous section the question rises how different DRE technologies can be stimulated. The following table presents the results for each technology, indicating the tech-nology specific multiplier necessary to achieve 20%, 40%, 60% and 80% market penetration for the particular technology-region combination. Table 5.15 Multipliers needed to achieve specific market penetration targets, China and
Sichuan, by technology. GC price fixed at RMB 0.039/kWh_on-grid
20% share 40% share 60% share 80% share
Mini-hydro 5 9 11 15 PV 0 0 134 194 China
Wind 120 149 154 197 Mini-hydro 5 9 11 15 PV 0 0 134 221 Sichuan Wind - - - -
The zero multipliers for the 20% and 40% market shares for PV may be explained by the fact that for 40% of the market a willingness to pay has been assumed equal to the cost of PV. Therefore, the inclusion of DRE into the MMS does not increase the uptake of PV over the business-as-usual scenario, unless (very) high multipliers are used. Similar to Table 5.11 and 5.13, Table 5.15 provides information that policymakers may find useful in formulating feed-in tariff systems and or multiple tier systems. For example, a 60% share of the potential market in China for mini-hydropower (60% of 694 GWh; see Table 5.8) can be achieved at a subsidy of 0.195 RMB/kWh. Table 5.16 takes the impact of the DRE supply on the equilibrium price for GCs in RMB/kWh_on-grid into account. In this table it is assumed that all multipliers except for the technology under question are set equal to 0. So for example, the entries for mini-hydropower assume that the multipliers for PV and wind are both set equal to zero. Table 5.16 Multipliers needed to achieve specific market penetration targets, China and
Sichuan, by technology. GC price in RMB/kWh_on-grid reacts to off-grid supply
20% share 40% share 60% share 80% share
Mini-hydro 5 10 14 - PV 0 0 148 246 China
Wind 130 201 - - Mini-hydro 5 10 12 17 PV 0 0 135 224 Sichuan Wind - - - -
Achieving an 80% penetration of the mini-hydro potential in China through the inclusion of DRE systems into the MMS is not possible through using multipliers. The same is true for 60 and 80% penetration for wind.

ECN-C--03-089 89
Tables 5.15 and 5.16 show that modest multipliers in the range of 10-15 are needed to achieve a significant penetration of the potential market for mini-hydropower in China and in a pilot in Sichuan. For wind and PV, very high multipliers are necessary to achieve a significant penetra-tion (wind) or additional penetration (PV). The analysis presented here suggests that multipliers for off-grid mini-hydropower may be set at the level of 10-15, and perhaps 17 in a pilot in Si-chuan and that multipliers for PV and wind are set equal to zero (excluded from the MMS). If these suggestions are followed, the impact on the MMS target is relatively modest. At a mul-tiplier of 10 in the whole of China, mini-hydropower accounts for 3.4% of the MMS target. At a multiplier of 15, this increases to 8.4%. The suggested multiplier of 17 for the Sichuan pilot would result in a contribution of 3.8% to the MMS target.
5.5 Shortcomings of the analysis
The analysis presented in this Chapter suffers from a few shortcomings:
• The quality of the data used to construct the supply curves of DRE power and the capacities to pay is rather low. This may affect the numerical outcomes of the analysis; however, the main qualitative results of the analysis remain valid.
• The cost concept used might not coincide with the cost concept used by the users of DRE systems. This may affect the outcomes of the analysis, but the alternative is to use concepts that are less sound from a theoretical perspective. Moreover, it is very had to justify any al-ternative assumption.
• The lack of location specificity in the analysis - for example, the analysis does not take the total demand for power at the locations that are suitable for DRE power into account; mean-ing that there could be a mismatch between supply and demand at certain locations. Fur-thermore, the analysis does not take into account that at some locations certain DRE options may be dominated by other DRE options, in the sense that one DRE option may be consis-tently cheaper than another DRE option available at the same location.
5.6 Environmental impact
DRE-systems providing electricity to households are likely to replace fuels such as kerosene, candles and dry cell batteries. For this study, the environmental impact in terms of global pollut-ing emission reductions is based on emission reduction coefficients developed for the CE-RUPT32 programme on behalf of the Ministry of Housing, Spatial Planning and the Environ-ment of the Netherlands. Proposed factors for determining the CO2 reduction resulting from de-centralised renewable electricity production are (Ministry of Housing, Spatial Planning and the Environment, 2001):
• Mini-hydro: 75 kg/year + 2 kg/year/W installed capacity.
• PV: 75 kg/year + 4 × Power kg/y/Wp.
• Wind: 75 kg/year + 350 D2 kg/year/m2. ( with D = rotor diameter) Table 5.17 presents the annual CO2 reduction for scenario II: differentiated support for off grid and on grid renewable energy technologies.
32 CERUPT is an acronym for Certified Emission Reduction Unit Procurement Tender. CERUPT was established
by Minister of Housing, Spatial Planning and the Environment in the Netherlands to purchase certified emission reductions through the CDM mechanism. CERUPT issued the first tender in 2001.

90 ECN-C--03-089
Table 5.17 Annual CO2 reduction for scenario II
China Sichuan
Multiplier Million [kWh] generated
CO2 reduction [1,000 tons CO2]
Multiplier value
[kWh] generated
CO2 reduction [1,000 tons CO2]
5 139 320 5 40.7 95 10 313 760 10 94.8 205 25 701 1,775 25 218.2 605 50 709 1,775 50 220.5 615 100 712 1,875 100 220.7 615 117.7 722.6 1,880 117.7 220.7 615
5.7 Conclusions
The analysis in this chapter indicates that inclusion of DRE-systems into the MMS will mainly benefit mini-hydro systems. If mini-hydro is brought under the MMS, the potential market amounts to some 727,000 new installations in China and some 234,000 installations in Sichuan province. The analysis shows that a green certificate price of RMB 1.1 per kWh is needed to re-alise the full mini-hydro potential of 694.3 GWh for China (0.87 % of the MMS kWh target) and 219.7 GWh for Sichuan (0.28 % of MMS kWh target). This potential however cannot be achieved through a single tier MMS system where DRE systems must compete with grid con-nected RE technologies. Therefore, it is recommended to provide differentiated support for DRES and grid connected RE technologies by means of applying a multiplier for green certifi-cates generated by DRES. If a multiplier is applied for green certificates produced by DRE systems, this means that the to-tal amount of green certificates in the MMS does not correspond anymore to the total amount of kWh produced from renewable sources. If high multipliers are applied this could jeopardise seriously the environmental objectives of the MMS and therefore it is recommended not to use multiplier values above 10. The impact of inclusion of PV and small wind into the MMS on the uptake becomes significant only at unrealistically high values of the multiplier. Therefore, it can be concluded that inclusion into the MMS is not the best mechanism to promote photovoltaic and stand alone wind in China.

ECN-C--03-089 91
6. EVALUATION OF POVERTY ALLEVIATION IMPACTS OF
MMS OPTIONS FOR DECENTRALIZED RENEWABLE
ELECTRICITY SYSTEMS
6.1 Importance of DRES to Living Conditions and Livelihoods of the Poor
6.1.1 Energy, poverty alleviation and poverty reduction
The significance of DRES for the poor is embedded in the larger question: how critical is energy as such to poverty reduction? Considerable confusion surrounds this question as yet. At one end is the view of energy as a part of the parcel of basic needs-oriented services for the poor, that is, a certain minimum amount of modern energy is deemed absolutely essential for life in the same manner that food, clothing and shelter are. Energy is thus seen as a ‘life claim’ and, as a result, notions like ‘universal access’ to electricity for basic household needs have gained recognition. At the other end is the perception of energy as a catalyst of rural economic transformations im-pelled by new income-earning and asset-building activities made possible to a good measure by modern energy interventions. This calls for a ‘minimum plus’ approach that goes beyond subsis-tence levels of energy consumption. These differing views are rooted in more fundamental twists in the debate over poverty as such. By common convention, the state of being poor is defined by an income cut-off or ‘poverty line’, which is now acknowledged internationally as one US dollar per day per individual but tends to vary at national levels.33 People whose incomes fall below an established threshold are considered poor. Poverty reduction would then mean reducing the numbers of those who live below the poverty line; in other words, income growth becomes the primary measure of escape from poverty. However, the income yardstick (income poverty) has been challenged over the years for a variety of reasons whose general thrust is that there are several other factors that de-termine human well being - health, education, safety, security, empowerment - and they cannot be defined in monetary terms. By this definition, poverty signifies an all-round state of depriva-tion of which insufficient income is just one measure. This argument has invoked the notion of poverty alleviation whereby a relief, to any extent, from any of the numerous hardships the poor face is equated with a lowering of the ‘intensity’ of poverty by that extent. In practice though, the phrases poverty reduction and poverty alleviation are used interchangeably, which can over-look the rather different aims but equally compelling arguments underlying each. While it is beyond the scope of this report to reconcile these differences, it is nonetheless impor-tant to grasp that poverty alleviation generally signals improvements in the living conditions of the poor without necessarily releasing them from the state of poverty as such. Such improve-ments mitigate the hardships of the poor and possibly render poverty less intolerable. By con-trast, poverty reduction will invariably involve productive or livelihood enhancements that help people cross the poverty line by raising their incomes. One could argue that improved livelihood opportunities would, by implication, engender better living conditions, whereas the reverse is not assured.
33 For example, it is 0.66 dollars a day per individual in China.

92 ECN-C--03-089
Translating this into energy terms requires an understanding of the energy needs of the poor, which typically fall into: a. Basic household and community needs, such as lighting, cooking, space-heating, and essen-
tial communication and convenience. These needs are usually met by traditional energy sources (fuel wood, biomass, animal waste) and their popular modern alternatives are elec-tricity, coal, charcoal and kerosene. The amount of modern energy services needed to meet these needs is usually small34 and, since they represent ‘minimum’ needs, there is a some-what finite dimension to the associated energy supply capacity.
b. Productive needs, beginning with agriculture but extending also to agriculture-related busi-ness activities (vegetables, processed fruits) and off-farm enterprises at the household and community levels. Barring indirect energy inputs (organic/chemical fertilizers, pesticides and weedicides), the direct energy needs of agricultural and enterprise activities are met by the poor through sheer human labour35 and animal power. Replacing these with modern en-ergy services means providing energy for motive power and heat in quantities that could be substantial and subject to increase over time. The scale of supply and the prospect of ex-panding supply capacity to meet rising demands, hence, become important.
6.1.2 Significance of DRES for the poor
Against the above, the role of DRES - solar photovoltaic, mini/micro hydro, wind power, bio-gas, hybrid36 systems - in meeting the energy needs of the poor has to be reviewed in terms of their initial supply capacity, potential for future expansion, form of energy supplied, and cost relative to the poor’s purchasing power. By definition, DRES would cover: (a) isolated small-scale systems of household level relevance and (b) larger community size systems using mini distribution grids (for electricity or fuels) whose eventual supply of energy per household might be on a scale roughly comparable to that of isolated household units. The WEC estimate of minimum electricity needs of 300-500 kWh per capita per year37 trans-lates into a supply capacity of 122-228 W for a family of four. However, since popular applica-tions for electricity, such as lighting and TV, are commonly used by all members of a family, the practical system size required could be limited to a fourth of this, that is, 30-57 W. It is well within the capacity of even small solar home systems to cater for this minimum amount of elec-tricity. By contrast, such a low volume of demand will be uneconomical for centralized grids, especially if the user communities are located in remote areas, to reach, which substantial in-vestments have to be made in transmission and distribution networks. For poor communities that have no access to electricity, electricity-producing DRES offer quick relief because of their short gestation and portability. Because they are based on locally available renewable resources, they also yield distinct environmental benefits. All DRES will, therefore have a positive impact on poverty alleviation in various ways, subject to their supply capacity, as the aim is to mitigate the hardships of the poor to a greater or lesser extent. Figure 6.1 illustrates the range of services provided by electricity in general to meet basic household needs. DRES are capable of most of these services, with the exception of high wattage equipment like refrigerators, air-conditioners and stoves/ovens that are usually more suited for grid supply.
34 The World Energy Council estimates this to be 300kWh per capita per annum immediately, growing at an average
annual rate of 2% to 500kWh by 2020 (WEC, 2000). 35 Also referred to as ‘sweat energy’ (IDS, 2002). 36 A combination of more than one technology, e.g., solar and diesel or solar and wind. 37 This is an average figure for the whole country and does not apply to rural areas where average electricity
consumption usually is lower

ECN-C--03-089 93
Figure 6.1 Household Applications of Electricity Source: ESMAP, 2002. That said, a major limitation of DRES is their association with technologies that produce elec-tricity. Electricity use for basic needs in rural households in developing countries generally forms a small portion (around 10%) of their aggregate energy consumption, the bulk (80-90%) of which is for cooking38 even in grid-connected households. The latter involves the collection of traditional fuels over distances and their use in rudimentary cooking devices of very low effi-ciency.39 This not only entails a substantial loss of women’s (and children’s) time for fuel gath-ering and cooking, but it also represents high levels of wasted energy and prompts serious in-door health hazards. Electricity-producing DRES contribute little to mitigating the daily cooking fuel-related hardship faced by women and children in rural communities. A more rounded view of the potential of DRES to contribute to poverty alleviation should, therefore, consider both electric and non-electric technologies. As noted by DFID (2002), “One mistake of the recent past has been excessive focus on the provision of electricity to poor people rather than wider energy services. Electricity is not always the most appropriate form of energy, nor is it the quickest or most cost-effective way of providing energy services to poor people. For example, extending an electricity grid to households in rural areas can cost seven times more than for grid electricity in urban areas. In most of sub-Saharan Africa, less than 10% of the population is connected to electricity and relies on fuel wood. And it is estimated that it would take over 250 years to supply all households in Uganda with electricity at current rates of elec-trification.” At the current stage of technology development, the main non-electric DRES capable of ad-dressing cooking energy needs in rural households are biogas systems and improved cook stoves. These technologies are largely local in origin and, presumably, do not normally feature in internationally assisted DRES programmes for this reason. However, biogas systems and im-proved cook stoves have the potential to conserve wood resources which should attract greater attention to them for environmental, if not poverty alleviation, considerations. Biogas has the added advantage of reducing chemical fertilizer inputs to home garden activities like vegetable and fruit cultivation since the slurry from biogas digesters is rich in natural fertilizers. As such, it can generate cash savings, which are equivalent to income increase.
38 Ramani, Islam & Reddy, 1995. 39 Traditional wood stoves typically have a thermal efficiency of only 8-10%.

94 ECN-C--03-089
The role of DRES in meeting the needs of the rural poor beyond their basic needs - that is, to reduce poverty - is controversial. Since scale and expandability are critical to meet productive energy needs, the usually small initial size of most DRES and the difficulty of enhancing system capacity in the future at an affordable cost have encountered criticism. Above all, most DRES technologies are ‘intermittent’ by nature, that is, the supply of energy from them is limited to certain hours of the day (solar) or by seasonal variations (hydro, wind). Recent studies commis-sioned by the World Bank in Indonesia and Sri Lanka (Marge, 2002a & 2002b), indicate that even time-lagged economic transformations in rural communities through the gradual develop-ment of productive village enterprises are largely associated with grid-supplied electricity rather than with DRES. However, community-scale DRES mini grids often get hooked to the utility grid in course of time, as has been the case in China, which does offer opportunities to enhance the supply capacity for productive uses. In the balance, it is safe to conclude that all DRES play a positive role in poverty alleviation through basic needs satisfaction, but their potential to contribute to poverty reduction by way of income growth is more often than not disappointing. Even if community-scale DRES are capa-ble of the latter through eventual grid connection, isolated home systems are not. Furthermore, all DRES are not made equally. Photovoltaic systems, at the size they are nor-mally sold (16-50 Wp), typically cater just for lighting and communication appliances, while small hydro and wind systems are capable of motive power as well, which enables them in the-ory to address both basic and productive needs. Also, investment and, therefore, energy costs vary by technology and location, with solar photovoltaic systems (the most portable and modu-lar) carrying the highest cost per unit of energy delivered. The choice between different DRES alternatives is often pre-empted by the location-specific availability of natural resources (sun-shine, water, wind), usually one or the other being the obvious candidate although there are situations where more than one DRES is possible and, therefore, their relative costs per unit of energy delivered will determine the eventual choice.
6.1.3 Access and affordability
The most serious barriers to employing DRES for the poor are problems of access and afforda-bility. DRES are usually cost-competitive against conventional energy options in serving remote communities. However, as noted by a World Bank study of energy, poverty and gender relation-ships in China (IDS, 2002): “Remoteness adds to the cost of all energy supply options. Remote-ness is likely to increase the attractiveness of energy supply options that do not require the transportation of fuels relative to those that do. However, this transport cost advantage may be offset by the cost of imported spare parts and the high costs of frequent visits from urban-based technicians required to maintain novel or delicate systems.” What this means is that while poor communities living in remote areas may find DRES their ‘cheapest’ option, they might actually have to incur more than the normal cost of acquiring and keeping these systems running in good condition, as compared to less remote rural consumers. So, while the comparative advantage of DRES vis-à-vis conventional supply options is possibly true in most remote situations, this is not necessarily the decisive factor. The central feature of poverty is the lack of purchasing power, especially cash income. The vast majority of the poor lead a subsistence life where the absence of surplus cash is their most serious handicap. Expect-ing these people to bear the initial investment in DRES in one lump sum and to incur the higher recurring costs of service in remote locations is often asking for too much. The cost of appli-ances, especially high value productive use devices like grinders or refrigerators, further con-strain the poor’s ability to employ energy to enhance their livelihoods, even if they had access. At the same time, without modern energy services, the poor’s capacity to increase their purchas-ing power remains constrained - that is, they need energy to escape poverty but poverty prevents them from acquiring energy. This chicken or egg dilemma can be viewed as a ‘vicious circle’ (Figure 6.2) and it goes to the heart of the energy-poverty nexus.

ECN-C--03-089 95
Breaking out of this vicious circle would mean financial assistance to the poor to acquire and effectively utilize modern energy services, including those offered by DRES. To the extent that MMS, which is the focus of this study, or other mechanisms like credit could contribute to such assistance, they would be desirable. This is reviewed at greater length in the context of China in Section 6.7 of the report.
No energy to run machines results in low productivity, poor quality and range of
output, time poverty (women’s labour time cannot
be released for economic activity).
Low productivity, low surplus, little cash
No money to buy improved energy supplies or energy
conversion equipment
Figure 6.2 The Vicious Circle of Energy Poverty Source: IDS, 2002.
6.1.4 The role of complementary inputs to energy
This discussion would remain incomplete without a mention of the role of complementary in-puts in poverty reduction. While modern energy services are a necessary pre-condition to reduce poverty, they are by no means the only inputs to rural economic transformation. As observed by an ESMAP, World Bank report: “Rural energy development must be integrated with other measures dealing with agriculture, education, infrastructure and social and political factors. Ex-perience has clearly demonstrated the limited effect of one-dimensional measures” (ESMAP, 2002). To pin the responsibility for rural poverty reduction on energy alone is, therefore, unrealistic. In order to be effective, energy services must combine with other developmental inputs, such as roads, communication facilities, water supply and, crucially, access to markets and credit. Where energy services precede other such inputs, as is frequently the case in remote locations, poverty will most likely remain unabated and the best one could hope for is a mitigation of some of the more glaring hardships faced by the poor, for instance, the absence of illumination or contact with the outside world, through DRES. Having said that, one must also observe that energy might have a more critical role in poverty reduction than many other inputs to rural development. This owes to the fact that rural economic transformation is contingent largely upon increases in agricultural output, to which direct energy inputs (diesel and electricity for mechanization and irrigation) and indirect energy inputs (espe-cially chemical fertilizers) are critical. As observed by an Asian regional review of rural devel-opment (Rosegrant & Hazell, 2000), rural poverty reduction is more often than not an outcome of increased agricultural productivity. Since the economic fortunes of the rural poor are locked to the soil, the extent to which energy could contribute to enhanced yield from agriculture and its derivatives can be pivotal in poverty reduction. The importance of energy in this context is

96 ECN-C--03-089
borne out by a study on regional income disparities in rural China, which shows electricity as second in importance only to irrigation over the years (Table 6.1). The conclusion, therefore, is that energy in general, and DRES in this instance, need to combine with other infrastructure in-puts/services, and have agriculture and associated activities as their starting focus if they are to make a distinct impact on poverty reduction. Table 6.1 Contributions of Input Factors to Regional Inequality in Agricultural Productivity in
China
Year Inequality Capital Labour Land Education Irrigation Roads R&D Electricity Phones Public Investment
1978 0.681 0.053 0.370 0.371 0.049 0.069 0.008 -0.012 0.002 -0.007 0.110
1985 0.661 0.052 0.364 0.344 0.028 0.097 0.008 -0.012 0.001 0.004 0.127
1990 0.666 0.045 0.358 0.348 0.043 0.091 0.007 -0.004 0.006 0.003 0.147
1995 0.727 0.049 0.322 0.319 0.038 0.087 0.008 0.012 0.064 0.013 0.221
Source: Fan, Zhang & Zhang, 2002.
6.2 Impacts of DRES on Poverty Alleviation/Reduction
6.2.1 Objectives, approach and methodology of assessment
Objectives According to its terms of reference, Activity 4 of the study, dealing with the impacts of DRES and potential MMS mechanisms for them on poverty alleviation, carries the following objec-tives: a. Analyse the impact of the introduction of DRES on poverty alleviation indicators, such as
income, security, health improvements, education services, time spent by women and chil-dren to collect traditional fuels, and access to information. Identify and characterize existing poverty alleviation mechanisms being used in the target provinces for energy service provi-sion.
b. Document the role of energy in poverty alleviation and evaluate how proposed MMS policy options can support these existing poverty initiatives. Identify areas where there is synergy and areas where there is no complementarity.
In fulfilling these objectives, the study has been asked to identify and characterize the major beneficiaries of decentralized electricity systems who are likely to be affected through the MMS mechanism (for example, by economic status, occupation, gender and other relevant factors identified by communities, based upon their needs and interests); and to explore the extent of potential benefits and costs to likely stakeholders. As a part of this, the contributions of DRES to poverty alleviation through improved health and education facilities, and benefits to women and children are to be given particular attention, and ways identified to promote the participa-tion of primary stakeholders in decisions on the extension of decentralized electricity provision.
Approach adopted The terms of reference do not draw an explicit distinction between poverty alleviation and pov-erty reduction. However, to the extent that they require an identification of economic impacts, it has been assumed that both aspects are to be covered. Secondly, in identifying potential beneficiaries, the approach adopted does not distinguish be-tween the poor who will be affected by the introduction of MMS-linked DRES and those who will be affected by the introduction of DRES in general. Any such distinction would be highly speculative since the vast majority of the Chinese population currently without access to modern energy, in particular electricity, is poor and, therefore, all are potential candidates for DRES supply. It is hard to draw a line between those who will get such supply through MMS and those who are likely to obtain it otherwise.

ECN-C--03-089 97
Thirdly, the time and resource boundaries of the study have not permitted household surveys or intensive data collection activities. To a limited extent, primary data has been collected through selected village visits, mainly to assess at first hand the views of stakeholders on their experi-ences and expectations with DRES. Broader conclusions have been drawn by combining this information with prior studies, notably the IDS study for the World Bank (IDS, 2002) on en-ergy, poverty and gender. Lastly, in analysing the data and while drawing conclusions/recommendations, primacy has been assigned to poverty alleviation/reduction through DRES rather than to MMS as a mecha-nism to promote DRES technologies. Proposals for the latter, as described elsewhere in the re-port, are evaluated with this understanding. This is consistent with the feedback received from discussions with various national agencies during the inception stage of the project. It is also in line with the emerging view that the ultimate developmental objectives of energy should receive priority over the pursuit of specific technologies or mechanisms to promote them for their own sake.
Methodology The methodology adopted for this aspect of the study consisted of four main stages:
• Characterization of the current socio-economic conditions of the population who stand to benefit from the availability of modern energy services, particularly electricity, through DRES in Sichuan Province. This was accomplished mainly through discussions with gov-ernment officials at the national, provincial, regional (Xichang) and county levels (Pingwu and Puge)40; and verified independently during village visits.
• Identification of the present energy supply-use patterns of the poor, and the social and eco-nomic impacts of DRES on them. This was carried out through focus groups in five poor villages in two designated poor counties of Sichuan Province; and the information gathered was counter-checked with county level officials of the Poverty Office and the Agricultural Machinery Bureau.
• Assessment of the capacity and willingness to pay of the poor for DRES, and their potential responses to the kinds of MMS incentive tentatively identified by the study at the time of the village visits. This was further reviewed against more detailed data in other reports41 and in the context of the fuller list of MMS options eventually identified by the study.
• Recommendations on appropriate schemes that could offer practical solutions to introduce DRE systems offering electricity to the poor. This took into account existing poverty allevia-tion/reduction policies and mechanisms, examined the complementarities and divergences between these and the proposed MMS options, and drew conclusions aimed at maximizing the benefits from DRES, with or without MMS.
Of the five villages visited during the study, one (Yang Jia She) was located in Pingwu County (Table 6.2), while the other four villages (Wudaoqing, Daping, Hezhi and Xinlong) were lo-cated in the mountainous region of Puge County. All were inhabited by poor populations living at altitudes of 1,200 to 2,000 metres. Three of the villages belonged to the Yi minority commu-nity.42 Of the five villages visited, four were served by mini/micro hydro systems while one (Xinlong) was connected to the grid but with biogas systems in place. All five villages were in designated (nationally or provincially43) poor counties.
40 Discussions were also held with the All-China Women’s Federation (ACWF), focusing on its potential willingness
to play an active role in future DRES promotion programmes for the poor. 41 Notably, Voravate et al (1998), World Bank (2001) and IDS (2002). 42 Of the 8 million nation-wide population of the Yi community, 2 million lives in Sichuan. Overall, ethnic minority
groups account for 40 percent of the remaining poor in China and they represent the poorest of the poor. They are concentrated in the northwest and southwest regions, occupying the most remote mountain areas.
43 The national poverty line is RMB 625 per capita per year, while the provincial (Sichuan) poverty line is set at RMB 1,000 per capita per year. The higher threshold for provincially designated poor counties is due to the inclusion of non-cash income, mainly self-consumed agricultural products.

98 ECN-C--03-089
Table 6.2 General Information on Study Villages in Sichuan Province
Yang Jia She Wudaoqing Daping Hezhi Xinlong
Location (county) Pingwu Puge Puge Puge Puge
Altitude 2,000m 1,200m 1,800 1,500
Paved road access No Yes Yes No No
Telephone access (land line) No Yes Yes No No
Travel time from nearest town (by 4 WD) 3 hrs. 30 mts. 1 hr. 2 hrs. 30 mts. 1 hr.
Population 50 1,300 1,240 985 1,800 No. of households 13 250 250 275 470
Ethnic minority - Yi Yi Yi -
An attempt was made during the village selection to include at least one village for each of the DRES technologies covered by the study (solar, hydro and wind), and to also visit a village without any form of electricity at present. However, this proved infeasible since wind-powered villages are few in Sichuan whereas solar-powered communities are located in very remote high altitude locations requiring a travel time of 2-3 days, which was not available during the study. Villages without electricity were even farther away. Nonetheless, the villages that were finally selected did offer representative samples of poverty conditions, if not of technology variety. During the village visits, discussions with the people were organized in the form of focus groups based on a questionnaire developed for the purpose. Women were included in numbers equal to that of men in all focus groups and their participation was usually active and vocal. Attention was paid to both basic energy services required to meet social needs and energy services re-quired to provide livelihood/income-generation opportunities. Special emphasis was placed on the time currently spent by the poor, especially the women, on human labour for activities that are either directly related to the collection and use of energy (fuel wood, biomass), or are indi-rectly affected by the presence/absence of electricity or modern fuels (lighting hours for educa-tion/self-improvement, extended cooking times). A key outcome of the village visits was the compilation of data on household income and expenditure in order to determine the capacity and willingness to pay for electricity. It should be noted that the impact assessment arising from the activities described above has been largely qualitative in nature. The small sample size and the very limited time available for each village visit (on average, half a day) did not allow the collection of numerical data of statis-tical validity. This would have required more in-depth household level surveys and, in any case, the main purpose of the present study has been to establish prima facie whether or not, and to what extent, DRES impact upon the living conditions and livelihoods of the poor; and if the use of MMS mechanisms could enhance future benefits from DRES. For this purpose, the extent of coverage achieved44 is considered adequate.
6.3 Major Beneficiaries of DRES
6.3.1 Profile of the poor in the Western Region and Sichuan
The major beneficiaries of DRES in China will largely be the poor concentrated in the Western Region who either have no access to electricity at all or whose current levels of supply from DRES are in such small quantities that additional supplies are necessary even to fulfil their basic needs effectively. Among these are the bottom poor whose income levels are well below the na-tional poverty line and whose primary sources of energy supply at present are traditional fuels and human/animal labour.
44 Taken together with an analysis of more in-depth data from prior studies named.

ECN-C--03-089 99
Although China’s poverty reduction has been remarkable as compared to other developing countries, having declined from 31.3 percent in 1990 to 11.5% in 1998 (World Bank, 2001), the remaining concentrations of the poor are mainly rural and located in mountainous areas and high plateaus. According to Fan, Zhang & Zhang (2002): “The national poverty line is defined as the level below which income and food production are below subsistence levels for food in-take, shelter and clothing. In 1996, more than 60 percent of the rural poor lived in border prov-inces, such as Gansu, Yunan, Sichuan, Guizhou, Guangxi, Qinghai, Ningxia, Inner Mongolia and Xinjiang. Given the low population density in these areas, the poverty incidence is much higher than the national average. For example, 23 percent of the rural population in Gansu and 27 percent in Xinjiang lived under the poverty line in 1996. Another pocket of poverty is the Northern China Plain, where the poor account for 22 percent of the national total. This area in-cludes Henan, Hebei, Shannxi, and Shanxi, where meagre natural resources, particularly poor soil and scarce water, is the major reason for high concentration of rural poor.” The regional distribution of poverty in China shows that the Western Region, where Sichuan is located, fares the worst against virtually all key indicators of poverty (Table 6.3). Nearly 60 per-cent of the country’s poor were concentrated in the Western Region in 1996, and the region’s poverty incidence of 36 percent was way above the national average of 15 percent. The region had the lowest rainfall, road density, labour productivity, literacy and education. Although the poverty head count has fallen steeply since 1996, the total number of rural poor in China as a whole was estimated to be 42 million against the national poverty line and 106 million by inter-national poverty standards (World Bank, 2001), and the majority of this population lives in the Western Region. Furthermore, studies on gender disparity in China45 indicate that female pov-erty is more prevalent than male poverty as evidenced by uneven sex ratios at birth, higher fe-male infant mortality rates, higher female unemployment rates, higher female suicide rates and lower school enrolment for girl children. Table 6.3 Social Development, Productivity and Poverty in Rural China Among Regions
Coastal Region Central Region Western Region National
1985 Illiteracy rate [%] 22.5 28.0 35.8 28.0 Years of schooling 4.8 5.1 4.5 5.1 Road density [km/1000 km2] 221.9 122.9 69.1 111.1 Irrigation [%] 58.0 36.0 40.0 44.0 Labour productivity [RMB/person] 707.3 718.8 465.3 645.6 Annual rainfall [mm] 1,097.6 716.7 506.9 Number of poor [million] 10.8 30.4 59.5 100.8 Incidence of poverty [%] 4.5 12.5 35.8 15.5 1996 Illiteracy rate [%] 8.6 11.4 19.8 12.1 Years of schooling 6.9 6.6 6.1 7.0 Road density [km/1000 km2] 306.2 136.6 81.5 138.3 Irrigation [%] 62.0 45.0 46.0 51.0 Labour productivity [RMB/person] 1,116.0 990.7 611.9 928.2 Annual rainfall [mm] 1,127.3 686.6 506.9 Number of poor [million] 5.9 12.7 31.6 50.2 Incidence of poverty [%] 1.9 3.5 14.3 5.6 Source: Fan, Zhang & Zhang (2002).
45 Cited in IDS, 2002.

100 ECN-C--03-089
This overall situation is echoed in Sichuan, the focus of the present study. The province has 31 nationally designated poor counties (Table 6.4)46 with the majority of the population living in rural areas. Of these, 24 counties are in mountain areas and 7 in the hills. An additional 14 provincially designated poor counties, also located mostly in mountain and hill areas, bring the total number of poor counties to 45 (25%) out of 180 in the province. Of the total provincial population of 80 million in 2000, 10.41 million (13%) was poor, with 3.38 million (4%) consid-ered the bottom poor, consisting largely of ethnic minorities. Table 6.4 Status of Nationally Designated Poverty Counties in Sichuan Province: 2000
County Population
[x 1000]
Rural population
[x 000]
Annual grain output
[x 000t]
Per capita income[RMB]
GDP [million RMB]
Value-added of primary industry [million RMB]
Local government revenue p.a.
[million RMB]
Gulan 740 690 258.8 1,624 1,398.75 555.79 91.18 Chaotian 210 190 97.4 1,389 379.18 179.65 14.89 Wangcang 450 350 196 1,454 1,465.76 556.18 48.18 Cangxi 770 650 365.7 1,438 1,597.25 957.50 61.59 Jialing 660 620 331 1,647 1,338.09 533.61 43.43 Nanbu 1,300 1,180 500.6 1,393 3,502.34 1,471.02 81.85 Yilong 970 940 444.8 1,410 1,513.89 938.46 62.59 Nangzhong 840 720 348.6 1,401 2,018.81 767.53 72.98 Xingwen 430 400 175.3 1,735 908.08 353.80 42.54 Guangan 1,200 1,030 491.2 1,849 3,235.57 1,019.85 85.24 Xuanhan 1,140 1,020 516.9 1,592 2,861.76 1,318.26 87.25 Quxian 1,310 1,130 600.6 1,858 2,842.63 1,273.78 70.28 Tongjiang 710 650 319.6 1,085 1,469.70 817.70 52.67 Nanjiang 610 530 314.6 1,386 1,450.80 751.96 52.78 Heishui 60 50 20.3 939 122.55 56.57 4.16 Rangtang 30 300 4.4 777 99.53 54.22 3.54 Baiyu 40 40 5.1 795 82.65 42.75 1.36 Batang 40 40 10.5 797 99.19 37.72 3.92 Xuangcheng 30 20 9.3 633 67.26 20.49 2.24 Derong 20 20 7.8 655 52.46 15.08 1.68 Muli 120 110 43.3 999 226.52 116.30 10.03 Yanyuan 310 290 128 1,134 555.83 294.63 28.02 Puge 140 120 67.8 974 330.45 159.89 19.03 Butuo 140 130 57.4 921 249.79 140.06 8.24 Jinyang 140 130 58.6 856 270.24 160.09 5.85 Zhaojue 200 190 87.2 991 360.07 200.06 10.72 Xide 130 120 63.5 1,148 348.55 127.33 13.88 Yuexi 240 220 99.1 1,117 506.71 216.22 20.03 Meigu 180 170 71.3 921 265.13 160.64 4.97 Leibo 230 200 81.6 1,110 439.86 252.19 12.01 Xuyong 660 590 28.3 1,832 1,364.95 558.62 53.47
Discussions with the Poverty Offices in Chengdu (provincial capital), Xichang (regional capi-tal), and in Pingwu and Puge counties offer the following profile of the poor in Sichuan:
• Their economic activities are centred around agriculture, animal husbandry, poultry and, occasionally, fisheries.
• The ecological conditions in mountain and hill areas, where the poor are concentrated, are especially harsh, characterized by limited arable land and low levels of soil fertility, with re-sultant low crop yields and insufficient agricultural surplus to generate cash income.
• Village and household enterprises among poor communities are generally at a low key and where they exist, they are linked largely to agricultural products, such as vegetables, fruits, animal husbandry, poultry and fishery.
46 Per capita incomes indicated in the table include urban and affluent populations.

ECN-C--03-089 101
• The average income level in the poverty areas is RMB 1,250 per capita, per annum, much of which is in kind, while the average expenditure is RMB 1,000 per capita, per annum. The main items of cash expenditure are agricultural expenses, school fees, house rent, health care expenses, taxes and transportation costs that together take up more than 60 percent of the to-tal. Less than 40 percent of the income is usually available for food and other household ex-penses.
• In Puge, a nationally designated poor county, the average income is considerably lesser, about RMB 800 per capita, per annum. Of this, only RMB 250-300 is in the form of cash, practically all of which is spent on household expenses. Among the minority Yi community in the county, which has a strong tradition of social interaction, a good part of available cash is spent on ceremonies and get-togethers.
6.3.2 Access to electricity
As with its poverty reduction efforts, China’s achievements in rural electrification have been noteworthy. The IDS (2002) report observes that, “there has been a dramatic increase in rural energy supply and consumption. In particular, the expansion of rural electrification has led to a situation in which some 96% of villages and 94% of households are now served by large or small grid systems. Thus the great majority of even poor households have access to grid elec-tricity, though possibly (particularly for isolated grid systems) with capacity, reliability or qual-ity constraints on potential applications in terms of production activities.” In spite of this, the report indicates that some 77 million people in 30,000 villages have no access to electricity or rely on batteries or small diesel generators. The electrification rate in Sichuan parallels the national average, with 97 percent of the popula-tion having access. This includes 514,000 people supplied by 13,400 mini/micro hydro systems and 32,776 households using isolated micro hydro units. Eighty-two percent of the 8.5 million poor in the province have access to electricity, either from the grid or through mini grids and isolated DRES, mainly mini/micro hydro systems. The total installed capacity of micro and mini grid hydro power in the province is 38 MW, which generates 14.2GWh annually at a capacity utilization factor of only 4.3 percent due to poor equipment quality, low water flows and lack of service capacity.47 This leaves about 1.18 million48 households without access to electricity of any sort. Compared to the situation in 1995, when the total number of people without access to electricity in the province was 8 million, the present situation shows much progress has been made in the last few years. Nonetheless, the remaining population without access is located in remote mountain/hill areas and the problems of supplying them will likely prove far more stubborn. Although the government plans to ensure 100 percent access to electricity in the next 5 to 10 years, it is diffi-cult to envisage grid supply for the vast majority of these populations since the costs would be prohibitive. A World Bank study on MMS mechanisms for DRES in China (Meier, 2001) concludes that in some mountainous areas the improvement of rural electricity grids brought about new financial debts to local governments and electricity supply companies since some of the works were un-dertaken without paying attention to their economic consequences (see Box 2). Similar views are expressed by Deng & Jiao (2002) who argue that: “It should be understood that it is eco-nomically not feasible to resolve the problem of electricity supply to the population without
47 Information on capacity utilization tends to be contradictory. The official view is that the low capacity utilization
of mini/micro hydro systems is due to the poor’s lack of (economic) capacity to make use of potential supply, with average usage hours confined to 4 hrs. daily. However, village visits undertaken during the study suggest supply insufficiency rather than excess capacity is the primary cause of under utilization.
48 This refers to lack of electricity at the household level. By official definition, a village is considered electrified when a government building in it has electricity, even from a solar PV system. But household in the same village need not have electricity of any sort.

102 ECN-C--03-089
electricity in the Western Region relying on the extension of the normal electricity grids. The cost of electricity generation by independent petrol/diesel generators is the highest. The main reason is that the cost of fuel itself is already very high. In addition, the transportation cost of fuel to those remote mountainous areas with poor communication infrastructure is rather signifi-cant. In the end, the cost of electricity generated by petrol and diesel generators can reach RMB 6/kWh, far beyond the economic bearing capacity of ordinary farmers.”
Box 2: Economic Infeasibility of Grid Extension in Hunan
The total investment of Xizhou Prefecture in Hunan Province in 2000 was RMB 295.92 mil-lion in electricity supply infrastructure, ranking at top among all industries. Due to reasons that the mountainous areas account for a big share of the prefecture, the electricity supply ra-dium of the transformation station is too big, population is very much dispersed and per capita electricity consumption is very low, the electricity supply company lost substantively. Mean-while, the cost of electricity in some villages remains to be above 1.4 RMB Yuan/kWh while the most expensive one reached 5 RMB Yuan/kWh. Guzhang is a small county with a population size of 130,000. The funds used to improve the electricity grids in the past 3 years reached RMB 27 million, of which 14 million was spent on the transformation station construction. Expenditure on the improvement of electricity grids in the county proper was RMB 3 million and RMB 10 million in rural areas. By 2001, improve-ment of the grids in the county proper and 49 villages has been completed. However, electric-ity consumption in rural areas of Guzhang at present is very small and it is estimated to be 2.8 million kWh per year. The county electricity supply company buys in electricity from the main grid at RMB 0.25/kWh, and it sells at RMB 0.31/kWh from the transformation station, the gross margin being RMB 0.06/kWh. That is to say that the revenue of the county electric-ity supply company from rural electricity grids is RMB 160,000 per year. It will take at least 70 years for the company to repay the already spent loan of 10 million if the revenue of the company remains to be as low as mentioned above. The households without electricity in county live in 136 villages, if the company blindly extends the grids, at least another 50 mil-lion RMB Yuan investment is needed, which of course is unbearable. The feasible approach is to develop the locally available abundant micro hydropower resources and the investment es-timation is about RMB 20 million.
Meier, 2001
Under the circumstances, DRES offer the most promising and economically viable options for supplying electricity to poor rural communities located in the mountainous parts of Sichuan in particular and the Western Region in general. In Sichuan, the main DRES option for the future will likely be small hydropower due to its relatively high potential in the mountain/hill areas. Solar photovoltaic potential in the province is confined to about four prefectures, while the po-tential for wind power is yet to be assessed seriously and, in any case, it might not be relevant for communities in the mountain/hill areas. However, solar photovoltaic and wind power sys-tems could cater for poor populations in other provinces, which have the supply potential.
6.3.3 Energy consumption patterns of the poor
Rural energy consumption levels have not changed significantly in China in recent years, but consumption patterns have. A recent study on rural household energy consumption (Wang & Feng, 2001) shows a steep decline in fuel wood use, and significant increases in coal, fuel oil and electricity consumption between 1990 and 1995 (Table 6.5). However, the study indicates practically no change in rural per capita energy consumption between 1985 and 1995, the aver-age annual consumption for the period being 373 kgce49 (Table 6.6). Although electricity con-
49 Equivalent to 670kWh per capita (assuming an average household population of four), which is well above the
WEC minimum standard of 300-500kWh.

ECN-C--03-089 103
sumption increased six-fold from 1980 to 1995, it formed only 5.5 percent of the aggregate in 1995, with fuel wood and straw continuing to account for the bulk (68%) of the energy con-sumed by rural people. The consumption of electricity by the rural poor is very likely much less than the foregoing na-tional average and their reliance on traditional fuels for cooking even higher. Although the data in Table 6.5 and Table 6.6 imply a gradual increase in the role of coal as a cooking fuel re-placement for traditional sources of energy, this may not apply to any appreciable extent for the remaining poor in the mountain and hill areas due to supply problems and, more important, cash constraints. Table 6.5 Rural Energy Consumption in China [10
4 tce]
Coal Electricity Fuel Oil Straw Fuel wood Total
1980 3,707 261 127 11,700 10,380 26,175 1985 5,707 501 121 12,350 11,020 29,700 1990 6,450 714 121 13,160 12,615 32,040 1995 7,740 1,745 160 12,900 9,239 31,784 Source: Wang & Feng, 2001. Table 6.6 Level and Structure of Rural Energy Consumption in China
Energy Consumption Per Capita Energy Consumption Structure [%]
Total [kgce] Commercial Energy
Electricity Coal Electricity Fuel Oil Straw Fuel wood
1980 329.0 51.5 7.9 14.2 1.0 0.5 44.7 39.7 1985 367.8 78.4 19.2 1.7 0.4 41.6 27.1 1990 380.8 86.3 24.5 20.1 2.2 0.4 41.1 36.3 1995 369.8 112.2 50.3 24.4 5.5 0.4 40.6 29.1 Source: Wang & Feng, 2001. The energy and electrification status of the poor villages investigated during the present study is summarized in Table 6.7, which highlights the following facts:
• The main cooking fuels in poor rural households are fuel wood, biomass and animal waste. In two of the villages adjoining officially designated ecological zones, the villagers are re-strained from obtaining fuel wood50 from heavily depleted neighbouring hill forests and, therefore, they use only biomass and animal waste.
• Biogas for cooking is used only in one of the villages that is connected to the grid. However, this is limited to a small proportion of about 10 percent of the households.
• Agricultural mechanization and irrigation water-pumping are non-existent in four of the five villages unconnected to the grid, so there are no direct modern energy inputs to farming in them. However, chemical fertilizers, pesticides and weedicides are used in all villages.
• For the non-grid-connected villages, the main source of electricity is small hydropower. Three villages have community size plants with mini distribution grids, one of them with grid supply to a third of its households and another with isolated micro hydro units serving a fourth of its households. The remaining village has isolated micro hydro units for most of its households, with three remaining households located at a spot without water resource poten-tial using diesel generators.
50 In the two villages, the government has acquired some of the agricultural land for tree plantation. However, the
farmers are provided an in-kind compensation in food grain in quantities equivalent to the average crop yield for the corresponding area.

104 ECN-C--03-089
• The most recent connection was acquired by Daping village, in March 2002, and the oldest connected villages were Wudaoqing (since 1985) and Xinlong (since 1982). In Daping and Hezhi (the latter electrified in 1999), households still without access to electricity form 25 and 60 percent, respectively. These are the bottom poor who cannot either afford to buy iso-lated micro hydro systems or pay the electricity charges for accessing the mini grid supply in place.
• In the four non-grid-connected villages, the average effective supply capacity per household is limited to a range of 40-72 W51. Although the installed capacity of isolated micro hydro units is between 300-3,000 W, numerous factors constrain actual generation (Box 4).
• The low level of electricity supply per household limits applications to lighting and televi-sion mainly. With 15 W incandescent bulbs (on average, two lighting points per house) be-ing the most popular, the quality of illumination is dismal, barely sufficient for nighttime visibility and clearly inadequate for reading or writing52.
• Television ownership in the non-grid-connected villages varies. While many households have colour television sets, just as many have to be satisfied with black and white sets for reasons of supply limitation. Furthermore, the high cost of television sets means not all households can afford them even if supply were not a constraint. This is the case with Xin-long, the only grid-connected village that has had access to electricity for 20 years. As of date, only half the households in the village have been able to acquire television sets53.
• Except for Xinlong, households in the other villages do not make use of any other electrical appliances, which is not surprising considering the low level of supply they receive and the economic status of the people.
51 The typical size of photovoltaic systems owned by rural households in China tends to be even smaller, about 20 W.
76% of photovoltaic systems in place are 20 W systems; 14% are 30-50W; and the rest are divided between very small (<20 W) and very large (>50 W) systems (Voravate, Barnes & Bogach, 1998).
52 In Hezhi, where the focus group discussions took place in an electrically lit room, the illumination proved so deficient for taking notes that candles had to be lit.
53 The Pingwu County Office states though that TV ownership has increased from 30% in 1994 to 84% in 2002 for the county as a whole.

EC
N-C
--03
-089
105
Table
6.7
E
ner
gy/
Ele
ctri
fica
tion S
tatu
s of
Poor
Vil
lages
in S
ichuan P
rovi
nce
Y
ang J
ia S
he
Wudaoqin
g
Dapin
ga
H
ezhi
Xin
long
To
tal
no
. o
f h
ou
seh
old
s 1
3
25
0
25
0
27
5
47
0
No
. o
f ho
use
ho
lds
wit
h a
cces
s to
ele
ctri
city
1
3
25
0
20
0
16
5
47
0
No
. o
f ho
use
ho
lds
wit
hou
t ac
cess
to
ele
ctri
city
0
0
5
0
11
0
0
No
. o
f yea
rs w
ith
ele
ctri
city
1
1-M
ay
17
<
1
3
20
Ele
ctri
city
so
urc
es
Iso
late
d m
icro
hyd
ro
(10
h/h
: 30
0W
-3kW
)
Die
sel
gen
set
(3 h
/h)
Min
i h
yd
ro m
ini
gri
de (
10
kW
) M
ini
hyd
ro m
ini
gri
de
(159
b h
/h:
20
kW
) gri
d
(91
h/h
)
Min
i h
yd
ro m
ini
gri
d (
95
h/h
:
8kW
) Is
ola
ted
mic
ro h
yd
ro
(70
h/h
: 30
0-6
00
W)
Gri
d
Aver
age
sup
ply
per
ho
use
ho
ldc
78
W
40
W
72
W
42
W
-
Mai
n e
lect
rica
l ap
pli
ance
s:
- In
can
des
cen
t bu
lb
1
5-4
0W
1
5-6
0W
1
5-6
0W
4
0-1
00
W
- R
adio
1
5-2
5W
Y
es
Yes
Y
es
Yes
- T
V (
bla
ck &
wh
ite)
Y
es
Yes
Y
esd
Yes
Y
es
- T
V (
colo
ur)
Yes
Y
esd
Yes
d
Yes
- H
i-fi
Y
es
Y
esd
Y
esd
- V
CR
Y
esd
- C
loth
es i
ron
Y
esd
- D
rin
kin
g w
ater
hea
ter
Yes
d
- W
ash
ing m
ach
ine
Yes
d
- G
rain
gri
nd
er/m
ille
r
Co
mm
un
ity p
lan
te
Co
mm
un
ity p
lan
te
Oth
er D
RE
S u
sed
S
ola
r w
ater
hea
terd
Lig
hti
ng f
uel
su
bst
itu
tes/
sup
ple
men
ts
Ker
ose
ne
Ker
ose
ne,
bam
bo
o
Ker
ose
ne,
bam
bo
o
Ker
ose
ne,
can
dle
s B
iogas
h/h
un
itd
Mai
n c
oo
kin
g f
uel
s F
uel
wo
od
B
iom
ass,
an
imal
was
te
Bio
mas
s, a
nim
al w
aste
F
uel
wo
od
, b
iom
ass,
an
imal
wast
e
Fu
el w
oo
d, b
iom
ass,
bio
gas
aS
tud
y d
ata
cover
s o
nly
55
ho
use
ho
lds
of
Gro
up
4 o
f th
e vil
lage
wit
h s
mal
l h
yd
ro m
ini
gri
d.
bIn
clu
des
100
ho
use
ho
lds
fro
m a
djo
inin
g v
illa
ge.
cB
ased
on
act
ual
gen
erat
ion
eff
icie
ncy.
dO
wn
ed o
nly
by v
ery s
mal
l m
ino
rity
of
aff
luen
t h
ou
seho
lds.
eO
wn
ed b
y o
ne
or
a fe
w h
ou
seh
old
s as
bu
sin
ess
ente
rpri
se.

106 ECN-C--03-089
• In Wudaoqing and Daping, villages with community scale mini-hydro systems, the plants are connected to grain grinders/millers. In these villages, these are the only productive use applications for electricity.
• Households in all four of the non-grid-connected villages use kerosene and/or bamboo as lighting fuels. While unelectrified houses have no other choice, electrified houses fall back on these alternatives during low water season when the power supply from mini/micro hy-dro systems is erratic and unreliable.
• Brown-outs are common in the Hezhi village mini grid due to low/erratic voltage even in high water seasons when the very limited supply capacity of the system is overextended by houses simultaneously turning on television sets.
The picture presented by the foregoing observations portrays a situation of high reliance by the poor on traditional energy sources, human labour and animal power with only a symbolic access to electricity. While some electricity, even at the levels indicated, is preferred to none, clearly it is not enough to make a meaningful impact in either the living conditions or the livelihoods of the poor. No doubt, an analysis of this handful of villages cannot be statistically valid for China as a whole. However, to the extent that these villages are representative of poverty conditions as such, the qualitative insights offered by them offer a quick but probably accurate enough snap-shot of the larger context. Of particular concern is the real cost that the poor have to bear to obtain even this quality of supply. The average cost of a 1 kW isolated micro hydro system in Yang Jia She was RMB 1,755 including system cost, civil works and labour. However, if one were to take into ac-count the actual supply from the system, the effective investment per kW in it comes to some RMB 35,000 (Box 3), which is more than fourteen years’ gross income for the average house-hold in the village.
Box 3: Low Efficiency of Mini/Micro Hydro Systems in Puge and Pingwu Counties, Sichuan
The mini/micro hydro systems used in China are demarcated by vintage. The efficiency of pre-1995 models is 75 percent at the time of installation, while that of post-1995 models is 95 per-cent. The equipment efficiency, however, declines steeply to 50 percent of these figures in five years’ time, yielding a capacity utilization factor (against rated capacity) of 37.5 and 47.5 per-cent, respectively. At this point, system breakdowns are frequent and, in the absence of com-petent servicing, units tend to go out of service since the villagers lack the technical know-how to carry out major repairs. In Puge County, whose small hydro programme is one of the earli-est in the country, most of the equipment in place is of pre-1995 vintage. These inherent equipment shortcomings are compounded by seasonal fluctuations in water flow. On average, four months of the year experience low or no water flow. Generation during this period, therefore, drops to zero or minimal. This is accompanied by low and erratic volt-age. Voltage fluctuations are common in pre-1995 models even during high water seasons, which inhibits the use of voltage-sensitive high-cost appliances even if they could be acquired by the poor. Poor system design, absence of equipment standards and lack of technical servic-ing facilities add to these problems. Performance and Real Cost of Isolated Micro Hydro Systems in Yang Jia She, Pingwu County
High Water
Season
Generation
Hours
[Mar-Oct]
Operating
Efficiency
[%]
Low Water
Season
Generation
Hours
[Nov-Feb]
Operating
Efficiency
[%]
Net
Generation
from 1kW
System
[kwH]
Annualised
Capital Cost
Over 10
Years
[RMB]
Annual
Maintenance
Cost
[RMB]
Cost Per
kWh
[RMB]
Effective
Investment
for 1kW of
Capacity
14 33 14 1 1,149 340 100 0.38 35,311

ECN-C--03-089 107
6.4 Impacts of DRES on the Poor
6.4.1 Poverty alleviation impacts
Based on the World Bank studies on energy, poverty and gender (IDS, 2002; Marge, 2002a & 2002b), the main impacts of electricity on rural living conditions can be divided into: a. illumination (lighting), b. alleviation of isolation (mainly television and to a lesser extent radio), c. home improvement (through ownership of household appliances), d. education (lighting, television), e. health (lighting, refrigeration), f. women’s status (lighting, television, household appliances), g. building of social capital (lighting, television). The impacts of electricity on the living conditions of the poor in the present study villages (Table 6.8) are assessed against these. Table 6.8 Perceived Benefits of Electrification in Study Villages in Sichuan Province
Yang Jia She Wudaoqing Daping Hezhi Xinlong
Lighting Very high Very high Very high Very high Very high Knowledge of outside world through TV
Very High Very high
Very high
High
Very high
Household/community safety High Low High High Opportunities for social interaction High Savings in women’s time Very high Highb Savings in men’s time Low Very high Very high Education:
- additional study hours None Moderate - knowledge gain through TV Moderate High
Ease of cooking, household activities
Income growth Insignificant Lowa Too early to tellc
Insignificant Low
a From RMB 250 to RMB 337 in 15 yrs., price adjusted (2.3% annual growth rate). b From biogas systems for cooking rather than from electricity. c The mini-hydro system in the village was installed only six months ago.
Illumination In spite of the low quality of lighting observed in the villages, lighting is perceived as one of the top two benefits of electrification. There are numerous reasons for this, which are largely psy-chological and social. The IDS report observes that because of the very high rate of rural electri-fication achieved in China, those remaining communities that do not have electricity suffer from a sense of exclusion. Lighting is, therefore, seen as a symbol of social achievement as much as it is a vehicle for illumination. In all the study villages, it was evident that electrical lighting had a high premium regardless of its quality.
Alleviation of isolation The second of the top two benefits of electrification is the television, which was, in fact, ranked the foremost benefit in one village. The most significant impact of television is to mitigate the geographical and social isolation of the people through awareness and knowledge of the outside world. Its practical uses in terms of day-to-day use may include, among others, weather fore-casts, news of agricultural product prices in neighbouring markets and entertainment.
Home improvement The popular perception is that electricity ushers in a new era of convenience at home through a variety of labour-saving kitchen and household appliances like cookers, clothes irons and so on. This proved true only for the sole grid-connected village covered by the study that did not face a supply constraint but needed only sufficient purchasing power. In the remaining villages that

108 ECN-C--03-089
were electrified through off-grid systems, ownership of appliances was severely limited by sup-ply capacity limitations and lack of purchasing power. Barring the television and radio, practi-cally no other appliances were in evidence in the non-grid-connected villages covered by the study.
Education Another oft-asserted benefit of electrification is that it contributes to education, which, in turn, leads to the improvement of a family’s social and economic prospects over time. This was not evident in any of the villages under the study. Given the low quality of illumination from the mini/micro systems in place, such lighting as was available was insufficient for any extended study hours for children or for adult education. However, children and adults benefited in terms of knowledge gained by watching television. While the value of this cannot be played down, it is nevertheless not equal to formal education or focused adult awareness improvement. However, an earlier study by the World Bank (Voravate, Barnes & Bogach, 1998) found that households that own photovoltaic systems generally have higher educational levels compared with households without photovoltaic systems. According to the study: “In households that own photovoltaic systems, more than 94 percent of the heads of households in Xinjiang and Gansu Provinces, and all the heads of households in Inner Mongolia could read. In Qinghai, about two-thirds of households with photovoltaic systems could read. Furthermore, the heads of house-holds with photovoltaic system owners in Gansu and Xinjiang Province generally have higher levels of education compared with the provincial averages. Educational levels of owners of photovoltaic systems in Qinghai are higher than the provincial average. Clearly, there is a strong link between education and ownership of households photovoltaic systems.” The findings are plausible since solar photovoltaic systems are invariably supplied with compact fluorescent lamps capable of much better illumination than incandescent bulbs of equivalent wattage. At the same time, it should be noted in the context of the poor that education is not a factor of household illumination alone but more rather a combination of other factors, such as the availability of schools and, more fundamentally, the people’s financial capacity to afford school fees in the first place. This is underlined by another World Bank study (World Bank, 2001) which observes: “As many as half of the boys in many of China’s poorest villages and, particularly in some minority areas, nearly all of the girls do not attend school and will not achieve literacy.”
Health The health impacts of electricity were not clearly discernible during the study. However, the IDS report on China states that, “Electricity does not seem to have made serious inroads into the time spent by women on onerous and health harming reproductive tasks…”. Reports from other country assessments (Marge, 2002a & 2002b) indicate that electricity from the grid has positive impacts on village health clinics and health services, but its impacts on household health were uncertain. The main focus of the present study is not on electricity in general but rather on elec-tricity supplied by DRES. Considering that electricity has no replacement role vis-à-vis tradi-tional cooking fuels, which are the source causes of most of the harm done to human health in rural households, it carries no inherent benefits at this level. Given the scale and unreliability of supply from DRES, there was no evidence either of benefits from them through improved community health services.
Women’s status The benefits attributed to electricity from DRES during the study included additional time, ease of cooking and household chores, knowledge gains from television and increased social interac-tion. Savings in women’s time were especially significant in the villages served by community scale mini-hydro systems coupled to grain grinding equipment. The latter resulted in savings of

ECN-C--03-089 109
about 1 hr. of time per day for the women54. In spite of the low quality of illumination, house-hold tasks like pig food preparation were made easier by electricity, but did not necessarily re-sult in significant time savings. The time gains made by women were largely redirected to other household activities and, to a certain extent, agricultural activities. These findings are consistent with those of the IDS report, which observes, however, that the implications of electricity for the status of women and men could be quite different (Box 5).
Building of social capital Social capital covers many tangible and intangible aspects that are not easy to define, let alone quantify. Beginning with one’s self-esteem, it includes factors such as the ability for socializa-tion, interaction with the outside world, sense of safety and security, and an overall sense of bet-ter-being. Electricity from DRES, or otherwise, clearly made a positive contribution to all of these in the study villages.
Box 4: Impacts of Electricity on Women
Time Allocation by Women Before and After Electrification: Housanxi Village Task Ratio of Time Spent After and
Before Electrification [%]
Housework (cook, sweep, fetch water, child
care) Pig food preparation
Working on the fields
Resting
Sleeping
99
45
157
132 101
Total 100 The responses of one couple interviewed in Duiwotai village may suggest radically different gendered attitudes to the benefits of electricity. The wife was very enthusiastic because “I can work late into the night”. The man was equally pleased because “I can sit around and talk to my friends in the evening”. Similar comments might suggest that women worked longer hours than men, and that electricity might exacerbate this. However, questions to women about who was worse off, who worked harder, ate better, who was poorer, usually elicited the response “We are all poor, all tired”. They did not declare their husbands or men in general had a better life. IDS, 2002
On the whole, the poverty alleviation impacts of electricity from DRES are positive in various ways and insignificant in others. Unfortunately, it is those ‘others’ that seem to count more. If one were to link back the findings of the study to the potential role ascribed to energy services at large in fulfilling the millennium development goals55, one is forced to conclude that electricity-producing DRES do not measure up. Their contribution is low or none to the goals of halving extreme poverty, reducing hunger, improving access to safe drinking water, reducing child and maternal mortality, reducing diseases, achieving universal primary education, promoting gender equality and the empowerment of women, and enhancing environmental sustainability56 57. If
54
In fact, the time savings for men were twice that since, prior to electricity, they had to travel to nearby towns for
grain grinding. 55 Refer to Box 1 earlier. 56 The electricity from DRES substitutes only a small fraction of the total traditional energy used in poor
households; as such, although it has environmental benefits as, for example, through the substitution of kerosene or bamboo for lighting, these benefits are generally not significant.

110 ECN-C--03-089
one could overlook all these and examine the impacts of electricity supplied by DRES using a very narrow angle lens of whether or not it makes a difference in the living conditions and life-styles of the poor, then yes, it does make a difference, but it is not quite enough.
6.4.2 Poverty reduction impacts
The impacts of electricity provided by DRES specifically on the livelihoods of the poor are low or none. In absolute terms, local government officials in Pingwu and Puge Counties (where the study villages were located) assess that average annual income levels increase by around RMB 80 following electrification by mini/micro hydro systems. The villagers themselves did not feel there was any perceptible change in their income levels. In relative terms though, the economic impacts of electricity seem greater from community scale mini-hydro systems than from isolated household micro hydro systems. As mentioned ear-lier, in two of the study villages, the community scale systems were coupled to centralized grain-grinding equipment, which were operated on a commercial basis. In one village (Wudao-qing), the owner of the mini-hydro-cum-grinding mill unit charged RMB 3 for every 50 kgs. of corn grinded for the village households. In the other (Daping), the grinding services were pro-vided free in exchange for community labour contributed to the construction of the system. In both cases, however, the systems were not owned by the communities as such, but rather by a partnership of three in the first and a single family in the second. Any direct increase in incomes would, thus, accrue to these owners rather than to individual households. At the same time, there were indirect benefits in terms of saved time to all households. It was unclear whether this time was redirected to productive activities, but the absence of claims towards any distinct in-come growth suggests that it was not, at least to any perceptible extent. At a broader level, the correlation between electricity and poverty reduction appears to be weak from available evidence. As mentioned earlier, at the provincial level, Sichuan has achieved a household electrification rate of 97 percent; in other words, only 3 percent of its population, mostly the poor, is currently without access to electricity. At the same time, the proportion of the poor is 13 percent, meaning 10 percent of the people are still poor even after electrification. Considering many of them obtained access to electricity as far back as ten years ago, including grid connection or through grid-connected small hydro systems, there are clearly a number of factors other than electricity supply that contribute to their persistent poverty conditions. These would include the absence of post-electrification complementary inputs, such as roads, commu-nication, skills development, market access, credit and so forth. These factors have obviously constrained the people from making effective use of available electricity for productive pur-poses that could induce a significant growth in their incomes. The IDS report, citing a World Bank assessment of rural electrification, states that: “All the evi-dence to date, including that from Bank-financed RE projects in Asia, shows that RE does not directly reduce poverty by helping the poorest rural people. Most of the direct benefits from ru-ral electricity go to wealthier people. ….Once connected, the amount of electricity consumed, and therefore the benefits obtained, depend on the ability to buy electrical equipment, whether light fixtures, televisions, fans, water pumps, or motor-driven machines…. RE reduces rural poverty only through a general rise in rural income obtained by productive uses. And - again with the exception of irrigation pumping - these productive uses of electricity appear to come about only when other factors are already raising rural and national per capital income.”
Is there any role then for DRES at all in poverty reduction? Apparently, there is. Allowing for other essential complementary inputs, the villagers consulted during the study identified a range of potential income-generating activities, many of which would be based on powered equip-
57
It is important to note that other forms of energy supply also have similar shortcomings. For example, grid
electricity used in homes also do not contribute significantly to MDGs.

ECN-C--03-089 111
ment, while others would make use of both electricity and modern fuels. These activities were related to their local resource and skills availabilities, and to their perceptions of market poten-tial for the ensuing products or services. Table 6.9 Potential Income-Generating Activities in Study Villages
Yang Jia She Daping Xinlong
Poultry hatchery Mushroom drying Grain processing for pig farm Cast iron foundry Shaping stones for construction material
A second grain mill Increased lighting Electric cookers to save time Refrigerator for food preservation Water heater
Fruit plantation Medicinal herbs Mulberry tree planting Grass planting for animal husbandry
The real issue, therefore, is not whether or not DRES can reduce poverty. Rather, the question is on what scale and level of reliability can DRES be promoted so that they cater for new or en-hanced livelihood activities. Clearly, at their present scale and level of reliability, they can meet no more than a part of the basic and social needs of the poor. But if this could be changed, then they do have a role to play in the future in both poverty alleviation and poverty reduction, more so in view of the fact that the remote poor communities in China have few other energy options.
6.5 Capacity and Willingness of Poor Households to Pay for DRES
6.5.1 Capacity to pay
According to official figures, some 65 million people in China have a per capita annual income less than RMB 1,000 (US$ 125) (Table 6.10). Of these, 7 million are the bottom poor, earning less than RMB 500 (US$ 62) per capita, per year. In Sichuan alone, there were 4.3 million peo-ple earning less than RMB 1,000 and 241,000 earning less than RMB 500 in the year 2000. For a family of four, this works out to a monthly household income of RMB 333 and RMB 166 (US$ 42 and US$ 21), respectively, for the two population groups. Much of this (65-75%) is not cash income but rather in-kind income in the form of agricultural products. The monthly cash income per household will, therefore, range between RMB 83-116 (US$ 10-15) for the poor and between RMB 41-58 (US$ 5-7) for the bottom poor. These figures speak for themselves. Table 6.10 Per Capita Income of Farmers in Western Provinces of China in 2000
Per Capita
Income
[RMB]
Order in the
Country
Population of Farmers with
Per Capita Income
< RMB 500 p.a.
Population of Farmers with Per
Capita Income less than
< RMB 1,000
Shanxi 1,443 28 883,000 7,415,000
Gansu 1,428 29 733,000 8,096,000 Ningxia 1,724 24 297,000 1,287,000
Qinghai 1,490 26 273,000 1,850,000
Xinjiang 1,618 25 249,000 2,700,000
Tibet 1,330 31 Yunnan 1,219 27 3,090,000 18,722,000
Guizhou 1,325 30 802,000 6,163,000
Sichuan 1,835 21 241,000 4,357,000
Chongqing 1,683 22 11,000 2,510,000 Guangxi 2,142 23 21,000 2,605,000
Inner-Mongolia 2,058 16 400,000 2,455,000
Average/Total 1,607 7,000,000 58,160,000
National Average 2,253 Data source: China Agricultural Publishing House,2000 (cited from Deng & Jiao, 2002).
Data from the present study corroborates broader evidence of the poor’s lack of capacity to pay for DRES in Sichuan. Low income was cited as the foremost constraint to DRES at all levels of government that were consulted during the study. The assessment of the economic status of the study villages, in fact, shows that the average poor household with access to electricity through

112 ECN-C--03-089
mini/micro hydro systems has to take out a loan ranging from RMB 112-359 annually (Table 6.11) to purchase a mini-hydro system58. In the discussions with the villagers, they indicated that they obtained the loans from relatives and friends (poor households do not have access to commercial loans). It was beyond the scope of the present study to verify how the households repay these loans but they might be repaying them by cutting down on their future expenses or by repaying in kind in goods or labour or other forms of assistance to those who helped them. Table 6.11 Economic Status of Study Villages in Sichuan Province [RMB]
Yang Jia She Daping Hezhi Xinlong
Annual Household Income
Farming (grains, vegetables, fruits) 1,000 2,050 2,100 4,800
Livestock, poultry, fishery 1,000 110 650 1,200
Other (including food for work) 400
Total income 2,400 2,160 2,750 6,000 Annual Household Expenditure
Farm expenses (mainly chemical fertilizers) 400 600 1,000 1,000
Food 1,040 1,050 1,050 2,000
Education 860 860 1,230
Hospitality, recreation 300
Clothing 40 100 55 300 Transportation, communication (phone) 120
Medical care, medicine 50 16 15 150
Taxes 20 22 27 60
Electricity O&M expenses/charges 100 50 100 210
Kerosene, candles 2 2
Other
Total expenditure 2,512 2,138 3,109 5,070
Annual Surplus/Deficit -112 22 -359 930
As % of Annual Income 5 1 13 15 Average Household Assets (mainly house and livestock) 8,000 6,000 6,000 8,000 Notes: 1. Within the time available, it was not possible to distinguish clearly between cash/non-cash income. According to
county officials, cash income varies between 25% and 35% of the total. 2. Where not stated by respondents, education expenses have been assumed at RMB 860 for one child, which is the
standard for primary school. Since these are cash expenses that affect the net annual deficit of poor households, it may be that such households do not send their children to school. In Daping village, the marginal annual surplus of RMB 22 results from education expenses excluded by respondents. Presumably, they do not send their children to school for lack of money. If primary school expenses for one child were included, the average household budget for the village will result in an annual deficit of RMB 838, the largest among the group.
Adding further to this evidence from elsewhere are the findings of the World Bank’s study of the market for solar photovoltaic systems in China (Voravate, Barnes & Bogach, 1998). The re-port of the study observes that 82 percent of the households with photovoltaic systems were those with high incomes and high assets (Figure 6.3 & Table 6.12) and concludes that house-holds with monthly incomes below RMB 300 cannot readily afford to purchase solar home sys-tems.
58
The data presented in Table 6.11 is obtained from visits undertaken in the study to only seven villages and
therefore can not be regarded as statistically valid for China as a whole. However, to the extent that these villages are representative of poverty conditions as such, the qualitative insights offered by them offer a quick but probably accurate snapshot of the larger context.

ECN-C--03-089 113
Figure 6.3 Distribution of Photovoltaic Owners Based Income and Assets Owned Source: Voravate, Barnes & Bogach, 1998.
Table 6.12 Affordability of Small Photovoltaic Systems
Ganzu Inner Mongolia Xinjiang Qinghai Total
Small systems are affordable
High income and high asset households. 43,838 180,186 196,991 62,026 483,040
Percentage of households. 8 64 47 73 35
Small Systems may be affordable. 93,775 56,064 35,596 13,471 198,906
Low income and high asset households. 16 19 9 16 15 Percentage of households. 98,988 3,962 91,708 4,473 199,131
High income and low asset households. 17 1 22 5 15
Percentage of households.
Small systems are probably not affordable. 332,849 56,144 90,291 4,691 383,975
Low income and low asset households. 59 19 22 6 35
Percentage of households. Source: Voravate, Barnes & Bogach, 1998.
The only conclusion that can be drawn from all this is that the poor simply do not have the ca-pacity to pay for DRES. Concern over this in the light of the government’s policy to promote DRES for poor household electrification is voiced by Deng & Jiao (2002) in their study on the market potential for off-grid electricity from DRES in China: “After these people pay for basic living expenses and schooling of their children, how much remains to be available in the farm-ers’ hands that can be used to purchase the ‘three-micro electricity generation’59 equipment?”. This is not a criticism of the government’s policy to promote DRES for the poor since, as noted earlier, there are no other viable options to provide electricity to the remaining unserved poor in the country. It is more a question of enabling these people financially to an extent, through MMS or others options, so that the policy could be implemented effectively.
6.6 Willingness to pay
In spite of the overwhelming evidence showing the poor’s lack of capacity to pay, the fact re-mains that many poor households, including those in the villages covered by the present study, have in fact managed to acquire DRES one way or another. On the face of it, this seems to indi-cate their willingness to pay for electricity services even though in some cases they have taken loans to purchase the system. As the IDS report and many other empirical studies on rural elec-trification indicate, rural populations without electricity will go to extraordinary lengths to get it
59
Refers to solar photovoltaic, small hydro and wind power systems.

114 ECN-C--03-089
and display remarkable ingenuity to pay for it. Instances of this phenomenon were found during the study (Box 5).
Box 5: Examples of Willingness to Pay for Electricity from DRES
Hezhi Village
The village was actually grid-connected until some years ago when the villagers opted out of it for reasons of high and uncertain electricity bills. Apparently, the local utility policy was to recoup electricity theft/pilferage losses in its area of coverage by spreading them across regis-tered consumers. Over time, as the incidence of unauthorized connections increased, regis-tered consumers in Hezhi found themselves being billed for increasing amounts of up to RMB 130 per month which proved beyond their capacity. As a result, they acquired a six-stage mini-hydro system and many households not served by the system installed isolated mi-cro hydro units. In spite of the poor output quality of these systems, the villagers expressed a clear preference to them over grid connection as they owned and controlled the former and did not have to pay the utility. When asked if they would like to reconnect to the grid for in-creased supply volume and quality, their response was that they would much rather upgrade the existing systems or acquire new ones. Daping Village
The community scale mini-hydro system was built with the labour contributed by all house-holds. Although the system is owned by a single family, the arrangement is that all households will get electricity from the system free of charge for the first two years in repayment of their labour. Thereafter, they would either pay a fixed electricity charge of RMB 50 per household or 50 kgs. of corn to the system owner. (Unfortunately, this ingenuous arrangement had a negative side to it. When the system owner applied for a bank loan to upgrade it, his applica-tion was turned down since he could not demonstrate sufficient cash flow.) Roadside Bee-Keeping Enterprise
The owner of a roadside bee-keeping enterprise selling honey had a 16 Wp solar home system, which was sufficient to power a 9 W compact fluorescent lamp, a black and white television set, and a mobile phone battery charger. The presence of the system allowed him to set up shop along the highway frequented by potential customers. In its absence, the enterprise would have lacked mobility and perhaps not been feasible. The owner was, therefore, willing to pay the system cost of RMB 1,400, which he could recover from the proceeds of his enter-prise.
While the poor’s willingness to pay for electricity services demonstrated by households is evi-dent, it must be emphasised that this is not always based on correct information. In certain cases the information provided to households by vendors (or others) is incorrect in the sense that they paint a very positive picture of the expenses that can be avoided and the low O&M cost of the system. If, after the purchase of the system, it turns out that the O&M costs are higher and/or expenses avoided are less than expected the ex ante willingness to pay is different from the ex post willingness to pay ( in the sense that the households would not have purchased the system if the decision would have been based on correct information). This could lead to a situation whereby households remain in debt throughout their life which actually could worsen poverty. In three of the villages covered by the present study, the mini/micro hydro systems were ac-quired through borrowings from family and friends. Only in one instance (Wudaoqing), the community scale system was purchased through a bank loan, which was repaid within three years out of earnings from the attached grain grinding facility. This underlines the importance of not only financing, but also the effectiveness of productive uses of electricity in ensuring the fi-nancial sustainability of DRES.

ECN-C--03-089 115
The most common measure of people’s willingness to pay for electricity, through DRES or oth-erwise, is their current expenditure on other forms of energy that electricity can replace. While the study was unable to make a detailed assessment of the energy expenditure of unelectrified poor households, an indication of the level of this expenditure was offered by officials of Puge County. According to them, the monthly household expenditure on kerosene for lighting ranged between RMB 15-20, which works out to an annual expenditure of RMB 180-240, an amount equivalent to the cost of a 300 W micro hydro system spread over 4-5 years but requiring a much longer payback period of 12-15 years for a 40 Wp solar home system (Table 6.13). Table 6.13 Prevailing Market Prices of DRES, Components and Appliances in 2002
System/Component Capacity Sale price [RMB]
Incandescent bulb 15 W 25 W 40 W
1.20 1.20 1.50
Fluorescent lamp (tube light) 20 W 30 W 40 W
28 28 28
Compact fluorescent lamp (CFL) 9 W 11 W
18 18
Solar home system 40 Wp 50 Wp 70 Wp
100 Wp
2,780 3,480 4,800 6,900
Storage battery for solar home system for 40 Wp system for 50 Wp system for 70 Wp system for 100 Wp system
100 W 102 W 200 W 200 W
520 650 960
1,250 Mini/Micro hydro system 300 W
3,000 W 1,000
6,000-10,000 Television set black & white colour
17” 21”
370
1,200 However, the limited, possibly inconclusive, data from the village visits does not support the above estimates. As shown earlier in Table 6.11, the annual household expenditure on kerosene and candles is stated by the villagers to be only RMB 2, which is a far cry from the county level estimates. The possible explanations are that the latter pertain to unelectrified households that are not really the bottom poor or that poor households in the villages covered by the study use other sources of energy, such as bamboo, for lighting. Either way, kerosene expenditure as a re-flection of willingness to pay for DRES is not clearly established and a more detailed assess-ment of it is needed. What is more important here is that even if the kerosene price estimates were correct and they apply to poor households, there is no getting over the fact that the average poor household in the study villages runs up an annual budgetary deficit. For instance, in Yang Jia She, the average O&M expense on isolated micro hydro systems was RMB 100 per household against the aver-age annual budgetary deficit of RMB 112, and this does not take into account repayment of the moneys households might have borrowed informally to acquire the systems. Furthermore, if the costs of common appliances and replacement components were taken into account, the financial situation of poor households is affected even more. For example, the cost of a 21” colour television set (RMB 1,200) exceeds the cost of investment in a 300 W micro hy-dro unit and the cost of a replacement battery (RMB 520) every two years for a 40 Wp solar

116 ECN-C--03-089
home system is equivalent to the cost of the latter’s ten-year life cycle, effectively doubling it (Table 6.13). Table 6.14 Expenditure on Livelihood and Household Energy Consumption Per Capita in
Sichuan
Expenditure on Livelihood p.a.
[RMB]
Expenditure on Energy Consumption p.a.
[RMB]
Ratio of Energy Expenditure to Livelihood Expenditure
[%]
1985 1986 1987 1988 1989 1990 1991 1992 1993 1994
276.3 316.9 348.3 426.5 473.6 509.2 552.4 569.5 647.4 904.3
15.43 14.71 15.32 20.16 21.02 25.30 25.19 25.63 41.91 82.75
5.58 4.73 4.40 4.73 4.44 4.97 4.56 4.50 6.47 9.15
Source: Wang & Feng, 2001.
Table 6.14 shows the energy expenditure of rural households in Sichuan, including expenditure on electricity. The point of interest in this is that the quantum of energy expenditure and its ratio to livelihood expenditure increased significantly from 1993 onwards when rural electrification programmes were intensified and household coverage rose significantly. In other words, the ar-rival of electricity meant a trebling of energy expenditure in two years. To the extent that this was unaccompanied by income gains, the implications for poverty reduction are negative. In summary, while DRE systems carry a number of distinct poverty alleviation benefits, in cer-tain cases where households are not fully informed about the potential costs and benefits of the DRES, the purchase of DRES could actually worsen poverty by imposing on the poor the addi-tional burdens of debt and higher recurring expenditure on maintenance of electrical equipment. The ESMAP, World Bank study in Philippines (ESMAP, 2002) suggests a number of surrogate indices to measure willingness to pay, ranging from estimates of people’s readiness to bear in-creased education and health costs to productive gains and community-wide benefits. Applying these techniques and effectively quantifying their results will mean far more time and resources than what the present study had. In any case, the common assumption underlying these tech-niques is that capacity precedes willingness to pay. The evidence from the study does not show this to be the case among the poor. What may be interesting though is that were such a detailed assessment possible in the context of the poor in China, a clearer case could be made out for the public benefit aspects of DRES in order to scale up public funding for their promotion.
6.7 Potential Contribution of MMS to Promote DRES for the Poor
6.7.1 Future role of DRES in poverty alleviation and reduction
In spite of the mixed, and often disappointing, evidence presented in the preceding section, it is clear that DRES will play a distinct role in providing modern energy services, particularly elec-tricity, to the remaining poor in China. The literature review and first-hand analysis of data un-der the study suggest the need for a future DRES promotion strategy somewhat different from what has been pursued so far. The main elements of an alternative strategy could be the follow-ing:
• In order to overcome the central constraint of affordability, a two-pronged approach, simul-taneously targeting system cost reduction and purchasing power increase, seems essential. MMS could contribute towards the former as discussed further down.

ECN-C--03-089 117
• Efforts to increase the poor’s purchasing power to acquire DRES are ideally linked to the promotion of DRES. This could take the form of projects or mechanisms that combine the sale of DRES with the sale of productive use appliances that carry the potential for income-enhancing micro-enterprises or other similar activities at the household level. This, however, is subject to the availability of complementary inputs, a topic discussed in the next section.
• For the bottom poor, that is, those with incomes below the national poverty line, neither cost reduction, nor income enhancement may be on a scale sufficient to enable them to acquire DRES in the near term. In their case, all or a major portion of the initial investment plus re-sources to ensure optimal system performance through regular servicing may have to be sourced from public funds, with a potential role for MMS in the latter.
• In either case, that is, for the poor and the bottom poor, the scale of DRES and the quality of electricity services provided by them should improve substantially upon present capacity and performance levels. In Sichuan, small hydropower will remain the main DRES for elec-tricity in the future. According to provincial government officials, systems below 1 kW ca-pacity are capable of meeting only the basic needs of the poor. In order to cater for produc-tive uses, the focus for the future should be on systems in the 1-10 kW range, with an em-phasis on community scale systems. Greater attention should be paid to increasing the gen-eration from these systems and efforts undertaken to improve their technical reliability.
• Scaling up system capacity and/or ensuring performance quality should not be restricted to new systems sold but it should also cover the upgrading of systems already in place. In fact, rehabilitation programmes are already in motion and these should be continued and ex-panded alongside market penetration measures for new systems.
• Other forms of DRES, such as biogas, and efficient end-use devices like improved cook stoves should be included in future promotional efforts as they are not only essential to achieve significant time savings among the poor women, but biogas also has the potential to generate a substantial reduction in chemical fertilizer costs which is equivalent to raising in-comes.
• The allocation of public investment to support DRES acquisition should have greater speci-ficity in relation to the poor. The present practice of allocations by county may need to be replaced by new arrangements that are able to ensure priority to poor villages and/or poor households as measured by income level.
• On the whole, if poverty reduction is the end objective, then the future role of DRES should be guided by this objective in form and substance. A poverty reducing promotional model will then assume primacy over the present basic needs model60, which tends to concentrate on small and static system capacities61. It would be necessary to redirect attention to larger systems with modularity and expansion potential to cater for demand growth over time.
6.8 Feasibility of MMS to promote DRES for the poor62
6.8.1 Emphasis on poverty reduction
The concept of MMS as a promotional mechanism for renewable energy systems at large is es-sentially driven by environmental objectives. It fits rather uneasily into the framework of pov-erty reduction, which has generally been considered an incidental outcome63 of DRES and not necessarily the foremost priority. Elsewhere in the industrialized countries where MMS has been deployed to encourage the use of renewable energy for electricity production, issues relat-
60 In actual fact, it would subsume rather than replace the latter. 61
One could argue that households could add modules to increase the electricity output. While this is true for PV, it
is less easy to add new capacity for mini-hydro the way one could with PV. Furthermore, the purchasing power of the poor is so low that even the first system is a heavy strain on them which makes it not realistic to expect them to add additional capacity.
62 The discussions in this section are concerned mainly with micro/mini-hydro systems which have been identified in the preceding section as the most suitable for MMS.
63 One could even say it has been dragged into the limelight by the force of mounting concerns over poverty.

118 ECN-C--03-089
ing to it have had little to do with the fundamental problem of poverty; and the focus of atten-tion in those instances has been on inducing a switch from one electricity source to another, re-lying on well-developed markets for energy as such. This raises two questions. Are DRES capa-ble of playing an effective role in reducing poverty? If so, can an MMS mechanism assist them to do so? The response to the first question has been set out at length in the preceding parts of this report. The gist of it is that DRES are capable of doing so but with several shifts in their promotional strategy as outlined above. One of the crucial components of the proposed strategy is the need to ensure that the poor are not only able to acquire electricity through DRES, but they are also able to get sufficient quantities of electricity to be able to apply it to productive uses. This is both a matter of the size of systems and the effectiveness of their performance. In the villages investi-gated during the study, the kWh output from systems in place is much lower than what might be possible with better servicing and maintenance. While newer systems might have an inherently better capacity utilization factor, the lack of financial resources at the level of the poor and their low technical skills mean that without proper servicing maintenance, even better quality new systems will not be able to deliver what is feasible. The role of MMS in the proposed promo-tional strategy for DRES is, therefore, to help the poor overcome their financial capacity con-straints to make effective use of DRES.
The one distinct advantage of MMS over other options to promote DRES is that it has the po-tential to generate a continuing stream of revenue that could be used to support regular mainte-nance of systems sold. The non-MMS options could be (a) capital cost subsidies by the govern-ment for system acquisition, (b) micro loans by development banks or micro-financing institu-tions, again for capital cost and (c) government grants or budgetary allocations for system main-tenance. The first two of these options do not provide for maintenance costs, while the third car-ries the uncertainties of regularity and sufficiency due to fluctuations in government budgets and allocation priorities. There is, therefore, a case to be made for MMS as it can link the main-tenance/servicing subsidy to number of systems installed and keep pace with the progress of ex-panded coverage.
In China, offgrid DRES are being promoted by the government essentially to fulfil a social ob-jective, that is, to electrify the remaining unserved population, the majority of whom is poor. It is mainly remoteness that prevents the government from achieving this objective through con-ventional options, such as grid. Were it not for the tremendous logistical difficulties of extend-ing grid supply to scattered rural communities in the distant mountain areas, most of the poor will by now have received access to electricity one way or another. The suitability of MMS for offgrid DRES options, therefore, has more to do with finding a solution to ‘remoteness’ rather than with finding the ‘cleanest’ resource-technology combination. In this process, MMS is sim-ply a tool to promote poverty/access objectives. This is different from the objectives attached to MMS for grid-connected DRES which have a more apparent environmental rationale.
Throughout the study, the vast majority of people interviewed/consulted have repeatedly stressed the above order of priority. Under the circumstances, the notion of an MMS subsidy in the form of a ‘green’ certificate price for offgrid DRES is more to ensure conformity with the larger MMS for grid-connected DRES, but it does not necessarily follow that the latter’s envi-ronmental objectives could be equally associated with the former. Indeed, for offgrid DRES in China, environmental benefits are incidental to poverty benefits, since the majority of potential users will be the poor.
Although the present study, and preceding ones in China and other developing Asian countries indicate the high cost per kWh that the poor are often willing to pay, it does not automatically follow that DRES contribute to ‘reducing’ poverty in the sense of raising incomes above the

ECN-C--03-089 119
poverty line64. One could leave it at that by pointing out the poverty alleviation benefits of DRES and proceed with the assumption that these are sufficient grounds to justify their promo-tion. In which case, the most practical way would be to compute willingness to pay from the current expenditure on kerosene (or candles or dry cell batteries). Although the data on this is not clear, this could be rectified by a more in-depth follow-up study. However, the present analysis shows that such an approach would overlook the potentially negative impact of small-scale DRES65 on the economic status of the poor in the form of debt burdens and, often, high recurring system maintenance costs. The net benefits of DRES (poverty alleviation benefits minus poverty reduction disbenefits) could prove negative in a number of instances, which is obviously unacceptable. The better option to deal with the issue is to focus on capacity to pay so that larger size systems can be made more affordable to the poor without causing them undue financial distress and, at the same time, promote income-generating activi-ties through sufficient electricity supply to drive productive appliances.
6.8.2 Impacts of proposed MMS mechanisms on the poor
The poor’s willingness to pay per kWh would vary according to the intensity of poverty. For the bottom poor, this would be very low. For those who are not the bottom poor, positive willing-ness to pay is conceivable but it might not be sufficient to meet the full cost of a system and so, it will fall below the market price per kWh. The purpose of assessing the willingness to pay is to determine how much subsidy the poor would need to cover the initial investment and if they need further assistance to keep the systems in good repair to derive the maximum possible elec-tricity from it. As stated in Chapter 5 of the report, households in China normally pay 40-50 percent of the in-vestment costs for mini-hydro and another 5 percent of the investment costs towards mainte-nance. However, this applies to the rural population at large. The willingness to pay of the vil-lages investigated during the study will be lower than these figures, the estimate in Section 5 being three-fifths of the average, that is, 24-30 percent of the investment costs and 3 percent of the investment costs towards maintenance. From the viewpoint of enhancing access of electricity to the poor, the above figures indicate that a capital cost of subsidy of 70-76 percent will be required. This may come from the government in whole or part in the form of outright grants and/or through loans (especially micro loans). An MMS subsidy could, then, cover the investment subsidy deficit (if any) and servic-ing/maintenance costs to ensure system performance and quantity of electricity produced. The verification cost estimates in Chapter 4 indicate that the best options for mini-hydro are an up-front subsidy for the purpose or a servicing contract with AMB. Of the two options, the AMB servicing contract arrangement is preferable. This is because the poor not only lack financial resources, but they also do not have the necessary technical know-how beyond what is needed for the most basic servicing tasks. An upfront subsidy might relieve their financial burden but it might not guarantee that the systems will be maintained in good condition and keep generating the maximum possible electricity. On the other hand, the AMB servicing contract option would bring much-needed technical personnel into the picture. This has a greater chance of generating additional kWh, which are needed for poverty reduction im-pacts.
64
This refers to lack of clear linkages between DRES - relative to their current capacity and utilization factor - and
income-generating activities. However, it should be noted that even if future DRES overcome these constraints, poverty reduction might not take place to a significant extent if higher quantities of electricity are not accompanied by other complementary development inputs.
65 Notionally, options below 1 kW capacity that are capable of meeting only basic household and community needs.

120 ECN-C--03-089
It is worth noting that the future market for DRES in China can be divided into two segments: one for new systems supplied to populations currently without access and another for popula-tions with access but with poorly performing systems. The analyses in Chapters 4 and 5 relate mainly to new systems. However, from the perspective of the poor, who have already made sub-stantial investments but are unable to realize their full value due to low capacity utilization prompted by inadequate servicing, a subsidy (MMS or otherwise) could be considered for exist-ing systems also. This is a desirable priority in the context of poverty reduction in China. Looking at only the market potential for new systems as estimated in earlier parts of the report, the vast majority of those served by these systems will be the poor. Therefore, the major benefi-ciaries of MMS will also be the poor. Combining the data in Table 5.8 (green certificate supply cost for mini-hydro) and Table 6.10 (per capita income of farmers in Western Provinces), an es-timate of the impact of MMS on enhancing access to the poor is given in Table 6.15. As noted in Chapter 5, some 60 percent of the poor (with per capital income above RMB 500 per capita but below RMB 1,000 per capita) will be able to pay for mini-hydro systems at a price of RMB 0.65/kWh to RMB 0.80/kWh. The remaining 40 percent (bottom poor with per capita in-comes below RMB 500) will be able to pay between RMB 0.30-0.50/kWh. The estimated cov-erage of the poor and bottom poor in Table 6.15 uses a cut-off point of RMB 0.60 between the two. Table 6.15 Impact of different multipliers on the poor’s access to electricity through mini-hydro
in China and Sichuan
China (All Western Provinces) Sichuan Income
level per
capita
Poor
Households
covered
Multiplier [%] of potential
market
(727,000 units)
[MW] [GWh] Poor
households
covered
Multiplier [%] of potential
market
(230,000 units)
[MW] [GWh]
1 0 0 0 1 0 0 0
136,676 2.6 4 34.2 32.3 43,240 2.6 4 10.8 10.2
820,056 6.4 24 205.0 193.5 259,440 6.4 24 64.9 61.2
956,732 8.2 28 239.2 220.3 302,680 8.2 28 75.7 69.7
1,366,760 10.2 40 341.7 317.1 432,400 10.2 40 108.1 100.3
2,050,140 11.5 60 512.5 451.0 648,600 11.5 60 162.2 142.7
>RMB 500
to
<RMB 1,000
2,665,182 15.4 78 666.3 571.6 843,180 15.4 78 210.8 180.8
3,006,872 19.2 88 751.7 624.9 951,280 19.2 88 237.8 197.7
3,143,548 20.5 92 785.9 651.7 994,520 20.5 92 248.6 206.2 <RMB 500
3,348,562 23.1 98 837.1 683.7 1.059,380 23.1 98 264.8 216.3
Mini-hydro 28.2 100 854.2 694.3 28.2 100 270.3 219.7
Wind 207.6 100 161.4 95.9 207.6
Solar PV 287.2 100 42.6 32.0 287.2 100 2.4 1.7
Not all the total unelectrified households of 5.75 million in China can be served by mini-hydro systems, but in theory some 60% can if a multiplier is applied of 28.2.66 As shown in the last three (shaded) rows of Table 6.15, in terms of total capacity installed, Sichuan, 99 percent of the new capacity will be in the form of mini-hydro, while across China new mini-hydro capacity will amount to 81 percent of all DRES capacity.
66
As explained in Chapter 5, multiplier values greater than 10 would jeopardise the environmental objectives of the
MMS and thus are not recommended

ECN-C--03-089 121
6.9 Alternative DRES Promoting Policies and Complementary Measures
6.9.1 Policy support
The promotion of DRES in China is integral to its overall policies for poverty reduction. This is evident by the fact that rural energy development features in China’s Overall Plan for Western Region Development under the Tenth Five-Year Plan as a part of poverty reduction strategies, which specifically seek to increase the incomes of farmers (NDRC, 2002). It is also consistent with the recommendations of the World Bank (2001): “…macroeconomic policies that promote growth, especially those that promote efficient agricultural growth and that target regions with high concentrations of poor such as the recent infrastructure investment program, should be seen as highly complementary to microeconomic poverty interventions.” The major policies for poverty reduction in China at present are the following67:
Subsidized loans for poverty reduction The subsidized loan programme is the largest of the poverty programmes and is considered the flagship of the Government’s poverty alleviation/reduction efforts with investment in it since inception totalling RMB 68 billion as of 1998. The current emphasis of the programme is on providing 70 percent of the investment funds to poor households for agriculture. Implementa-tion of the programme has encountered difficulties and these targets are yet to be reached. As of 1998, the proportion of loans reaching poor households was less than 30 percent. The reasons for this include complex lending procedures that discourage poor applicants, requirements of collateral and security, low and negative interest rates acting as disincentives to repayment, and low repayment rates.
Micro-credit programmes Micro-credit programmes initiated in response to the problems faced by the subsidized poverty loan programme covered 200 counties and represented a total investment of RMB 800 million in 1998. Most are variations of the Grameen Bank model in Bangladesh, which stresses social collateral and community participation. However, implementation of the programmes by the Agricultural Bank of China has been constrained by the lack of institutional capacity and grass-roots outreach to poor households. Shifting a part of the responsibility to grassroots organiza-tions, developing savings services for the farmers and reforming financial institutions in poor areas are among the measures recommended to improve the situation.
Food for work programme Initiated in the early 1990s, the programme offers food commodities in exchange for local la-bour, with funding directed at the improvement of rural roads, electrification, water, land, com-merce, education and health. Although the programme has made headway in many areas, its impact on the poorest villages remains to be assessed.
Ministry of Finance grants The main component of these grants are the Poor Area Development Funds, which totalled over RMB 3 billion in 1998. The State Council’s Leading Group Office for Poverty Reduction co-ordinates these funds whose administration has encountered difficulties of raising counterpart funds from the provinces, diversion of funds to meet administrative costs, poor matching of fund delivery to project schedules and so on.
Rural relief programmes These are implemented by the Ministry of Civil Affairs and provincial and county Civil Affairs Bureaus independent from the Government’s poverty relief programme. The programmes target
67
Abbreviated from World Bank, 2001.

122 ECN-C--03-089
those affected by natural disasters but also ensure those considered destitute guaranteed food, clothing, housing, medical care and education. Future DRES promotion targeted at the poor needs to be synchronized with the subsidized loan programme, micro-credit programmes and the LGPR-administered Poor Area Development Funds. Although China’s experience with micro-credit is still at a nascent stage, both in terms of funding volume and implementation strategy, it seems an ideal vehicle for DRES loans for the poor. Consistent with the suggested strategy for future DRES promotions, such micro-loans should be combined with an income-generating or productive use component, which would ad-dress both poverty reduction and the financial sustainability of DRES. However, as noted by the World Bank study (op. cit.), “…micro-credit on its own is unlikely to meet the needs of the absolute poor, and should be combined with other types of interventions in the poorest area…one of the most effective means of assisting the absolute poor is through an integrated set of interventions in the form of a multiyear project.” The study identifies a mul-tisectoral project model that includes (a) upland agricultural development encompassing filed and tree crop and livestock activities to raise agricultural productivity; (b) labour-intensive con-struction or rural roads, drinking water systems, small-scale irrigation and other rural infrastruc-ture (which could include DRES-based modern energy services; (c) provision of off-farm em-ployment opportunities; (d) rural enterprise development; (e) education and health; and (f) mi-cro-credit. Such a model need not be restricted to the absolute poor but could also be applied to others who are considered poor and currently without access to, or insufficient supply of, mod-ern energy services. Combining an MMS element into the above model is feasible in theory but there are potential difficulties as well. The most critical of these is the problem of meeting MMS quotas for DRES in conjunction with progress to be made by several other agencies responsible for various other inputs in an integrated project. The entity upon whom the MMS obligation is eventually placed will not have the freedom to seek its quota on its own but will be dependent on other agencies whose priorities and time-frames would likely prove complex to pull together. Nonetheless, as stated at the output, this assessment has placed primacy on poverty reduction and problems of this nature have to be faced and overcome with time and experience gained. An independent pursuit of DRES so far has not led to distinct impacts on poverty reduction in China. Persisting with the same strategy under an MMS umbrella is likely to meet the same results.
6.9.2 Ways to enhance stakeholder participation
Stakeholder participation in poverty alleviation/reduction efforts in general and in the energy dimension of these has assumed prominence in recent years. There are good reasons for it in the energy context. Traditional approaches to energy, DRES in particular, have been fixated with the merits of individual technologies. In the post-oil crisis decade of the 1980s, DRES were ad-vocated to increase energy self-reliance. In the post-Brundltand Commission decade of the 1990s, they have ridden on environmental concerns. Neither of these phases had a poverty fo-cus. If anything, initial experiments with DRES and the subsequent drive towards their com-mercialisation pretty much emulated the classical top-down market penetration approach where new products gravitate to purchasing power. Expectations that such an approach would bring down technology costs with economies of scale brought about by market size expansion, as it occurred with information technology, have so far failed to materialize. It is unlikely they will do so, for the simple reason that access to a certain amount of modern energy is a basic need; access to the Internet is not. Under the circumstances, a parallel bottom-approach to DRES promotion, one that is aimed at market creation rather than market penetration at the level of the poor, is imminent. Since this will invariably require a deeper understanding of the poor’s needs, capacities and expectations, their participation in decision processes concerning the acquisition and use of DRES is essential.

ECN-C--03-089 123
There are numerous ways to enhance stakeholder participation in this context and they are not confined to energy alone. Participatory approaches for the kind of integrated model suggested would require the involvement of the poor at the stages of project design, implementation and feedback. Under the World Bank’s energy, poverty and gender project, a detailed methodology and accompanying tools have been developed for needs/benefits assessment surveys and moni-toring mechanisms (World Bank et al, 2002). These tools are best circumscribed by the ap-proaches guiding the Bank’s Poverty Reduction Strategy Papers and the Sustainable Liveli-hoods concept developed by DFID. The latter is especially suited to the integrated project model suggested here as it assigns overarching importance to poverty reduction through increased live-lihood opportunities and it recognizes the role of energy in this. Implementation of these approaches and the employment of associated methodological tools in China is best managed by agencies that currently lead efforts to reduce poverty and to promote rural energy services. They would consist of the Leading Group Office for Poverty Reduction, the Poverty Offices at decentralized levels and the Agricultural Machinery Bureau. In addition to these, it would be necessary to involve the Agricultural Bank of China, currently the leading financing source for poverty loans. The role of the bank could be complemented or directly fa-cilitated by the All-China Women’s Federation, which is the only organisation in the country with a grassroots outreach down to the village levels. The Federation is already engaged in mi-cro-credit in the areas of animal husbandry, food processing, handicrafts and other micro-enterprises for the poor. It organizes women and villagers into groups, provides skills-oriented training and performs loan recovery operations with a record of 95-99 percent loan recovery.
6.9.3 Complementary measures
This Section has outlined the benefits and shortcoming of DRES in China and called for a new promotional strategy focusing on poverty reduction impacts. However, it is important to note that rural underdevelopment, by definition, means a pervasive lack of many infrastructure facili-ties, of which energy (including electricity) is just one. Since distance is a critical factor in the development of these facilities, the remote mountainous rural communities are the affected by the lack of accompanying infrastructure that could take advantage of modern energy/electricity services once they are made available. Hence, even if a new DRES strategy is successfully im-plemented, unless it is accompanied by these other inputs, poverty may remain unabated. A case in point is that of Sichuan itself where, as noted in the preceding parts, the electrification rate exceeds 97 percent, with many with access to electricity having been connected as far back as ten years ago. Yet, there are still over 10 million poor in the province today, some 3.4 million of them considered the bottom poor. This prompts the question: what difference did electricity make then to poverty reduction? Since the majority of the remaining poor in the province is, in fact, connected to the grid, supply constraints cannot be the reason. It is more likely that the provision of electricity was not preceded, accompanied or followed by several other develop-mental inputs. As a result, conditions of poverty persist although, because of electricity, those conditions could be less harsh than they were earlier. The need for complementary infrastructure, such as roads, communication facilities, markets, buildings, equipment and skilled personnel - often not provided in tandem with modern energy services - in order to achieve economic benefits from electrification or modern fuel supplies cannot be overemphasized. Their absence, or their lack of co-ordinated development, is why the impacts of modern energy in general and DRES in particular are so variable and why, when it comes to the poor, the impacts of energy services are so frequently disappointing. For instance, soil conditions and climate limit the possibilities for increased agricultural productivity or diver-sification of outputs. The distance from markets and employment opportunities, and the absence of roads and poor transportation, inhibit the growth of alternative income-generating activities. Limited water and fuel wood resources impose demands on domestic labour time that reduce the time available for productive activities. The lack of adequate water supply due to the remoteness

124 ECN-C--03-089
of water sources mean that women have to carry drinking water, an occupation that consumes several hours of each day. The findings of the World Bank’s EnPoGen (Energy, Poverty and Gender) project68 suggest that the impact of poverty-reducing energy interventions will be a function of existing69 complemen-tary inputs - production equipment or other livelihood assets - and that, if these inputs are not in place, then the impact will not be achieved unless additional investments in those inputs are made. They also suggest that, as no human activity is possible without the use of energy, all studies that purport to show an impact on poverty from one or more inputs (such as, land re-form, irrigation, micro credit, women’s education, agricultural improvement) are necessarily also affected by the use of energy (and probably many other inputs). Therefore, a prima facie case can be made that these interventions owe at least a part of their success to the presence of these energy services, or that they would have had a greater impact had they been associated with greater access to effective energy services. This, in turn, means that there will be poverty benefits from considering how, and at what addi-tional cost, improved access to energy services might ‘add value’ in terms of poverty impact to other mainstream poverty reduction interventions. Or, to put it another way, the key ‘energy is-sues’ relating to the development of any poverty reduction strategy are whether that strategy would be improved or worsened by adding an ‘energy perspective’ to the diagnosis of the prob-lem and whether the effectiveness of specific interventions would be enhanced significantly if they had access to improved energy services. It is clear from the EnPoGen studies and evidence elsewhere that the potential of modern energy services to release people from poverty can be fully tapped only when several complementary inputs precede or accompany them. It is difficult to set universal priorities among these inputs as they differ from one location to another, depending on the overall development status of a coun-try, its geophysical characteristics and the prevailing socio-economic conditions of its popula-tion. One could name any number of complementary inputs, such as roads or water supply or communication or market access as the more important. These are subjective and location-specific priorities, which cannot be generalized. One could, in fact, look at the issue of urban poverty where many such complementary inputs exist and yet the people remain poor due to other factors. What might be useful here though is to distinguish between ‘infrastructure’ and ‘non-infrastructure’ inputs that need to accompany energy services to make an impact on poverty. In-frastructure consists of facilities that usually fall within the domain of public benefits, the provi-sion of which is primarily a responsibility of the government. Non-infrastructure inputs com-prise products and services that are available in the market and can be acquired subject to eco-nomic capacity and know-how. Access to the latter is most often conditional upon the availabil-ity of the former, but the difference between the two in terms of investment responsibility can be important. The development of rural infrastructure facilities that are public investment responsibilities de-pends on governmental resources, policy objectives and budgetary allocations. It is here that the rationale for extending these facilities to one or the other of rural communities often gets caught in conflicting priorities. For instance, a government focusing strongly on poverty reduction might assign a high priority to the development of infrastructure facilities for populations that are the poorest. However, if these populations also happen to be located in remote areas, as is the reality in China, the cost of investment could lie beyond the capacity of the government in the short-term, requiring a selective and drawn-out process of budgetary allocations. In a typical
68 Under this, the Bank commissioned in-depth studies of the poverty and gender impacts of energy with particular
reference to electricity in China, Indonesia and Sri Lanka. 69 Or accompanying, or immediately succeeding.

ECN-C--03-089 125
situation, some communities might be provided with fertilizers and irrigation facilities, but not roads or communication. Others might get access to roads and water supply, but perhaps lack schools or health clinics. Indeed, the development of rural infrastructure is seldom smooth and the simultaneous coincidence of various elements of it rarely achieved. The more these elements are staggered across space and time, the lesser the chances of energy services having the desired impact on the people. Infrastructural inputs do not only consist of physical structures and buildings, but they also in-clude intangible services that are again made possible as a consequence of public policy and in-vestment. Notable among the latter are markets, financing and credit mechanisms, training and skills development institutions, and qualified personnel, such as doctors, teachers and techni-cians. Ensuring these resources to rural communities often marks the difference between whether or not they are able to take advantage of the physical facilities provided to them. For instance, the provision of electricity without the knowledge or skills to make use of it in produc-tive enterprises can confine electricity usage largely to household applications. Non-infrastructure inputs are generally in the private domain and, therefore, closely related to the capacity and capability of the poor. Again, a listing of these inputs or assigning priorities among them is difficult. In general though, if one accepts the fact that the lack of financial re-sources lies at the heart of poverty, then obviously acquiring those resources would seem central to the issue. Without financial resources, none of the other inputs necessary to mitigate or elimi-nate poverty is possible. These inputs will include education, technical knowledge, entrepreneu-rial skills, productive equipment, capacity for innovation and, above all, the ability to combine human capital with financial capital according to create or grasp opportunities for lifestyle and livelihood improvement. Access to these non-infrastructure inputs is a function of public infrastructure, but their effective use is a matter of choice and acumen of the people themselves. Where these exist, the availabil-ity of modern energy services could enhance the poor’s prospects significantly.

126 ECN-C--03-089
7. RECOMMENDATIONS
7.1 Evaluation criteria
In the previous Chapters the feasibility of including DRE systems into the MMS have been ana-lysed and evaluated based on the following set of criteria: 1. Transaction costs: if the transaction costs for monitoring and verification procedures for
DRE systems are more than 10% of the expected MMS revenues, costs are considered too high (too much money is spent on procedures) and a more direct way of promoting DRE systems is recommended.
2. Robustness of the monitoring and verification procedures. 3. Applicability of the monitoring and verification procedures in China. 4. Impact of inclusion of DRES into the MMS on the additional number of DRE systems sold. 5. Impact of inclusion of DRES on poverty reduction and poverty alleviation Before a nation-wide MMS scheme will be introduced in China, the proposed MMS will first be tested in a pilot phase at provincial level. Recommendations regarding the inclusion of mini-hydro, PV household applications, PV village power and stand-alone wind turbines into the MMS pilot are presented below.
7.1.1 Mini-hydro
The recommended verification procedure for mini-hydro is the household survey approach both for sales verification as well as for verification of system performance. This verification proce-dure can be combined with the Agricultural Machinery Bureau service contract model. The sali-ent points of the recommended verification procedure for mini-hydro are as follows:
• The total transaction costs of the recommended verification procedure are less than the 10% threshold of total expected MMS revenues at relatively low multiplier values of 7 or higher.
• The robustness of the recommended survey approach for monitoring and verification of the systems is high if standard statistical requirements are applied.
• The applicability of the survey approach for mini-hydro systems combined with the mainte-nance service contract is very good. The Agricultural Machinery Bureau is deemed to play an essential role in the implementation of this option. The Bureau is well established, is al-ready involved in the development of mini-hydro systems and has expressed its willingness to conduct maintenance activities in the framework of the MMS. This makes this option very attractive from a practical point of view.
• There is a large potential market for new mini-hydro installations in China (estimated poten-tial is approximately 727,000 systems) in general and in Sichuan in particular (estimated po-tential is approximately 234,000 systems). At a multiplier value of 10, 40% of the total mini-hydro potential will be developed in China as a result of inclusion into the MMS. This cor-responds to some 290,800 new systems in China with an estimated total annual electricity production of 317.1 GWh (nearly 0.4 % of the MMS target of 79,476 GWh presented by Meier).

ECN-C--03-089 127
• As indicated above, at a multiplier value of 10 the access of the poor to mini-hydro systems will increase by some 290,800 systems. On average each system connects 4.7 households, which means that some 1.37 million households will gain access to electricity if mini-hydro is brought under the MMS. This is approximately 24% of the total number of households currently without electricity. The poverty analysis revealed that mini-hydro in most cases positively impact on poverty alleviation, although historically the impact has been nega-tively affected by low quality equipment, resulting in higher repair and maintenance costs and a higher percentage of non-performing systems. If mini-hydro is included into the MMS, there would be an incentive for better system design and better maintenance. Mini-hydro can also contribute to the creation of new economic activities although the evidence found during the village visits did not show any cash savings arising from these economic activities. This means that mini-hydro does not yet strongly contribute to poverty reduction in the sense of asset and income creation, probably because the system sizes are often too small for these applications.
Based on the above considerations it is recommended to include mini-hydro in the pilot phase of
the proposed MMS for China because the evaluation results are positive for all identified crite-
ria. It is further recommended to provide differentiated support for mini-hydro and grid con-
nected RE technologies and to apply a multiplier for mini-hydro in the range of 7-10. Higher
multiplier values would jeopardise the environmental objectives of the MMS.
7.1.2 Photovoltaic household applications
The recommended verification procedure for PV household applications is the verification of financial administration of solar companies because the other identified verification options are too expensive and do not meet the 10% threshold criterion. The salient points of the recom-mended verification procedure are as follows:
• A multiplier value of 4 would be sufficient to meet the 10% threshold for the transaction costs of the recommended verification procedure.
• The robustness of the recommended verification procedure is reasonable and is similar to the robustness of the existing tax audit system. Options are available to improve the robust-ness of the procedure.
• Applicability of the recommended verification procedure is questionable. Although linking the verification of sales registration with the tax system is a very innovative and at first glance an attractive option, it is questionable whether the current tax system in China is suf-ficiently well established and reliable enough to be used for verifying system sales. The fact that presently a large percentage of the smaller companies pay a fixed amount of tax ( inde-pendent of sales turn over) makes this option also less attractive to apply within the pilot phase of the MMS. More research is also needed to assess the willingness of the tax authori-ties to co-operate with the MMS authority in order to avoid problems relating to fraud and double counting of certificates before this verification option can be implemented.
• To achieve a significant uptake of photovoltaic systems under the MMS, a multiplier value of about 77 is needed. Such a high multiplier value would seriously affect the price of the green certificate and thus jeopardise the environmental objectives of the MMS. A multiplier value of 10 would result in some 30,000 additional PV systems for China which is only 1.4 % above the base case.
• PV concerns mainly the improvement of the living conditions of the poor and to a much lesser extent PV creates direct income generating activities. However, PV systems could have a indirect impact on income generation by allowing more study in the evening.
Based on the above evaluation it is recommended not to include PV for household applications
into the MMS pilot because the applicability of the recommended verification procedure in
China is questionable and because the impact on the uptake of PV is very limited. The funds
available for the promotion of photovoltaic systems can better be used in a more direct way.

128 ECN-C--03-089
7.1.3 PV village power
At present, some 50 villages in Sichuan and some 1,000 villages in China receive electricity from a mini grid powered by photovoltaic installations. These are isolated systems but are me-tered and therefore do not need separate verification procedures and thus can be incorporated into the MMS pilot with relatively low transaction costs. Based on an identified potential of 20,000 villages that could be supplied through these systems and an average production of 4,080 kWh per system, the maximum achievable production amounts to 81.6 GWh (0.1% of the MMS target). Because the electricity produced by PV mini grids is also for productive use, the poverty impact is positive both in terms of improving the living conditions of the poor as well as in the creation of new economic activities which could lead to broader sustainable local development. Based on the above considerations it is recommended to include PV village power mini grid
systems into the MMS. It is further recommended to provide differentiated support for PV vil-
lage power and grid connected RE technology and to apply the same multiplier value as for
mini- hydro.
7.1.4 Stand alone wind turbines
The recommended verification procedures are the financial administration of wind turbine manufacturers for monitoring the number of systems sold and the battery certification approach for motoring the system performance. The evaluation results based on the set of criteria pre-sented above are as follows:
• The proposed M&V procedure meets the 10% threshold if a multiplier value of 5 would be acceptable.
• The robustness/applicability of the battery certification procedure for monitoring system performance is unclear. This proposed procedure is new and has not been applied in China or in any other country. The procedure, therefore, needs to be tested first.
• The potential market for new systems is confined to a limited number of provinces with enough wind resources availability. The quantitative analysis shows that although there is a large potential market for small wind systems, this market can only be tapped at very high values of the multiplier. For example, a market penetration of 30 % can be reached only at a multiplier value of 123 which is unrealistically high.
• The poverty impacts of small wind systems are comparable to PV household applications. The impact on poverty is mainly related to lighting and communication.
Based on the above considerations it is recommended not to include stand alone wind systems
because the robustness and applicability in China of the proposed verification procedures is
questionable and because the impact on the uptake of small wind systems is substantial only at
very (unrealistically) high values of the multiplier. The MMS therefore is not a suitable mecha-
nism to promote small-scale wind systems.
7.2 Alternative mechanism for promoting PV household applications and
stand alone wind turbines
In the previous section it was argued that inclusion of PV household applications and stand-alone wind systems into the proposed MMS pilot is not feasible. This section presents alterna-tive mechanisms for promoting these technologies.

ECN-C--03-089 129
Based on the discussions held in China with representatives of the renewable energy industry, NGOs and local and national government the recommended mechanisms for promoting PV household applications and stand alone wind in China are capital cost subsidies and micro loans. The extent of capital cost subsidies will depend on the income levels of the people. However, for the bottom poor (with per capita income < RMB 500/yr.) the subsidy ceiling may be 50 per-cent, declining progressively for higher income levels subject to a minimum of 25 percent.70 In reality, given the absolute lack of cash among the bottom poor, 100 percent capital cost sub-sidy is conceivable. However, this is not recommended, as it would not promote a sense of ownership, which is essential to ensure basic operation and maintenance. Instead, the remaining capital cost could be provided in the form of repayable micro loans. Again, higher loan volumes would apply to the bottom poor. In all cases, therefore, a minimum of 10 percent equity contri-bution is required, even from the bottom poor, to ensure ownership stakes. The operational details of the micro loan component would have to be elaborated by the con-cerned micro-financing institutions. However, it would help if certain income-generating activi-ties are also covered in such micro loans so that people can acquire also productive equipment for the purpose in conjunction with PV or wind systems. A number of simple activities that do not even need any major productive equipment are possible for PV, such as solar lanterns that can help illuminate village shops and enterprises, which allow people to do home-based com-mercial activities like vegetable and fruit processing. One could think of similar, possibly more equipment-intensive activities for wind like grain grinding. Though in China micro financing is still evolving the all China Women’s Federation, which has an outreach to most villages, is the most promising for rural energy. The federation has already a micro-loan programme for income-generating activities, which could be readily combined with loans for stand-alone PV and wind technologies. A key question is on funding: where would the government get the funds to support upfront subsidies or micro-loans? One possibility is that a portion of the revenues generated by the MMS could be routed to support subsidies or a micro loan fund for rural energy. This would mean that the MMS would support the development of decentralised renewable electricity sys-tems directly (mini-hydro) and indirectly (PV and wind). The above recommended polices for promoting PV and wind are not new. In fact, these policies are already being implemented in China under the REDP and NDCR programmes and have re-sulted in the establishment of a highly developed market infrastructure via which stand alone PV and wind technologies are disseminated to households (very unlike the case of mini-hydro where market players are not active in dissemination and where one can see a clear role for an organisation such as the Agricultural Machinery Bureau). Such a market infrastructure is very difficult to build, and once established is a very valuable asset for a government as part of its rural electrification policy. Therefore, any DRES support policy should be aimed at enforcing such a market infrastructure and should leave the dissemination of the DRE systems to the play-ers in the private industry.
70 It is theoretically possible to determine different subsidy rates by county income level but this can be open to
abuse by people getting higher subsidies at certain counties and passing them on to other counties where lower subsidies would apply. It would be better to differentiate by villages without pre-determining the rate of subsidy. For example, the county office could be given the discretion to provide subsidies ranging from 10% to 50% depending on their assessment of village incomes. For planning/budgeting purpose, they would need to determine how many villages fall under which income bracket and make the necessary provision. This is administratively more intricate, but one should safeguard against subsidy abuse.

130 ECN-C--03-089
8. OUTLINE FOR THE DESIGN OF A MINI-HYDRO MMS PILOT
PHASE IN SICHUAN PROVINCE
8.1 Introduction
In this Chapter the mini-hydro option, the recommended option for inclusion into the pilot phase of the MMS, will be further elaborated. A more detailed description of the specific modalities of this option and a tentative estimation of the costs related to the implementation of this option in the province of Sichuan are presented. Although a detailed investigation of suitable provinces for inclusion into the MMS pilot was be-yond the scope of this study, Sichuan certainly qualifies as a candidate province because a num-ber of conditions required for a successful implementation of the MMS seem to be fulfilled in Sichuan, namely:
• A number of capacity building activities related to the introduction of an MMS have already been implemented in Sichuan; most representatives from the Sichuan government are famil-iar with the basic principles of the MMS mechanism.
• The provincial government seems to have a positive attitude towards MMS; and
• There is a large potential of hydro (both grid connected and off grid) that can be brought un-der the MMS
As explained in Section 4.3, if mini-hydro is brought under the MMS an essential role is envis-aged for the Agricultural Machinery Bureau with regard to the implementation of this option. The main responsibility of the AMB is to manage the agricultural machinery sector. This in-volves policy formulation and implementation, formulation of technical standards, quality con-trol and technical research management in the agricultural sector. The AMB is part of the government at national, provincial and county level. In the province of Sichuan the AMB in an independent department but in some other provinces the AMB falls un-der the Ministry of Agriculture. The AMB in Sichuan employs some 50 professional staff and is in charge of the management of mini-hydro (under 10 kW). The Sichuan government has allocated RMB 220 million in the 10th five-year plan to support the poor people in getting access to electricity by installing and maintaining mini-hydro installa-tions. This is achieved by preparing an annual plan and by quality control of mini-hydro equip-ment and projects. The average capacity of the installed mini-hydro is 1 kW. The size of the new systems installed in Sichuan tends to be relatively big. Most systems are in the range of 3-5 kW and each system supplies electricity to some 10 households. Although the mini-hydro programme developed by the Sichuan government is very ambiguous, it will not be able to provide electricity to more than 10% of the estimated 1.1 million house-holds in Sichuan who are currently without electricity. Additional funding from the MMS there-fore could further expand this programme.
8.2 Main features of a mini-hydro MMS pilot in Sichuan Province
A mini-hydro MMS pilot in Sichuan comprises the following main features:
Multiplier value A multiplier value in the range of 7-10 is proposed. A multiplier value of 10 corresponds to MMS revenue of RMB 0.4 per kWh and will result in realising some 40 % of the estimated po-
ECN-C--03-089 131
tential mini-hydro market in Sichuan. This would mean that, compared to the situation without an MMS, some 93,600 mini-hydro systems could be sold additionally in the period up to 2010. Assuming that on average each system supplies 4.7 households, some 439,920 households will be supplied with electricity (37.2 % of households in Sichuan currently without electricity) In total, these systems will generate some 100 GWh annually.
MMS revenues If it is assumed that a certificate represents 1,000 kWh, some 100, 000 certificates will be issued every year. Assuming a certificate price of RMB 400 this means that inclusion into the MMS would generate RMB 40 million each year. If it is assumed that the Chinese Government will cover the costs of verification activities, the MMS revenues can be used for the AMB mainte-nance contract (RMB 4 million) and for a price reduction on the system (RMB 36 million).71
Ownership of the green certificates In principal, the owner of the mini-hydro system receives the certificates but the owner can, on a voluntary basis, assign the right to claim credits to the AMB (who can act as an registered agent) in order to avoid the administration costs of registration and creating and selling the cer-tificates. In that case the owner needs to sign a written approval and in return the owner receives free maintenance from the AMB and, depending on the value of the green certificates, a price reduction on the system. Based on a multiplier value of 10, the MMS revenues could result in a price reduction of the system of some 30%. It is proposed to monitor the systems every year in accordance with the proposed monitoring option HS1 presented in Section 4.3.2. Issuing of certificates can be done once every five years to reduce the transaction costs. This frequency is used in the Australian system and seems to work well. The risk of non-performance could be addressed by creating a guarantee facility. A portion of the green certificate price could go to this facility from which the MMS administrator could draw in case of technology non-performance.
Verification procedures As explained in detail in Section 4.1.2 the verification cycle of non metered mini grid systems consists of: 1) standardisation of kWh production; 2) verification of mini-hydro system sales registration; and 3) verification of the performance of the mini-hydro systems. The proposed procedures for the MMS pilot are: 1. Estimation of kWh production per system: the amount of kWh generated by a mini-hydro
system is based on the size of the system and the number of hours each year of water avail-ability. A Table containing standardised kWh production based on the size of the system and the water availability will be developed for Sichuan province.
2. Verification of sales registration: survey of systems registered in the AMB database. An in-dependent verification team will verify the systems that are included in the AMB database through a survey as described in option HS1, Section 4.3.2.
3. Verification of system performance: an independent verification team will check the opera-tional status of the mini-hydro systems included in the AMB data base by means of a sur-vey. Option HP1 Section 4.3.3.
71 This support can be motivated by the fact that the Government wants to promote DRE-systems anyhow.
Consequently, the verification costs, or at least a substantial part of it, will not weigh on the users of the green certificate system.

132 ECN-C--03-089
8.3 Indicative Costs for establishing a mini-hydro MMS pilot in Sichuan
The costs related to the inclusion of mini-hydro into the pilot phase of the MMS comprise three main components: 1. Costs related to developing of capacity in the AMB. 2. Costs related to the development of MMS institutions. 3. Costs related to the development of awareness campaign. The costs related to the development of capacity in the AMB involve the following items: 1. Development of a GC administration system for the AMB: the current administration system
of the AMB needs to be assessed on its suitability to register mini-hydro sales and their per-formance. Necessary adjustments need to be identified and internal MMS management sys-tem needs to be developed. This development should occur interactively with the relevant stakeholders (end-users and mini-hydro suppliers) and be co-ordinated with the MMS mini-hydro body.
2. Technical assistance to AMB staff: once all systems and procedures are in place, AMB staff and other key drivers in the process (mini-hydro sales outlets, verifiers) need to be trained to ensure successful implementation of the mini-hydro service organisation.
The costs related to the design of the MMS institutions include: 1. Setting up of a mini-hydro MMS body: this body needs to function under the central stan-
dard setting body for MMS in China. Until this is in place, the body can be supervised by the PMO of the CRESP programme at NDRC. The MMS body will be responsible for de-veloping standards and procedures for the accreditation of verifiers and for appointing the accreditation body.
2. Given the new and challenging task of the MMS body, it is advised to develop a team of Chinese and international experts who will provide technical assistance to the Mini-hydro MMS body during the first years of its operation.
3. Development of Standards and procedures: Section 4 describes 3 verification procedures for mini-hydro. The household survey approach is the recommended verification procedure for mini-hydro combined with the AMB model. If an agreement can be reached with AMB that they will be the implementing body for the MMS mini-hydro scheme, detailed verification procedures, guidelines and instruction manuals need to be developed.
4. Development of a registry: the registry is the record of ownership of the green certificates and will record the issuance, transfer, retirement and cancellation of all green certificates. Development of a registry for a full MMS can be quite complex and is likely to involve a considerable budget. The registry development costs (hardware and software) used for the United Kingdom Emission Trading Scheme involved over Euro 1 million (Hession and De-vine, 2003). Nevertheless, for the pilot phase the requirements for a green certificate registry will be far less demanding. Hence, it is advised to use a simple database design for the regis-tration and tracing of green certificates. The development of the registry is linked to the de-velopment of the trading framework
The provincial wide public awareness campaign aims to inform potential users of mini-hydro systems about the MMS and the potential revenues MMS could generate for mini-hydro system owners. The costs of setting up and implementing an awareness campaign include:
• advertising campaign
• brochure
• hotline telephone service
• website campaign.
Indicative costs for mini-hydro pilot phase In Table 8.1 an overview of the estimated costs is presented for the various cost components de-scribed in the previous section. It must be emphasised that these estimates are only rough indi-cations of the various cost items based on the experience gained in Europe with establishing

ECN-C--03-089 133
MMS institutions. The purpose of the overview is to provide a first indication of the order of magnitude of the costs of setting up a mini-hydro MMS pilot in Sichuan. A more detailed esti-mation that also takes into account the specific circumstances in China can only be made after the decision on the MMS pilot has been taken and the specific modalities of the MMS have been defined. A second point that needs to be stressed concerns the fact that the costs are related to the inclusion of mini-hydro and not the establishment of the MMS itself. Table 8.1 Indicative costs for mini-hydro MMS pilot in Sichuan
Costs [×1,000 RMB]
Initial establishment of the mini-hydro MMS body -Drawing up of the statutes for the mini-hydro body 50 -Development of standards and procedures 100 -Development of registry 600 -General costs for the establishment of the mini-hydro MMS body 50 -Unforeseen 100 Yearly running costs for the mini-hydro MMS body -Verification process( option HS1+option HS2) 2,600* -Issuing of approximately 100,000 certificates 1,242** -Redeeming of consumed certificates 1,242 -Updating of the standards and procedures 80 -Management/reporting 150 -Green Certificates payments:100,000 certificates @RMB 39 3,900 Building of capacity in the AMB -Development of MMS administration system 200 -Technical assistance 400 Development and implementation of an awareness campaign 250 * It is expected that the amount needed for verification will decrease significantly over time as the sample size will
decrease and also the frequency of verification will be lower. ** Based on fees applied by the Dutch RECS office.

134 ECN-C--03-089
REFERENCES
China Agricultural Publishing House (2000): China Agriculture Statistics in 2000, Beijing.
Commonwealth of Australia(2002): Towards a truly national and efficient energy market.
Deng Keyun & Jiao Qingyu (2002): Study on Policies of Promoting the Development of Off-Net
Electricity Generation Systems Based on Renewable Energy Resources in Rural China, China Energy Research Society & China Association of Rural Energy Industry, Beijing.
DFID (2002): Energy for the Poor: Consultation Document, Department for International Development, UK, May 2002, London.
EcoSecurities (2000): Financing and financing mechanisms for joint implementation (JI)
projects in the electricity sector, for UK Foreign and Commonwealth Office and European Commission, EcoSecurities, Oxford (www.ecosecurities.com).
ESMAP (2002): Rural Electrification and Development in the Philippines: Measuring the
Social and Economic Benefits, Joint UNDP/World Bank Energy Sector Management Assistance Programme, The World Bank, Washington DC.
Faber et al (2001): Promotion strategies for electricity from renewable energy sources in EU
countries, Institute of Energy Economics, Vienna University of Technology, June 2001.
Fan Shenggen, Zhang Linxiu & Zhang Xiaobo (2002): Growth, Inequality and Poverty in Rural
China: The Role of Public Investments, Final Draft, International Food Policy Research Institute, Washington DC.
IDS (2002): Energy, Poverty and Gender: A Review of the Evidence and Case Studies in Rural
China, Final Draft Report March 2002, The Institute of Development Studies (for the World Bank), Sussex.
MARGE (2002a): Energy, Poverty and Gender: Indonesia Report, Marchéage et Gestion de l’Environnement (for The World Bank), July 2002, Washington DC.
MARGE (2002b): Energy, Poverty and Gender: Sri Lanka Report, Marchéage et Gestion de l’Environnement (for The World Bank), July 2002, Washington DC.
Martens, J.W., S.L. Kaufman, J. Green, F.N. Nieuwenhout (2001): Streamlining CDM
procedures for solar home systems: A review of issues and options, ECN-C--01-098, Petten, the Netherlands www.ecn.nl/unit_bs/kyoto/mechanism/cdmshs.html
Martens J.W., S.N.M. van Rooijen., V. Bovee, H.J. Wijnants (2002): Standardised baselines for
small-scale CDM activities - a proposal for the CDM programme of the Netherlands, ECN-C--01-122, ECN, Petten, the Netherlands
Martinot, E., Kilian Reiche (2000): Regulatory approaches to rural electrification and
renewable energy: Case studies from six developing countries, World Development.
Meier, Peter (2002): Economic and Financial Analysis of the China renewable Energy Scaleup
Programme (CRESP), Draft Report, Peter Meier.
Ministry of Housing, Spatial Planning and the Environment of the Netherlands(2001): Standardised Baselines and Streamlined Monitoring Procedures for Selected small-
scale Clean Development Mechanism Project Activities, A guide for project developers.
Moura Costa, Pedro, Marc Stuart, Michelle Pinard and Gareth Phillips (2000): Elements of a
certification system for forestry-based carbon offset projects, Mitigation and Adaptation Strategies for Global Change,

ECN-C--03-089 135
Nieuwenhout, F., P.J.N.M. van de Rijt, M.R. Vervaart (2001): Monitoring of Solar Home
Systems in China: First Year Results, 17th PVSEC, Munich, 2001.
Nieuwenhout, F. and M. Djamin (2002): Monitoring Solar Home Systems in Indonesia, paper
presented at the PV in Europe - From PV Technology to Energy Solutions Conference and Exhibition, Rome, Italy, 7-11 October 2002.
Ramani, K V, M.N. Islam and A.K.N. Reddy (eds.) (1993): Rural Energy Systems in the Asia-
Pacific: A Survey of Their Status, Planning and Management, Asian and Pacific Development Centre & Deutsche Gessellschaft für Technische Zusammenarbeit (GTZ) GmbH, Kuala Lumpur.
Rosegrant, Mark W. & Peter B.R. Hazell (2000): Transforming the Rural Asian Economy: The
Unfinished Revolution, Oxford University Press (for Asian Development Bank), New York.SDPC (2002), ‘The Overall Plan of Western Region Development and Related Policy Measures’, State Development Planning Commission, China Planning Press, Beijing.
Schaeffer, G.J.; Boots, M.G. (ECN, Petten (Netherlands)); Mitchell, C.; University of Sussex. Science and Technology Policy Research (SPRU), Brighton (UK); Timpe, C.; Cames, M. (Oeko-Institut); Anderson, T. (2000): Options for design of tradable green
certificate systems, ECN-C--00-032. Petten, March 2000.
Taylor, Robert P & V Susan Bogach (1998): China: A Strategy for International Assistance to
Accelerate Renewable Energy Development, World Bank Discussion Paper Number 388, The World Bank, Washington DC.
UNFCCC (2001): Report or the Conference of the Parties of its seventh session, held at MArrakesh from 29 October to 11 November 2001 (see www.unfccc.int).
Upton, C., and Bass, S. (1995): The Forest Certification Handbook, London, Earthscan.
Uyterlinde, M.A. et al (2003): ADMIRE REBUS: Assessment and Dissemination of Major
Investment Opportunities for Renewable Electricity in Europe using the REBUS Tool, Interim Report; February, 2003.
Uzzell, J. M. Lehman, I. Nestaas, E. Telnes, T. Lund, G. Vage (2001): Multi-project verification
of Swedish AIJ Projects, for the Swedish National Energy Administration, Det Norske Veritias, Hovik, Norway
Violette, Dan (2001): Simplified procedures for the baseline assessment and monitoring of CFL
projects, Section 5.4 in Martens, et al, 2002, Petten, the Netherlands.
Voravate, Tuntivate, Douglas F Barnes & V Susan Bogach (1998): Assessing Markets for
Renewable Energy in Rural Areas of Northwestern China, The World Bank, Washington DC. Wang Xiaohua & Feng Zhenmin (2001), ‘Rural Household Energy Consumption with the Economic Development in China: Stages and Characteristic Indices’, in Energy Policy 29 (2001) 1391-1397, Elsevier.
WEC (2000): WEC Statement 2000, World Energy Council, London.
WEC-FAO (1999): Overcoming Rural Energy Poverty in Developing Countries, World Energy Council & Food and Agriculture Organization, London.
World Bank (2001): China: Overcoming Rural Poverty, The World Bank, Washington DC.
World Bank, Winrock International & Mallika Consultants (2002): Monitoring and Evaluation
in Rural Electrification Projects: A Demand-Oriented Approach, ASTAE-ESMAP, Washington DC.
Zhang Zhengmin, Wang Qingyi, Zhuang Xing, Dr. Jan Hamrin, Seth Baruch: Renewable
Energy Development in China: The potential and the Challenges, A report supported by the China Sustainable Energy Program.

136 ECN-C--03-089

ECN-C--03-089 137
APPENDIX A LIST OF POSSIBLE DRE OPTIONS
Table A.1 PV
System no. System type Device
1 Up to 4 W (DC) Lighting, one 5 W DC light 2 4 - 10 W (D/C) One 9 W light 3 10 - 20 W (D/C) Two lights 4 20 - 40 W (D/C) Two lights, black&white TV 5 40 - 50 W (D/C) Two lights, black&white TV 6 50 - 100 W(A/C) Colour TV 7 100 - 200 W(A/C) Colour TV, lights, satellite receiver 8 200 W - 2000 W Hotel, shop, restaurant 9 5 kW - 100 kW Mini grid (control room, battery room,
centralised PV arrays) Hybrid home systems 10 100 W wind/50 W PV 11 300 W wind/100/200 W PV 12 Up to 500 kW(2.3 wind-1/3 PV) Village power
Table A.2 Mini-hydro systems
System no. System type Device
13 Up to 1 kW Supplies one household 14 1-5 kW 2-5 households 15 5-10 kW 5-10 households > 10 kW Connected to the grid Table A.3 Wind
System no. System type Device
15 Up to 50 W 2-3 lights & one black-white TV set 16 50 - 100 W 2-3 lights & one colour TV set 17 100 - 150 W Same with above & one small refrigerator 18 150 - 200 W 2-3 lights & one colour TV set and middle
size refrigerator 19 200 - 300 W 2-3 lights & one colour TV set & large size
refrigerator 20 300 - 500 W Same as above, plus pumping system 21 500 - 600 W Same as above 22 600 W - 1 kW Several households use 23 1 - 2 kW Several households use 24 2 - 3 kW Village power system 25 3 - 5 kW Village power system 26 5 - 6 kW Village power system 27 6 - 10 kW Village power system

138 ECN-C--03-089
APPENDIX B SOLAR RESOURCES IN CHINA BY REGION
Solar region Solar irradiation [kWh/m2] Provinces
A 1856-2330 • West of Tibet
• North of Ningxia
• North of Gansu
• East of Xinjiang
• West of Qinghai B 1625-1856 • North-west Hubei
• North of Shanxi
• South of Inner Mongolia
• South of Ningxia
• Central of Gansu
• East of Qinghai
• South East of Tibet
• North West of Sichuan
• South of Xinjiang C 1390-1625 • Shandong
• Henan
• South East of Hebei
• South of Guangdong
• South of Fujian
• North of Jiangsu
• North of Anhui
• South West of Taiwan D 1170-1390 • Hunan
• Hubei
• Guangxi
• Jiangsu
• Zhejiang
• North of Fujian
• North of Guangdong
• South of Shaanxi
• North of Jiangsu
• South of Anhui
• Heilongjiang
• North East of Taiwan E 930-1170 • South and East of Sichuan
• Guizhou

ECN-C--03-089 139
APPENDIX C HISTORICAL OVERVIEW OF ANNUAL
PRODUCTION, MODULE PRICE AND INSTALLED
PV CAPACITY
Year Type Annual Production [kWp] Module Price [RMB/Wp] Installed Capacity [kWp]
1976 0.5 400 0.5
1977 1 200 1.5
1978 2 120 3.5
1979 5 100 8.5 1980 8 80 16.5
1981 15 75-80 31.5
1982 20 70 51.5
1983 30 60 81.5 1984 50 50 131.5
1985 70 45-50 200
1986 80 40-45 280
1987 100 40 380 1988 a-Si
c-Si
200
150
21-23
35-45
730
1989 a-Si
c-Si
300
250
Si 23
35-37
1,280
1990 a-Si
c-Si
100
400
22-25
38-40
1,780
1991 a-Si
c-Si
100
450
23-25
38-40
2,330
1992 a-Si
c-Si
150
500
Si 25
40-42
2,980
1993 a-Si
c-Si
250
650
25-27
40-47
3,880
1994 a-Si
c-Si
imported
200
900
100
25-27
40-47
5,080
1995 a-Si c-Si
imported
200 1,000
350
25-27 40-47
50-60
6,630
1996 a-Si
c-Si imported
450
1,420 300
25-27
40-47 50-60
8,800
1997 a-Si
c-Si
imported
500
1,500
300
25-27
42-47
46-60
11,100
1998 a-Si
c-Si
imported
430
1,670
200
25-27
40-45
45-60
13,300
1999 a-Si c-Si
imported
500 2,000
200
22-25 38-45
45-60
16,000
2000 a-Si
c-Si
imported
600
2,200
500
20-25
35-45
45-60
19,000
2001 a-Si
c-Si
imported
300
4,000
200
20-25
35-45
40-50
23,500
2002 a-Si
c-Si imported
300
>14,700 5,000
20-25
35-45 40-50
≈ 43,500

140 ECN-C--03-089
1. Exchange rate: before 1988: 1 US$ = RMB 3.5 - 3.8 , 1989 - 1993: 1 US$ = RMB 5.3 - 5.7 , 1994 to present: 1 US$ = RMB 8.3 - 8.9 .
2. The imported PV means the modules, not the solar cells. Now most Chinese PV manufacturers import solar cells from foreign PV companies and assemble the modules in China.

ECN-C--03-089 141
APPENDIX D SOLAR HOME SYSTEM COSTS
Solar Home System Cost (RMB)
Wp Operating hours per day
PV panel
Battery DC (AC) lights
Charge control.
Inverter (for AC)
Others Total
DC 4 4-5 140 60 20 20 80 32010 4-5 350 120 40 30 100 64020 4-5 700 200 60 30 120 1,11050 4-5 1,750 360 80 30 200 2,420AC 100 4-5 3,500 1,200 80 300 (200 W)
800 300 6,180
200 4-5 7000 2,000 80 300 (500 W) 2,000
500 11,880
2000 4-5 70,00 30,000 80 1,000 (5KVA)15,000
1,000 117,080
Lifetime of equipment (years) 15 3-8 2 10 10
Wind-PV Hybrid Home System Cost
Wind/PV [W]
Wind Turbine
PV panel [RMB]
Battery AC lights Charge control.
Inverter (for AC)
Others Total
100/50 1,500 1,750 800 80 1,000 (500 W)2,000
500 7,630
300/100 3,000 3,500 1,600 80 2,000 ( 1kW) 3,500
1,000 15,680
Village Power System Price
Operating hours per year
Turn key investment costs
[RMB/W]
Hardware Equipment[RMB/W]
Civil works
[% of turn-key costs]
Transmission
[RMB/km]
Others
[RMB/W]
Wind 1,500 50 25 40,000 50,000 5 PV 1,500 100 50 40,000 50,000 5 Wind-PV hybrid 1,500 60 - 80
Depending on the fraction of Wind
and PV
30-40 40,000 50,000 5
Expected Lifetime 15 years 15 20 20

142 ECN-C--03-089
APPENDIX E KWH PRODUCED BY PV AND WIND/PV SYSTEMS
No. PV [Wp]
Daily Irradiation [kWh/m2]
Load [W]
Working Time [h/D]
Yearly Output[kWh]
Availability (80%) [kWh]
6 4 4 5.84 4.7 5 4 3.5 5.11 4.1 1 4 4 4 3 4.38 3.5 6 6 6.5 14.20 11.4 5 6 5.5 12.0 9.5 2 10 4 6 4.5 10.0 8.0 6 12 6.5 28.5 22.8 5 12 5.5 24.0 19.0 3 20 4 12 4.5 20.0 16.0 6 40 6 87.6 70.0 5 40 5 73.0 58.4 4 50 4 40 4 58.4 46.7 6 80 6 175.2 140.0 5 80 5 146.0 116.8 5 100 4 80 4 116.8 93.4 6 160 6 350.4 280.0 5 160 5 292.0 233.6 6 200 4 160 4 233.6 186.9 6 1,200 10 4,380.0 3,504.0 5 1,200 8 3,504.0 2,803.2 7 2000 4 1,200 6 2,628.0 2,102.4
No. PV [Wp]
Wind [W]
Load [W]
Working Time [h/D]
Yearly Output[kWh]
Availability (80%) [kWh]
1 50 100 80 10 292.0 233.6 2 100 300 200 10 730.0 584.0

EC
N-C
--03
-089
143
AP
PE
ND
IX F
D
IFF
ER
EN
T T
YP
ES
OF
ST
AN
D A
LO
NE
WIN
D S
YS
TE
MS
US
ED
IN
CH
INA
Syst
em t
ype
Bla
de
dia
met
er D
aily
aver
age
win
d s
pee
d
Work
ing t
ime
Yea
rly o
utp
ut
Avai
labil
ity
Load
S
yst
em c
ost
[W]
[m]
[m/s
] [h
ours
/day
] [k
Wh]
[%]
[W]
[kW
h]
[RM
B]
50 W
1.2
6
16
360
25
2-3
lig
hts
& o
ne
bla
ck-w
hit
e T
V s
et
5
9.4
210
43
500
4
4.9
115
79
(2×0
.015 k
W×5
H+
0.0
25 k
W×4
H)×
365=
91 k
Wh
3
2.6
60
Not
enough
100 W
1.5
6
16
580
31
2-3
lig
hts
& o
ne
colo
ur
TV
set
5
9.4
340
54
800
4
4.9
180
100
(3×0
.025 k
W×5
H+
0.0
25 k
W×5
H)×
365=
182 k
Wh
3
2.6
94
Not
enough
150 W
1.8
6
16
870
29
Sam
e w
ith a
bove
& o
ne
smal
l re
frig
erat
or
5
9.4
510
49
1,1
50
4
4.9
270
93
(3×0
.015 k
W×5
H+
0.0
25 k
W×4
H+
0.0
6 k
W×6
H)×
365=
250 k
Wh
3
2.6
140
Not
enough
200 W
2
6
16
1040
30
2-3
lig
hts
& o
ne
colo
ur
TV
set
and m
iddle
siz
e re
frig
erat
or
1,6
65
5
9.4
660
48
4
4.9
375
84
(3×0
.015 k
W×5
h+
0.0
25 k
W×4
h+
0.0
9 k
W×6
h)×
365=
316 k
Wh
3
2.6
190
Not
enough
300 W
2.2
--2.4
6
16
1740
22
2-3
lig
hts
& o
ne
colo
ur
TV
set
& l
arge
size
ref
riger
ator
3,0
90
5
9.4
1020
37
4
4.9
540
70
(3×0
.015 k
W×5
h+
0.0
25 k
W×4
h+
0.1
20 k
W×6
h)×
365=
380 k
Wh
3
2.6
280
Not
enough
500 W
2.5
--2.7
6
16
2960
18
Sam
e as
above,
plu
s pum
pin
g s
yst
em
5
9.4
1630
32
4,5
00
4
4.9
810
65
380+
0.3
70 k
W×4
00 h
=528 k
Wh
3
2.6
300
Not
enough
600 W
2.8
6
16
3430
18
Sam
e as
above
5
9.4
1860
34
4
4.9
890
71
Plu
s li
ghti
ng, 100 k
Wh, 628 k
Wh
3
2.6
320
Not
enough

144
E
CN
-C--
03
-089
Syst
em t
ype
Bla
de
dia
met
er D
aily
aver
age
win
d s
pee
d
Work
ing t
ime
Yea
rly o
utp
ut
Avai
labil
ity
Load
S
yst
em c
ost
[W]
[m]
[m/s
] [h
ours
/day
] [k
Wh]
[%]
[W]
[kW
h]
[RM
B]
1 k
W
3.2
6
8.8
3230
39
Sev
eral
house
hold
s use
5
5.2
1900
66
8,0
00
4
2.7
1000
Not
enough
2-6
28 k
Wh=
1256 k
Wh
3
1.3
480
Not
enough
2 k
W
4.5
6
8.8
6460
29
Sev
eral
house
hold
s use
5
5.2
3800
50
23,0
00
4
2.7
2000
Not
enough
3×6
28 k
Wh=
1884 k
Wh
3
1.3
960
Not
enough
6
8.8
9690
31
Vil
lage
pow
er s
yst
em
5
5.2
5700
53
4
2.7
3000
100
3000 k
Wh
40,0
00
3kW
3
1.3
1440
Not
enough
6
8.8
16150
31
Vil
lage
pow
er s
yst
em
5
5.2
9500
53
70,0
00
4
2.7
5000
100
5000 k
Wh
5kW
3
1.3
2400
Not
enough
6
8.8
19380
31
Vil
lage
pow
er s
yst
em
5
5.5
11400
53
80,0
00
4
2.7
6000
100
6000 k
Wh
6kW
3
1.3
2880
Not
enough
6
8.8
32300
31
Vil
lage
pow
er s
yst
em
5
5.2
19000
53
100,0
00
4
2.7
10000
100
10000 k
Wh
10kW
3
1.3
4800
Not
enough

ECN-C--03-089 145
APPENDIX G RESULTS WITH AN ALTERNATIVE METHOD TO
MODEL THE DEMAND SIDE
In response to comments received on the draft version of this report, an alternative method to
model the demand for electricity services based on a fixed household budget has been devel-
oped. Based on the observation that poor households in China in general seem to spend between
3-5% of household income, it was suggested that it is possible to model the demand side by as-
suming a fixed budget for off-grid renewables (3-5% of household income). In that case, the
quantity demanded per household (Q) depends on the effective price P that the household pays
per kWh. The relationship can be written as P×Q=Budget.
The focus in the following calculations is on China. To increase the comparability of the results
in this Appendix with those in the main text of Chapter 5, the same assumptions are used as
listed in Tables 5.3-5.7. The total potential in terms of un-electrified households is also equal to
the main text. It is assumed that 4% of household income is spent on off-grid renewables. The
following household income categories are distinguished:
MHP
• 10% with annual household income 4000 RMB,
• 80% with annual household income 3000 RMB,
• 10% with annual household income 2000 RMB.
Wind
• 10% with annual household income 4000 RMB,
• 80% with annual household income 3000 RMB,
• 10% with annual household income 2000 RMB.
PV
MHP
• 40% with annual household income 4000 RMB,
• 40% with annual household income 3000 RMB,
• 20% with annual household income 2000 RMB.
These income categories have been derived by combining WTP categories presented in the
main text of Chapter 5. Using these assumptions, the generation of GC at different GC prices
can be calculated. The same type of analysis is repeated as done for Table 5.11 and Table 5.12.
See Tables G.1 and G.2 respectively.

146 ECN-C--03-089
Table G.1 Uptake of DRE in GWh/year for various multiplier values, China. GC price fixed at
RMB 0.039/kWh_on-grid
Total power generation Power additional to BAU
Multiplier Total
[GWh]
Hydro
[GWh]
Wind
[GWh]
PV
[GWh]
Total
[GWh]
Hydro
[GWh]
Wind
[GWh]
PV
[GWh]
0 140.2 83.0 19.8 37.4 0.0 0.0 0.0 0.0
2 146.8 89.1 20.0 37.7 6.6 6.1 0.2 0.2
3 150.8 92.9 20.1 37.8 10.7 9.9 0.3 0.4
4 155.3 97.1 20.3 37.9 15.1 14.1 0.5 0.5
5 160.1 101.6 20.4 38.1 19.9 18.6 0.6 0.7
10 193.1 133.2 21.1 38.8 52.9 50.3 1.3 1.4
25 641.8 577.4 23.4 41.1 501.7 494.4 3.6 3.6
50 684.8 610.5 28.8 45.5 544.6 527.6 9.0 8.1
100 719.3 610.5 56.1 52.7 579.1 527.6 36.3 15.3
117.7 728.2 610.5 63.2 54.4 588.0 527.6 43.5 17.0
Table G.2 Uptake of DRE in GWh/year for various multiplier values, China. GC price in
RMB/kWh_on-grid reacts to off-grid supply
Total power generation Power additional to BAU
Multiplier Total
[GWh]
Hydro
[GWh]
Wind
[GWh]
PV
[GWh]
Total
[GWh]
Hydro
[GWh]
Wind
[GWh]
PV
[GWh]
0 140.2 83.0 19.8 37.4 0.0 0.0 0.0 0.0
2 146.7 89.0 20.0 37.7 6.5 6.1 0.2 0.2
3 150.7 92.7 20.1 37.8 10.5 9.8 0.3 0.4
4 154.9 96.7 20.3 37.9 14.7 13.7 0.5 0.5
5 159.4 101.0 20.4 38.1 19.2 18.0 0.6 0.6
10 187.8 128.2 21.0 38.7 47.7 45.2 1.2 1.3
25 339.0 276.9 22.2 40.0 198.8 193.9 2.4 2.5
50 374.4 312.0 22.3 40.1 234.3 229.1 2.6 2.6
100 256.3 195.4 21.8 39.1 116.1 112.5 2.0 1.6
117.7 228.9 168.8 21.4 38.7 88.7 85.8 1.6 1.3
For Table 5.11 the estimated uptake had to be cut off for the different income categories when
the GC price gets close to the supply costs, since the relation between quantity demanded and
price assumed implies that the quantity demanded would approach infinity.
Although the exact relationship between the multiplier and the uptake of off-grid power in Ta-
bles G.1 and G.2 is different from the relationships found in Table 5.11 and Table 5.12, (the ta-
bles here suggest a higher uptake at low multiplier values) the essential conclusions are the
same:
• At reasonable multiplier values (10 and below), only mini-hydropower is significantly
stimulated by the introduction of the multiplier.
• To stimulate the uptake of off-grid PV and wind technologies significantly, multipliers of
over 100 are needed. However, in the context of one single multiplier for off-grid renew-
ables, it is not possible to achieve significant additional uptake of wind and PV.
• If the Chinese government wishes to stimulate the uptake of wind and PV, the analysis here
again suggests that this may be best achieved through a feed-in tariff (with a subsidy of 4
RMB/kWh or above) or through an MMS system with two or more separate MMS targets.
The main contrast with the analysis presented in the main text of Chapter 5 is that the analysis
suggests somewhat higher multiplier values of about 20-25 instead of 10-15 to achieve signifi-
cant additional uptake of off-grid renewables (mini-hydropower).
Related Documents