The evolution of the social situation and social protection in Belgium Monitoring the social situation in Belgium and the progress towards the social objectives and the priorities of the National Reform Programme and the National Social Report April 2015

Welcome message from author
This document is posted to help you gain knowledge. Please leave a comment to let me know what you think about it! Share it to your friends and learn new things together.
Transcript

The evolution of the social situation and social protection in Belgium
Monitoring the social situation in Belgium and the progress towards the social objectives and the priorities of the National Reform Programme and the National Social Report
April 2015

2

3
Contents
Key Messages of the analysis of the EU social indicators 4
Introduction 5
The Economic and European context 6 1 |
Economic context 6 1.1
Social developments 7 1.2
The Europe 2020 poverty or social exclusion target 10 2 |
Analysis of the evolution of poverty and social exclusion on the basis of the social 3 |
indicators 12
The evolution of the overall social situation in Belgium: labour market participation and 3.1
income distribution 12
Indicators on poverty and social exclusion 15 3.2
Follow-up of the policy priorities in the context of the National Reform Programme and 4 |
the National Social Report 22
Social Protection 22 4.1
Child poverty 25 4.2
Housing 28 4.3
Active inclusion 31 4.4
Overindebtedness 35 4.5
5|Pensions 37
6| Health care and long-term care 41
7|Summary and conclusions 45
References 48
Annex 1: SPPM scoreboard for Belgium / summary table of main social trends 51
Annex 2 : tables and figures 52
Annex 3: Participants in the meeting of the Working group on social Indicators and
persons giving input to analysis 61
Annex 4: Nederlandstalige samenvatting 62
Annex 5: Résumé Français 65
4
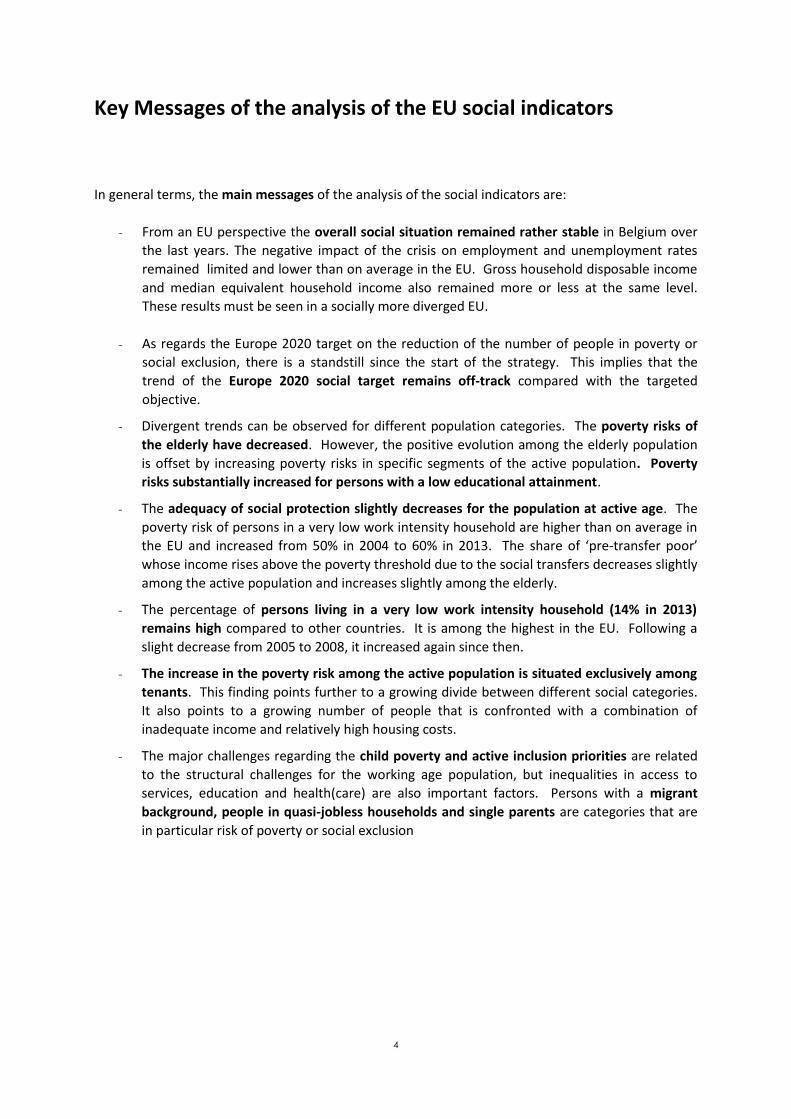
Key Messages of the analysis of the EU social indicators
In general terms, the main messages of the analysis of the social indicators are:
- From an EU perspective the overall social situation remained rather stable in Belgium over
the last years. The negative impact of the crisis on employment and unemployment rates
remained limited and lower than on average in the EU. Gross household disposable income
and median equivalent household income also remained more or less at the same level.
These results must be seen in a socially more diverged EU.
- As regards the Europe 2020 target on the reduction of the number of people in poverty or
social exclusion, there is a standstill since the start of the strategy. This implies that the
trend of the Europe 2020 social target remains off-track compared with the targeted
objective.
- Divergent trends can be observed for different population categories. The poverty risks of
the elderly have decreased. However, the positive evolution among the elderly population
is offset by increasing poverty risks in specific segments of the active population. Poverty
risks substantially increased for persons with a low educational attainment.
- The adequacy of social protection slightly decreases for the population at active age. The
poverty risk of persons in a very low work intensity household are higher than on average in
the EU and increased from 50% in 2004 to 60% in 2013. The share of ‘pre-transfer poor’
whose income rises above the poverty threshold due to the social transfers decreases slightly
among the active population and increases slightly among the elderly.
- The percentage of persons living in a very low work intensity household (14% in 2013)
remains high compared to other countries. It is among the highest in the EU. Following a
slight decrease from 2005 to 2008, it increased again since then.
- The increase in the poverty risk among the active population is situated exclusively among
tenants. This finding points further to a growing divide between different social categories.
It also points to a growing number of people that is confronted with a combination of
inadequate income and relatively high housing costs.
- The major challenges regarding the child poverty and active inclusion priorities are related
to the structural challenges for the working age population, but inequalities in access to
services, education and health(care) are also important factors. Persons with a migrant
background, people in quasi-jobless households and single parents are categories that are
in particular risk of poverty or social exclusion
5
Introduction
This note summarizes the evolution of the social situation, in view of the objectives of the Europe
2020 strategy1. This analysis is mainly based on European social indicators, completed with a number
of national data and studies. This analysis is the basis for the follow-up of the objective for the
reduction of poverty or social exclusion in the National Reform Program and for the determination of
the challenges in the context of the National Social Report.
The social indicators are mainly based on data derived from surveys of a population sample. The EU-
SILC survey is one of the main data sources for all the indicators for income, poverty and deprivation.
When interpreting these data, a statistical error rate should be taken into account. This means that
when the value of an indicator is interpreted for a specific moment in time, an error rate should be
considered and it should also be considered that the variations in time and space that are found in
the sample cannot always be extrapolated to the entire population. For indicators calculated on the
basis of smaller subpopulations, the error rate is higher.
Some population groups are not included in the sample frame. Hence, the situation of these groups
is not reflected in the indicators. These groups mainly include persons in collective households,
homeless people and people who do not have a valid residence permit. In the SILC-CUT survey
(Schockaert et al., 2012), the combined size of these groups is estimated at 2% to 3% of the
population. Some of these groups live in extreme poverty. The authors therefore estimate that the
EU-SILC poverty rate (AROP) may understate the true rate by 0.6 pp. to 1.7pp.2
The analysis is based on the indicators that are available on the Eurostat website and on
complementary national data, such as the detailed indicators and the breakdowns on the basis of the
EU-SILC and the Labour Force Survey, made available by the Directorate General Statistics of the
Federal Public Service Economy.
Due to some uncertainties concerning the regional breakdowns of the social indicators, Statistics
Belgium does not supply indicators on the Regional level since 2014. On this, the 2014 National
Reform Programme indicated that a working group has been set up under the Higher Council for
Statistics. The work of this group, on an urgent and structural reinforcement of EU-SILC, is of utmost
importance for the monitoring of the social situation in Belgium and its Regions. In view of the
importance of the regional level in a country with increasingly devolved social competencies, this
note presents some indicators that were published before the current statistical policy. It should be
noted that the authorities from all the three Regions regularly produce very detailed monitoring
reports on poverty and social exclusion for their region3.
1 The monitoring of the social situation in the context of the aforementioned European reports is coordinated
by the Federal Public Service (FPS) Social Security, with the support of the NRP/NSR Social Indicator working
group, which consists of experts in the field of social indicators from the federal and regional
administrations, universities, research centres and stakeholder organisations (cf. annex 4 for an overview of
the persons who contributed to this note). However, the responsibility for the content of this note lies with
the FPS Social Security. This note further builds on preparatory work of OSE and HIVA on updating the 2013
analysis of the social indicators. Contact : [email protected] or [email protected]
2 Schockaert, I., Morissens, A., Cincinnato, S., Nicaise, I., Armoede tussen de plooien. Aanvullingen en correcties
op de EU-SILC voor verborgen groepen armen, Leuven: HIVA, 2012, 225p
3 Regional reports:
6
The Economic and European context 1 |
Economic context 1.1
The analysis of the social situation accompanying the 2013 National Social Report4 indicated that the
economic impact of the crisis in Belgium had been less than on average in the EU. Belgium indeed
experienced a slight but consistent better (or less bad) growth rate than on average in the EU, while
budget deficits were somewhat less than the EU-average. The Winter 2015 economic forecasts of
the European Commission however seem to indicate that from 2014 on these trends could be
reversed, with Belgium performing slightly worse than the EU-average (European Commission, 2015).
Prospects for economic recovery thus seem to be even slightly weaker than the already weak
prospects for the EU5. During the crisis, public debt has again moved to over 100% of GDP and is
forecast to increase further during the next years6.
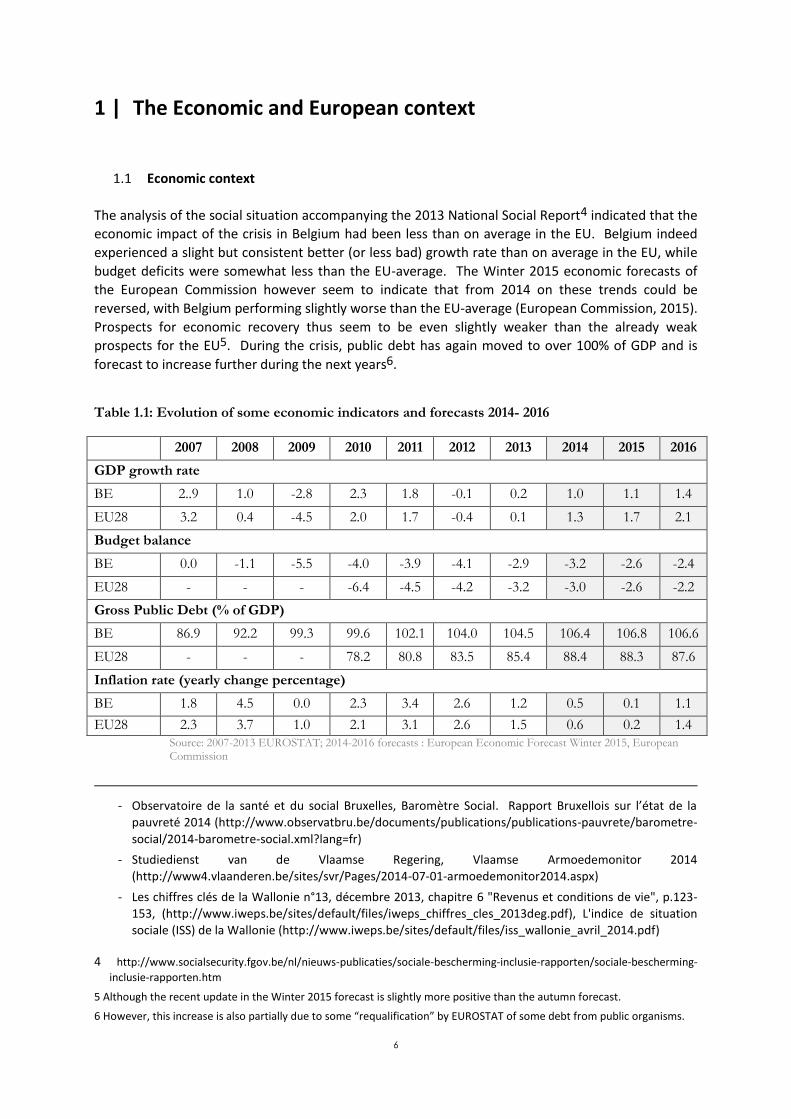
Table 1.1: Evolution of some economic indicators and forecasts 2014- 2016
2007 2008 2009 2010 2011 2012 2013 2014 2015 2016
GDP growth rate
BE 2..9 1.0 -2.8 2.3 1.8 -0.1 0.2 1.0 1.1 1.4
EU28 3.2 0.4 -4.5 2.0 1.7 -0.4 0.1 1.3 1.7 2.1
Budget balance
BE 0.0 -1.1 -5.5 -4.0 -3.9 -4.1 -2.9 -3.2 -2.6 -2.4
EU28 - - - -6.4 -4.5 -4.2 -3.2 -3.0 -2.6 -2.2
Gross Public Debt (% of GDP)
BE 86.9 92.2 99.3 99.6 102.1 104.0 104.5 106.4 106.8 106.6
EU28 - - - 78.2 80.8 83.5 85.4 88.4 88.3 87.6
Inflation rate (yearly change percentage)
BE 1.8 4.5 0.0 2.3 3.4 2.6 1.2 0.5 0.1 1.1
EU28 2.3 3.7 1.0 2.1 3.1 2.6 1.5 0.6 0.2 1.4
Source: 2007-2013 EUROSTAT; 2014-2016 forecasts : European Economic Forecast Winter 2015, European Commission
- Observatoire de la santé et du social Bruxelles, Baromètre Social. Rapport Bruxellois sur l’état de la
pauvreté 2014 (http://www.observatbru.be/documents/publications/publications-pauvrete/barometre-
social/2014-barometre-social.xml?lang=fr)
- Studiedienst van de Vlaamse Regering, Vlaamse Armoedemonitor 2014
(http://www4.vlaanderen.be/sites/svr/Pages/2014-07-01-armoedemonitor2014.aspx)
- Les chiffres clés de la Wallonie n°13, décembre 2013, chapitre 6 "Revenus et conditions de vie", p.123-
153, (http://www.iweps.be/sites/default/files/iweps_chiffres_cles_2013deg.pdf), L'indice de situation
sociale (ISS) de la Wallonie (http://www.iweps.be/sites/default/files/iss_wallonie_avril_2014.pdf)
4 http://www.socialsecurity.fgov.be/nl/nieuws-publicaties/sociale-bescherming-inclusie-rapporten/sociale-bescherming-
inclusie-rapporten.htm
5 Although the recent update in the Winter 2015 forecast is slightly more positive than the autumn forecast.
6 However, this increase is also partially due to some “requalification” by EUROSTAT of some debt from public organisms.
7
Social developments 1.2
The European Commission’s Annual Growth Survey 2015 acknowledges that :
‘Despite national and European efforts, recovery is weaker than expected one year ago. The
momentum began to slow in spring 2014. The economic crisis triggered an ongoing social crisis and
the slow recovery is hampering efforts to reduce the high levels of unemployment’ (European
Commission, 2014).
To monitor the social situation in the EU new tools have been developed during the previous years
(see Box 1):
Box 1 : EU monitoring tools
- To reinforce the social dimension of the EMU, a social scoreboard was developed, with the
primary objective of identifying major employment and social problems at an early stage 7. The
social scoreboard is based on five employment and social indicators: the unemployment rate, the
Youth unemployment rate together with the NEETs rate, the change in the gross household
disposable income, the at-risk-of-poverty rate of the working age population and the S80/S20
ratio. The social scoreboard is reported annually in the Joint Employment Report
(http://ec.europa.eu/europe2020/making-it-happen/annual-growth-surveys/index_en.htm)
- To reinforce the monitoring capacity of the Social Protection Committee in the context of the
Europe 2020 strategy and the European Semester, the Committee developed a ‘Social
Protection Performance Monitor’ (SPPM). This tool consists of three elements: (1) a graph of
the evolution towards the EU headline target on poverty or social exclusion, (2) a dashboard of
key social indicators covering the domains 'inclusion', 'pensions' and 'health and long-term care'
that should lead to identifying 'key social trends', (3) country profiles. The SPPM constitutes the
backbone of the annual report of the SPC on the social situation in the EU
(http://ec.europa.eu/social/main.jsp?catId=738&langId=en&pubId=7744&visible=0)
The key finding coming from the first application of the social scoreboard in the 2014 Joint
Employment Report was the growing social divergence between the member states. While in a
number of member states the social impact of the crisis has been limited, other member states were
severely affected over the range of scoreboard indicators. Among the countries that were severely
affected are the Southern Member States like Greece, Spain, Portugal and Cyprus, but also Ireland
and Estonia, although the latter seems to have recovered better. The finding that a social cleavage
has emerged between groups of member states goes against the idea of upward convergence, one of
the core objectives of the European Union.
The deterioration of the social situation in many member states is illustrated in more detail by the
SPPM. More than half of the member states experienced a drop in their gross household disposable
income since 2008. The number of people in poverty or social exclusion increased. On all the three
indicators8 that constitute the Europe 2020 target, a considerable number of member states has
7 With the same objective of strengthening the social dimension of the EMU, social indicators, with an auxiliary
status, were also introduced in the Macro-Economic Imbalance scoreboard
8 The number of persons below the at-risk-of-poverty threshold ; the number of persons in a situation of
severe material deprivation ; the number of persons in a situation of very low work intensity (see footnote 9,
10 and 11 for definitions).

8
experienced significant deterioration. Also the poverty gap and inequality increased. Child poverty
increased and youth indicators also show a significant negative evolution. Finally, a lot of member
states are confronted with a significant increase of the housing cost overburden rate. On the other
hand, there has been an important improvement of the employment rate of older workers in many
member states. The income position of elderly has also improved in many member states. However,
this will in many cases be a relative improvement, due to the deterioration of household incomes of
the working age population (figure 1.1).
Although the incidence of significant negative evolutions over the EU member states is less
outspoken between 2012 and 2013, the most recent data points, significant negative trends in one
third or more of the member states can be found on the following indicators: real change in gross
household disposable income, housing cost overburden rate, the median poverty risk gap, the share
of the population in quasi-jobless households and the at-risk-of-poverty rate (figure 1.2).
Comparing the levels on the 25 indicators in the SPPM dashboard of key social indicators, Belgium
scores less good than the EU average on three indicators: the very low work intensity rate, the
poverty risk of persons in very low work intensity and on the at-risk-of-poverty rate of elderly (see
annex 1).
Figure 1.1: Social Trends to watch and areas of improvement for the period 2008-2013
Source: European Union (2015), Social Protection Performance Monitor

9
Figure 1.2: Social trends to watch and areas of improvement for the period 2012-2013
Source: European Union (2015), Social Protection Performance Monitor

10
The Europe 2020 poverty or social exclusion target 2 |
The EU-target on the reduction of poverty or social exclusion is based on the combination of three
indicators: the number of persons that is below the at-risk-of-poverty threshold9 or in a situation of
severe material deprivation10 or in a situation of very low work intensity11 . Belgium set its Europe
2020 target on the same basis as the EU-wide target. It aims at reducing the number of persons at
risk of poverty or social exclusion by 380.000 compared to the situation at the start of the strategy
(2.194.000 persons based on EU-SILC 2008).
After a slight increase for 3 consecutive years (period 2009-2012), the evolution of the combined
indicator ‘poverty or social exclusion’ (AROPE), based on the EU-SILC survey, shows a slight decrease
in 2013 (figure 2.1). Based on the assessment in the Social Protection Performance Monitor, the
2008-2013 change is not statistically significant. However, the real trend remains off-track compared
with the anticipated decrease. On the basis of EU-SILC 2013 (halfway the decade), the number of
persons living in situation of poverty or social exclusion is estimated at 2,286,000 compared to
2,194,000 on the basis of EU-SILC 2008: a decrease by 472,000 persons is therefore necessary in the
next five years to reach the target by 2020 (EU-SILC 2018).
Figure 2.1: Evolution of poverty or social exclusion in relation to the national Europe2020 target, Belgium (absolute
number x1000)
Source: EU-SILC, EUROSTAT
9 60% of the median disposable income
10 A person is considered to be in a situation of severe material deprivation if this person lives in a household
that is confronted with at least 4 out of 9 problems: being confronted with arrears, not being able to afford 1
week annual holiday away from home, not being able to afford a meal with meat/fish/chicken every other
day, not being able to make an unexpected expense with a value equal to the poverty threshold (1000 € in
2011), not being able to heat the dwelling adequately, not being able to afford a washing machine, a tv, a
telephone, a car.
11 A person is living in a household with a very low work intensity if the actual number of months worked in
the household is less than 20% of the possible maximum number of months that could be worked by all
adult household members (excluding students).
2004 2005 2006 2007 2008 2009 2010 2011 2012 2013 2014 2015 2016 2017 2018
AROPE 2257 2338 2247 2261 2194 2145 2235 2271 2356 2286 1814
0
500
1000
1500
2000
2500

11
After a decrease during the period 2005-2008, the number of people in a very low work intensity
household increased gradually during the subsequent crisis period 2008-2011 and continued to rise
in 2012 and 2013. Between 2009 and 2012 (incomes 2008-2011), the number of persons at risk of
poverty increased slightly. There is no clear trend in the number of persons in a situation of severe
material deprivation. (figure 2.2)12.
Figure 2.2: At-risk of poverty or social exclusion, at-risk-of poverty, severe material deprivation and very low work
intensity, Belgium (absolute number x1000)
Note: AROPE: at risk-of-poverty or social exclusion; AROP: at-risk-of-poverty; SMD: severe material deprivation; VLWI: very low work intensity
Source EU-SILC, EUROSTAT
12 Provisional 2014 figures for severe material deprivation indicate 650 (thousand) persons.
2004 2005 2006 2007 2008 2009 2010 2011 2012 2013
AROPE 2257 2338 2247 2261 2194 2145 2235 2271 2356 2286
AROP 1492 1537 1531 1590 1554 1549 1566 1657 1667 1652
VLWI 1221 1244 1178 1138 967 1021 1053 1152 1170 1190
SMD 495 673 672 602 595 555 628 615 687 561
0
500
1000
1500
2000
2500

12
Analysis of the evolution of poverty and social exclusion on 3 | the basis of the social indicators
The evolution of the overall social situation in Belgium: labour market participation and 3.1income distribution
Although poverty and social exclusion are key aspects of the social situation, the living standards of
large parts of the population can be or are affected by both the crisis and structural labour market
and demographic evolutions. Therefore, before analysing more in depth the evolution of poverty
some indicators on the overall social situation are presented.
As for most people, the most important pathway for an adequate living standard is having a job, the
employment situation is of key importance for the social situation. The employment rate, at 67,2%
in 2013 remained in Belgium about 0,5-0,8 pp. below its pre-crisis level, with almost no changes in
the most recent years (table 3.1). The EU employment rate dropped somewhat sharper and remains
also stable in the most recent years. The unemployment rate increased, but significantly less than
the increase at EU-level. Forecasts indicate a rather stable unemployment rate for Belgium in the
current and next years, while in the EU as a whole, it would remain on a high, but slightly decreasing,
level. In its report on the monitoring of the Federal reflation strategy of the former government, the
Federal Planning Bureau notes that the Belgian employment level remained also relatively stable in
comparison with the neighbouring countries13 More information on the employment situation of
specific groups can be found below, in the section on the active inclusion priority.
Table 3.1. Employment rate and unemployment rate
2007 2008 2009 2010 2011 2012 2013 2014 2015 2016
Employment rate (20-64)
BE 67.7 68.0 67.1 67.6 67.3 67.2 67.2
EU28 69.8 70.3 69.0 68.5 68.5 68.4 68.4
Unemployment rate
BE 7.5 7.0 7.9 8.3 7.2 7.6 8.4 8.5 8.4 8.2
EU28 7.2 7.0 8.9 9.6 9.6 10.5 10.8 10.3 10.0 9.5
Source: Eurostat; European Economic Forecast Winter 2015, European Commission
One way to look at distributional aspects of income is to look at Gross Household disposable income
(GHDI). GHDI is based on the National Accounts and can roughly be described as the share of the
13 Federal Planning Bureau, Monitoring of the Federal reflation strategy. Progress Report, July 2014: “This way
Belgian employment was during the first quarter of 2014 3.1% above the level of the end of 2007, which
makes that Belgium scores better than the Eurozone (-3.2%) en the average of the neighbouring
countries(2.4%). The positive figure for the neighbouring countries was exclusively due to the strong
performance of Germany; in France and the Netherlands employment doesn’t reach its pre-crisis levels yet.
Although the Belgian employment situation came through the crisis quite well, the employment rate remains
low in European perspective’)

13
economy-wide income that goes to the household sector14. National Accounts provide a very
valuable source of much timelier information on the evolution of aggregate household disposable
income. The evolution of its components, which can illustrate the role of social transfers in the
overall income, is an important complement to the GDP indicator, giving insight to the extent to
which GDP growth benefits households. It’s also an important aspect of the inclusive growth agenda
which is at the heart of the Europe 2020 strategy.
The GHDI decreased slightly for Belgium since 2009, but remained rather stable during the most
recent years. France shows the same evolution, while the decrease is somewhat more pronounced
in The Netherlands. In Germany GHDI clearly increased since 2010. In Greece GHDI dropped
dramatically (as in Cyprus-not shown in figure 3.1a), while it is also substantially under its pre-crisis
level in Spain, Ireland and Portugal.
Changing the perspective from distribution between economic sectors to the distribution of income
between households, the S80/S20 indicator compares the aggregate income of the 20% households
with the highest incomes to the 20% households with the lowest incomes. The GINI coefficient
measures the overall inequality of the income distribution. Both measures indicate that income
inequality is rather low in Belgium compared to other EU-countries. On the S80/S20 ratio, 6 member
states have a lower score than Belgium. Both measures of income inequality also indicate a stable
level in Belgium (Figure 3.1c, GINI in annex 2, figure A2.14).
Still another perspective on the evolution of household incomes is offered by the at-risk-of-poverty
threshold. The at-risk-of poverty threshold is defined as a percentage of the median equivalent
household disposable income in a country. As such it shows how incomes in the middle of the
income distribution evolve over time, which is both important from the perspective of average living
standards, but also from the economic perspective of the evolution of internal demand. Figure 3.1b
shows that median income, in real terms remained rather stable in Belgium throughout the crisis
period. This is also the case in the neighboring countries, although The Netherlands show a slight
drop in median incomes. In countries like Greece, Portugal, Ireland and Spain15 median incomes
appear to have been seriously affected by the crisis.
Overall, the employment rate and both the share of household income in the economy and its
distribution among households at the micro level have remained stable during the last years, in a
context of stagnating growth and stagnating median household income.
14 Includes also non-profit household serving institutions. The definition of this indicator is as follows: GHDI=
D1 Compensation of employees (received) + B2G-B3G Gross operating surplus and gross mixed income
(received) + D4 Property income (received) - D4 Property income (paid) + D7 Other current transfers
(received) - D7 Other current transfers (paid) + D62 Social benefits other than social transfers in kind
(received) - D62 Social benefits other than social transfers in kind (paid) + D61 Social contributions (received)
- D61 Social contributions (paid) - D5 Current taxes on income, wealth, etc. (paid)
15 For Spain there is a break in the series between 2012 and 2013

14
Figure 3.1: Indicators of the evolution of household income, Belgium and selection of countries
Figure 3.1a Real gross disposable household income
Figure 3.1b: Median equivalent household income
Figure 3.1c: Income quintile ratio (S80/S20)
Note figure 3.1b,c: break in series for Spain between 2011-2012. Data refer to income yearsSource: Eurostat, AMECO (own calculations)
60
70
80
90
100
110
120
130
2004 2005 2006 2007 2008 2009 2010 2011 2012 2013
EU28
Belgium
Germany
Greece
Spain
France
Netherlands
60
70
80
90
100
110
120
2004 2005 2006 2007 2008 2009 2010 2011 2012
Belgium
Germany
Greece
Spain
France
Netherlands
60
70
80
90
100
110
120
130
140
2004 2005 2006 2007 2008 2009 2010 2011 2012
EU27
Belgium
Germany
Greece
Spain
France
Netherlands
15
Indicators on poverty and social exclusion 3.2
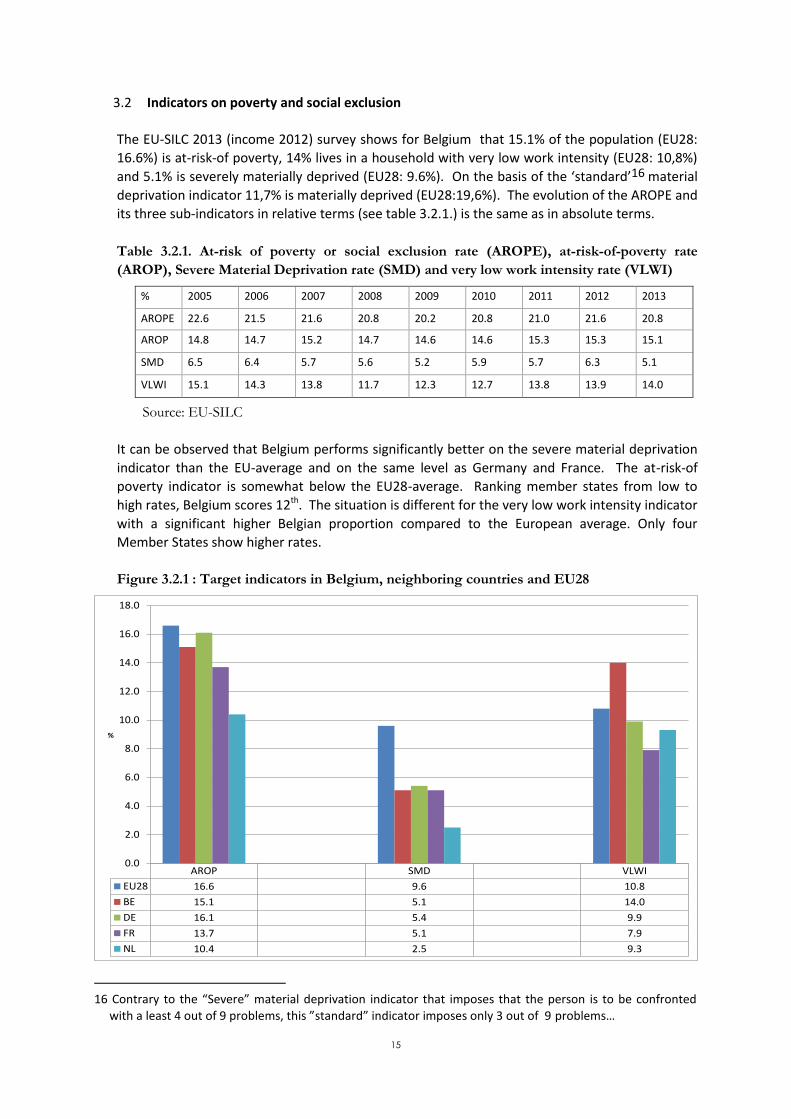
The EU-SILC 2013 (income 2012) survey shows for Belgium that 15.1% of the population (EU28:
16.6%) is at-risk-of poverty, 14% lives in a household with very low work intensity (EU28: 10,8%)
and 5.1% is severely materially deprived (EU28: 9.6%). On the basis of the ‘standard’16 material
deprivation indicator 11,7% is materially deprived (EU28:19,6%). The evolution of the AROPE and
its three sub-indicators in relative terms (see table 3.2.1.) is the same as in absolute terms.
Table 3.2.1. At-risk of poverty or social exclusion rate (AROPE), at-risk-of-poverty rate
(AROP), Severe Material Deprivation rate (SMD) and very low work intensity rate (VLWI)
% 2005 2006 2007 2008 2009 2010 2011 2012 2013
AROPE 22.6 21.5 21.6 20.8 20.2 20.8 21.0 21.6 20.8
AROP 14.8 14.7 15.2 14.7 14.6 14.6 15.3 15.3 15.1
SMD 6.5 6.4 5.7 5.6 5.2 5.9 5.7 6.3 5.1
VLWI 15.1 14.3 13.8 11.7 12.3 12.7 13.8 13.9 14.0
Source: EU-SILC
It can be observed that Belgium performs significantly better on the severe material deprivation
indicator than the EU-average and on the same level as Germany and France. The at-risk-of
poverty indicator is somewhat below the EU28-average. Ranking member states from low to
high rates, Belgium scores 12th. The situation is different for the very low work intensity indicator
with a significant higher Belgian proportion compared to the European average. Only four
Member States show higher rates.
Figure 3.2.1 : Target indicators in Belgium, neighboring countries and EU28
16 Contrary to the “Severe” material deprivation indicator that imposes that the person is to be confronted
with a least 4 out of 9 problems, this ”standard” indicator imposes only 3 out of 9 problems…
AROP SMD VLWI
EU28 16.6 9.6 10.8
BE 15.1 5.1 14.0
DE 16.1 5.4 9.9
FR 13.7 5.1 7.9
NL 10.4 2.5 9.3
0.0
2.0
4.0
6.0
8.0
10.0
12.0
14.0
16.0
18.0
%

16
Source: EU-SILC 2013, Eurostat
The slight increase in AROPE since 2009 is mainly situated among the working age population. The
initial increase among children seems to have stabilized during the last two years. Among the 65+
population there is a slight decrease of the number of people at-risk-of-poverty or social exclusion.
In relative terms (percentages) this decrease is more pronounced (see part on pensions below). The
slight downward evolution in the most recent 2012-2013 data is situated among all age
categories(figure 3.2.2.).
Figure 3.2.2 : At-risk-of poverty or social exclusion, total and by age, Belgium (absolute number x1000)
Source: EU-SILC, EUROSTAT
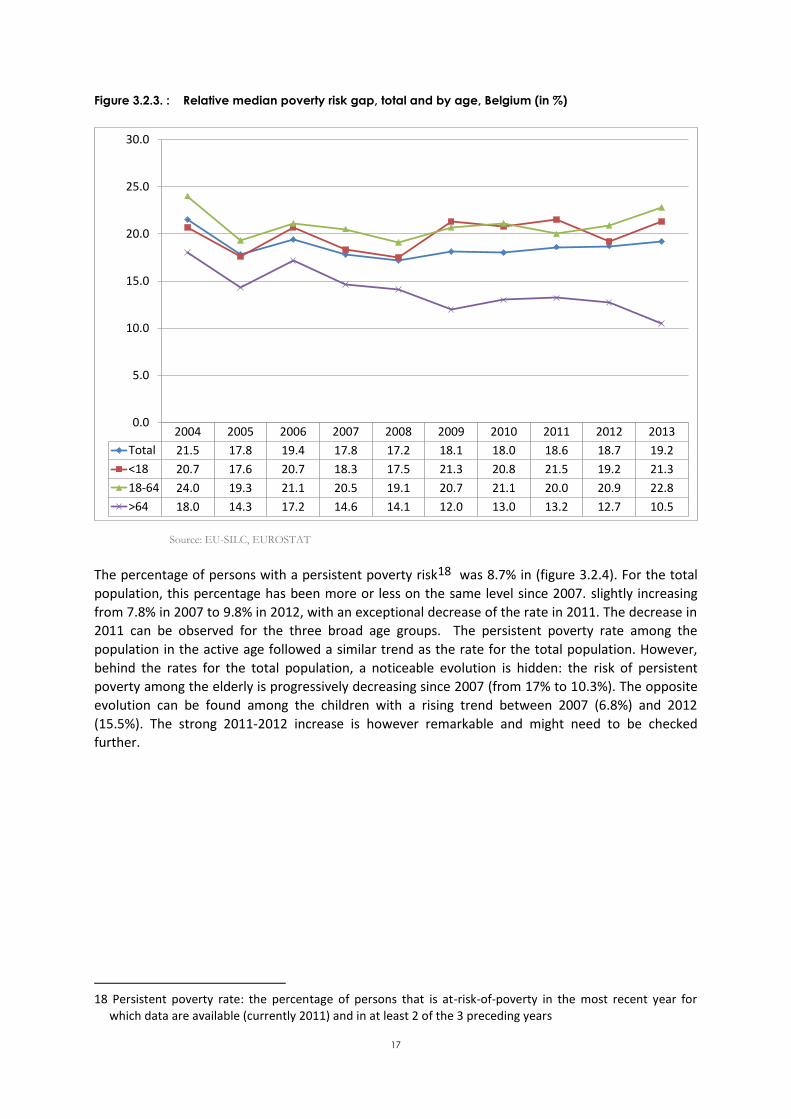
The median at-risk-of-poverty gap17, which indicates how far people at-risk-of-poverty are below the
poverty line, has grown very slightly since 2008 (17.2% in 2008 and 19,2% in 2013). The poverty risk
gap became larger among children and the population in the active age whereas the gap decreased
significantly among the elderly to reach a minimum over the period 2004-2013 (Figure 3.2.3.).
17 The difference between the median income of persons having an income that is below the at-risk-of-poverty
threshold and the at-risk-of-poverty threshold, as a percentage of the at-risk-of-poverty threshold.
2004 2005 2006 2007 2008 2009 2010 2011 2012 2013
total 2257 2338 2247 2261 2194 2145 2235 2271 2356 2286
<18 519 553 479 486 480 457 526 530 524 506
18-64 1.377 1.410 1.345 1.357 1.325 1.293 1.346 1.362 1.451 1.423
>65 361 375 423 418 389 396 364 379 381 356
0
500
1000
1500
2000
2500
17
Figure 3.2.3. : Relative median poverty risk gap, total and by age, Belgium (in %)
Source: EU-SILC, EUROSTAT
The percentage of persons with a persistent poverty risk18 was 8.7% in (figure 3.2.4). For the total
population, this percentage has been more or less on the same level since 2007. slightly increasing
from 7.8% in 2007 to 9.8% in 2012, with an exceptional decrease of the rate in 2011. The decrease in
2011 can be observed for the three broad age groups. The persistent poverty rate among the
population in the active age followed a similar trend as the rate for the total population. However,
behind the rates for the total population, a noticeable evolution is hidden: the risk of persistent
poverty among the elderly is progressively decreasing since 2007 (from 17% to 10.3%). The opposite
evolution can be found among the children with a rising trend between 2007 (6.8%) and 2012
(15.5%). The strong 2011-2012 increase is however remarkable and might need to be checked
further.
18 Persistent poverty rate: the percentage of persons that is at-risk-of-poverty in the most recent year for
which data are available (currently 2011) and in at least 2 of the 3 preceding years
2004 2005 2006 2007 2008 2009 2010 2011 2012 2013
Total 21.5 17.8 19.4 17.8 17.2 18.1 18.0 18.6 18.7 19.2
<18 20.7 17.6 20.7 18.3 17.5 21.3 20.8 21.5 19.2 21.3
18-64 24.0 19.3 21.1 20.5 19.1 20.7 21.1 20.0 20.9 22.8
>64 18.0 14.3 17.2 14.6 14.1 12.0 13.0 13.2 12.7 10.5
0.0
5.0
10.0
15.0
20.0
25.0
30.0

18
Figure 3.2.4. :Persistent poverty rate, total and by age, Belgium (in %)
Source: EU-SILC, EUROSTAT
The indicators above point to divergent poverty trends between the elderly population and younger age categories. However, divergent trends can also be found within the working age category. It is particularly worrying that poverty rates have increased specifically in categories that were already at higher risk of poverty. This is clearly illustrated by the evolution of the poverty risk by educational level (figure 3.2.5.). Differences in poverty risk between the educational level have increase sharply between 2005 and 2013. Poverty rates for persons with a low educational attainment increased from 18.7% in 2005 to 27.3% in 2013. The difference in poverty rates between persons with a low and a high educational attainment increased from 14 percentage points to 20 percentage points, pointing to a growing divide within the population at active age. Further in this note additional trends confirming this finding are presented.
2007 2008 2009 2010 2011 2012 2013
total 7.8 9.0 9.2 9.3 8.0 9.9 8.7
<18 6.8 9.1 9.7 11.6 9.5 14.7 9.1
18-64 5.6 6.9 7.0 7.1 6.2 8.1 8.1
>65 17.0 15.9 15.5 15.1 13.0 11.8 10.3
0.0
2.0
4.0
6.0
8.0
10.0
12.0
14.0
16.0
18.0

19
Figure 3.2.5.: At-risk-of-poverty rate by level of education, (18-64) Belgium
Source: EU-SILC, Eurostat
The global percentages for Belgium as a whole hide important differences between the various
regions and population categories. On the basis of EU-SILC 2011 the risk of poverty and/or social
exclusion amounted to 40% in Brussels, 25% in Wallonia and 15% in Flanders19. Next to large
differences in the levels of poverty or social exclusion, there are also differences in the composition
of the population at risk, e.g. in Flanders the share of elderly is higher than in the other Regions,
while in Wallonia the relative risk of younger age categories is higher. Notwithstanding these very
marked differences, there are also similarities in the structural challenges in the three regions, as
indicated in an analysis on child poverty by Vandenbroucke and Vinck (2013)20. The ‘administrative
VLWI’ indicator presented in this note points in the same direction (see box 6).
19 Due to the unavailability of 2012/2013 data on the Regional level when drafting this note, use is made of
figures that were published earlier- see introduction. Although no official Regional figures are published by
Statistics Belgium, the 2013 EU-SILC quality report indicates an AROPE-rate of 40% for Brussels (95% CI:
34,2-46,8), 15,4% in Flanders(95% CI:13,4-17,4) and 24,2% in Wallonia (95% CI: 20,9-27,5).(Statistics
Belgium, 2014) : *The 2013 EU-SILC quality-report
(http://statbel.fgov.be/nl/binaries/BE_QualityReport_SILC2013_tcm325-261626.pdf)
20 Vandenbroucke, F. & Vinck, J. (2013), ‘Child Poverty Risks in Belgium, Wallonia, Flanders: Accounting for a Worrying Performance’, in P. Maystadt, E. Cantillon, L. Denayer, P. Pestieau, B. Van der Linden, M. Cattelain (eds.), Le modèle social belge : quel avenir ? Presses interuniversitaires de Charleroi ‘The Belgian welfare state is characterized by dual polarization. Looked at from a household perspective, the gap between the haves and the have not’s is exceptionally large, both with regard to labour market participation and with regard to the consequences of labour market participation for poverty. On the one hand, many children live in households that are very work-poor; on the other hand, the financial poverty risk for children in very work-poor households is high. At first sight, one might think that this pattern reflects ‘haves’ in one region and ‘have not’s in another region; but the picture is more complicated, with a similar pattern of polarization within Wallonia, and high
2005 2006 2007 2008 2009 2010 2011 2012 2013
low 18.7 18.8 19.9 20.6 22.2 22.7 25.5 26.3 27.3
middle 11.1 11.0 11.5 10.9 9.8 9.8 11.5 11.3 11.4
high 4.4 5.6 5.7 5.3 5.2 5.2 6.0 7.1 7.2
0.0
5.0
10.0
15.0
20.0
25.0
30.0
20
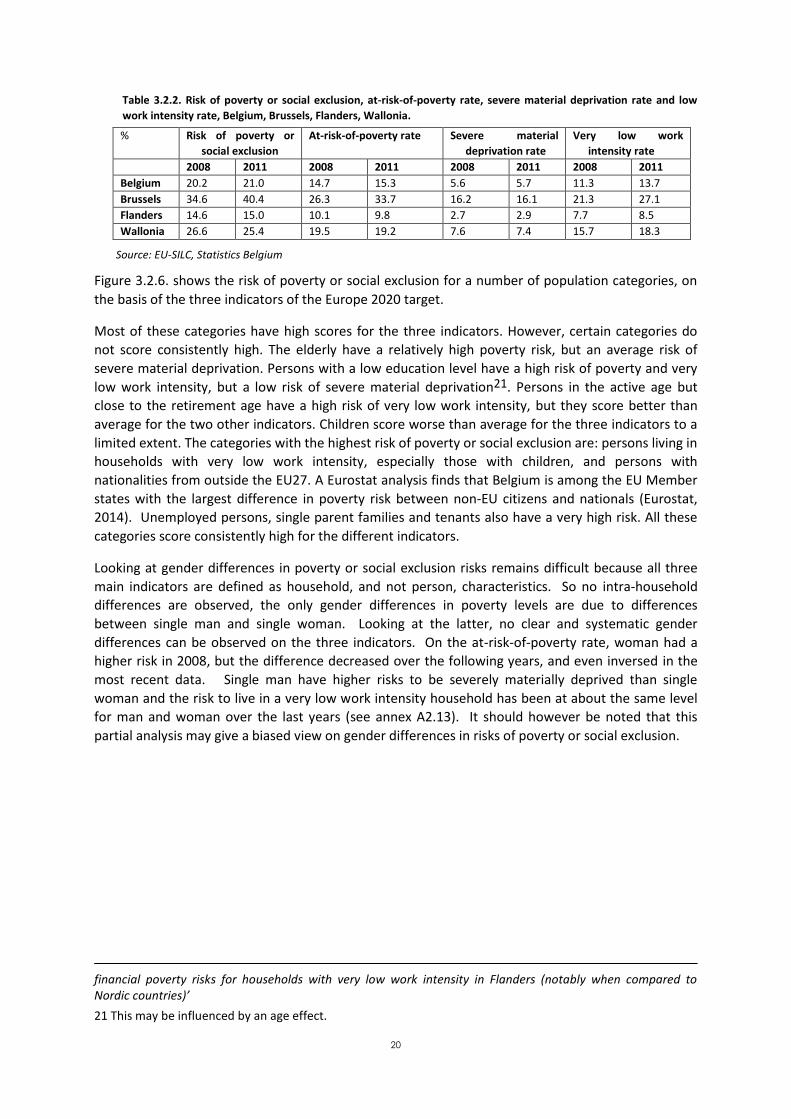
Table 3.2.2. Risk of poverty or social exclusion, at-risk-of-poverty rate, severe material deprivation rate and low
work intensity rate, Belgium, Brussels, Flanders, Wallonia.
% Risk of poverty or
social exclusion
At-risk-of-poverty rate Severe material
deprivation rate
Very low work
intensity rate
2008 2011 2008 2011 2008 2011 2008 2011
Belgium 20.2 21.0 14.7 15.3 5.6 5.7 11.3 13.7
Brussels 34.6 40.4 26.3 33.7 16.2 16.1 21.3 27.1
Flanders 14.6 15.0 10.1 9.8 2.7 2.9 7.7 8.5
Wallonia 26.6 25.4 19.5 19.2 7.6 7.4 15.7 18.3
Source: EU-SILC, Statistics Belgium
Figure 3.2.6. shows the risk of poverty or social exclusion for a number of population categories, on
the basis of the three indicators of the Europe 2020 target.
Most of these categories have high scores for the three indicators. However, certain categories do
not score consistently high. The elderly have a relatively high poverty risk, but an average risk of
severe material deprivation. Persons with a low education level have a high risk of poverty and very
low work intensity, but a low risk of severe material deprivation21. Persons in the active age but
close to the retirement age have a high risk of very low work intensity, but they score better than
average for the two other indicators. Children score worse than average for the three indicators to a
limited extent. The categories with the highest risk of poverty or social exclusion are: persons living in
households with very low work intensity, especially those with children, and persons with
nationalities from outside the EU27. A Eurostat analysis finds that Belgium is among the EU Member
states with the largest difference in poverty risk between non-EU citizens and nationals (Eurostat,
2014). Unemployed persons, single parent families and tenants also have a very high risk. All these
categories score consistently high for the different indicators.
Looking at gender differences in poverty or social exclusion risks remains difficult because all three
main indicators are defined as household, and not person, characteristics. So no intra-household
differences are observed, the only gender differences in poverty levels are due to differences
between single man and single woman. Looking at the latter, no clear and systematic gender
differences can be observed on the three indicators. On the at-risk-of-poverty rate, woman had a
higher risk in 2008, but the difference decreased over the following years, and even inversed in the
most recent data. Single man have higher risks to be severely materially deprived than single
woman and the risk to live in a very low work intensity household has been at about the same level
for man and woman over the last years (see annex A2.13). It should however be noted that this
partial analysis may give a biased view on gender differences in risks of poverty or social exclusion.
financial poverty risks for households with very low work intensity in Flanders (notably when compared to Nordic countries)’
21 This may be influenced by an age effect.

21
Figure 3.2.6. : Incidence of poverty or social exclusion by high risk and policy relevant social categories, Belgium, 2013
Source: EU-SILC, Eurostat
totalunempl
oyed
VLWI,no
child.
VLWI,withchild.
singleparent
loweducati
on
nonEU28*
tenant elderly childrensingle<65
age55/59-
64
otherinactive
AROP 15.1 46.4 48.2 71.5 34.2 25.4 59.2 34.6 18.4 17.2 26.4 12.1 29.2
SMD 5.1 23.2 16.1 8.5 21.1 15.6 5.5 5.5 15.8 3.8 10.2
VLWI 14.0 65.4 41.1 30.5 43.7 32.2 0.0 14.0 0.0 19.3 34.5
0.0
10.0
20.0
30.0
40.0
50.0
60.0
70.0
80.0

22
Follow-up of the policy priorities in the context of the 4 | National Reform Programme and the National Social Report
Social Protection 4.1
The number of people with an unemployment allowance decreased during the previous years. The
number of persons with an invalidity allowance on the other hand increased steadily during the last
decade. This increase can be partially explained by demographic and labour market evolutions: an
ageing population and the increased female labour market participation in combination with the
increased pensionable age for woman. Furthermore there are increases in specific diseases that play
a role, in particular mental disorders. The number of social assistance beneficiaries also increased
steadily over the last decade, with relatively strong increases in 2009 and 2010 and again in 2014
(see figure in A2.10 in annex 2). The number of social assistance beneficiaries increased stronger
among young people (SPP Intégration Sociale, 2015).
In 2012, social protection expenditure amounted in Belgium to 29.4% of GDP, which is about 1
percent above the EU28-average (28.3%) and slightly higher than the average for the Euro area.
The evolution of social benefits expenditure kept in line with the European evolution, with a steep
increase of the expenditure level in percentage of GDP as from 2007, due to the increase of the
volume of benefits and the lesser or negative growth of GDP. Over the period 2008-2012, the
expenditure level in percentage of GDP remained above the EU28 average and was very similar to
the expenditure rate of the Euro area (figure 4.1.1.)
Figure 4.1.1 Social benefits expenditure as % of GDP
Source: ESSPROS, Eurostat
2003 2004 2005 2006 2007 2008 2009 2010 2011 2012
EU28 25,6 28,3 28,2 27,9 28,3
Euro area 26,5 26,4 26,4 26,1 25,6 26,3 29,0 29,0 28,7 29,1
Belgium 26,3 26,3 26,2 25,9 25,5 26,7 29,1 28,6 29,0 29,4
23
24
25
26
27
28
29
30
23
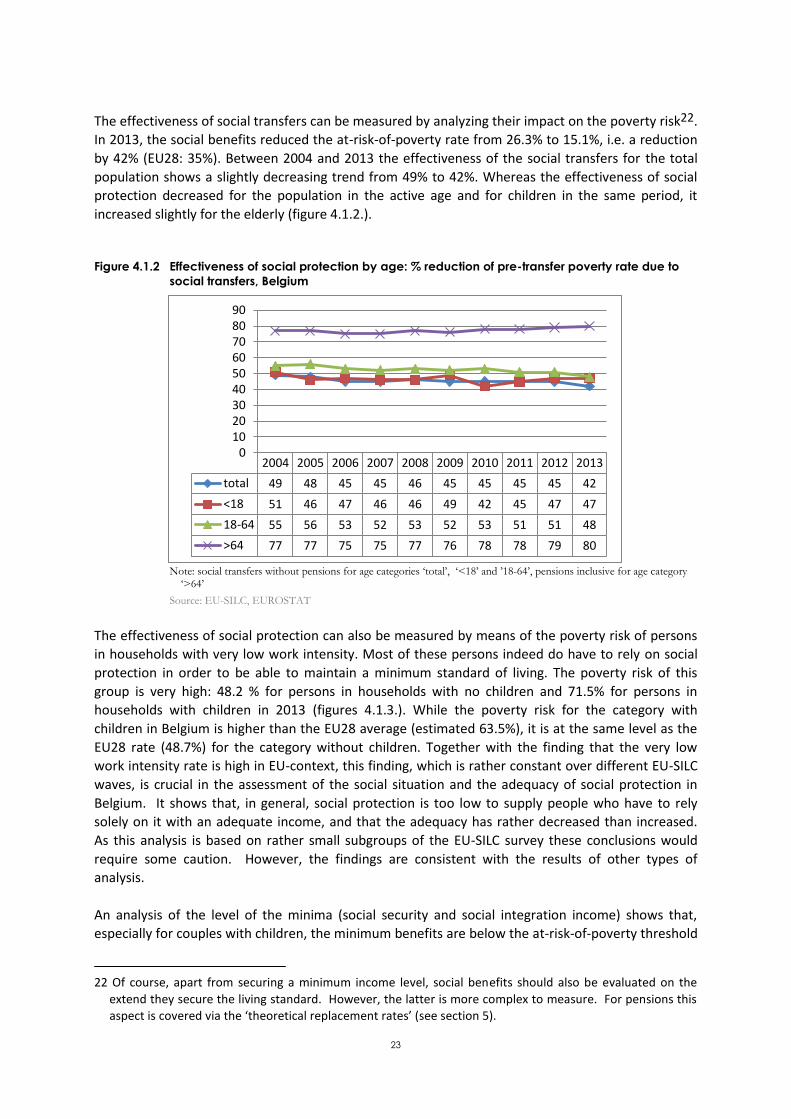
The effectiveness of social transfers can be measured by analyzing their impact on the poverty risk22.
In 2013, the social benefits reduced the at-risk-of-poverty rate from 26.3% to 15.1%, i.e. a reduction
by 42% (EU28: 35%). Between 2004 and 2013 the effectiveness of the social transfers for the total
population shows a slightly decreasing trend from 49% to 42%. Whereas the effectiveness of social
protection decreased for the population in the active age and for children in the same period, it
increased slightly for the elderly (figure 4.1.2.).
Figure 4.1.2 Effectiveness of social protection by age: % reduction of pre-transfer poverty rate due to
social transfers, Belgium
Note: social transfers without pensions for age categories ‘total’, ‘<18’ and ’18-64’, pensions inclusive for age category
‘>64’
Source: EU-SILC, EUROSTAT
The effectiveness of social protection can also be measured by means of the poverty risk of persons
in households with very low work intensity. Most of these persons indeed do have to rely on social
protection in order to be able to maintain a minimum standard of living. The poverty risk of this
group is very high: 48.2 % for persons in households with no children and 71.5% for persons in
households with children in 2013 (figures 4.1.3.). While the poverty risk for the category with
children in Belgium is higher than the EU28 average (estimated 63.5%), it is at the same level as the
EU28 rate (48.7%) for the category without children. Together with the finding that the very low
work intensity rate is high in EU-context, this finding, which is rather constant over different EU-SILC
waves, is crucial in the assessment of the social situation and the adequacy of social protection in
Belgium. It shows that, in general, social protection is too low to supply people who have to rely
solely on it with an adequate income, and that the adequacy has rather decreased than increased.
As this analysis is based on rather small subgroups of the EU-SILC survey these conclusions would
require some caution. However, the findings are consistent with the results of other types of
analysis.
An analysis of the level of the minima (social security and social integration income) shows that,
especially for couples with children, the minimum benefits are below the at-risk-of-poverty threshold
22 Of course, apart from securing a minimum income level, social benefits should also be evaluated on the
extend they secure the living standard. However, the latter is more complex to measure. For pensions this
aspect is covered via the ‘theoretical replacement rates’ (see section 5).
2004 2005 2006 2007 2008 2009 2010 2011 2012 2013
total 49 48 45 45 46 45 45 45 45 42
<18 51 46 47 46 46 49 42 45 47 47
18-64 55 56 53 52 53 52 53 51 51 48
>64 77 77 75 75 77 76 78 78 79 80
0102030405060708090

24
(annex 2, table A2.1). Invalidity benefits and full pensions for single persons are above the at-risk-of-
poverty threshold. Some minima, such as the minimum pensions for self-employed persons and the
income guarantee for the elderly have been increased significantly during the last years.
Academic research, on the basis of typical cases, also supports the conclusion on the decreasing
adequacy of social protection for low work intensity households, consistent with the results from
survey based indicators (see box 2).
Figure 4.1.3 At-risk-of-poverty rate for population in very low work intensity households, total, with and
without children, Belgium (in %)
Source: EU-SILC, EUROSTAT
Box 2 :
The Glass Ceiling of the Active Welfare State
Cantillon, et. al. (2014) analyse on the basis of a set of typical cases the evolution of minimum wage,
median household income and a set of social benefits and the interaction between these different
aspects of the Belgian welfare state. They start their analysis with the findings that (1) gross
minimum wages are, especially for families with several children, insufficient as sole income in the
family, and (2) gross minimum wages didn’t keep up with the increase of median household income,
especially in the years before the crisis. As the evolution of social benefits is necessarily bound to
the level of the minimum wage, the same applies for these benefits. The policy efforts required to
bring incomes of low wage households or households depending on benefits up to the level of the
at-risk-of-poverty threshold, thus substantially increased in the pre-crisis years. In a following step
they show that the lagging behind of gross minimum wages didn’t result in the same situation for
the net disposable income of households living on a minimum wage, due to selective reductions of
taxes and selective increases in child allowances. The net disposable income of work-poor
households however did lag behind overall income developments in a number of cases, and policy
failed in lifting the income of poor unemployed people up to the at-risk-of-poverty threshold. At
the same time the gains of taking up a job, coming from unemployment, remained in most cases at
about the same level. Compensating for necessary costs (eg. Housing, utilities, education, transport)
was another type of policy that was used. Together with tax reductions, increases in child
allowances and specific selective increases of some benefits, these policy measures enabled low
work/low income households to make spending capabilities (unlike their disposable income) more
or less keep pace with work rich/higher income households. However, one of the conclusions of
the researchers is that the gap hasn’t been bridged completely and that a ‘prowling, though clear’
2004 2005 2006 2007 2008 2009 2010 2011 2012 2013
VLWI total 49,8 50,9 56,3 55,3 54,7 57,6 55,4 62,9 60,4 60,7
VLWI without children 37,0 32,3 42,7 42,1 39,7 40,5 37,9 47,8 44,8 48,2
VLWI with children 61,7 68,8 70,2 70 71,9 75,2 71,7 74,8 73,9 71,5
0,0
10,0
20,0
30,0
40,0
50,0
60,0
70,0
80,0

25
dualisation process is visible between the income of work poor households depending on
unemployment allowances and work rich households. Structural pressures on low schooled, low
productivity labour are key drivers of this evolution, with far reaching implications for social
policies.
Biannual report on social protection and poverty
The Combat poverty, insecurity and social exclusion service has published in December 2013 a
report about social protection and poverty (Combat Poverty Agency, 2013). The report has been
drawn up in collaboration with a wide range of actors: people living in poverty and their own
organisations, support providers from both public and private services, representatives of the social
partners, health insurance funds, administrations, public social security institutions… There were
specific meetings about the social protection for the unemployed, for the ill and disabled, for
pensioners, and for children and their families. In order to compensate for the potential
disadvantages of this thematic and thus fragmented approach, some 30 interviews with people living
in poverty or insecurity were conducted. The interviews clearly indicate that in general, these people
tend to be confronted with multiple problems simultaneously; that poorly functioning social
protection in a given area weakens protective mechanisms in other areas; that periods of changeover
from one status to another are times at which the social protection may be threatened.
Child poverty 4.2
We already pointed out that the number of children living in situations of poverty or social exclusion
seems to have stabilized and even decreased somewhat over the most recent years, after earlier
increases. Figure 4.2.1. shows that this decrease occurred on all three dimensions of the Europe 2020
target: poverty risk, severe material deprivation and very low work intensity. The decrease of the
number of children in households with low work intensity is most noticeable, given that the indicator
still increased by more than half between 2008 and 2011. Another remarkable evolution is the
significant decrease (-33%) of the children living in households facing severe material deprivation
between 2012 and 2013, which might need further research.
Figure 4.2.1 Poverty or social exclusion among children (0-17), Belgium (absolute number x 1000)
Source: EU-SILC, EUROSTAT
2004 2005 2006 2007 2008 2009 2010 2011 2012 2013
AROPE 519 553 479 486 480 457 526 530 524 506
AROP 363 421 344 381 386 371 413 424 397 396
SMD 130 197 211 157 165 146 175 187 190 127
VLWI 314 312 292 275 201 246 272 317 298 281
0
100
200
300
400
500
600

26
Depending on the age category, about 20-25% of all children are at risk of poverty or social
exclusion23. The risk of poverty or social exclusion is the highest in the age category 12-17 (25.2%).
This is remarkable given the fact that in 2009 this age category still had the lowest risk of poverty or
social exclusion. Whereas the AROPE rate of the oldest age category continued to rise since 2009, the
other age groups experienced a decrease of the risk on poverty or social exclusion during the last
year(s). In the youngest age category (0-5), the risk in 2013 was 20.8% compared to 19.8% for the age
category 6-11 (figure 4.2.2. The risk for all three age categories is below the EU27 level.
Figure 4.2.2 Poverty or social exclusion of children by age, Belgium (in %)
Source : EU-SILC, EUROSTAT
In figures 3.2.3 and 3.2.4, it was shown that the poverty gap as well as the risk of persistent poverty
has increased for children between 2012 and 2013 (2011/2012 for persistent poverty). Despite the
recent increase, the median poverty gap remained relatively constant between 2009 (21.3%) and
2013 (21.3%). The poverty gap for children in 2013 was wider than the poverty gap for the elderly
(10.5%) but slightly smaller than the poverty gap for the population in the active age (22.8%). The
persistent poverty rate among children increased significantly between 2011 (9.5%) and 2012
(15.5%). This increase resulted in the highest persistent poverty rate compared with the population
in the active age (8.2%) and the elderly (11.3%). Further research into the cause of the sharp
increase might be useful (see Box 3).
Box 3 : Putting Child poverty higher on the agenda. An overview of figures.
Guio et al. (2014) give in their overview of child poverty in Belgium a number of regional figures based on EU-SILC
2011. As for poverty in general, the differences in poverty levels between the regions are substantial. About one in
four children in Wallonia live below the poverty threshold, four in ten in Brussels and one in ten in Flanders. Both
in Flanders and Wallonia child poverty is characterized by high poverty risks for low work intensity households with
children and low poverty risks for households with high work intensity compared with the EU level. Wallonia has
however a substantial higher level of low work intensity than Flanders.
Looking at Material Deprivation the researchers find that 39% of the children in Brussels lacks at least three out of
nine items, 22% in Wallonia and 12% in Flanders.
23 Due to relatively small sample sizes for breakdowns by child age groups, some caution is needed in the
interpretation of the relative levels and the evolution.
2004 2005 2006 2007 2008 2009 2010 2011 2012 2013
0-5 23,2 26,0 19,4 22,2 20,4 22,1 25,2 25,4 22,0 20,8
6-11 21,7 21,3 22,6 19,5 19,1 19,6 22,8 21,3 22,1 19,8
12-17 23,2 23,9 22,1 22,9 24,1 19,5 21,5 22,8 24,5 25,2
0,0
5,0
10,0
15,0
20,0
25,0
30,0

27
The percentage of early school leavers slightly decreased from 12.3% in 2011 over 12% in 2012 to
11% in 2013. This indicator depicts the number of young people (age 18-24) with a weak labour
market position, but is also informative for the performance of the education system. Belgium
scores somewhat better than the EU28 average (11,9%), but 17 countries do better. The percentage
of young people (18-24) not in employment or education (NEET) was 16,0% in 2013, which is also
somewhat below the EU28 number (17,0%). The figures increased however by 1 pp. compared to
2012 and by 2,7 pp. compared to 2008. The different evolution of both indicators can be explained
by the increased youth unemployment rate.
The PISA 2012 results (with a focus on mathematical literacy) confirm earlier results on the
educational performance of Belgium and the different Regions (De Meyer et. al., 2014) . Like in the
previous studies, Belgium is one of the few countries that combine a high general performance level
of fifteen-year olds with high coherence between the performance and the social-economic status of
the pupils, and consequently with a high degree of social inequality. The study further again
confirms that Belgium is one of the weakest perfomers regarding pupils with a migrant background.
Even after controlling for differences in the socio-economic profile of the population of migrant
pupils, Belgium, and a fortiori Flanders, remain among the worst performers. Recently, the OECD in
its 2015 Economic Survey for Belgium, also puts a focus on the Belgian education system’s
performance regarding children of a migrant background (see box 4).
Box 4 : OECD Economic Survey For Belgium 2015
As mentioned in the recent (February 2015) OECD Economic survey for Belgium, the school achievements (as mirrored in the PISA results) show that, despite some improvement over the past decade, compared to their peers without a migration background, the children of immigrants tend to underperform by a wide margin, and by more than in many other countries. The OECD report mentioned at least 5 facts that can explain this important lower level of achievements for children of immigrants tend :
- Despite recent efforts to promote social diversity in schools, as well in Flanders than in the French
community, school segregation in Belgium stays high, so that disadvantaged students tend to be highly concentrated, which hampers their learning. The children of immigrants are hit hard, both because they are over-represented in disadvantaged schools and because the effect of school disadvantage on learning outcomes tends to be larger than for students with no immigrant background ;
- Early tracking is also a source of the problem. Often, pupils are de facto first selected at the outset of secondary education – when they are 12, an internationally low age – and those perceived as weaker are assigned to a lower, pre-vocational stream. Early selection generally harms students in lower tracks (despite recent attempt to upgrade vocational studies), and in Belgium also reinforces school segregation, since schools often offer just one track. Unsurprisingly, children of immigrants are over-represented in vocational streams, especially in Flanders.
- Belgium stands out for widespread retention practices (36% of 15-year-olds taking part in PISA 2012 reported to have already repeated a grade, the highest proportion in the OECD). In the case of students with an immigrant background, the share rises to 53%. These grade repetitions reinforce inequities and downgrading to lower streams.
- Many students with an immigrant background, don’t speak the language of instruction at home. It is an important barrier to educational achievement. Belgium stands out as one of the few countries where this barrier affects native-born students with foreign-born parents almost as much as foreign-born students.
- A recent Flemish survey shows (but with data limitations) that only 34% of mothers with foreign citizenship are regular users of early childhood education and care services (that tends to pave the way for successful school attainment at later ages), against 73% of Belgian mothers.

28
After a gradual decrease of the infant mortality rate over the period 2001-2011 (from 4.6‰ to
3.4‰), the rate increased to 3.8‰ in 2012, bringing it at the EU28 level and somewhat above the
rate in the neighboring countries.
Housing 4.3
Earlier it was indicated that the-slight- increase in the AROPE rate was mainly situated among the
active population. In section 2 it was indicated that an increase of the AROP rate can be found
among persons with low educational attainment and very low work intensity households. A
breakdown of the evolution of the number of persons living in situations of poverty or social
exclusion according to the housing situation further shows that the increase occurred only among
persons renting their home. Especially among the tenants who rent at reduced prices, the number of
persons living in situations of poverty or social exclusion has recently increased from 46.7% in 2011
to 54.1% in 2013. Among owners, with or without mortgage, the number of persons living in poverty
or social exclusion remains stable (or even decreases slightly)24 (figure 4.3.1). Further analysis of the
indicators shows that the increase of AROPE among tenants is due to an increase of the at-risk of
poverty and very low work intensity rate among the working age population. There is no increase
among elderly tenants. As it is known that tenants have a weaker social profile than owners, the
indicators point to the fact that poverty risks appeared to have increased in very specific population
categories, already confronted with higher poverty risks.
Figure 4.3.1 Risk of poverty or social exclusion by housing tenure, Belgium (in %)
Source: EU-SILC, EUROSTAT
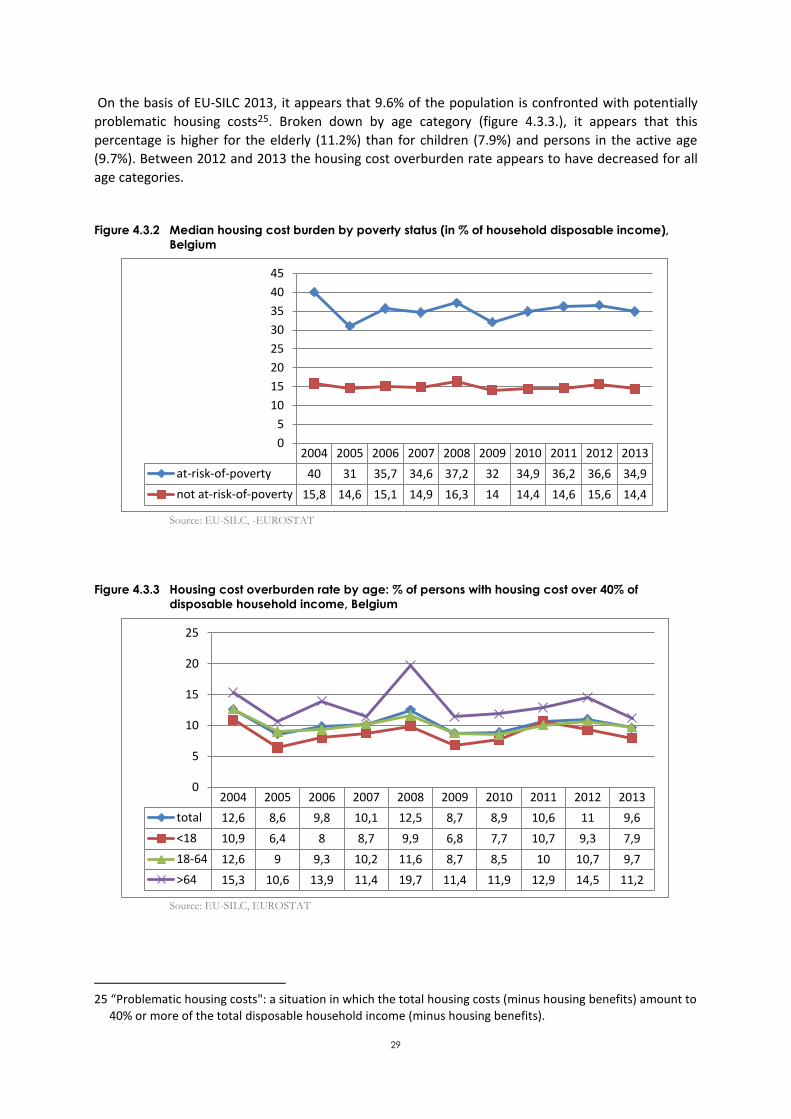
Furthermore, it is relevant to monitor the evolution of the share of the housing costs in the
household budget (figure 4.3.2) by poverty status. For persons below the poverty threshold, this
share remains relatively constant around 35% (34.9% in 2013), while it is close to 15% for persons
above the poverty threshold (14.4% in 2013).
24 The higher risk of poverty or social exclusion for owners without mortgages compared to owners with
mortgages is probably linked with the profile of these categories. Owners without mortgages are mostly
elderly people with lower (pension) incomes.
2004 2005 2006 2007 2008 2009 2010 2011 2012 2013
owner with mortgage 10,1 11,0 9,8 8,6 10,5 8,7 8,9 8,2 8,6 8,0
owner without mortg. 20,1 19,4 20,7 21,7 19,3 19,2 18,4 18,6 18,9 17,0
tenant, market price 39,1 39,5 37,5 38,9 34,1 35,1 37,9 40,5 41,5 40,3
tenant, reduced price 41,3 48,3 45,3 43,2 46,2 44,6 48,1 46,7 51,9 54,1
0,0
10,0
20,0
30,0
40,0
50,0
60,0
29
On the basis of EU-SILC 2013, it appears that 9.6% of the population is confronted with potentially
problematic housing costs25. Broken down by age category (figure 4.3.3.), it appears that this
percentage is higher for the elderly (11.2%) than for children (7.9%) and persons in the active age
(9.7%). Between 2012 and 2013 the housing cost overburden rate appears to have decreased for all
age categories.
Figure 4.3.2 Median housing cost burden by poverty status (in % of household disposable income),
Belgium
Source: EU-SILC, -EUROSTAT
Figure 4.3.3 Housing cost overburden rate by age: % of persons with housing cost over 40% of
disposable household income, Belgium
Source: EU-SILC, EUROSTAT
25 “Problematic housing costs": a situation in which the total housing costs (minus housing benefits) amount to
40% or more of the total disposable household income (minus housing benefits).
2004 2005 2006 2007 2008 2009 2010 2011 2012 2013
at-risk-of-poverty 40 31 35,7 34,6 37,2 32 34,9 36,2 36,6 34,9
not at-risk-of-poverty 15,8 14,6 15,1 14,9 16,3 14 14,4 14,6 15,6 14,4
0
5
10
15
20
25
30
35
40
45
2004 2005 2006 2007 2008 2009 2010 2011 2012 2013
total 12,6 8,6 9,8 10,1 12,5 8,7 8,9 10,6 11 9,6
<18 10,9 6,4 8 8,7 9,9 6,8 7,7 10,7 9,3 7,9
18-64 12,6 9 9,3 10,2 11,6 8,7 8,5 10 10,7 9,7
>64 15,3 10,6 13,9 11,4 19,7 11,4 11,9 12,9 14,5 11,2
0
5
10
15
20
25
30
The number of social housing units for tenants slightly but steadily increased over the years.
However, the population and certainly the number of private households grew faster. The number
of social housing units as a percentage of the total private households thus decreased slightly from
about 6,3% during the mid-00s to 6,1% in 201126. The number of persons on a waiting list for
renting a dwelling at social rate has increased over the recent years27 (see also OECD assessment in
box 5 ).
Box 5
Great Housing research in Flanders recent results on the basis of the Flemish ‘Great Housing Research’ (Groot
Woononderzoek), point to the fact that renting prices in the private rental sector have increased in real terms by 1%
annually between 2005 and 2013 in Flanders (Heylen, 2015). Increases appear to have been stronger for small
housing units (studio’s, rooms), and thus for more vulnerable categories: renters in the lowest income quintile,
households with an unemployed, sick/disabled head of household, and the oldest and youngest age categories.
Rents increased also in the social housing sector by 2% in real terms. Affordability problems increased strongly
according when using the ‘housing quote’ method (% of households with housing costs >30% of household income)
and remained constant according to the ‘rest income’ method (% of households whose remaining income, after
housing costs, falls below a minimum threshold based on reference budgets). Vulnerable groups in terms of housing
affordability are households with an unemployed, sick/disabled head of household, single parent households. In
terms of age, the younger age groups have the highest affordability problems. Affordability has become more
problematic for vulnerable categories between 2005 and 2013 according to the housing quote method, but not
according to the rest-income method.
OECD Economic Survey For Belgium 2015
In its recent Economic Survey for Belgium the OECD also devotes a chapter on ‘mainting an efficient and equitable
housing market’. In this contribution the OECD points to the finding that ‘housing affordability is deteriorating,
especially for vulnerable groups’. Especially for renters, housing affordability deteriorated. The study points to the
fact that the size of the social housing market is small compared to other countries and that waiting lists for social
housing lead to high demand in the lower end of the private rental sector, contributing to affordability problems for
lower-income tenants.
Counting the number of homeless people in Brussels
On November 6th 2014, a an organisation of the Brussels authorities (Steunpunt thuislozenzorg Brussel-La Strada)
organised a count of the number of homeless people in Brussels. It was the third time that such a count was
organised, using a similar methodology. 160 volunteers participated in this count, which took place between 11 pm.
and midnight. The results have recently become available. In total 2603 persons were counted as homeless. This is
a substantial increase compared to the first count in 2010, when 1947 persons were counted.
26 Apart from social housing units for rent operated by social housing societies, municipalities and municipal
welfare services can have housing can supply housing units at reduced prices. Furthermore, Flanders has a
system of housing subsidies for households that have been on a waiting list for a certain time span.
However, these additional housing support pathways are overall relatively marginal.
27 Due to differences in methods of collecting and updating lists, it remains difficult to give an exact figure of
the number of persons on a waiting list over the regions. There could also be double counts of people
registered in different regions. Furthermore, like the social housing society does, one could make a
difference between people who are on a list but who live already in social housing and people who don’t.
With all these remarks in mind, about 180.000 people were registered in 2013 as candidate for a social
dwelling.

31
Active inclusion 4.4
The active inclusion strategy has three components: an adequate minimum income, inclusion into
the labour market and access to high-quality services.
The best indicator for the extent to which a country succeeds in guaranteeing a minimum income is
indeed the poverty risk. Offering (minimal) income protection in case a household has no primary
income (due to social risks), is a key function of social protection systems and of an active inclusion
policy. In that respect, it is relevant to examine the poverty risk in households with very low work
intensity, as was done in section 4.1. It can be assumed that these households depend on benefits
to a large extent. As already mentioned, households with very low work intensity are confronted
with a very high poverty risk, especially when children are involved. It is important to note that the
performance of Belgium on this indicator is worse than the EU-average.
As regards labour market participation (figure 4.4.1), it can be concluded that the general
employment rate remained more or less stable in the period 2009-2013 with rates around 67%
(67.2% in 2013). For the vulnerable target group of people with low education levels, it can be
observed that their employment rate slightly decreased between 2007 (49.5%) and 2013 (46.8%),
which widens the gap with the total active population. This widening gap in the employment rate
between persons with low education level and the total population can be observed for both
Flanders and Wallonia, but not in Brussels (see annex 2) The employment rate of older workers (55-
64 years) moves in the opposite direction: their employment rate gradually increases from 28.1% in
2003 to 41.7% in 2013. The long-term unemployment rate decreased slightly just before the crisis
impacted and increased again slightly since then (3.9% in 2013). Overall, it is noticeable that long-
term unemployment, like very low work intensity, reacts only in a limited way on differing socio-
economic conditions. However, looking at the evolution at the regional level shows that in Brussels
and Wallonia there seems to be a stronger link to the economic cycle (annex 2, figure A2.9).
Figure 4.4.1 Employment rate (20-64), total and specific categories (low education, older workers) and long-term
unemployment rate (15-74), Belgium (in %)
Source: Labour Force Survey, EUROSTAT
2003 2004 2005 2006 2007 2008 2009 2010 2011 2012 2013
LT unempl. rate (15-74) 3,7 4,1 4,4 4,2 3,8 3,3 3,5 4,1 3,5 3,4 3,9
empl. rate low educ. (20-64) 48,4 49,4 48,8 48,8 49,5 49,1 47,7 48,4 47,3 47,1 46,8
employment rate (20-64) 64,7 65,6 66,5 66,5 67,7 68 67,1 67,6 67,3 67,2 67,2
older workers (55-64) 28,1 30 31,8 32 34,4 34,5 35,3 37,3 38,7 39,5 41,7
0
10
20
30
40
50
60
70
80

32
Box 6 : A closer look at persons living in quasi-jobless households on the basis of administrative data Administrative data are a potential rich source of information to complement the EU-SILC based indicator on very low work intensity. A report of the European Social Observatory presents the results of an exploratory analysis of the recently constructed ‘administrative VLWI-indicator’ for the years 2005-2009 2829. Although a substantial analysis would require some further developments of the data and the timeliness, some already interesting results are briefly reflected here. The figure below shows the evolution of the percentage of persons in a very low work intensity household with similar concepts based on two other data-sources: the administrative data of the Datawarehouse Labour Market and Social Protection on the one hand and the Labour Force Survey on the other hand. Although there are some-rather
slight- differences between the three series, the overall trend is the same for the administrative LWI30 than for the two survey-based indicators: after a limited decrease before the crisis, the percentage slightly increases due to the crisis31.
28 Peña-Casas, R., (2014) ,A picture of low work intensity households in Belgium using the Datawarehouse
Labour Market and Social protection, report on request of the Federal Public Service Social Security.
29 This indicator was constructed by HIVA and CeSO, both KULeuven based research centres, in the context of
a project funded by the federal science policy, on behalf of the FPS Social Security and the Crossroads bank
for Social Security. For complete information see :
https://www.bcss.fgov.be/nl/dwh/dwh_page/content/websites/datawarehouse/others/LWI-indicator.html
30 The researchers developed two variants of an LWI indicator. The first variant tries to follow as close a
possible the EU-SILC variable, the second variant tries to exploit as well as possible the possibilities of the
administrative data to operationalize the LWI concept. For the results presented here, the first variant is
used.
31 The differences between the three series are not surprising: although the three figures try to capture the
same phenomenon, the concrete operationalization shows marked differences. The ‘administrative VLWI’
indicator still needs further refinements, especially the treatment of people living in Belgium, but working
for international organisations and the treatment of cross-border workers has to be improved. Now these
categories are considered as not working, leading to an overestimation of the incidence of ‘administrative
VLWI’. Survey results on the other hand can of course be influenced by sampling and measurement
fluctuations.
33
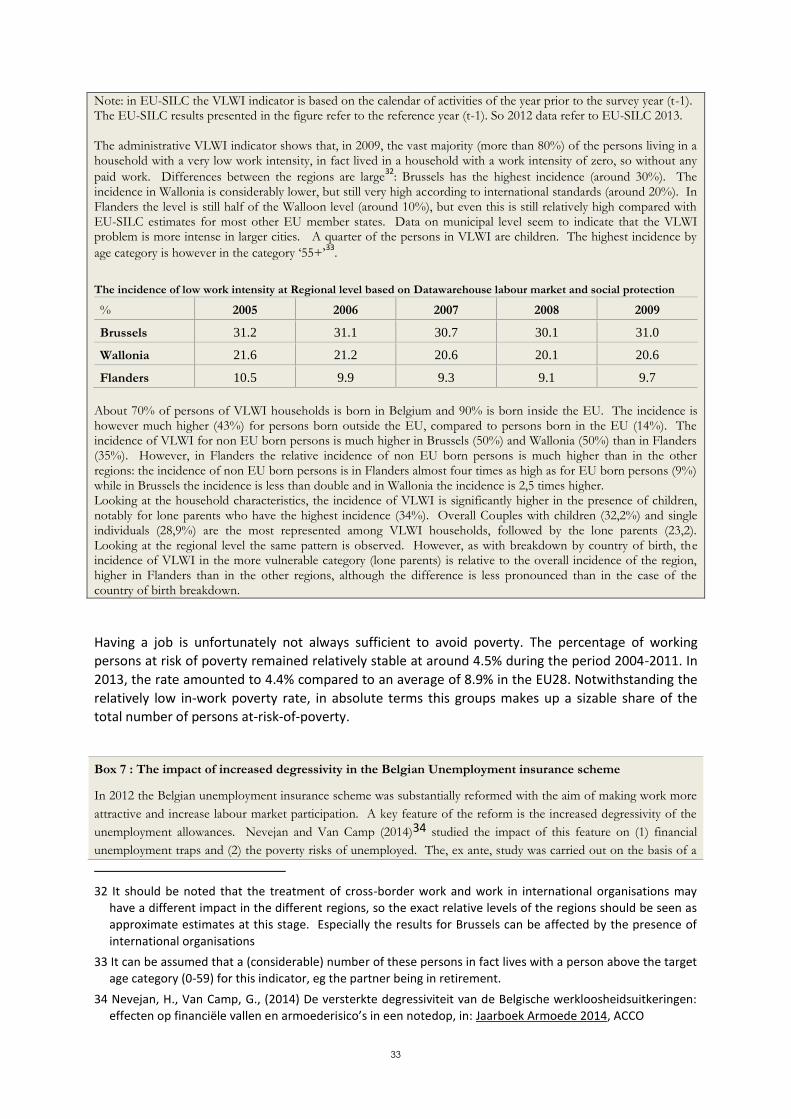
Note: in EU-SILC the VLWI indicator is based on the calendar of activities of the year prior to the survey year (t-1). The EU-SILC results presented in the figure refer to the reference year (t-1). So 2012 data refer to EU-SILC 2013. The administrative VLWI indicator shows that, in 2009, the vast majority (more than 80%) of the persons living in a household with a very low work intensity, in fact lived in a household with a work intensity of zero, so without any
paid work. Differences between the regions are large32
: Brussels has the highest incidence (around 30%). The incidence in Wallonia is considerably lower, but still very high according to international standards (around 20%). In Flanders the level is still half of the Walloon level (around 10%), but even this is still relatively high compared with EU-SILC estimates for most other EU member states. Data on municipal level seem to indicate that the VLWI problem is more intense in larger cities. A quarter of the persons in VLWI are children. The highest incidence by
age category is however in the category ‘55+’33
.
The incidence of low work intensity at Regional level based on Datawarehouse labour market and social protection
% 2005 2006 2007 2008 2009
Brussels 31.2 31.1 30.7 30.1 31.0
Wallonia 21.6 21.2 20.6 20.1 20.6
Flanders 10.5 9.9 9.3 9.1 9.7
About 70% of persons of VLWI households is born in Belgium and 90% is born inside the EU. The incidence is however much higher (43%) for persons born outside the EU, compared to persons born in the EU (14%). The incidence of VLWI for non EU born persons is much higher in Brussels (50%) and Wallonia (50%) than in Flanders (35%). However, in Flanders the relative incidence of non EU born persons is much higher than in the other regions: the incidence of non EU born persons is in Flanders almost four times as high as for EU born persons (9%) while in Brussels the incidence is less than double and in Wallonia the incidence is 2,5 times higher. Looking at the household characteristics, the incidence of VLWI is significantly higher in the presence of children, notably for lone parents who have the highest incidence (34%). Overall Couples with children (32,2%) and single individuals (28,9%) are the most represented among VLWI households, followed by the lone parents (23,2). Looking at the regional level the same pattern is observed. However, as with breakdown by country of birth, the incidence of VLWI in the more vulnerable category (lone parents) is relative to the overall incidence of the region, higher in Flanders than in the other regions, although the difference is less pronounced than in the case of the country of birth breakdown.
Having a job is unfortunately not always sufficient to avoid poverty. The percentage of working
persons at risk of poverty remained relatively stable at around 4.5% during the period 2004-2011. In
2013, the rate amounted to 4.4% compared to an average of 8.9% in the EU28. Notwithstanding the
relatively low in-work poverty rate, in absolute terms this groups makes up a sizable share of the
total number of persons at-risk-of-poverty.
Box 7 : The impact of increased degressivity in the Belgian Unemployment insurance scheme
In 2012 the Belgian unemployment insurance scheme was substantially reformed with the aim of making work more
attractive and increase labour market participation. A key feature of the reform is the increased degressivity of the
unemployment allowances. Nevejan and Van Camp (2014)34 studied the impact of this feature on (1) financial
unemployment traps and (2) the poverty risks of unemployed. The, ex ante, study was carried out on the basis of a
32 It should be noted that the treatment of cross-border work and work in international organisations may
have a different impact in the different regions, so the exact relative levels of the regions should be seen as
approximate estimates at this stage. Especially the results for Brussels can be affected by the presence of
international organisations
33 It can be assumed that a (considerable) number of these persons in fact lives with a person above the target
age category (0-59) for this indicator, eg the partner being in retirement.
34 Nevejan, H., Van Camp, G., (2014) De versterkte degressiviteit van de Belgische werkloosheidsuitkeringen:
effecten op financiële vallen en armoederisico’s in een notedop, in: Jaarboek Armoede 2014, ACCO

34
large sample of administrative data and using the microsimulation model MIMOSIS. It is important to note that the
study does not take into account specific costs resulting from taking up a job (eg. child care).
The study concludes that the reform significantly increased the financial attractiveness of taking up a job for
unemployed. The financial surplus of taking up a job increases more steeply with the duration of the unemployment
spell in the new system than in the old system. The number of unemployed for whom the financial gain of taking up
a job is below 20% of the unemployment allowance is lower under the new system (starting from 19 months of
unemployment) than in the old system. The study notes however that, due to the limited insurance character of the
Belgian unemployment scheme, already under the old system the financial incentives for finding and taking up a job
were substantial.
The comparison of the poverty risk before and after the reform shows the downside of the reform. Poverty risks for
unemployed that don’t take up a job are significantly higher in the new scheme. This finding goes for different
family types, but the increase is most outspoken for single unemployed. Poverty risks of people taking up a part- or
full-time job at the former wage level are considerably below those of full-time unemployed people.
The study notes that the complexity and non-transparency of the new system may hinder its effectiveness and that
labour demand is also a crucial factor. The real employment and poverty impacts of the reform can thus only be
evaluated ex post.
In a study of the Combat Poverty, Insecurity and Social Exclusion Service, these results are further analysed by
Region (Service de lutte contre la pauvreté, la précarité et l’exclusion sociale, 2014). This analysis shows that the
three Regions show the same evolution: as was the case before the reform, the poverty risk increases with the
duration of the unemployment spell, but the increase is stronger after the reform. The Brussels Region has the
highest initial poverty risk, but also the strongest increase. In the Walloon Region the increase in the poverty risk as
a consequence of the reform starts slightly earlier than in Flanders and ends at 38,9% after 61 months.
Participation in life-long learning - by initial educational attainment - is one indicator for the
accessibility of (high quality) services as a component of active inclusion (figure 4.4.2). The indicator
for participation in education or training among the population aged 25 to 64 decreased significantly
between 2004 (8.6%) and 2008 (6.8%), especially among persons with a high initial education level.
Between 2008 and 2011, the participation remained relatively stable. From 2011 the gap with the
EU28 average increased again, mainly due to a rather steep increase in the EU28 figure in 2013. The
difference in participation rate between persons with a high and a low educational level remained at
about 8 pp. during the last years (about 3% for low skilled and about 11% for high skilled).

35
Figure 4.4.2. Participation in life-long learning by educational attainment, Belgium, EU28 (population
25-64) (in %)
Source: Labour Force Survey, ADSEI EUROSTAT
Overindebtedness 4.5
Since a number of years, the information of the Central Register of the National Bank (figure 4.5.1)
shows a continually increasing number of credit arrears. However, in percentage, the level of credit
arrears are relatively stable since 2007. In terms of number of credits, the percentage of credits with
defaults (non-regularised) falls from 5,75% in 2007 to a minimum of 4,1% in the beginning of 2012
before to increase a little bit to 4,6% at the end of 2014. We can see more or less the same evolution
in term of number of borrowers with arrears (from 6,1% in 2007 to 5,1% in 2012, to 5,6% now).
Broken down according to the type of credit, increasing numbers of arrears are especially found for
credit openings that become the type of credit with the most defaults of payment. Also for mortgage
credits, there is a (slighter) increase in the number arrears (+15% between January 2007 and
December 2014). Although the amount of the arrears per person is in 60% of the cases below €5000,
the average amount increased up to €13095 in 2014, which is an increase of 41% since the beginning
of the crisis. This increase in the average amount is mainly situated among mortgage loans (NBB,
2015).
The Central Individual Credit Register does not collect any further details regarding the persons with
arrears. Hence, it is not clear which social reality is hidden behind this increasing number of arrears.
Regarding indicators around the problematic debts based on EU-SILC, the percentage of persons,
whose disposable income falls (further) below the poverty threshold because they have to pay back
consumer credits, remains stable around 5%. The percentage of persons who live in a household with
2005 2006 2007 2008 2009 2010 2011 2012 2013 2014
low educ. 3.1 3.0 3.0 2.9 3.0 3.1 3.1 2.7 2.9 3.1
middle educ 7.3 6.5 6.1 5.9 5.4 5.9 5.6 5.2 5.0 5.6
high educ. 15.3 13.3 12.6 11.6 11.7 11.9 11.9 11.0 11.4 11.8
total 8.3 7.5 7.2 6.8 6.8 7.2 7.1 6.6 6.7 7.2
EU28 9.6 9.5 9.3 9.3 9.3 9.1 8.9 9.0 10.5 10.6
0.0
2.0
4.0
6.0
8.0
10.0
12.0
14.0
16.0
18.0

36
at least two arrears for basic necessities (water, gas, electricity, rent and mortgage) is also relatively
stable 2007 (6.1% in 2007, 7.8% in 2011, 5,2% in 2013)
Figure 4.5.1 Number of borrowers with at least one overdue debt repayment, Belgium
Source: National Bank of Belgium
0
50000
100000
150000
200000
250000
300000
350000
400000
450000
5000002
00
7-0
1
20
07
-07
20
08
-01
20
08
-07
20
09
-01
20
09
-07
20
10
-01
20
10
-07
20
11
-01
20
11
-07
20
12
-01
20
12
-07
20
13
-01
20
13
-07
20
14
-01
20
14
-07
20
14
-12
installment loan
installment sales
leasing
credit opening
mortgage loan
total
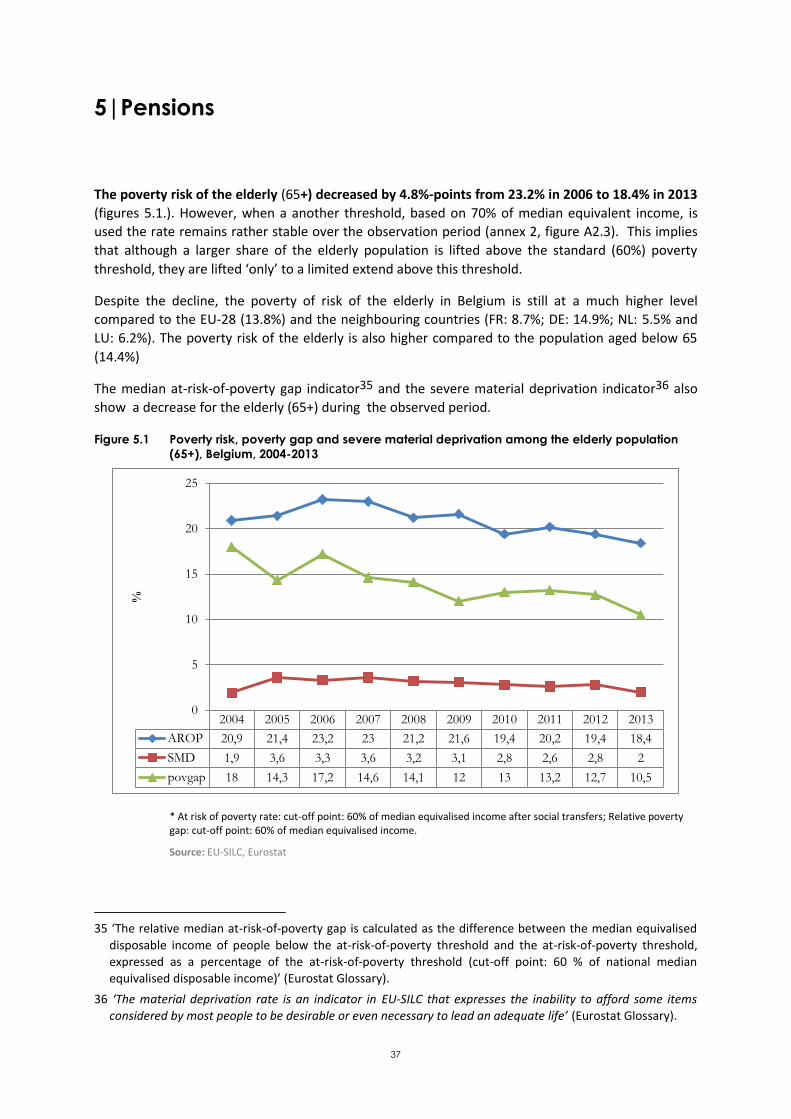
37
5|Pensions
The poverty risk of the elderly (65+) decreased by 4.8%-points from 23.2% in 2006 to 18.4% in 2013
(figures 5.1.). However, when a another threshold, based on 70% of median equivalent income, is
used the rate remains rather stable over the observation period (annex 2, figure A2.3). This implies
that although a larger share of the elderly population is lifted above the standard (60%) poverty
threshold, they are lifted ‘only’ to a limited extend above this threshold.
Despite the decline, the poverty of risk of the elderly in Belgium is still at a much higher level
compared to the EU-28 (13.8%) and the neighbouring countries (FR: 8.7%; DE: 14.9%; NL: 5.5% and
LU: 6.2%). The poverty risk of the elderly is also higher compared to the population aged below 65
(14.4%)
The median at-risk-of-poverty gap indicator35 and the severe material deprivation indicator36 also
show a decrease for the elderly (65+) during the observed period.
Figure 5.1 Poverty risk, poverty gap and severe material deprivation among the elderly population
(65+), Belgium, 2004-2013
* At risk of poverty rate: cut-off point: 60% of median equivalised income after social transfers; Relative poverty gap: cut-off point: 60% of median equivalised income.
Source: EU-SILC, Eurostat
35 ‘The relative median at-risk-of-poverty gap is calculated as the difference between the median equivalised
disposable income of people below the at-risk-of-poverty threshold and the at-risk-of-poverty threshold,
expressed as a percentage of the at-risk-of-poverty threshold (cut-off point: 60 % of national median
equivalised disposable income)’ (Eurostat Glossary).
36 ‘The material deprivation rate is an indicator in EU-SILC that expresses the inability to afford some items
considered by most people to be desirable or even necessary to lead an adequate life’ (Eurostat Glossary).
2004 2005 2006 2007 2008 2009 2010 2011 2012 2013
AROP 20,9 21,4 23,2 23 21,2 21,6 19,4 20,2 19,4 18,4
SMD 1,9 3,6 3,3 3,6 3,2 3,1 2,8 2,6 2,8 2
povgap 18 14,3 17,2 14,6 14,1 12 13 13,2 12,7 10,5
0
5
10
15
20
25
%
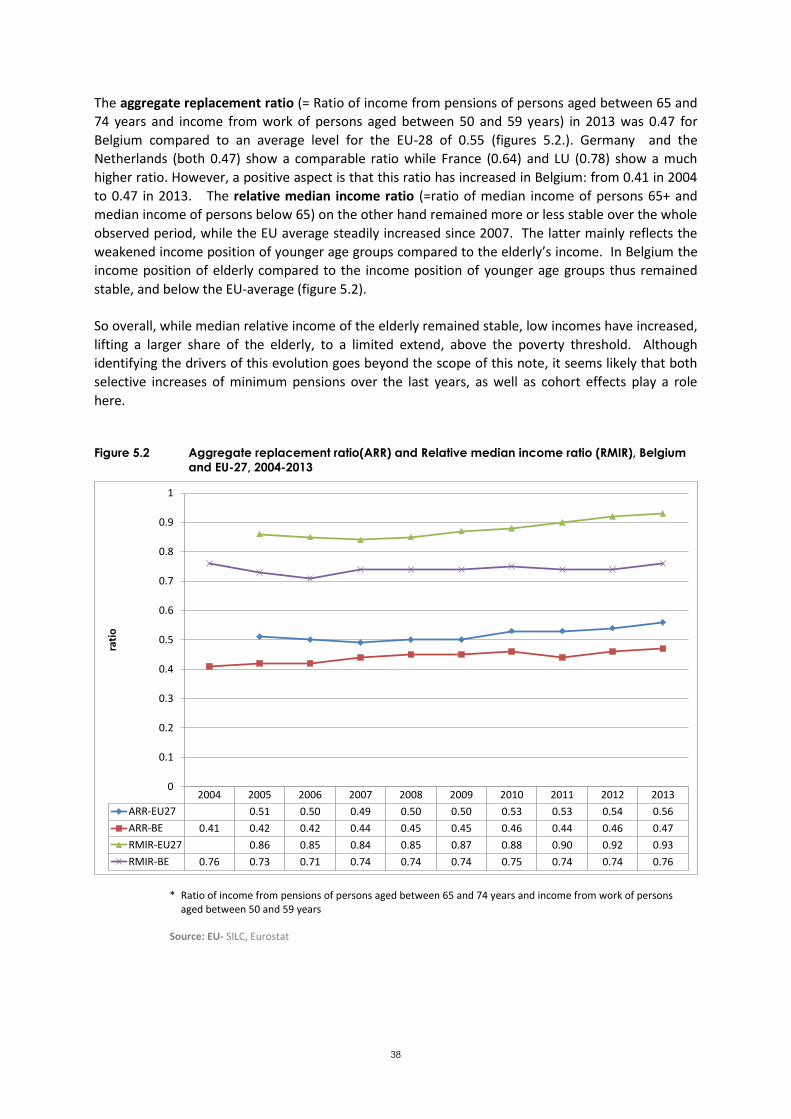
38
The aggregate replacement ratio (= Ratio of income from pensions of persons aged between 65 and
74 years and income from work of persons aged between 50 and 59 years) in 2013 was 0.47 for
Belgium compared to an average level for the EU-28 of 0.55 (figures 5.2.). Germany and the
Netherlands (both 0.47) show a comparable ratio while France (0.64) and LU (0.78) show a much
higher ratio. However, a positive aspect is that this ratio has increased in Belgium: from 0.41 in 2004
to 0.47 in 2013. The relative median income ratio (=ratio of median income of persons 65+ and
median income of persons below 65) on the other hand remained more or less stable over the whole
observed period, while the EU average steadily increased since 2007. The latter mainly reflects the
weakened income position of younger age groups compared to the elderly’s income. In Belgium the
income position of elderly compared to the income position of younger age groups thus remained
stable, and below the EU-average (figure 5.2).
So overall, while median relative income of the elderly remained stable, low incomes have increased,
lifting a larger share of the elderly, to a limited extend, above the poverty threshold. Although
identifying the drivers of this evolution goes beyond the scope of this note, it seems likely that both
selective increases of minimum pensions over the last years, as well as cohort effects play a role
here.
Figure 5.2 Aggregate replacement ratio(ARR) and Relative median income ratio (RMIR), Belgium
and EU-27, 2004-2013
* Ratio of income from pensions of persons aged between 65 and 74 years and income from work of persons aged between 50 and 59 years
Source: EU- SILC, Eurostat
2004 2005 2006 2007 2008 2009 2010 2011 2012 2013
ARR-EU27 0.51 0.50 0.49 0.50 0.50 0.53 0.53 0.54 0.56
ARR-BE 0.41 0.42 0.42 0.44 0.45 0.45 0.46 0.44 0.46 0.47
RMIR-EU27 0.86 0.85 0.84 0.85 0.87 0.88 0.90 0.92 0.93
RMIR-BE 0.76 0.73 0.71 0.74 0.74 0.74 0.75 0.74 0.74 0.76
0
0.1
0.2
0.3
0.4
0.5
0.6
0.7
0.8
0.9
1
rati
o

39
The prospective theoretical replacement rate for Belgium37 shows that, with the current policy
(situation January 2013) and taking into account a number of assumptions, the replacement rate for
a person who retires in 2053 would change to a limited extend (Table 5.1.). For the basic type case
(career of 40 years, average income) the net replacement rate (1st and 2nd pillar) in 2013 amounted
to 78,6%. In 2053, it would amount to 74,7%. It would thus imply a small diminution, which is be
somewhat in contrast with a previous exercise which estimated the change in TRR between 2010 and
2050 to increase from 74 to 76%. This difference in outcomes between the current and the previous
TRR exercise is essentially due to the abandoning of the “bonus pension”. Table 5.1. shows the
results for a number of variants of this basic type case. The table shows e.g. that the current and the
future replacement rate varies widely according to the income level during the professional career.
For low incomes, the replacement rate amounts to 84,3% in 2053, for high incomes it amounts to
54,9% in 2053. The replacement rate after 10 years of retirement amounts to 66,7%. The effect of a
career interruption in the context of child care does not influence the replacement rate. Career
interruptions in other contexts have a slightly more significant influence.
Table 5.1: Current (2013) and prospective theoretical replacement rate
Base-
case:
40year
career,
average
income
level
Low
income
level
High
income
level
10 years
after
retirement
Female
employee with
3 years career
interruption for
care of children
3 year career
interruption due
to unemployment
10 year
absence
of
labour
market
2013 78.6 -* -* -* -* -* -*
2053 74.7 84.3 54.9 66.7 72.7 72.8 62.3
Source: Federal Public Service Social Security
For a correct assessment of the relative prosperity of the elderly, it is also important to take home
ownership into account. However, a concerted European methodology for taking into account the
impact of the so-called imputed rent (fictitious income of owners-occupiers) is not yet available. The
annual report of the Study Committee on Ageing however presented the result of a calculation made
by Statistics Belgium in the context of EU-SILC. The conclusion is that if account is taken of the
imputed rent, the poverty risk for the elderly (11.7%) is at a lower level than the poverty risk for the
population in the active age (14,1%)38. However, these interpretations should be approached with
caution. Figure 4.3.3 (cf. above) shows that the percentage of persons who are confronted with
problematic housing costs is higher among the elderly than among other age groups. The median
total housing costs as a percentage of the household income is also higher for the elderly (17,9%)
than for the total population (16.4%). Moreover, the extent to which the own home can be used for
fulfilling other needs is a complicated issue.
37 The theoretical replacement rate is an indicator for the level of the pension compared to the wage earned
before retiring. The calculation is based on a number of type cases. These type cases draw a picture of the
functioning of the pension system, but they are not (necessarily) representative of the actual pensions the
pensioners receive. For more information: cf. ’Pension Adequacy in the European Union. Report prepared
Jointly by the Directorate General Employment, Social Affairs and Inclusion of the European Commission and
the Social Protection Committee, May 2012’ (http://ec.europa.eu/social/main.jsp?langId=en&catId=758)
* No Figures for 2013
38 Hoge Raad van Financiën, Studiecommissie voor de Vergrijzing, Jaarlijks Verslag, juli 2014

40
Finally, as regards the budgetary sustainability of the pensions, the Study Committee on Ageing
(2014) estimates the additional pension costs at 0.6% of GDP for the period 2013-2019 and at 4.1%
of GDP for the period 2013-2060. The general additional costs of ageing are estimated at 0.5% of
GDP for the period 2013-2019 and at 4.2% of GDP for the period 2013-2060. Compared with previous
estimates of the budgetary cost of ageing, the current estimates are lower by 0,6% of GDP. This is
due to different factors. Two thirds of the difference can be attributed to methodological changes in
estimating the health, and in particular long-term care, expenditure. Other factors contributing to
the decrease are public pensions (higher estimated share of mixed pensions) and child allowances
(calculation basis of welfare adaptations).

41
6| Health care and long-term care
Between 2004 and 2012, life expectancy (LE) at birth for women has increased from 81.9 to 83.1
years, for men it has increased from 76 to 77.8 years. For both, a small decrease has been observed
compared to 2011. Especially the number of healthy life years (HLY) at birth show a strong increase
within the observed period. Also the difference between men and women in number of healthy life
years is much smaller compared to the difference in life expectancy. Between 2004 and 2012, life
expectancy at age 65 increased from 20.2 to 21.3 years for women and from 16.5 to 17.7 years for
men. Life expectancy in good health at age 65 was 11.1 years for women and 10.7 years for men in
2012. Again the difference between men and women in number of healthy life years at age 65 is
much smaller compared the difference in life expectancy at age 65.
Figure 6.1 Life expectancy (LE) and Healthy Life Years (HLY) in years, Belgium, 2004-2012
Source Eurostat
Like in other member states, the health system in Belgium is characterised by a number of important
social inequalities. The 2012 report regarding the Performance of the Belgian Health System gave a
detailed overview of these inequalities39.
An important structural fact in this context is the difference in life expectancy (in good health)
according to social-economic status. A number of figures are shown in table 6.1. This shows
significant differences for both sexes. For men, the difference between the extremes is 7.5 years, for
women it is 5.9 years. Regarding life expectancy in good health, the differences are even
39 https://kce.fgov.be/publication/report/performance-of-the-belgian-health-system-report-2012 A new
version of this “performance report” is in preparation
2004 2005 2006 2007 2008 2009 2010 2011 2012
LE female at birth 81,9 81,9 82,3 82,6 82,6 82,8 83 83,3 83,1
LE male at birth 76 76,2 76,6 77,1 76,9 77,3 77,5 78 77,8
HLY female at birth 58,4 62,3 63,2 63,9 64,2 63,7 62,6 63,6 65,4
HLY male at birth 58,9 62,4 63 63,5 63,3 63,9 64 63,4 64,3
LE female at 65 20,2 20,2 20,6 21 20,9 21,1 21,3 21,6 21,3
LE male at 65 16,5 16,6 17 17,3 17,3 17,5 17,6 18 17,7
HLY female at 65 8,7 9,8 10 10,4 10,4 10,3 9,7 10,3 11,1
HLY male at 65 8,8 9,4 9,6 10,2 10,4 10,6 10,4 9,8 10,7
0
10
20
30
40
50
60
70
80
90
Years

42
considerably bigger. Here, the difference between the extremes is 18.6 years for men and 18.2 years
for women.
For example : the estimated life expectancy at age 65 for men with a low education level is 7.38 years
and 11.28 years for men with a high education level. As regards women, these figures are 7.56 years
and 12.57 years respectively (WIV, EU-SILC 2004).
Table 6.1: Life expectancy (2001) and healthy life expectancy (2004) at age 25, by sex and level of
education, Belgium
Life expectancy Healthy life expectancy
male female male female
Higher education 55 59.9 46.33 47.1
Higher secondary
education 52.5 58.8 41.54 41.27
Lower secondary
education 51.3 58.0 39.71 42.01
Primary
education 49.3 56.2 36.65 36.27
No diploma 47.6 54.0 27.75 28.92
Source: Deboosere et. al., Van Oyen et. al. in de Performantie van het Belgische gezondheidssysteem. Rapport 2012.
Recently the first results of the new Belgian Health Interview Survey 2013 became available40.
Although a specific analysis of health inequalities by socio-economic status still is in preparation, a
number of the already available analysis on Health status and well-being, health behaviour and life-
styles confirm findings of earlier surveys. Important differences remain in health status and health
behaviour according to the socio-economic position and sometimes even increase. For example,
subjective health, chronic conditions and mental health vary in function of the education level and
multi-morbidity is higher for people with a lower level of education. As regards health behaviour and
life style, major differences are also registered, especially for smoking behaviour and obesity, as well
as with regard to overweight, vegetable and fruit consumption and physical exercise.
Compared to other member states, Belgium scores well on accessibility of health care on the basis of
the ‘unmet need’ indicator. The number of persons who have to postpone medical consultations for
financial reasons is among the lowest in the EU27. In 2013, 1.9% of the population was in such a
situation. In the group with the 20% lowest incomes, this percentage is 5,2% and increased from
4.2% in 201141. The health Interview Survey 2013 evaluates ‘unmet need’ on the basis of a larger set
of medical services (medical care, dental care, prescribed drugs, glasses or lenses, mental health
care). It was found that in the lowest income quintile, 19% of the respondents report a
postponement of a contact with the health system, compared to 3% in the highest quintile. The
overall percentage was 8% (22,6% in Brussels, 8,9% in Wallonia and 4,8% in Flanders).
40 See website of the Scientific Institute of Public Health: https://his.wiv-isp.be/nl/SitePages/Rapporten.aspx
41 Source : EU-SILC.

43
Table 6.2: Unmet need for medical care, Belgium
2004 2005 2006 2007 2008 2009 2010 2011 2012 2103
1st quintile 4,1 2,4 1,7 1,4 1,4 1,4 1,1 4,2(b) 4,8 5,5
total 1,3 0,7 0,5 0,3 0,5 0,6 0,4 1,5(b) 1,7 1,9
Source: EU-SILC, Eurostat
Improving the measurement of the financial accessibility of health care is a major challenge. Very
little information is available however. In addition to the above-mentioned 'unmet need' indicator
and on the basis of the System of Health Accounts, it can be examined at an aggregate level what
patient themselves spend on health care. The absolute ‘out-of-pocket payments’ increased from €
5.8 billion to 8.4 billion between 2003 and 2012. It implies an average expenditure per inhabitant of €
753 in 2012. However, the share of the ‘out-of-pocket payments’ in total health expenditure has
remained stable during the same period. Nevertheless, this share of ‘out-of-pocket payments’ in
Belgium (20.4% in 2012) is high compared to the neighbouring countries Germany (12.2%), France
(7.8%), Luxembourg (11.6%) and the Netherlands (6.0%). Overall, due to comparability problems the
results concerning accessibility remain rather inconclusive.
Table 6.3 Out-of-pocket expenditures, Belgium, 2003-2012
2003 2004 2005 2006 2007 2008 2009 2010 2011 2012
Billon € 5.803 5.894 6.082 6.683 7.208 7.254 7.249 7.798 7.816 8.351
% expenditure on health 21.78 20.92 20.78 21.88 22.3 21.06 19.97 20.76 19.95 20.4
€ / capita 560.4 567.0 582.2 635.8 681.0 680.1 674.1 719.4 710.5 752.9
Source Eurostat
Figure 6.2 Out-of-pocket expenditures as share in total health expenditure, Belgium and
neighbouring countries, 2003-2012
Source: System of Health Accounts
2003 2004 2005 2006 2007 2008 2009 2010 2011 2012
Belgium 21,78 20,92 20,78 21,88 22,30 21,06 19,97 20,76 19,95 20,40
Germany 11,41 12,79 12,72 12,92 12,83 12,58 12,32 12,33 12,32 12,22
France 7,38 7,25 7,37 7,73 7,63 7,93 7,79 7,74 7,80 7,76
Luxembourg 13,26 12,77 12,93 13,37 10,31 10,06 9,90 10,23 11,24 11,63
Netherlands 7,97 7,86 8,13 6,70 6,54 6,64 5,77 5,75 5,89 5,96
0,00
5,00
10,00
15,00
20,00
25,00
% o
f to
tal
healt
h e
xp
en
dit
ure
44
Finally, as regards the budgetary sustainability of the health care and long-term care systems, for
the period 2013-2019, the Study Committee on Ageing (2014) estimates the budgetary costs of
ageing as regards health care and long-term care at 0.3% of GDP. For the period 2013-2060, the
estimated additional costs are estimated at 2,1% of GDP. As indicated above (section on pensions)
the estimates for health, and specifically long term care were significantly revised downwards, due to
methodological changes.
45
7|Summary and conclusions
The evolution of the social situation in the EU has been characterised over the last few years by
strong social divergence. In some Member States the social situation remained relatively stable, but
in others living conditions seriously deteriorated. The evolution between the two most recent years
seems to indicate a somewhat less pronounced divergence.
In Belgium the economic situation has remained relatively unaffected by the crisis. GDP growth has
been somewhat better (or in some years, less bad) than the EU-wide performance. Budget deficits
have been somewhat lower than the EU28 figure over the last years, but this is forecast to be
reversed in the coming years. After decades of public debt reduction, the crisis has brought public
debt levels back to over 100% of GDP. Social protection expenditure in percentage of GDP evolved
around the euro-area-average, and is slightly above this average in the latest figures.
Belgium is among the member states in which also the social impact of the crisis has been relatively
moderate. The employment rate is not far below the pre-crisis level. The unemployment rate
increased by approximately one percentage point between 2007 and 2013, which is clearly below
EU28 increase. Median household income and income inequality also remained stable. EU-SILC
estimates point to slight increases of the number of people at-risk-of-poverty or social exclusion.
These increases were mainly driven by an increase of the number of people in very-low-work-
intensity households , but slight increases were also registered for at-risk-of-poverty and severe
material deprivation. So far these changes have not been large enough to be statistically significant
and can thus not be extrapolated to the whole population. Furthermore, the most recent 2012-2013
figures point to a slight decrease. Overall, the change in the number of people at-risk-of-poverty or
social exclusion between 2008-2013 is not significant. Two important remarks need to be added to
this picture of overall relative stability.
Firstly, at about halfway of the Europe 2020 strategy, and with data that go by now up to three years
beyond the start of the strategy, there is no trend towards reaching the Europe 2020 target.
Secondly, behind the overall stability divergent trends can be identified for different social
categories.
Several indicators point to reduced poverty and social exclusion risks for elderly persons (65+).
Both the at-risk-of-poverty rate and the severe material deprivation rate show a decreasing trend,
beginning already before the crisis and persisting since then. Also the poverty gap decreased and the
aggregate replacement rate increased. It should however be noted that the reduction of the poverty
risk cannot be observed using a higher (70%) alternative threshold. The median relative income ratio
remained at the same level. So overall, while median relative income of the elderly remained stable,
low incomes have increased, lifting a larger share of the elderly, to a limited extend, above the
poverty threshold. Although identifying the drivers of this evolution goes beyond the scope of this
note, it seems likely that both selective increases of minimum pensions over the last years, as well as
cohort effects play a role here.

46
Notwithstanding this positive evolution, it needs to be noted that the poverty rate of the elderly
remains clearly above the population poverty rate. It needs to be noted further that the relative
income position of the elderly still considerably lags behind average EU28 levels: elderly poverty
rates are higher and both aggregate replacement rates and relative median income ratio are clearly
lower than EU28 levels. Depending on a set of assumptions, the future replacement rate for a
person with a 40 year career and average earnings is projected to decrease slightly by 2053.
On the other hand, for the working age population (18-64), an increasing risk of poverty (or social
exclusion) can be observed within specific- already high-risk- subgroups of this age category. The
increase is situated among low-skilled persons and exclusively among persons renting their home, a
group with overall a weaker social profile in Belgium-certainly in the case of the social housing sector.
The number of persons in very low work intensity households increased, and at the same time the
poverty risk of this group increased. Furthermore, the employment rate of persons with a low
educational level decreased. Although further research should substantiate this more42, taken
together, these observations point to a growing social divide within the working age population.
The very high poverty risks of single parents and persons with a nationality from outside the EU are
linked to this but might require a specific policy focus. After slight increases in the preceding years,
the level of child poverty or social exclusion now seems more stable. However, the fact that child
poverty is still higher than the overall poverty rate and the existence of persistent structural
inequalities according to the social origin of children, e.g. in the field of education, health behaviour,
etc., make that fighting child poverty also remains a key challenge in a more structural approach for
tackling poverty and social exclusion. Regarding the socio-economic position of persons with a
migrant background, Belgium is among the worst performing EU Member States.
As regards the housing situation, the indicators show that the number of persons living in situations
of poverty or social exclusion increases only on the rental market. At the same time, the EU-SILC
survey reveals high housing costs for persons with incomes below the at-risk-of-poverty threshold. As
weaker income situations and higher necessary expenses for housing-related aspects coincide in the
same population categories and among the same persons, this undoubtedly leads to difficult living
situations.
There are strong regional differences in the levels of poverty or social exclusion (AROPE), with very
high rates in Brussels (+40%), around 25% in Wallonia and around 15% in Flanders
Recent new results from the Health Interview Survey 2013 confirm the existence of significant socio-
economic differences in health status and health behaviour an life-style. Based on existing
evidence on the drivers of health inequalities, it is safe to assume that the growing social divergences
among the active population also enforce health inequalities among the working age population.
Belgium scores good as regards the accessibility of health care, but the small increase in the last
years in the percentage of persons in the lowest income quintile needs to be monitored further.
More and better comparable data to assess the performance on the accessibility of health care are
much needed.
To conclude, the most important trends that were shown in this note concern the changes in the
socio-economic position of the elderly and persons with a low educational attainment. These trends
already started before the outset of the crisis in 2008. They can also be observed at EU-level.
Certainly in the case of persons with a low educational attainment, they thus point to structural
42 On the basis of an analysis of the income evolution of a set of theoretical household types with incomes at
different points in the income distribution Cantillon et al. come to similar conclusions (Cantillon et. al., 2014)

47
changes that weaken the position on the labour market of this group and which also put the
adequacy of social protection for this category under pressure. In this regard, this analysis points to
the key importance of the joint challenge of the high incidence of very low work intensity, which is
relatively unaffected by the business cycle and changes in the employment rate, and the low- and
decreasing- adequacy of social allowances for vulnerable working age categories.

48
References
Cantillon, B., Van Mechelen, N., Frans, D., Schuerman, N., (2014) Het glazen plafond van de actieve welvaartstaat: twee decennia ongelijkheid, armoede en beleid in België, CSB-Berichten, Oktober 2014, Antwerpen
Combat Poverty Agency (2013), Social protection and poverty. Biennial Report 2012-2013 De Meyer, I., Warlop, N. & Van Camp, S. (2014). Wiskundige geletterdheid bij 15-jarigen. Overzicht
van de eerste Vlaamse resultaten van PISA2012. Brussel: Departement Onderwijs en Vorming, Afdeling Strategisch Beleidsondersteuning
Drieskens, S., Gisle, L., (ed. (2015), Gezondheidsenquête 2013. Deel 3: Gebruik van Gezondheids- en
Welzijnsdiensten, WIV-ISP, 2014 European Commission (2015), European Economic Forecast Winter 2015, European Economy 1|2015 European Commission (2014), Annual Growth Survey 2015, Communication from the Commission to
the European Parliament , the Council, the European Central Bank, the European Social and Economic Committee, the Committee of the Regions and the European Investment Bank, Brussels 2014
European Union (2015), Social Europe: Aiming for Inclusive Growth. Annual Report of the Social
Protection Committee on the Social Situation in the European Union (2014), Eurostat (2014), Newsrelease, 177/2014 Federaal Planbureau (2014), Monitoring van de relancestrategie van de Federale regering.
Vooruitgangsverslag, juli 2014 Bureau Fédéral du Plan (2014), Monitoring de la stratégie de relance du gouvernement fédéral,
Rapport d’avancement, juillet 2014 Gisle, L., Demarest, S., (ed.) (2014), Gezondheidsenquête 2013. Rapport 2: Gezondheidsgedrag en
leefstijl, WIV-ISP, Brussel Guio., A.C., Feyaerts, G., Vandenbroucke, F., Vinck, J., (2014), Kinderarmoede hoger op de politieke
agenda plaatsen. Werknota voor het Colloquium van de Koning Boudewijnstichting “Werken rond de structurele oorzaken van kinderarmoede” Versie van 5 juni 2014
Heylen, K. (2015), Grote Woononderzoek 2013. Deel 2. Deelmarkten, woonkosten en
betaalbaarheid, Steunpunt Wonen Hoge Raad voor Financiën, Studiecommissie voor de Vergrijzing (2014), Jaarlijks Verslag. La Strada. Steunpunt thuislozenzorg Brussel (2015), Dak- en thuislozen in het Brussels Hoofdstedelijk
Gewest. Telling van 6 november 2014 Nationale Bank van België, Centrale voor kredieten aan particulieren (2015), Statistieken.

49
Banque Nationale de Belgique, Centrale des crédits aux particuliers (2015), Statistiques. Nevejan, H., Van Camp, G., (2014) De versterkte degressiviteit van de Belgische
werkloosheidsuitkeringen: effecten op financiële vallen en armoederisico’s in een notedop, in: Jaarboek Armoede 2014, ACCO
OECD (2015), Economic Surveys: Belgium 2015, OECD Publishing Peña-Casas, R., (2014), A picture of low work intensity households in Belgium using the
Datawarehouse Labour Market and Social Protection, European Social Observatory, November 2014
POD Maatschappelijke Integratie (2015), Statistisch Rapport, Bulletin nr 10 SPP Intégration Sociale (2015), Rapport Statistique, Bulletin n°10 Schockaert, I., Morissens, A., Cincinnato, S., Nicaise, I., Armoede tussen de plooien. Aanvullingen en correcties op de EU-SILC voor verborgen groepen armen, Leuven: HIVA, 2012, 225p Statistics Belgium (2014), Quality Report Belgian SILC 2013 Service de lutte contre la pauvreté, la précarité et l’exclusion sociale (2014), La dégressivité des
allocations de chômage : impact sur la pauvreté Steunpunt tot bestrijding van armoede, bestaansonzekerheid en sociale uitsluiting (2014), De
versterkte degressiviteit van de werkloosheidsuitkeringen: impact op armoede, augustus 2014 Service de lutte contre la pauvreté, la précarité et l’exclusion sociale (2013), Protection sociale et
pauvreté. Rapport Bisannuel 2012-2013 Steunpunt tot bestrijding van armoede, bestaansonzekerheid en sociale uitsluiting (2013), Sociale
Bescherming en armoede. Tweejaarlijks rapport 2012-2013 Vandenbroucke, F. & Vinck, J. (2013), ‘Child Poverty Risks in Belgium, Wallonia, Flanders: Accounting
for a Worrying Performance’, in P. Maystadt, E. Cantillon, L. Denayer, P. Pestieau, B. Van der Linden, M. Cattelain (eds.), Le modèle social belge : quel avenir ? Presses interuniversitaires de Charleroi
Van Der Heyden, J., Charafedinne, R.,(ed.) (2014), Gezondheidsenquête 2013. Rapport 1:
Gezondheid en Welzijn, WIV-ISP, Brussel Van Der Heyden, J., Charafedinne, R.,(ed.) (2014), Enquête de santé 2013. Rapport 1: Santé et Bien-être, WIV-ISP, Bruxelles Vrijens, F., Renard, F., Jonckheer, P., Van den Heede, K., Desomer, H., Van de Voorde, C., Walckiers,
D., Dubois, C., Camberlin, C., Vlayen, J., Van Oyen, H., Léonard, C., Meeus, P., (2012) De performantie van het Belgische gezondheidssysteem. Report 2012, KCE report 196A

50
ANNEXES
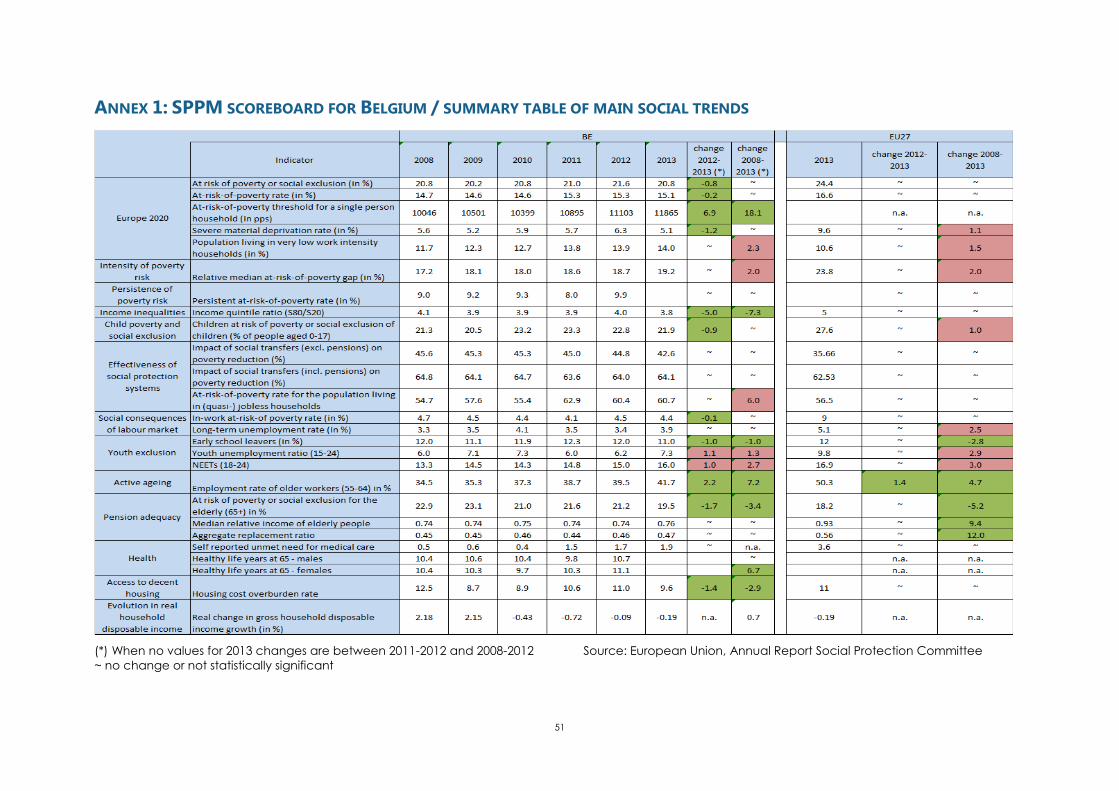
51
ANNEX 1: SPPM SCOREBOARD FOR BELGIUM / SUMMARY TABLE OF MAIN SOCIAL TRENDS
(*) When no values for 2013 changes are between 2011-2012 and 2008-2012 Source: European Union, Annual Report Social Protection Committee
~ no change or not statistically significant

52
ANNEX 2 : TABLES AND FIGURES
Annex 2 contains, from p. 49 to 56, the following tables and figures :
- Table A2.1 : Minimum social protection allowances in % of at-risk-of-poverty threshold
- Table A2.2 : Time series of some indicators not included in figures
- Figure A2.1 : At-risk-of-poverty rate for children by different at-risk-of-poverty threshold levels (40%, 50%, 60%, 70% of median equivalent household income)
- Figure A2.2 : At-risk-of-poverty rate for working age population by different at-risk-of-poverty threshold levels
- Figure A2.3 : At-risk-of-poverty rate for elderly population by different at-risk-of-poverty threshold levels
- Figure A2.4 : AROPE by age in percentage, Belgium
- Figure A2.5 : Infant mortality rate, EU28, Belgium and neighbouring countries
- Figure A2.6 : Employment rate Brussels region, total and persons with low education
- Figure A2.7 : Employment rate Flanders, total and persons with low education
- Figure A2.8 : Employment rate Wallonia, total and persons with low education
- Figure A2.9 : Long term unemployment rate, Belgium and Regions
- Figure A2.10 : Trends in take-up of selected benefits
- Figure A2.11 : Trends in material deprivation items, Belgium
- Figure A2.12 : Intersections between three basic indicators
- Figure A2.13 : Gender differences in poverty risk
- Figure A2.14: Evolution of income dispersion measures (S80/S20 and GINI), Belgium and neighbouring countries

53
Table A2.1: minimum social protection allowances in % of at-risk-of-poverty threshold (60% of median)
Source FPS Social Security
Table A2.2: Time series of some indicators not included in figures
2004 2005 2006 2007 2008 2009 2010 2011 2012
201
3
S80/S20 3.9 4.0 4.2 3.9 4.1 3.9 3.9 3.86 4.0 3.8
Gini 26.1 27.9 27.8 26.3 27.5 26.4 26.6 26.3 26.5 25.9
poverty threshold
(nominal annual amounts in €) 9405 9942 10316 10540 10791 11588 11678 12005 12168
128
90
AROP 40% threshold (%) 4.3 2.7 3.3 3.7 3.2 3.5 4.1 3.6 3.8 3.9
AROP 50% threshold (%) 8.5 7.7 8.2 8.0 7.5 7.9 7.9 8.3 8.3 8.3
AROP 60% threshold (%) 14.3 14.8 14.7 15.2 14.7 14.6 14.6 15.3 15.3 15.1
AROP 70% threshold (%) 23.0 24.1 23.5 23.4 23.8 23.5 23.8 24.1 24.3 24.3
in-work poverty BE (%) 4.0 3.9 4.1 4.3 4.8 4.5 4.4 4.1 4.5 4.4
Source: EU-SILC, ADSEI
2004 2005 2006 2007 2008 2009 2010 Sep-11 Nov-12 Oct-13 Oct-14
social assistance for the elderly
single person 76 79 79 91 92 92 92 95 93 93 92
couple 68 70 71 81 82 82 82 84 83 82 82
allowance replacing income for
persons with a disability
single person 72 73 72 73 76 74 75 77 75 75 75
couple with two children 66 67 66 67 68 66 67 68 67 66 66
social assistance
single person 72 74 72 73 76 74 75 77 75 75 75
couple with two children 63 64 63 64 66 64 64 66 64 64 63
single parent with two children 83 85 83 84 86 83 84 86 85 83 83
old age pension (full carreer)
single person 106 107 105 106 107 106 108 106 104 103 103
couple 88 90 88 88 88 87 88 88 87 86 85
unemployment allowance (after
6 months)
single person 88 89 87 87 89 86 87 90 88 87 87
couple with two children 70 71 70 70 71 69 69 71 70 69 69
single parent with two children 88 89 88 88 89 86 87 89 87 86 86
invalidity allowance
single person 96 98 96 101 102 101 103 106 104 103 103
coupel with two children 80 81 80 82 83 82 83 84 83 81 81
minimum wage
single person 130 127 125 128 130 130 128 127 125 122 122
couple with two children 90 88 87 88 89 88 88 88 87 84 85
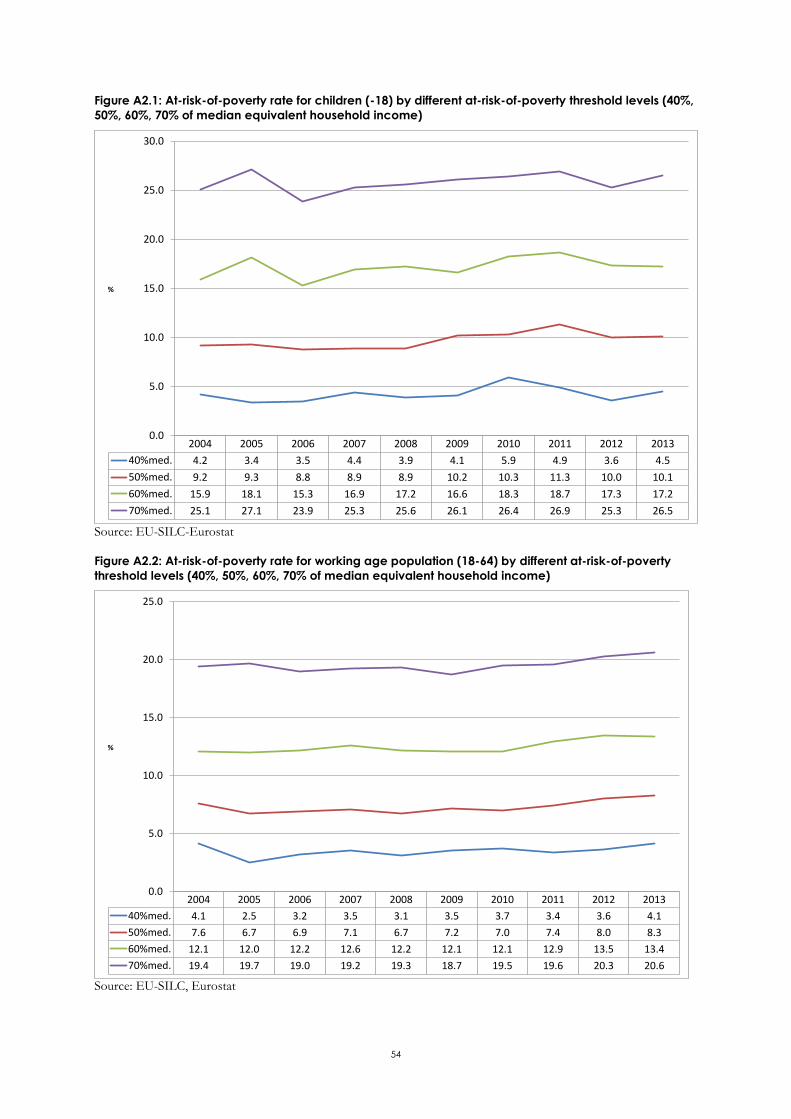
54
Figure A2.1: At-risk-of-poverty rate for children (-18) by different at-risk-of-poverty threshold levels (40%,
50%, 60%, 70% of median equivalent household income)
Source: EU-SILC-Eurostat
Figure A2.2: At-risk-of-poverty rate for working age population (18-64) by different at-risk-of-poverty
threshold levels (40%, 50%, 60%, 70% of median equivalent household income)
Source: EU-SILC, Eurostat
2004 2005 2006 2007 2008 2009 2010 2011 2012 2013
40%med. 4.2 3.4 3.5 4.4 3.9 4.1 5.9 4.9 3.6 4.5
50%med. 9.2 9.3 8.8 8.9 8.9 10.2 10.3 11.3 10.0 10.1
60%med. 15.9 18.1 15.3 16.9 17.2 16.6 18.3 18.7 17.3 17.2
70%med. 25.1 27.1 23.9 25.3 25.6 26.1 26.4 26.9 25.3 26.5
0.0
5.0
10.0
15.0
20.0
25.0
30.0
%
2004 2005 2006 2007 2008 2009 2010 2011 2012 2013
40%med. 4.1 2.5 3.2 3.5 3.1 3.5 3.7 3.4 3.6 4.1
50%med. 7.6 6.7 6.9 7.1 6.7 7.2 7.0 7.4 8.0 8.3
60%med. 12.1 12.0 12.2 12.6 12.2 12.1 12.1 12.9 13.5 13.4
70%med. 19.4 19.7 19.0 19.2 19.3 18.7 19.5 19.6 20.3 20.6
0.0
5.0
10.0
15.0
20.0
25.0
%

55
Figure A2.3: At-risk-of-poverty rate for elderly population (65+) by different at-risk-of-poverty threshold
levels (40%, 50%, 60%, 70% of median equivalent household income)
Source: EU-SILC, Eurostat
Figure A2.4: AROPE by age in percentage, Belgium
Source: EU-SILC, Eurostat
2004 2005 2006 2007 2008 2009 2010 2011 2012 2013
40%med. 4.8 2.6 3.3 3.3 2.8 2.7 3.2 2.6 4.5 2.3
50%med. 10.8 9.5 12.2 10.1 8.8 7.6 7.8 7.9 7.5 5.8
60%med. 20.9 21.4 23.2 23.0 21.2 21.6 19.4 20.2 19.4 18.4
70%med. 34.4 37.7 40.4 37.2 38.8 38.7 37.2 37.5 37.9 35.1
0.0
5.0
10.0
15.0
20.0
25.0
30.0
35.0
40.0
45.0
%
2004 2005 2006 2007 2008 2009 2010 2011 2012 2013
Total 21.6 22.6 21.5 21.6 20.8 20.2 20.8 21.0 21.6 20.8
<18 22.7 23.7 21.4 21.6 21.3 20.5 23.2 23.3 22.8 21.9
18-64 21.2 21.9 20.7 20.7 20.1 19.3 20.0 20.0 21.3 20.8
>65 22.0 23.3 25.2 25.0 22.9 23.1 21.0 21.6 21.2 19.5
0.0
5.0
10.0
15.0
20.0
25.0
30.0
%

56
Figure A2.5: Infant mortality rate (per 1000 live births), EU28, Belgium and neighbouring countries
Source: EU-SILC, Eurostat
Figure A2.6: Employment rate Brussels region, total and persons with low education
Source: Labour Force Survey, Statistics Belgium
2003 2004 2005 2006 2007 2008 2009 2010 2011 2012
EU28 5.3 5.1 4.9 4.7 4.5 4.3 4.2 4.0 3.9 3.8
Belgium 4.1 3.9 3.7 4.0 3.9 3.8 3.5 3.6 3.4 3.8
Germany 4.2 4.1 3.9 3.8 3.9 3.5 3.5 3.4 3.6 3.3
France 4.2 4.0 3.8 3.8 3.8 3.8 3.9 3.6 3.5 3.5
Netherlands 4.8 4.4 4.9 4.4 4.1 3.8 3.8 3.8 3.6 3.7
0.0
1.0
2.0
3.0
4.0
5.0
6.0
2003 2004 2005 2006 2007 2008 2009 2010 2011 2012 2013
low educ. 33.8% 34.4% 33.8% 33.8% 34.3% 36.1% 35.1% 34.6% 32.9% 32.9% 31.6%
Total 53.2% 54.1% 54.8% 53.4% 54.8% 55.6% 55.1% 54.8% 53.8% 54.0% 52.5%
0.0%
10.0%
20.0%
30.0%
40.0%
50.0%
60.0%
Employment rate Brussels Region

57
Figure A2.7: Employment rate Flanders, total and persons with low education
Source: Labour Force Survey, Statistics Belgium
Figure A2.8: Employment rate Wallonia, total and persons with low education
Source: Labour Force Survey, Statistics Belgium
2003 2004 2005 2006 2007 2008 2009 2010 2011 2012 2013
low educ. 44.4% 44.3% 43.7% 43.1% 44.5% 42.9% 42.4% 42.7% 42.0% 41.4% 41.3%
Total 62.9% 64.3% 64.9% 65.0% 66.1% 66.5% 65.8% 66.3% 66.2% 65.9% 66.2%
0.0%
10.0%
20.0%
30.0%
40.0%
50.0%
60.0%
70.0%
Employment rate Flanders
2003 2004 2005 2006 2007 2008 2009 2010 2011 2012 2013
low educ. 37.9% 36.2% 37.0% 37.2% 35.8% 36.1% 34.0% 35.3% 35.1% 35.1% 34.2%
Total 55.4% 55.1% 56.1% 56.1% 57.0% 57.2% 56.2% 56.7% 57.0% 57.3% 57.0%
0.0%
10.0%
20.0%
30.0%
40.0%
50.0%
60.0%
70.0%
Employment rate Wallonia

58
Figure A2.9: Long term unemployment rate, Belgium and Regions
Source: Labour Force Survey, Statistics Belgium
Figure A2.10: Trends in take-up of selected benefits (number of persons)
Source: Social protection Committee, Annual Report 2015
0.0%
2.0%
4.0%
6.0%
8.0%
10.0%
12.0%
2003 2004 2005 2006 2007 2008 2009 2010 2011* 2012 2013
Brussels Hoofdstedelijk Gewest
Vlaams Gewest
Waals Gewest
België
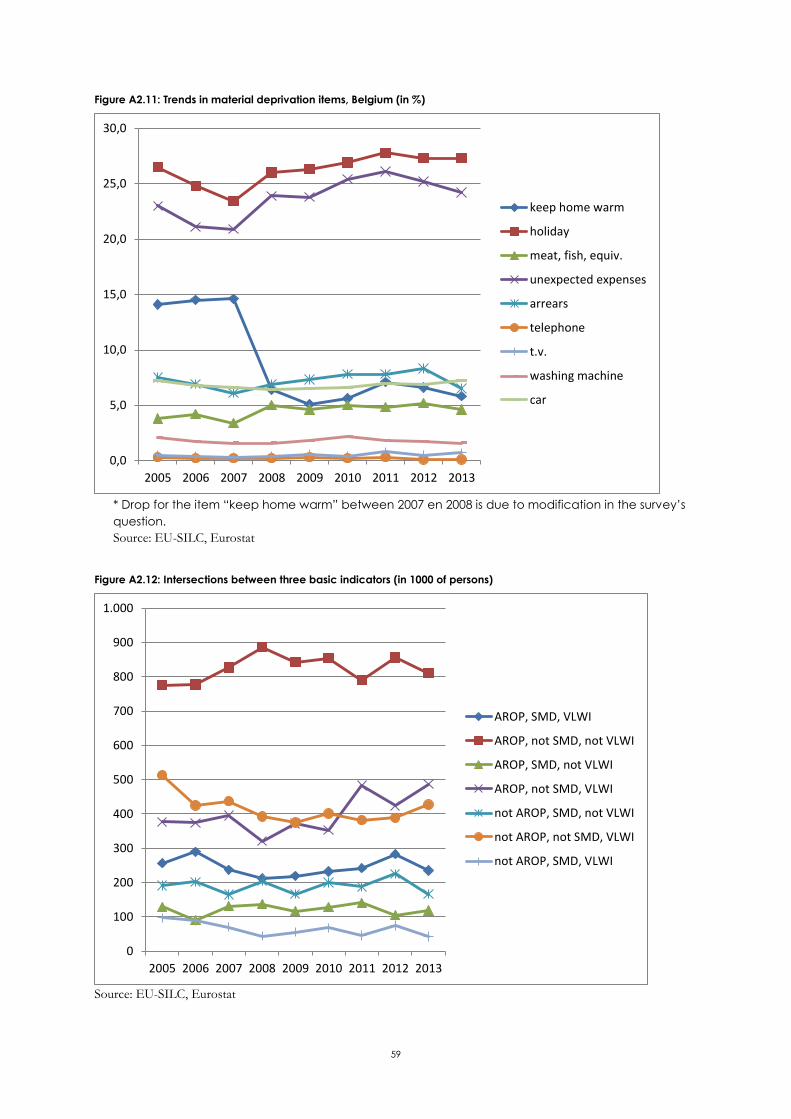
59
Figure A2.11: Trends in material deprivation items, Belgium (in %)
* Drop for the item “keep home warm” between 2007 en 2008 is due to modification in the survey’s
question.
Source: EU-SILC, Eurostat
Figure A2.12: Intersections between three basic indicators (in 1000 of persons)
Source: EU-SILC, Eurostat
0,0
5,0
10,0
15,0
20,0
25,0
30,0
2005 2006 2007 2008 2009 2010 2011 2012 2013
keep home warm
holiday
meat, fish, equiv.
unexpected expenses
arrears
telephone
t.v.
washing machine
car
0
100
200
300
400
500
600
700
800
900
1.000
2005 2006 2007 2008 2009 2010 2011 2012 2013
AROP, SMD, VLWI
AROP, not SMD, not VLWI
AROP, SMD, not VLWI
AROP, not SMD, VLWI
not AROP, SMD, not VLWI
not AROP, not SMD, VLWI
not AROP, SMD, VLWI
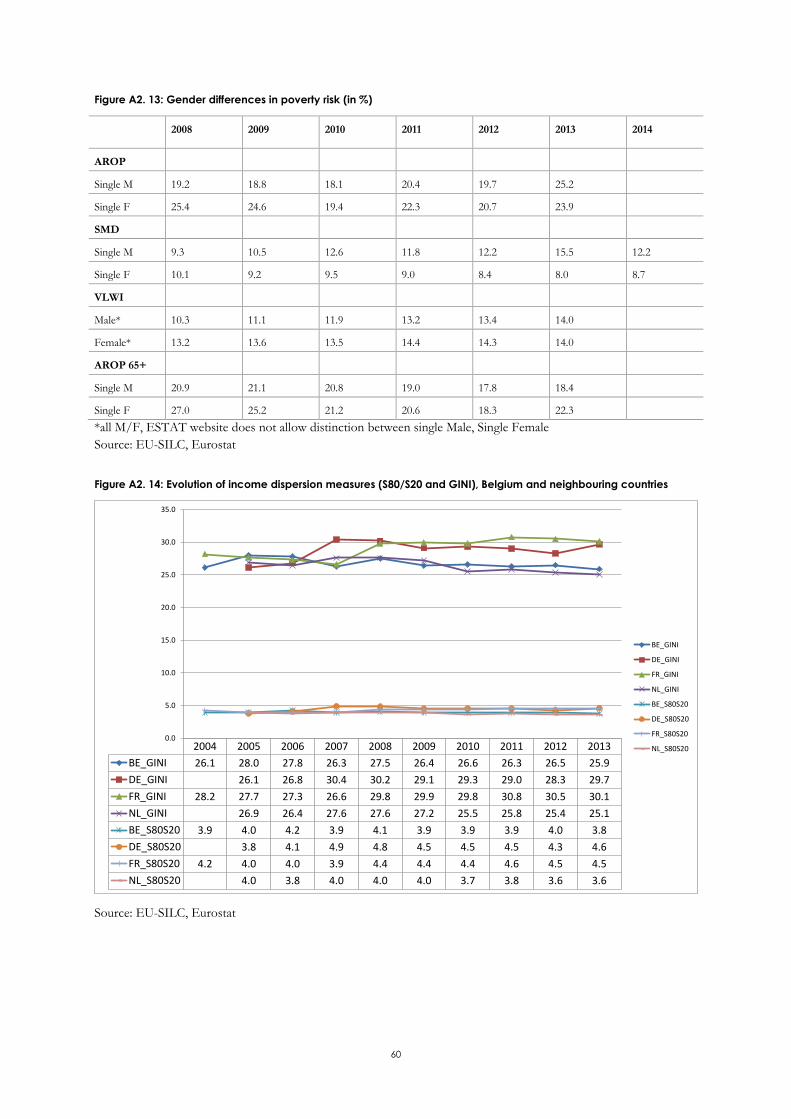
60
Figure A2. 13: Gender differences in poverty risk (in %)
2008 2009 2010 2011 2012 2013 2014
AROP
Single M 19.2 18.8 18.1 20.4 19.7 25.2
Single F 25.4 24.6 19.4 22.3 20.7 23.9
SMD
Single M 9.3 10.5 12.6 11.8 12.2 15.5 12.2
Single F 10.1 9.2 9.5 9.0 8.4 8.0 8.7
VLWI
Male* 10.3 11.1 11.9 13.2 13.4 14.0
Female* 13.2 13.6 13.5 14.4 14.3 14.0
AROP 65+
Single M 20.9 21.1 20.8 19.0 17.8 18.4
Single F 27.0 25.2 21.2 20.6 18.3 22.3
*all M/F, ESTAT website does not allow distinction between single Male, Single Female
Source: EU-SILC, Eurostat
Figure A2. 14: Evolution of income dispersion measures (S80/S20 and GINI), Belgium and neighbouring countries
Source: EU-SILC, Eurostat
2004 2005 2006 2007 2008 2009 2010 2011 2012 2013
BE_GINI 26.1 28.0 27.8 26.3 27.5 26.4 26.6 26.3 26.5 25.9
DE_GINI 26.1 26.8 30.4 30.2 29.1 29.3 29.0 28.3 29.7
FR_GINI 28.2 27.7 27.3 26.6 29.8 29.9 29.8 30.8 30.5 30.1
NL_GINI 26.9 26.4 27.6 27.6 27.2 25.5 25.8 25.4 25.1
BE_S80S20 3.9 4.0 4.2 3.9 4.1 3.9 3.9 3.9 4.0 3.8
DE_S80S20 3.8 4.1 4.9 4.8 4.5 4.5 4.5 4.3 4.6
FR_S80S20 4.2 4.0 4.0 3.9 4.4 4.4 4.4 4.6 4.5 4.5
NL_S80S20 4.0 3.8 4.0 4.0 4.0 3.7 3.8 3.6 3.6
0.0
5.0
10.0
15.0
20.0
25.0
30.0
35.0
BE_GINI
DE_GINI
FR_GINI
NL_GINI
BE_S80S20
DE_S80S20
FR_S80S20
NL_S80S20

61
ANNEX 3: PARTICIPANTS IN THE MEETING OF THE WORKING GROUP ON SOCIAL
INDICATORS (8/1/2015 AND 27/3/2015) AND PERSONS GIVING INPUT TO
ANALYSIS
Jean-Maurice Frère (FPB), Ariane Rober (Steunpunt Werk en Sociale Economie), Guy Van Camp (FOD
SZ), Sarah Luyten, Marion Englert (Observatoire de la santé et du sociale Bruxelles), Essin Fehmieva,
Marie Castaigne, Genveviève Geenens (Statistics Belgium), Didier Noël (Observatoire du Crédit et de
l’endettement), Jill Coene (OASES-UA), Ides Nicaise, Wouter Schepers, Fréderic de Wispelaere (HIVA-
KULeuven), Henk Van Hootegem (Steunpunt armoedebestrijding), Sebastien Bastaits, Peter Lelie,
Dirk Moens, Rudi Van Dam (FOD SZ), Tim Goedemé (CSB-UA), Christine Ruyters, Sile O’Dorchai
(IWEPS), Anne-Cathérine Guio (CEPS-Instead), Jo Locquet (POD MI), Jo Noppe (Studiedienst Vlaamse
Regering), Ramon Peña-Casas (Observatoire Sociale Européen), Ricardo Cherenti (Union des Villes et
Communes de Wallonie)
62
ANNEX 4: NEDERLANDSTALIGE SAMENVATTING
Deze nota werpt een blik op de evolutie van de sociale situatie in het licht van de doelstellingen van
de Europa 2020-strategie43. Deze analyse is voornamelijk gebaseerd op Europese sociale indicatoren,
aangevuld met een aantal nationale gegevens en enquêtes.
De sociale en economische situatie in België is tijdens de crisis vrij stabiel gebleven. De groei van het
BBP was iets gunstiger (of in bepaalde jaren minder ongunstig) dan het gemiddelde resultaat in de
EU. Het begrotingstekort lag de voorbije jaren iets lager dan het EU28-cijfer, maar volgens
voorspellingen zou dit de komende jaren andersom kunnen zijn. Nadat ons land er de voorbije
decennia in geslaagd was de overheidsschuld af te bouwen, bedraagt deze door de crisis opnieuw
100% van het BNP. Het procentueel aandeel van de socialezekerheidsuitgaven in het BNP lag rond
het gemiddelde van de Eurozone, en ligt volgens de meest recente cijfers net boven dit gemiddelde.
België is een van de lidstaten waar de crisis een eerder matige sociale impact heeft gehad. De
werkzaamheidsgraad ligt niet veel lager dan voor de crisis. Het werkloosheidscijfer steeg tussen 2007
en 2013 met ongeveer één procent, wat beduidend minder is dan de EU28-toename. Volgens EU-
SILC-schattingen nam het aantal personen met risico op armoede en sociale uitsluiting de afgelopen
jaren licht toe. Deze stijging was voornamelijk te wijten aan de toename van het aantal mensen in
gezinnen met een zeer lage werkintensiteit, maar ook voor armoederisico en ernstige materiële
deprivatie werden lichte stijgingen waargenomen. Tot nu toe waren deze veranderingen niet
belangrijk genoeg om statistisch relevant te zijn. De recentste cijfers voor 2012-2013 vertonen
overigens een lichte afname. Globaal gezien zijn de wijzigingen van het aantal personen met risico op
armoede of sociale uitsluiting tussen 2008-2013 echter niet significant.
Bij dit beeld van algemene relatieve stabiliteit moeten echter twee belangrijke opmerkingen worden
gemaakt.
Ten eerste zien we halfweg de Europa 2020-strategie, en met cijfers tot inmiddels drie jaar na het
begin van de strategie, geen tendens in de richting van de Europa 2020-doelstelling inzake de
vermindering van het aantal personen in een situatie van armoede of sociale uitsluiting.
Ten tweede nemen we achter de globale stabiliteit uiteenlopende tendensen waar voor
verschillende sociale categorieën.
Verschillende indicatoren wijzen op een verminderd risico op armoede en sociale uitsluiting bij 65-
plussers. Zowel het armoederisico-cijfer als het cijfer voor ernstige materiële deprivatie tonen een
neerwaartse trend die reeds voor de crisis werd ingezet en blijft duren. Daarnaast werd de
armoedekloof kleiner en nam de geaggregeerde vervangingsratio toe. Bij deze positieve evolutie
43 De monitoring van de sociale situatie in het kader van de voornoemde Europese rapporten wordt gecoördineerd door de
Federale Overheidsdienst (FOD) Sociale Zekerheid, met de ondersteuning van de Werkgroep sociale indicatoren
NRP/NSR, die bestaat uit deskundigen op het gebied van sociale indicatoren van de federale en gewestelijke
administraties, universiteiten, onderzoekscentra en stakeholder-organisaties (cf. bijlage 4 van het rapport voor een
overzicht van de mensen die aan deze nota hebben meegewerkt). Voor de inhoud van deze nota is evenwel uitsluitend
de FOD Sociale Zekerheid verantwoordelijk. Deze nota bouwt verder op voorbereidend werk van het OSE en het HIVA
met betrekking tot de actualisering van de analyse van de sociale indicatoren van 2013. Contact:

63
kunnen wel enkele verdere kanttekeningen worden gemaakt. De ratio van het mediaan (equivalent)
inkomen van ouderen en het mediaan equivalent inkomen van de personen onder 65 jaar bleef quasi
stabiel, hetgeen lijkt te impliceren dat in het bijzonder de situatie van ouderen met de laagste
inkomens verbeterd is. Dit blijkt ook uit een toegenomen doelmatigheid van de sociale bescherming.
Dit is mogelijks het gevolg van maatregelen sedert de tweede helft van de jaren 2000 om de laagste
pensioenen te verhogen, maar ook cohorte-effecten kunnen hierbij een rol spelen.
Niettegenstaande deze gunstige evolutie dient te worden aangestipt dat het armoederisico bij
ouderen duidelijk boven de armoederisico voor de globale bevolking blijft. Tevens moet worden
benadrukt dat de relatieve inkomenspositie van de ouderen nog steeds aanzienlijk achterop hinkt
ten opzichte van gemiddelde EU28-niveaus: de armoedecijfers bij ouderen zijn hoger en zowel de
geaggregeerde vervangingsratio als het relatieve mediaaninkomen zijn uitgesproken lager dan de
EU28-niveaus. Afhankelijk van een aantal vooronderstellingen wordt verwacht dat de toekomstige
vervangingsratio voor personen met een loopbaan van 40 jaar en een gemiddeld inkomen tegen
2053 licht zal dalen.
Anderzijds stellen we bij de bevolking op actieve leeftijd (18-64) een lichte toename van het risico
op armoede en sociale uitsluiting vast. Deze toename blijkt zich echter te situeren binnen specifieke
subgroepen binnen deze leeftijdscategorie die reeds met een verhoogd risico kampen. Zo wordt een
substantiële toename vastgesteld van het armoederisico onder personen met een laag
opleidingsniveau sinds de eerste helft van de jaren ’00. De toename doet zich ook uitsluitend voor
bij personen die hun woning huren, een groep met een globaal zwakker sociaal profiel in België. Het
aantal personen in gezinnen met een zeer lage werkintensiteit nam toe, en tegelijk steeg het
armoederisico bij deze groep. Verder nam het tewerkstellingspercentage bij laaggeschoolden af.
Hoewel verder onderzoek noodzakelijk is, lijken deze vaststellingen te wijzen op een toenemende
dualisering onder de actieve bevolking.
Het zeer hoge armoederisico bij alleenstaande ouders en onderdanen van niet-EU-lidstaten houdt
verband met de hiervoor vermelde ontwikkelingen, maar vereisen wellicht ook specifieke
beleidsklemtonen. Na lichte stijgingen de voorbije jaren lijkt het niveau inzake kinderarmoede en
sociale uitsluiting momenteel eerder stabiel. Toch ligt het kinderarmoedeniveau nog steeds hoger
dan de algemene armoedecijfers en blijven er grote structurele ongelijkheden naar gelang de sociale
herkomst van kinderen bestaan, bv. op vlak van scholing en gezondheidsgedrag. De bestrijding van
kinderarmoede blijft dan ook een cruciale uitdaging binnen een meer structurele aanpak van
armoede en sociale uitsluiting. Kijken we naar de sociaaleconomische positie van mensen met een
migratieachtergrond, dan blijkt België een van de minst performante EU-lidstaten te zijn.
Wat de situatie op vlak van huisvesting betreft, blijkt uit de indicatoren dat het aantal mensen in
armoede of sociale uitsluiting enkel toeneemt op de huurmarkt. Tegelijk wijst de EU-SILC-enquête op
hoge huisvestingskosten bij personen met een inkomen onder de armoederisicodrempel. Aangezien
een zwakkere inkomenssituatie bij een en dezelfde bevolkingsgroep optreedt in combinatie met
hogere noodzakelijke uitgaven voor huisvestingsgebonden aspecten, brengt dit ongetwijfeld
moeilijke levensomstandigheden met zich mee.
Het niveau van armoede en sociale uitsluiting is sterk verschillend tussen de deelgebieden (AROPE),
met zeer hoge cijfers in Brussel (+40%), ongeveer 25% in Wallonië en rond de 15% in Vlaanderen . 44
44 Zie ook rapporten bij de deelgebieden:
- Observatoire de la santé et du social Bruxelles, Baromètre Social. Rapport Bruxellois sur l’état de la pauvreté 2014
(http://www.observatbru.be/documents/publications/publications-pauvrete/barometre-social/2014-barometre-
social.xml?lang=fr)

64
Nieuwe, recente gegevens van de Health Interview Survey 2013 bevestigen dat er significante
sociaaleconomische verschillen zijn in gezondheidsstatus en gezondheidsgedrag en levensstijl. Op
basis van de beschikbare aanwijzingen over de oorzaken van gezondheidsongelijkheden mogen we
veronderstellen dat de toenemende sociaal-economische verschillen bij de actieve bevolking de
gezondheidsongelijkheid binnen de bevolking op beroepsactieve leeftijd versterken. België scoort
goed wat betreft de toegankelijkheid van geneeskundige verzorging, maar er zijn meer en beter
vergelijkbare gegevens nodig om de performantie van landen op dit vlak beter te meten.
De wijzigingen in de sociaal-economische positie van ouderen en laaggeschoolden zijn wellicht de
belangrijkste trends die uit de analyse van de indicatoren naar voor komen. Het is, tot slot,
belangrijk om aan te stippen dat deze trends zich reeds vóór de aanvang van de crisis in 2008
begonnen af te tekenen. Bovendien kunnen zij ook op Europees niveau worden vastgesteld. Vooral
wat betreft laaggeschoolden lijkt het bijgevolg te gaan om structurele veranderingen. Voor
laaggeschoolden verzwakken deze ontwikkelingen de arbeidsmarktpositie en tegelijkertijd zetten zij
de sociale bescherming van deze groep onder druk. Beleidsmatig is het van belang om oog te
hebben voor deze structurele aspecten. In dit opzicht is de gezamenlijke uitdaging van de hoge
aantal ‘jobless households’, dat slechts in beperkte mate wordt beïnvloed door de economische
cyclus en veranderingen in de werkzaamheidsgraad, en de lage en dalende toereikendheid van de
sociale uitkeringen voor specifieke groepen onder de actieve bevolking, daarbij een belangrijk
gegeven.
- Studiedienst van de Vlaamse Regering, Vlaamse Armoedemonitor 2014
(http://www4.vlaanderen.be/sites/svr/Pages/2014-07-01-armoedemonitor2014.aspx)
- Les chiffres clés de la Wallonie n°13, décembre 2013, chapitre 6 "Revenus et conditions de vie", p.123-153,
(http://www.iweps.be/sites/default/files/iweps_chiffres_cles_2013deg.pdf), L'indice de situation sociale (ISS) de la
Wallonie (http://www.iweps.be/sites/default/files/iss_wallonie_avril_2014.pdf)

65
ANNEX 5: RESUME FRANÇAIS
La présente note synthétise l’évolution de la situation sociale par rapport aux objectifs de la stratégie Europe 202045. Cette analyse repose principalement sur des indicateurs sociaux européens, complétés par certaines données et études nationales. L’évolution de la situation sociale au sein de l’Union Européenne a été caractérisée ces dernières années par de fortes divergences sociales. Dans certains Etats Membres, la situation sociale est restée relativement stable, mais dans d’autres les conditions de vie se sont sérieusement détériorées. L’évolution basée sur les 2 dernières années semble indiquer une divergence légèrement moins prononcée. La situation économique en Belgique n’a de façon générale pas été affectée par la crise. La
croissance du PIB a été quelque peu meilleure (ou certaines années, moins mauvaise) que celle de
l’ensemble de l’UE. Les déficits budgétaires ont été légèrement inférieurs à ceux de l’EU-28 au cours
des dernières années, mais on s’attend à ce que cette tendance s’inverse dans les années à venir.
Après des décennies de réduction de la dette publique, la crise a eu pour effet de ramener les
niveaux de la dette publique à des taux supérieurs à 100% du PIB. Les dépenses de protection
sociale, exprimées en pourcentage du PIB, ont fluctué autour de la moyenne de la zone euro, et sont
légèrement supérieures à cette moyenne selon les derniers chiffres.
La Belgique figure parmi les Etats membres ayant subi un impact social relativement modéré de la
crise. La taux d’emploi n’est pas très inférieur à celui d’avant la crise. Le taux de chômage a
augmenté d’environ un point de pourcentage entre 2007 et 2013, ce qui représente un chiffre
clairement inférieur à l’augmentation de l’EU28. Le revenu médian des ménages et l’inégalité des
revenus sont également restés stables. Les estimations de l’enquête EU-SILC laissent prévoir une
légère augmentation du nombre de personnes exposées au risque de pauvreté et à l’exclusion
sociale. Cette augmentation est principalement induite par une augmentation du nombre de
personnes vivant dans des ménages à très faible intensité de travail, mais de légères augmentations
sont également enregistrées concernant l’exposition au risque de pauvreté monétaire et la privation
matérielle grave. Jusqu’ici, ces changements n’ont pas été suffisamment importants pour être
statistiquement significatifs et ils ne peuvent donc pas être extrapolés à l’ensemble de la population
avec toute la sécurité voulue. Bien que les chiffres les plus récents concernant 2012-2013 laissent
entrevoir de légères baisses, de façon générale, l’évolution du nombre de personnes en risque de
pauvreté ou d’exclusion sociale de 2008 à 2013 n’est pas significative. Deux remarques importantes
doivent être formulées par rapport à cette image de relative stabilité générale.
Premièrement, à mi-chemin de la stratégie Europe 2020, et sur la base de données portant sur à
présent trois ans depuis le lancement de celle-ci, il n’y a aucune évolution perceptible dans le sens
de la réalisation de l’objectif Europe 2020.
Deuxièmement, derrière cette image de stabilité générale se profilent des tendances divergentes
pour différentes catégories sociales.
Plusieurs indicateurs révèlent une réduction des risques de pauvreté et d’exclusion sociale chez les
personnes de plus de 65 ans. Le taux de risque de pauvreté monétaire et le taux de privation
45 Le suivi de la situation sociale dans le contexte des rapports européens précités est coordonné par le Service public
fédéral (SPF) Sécurité sociale, assisté par le groupe de travail Indicateurs sociaux PNR/RSN, qui est composé d’experts
dans le domaine des indicateurs sociaux, issus d’administrations fédérales et régionales, d’universités, de centres de
recherche et d’organisations de parties prenantes (cf. annexe 4 pour une liste des personnes qui ont participé à la
rédaction de la présente note). Toutefois, la responsabilité du contenu de celle-ci incombe au SPF Sécurité sociale. Cette
note s’inspire du travail préparatoire de l’OSE et de l’HIVA concernant l’actualisation de l’analyse 2013 des indicateurs
sociaux. Pour tout contact : [email protected] ou [email protected].
66
matérielle grave affichent une tendance à la baisse, qui date déjà d’avant la crise et persiste depuis
lors. De même, l’écart de pauvreté a diminué et le taux de remplacement global a augmenté. En
outre, le revenu médian des personnes âgées est resté stable en comparaison avec le revenu médian
de la population active Il convient cependant de noter que ce double constat s’explique par le fait
que ce sont surtout les bas revenus qui ont augmenté, faisant passer une partie des âgés « juste »
au-dessus du revenu médian (qui lui est resté stable). Cette caractéristique a également comme
conséquence que la baisse du taux de pauvreté ne s’observe plus lorsqu’on considère un seuil
alternatif de 70% du revenu disponible m2dian. Même si l’identification des “facteurs” expliquant
l’évolution n’est pas le “scope” de cette note, il est probable que la hausse de certaines pensions
minimales et des effets “cohorts” sont jouent un rôle dans ces évolutions. De plus, il convient
également de faire remarquer que le taux de pauvreté des personnes âgées demeure nettement
supérieur au taux de pauvreté de la population. Enfin, il importe également de signaler que la
situation relative des revenus des personnes âgées accuse encore un retard considérable par rapport
aux niveaux de l’EU28 : les taux de pauvreté des personnes âgées sont supérieurs, et à la fois les taux
de remplacement globaux et le ratio du revenu médian relatif sont nettement inférieurs aux niveaux
de l’EU28. En fonction d’un ensemble d’hypothèses, le futur taux de remplacement pour une
personne ayant 40 ans de carrière et des revenus moyens devrait diminuer légèrement d’ici 2053.
Par ailleurs, en ce qui concerne la population d’âge actif (18-64), une légère augmentation du
risque de pauvreté et de l’exclusion sociale peut être observée. Toutefois, cette augmentation
semble concerner des sous-groupes spécifiques - déjà à haut risque - de cette catégorie d’âge. Cette
augmentation est décelée parmi les personnes les moins qualifiées et exclusivement parmi les
personnes qui louent leur habitation, un groupe de population dont le profil social est en général
plus faible en Belgique – certainement en ce qui concerne le logement social. On a enregistré une
augmentation du nombre de personnes vivant dans des ménages à très faible intensité de travail, et
simultanément une augmentation du risque de pauvreté de ce groupe. En outre, le taux d’emploi de
personnes ayant un faible niveau d’instruction a diminué. De nouvelles recherches devraient étayer
cela davantage46, mais dans l’ensemble, ces observations semblent indiquer des divergences
sociales accrues dans la population d’âge actif.
Les risques très élevés de pauvreté auxquels sont exposés les parents isolés et les ressortissants de
pays hors UE y sont liés et exigent une politique spécifique. Après avoir légèrement augmenté au
cours des années précédentes, le niveau de pauvreté infantile et d’exclusion sociale semble à
présent stable. Toutefois, étant donné le niveau plus élevé du taux de pauvreté infantile par rapport
au taux global de pauvreté et la persistance d’inégalités structurelles en fonction de l’origine sociale
des enfants (par exemple en matière d’enseignement, de comportement lié à la santé, etc.) la lutte
contre la pauvreté infantile reste également un défi majeur dans le cadre d’une approche plus
structurelle de la lutte contre la pauvreté et l’exclusion sociale. En ce qui concerne la situation socio-
économique de personnes issues de l’immigration, la Belgique figure parmi les Etats membres les
moins performants de l’UE.
Concernant la situation en matière de logement, les indicateurs montrent que le nombre de
personnes vivant dans la pauvreté ou l’exclusion sociale n’augmente que sur le marché locatif.
Simultanément, l’enquête EU-SILC révèle des coûts de logement élevés pour les personnes dont les
revenus se situent en deçà du seuil de risque de pauvreté. La concomitance de situations de revenus
46 En se basant sur une analyse de l’évolution des revenus d’un ensemble de types théoriques de ménages ayant des
revenus à différents points dans la répartition des revenus, Cantillon et al. Arrivent à des conclusions semblables
(Cantillon et. al., 2014)

67
plus faibles et de la nécessité de dépenses de logement plus élevées dans les mêmes catégories de
population et chez les mêmes personnes entraîne indiscutablement des conditions de vie pénibles.
Dans les niveaux de pauvreté et d’exclusion sociale (AROPE), il existe de fortes différences régionales
(AROPE) : on enregistre un taux très élevé à Bruxelles (+40%), environ 25% en Wallonie et environ
15% en Flandre.
Des résultats récents issus de l’Enquête de Santé Nationale (Health Interview Survey 2013)
confirment l’existence de différences socio-économiques significatives au niveau de l’état de santé,
du comportement lié à la santé et du mode de vie. En se basant sur des éléments probants actuels
concernant les facteurs de l’inégalité en matière de santé, on peut raisonnablement penser que les
divergences croissantes parmi la population active engendrent également des inégalités en matière
de santé au sein de la population d’âge actif. Concernant l’accessibilité des soins de santé, la Belgique
a de bons résultats, mais davantage de données comparables de meilleure qualité sont requises pour
évaluer les performances des pays.
Les évolutions dans les positions socio-économiques des âgés et des personnes avec un faible niveau
d’éducation sont probablement les tendances les plus importantes qui ressortent de l’analyse des
indicateurs. Il est, de plus, important de préciser que ces tendances se dégageaient déjà avant la
crise en 2008. De même, on peut affirmer que celles-ci se constatent également au niveau européen.
Cela démontre, surtout en ce qui concerne l’affaiblissement sur le marché du travail de la position
des personnes avec un faible niveau d’éducation, qu’il s’agit de changements structurels. Ces
derniers mettent l’adéquation des systèmes de protection sociale sous pression. Il est important que
les politiques tiennent compte du caractère structurel de ces évolutions. A cet égard, cette analyse
met en lumière l’importance majeure du défi commun que représente la forte incidence de la très
faible intensité de travail, qui n’est pratiquement pas affectée par le cycle conjoncturel et les
variations du taux d’emploi, et la faiblesse de l’adéquation - en diminution - des prestations sociales
pour certains groupes spécifique de la population d’âge active.

2
Indicators of Social Protection in Belgium
2
© 2015
FPS Social Security / DG Strategy and Research
Administratief Centrum Kruidtuin
Finance Tower
Kruidtuinlaan 50, box 115
1000 Brussels
www.socialsecurity.fgov.be
Papier: D/2015/10.770/20
Online: D/2015/10.770/21
Responsible editor: Tom Auwers
Related Documents