Analysis of the barley leaf transcriptome under salinity stress using mRNA-Seq Mark Ziemann 1 , Atul Kamboj 2 , Runyararo M. Hove 2 , Shanon Loveridge 1 , Assam El-Osta 1 , Mrinal Bhave 2* 1 Baker IDI Heart and Diabetes Institute, Melbourne, VIC 3004, Australia 2 Environment and Biotechnology Centre, Faculty of Life and Social Sciences, Swinburne University of Technology, PO Box 218, Hawthorn, VIC 3122, Australia. *Corresponding author: Phone 61-3-9214-5759 Facsimile 61-3-9819-0834 Email [email protected] 1 1 2 3 4 5 6 7 8 9 10 11 12 13 14 15 16 17 18 19 20

Welcome message from author
This document is posted to help you gain knowledge. Please leave a comment to let me know what you think about it! Share it to your friends and learn new things together.
Transcript

Analysis of the barley leaf transcriptome under salinity stress using mRNA-Seq
Mark Ziemann1, Atul Kamboj2, Runyararo M. Hove2, Shanon Loveridge1, Assam El-Osta1,
Mrinal Bhave2*
1Baker IDI Heart and Diabetes Institute, Melbourne, VIC 3004, Australia2Environment and Biotechnology Centre, Faculty of Life and Social Sciences,
Swinburne University of Technology, PO Box 218, Hawthorn, VIC 3122, Australia.
*Corresponding author:
Phone 61-3-9214-5759
Facsimile 61-3-9819-0834
Email [email protected]
1
1
2
3
4
5
6
7
8
9
10
11
12
13
14
15
16
17
18
19
20
Abstract
Salinity is a threat to the crops worldwide, and together with drought, it is predicted to be a
serious constraint to food security. However, understanding the impact of this stressor on
plants is a major challenge due to the involvement of numerous genes and regulatory
pathways. While transcriptomic analyses of barley (Hordeum vulgare L.) salt stress have
been reported with microarrays, there are no reports as yet of the use of mRNA-Seq. We
demonstrate the utility of mRNA-Seq by analysing cDNA libraries derived from acutely salt-
stressed and unstressed leaf material of H. vulgare cv. Hindmarsh. The data yielded >50
million sequence tags which aligned to 26,944 sequences in the Unigene reference database.
To gain maximum information, we performed de novo assembly of unaligned reads and
discovered >3,800 contigs, termed novel tentative consensus sequences (NTCs), which are
either new, or significant improvements on current databases. Differential gene expression
screening found 48 significantly up-regulated and 62 significantly down-regulated transcripts.
The work provides comprehensive insights into genome-wide effects of salinity and is a new
resource for study of gene regulation in barley and wheat. Further, the bioinformatics
workflow may be applicable to other non-model plants to establish their transcriptomes and
identify unique sequences.
Key words:
Salinity, barley, gene expression, mRNA-Seq
2
21
22
23
24
25
26
27
28
29
30
31
32
33
34
35
36
37
38
39
40
41
42
43
44

Introduction
Salt and drought stresses are the two most important environmental stresses which limit plant
growth and development. Over 100 countries in the world were identified to be affected by
salinity, covering about 350 million hectares in 1989 (Rengasamy 2006), and the scale of the
problem seems to be increasing at an alarming rate, with >800 M ha (>6% of total land area)
affected by 2000 (Munns and Tester 2008). Salinity, together with drought, has far-reaching
implications for food security, economic sustainability and the irreplaceable biodiversity of
any affected area, and the challenges are expected to be exacerbated by the projected impact
of climate change. The effects of water-insufficiency stresses have been studied extensively,
and in summary, they limit water and micronutrient uptake due to reverse osmotic effects,
and lead to closure of stomata, decline in carbon metabolism, stunted growth, ion/salt toxicity
and reduced yield (Langridge et al. 2006; Munns and Tester 2008).
For plants to survive under such conditions, they must be able to sense and respond rapidly.
Molecular studies on various plants including Arabidopsis thaliana show that these events
involve complex networks of gene regulation (Bartels and Sunkar 2005; Langridge et al.
2006; Munns and Tester 2008), including intracellular signalling pathways such as those
mediated by plant hormones such as abscisic acid (Ma et al. 2009) and ethylene (Xu et al.
2007) and effected through specific transcription factors (Urano et al. 2010), and expression
of diverse functional genes for osmo-regulation/cell protection/acclimation, e.g., Nax (Munns
2005), aquaporins (Tyerman et al. 2002; reviewed in Forrest and Bhave 2007), dehydrins
(Close 1996), redox enzymes (Selote and Khanna-Chopra 2006) and chaperones (Meiri and
Breiman 2009). While the perception of salt and drought may share a common mechanism
(Shinozaki and Yamaguchi-Shinozaki 1997), each stress may also have some unique effects.
For the continued improvement of crops in the face of future environmental and socio-
economic challenges, our understanding of crop responses to drought and salinity will need
to grow. Central to these is a comprehensive understanding of the roles of individual genes,
their transcripts including alternative splice forms, their protein products, as well as the ‘sum’
of all pathways that plants use to manage abiotic stresses, often in a plant-specific manner.
Despite being staple foods around the world, the elucidation of the complete genome
sequence of wheat has been hindered by the complexity of its genome, while a draft barley
3
45
46
47
48
49
50
51
52
53
54
55
56
5758
59
60
61
62
63
64
65
66
67
68
69
70
71
72
73
74
75
76

whole genome sequence has only recently been described (International Barley Genome
Sequencing Consortium et al. 2012). Even in the absence of a whole genome sequence,
transcript profiling has provided important data in recent years for the cataloguing of their
genes. These reports include the barley GeneChip (Walia et al. 2006) that identified several
stress responsive genes; profiling of drought tolerant versus susceptible wheat lines that led to
identification of altered responses of several genes and a new transcription factor
(Mohammadi et al. 2007); wheat arrays that led to several hundred genes related to abiotic
stress response (Kawaura et al. 2008); and wheat GeneChip (Schreiber et al. 2009) that
produced transcript data highly comparable to the barley gene chip (Druka et al. 2006),
supporting the functional closeness of the two species.
The next-generation mRNA-Seq, a high throughput cDNA sequencing technology, is a
powerful method for rapid characterisation of transcript sequences and gene expression levels
in biological samples. It is being applied widely in human genetics and medicine, but is still
an emerging technology for plants. The use of high-throughput sequencers such as the
Roche-454, Solid and Illumina systems has considerable potential to bring high resolution
transcriptome maps to non-model species such as barley. Marioni et al. (2008) critically
evaluated gene expression profiling by RNA-Seq by the Illumina platform to that by
Affymetrix arrays from the same RNA samples, and concluded that RNA-Seq was not only
comparable in elucidating differentially expressed genes, but also had added capabilities of
detecting transcripts with low level expression, identifying sequence variants and new
transcripts. Transcriptome analysis from short-read Illumina sequencing is now beginning to
be carried out for crop species, e.g., rice (Mizuno et al. 2010) and soybean (Severin et al.
2010), which have the advantage of reference whole genome data, and also species such as
chickpea (Garg et al. 2011) without such information. By the FAO (2005) classification of
salinity tolerance, both corn and soybean are moderately tolerant, wheat is tolerant, while
barley is classified as ‘highly tolerant’; hence it may display important genetic attributes
under salt challenge. The cultivar Hindmarsh was chosen for transcriptome analysis here
because it is the most widely cultivated barley variety in Australia (GRDC 2008;
http://www.grdc.com.au/uploads/documents/GRDC_ImpAss_BarleyBreeding1.pdf; p17) and
is particularly suited to regions of South-Eastern Australia with lower rainfall (Modra Seeds
Fact Sheet). In this paper, we compare the transcriptomes of the leaf of barley, a major cereal
crop and a close relative of wheat, in acute salt stressed versus control conditions, and show
the utility of mRNA-Seq for qualitative and quantitative analyses of gene expression profiles.
4
77
78
79
80
81
82
83
84
85
86
87
88
89
90
91
92
93
94
95
96
97
98
99
100
101
102
103
104
105
106
107
108
109
110
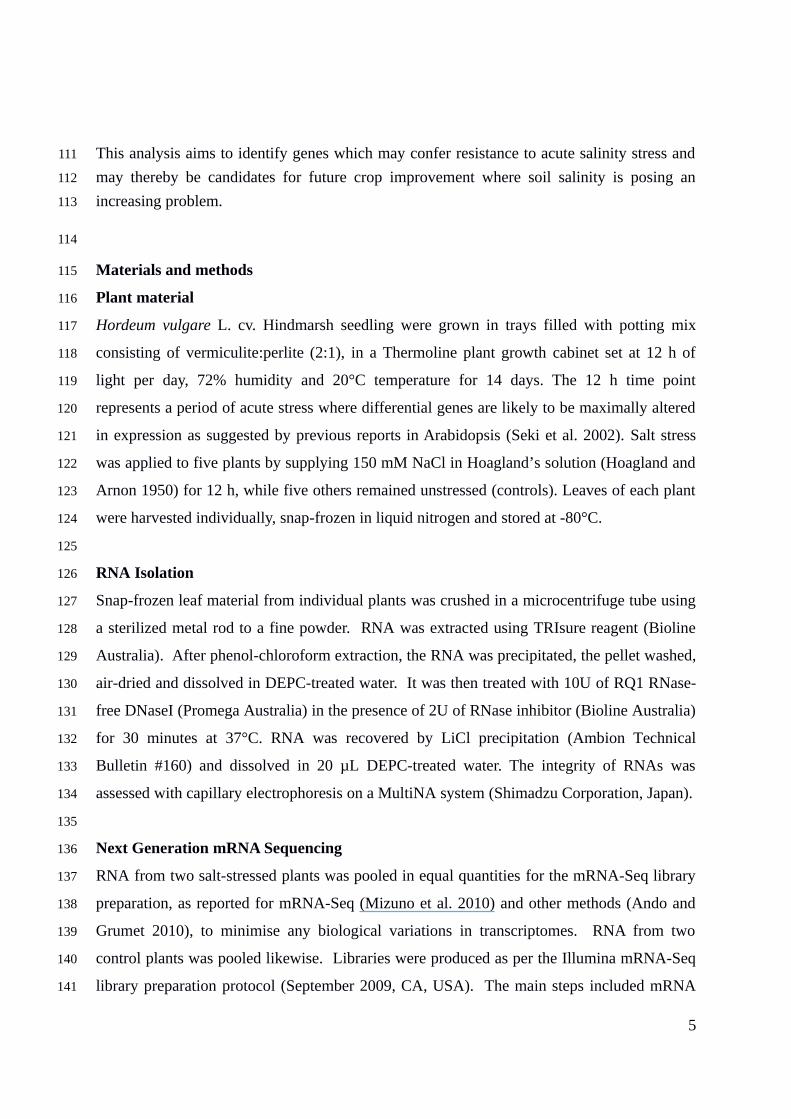
This analysis aims to identify genes which may confer resistance to acute salinity stress and
may thereby be candidates for future crop improvement where soil salinity is posing an
increasing problem.
Materials and methods
Plant material
Hordeum vulgare L. cv. Hindmarsh seedling were grown in trays filled with potting mix
consisting of vermiculite:perlite (2:1), in a Thermoline plant growth cabinet set at 12 h of
light per day, 72% humidity and 20°C temperature for 14 days. The 12 h time point
represents a period of acute stress where differential genes are likely to be maximally altered
in expression as suggested by previous reports in Arabidopsis (Seki et al. 2002). Salt stress
was applied to five plants by supplying 150 mM NaCl in Hoagland’s solution (Hoagland and
Arnon 1950) for 12 h, while five others remained unstressed (controls). Leaves of each plant
were harvested individually, snap-frozen in liquid nitrogen and stored at -80°C.
RNA Isolation
Snap-frozen leaf material from individual plants was crushed in a microcentrifuge tube using
a sterilized metal rod to a fine powder. RNA was extracted using TRIsure reagent (Bioline
Australia). After phenol-chloroform extraction, the RNA was precipitated, the pellet washed,
air-dried and dissolved in DEPC-treated water. It was then treated with 10U of RQ1 RNase-
free DNaseI (Promega Australia) in the presence of 2U of RNase inhibitor (Bioline Australia)
for 30 minutes at 37°C. RNA was recovered by LiCl precipitation (Ambion Technical
Bulletin #160) and dissolved in 20 µL DEPC-treated water. The integrity of RNAs was
assessed with capillary electrophoresis on a MultiNA system (Shimadzu Corporation, Japan).
Next Generation mRNA Sequencing
RNA from two salt-stressed plants was pooled in equal quantities for the mRNA-Seq library
preparation, as reported for mRNA-Seq (Mizuno et al. 2010) and other methods (Ando and
Grumet 2010), to minimise any biological variations in transcriptomes. RNA from two
control plants was pooled likewise. Libraries were produced as per the Illumina mRNA-Seq
library preparation protocol (September 2009, CA, USA). The main steps included mRNA
5
111
112
113
114
115
116
117
118
119
120
121
122
123
124
125
126
127
128
129
130
131
132
133
134
135
136
137
138
139
140
141

enrichment on oligo(dT) beads, reverse transcription (using random primer), synthesis of
second strand, end repair, 3’ adenylation, sequencing adapter ligation and PCR amplification.
A V4 kit was used for cluster generation with a DNA concentration of 8 pM on the Illumina
Cluster Station and the flow cell was loaded onto Illumina Genome Analyzer IIx for
sequencing-by-synthesis for 76 cycles (V4 reagents). Image analysis with RTA v1.8 was
performed for base-calling and sequence file generation.
Bioinformatics methods
Datasets were filtered for spurious reads using the Fastx Artifacts Filter and poor quality
bases were removed from the 3' end with the Fastq Quality Trimmer using a threshold of Q30
(http://hannonlab.cshl.edu/fastx_toolkit/). Initially, Hordeum vulgare Unigene transcript
sequences downloaded from the NCBI database (http://www.ncbi.nlm.nih.gov/unigene; last
accessed November 2011) were used as reference sequences. This database consisted of
26,941 transcripts including those annotated as ‘complete CDS’ and ‘partial CDS’. The 76
nucleotide (nt) mRNA reads were aligned using Burrows-Wheeler Aligner (BWA) (Li and
Durbin 2009) using default settings which allowed up to 4 mismatches in the 76b reads.
Unaligned reads were extracted with SAMtools software (Li et al. 2009) and underwent de
novo assembly using the 'Assembly By Short Sequence’ (ABySS) software package
(Simpson et al. 2009) to elucidate any previously unidentified transcripts. ABySS was run at
a range of k-mer lengths from 27 to 63, using a coverage threshold of 3x. To increase the
contiguity of the assembly, these discrete assemblies were concatenated and re-assembled
using a range of k-mer lengths. Any contigs less than 100 bp were discarded and remaining
contigs were named tentative consensus sequences (TCs). To determine whether these TCs
represented novel sequences, they were BlastN searched to the above Barley Unigene
collection as well as to a rice cDNA database (http://rice.plantbiology.msu.edu/). Novel TCs
were expected to find a relatively strong hit to the rice database and a poor match in the
barley TA database. After trial and error of various ratios (that turned out too stringent or too
non-selective; data not shown), we implemented a rice/barley blast bit score ratio threshold of
≥2 and discarded TCs with a score <2, leaving a set of novel TCs (NTCs), which were
subsequently appended to the Unigene reference. A work-flow diagram is given in Fig. 1.
6
142
143
144
145
146
147
148
149
150
151
152
153
154
155
156
157
158
159
160
161
162
163
164
165
166
167
168
169
170
171
172
173

To perform differential gene expression (DGE) analysis, the Q30 quality trimmed reads were
aligned with BWA to the updated transcriptome database. Ambiguously aligning reads were
not filtered, as this would have biased against contigs which have been extended in length by
the assembly process. Counts for each transcript were extracted with SAMtools (idxstats
feature) and these were subject to DGE analysis using the DESeq software package (Anders
and Huber 2010), using the conservative “blind” method to estimate variance despite lack of
replicates. Transcripts with false discovery rate (Benjamini-Hochberg procedure) adjusted p-
values < 0.05 were considered significantly differentially expressed.
Gene ontology (GO) analysis was performed for up- and down-regulated sets of 200 genes
(selected based on adjusted p-value rank) by first mapping each barley gene to its closest
BlastN match in the rice cDNA database as above, using an e-value threshold of <0.1. The
rice locus name sets were then analysed with the agriGO Singular Enrichment Analysis tool
(Du et al. 2010), using the suggested rice whole transcriptome background. Significance of
the gene set enrichment was evaluated with Fisher test using Yekutieli FDR adjustment, with
a significance threshold set at 0.05.
Validation of NGS findings by semi-quantitative reverse transcriptase PCR
The transcripts analysed by semi-quantitative reverse transcriptase PCR (sqRT-PCR) were
those of Hv.469, Hv.10251, Hv.8888, Hv.8276, Hv.22598, Hv.20929, Hv.30571, Hv.25954,
Hv. 22828, Hv.808, Hv.23281, with actin and α-tubulin as housekeeping controls (Suprunova
et al. 2004). Primers were designed using Netprimer
(http://www.premierbiosoft.com/netprimer/index.html), with the following criteria: length 15-
25 bases; GC content ~50%, minimal secondary structures, and comparable annealing
temperatures (~60°C) of the primers of a pair, to amplify products of 60-372 bp (Table S1).
Three salt-stressed and three control plants were used to extract total RNA individually and
cDNAs were synthesised from each using Bioscript reverse transcriptase (Bioline, Australia).
Purified RNA (1 µg) was mixed with 1 µL of oligo(dT)18 primer (0.5µg/µL) in 12 µL,
incubated at 70 °C for 5 minutes and chilled on ice. 10 U (0.25 µL) of RNase inhibitor,
40mM (1 µL) dNTP, 4 µL of 1X Reaction buffer and 50 U (0.25 µL) of Bioscript (all from
Bioline) were added to a final volume of 20µL, and incubated for 1 h at 37 °C. The reaction
was terminated at 70 °C for 10 min and the cDNAs stored at -20 °C. Absence of genomic
7
174
175
176
177
178
179
180
181
182
183
184
185
186
187
188
189
190
191
192
193
194
195
196
197
198
199
200
201
202
203
204
205

DNA in cDNAs was confirmed by PCR using intron-spanning primers for actin and α-tubulin
(Suprunova et al. 2004) and comparisons to gDNA amplifications. The 25 µL PCR mixes
contained 200 ng cDNA, 12.5 µL of 2X Biomix (Bioline; contains Taq polymerase, dNTPs)
and 0.5 µL (0.1 µg/µL) each of the forward and reverse primers. For sqRT-PCR of each
gene, four identical PCR tubes were prepared for each cDNA, to amplify for 20, 25, 30 and
35 cycles for genes showing relatively high expression in mRNA-Seq, or 25, 30, 35 and 40
cycles for those showing relatively low expression, with typical annealing temperatures of
60°C. Aliquots (5 μL) of each reaction were electrophoresed and the intensity of bands
recorded using Chemidoc XRS Documentation Station and Quantity One software (Bio-Rad).
Differential expression (fold change) was calculated using actin and α-tubulin (Suprunova et
al. 2004) as housekeeping controls that exhibit relatively constant expression.
Results
Next Generation Sequencing
The mRNA-Seq libraries from the control and salt-stressed cDNA were each loaded on one
lane of Illumina Genome Analyser IIx, and yielded over 50 million sequence tags (Table 1).
The reads were curated with artefact filtering and quality trimming and then aligned to the
current barley Unigene database (see Methods) using the BWA program under default
settings, which allowed up to 4 mismatches in 76 nt reads. From this dataset it was found
that out of the 26,944 present in the Unigene reference database, 21,336 transcripts were
detected in the control and 21,574 detected in the salt-stressed sample (1 read or more).
Identification of new transcripts
To discover previously unrecognised transcripts, the remaining 16,434,520 unaligned reads
underwent a two-step de novo assembly in ABySS (Fig. 2). A range of k-mer lengths was
utilised for phase 1, which generated 5,723,131 overlapping contigs from 18 assemblies (k-
mer range 27, 29, etc., up to 63). These contigs then underwent phase 2 assembly, with the
average contig length and N50 length improving dramatically and the number reducing to
<50,000. We selected the k55 assembly for downstream analyses, which yielded 39,707
contigs ≥100 bp in length. These had an average length of 343.9 bp and N50 length of 518
bp (Table 2). The longest contig (TC21595; 13,710 bp) putatively encodes an auxin transport
8
206
207
208
209
210
211
212
213
214
215
216
217
218
219
220
221
222
223
224
225
226
227
228
229
230
231
232
233
234
235
236
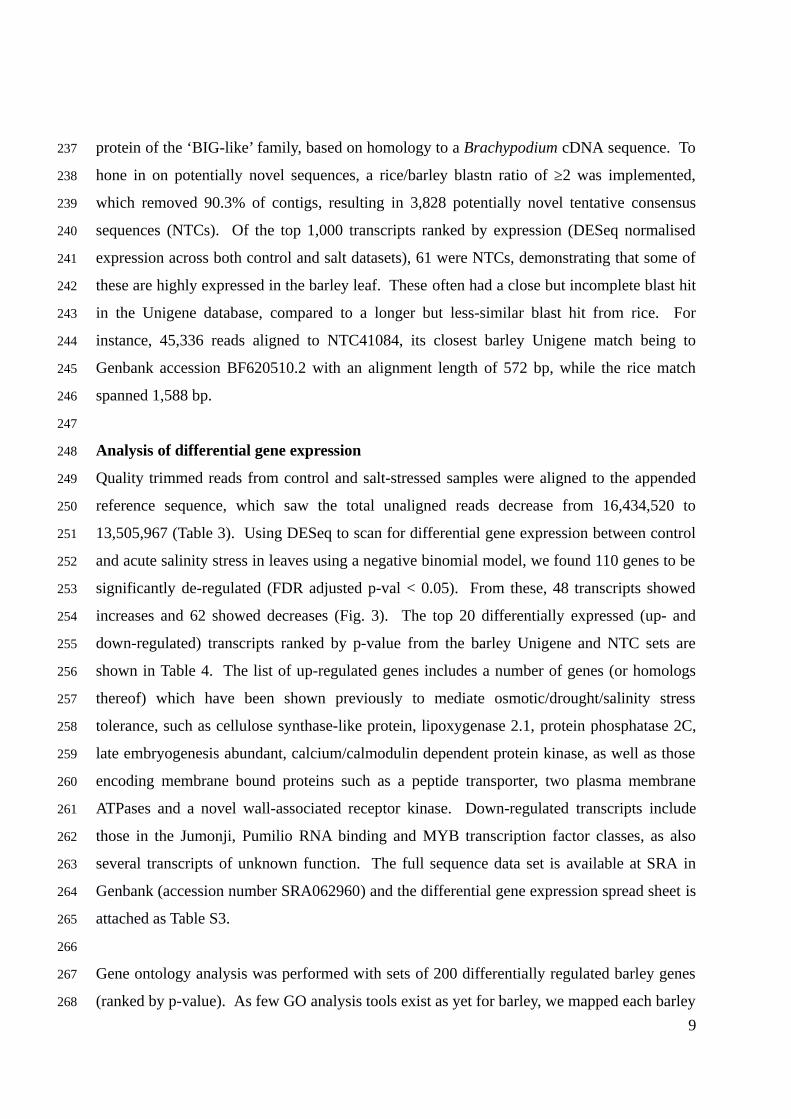
protein of the ‘BIG-like’ family, based on homology to a Brachypodium cDNA sequence. To
hone in on potentially novel sequences, a rice/barley blastn ratio of ≥2 was implemented,
which removed 90.3% of contigs, resulting in 3,828 potentially novel tentative consensus
sequences (NTCs). Of the top 1,000 transcripts ranked by expression (DESeq normalised
expression across both control and salt datasets), 61 were NTCs, demonstrating that some of
these are highly expressed in the barley leaf. These often had a close but incomplete blast hit
in the Unigene database, compared to a longer but less-similar blast hit from rice. For
instance, 45,336 reads aligned to NTC41084, its closest barley Unigene match being to
Genbank accession BF620510.2 with an alignment length of 572 bp, while the rice match
spanned 1,588 bp.
Analysis of differential gene expression
Quality trimmed reads from control and salt-stressed samples were aligned to the appended
reference sequence, which saw the total unaligned reads decrease from 16,434,520 to
13,505,967 (Table 3). Using DESeq to scan for differential gene expression between control
and acute salinity stress in leaves using a negative binomial model, we found 110 genes to be
significantly de-regulated (FDR adjusted p-val < 0.05). From these, 48 transcripts showed
increases and 62 showed decreases (Fig. 3). The top 20 differentially expressed (up- and
down-regulated) transcripts ranked by p-value from the barley Unigene and NTC sets are
shown in Table 4. The list of up-regulated genes includes a number of genes (or homologs
thereof) which have been shown previously to mediate osmotic/drought/salinity stress
tolerance, such as cellulose synthase-like protein, lipoxygenase 2.1, protein phosphatase 2C,
late embryogenesis abundant, calcium/calmodulin dependent protein kinase, as well as those
encoding membrane bound proteins such as a peptide transporter, two plasma membrane
ATPases and a novel wall-associated receptor kinase. Down-regulated transcripts include
those in the Jumonji, Pumilio RNA binding and MYB transcription factor classes, as also
several transcripts of unknown function. The full sequence data set is available at SRA in
Genbank (accession number SRA062960) and the differential gene expression spread sheet is
attached as Table S3.
Gene ontology analysis was performed with sets of 200 differentially regulated barley genes
(ranked by p-value). As few GO analysis tools exist as yet for barley, we mapped each barley
9
237
238
239
240
241
242
243
244
245
246
247
248
249
250
251
252
253
254
255
256
257
258
259
260
261
262
263
264
265
266
267
268

sequence to its best blast hit in rice, and compared these lists to the rice transcriptome-wide
background using agriGO (Du et al. 2010). The set of genes which were down-regulated
(only 120 loci had GO annotation) did not show any significant enrichment (p-val <0.05), but
the set of 200 up-regulated genes (only 104 loci had any GO annotation) was significantly
enriched for genes annotated with ‘response to abiotic stimulus’ (Table S2). The genes in
significant GO terms in the up-regulated list were all linked to response to osmotic stress,
desiccation or water limitation. Combining the up- and down regulated lists showed that the
GO terms ‘response to chemical stimulus’ and ‘response to abiotic stimulus’ were over-
represented.
Validation of transcript profiles by sqRT-PCR
SqRT-PCR of eleven randomly selected sequences from the mRNA-Seq data resulted in
successful amplification of the bands of expected sizes (Fig. S2; Table S1), and quantitation
of the band intensities in relation to house-keeping controls largely supported the direction of
change of expression as detected by mRNA-Seq for all transcripts (Fig. S1). Exceptions to
this occurred when the fold-changes detected were slight, and the deviations were within the
observed variation of the ‘housekeeping’ genes alpha-tubulin (-1.39) and actin (+1.17) in
mRNA-Seq datasets. In cases of extreme fold-changes, sqRT-PCR recorded smaller fold
changes in comparison to those determined with mRNA-Seq due to known limitations (e.g.,
saturation and detection range limits) of ethidium bromide staining of gels and quantitation.
Discussion
Transcriptome profiling by mRNA-Seq is fast becoming an attractive method as it facilitates
rapid generation of large datasets for transcript identification and quantification, even in the
absence of a reference genome. In this work, using just 2 lanes of an Illumina Genome
Analyser flow cell, over 50 million 75 nt reads were generated, amounting to 3.56 Gbp after
quality trimming. In comparison, Genbank contained 525,999 capillary-sequenced barley
ESTs, amounting to 272.6 Mbp (November 2011). It thus appears that mRNA-Seq has a
profound potential for plant biology, as also indicated by recent studies on crop species such
as rice (Mizuno et al. 2010) and soybean (Severin et al. 2010) with reference genomes, and
chickpea (Garg et al. 2011) which assumed no a-priori sequence information.
10
269
270
271
272
273
274
275
276
277
278
279
280
281
282
283
284
285
286
287
288
289
290
291
292
293
294
295
296
297
298
299
300

In this work, we aimed at addressing two main points; to determine barley genes which are
differentially expressed under acute salt stress, and to discover previously un-identified
transcripts in the barley leaf. To this end, we show that the two-phase assembly method
significantly improved the contiguity over the standard assembly, with k55 N50 increasing
from 223 bp to 518 bp. Furthermore, the use of stringent blast ratio filtering enabled the
discovery of 3,828 NTCs, some of which are new and others are more complete in size.
While many of the differentially regulated genes identified here agree with previous work
using microarrays (Ueda et al. 2004), differentially expressed NTCs found here represent
transcripts which could not have been detected using microarray technology. One such NTC
is a 2.0 kb transcript encoding a wall-associated receptor kinase-like 22, which has only a 450
bp blast hit in the current barley Unigene database but a 1.2 kbp match to rice and
Brachypodium homologues. A related gene in Arabidopsis, WAKL4, is responsive to Na+ as
well as other cations such as K+, Ni2+ and Zn2+ (Hou et al. 2005).
An early-responsive to dehydration stress (ERD4) homolog, known as late embryogenesis
abundant (LEA), is strongly up-regulated by acute salinity in this dataset and has been
investigated in maize (Liu et al. 2009), wherein this gene is not only induced upon salinity
stress, but its over-expression in Arabidopsis leads to enhanced tolerance to drought and
salinity. In barley, this gene is shown to confer tolerance to osmotic stresses (Xu et al. 1996).
Other strongly upregulated candidates for future functional work could include the
chloroplast localised lipoxygenase 2.1, a plasma membrane bound ATPase, an ODORANT1
homologue, as well as a protein phosphatase 2C. A highly expressed aquaporin was among
the most decreased in expression (ranked 121 highest in control, down to 3,016 in salt),
indicating water transport processes within the leaf could be strongly reduced under acute salt
stress.
Comparison of this mRNA-Seq dataset to previously described array experiments (Walia et
al. 2007) yielded a moderate correlation of fold change, with 5,334 of the 15,000 highest
expressed transcripts showing contradictory fold changes (data not shown). Many factors
could explain this disparity, including the different lines of barley used, different regimens of
salt stress and different analysis chemistries. Investigation of 11 transcripts with sqRT-PCR
shows general agreement between the two techniques (Fig. S1). While the direction of
11
301
302
303
304
305
306
307
308
309
310
311
312
313
314
315
316
317
318
319
320
321
322
323
324
325
326
327
328
329
330
331
332

expression changes was largely consistent between both methods, the magnitude of fold
change found with sqRT-PCR was generally smaller than that of mRNA-Seq (Table S1).
The data demonstrate that mRNA-Seq is an excellent high-throughput methodology for gene
expression, which will be crucial to revealing the scale of variations in barley germ-plasm
and accurate mapping of quantitative trait loci. As next-generation sequencing technologies
and associated bioinformatics methods continue to improve, these will become more
commonplace in plant biology will result in a comprehensive high quality annotation of the
barley and wheat genomes. Until then, this study provides a valuable dataset containing
thousands of novel transcripts and a snapshot of differential expression due to acute salt
stress. The outcomes serve as a useful reference for future hypothesis-driven studies in
barley and the closely related and most important cereal, wheat. Reverse genetic studies of
these salinity responsive genes could uncover genes which contribute to salinity tolerance.
Author Contributions Statement
Mark Ziemann performed mRNA-Seq and bioinformatics, generated figures and co-wrote the
manuscript. Atul Kamboj and Runyararo M. Hove prepared plant material, undertook qPCR,
generated figures and edited the manuscript. Shanon Loveridge assisted with expert
bioinformatics analysis. Assam El-Osta co-wrote and edited the manuscript. Mrinal Bhave
undertook experimental planning and co-wrote and edited the manuscript.
References
Ando K, Grumet R (2010) Transcriptional profiling of rapidly growing cucumber fruit by 454-pyrosequencing analysis. J Amer Soc Hort Sci 135:291-302
Anders S, Huber W (2010) Differential expression analysis for sequence count data. Genome Biol 11: R106
Bartels D, Sunkar R (2005) Drought and salt tolerance in plants. Crit Rev Plant Sci 24:23-58
Close TJ (1996) Dehydrins: emergence of a biochemical role of a family of plant dehydration proteins. Physiol Plant 97:795-803
Druka A, Muehlbauer G, Druka I, Caldo R, Baumann U, Rostoks N, Schreiber A, Wise R, Close T, Kleinhofs A, Graner A, Schulman A, Langridge P, Sato K, Hayes P, McNicol J, Marshall D, Waugh R (2006) An atlas of gene expression from seed to seed through barley development. Funct Integr Genom 6:202-211
12
333
334
335
336
337
338
339
340
341
342
343
344
345
346
347
348
349
350
351
352
353
354355356357358359360361
362363
364365366
367368369370371

Du Z, Zhou X, Ling Y, Zhang Z, Su Z (2010) agriGO: a GO analysis toolkit for the agricultural community. Nucleic Acids Res 38 (Suppl 2):w64-w70
Food and Agriculture Organisation of the United Nations (2005) Management of irrigation-induced salt-affected soils ftp://ftp.fao.org/agl/agll/docs/salinity_brochure_eng.pdf
Forrest KL, Bhave M (2007) Major intrinsic proteins (MIPs) in plants: a complex gene family with major impacts on plant phenotype. Funct Integr Genom 7:263-289
Garg R, Patel RK, Tyagi AK, Jain M (2011) De novo assembly of chickpea transcriptome using short reads for gene discovery and marker identification. DNA Res 18:53-63
Grains Research & Development Corporation (2008) GRDC Impact Assessment Report Series: An Economic Analysis of GRDC’s Investment in Barley Breeding http://www.grdc.com.au/uploads/documents/GRDC_ImpAss_BarleyBreeding1.pdf
Hoagland DR, Arnon DI (1950) The water culture method for growing plants without soil. University of California Agric. Exp station, Berkley Circular 347
Hou X, Tong H, Selby J, Dewitt J, Peng X, He ZH (2005) Involvement of a cell wall-associated kinase, WAKL4, in Arabidopsis mineral responses. Plant Physiol 139:1704-1716
International Barley Genome Sequencing Consortium, Mayer KF, Waugh R, Brown JW, Schulman A, Langridge P, Platzer M, Fincher GB, Muehlbauer GJ, Sato K, Close TJ, Wise RP, Stein N (2012) A physical, genetic and functional sequence assembly of the barley genome. Nature 29:711-716
Kawaura K, Mochida K, Ogihara Y. (2008) Genome-wide analysis for identification of salt-responsive genes in common wheat. Funct Integr Genomics 8:277-286
Langridge P, Paltridge N, Fincher G (2006) Functional genomics of abiotic stress tolerance in cereals. Briefings Funct Genom Proteom 4:343-354
Li H, Durbin R (2009) Fast and accurate short read alignment with Burrows-Wheeler transform. Bioinforma 25:1754-1760
Li H, Handsaker B, Wysoker A, Fennell T, Ruan J, Homer N, Marth G, Abecasis G, Durbin R; 1000 Genome Project Data Processing Subgroup (2009) The Sequence Alignment/Map format and SAMtools. Bioinforma 25:2078-2079
Liu YH, Li HY, Shi YS, Song YC, Wang TY, Li Y (2009) A maize early responsive to dehydration gene, ZmERD4, provides enhanced drought and salt tolerance in Arabidopsis. Plant Mol Biol Rep 27:542-548
Ma Q, Dai X, Xu Y, Guo J, Liu Y, Chen N, Xiao J, Zhang D, Xu Z, Zhang X, Chong K (2009) Enhanced tolerance to chilling stress in OsMYB3R-2 transgenic rice is mediated
13
372373374
375376377
378379380
381382383
384385386387
388389390
391392393394395396397398399400401402403404405406407408
409410411412
413414415416
417418

by alteration in cell cycle and ectopic expression of stress genes. Plant Physiol 150:244-256
Marioni JC, Mason CE, Mane SM, Stephens M, Gilad Y (2008) RNAseq: An assessment of technical reproducibility and comparison with gene expression arrays. Genom Res 18:1509-1517
Meiri D, Breiman A (2009) Arabidopsis ROF1 (FKBP62) modulates thermotolerance by interacting with HSP90.1 and affecting the accumulation of HsfA2-regulated sHSPs. Plant J 59:387-399
Mizuno H, Kawahara Y, Sakai H, Kanamori H, Wakimoto H, Yamagata H, Oono Y, Wu J, Ikawa H, Itoh T, Matsumoto T (2010) Massive parallel sequencing of mRNA in identification of unannotated salinity stress-inducible transcripts in rice (Oryza sativa L). BMC Genom 11:683-695
Modra Seeds Fact Sheet, February 2011http://www.modraseeds.com.au/pdf/Hindmarsh_Factsheet_Feb_2011.pdf
Mohammadi M, Kav NNV, Deyholos MK (2007) Transcriptional profiling of hexaploid wheat (Triticum aestivum L.) roots identifies novel, dehydration-responsive genes. Plant Cell Environ 30:630-645
Munns R (2005) Genes and salt tolerance: bringing them together. New Phytol 167:645-663
Munns R, Tester M (2008) Mechanisms of salinity tolerance. Ann Rev Plant Biol 59:651-681
Rengasamy P (2006) World salinization with emphasis on Australia. J Expt Bot 57:1017-1023
Schreiber AW, Sutton T, Caldo RA, Kalashyan E, Lovell B, Mayo G, Muehlbauer GJ, Druka A, Waugh R, Wise RP, Langridge P, Baumann U (2009) Comparative transcriptomics in the Triticeae. BMC Genom 10:285-301
Seki M, Narusaka M, Ishida J, Nanjo T, Fujita M, Oono Y, Kamiya A, Nakajima M, Enju A, Sakurai T, Satou M, Akiyama K, Taji T, Yamaguchi-Shinozaki K, Carninci P, Kawai J, Hayashizaki Y, Shinozaki K. (2002) Monitoring the expression profiles of 7000 Arabidopsis genes under drought, cold and high-salinity stresses using a full-length cDNA microarray. Plant J 31:279-292
Selote DS, Khanna-Chopra R (2006) Drought-acclimation confers oxidative stress tolerance by inducing coordinated antioxidant defense at cellular and subcellular level in leaves of wheat seedlings. Physiol Plant 127:494-506
Severin AJ, Woody JL, Bolon YT, Joseph B, Diers BW, Farmer AD, Muehlbauer GJ, Nelson RT, Grant D, Specht JE, Graham MA, Cannon SB, May GD, Vance CP, Shoemaker RC
14
419420421422423424425
426427428429
430431432433434435436437438439440441
442443
444445
446447448
449450451452
453454455456457458
459460461462
463464

(2010) RNA-Seq atlas of Glycine max: a guide to the soybean transcriptome. BMC Plant Biol 10:160-175
Shinozaki K, Yamaguchi-Shinozaki K (1997) Gene expression and signal transduction in water-stress response. Plant Physiol 115:327-334
Simpson JT, Wong K, Jackman SD, Schein JE, Jones SJ, Birol I (2009) ABySS: a parallel assembler for short read sequence data. Genome Res 19:1117-1123
Suprunova T, Krugman T, Fahima T, Chen G, Shams I, Korol A, Nevo E (2004) Differential expression of dehydrin genes in wild barley, Hordeum spontaneum, associated with resistance to water deficit. Plant Cell Environ 27:1297-1308
Tyerman SD, Niemietz CM, Bramley H (2002) Plant aquaporins: multifunctional water and solute channels with expanding roles. Plant Cell Environ 25:173-194
Urano K, Kurihara Y, Seki M, Shinozaki K (2010) ‘Omics’ analyses of regulatory networks in plant abiotic stress responses. Curr Opin Plant Biol 13:132-138
Ueda A, Kathiresan A, Inada M, Narita Y, Nakamura T, Shi W, Takabe T, Bennett J (2004) Osmotic stress in barley regulates expression of a different set of genes than salt stress does. J Exp Bot 55:2213-2218
Walia H, Wilson C, Wahid A, Condamine P, Cui X, Close TJ (2006) Expression analysis of barley (Hordeum vulgare L.) during salinity stress. Funct Integr Genom 6:143-156
Walia H, Wilson C, Condamine P, Ismail AM, Xu J, Cui XP, Close TJ (2007) Array-based genotyping and expression analysis of barley cv. Maythorpe and Golden Promise. BMC Genom 8:87-100
Xu D, Duan X, Wang B, Hong B, Ho T, Wu R (1996) Expression of a Late Embryogenesis Abundant Protein Gene, HVA1, from Barley Confers Tolerance to Water Deficit and Salt Stress in Transgenic Rice. Plant Physiol 110:249-257
Xu ZS, Xia LQ, Chen M, Cheng XG, Zhang RY, Li LC, Zhao YX, Lu Y, Ni ZY, Liu L, Qiu ZG, Ma YZ (2007) Isolation and molecular characterization of the Triticum aestivum L. ethylene-responsive factor1 (TaERF1) that increases multiple stress tolerance. Plant MolBiol 65:719-732
15
465466467
468469470
471472473474475476477
478479480
481482483
484485486487
488489490
491492493494
495496497498
499500501502
Figure Legends
Fig. 1 Study design.
mRNA-Seq is performed on material derived from control and salt-stressed barley leaves.
Reads unaligned to current databases are assembled to discover novel sequences. These
sequences are blasted to rice and barley databases to determine novelty. The final contig set is
analysed for differential gene expression.
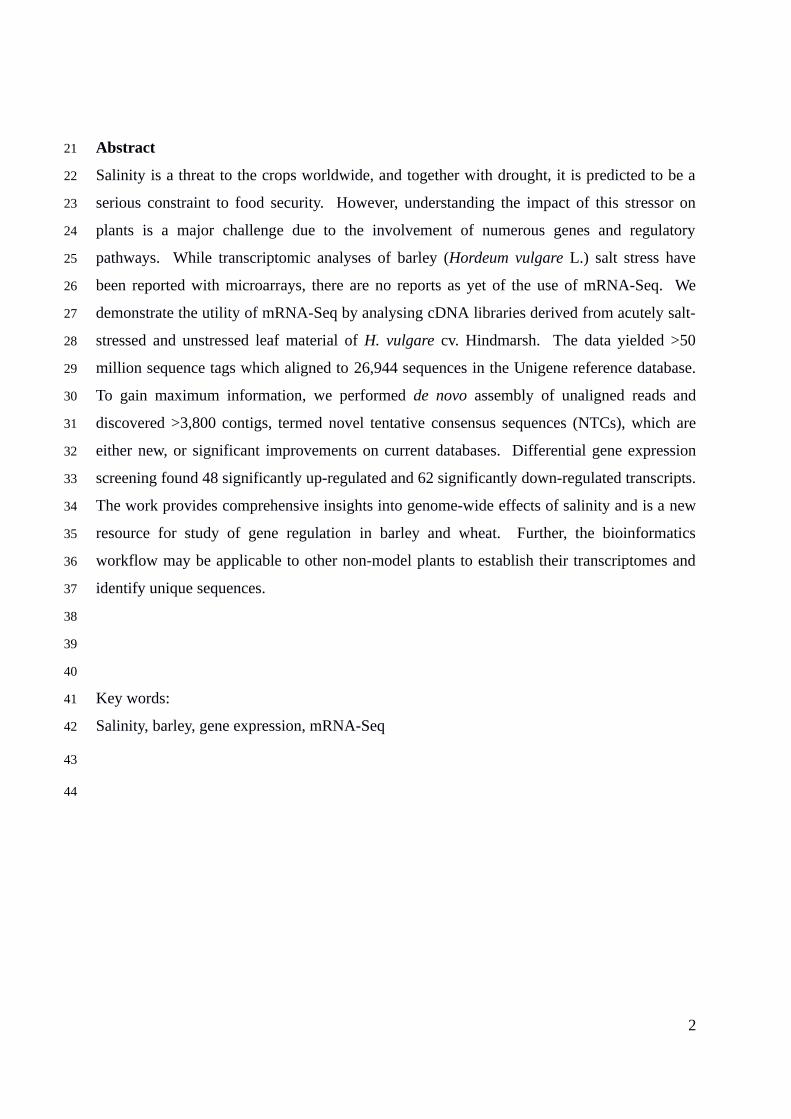
Fig. 2 Process of identifying novel sequences from mRNA-Seq data.
(a) The schematic consolidation of data by assembly of reads, merging of overlapping
contigs, filtering by Blast ratio. (b) The number of identified contigs ≥100bp in phase one
assembly using k-mer 27 to 63. (c) Phase 1- average contig length. (d) Phase 1 - N50 length.
(e) Phase 2 - number of contigs ≥100bp. (f) Phase 2- average contig length. (g) Phase 2- N50
length. (h) Length distribution for final assembly using k55, as a k-mer of 55 was selected
for further analysis. (i) Blast ratio filtering: the Blast bit score of the best hit in the rice
database (y-axis) is plotted against the bit score of the best hit in the barley database (x-axis),
with points in red denoting contigs passing filtering (NTCs) and those in black being
discarded.
Fig. 3 Differential gene expression of NTCs and known transcripts.
A smear plot (a) showing the base mean expression versus the Log2 of fold change for NTCs
shown in red and known contigs shown in black. Large points indicate those considered
significantly differentially regulated by salt stress (adj p-value < 0.05). A distribution of p-
values for NTCs and known transcripts (b).
16
503
504505
506
507
508
509
510
511
512
513
514
515
516
517
518
519
520
521
522
523
524
525
526

Table 1 mRNA-Seq data yields from Genome Analyzer IIx sequencingControl dataset
Salt stress dataset
Original read length (bp) 76 76Original number of reads (million) 23.7 26.7Original sequence yield (Gbp) 1.80 2.03Sequence yield after artifact filtering (Gbp) 1.80 2.03Number of reads after Q30 quality filtering (million) 23.4 26.1Sequence yield after Q30 quality filtering (bp) 1.70 1.86Number of reads aligning to Unigene DB (million) 16.6 16.4% Reads aligned 70.9 63.0Number of unaligned reads (million) 6.79 9.64Unaligned sequence (Gbp) 0.496 0.698

Table 2 Results from the two-phase assembly using AbySS
Phase1 of AssemblyNumber of unmerged contigs from k27-k63 assembly 5,723,131Number of unmerged contigs ≥100bp 954,420Average length (bp) 235N50 Length (bp) 256Longest contig (bp) 12,314Phase2 of Assembly (k-mer =55)Number of merged contigs 50,499Number of merged contigs ≥100bp 39,707Average length (bp) 344N50 Length (bp) 518Longest contig (bp) 13,710Assembly size (bp) 13,696,077Contigs with Rice/Barley Blast Ratio ≥2 3,828
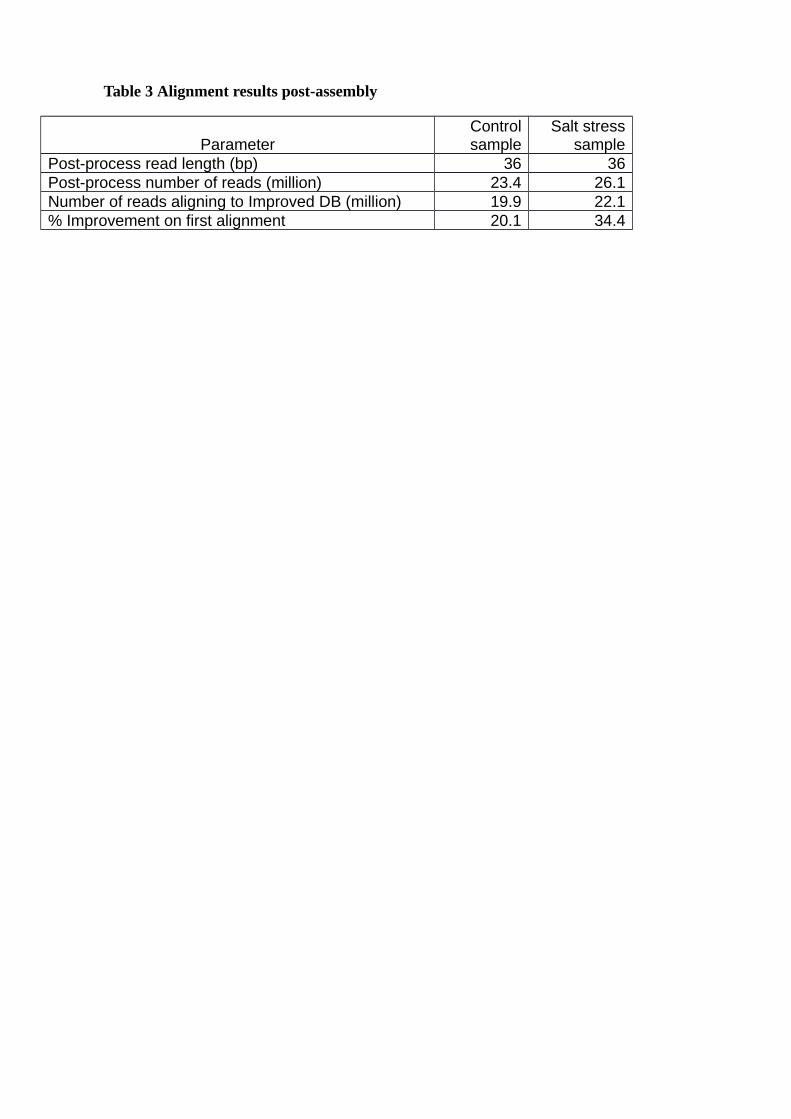
Table 3 Alignment results post-assembly
ParameterControl sample
Salt stress sample
Post-process read length (bp) 36 36Post-process number of reads (million) 23.4 26.1Number of reads aligning to Improved DB (million) 19.9 22.1% Improvement on first alignment 20.1 34.4

Table 4 Top 20 up-regulated and down-regulated transcripts ranked by p-value
AccessionReads Control
Reads Salt
Log2 Fold Change
P-value (FDR adjusted) Nearest rice blast hit* Rice_annotation
Hv.29838 20 827 5.3 1.12E-5 LOC_Os07g36750 CSLF3 - cellulose synthase-like family F; beta1,3;1,4 glucan synthase, expressed
Hv.5008 125 3701 4.9 7.76E-5 - unclassified transcript
Hv.31363 4 224 5.8 2.82E-4 LOC_Os12g37260 lipoxygenase 2.1, chloroplast precursor, putative, expressed
Hv.8934 29 640 4.4 3.40E-4 LOC_Os04g40990 malate synthase, glyoxysomal, putative, expressed
Hv.17368 44 843 4.2 0.001 LOC_Os05g46040 protein phosphatase 2C, putative, expressed
Hv.2654 9 261 4.8 0.001 LOC_Os07g44060 haloacid dehalogenase-like hydrolase family protein, putative, expressed
Hv.29473 10 264 4.7 0.002 - unclassified transcript
Hv.3400 2 137 6.1 0.002 LOC_Os01g12580 late embryogenesis abundant protein, putative, expressed
Hv.30848 3 149 5.6 0.002 LOC_Os03g48310 plasma membrane ATPase, putative, expressed
Hv.32578 4 164 5.3 0.002 LOC_Os04g02000 zinc finger family protein, putative, expressed
Hv.17120 40 603 3.9 0.003 LOC_Os10g41490 CAMK_CAMK_like.41 - CAMK includes calcium/calmodulin dependent protein kinases, expressed
Hv.15443 41 566 3.8 0.004 LOC_Os04g47700 expressed proteinNTC25482 58 754 3.7 0.004 LOC_Os02g42110 wall-associated receptor kinase-like 22 precursor, putative, expressed
Hv.32190 6 172 4.8 0.004 LOC_Os03g19600 retrotransposon protein, putative, unclassified, expressed
Hv.5085 11 229 4.4 0.005 LOC_Os07g05365 photosystem II 10 kDa polypeptide, chloroplast precursor, putative, expressed
Hv.30861 2 104 5.7 0.007 LOC_Os03g48310 plasma membrane ATPase, putative, expressed
Hv.10528 234 2825 3.6 0.008 LOC_Os09g35880 B-box zinc finger family protein, putative, expressed
Hv.5729 1 56 4.8 0.008 LOC_Os06g38294 peptide transporter PTR2, putative, expressedNTC26185 3 230 4 0.009 LOC_Os09g25700 TsetseEP precursor, putative, expressed
Hv.12388 89 976 3.4 0.009 LOC_Os09g02180 expressed protein
AccessionReads Control
Reads Salt
Log2 Fold Change
P-value (FDR adjusted) Nearest rice blast hit* Rice_annotation
Hv.16656 5229 25 -7.7 2.65E-9 LOC_Os12g31000 pumilio-family RNA binding repeat domain containing protein, expressed
Hv.2383 1413 10 -7.2 6.16E-9 LOC_Os10g25060 expressed protein
Hv.6975 798 5 -7.3 8.44E-9 LOC_Os04g47140 expressed protein
Hv.33010 382 2 -7.6 2.52E-7 LOC_Os09g31380 jmjC domain-containing protein 5, putative, expressed
Hv.13882 771 10 -6.3 2.52E-7 LOC_Os04g02880 expressed protein
Hv.10251 950 14 -6.1 2.52E-7 LOC_Os03g58300 indole-3-glycerol phosphate lyase, chloroplast precursor, putative, expressed
Hv.34103 230 1 -7.9 1.13E-5 LOC_Os03g08580 expressed protein
Hv.37409 1475 43 -5.1 1.13E-5 LOC_Os04g57880 heat shock protein DnaJ, putative, expressed
Hv.20312 1873 57 -5.1 1.73E-5 LOC_Os01g74020 MYB family transcription factor, putative, expressed
Hv.30597 712 22 -4.8 6.27E-5 LOC_Os01g05060 mitochondrial glycoprotein, putative, expressed
Hv.13356 234 3 -6.3 6.30E-5 LOC_Os04g49450 MYB family transcription factor, putative, expressed

Hv.19411 4919 160 -5 7.65E-5 LOC_Os06g19444 CCT/B-box zinc finger protein, putative, expressed
Hv.9005 1081 51 -4.4 2.31E-4 LOC_Os03g55280 semialdehyde dehydrogenase, NAD binding domain containing protein, putative, expressed
Hv.8557 391 14 -4.8 2.82E-4 LOC_Os03g16780 ankyrin repeat family protein, putative, expressed
Hv.20948 7350 295 -4.6 3.49E-4 LOC_Os05g37520 expressed protein
Hv.19979 934 50 -4.2 4.90E-4 LOC_Os07g42650 expressed protein
Hv.19759 1439 82 -4.2 0.001 LOC_Os02g40510 response regulator receiver domain containing protein, expressed
Hv.30983 2304 135 -4.1 0.001 LOC_Os03g63910 PPR repeat domain containing protein, putative, expressed
Hv.8625 214 5 -5 0.001 LOC_Os07g48050 peroxidase precursor, putative, expressed
Hv.21993 270 11 -4.6 0.002 LOC_Os12g43600 RNA recognition motif containing protein, expressed
*Annotations were mined from best Blastn hits in the Rice database using an e-value threshold of <0.1

Figure 1. Study design
control salt stress12h
RNA
mRNA-seq
Alignment to barley Unigene DB
Known transcript set
Aligned sequences
De novo assembly
Unaligned sequences
Differential gene expression and variant analysis
BLAST against rice and barley cDNA
Novel transcript set

Figure 2. Process of identifying novel sequences from mRNA-Seq data.
Figure 2 (a)
Unaligned reads
ABySS unmerged contigs
Blast Ratio FilteredNew Tentative Consensus Sequences
ABySS merged contigs

Figure 2(b)
k27 k29 k31 k33 k35 k37 k39 k41 k43 k45 k47 k49 k51 k53 k55 k57 k59 k61 k630
10000
20000
30000
40000
50000
60000
70000
Contigs >100

Figure 2(c)
k27 k29 k31 k33 k35 k37 k39 k41 k43 k45 k47 k49 k51 k53 k55 k57 k59 k61 k63200
205
210
215
220
225
230
235
240
245
250
Average Contig Length

Figure 2(d)
k27 k29 k31 k33 k35 k37 k39 k41 k43 k45 k47 k49 k51 k53 k55 k57 k59 k61 k630
50
100
150
200
250
300
N50 Length

Figure 2(e)
k27 k29 k31 k33 k35 k37 k39 k41 k43 k45 k47 k49 k51 k53 k55 k57 k59 k61 k630
10000
20000
30000
40000
50000
60000
Contigs >100

Figure 2(f)
k27 k29 k31 k33 k35 k37 k39 k41 k43 k45 k47 k49 k51 k53 k55 k57 k59 k61 k630
50
100
150
200
250
300
350
400
450
Average Contig Length

Figure 2(g)
k27 k29 k31 k33 k35 k37 k39 k41 k43 k45 k47 k49 k51 k53 k55 k57 k59 k61 k630
100
200
300
400
500
600
700
N50 Length

Figure 2(h)
100-199
200-399
400-599
600-799
800-999
1000-1499
1500-1999
2000-2999
3000-4999
5000-9999
10000-13999
1 10 100 1000 10000 100000

Figure 2(i)
25 250 250025
250
2500
≥2 n=3,828<2 n=35,795
Barley blastn bit score
Ric
e b
last
n b
it sc
ore

Figure 3. Differential gene expression of NTCs and known transcripts. Figure 3(a) Comparison of control and salt gene expression
1 10 100 1000 10000 100000 1000000-8
-6
-4
-2
0
2
4
6
8 abcd
Base Mean Expression
Log2
Fol
d C
hang
e
Large icons NTC p<0.05 n=6Large icons HvUnigene p<0.05 n=90Small icons NTC p≥0.05 n=3,822Small icons HvUnigene p≥0.05 n=26,845

Figure 3(b) Distribution of p-values
Undetected1
0.9-0.990.8-0.890.7-0.790.6-0.690.5-0.590.4-0.490.3-0.390.2-0.290.1-0.19
0.09-0.0990.08-0.0890.07-0.0790.06-0.0690.05-0.0590.04-0.0490.03-0.0390.02-0.0290.01-0.019
<0.01
1 100 10000 1000000
NTCUnigene
Number of transcripts
Ad
just
ed
p-v
alu
e r
an
ge
Related Documents