EUKARYOTIC CELL, Feb. 2007, p. 271–279 Vol. 6, No. 2 1535-9778/07/$08.000 doi:10.1128/EC.00235-06 Copyright © 2007, American Society for Microbiology. All Rights Reserved. Analysis of Thalassiosira pseudonana Silicon Transporters Indicates Distinct Regulatory Levels and Transport Activity through the Cell Cycle Kimberlee Thamatrakoln† and Mark Hildebrand* Marine Biology Research Division, Scripps Institution of Oceanography, 9500 Gilman Dr., La Jolla, California 92093-0202 Received 18 July 2006/Accepted 6 December 2006 An analysis of the expression and activity of silicon transporters (SITs) was done on synchronously growing cultures of the diatom Thalassiosira pseudonana to provide insight into the role these proteins play in cellular silicon metabolism during the cell cycle. The first SIT-specific polyclonal peptide antibody was generated and used in the immunoblot analysis of whole-cell protein lysates to monitor SIT protein levels during synchronized progression through the cell cycle. Peaks in SIT protein levels correlated with active periods of silica incor- poration into cell wall substructures. Quantitative real-time PCR on each of the three distinct SIT genes (TpSIT1, TpSIT2, and TpSIT3) showed that mRNA levels for the most highly expressed SIT genes peaked during the S phase of the cell cycle, a period prior to maximal silicon uptake and during which cell wall silicification does not occur. Variations in protein and mRNA levels did not correlate, suggesting that a significant regulatory step of SITs is at the translational or posttranslational level. Surge uptake rates also did not correlate with SIT protein levels, suggesting that SIT activity is internally controlled by the rate of silica incorporation. This is the first study to characterize SIT mRNA and protein expression and cellular uptake kinetics during the course of the cell cycle and cell wall synthesis, and it provides novel insight into SIT regulation. Silicon is an important element in biology, from bacteria to humans (7). The hydrated form of silicon, called silicic acid, is considered an important nutrient for plant growth (23, 54), and silica, the polymerized form of silicon, is used by certain plants for rigidity, fungal resistance, and defense against grazers. In animals, silicon has a wide range of systemic effects (5) in addition to being essential for proper bone and collagen for- mation (12, 57). Despite the importance of silicon to life on Earth, the molecular details of biological interactions with silicon and regulatory mechanisms are poorly understood. One of the largest groups of silicifying organisms is diatoms, uni- cellular, eukaryotic phytoplankton that use silica as a cell wall material. These organisms are found predominantly in aquatic environments but are capable of living in soils and ice. Diatoms play a dominant role in silicon biogeochemistry (49, 63), and because they are estimated to contribute 20% of global pri- mary production (49), they play an important role in the global carbon cycle. Because most diatom species have an obligate silicon requirement for growth (19) and naturally process large amounts of silicon, they are an excellent model system for investigations into biological interactions with silicon. The silicified diatom cell wall, or frustule, is composed of two overlapping halves, with the upper half called the epitheca and the lower half the hypotheca. Thecae consist of a valve, the species-specific structure capping each end, and girdle bands, a series of overlapping siliceous strips extending on the sides and in the region overlapping the two thecae. Vegetative cell divi- sion in certain diatom species begins with the mother cell expanding by synthesizing girdle bands (52). Cytokinesis fol- lows, and on adjacent areas of the two daughter cell proto- plasts (still contained within the mother cell), new valves are formed. Silica polymerization occurs within an organelle called the silica deposition vesicle, bounded by a membrane called the silicalemma (18, 53, 56). Once the valve is completely formed, it is exocytosed and the daughter cells separate. This intimate connection between cell wall synthesis and the cell cycle results in a tight coupling of silicon metabolism and cell division. In diatoms, silicon is taken up from the environment pre- dominantly as silicic acid (20). Although the average oceanic concentration of silicic acid is 70 M, in surface waters, where diatoms are most common, levels can be less than 10 M (63). In contrast, intracellular concentrations of silicic acid can be several hundred millimolar depending on the species (45); therefore, diatoms must posses an efficient uptake system to overcome this 1,000-fold difference. Data suggest that silicon uptake in diatoms follows Michaelis-Menten saturation kinet- ics with K s values between 0.2 and 7.7 M and the maximum rate of uptake ranging from 1.2 to 950 fmol Si cell 1 h 1 (6, 39, 40, 45, 59, 60, 64). The coupling of the diatom cell cycle and silicon metabolism (9, 13, 17, 55) has an effect on transport. Rates of silicon uptake vary during synchronized growth of cultures, suggesting that silicon uptake is cell cycle dependent (59), which has led to the understanding that uptake parame- ters measured for exponentially growing cultures are underes- timates because cells are at different stages of the cell cycle and not necessarily utilizing maximum uptake rates (9). Chemostat studies monitoring silicon uptake have revealed three modes of uptake: surge uptake, externally controlled uptake, and internally controlled uptake (15, 16). Surge uptake * Corresponding author. Mailing address: Marine Biology Research Division, Scripps Institution of Oceanography, 9500 Gilman Dr., MC 0202, La Jolla, CA 92093-0202. Phone: (858) 822-0167. Fax: (858) 534-7313. E-mail: [email protected]. † Present address: Institute of Marine and Coastal Studies, Rutgers University, 71 Dudley Rd., New Brunswick, NJ 08901. Published ahead of print on 15 December 2006. 271 Downloaded from https://journals.asm.org/journal/ec on 08 February 2022 by 101.235.251.17.

Welcome message from author
This document is posted to help you gain knowledge. Please leave a comment to let me know what you think about it! Share it to your friends and learn new things together.
Transcript
EUKARYOTIC CELL, Feb. 2007, p. 271–279 Vol. 6, No. 21535-9778/07/$08.00�0 doi:10.1128/EC.00235-06Copyright © 2007, American Society for Microbiology. All Rights Reserved.
Analysis of Thalassiosira pseudonana Silicon Transporters Indicates DistinctRegulatory Levels and Transport Activity through the Cell Cycle�
Kimberlee Thamatrakoln† and Mark Hildebrand*Marine Biology Research Division, Scripps Institution of Oceanography, 9500 Gilman Dr., La Jolla, California 92093-0202
Received 18 July 2006/Accepted 6 December 2006
An analysis of the expression and activity of silicon transporters (SITs) was done on synchronously growingcultures of the diatom Thalassiosira pseudonana to provide insight into the role these proteins play in cellularsilicon metabolism during the cell cycle. The first SIT-specific polyclonal peptide antibody was generated andused in the immunoblot analysis of whole-cell protein lysates to monitor SIT protein levels during synchronizedprogression through the cell cycle. Peaks in SIT protein levels correlated with active periods of silica incor-poration into cell wall substructures. Quantitative real-time PCR on each of the three distinct SIT genes(TpSIT1, TpSIT2, and TpSIT3) showed that mRNA levels for the most highly expressed SIT genes peakedduring the S phase of the cell cycle, a period prior to maximal silicon uptake and during which cell wallsilicification does not occur. Variations in protein and mRNA levels did not correlate, suggesting that asignificant regulatory step of SITs is at the translational or posttranslational level. Surge uptake rates also didnot correlate with SIT protein levels, suggesting that SIT activity is internally controlled by the rate of silicaincorporation. This is the first study to characterize SIT mRNA and protein expression and cellular uptakekinetics during the course of the cell cycle and cell wall synthesis, and it provides novel insight into SITregulation.
Silicon is an important element in biology, from bacteria tohumans (7). The hydrated form of silicon, called silicic acid, isconsidered an important nutrient for plant growth (23, 54), andsilica, the polymerized form of silicon, is used by certain plantsfor rigidity, fungal resistance, and defense against grazers. Inanimals, silicon has a wide range of systemic effects (5) inaddition to being essential for proper bone and collagen for-mation (12, 57). Despite the importance of silicon to life onEarth, the molecular details of biological interactions withsilicon and regulatory mechanisms are poorly understood. Oneof the largest groups of silicifying organisms is diatoms, uni-cellular, eukaryotic phytoplankton that use silica as a cell wallmaterial. These organisms are found predominantly in aquaticenvironments but are capable of living in soils and ice. Diatomsplay a dominant role in silicon biogeochemistry (49, 63), andbecause they are estimated to contribute 20% of global pri-mary production (49), they play an important role in the globalcarbon cycle. Because most diatom species have an obligatesilicon requirement for growth (19) and naturally process largeamounts of silicon, they are an excellent model system forinvestigations into biological interactions with silicon.
The silicified diatom cell wall, or frustule, is composed oftwo overlapping halves, with the upper half called the epithecaand the lower half the hypotheca. Thecae consist of a valve, thespecies-specific structure capping each end, and girdle bands, aseries of overlapping siliceous strips extending on the sides and
in the region overlapping the two thecae. Vegetative cell divi-sion in certain diatom species begins with the mother cellexpanding by synthesizing girdle bands (52). Cytokinesis fol-lows, and on adjacent areas of the two daughter cell proto-plasts (still contained within the mother cell), new valves areformed. Silica polymerization occurs within an organelle calledthe silica deposition vesicle, bounded by a membrane calledthe silicalemma (18, 53, 56). Once the valve is completelyformed, it is exocytosed and the daughter cells separate. Thisintimate connection between cell wall synthesis and the cellcycle results in a tight coupling of silicon metabolism and celldivision.
In diatoms, silicon is taken up from the environment pre-dominantly as silicic acid (20). Although the average oceanicconcentration of silicic acid is 70 �M, in surface waters, wherediatoms are most common, levels can be less than 10 �M (63).In contrast, intracellular concentrations of silicic acid can beseveral hundred millimolar depending on the species (45);therefore, diatoms must posses an efficient uptake system toovercome this 1,000-fold difference. Data suggest that siliconuptake in diatoms follows Michaelis-Menten saturation kinet-ics with Ks values between 0.2 and 7.7 �M and the maximumrate of uptake ranging from 1.2 to 950 fmol Si cell�1 h�1 (6, 39,40, 45, 59, 60, 64). The coupling of the diatom cell cycle andsilicon metabolism (9, 13, 17, 55) has an effect on transport.Rates of silicon uptake vary during synchronized growth ofcultures, suggesting that silicon uptake is cell cycle dependent(59), which has led to the understanding that uptake parame-ters measured for exponentially growing cultures are underes-timates because cells are at different stages of the cell cycle andnot necessarily utilizing maximum uptake rates (9).
Chemostat studies monitoring silicon uptake have revealedthree modes of uptake: surge uptake, externally controlleduptake, and internally controlled uptake (15, 16). Surge uptake
* Corresponding author. Mailing address: Marine Biology ResearchDivision, Scripps Institution of Oceanography, 9500 Gilman Dr., MC0202, La Jolla, CA 92093-0202. Phone: (858) 822-0167. Fax: (858)534-7313. E-mail: [email protected].
† Present address: Institute of Marine and Coastal Studies, RutgersUniversity, 71 Dudley Rd., New Brunswick, NJ 08901.
� Published ahead of print on 15 December 2006.
271
Dow
nloa
ded
from
http
s://j
ourn
als.
asm
.org
/jour
nal/e
c on
08
Febr
uary
202
2 by
101
.235
.251
.17.

occurs upon the initial addition of silicon to silicon-starvedcells, with uptake rates maximal during this time. Externallycontrolled uptake occurs when extracellular levels of siliconare low and the rate of uptake is controlled by the externalsubstrate concentration. In internally controlled uptake, therate of silica deposition into the cell wall is proposed to controlthe rate of uptake (15, 16). On longer time scales (hours),uptake is largely internally controlled (15, 16, 30). On shortertime scales (minutes), silicon transport is a dynamic process,involving both uptake and efflux (46, 60).
Diatom silicon transporters (SITs), first identified in themarine pennate diatom Cylindrotheca fusiformis (32, 34), aremembrane-associated proteins that directly interact with andtransport silicic acid (34). SITs are a novel family of transport-ers with no known homologs, although a silicon transporter inrice homologous to aquaporins, but with no homology todiatom SITs, was recently described (42). Five SIT genes(CfSIT1-5) in Cylindrotheca fusiformis were identified, eachwith a distinct level or pattern of mRNA expression during cellwall synthesis. Cylindrotheca fusiformis SITs are predicted tocontain 10 transmembrane segments, an intracellular N termi-nus, and an intracellular C-terminal coiled-coil motif, a struc-ture known to play a role in protein-protein interactions.Genome sequencing of the centric diatom Thalassiosira pseu-donana led to the identification of three distinct SIT genes(TpSIT1-3). Similar to CfSITs, TpSITs are predicted to contain10 transmembrane segments, with intracellular N and C ter-mini. However, they are not predicted to contain a coiled-coilmotif (61). Phylogenetic analyses of TpSIT genes suggest thatTpSIT1 and TpSIT2 are related through a relatively recentlineage-specific gene duplication and that TpSIT3 is evolving at arate significantly different from that of TpSIT1 or TpSIT2 (61).
T. pseudonana is an excellent model system for investiga-tions into SIT regulation and function because the exact num-ber of SIT genes is known (3, 61) and a synchronized growthprocedure has recently been developed (25, 33). Synchronizedgrowth enables the evaluation of cell cycle effects, providing aunique opportunity to perform a comprehensive investigationinto the molecular details of SIT function. This is the first studyto investigate molecular and biochemical aspects of SITs andrelate that information to silicon uptake rates. Using this ap-proach on synchronously growing cultures of T. pseudonanarevealed distinct levels of SIT regulation.
MATERIALS AND METHODS
Culture conditions. T. pseudonana Hasle et Heimdale clone 3H CCMP1335,Thalassiosira weissflogii (Grunow) Fryxell et Hasle CCMP1336, Skeletonemacostatum (Greville) Cleve CCAP1281, Cyclotella meneghianana CCMP338,Bacillaria paxillifer (O. F. Muller) N. I. Hendey 1951 CCAP1006/2, Cylindrothecafusiformis Reimann et Lewin CCMP343, Ditylum brightwellii (T. West) Grunowex van Heurck 1883 CCAP1022/1, Navicula pelliculosa (Brebisson) HilseSAG1050-3 (a freshwater strain referred to in the text as Navicula pelliculosaFW), Navicula pelliculosa (Brebisson et Kuetzing) Hilse CCMP543 (a marinestrain referred to in the text as Navicula pelliculosa M), and Phaeodactylumtricornutum Bohlin CCMP1327 were grown in batch culture under continuousillumination with cool white fluorescent lights at 150 �mol m�2 s�1 at 18 to 20°C.N. pelliculosa FW was grown in fresh water-tryptone medium (53). T. pseudonanawas grown in sterile artificial seawater medium (ASW) (19) supplemented withbiotin and vitamin B12, each at 1 ng liter�1, with or without Bacto tryptone addedto 1 g liter�1. All other diatom species were grown in sterile ASW with 0.1%Bacto tryptone [ASW(T)] or f/2 medium made with local seawater filteredthrough a 0.2-�m-pore-size filter and autoclaved (27, 28).
Synchronized cell growth. Synchronized growth of T. pseudonana cultures wascarried out as previously described (25, 33). Briefly, exponential-phase culturesof T. pseudonana were harvested by centrifugation and washed with silicon-freeASW(T). Cells were resuspended in silicon-free ASW(T) at 0.8� 106 to 1.0 �106 cells ml�1 and allowed to incubate in the light with aeration for 24 h in apolycarbonate bottle. After 24 h, a sample was harvested (representing 0 h), andsodium silicate was added to the remaining culture at a final concentration of 200�M to initiate synchronized progression through the cell cycle. Samples (750 ml)were harvested by centrifugation at 3,000 � g for 12 min in a Composite KA-14.250 rotor every hour, washed in 3.5% (wt/vol) NaCl, and stored at �80°C. Theformation of specific cell wall structures was monitored by visualization withrhodamine 123 (Sigma, St. Louis, MO) staining as described previously (25) orwith 2-4-pyridyl-5-{[4-(2-dimethylaminoethylaminocarbomoyl)methoxy]-phenyl}oxazole (PDMPO; Molecular Probes, Carlsbad, CA) used at 100 nM in the culture.
mRNA extraction, cDNA synthesis, and quantitative real-time PCR. TotalRNA was isolated using TriReagent (Sigma, St. Louis, MO) as described previ-ously (31). Aliquots of total RNA were subjected to DNase treatment using anRNeasy kit (QIAGEN, Inc., Valencia, CA) according to the manufacturer’sprotocol. cDNA was prepared from equivalent amounts of DNase-treated RNAby using SuperScript II reverse transcriptase (Invitrogen, Carlsbad, CA). Quan-titative real-time reverse transcription PCR (qRT-PCR) was performed using aLightCycler system and LightCycler DNA master SYBR green I (Roche AppliedScience, Indianapolis, IN). Because of the high level of sequence conservationamong TpSIT genes, primer sets were designed to amplify different-size frag-ments and PCR was used to verify that each primer set amplified only the SIT ofchoice. Primers used were as follows: for TpSIT1, TpSIT1 5� (5�-AGATGGAAGGGTATTTGACAGAG) and TpSIT1 3�-2 (5�-TATCTTCACATGCATCCTTGGG); for TpSIT2, TpSIT2 5� (5�-GTCCGTTCAACAAGGCAGAA) andTpSIT2 3�-2 (5�-CATCTTCACGTGCATTCTCGGA); and for TpSIT3, TpSIT35�-2 (5�-CATCCGGAGTAGTTACTCGTG) and TpSIT3 3� (5�-GACGTCCAAGATGCGAAGAG). Standards for qRT-PCR were as previously described (25),using dilutions of T. pseudonana genomic DNA. This resulted in genome equiv-alent nanogram values for mRNA levels rather than an absolute amount of RNAper cell to avoid possible artifacts generated by using rRNA, whose levels changeduring the cell cycle (47), as a standard. Equivalent amounts of DNase-treatedRNA were used as material for cDNA synthesis (11). Dilutions of cDNA weredone to ensure that amplification was in the linear range. PCR amplification ofRNA samples not treated with reverse transcriptase did not produce an ampli-fication product, indicating that there was no genomic DNA contamination.qRT-PCR measurements of mRNA levels were done on two independent cul-tures (biological replicates). For the first culture (denoted Sync1), independentqRT-PCRs with the same set of cDNA samples were performed in triplicate forTpSIT1 and TpSIT2 while a single qRT-PCR was performed for TpSIT3. In thesecond culture (denoted Sync2), duplicate qRT-PCRs were performed for eachSIT. To compare the patterns of mRNA changes for each SIT gene, replicatesfrom each culture were normalized to the mean value for all time points for agiven SIT. The mean of the normalized values was plotted along with thestandard error. For Sync1, one of the triplicate results for 1 h was removedbecause it was approximately 2 standard deviations away from the mean.
Anti-TpEL4 production. The sequence of a 15-residue region corresponding toamino acids 318 to 332 of TpSIT1 (sequence PANERGTSFFGRKTC) wasprovided to Sigma Genosys (The Woodlands, TX) and used to generate apeptide conjugated to keyhole limpet hemocyanin. This peptide was used as anantigen to generate polyclonal antibodies in rabbits (Sigma Genosys, The Wood-lands, TX). The antibody was designated anti-TpEL4 because the peptide cor-responds to a region of extracellular loop 4 (61).
SDS-polyacrylamide gel electrophoresis. During the course of synchronizedgrowth, 13-ml samples were harvested by centrifugation at 16,500 � g in an HB-4rotor at 0 min, 5 min, and every 30 min thereafter for 8 h. Cell pellets were storedat �80°C until ready for use. Either equal cell numbers or equal protein amountswere analyzed. For equal cell numbers, cells were resuspended in 2� sodiumdodecyl sulfate (SDS)-sample buffer (Invitrogen, Carlsbad, CA) and heated to95°C for 5 min. Thirty microliters of each sample was separated by electrophore-sis on 4 to 20% gradient gels (Bio-Rad, Hercules, CA). For experiments in whichequal protein concentrations were loaded, 50 �l of 2% SDS was added to eachsample and the protein concentration was measured using a DC protein assay kit(Bio-Rad, Hercules, CA) according to the manufacturer’s instructions. Ten mi-crograms of total protein was added to 2� SDS-sample buffer, heated at 95°C for5 min, and electrophoresed as described above. Protein lysates from speciesother than T. pseudonana were obtained using the same method described forequal-protein-concentration experiments but samples were electrophoresed on10% polyacrylamide gels (Bio-Rad, Hercules, CA).
272 THAMATRAKOLN AND HILDEBRAND EUKARYOT. CELL
Dow
nloa
ded
from
http
s://j
ourn
als.
asm
.org
/jour
nal/e
c on
08
Febr
uary
202
2 by
101
.235
.251
.17.
Peptide competition. The TpEL4 peptide used as the antigen for antibodyproduction was generated and provided by Sigma Genosys (The Woodlands,TX). TpEL4 was reconstituted in 0.2 M boric acid, pH 8, to a concentration of1 mg/ml. Various concentrations of peptide were preincubated with 2.5 �l ofanti-TpEL4 antiserum at 4°C overnight with mixing. This mixture was then usedas the primary antibody for immunoblot analysis as described below.
Immunoblot analysis. Electrophoretically separated proteins were transferredonto polyvinylidene difluoride membrane in blotting buffer containing 25 mMTris and 192 mM glycine, pH 8.3. Transfer efficiency was monitored by usingSeeBlue prestained protein standards (Invitrogen, Carlsbad, CA). Membraneswere blocked in 1� TBST, pH 7.5 (25 mM Tris-HCl, 137 mM NaCl, 27 mM KCl,0.2% [vol/vol] Tween 20), and 3% nonfat dried milk at 4°C overnight withshaking. The membranes were washed three times for 10 min each in 1� TBSTand then incubated in blocking buffer containing preimmune or anti-TpEL4antisera at a 1:5,000 dilution in initial experiments but at a 1:10,000 dilution insubsequent experiments for 1 h at room temperature. After three 10-min washesin 1� TBST, the membranes were incubated in blocking buffer containinghorseradish peroxidase-conjugated goat anti-rabbit antibody at a 1:10,000 dilu-tion for 1 h at room temperature. Three additional washing steps were done, andchemiluminescence detection was performed using a SuperSignal West Picochemiluminescent substrate kit (Pierce, Rockford, IL) and following the manu-facturer’s protocol.
Three immunoblot analyses were performed on two independent culturesduring synchronized cell growth. For two of the immunoblots, equal cell numberswere loaded onto the gel, while for the third analysis, equal total protein con-centrations were loaded. Similar results were obtained using either method.Densitometry was done for each immunoblot whereby each blot was scannedusing an AlphaImager imaging system (Alpha Innotech Corp., San Leandro, CA)
and the relative densitometric units (densitometric units minus background)were determined using AlphaEaseFC (Alpha Innotech Corp., San Leandro,CA). Data were normalized to the mean intensity for all points within a givenexperiment, and the change relative to the mean was plotted. The normalizedaverage for all experiments was plotted along with the standard error.
Cloning of T. pseudonana SIT genes and heterologous expression in Saccha-romyces cerevisiae. TpSIT1, TpSIT2, and TpSIT3 were amplified by PCR usingcDNA as a template and the following primers: EcoRI-TpSIT1, 5�-CCGGAATTCAAAAATGTCTACCGCTGAAATCCAA, and TpSIT1-Xba, 5�-CTAGTCTAGAGGCATCCTCGGCAAGAGCATC; Bam-TpSIT2, 5�-CGCGGATCCAAAAATGTCTTCTGCCGAGGTT, and TpSIT2-Xba, 5�-CTAGTCTAGAAGCCTGCGCGTCAACAGCCTC; and Bam-TpSIT3, 5�-CGCGGATCCAAAAATGCGCGCTCAAAACGATGAA, and TpSIT3-Xba, 5�-CTAGTCTAGACTTCGCCAATCCACTTTCAAC. Products were gel purified and ligated into the yeastexpression vector pYES2/CT (Invitrogen, Carlsbad, CA) by using the EcoRI/XbaI site for TpSIT1 and the BamH1/XbaI site for TpSIT2 and TpSIT3. Cloneswere sequenced by SeqXCel (San Diego, CA) and verified to be in frame.
Saccharomyces cerevisiae INVSc1 (Invitrogen, Carlsbad, CA) was transformedwith each construct using the lithium acetate method (26). Saccharomyces cer-evisiae was grown in yeast extract-peptone-dextrose medium at 30°C to a densityof 2 � 107 cells ml�1 and then harvested by centrifugation at 3,000 � g for 5 min.Cells were washed in sterile water and resuspended at a density of 109 cells ml�1.An aliquot of 100 �l of competent cells was transferred into a 1.5-ml microcen-trifuge tube to which 1 �g of each pYES2-TpSIT construct was added, along with100 �g of herring sperm DNA, 36 �l of 1 M lithium acetate, and 240 �l ofpolyethylene glycol 3500 at 50% (wt/vol). After 30 min at 42°C, the cells werecentrifuged for 30 s at maximum speed, resuspended in 1 ml of water, and platedat various dilutions onto uracil-deficient synthetic medium plates. Plates were
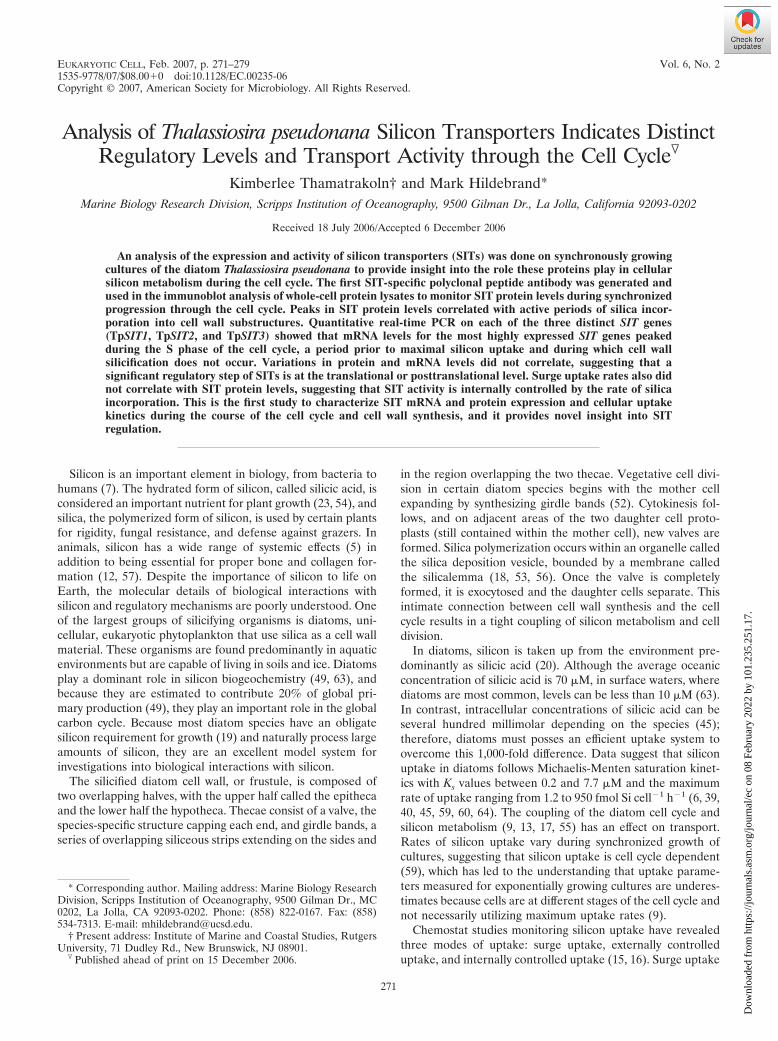
FIG. 1. Predicted amino acid alignment of T. pseudonana SITs. Residue numbers are shown on the left. Black shading indicates identicalresidues, and gray shading represents conserved substitutions. Black lines and numbers above the alignment denote transmembrane segments aspredicted by HMMTOP (65) with a multiple-sequence alignment of 10 SIT sequences (61). Arrows indicate the locations corresponding to intronsin each SIT gene.
VOL. 6, 2007 T. PSEUDONANA SILICON TRANSPORTERS 273
Dow
nloa
ded
from
http
s://j
ourn
als.
asm
.org
/jour
nal/e
c on
08
Febr
uary
202
2 by
101
.235
.251
.17.

incubated at 30°C until colonies were visible (approximately 3 days). Clones werepicked and grown in liquid selection medium.
SIT protein expression was induced in yeast by growing cells in the presenceof 2% galactose at 30°C. After 24 h in induction medium, cells were harvested bycentrifugation at 1,500 � g for 5 min. Protein lysates were generated by resus-pending cells to an optical density at 600 nm of 50 in breaking buffer (50 mMsodium phosphate [pH 7.4], 1 mM EDTA, 5% glycerol, and 1 mM phenylmethyl-sulfonyl fluoride), adding an equal volume of acid-washed glass beads (0.4 to 0.6mm in size; Sigma-Aldrich, St. Louis, MO), and vortexing four times at 30-sintervals at 4°C. After centrifugation at maximum speed for 10 min, the super-natant was removed and stored at �20°C until ready for use. Proteins wereseparated by electrophoresis on 10% polyacrylamide gels, and immunoblot anal-ysis was performed as described above.
Measurements of silicon in the growth medium. Silicon disappearance fromthe medium was monitored during synchronized cell division to measure siliconuptake and determine the onset of valve synthesis (G2/M). The timing of cellularprocesses during synchronized growth was determined previously with repeatedcultures by observation of rhodamine 123 incorporation coupled with flow cyto-metric analysis to determine cell cycle stages (33). It was found that valvesynthesis correlated to a decrease of silicon in the medium (i.e., increased siliconuptake into the cell); thus, replicates can be compared by measuring silicon in thegrowth media and determining the timing of valve synthesis. Samples were taken
at regular intervals by the centrifugation of cells at 16,500 � g for 5 min. Aliquotsof supernatant were removed and stored at �20°C. Silicic acid concentrationswere measured using the silicomolybdate assay (58) either as described previ-ously (33) or modified for a 96-well-plate format as follows. Twenty-five micro-liters of supernatant was added to 100-�l Milli-Q water; 50-�l of molybdatereagent was added, mixed, and allowed to incubate for 10 min at room temper-ature; and then 75 �l of reducing agent was added and mixed. Samples wereincubated for 3 h at room temperature with occasional mixing prior to themeasurement of the absorbance at 810 nm on a SpectraMax M2 microplatereader (Molecular Devices, Sunnyvale, CA). The standard was sodium hexafluo-rosilicate (Sigma, St. Louis, MO) used in a range from 0 to 50 �M.
Measurements of surge uptake kinetics. Silicic acid surge uptake during thecourse of synchronized growth was measured using 68Ge(OH)4 as a radiotracerfor silicic acid (4). We have determined (K. Thamatrakoln and M. Hildebrand,unpublished data) that short-term uptake (2 min) in silicon-replete cultures of T.pseudonana is not saturable, even at extremely high silicon concentrations (�500�M). The lack of saturability prevents the determination of a Michaelis-MentenVmax value; therefore, uptake was monitored at 100 �M silicate and the maxi-mum rate of surge uptake at this concentration (V100) was determined. Cellswere harvested at 3,000 � g for 5 min in an HB-4 rotor, washed, and resuspendedin silicon-free ASW to a concentration of 2.5 � 105 cells ml�1. One ml of cellswas added to 100 �l of 0.1 �Ci 68Ge(OH)4 and 100 �M silicate (59, 60) and
FIG. 2. Characterization of anti-TpEL4. Molecular mass markers (kDa) are shown on the left or right side of each immunoblot derived fromSDS-PAGE separations. (A) Immunoblot of T. pseudonana whole-cell protein lysates using preimmune serum and anti-TpEL4 indicated that theantibody specifically recognized a protein with a size consistent with the predicted size of SITs. (B) Immunoblot of protein lysates probed withanti-TpEL4 preincubated with 0, 1, or 50 �g of TpEL4 peptide demonstrated the specificity of the antibody for the epitope against which it wasraised. (C) Immunoblot of Saccharomyces cerevisiae transformed to express TpSIT1, TpSIT2, or TpSIT3 demonstrated that the antibodyrecognized each of the three T. pseudonana SITs. (D) Immunoblot of 10 �g of total protein lysate from various centric and pennate diatom speciesand the coccolithophore Emiliania huxleyi. (E) Amino acid alignment of SITs from different diatoms in the region used to generate anti-TpEL4.The sequence of TpSIT1 is shown on the first line. SIT sequences are identified by the initials for genus and species as follows: Tp, Thalassiosirapseudonana; Tw, Thalassiosira weissflogii; Sc, Skeletonema costatum; Cf, Cylindrotheca fusiformis; NpFW, Navicula pelliculosa FW; NpM, Naviculapelliculosa M; and Pt, Phaeodactylum tricornutum. Dashes indicate residues identical to those of TpSIT1. Asterisks indicate proteins from speciesthat cross-reacted with anti-TpEL4.
274 THAMATRAKOLN AND HILDEBRAND EUKARYOT. CELL
Dow
nloa
ded
from
http
s://j
ourn
als.
asm
.org
/jour
nal/e
c on
08
Febr
uary
202
2 by
101
.235
.251
.17.
either immediately vacuum filtered (for 0 min; background measurement)through a Millipore Isopore RTTP 1.2-�m-pore-size membrane or incubated for2 min (surge uptake measurement) and then filtered. Filters were washed with 5ml of 3.5% NaCl, placed in a gamma vial, and counted using an LKB Wallac 1282Compugamma CS universal gamma counter (Perkin-Elmer, Wellesley, MA).Triplicate samples for each condition were analyzed. Subtraction of the value for0 min from that for 2 min gave net uptake of label, and the result was convertedinto fmol cell�1 h�1, taking into account counting efficiency, dilution effects, andradioactive decay.
RESULTS
Comparison of SIT sequences. Predicted amino acid se-quences of TpSIT1, TpSIT2, and TpSIT3 (61) were alignedand analyzed using CLUSTALW (14, 62) (Fig. 1). Analysisshowed 44% amino acid identity and 75% similarity (identicalresidues plus conserved substitutions) in a comparison of allthree SITs. Pairwise comparison between each SIT revealed88% amino acid identity and 95% similarity between TpSIT1and TpSIT2. TpSIT1 and TpSIT3 were 46% identical and 74%similar, while TpSIT2 and TpSIT3 were 46% identical and76% similar. Each TpSIT contained a single intron ranging insize from 97 to 124 bp, located at positions corresponding toamino acid residue 108 in TpSIT1 and TpSIT2 and residue 158in TpSIT3 (Fig. 1).
Characterization of TpEL4 antibody. Preimmune and anti-TpEL4 antisera were tested for reactivity to whole-cell proteinlysates of T. pseudonana. There was no reactivity with thepreimmune serum (Fig. 2A), whereas anti-TpEL4 reacted witha single band at approximately 60 kDa (Fig. 2A), similar to thepredicted molecular masses of T. pseudonana SITs. A peptidecompetition assay demonstrated the specificity of the antibodyfor this band (Fig. 2B). To determine whether anti-TpEL4recognized all three T. pseudonana SITs, Saccharomyces cer-evisiae was transformed to express individual SITs. Immuno-blot analysis of whole-cell lysates showed that anti-TpEL4 rec-ognized each T. pseudomonas SIT (Fig. 2C). To determinewhether anti-TpEL4 recognized SITs from other diatom spe-cies or phytoplankton, whole-cell protein lysates were analyzedby immunoblot (Fig. 2D). Anti-TpEL4 recognized a protein ofapproximately 60 kDa in the centric diatoms T. pseudonana,Skeletonema costatum, Chaetoceros gracilis, Cyclotella meneghi-anana, and Ditylum brightwellii and the pennate diatoms Cylin-drotheca fusiformis, Navicula pelliculosa M, and Phaeodactylumtricornutum but did not recognize proteins in lysates from thecentric diatom Thalassiosira weissflogii or the pennate diatomsNavicula pelliculosa FW and Bacillaria paxillifer. In addition,there was no reactivity with protein lysate from the coccolith-ophore Emiliania huxleyi. For those species for which SITsequences were available (61), the region corresponding to thepeptide used as the antigen was compared to TpSIT1 (Fig. 2E).No distinct pattern of sequence conservation among SITs thatdid or did not cross-react with anti-TpEL4 was apparent. Forexample, SIT2 of Thalassiosira weissflogii (Fig. 2E) had onlyone amino acid substitution compared to TpSIT1, but therewas no cross-reactivity with anti-TpEL4.
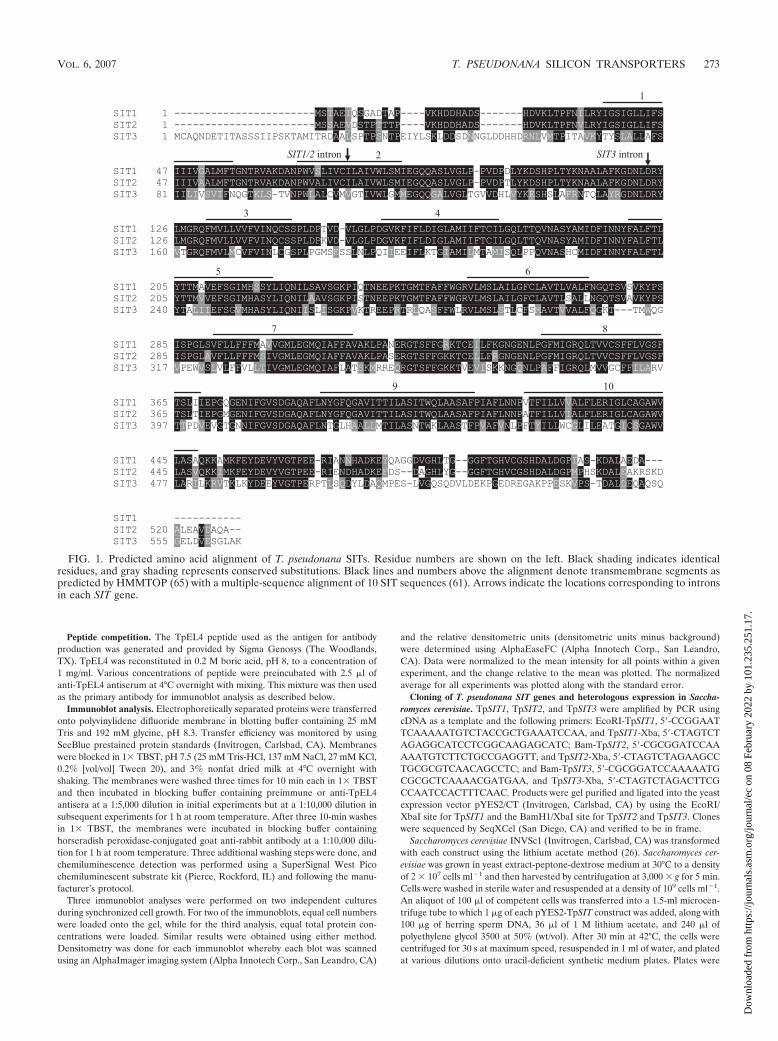
Analysis of SIT protein expression in synchronized culturesof T. pseudonana. SIT protein was monitored through synchro-nized progression through the cell cycle by using anti-TpEL4and immunoblot analysis (Fig. 3, top panel). In the same cul-ture, net silicic acid uptake was determined by the measure-
ment of silicon disappearance from the medium (Fig. 3, middlepanel). Results from three immunoblot analyses performed ontwo independent cultures were compared by normalizing rel-ative densitometric units (see Materials and Methods) anddetermining changes in protein levels (Fig. 3, bottom panel).This analysis showed that SIT protein was expressed through-out synchronized cell cycle progression but at various levels.SIT protein levels increased approximately 1.5 h after siliconreplenishment and then decreased to a minimum at 3.5 h (Fig.3). At 4.5 h, protein levels again increased and remained highuntil the end of the experiment. Based on measurements ofsilicon in the medium, valve synthesis began at 4.5 h (Fig. 3,bottom panel).
Analysis of SIT mRNA levels during synchronized growth.qRT-PCR was used to monitor mRNA levels for each TpSIT
FIG. 3. Analysis of SIT protein levels during synchronized cellgrowth. Time (h) during synchronized cell growth is shown. The toppanel is a representative example of immunoblots of whole-cell proteinlysates probed with anti-TpEL4. The middle panel shows net silicicacid uptake during synchronized growth based on results for triplicatesamples, with errors bars for standard deviations. The bottom panelshows the mean induction (fold) based on relative densitometric unitsfor three immunoblot analyses performed on two independent repli-cate cultures (see Materials and Methods). Error bars represent stan-dard errors. Approximate timing of cellular events during synchro-nized growth is denoted at the bottom.
VOL. 6, 2007 T. PSEUDONANA SILICON TRANSPORTERS 275
Dow
nloa
ded
from
http
s://j
ourn
als.
asm
.org
/jour
nal/e
c on
08
Febr
uary
202
2 by
101
.235
.251
.17.

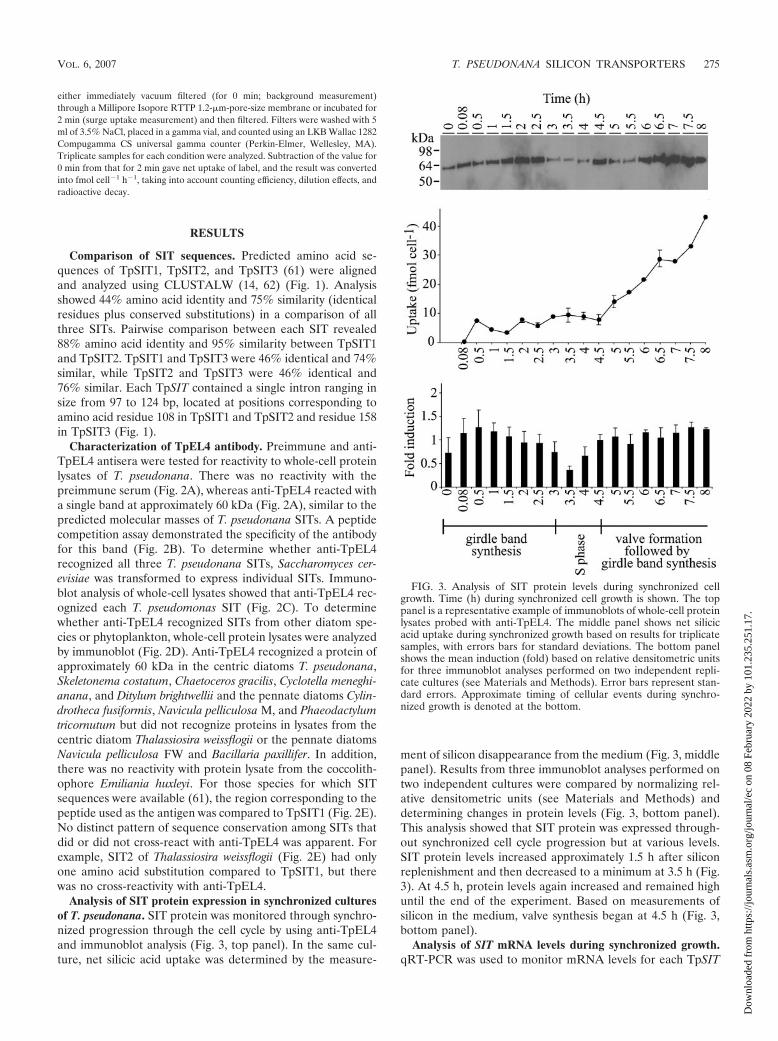
gene (Fig. 4) in two independent replicate cultures (designatedSync1 and Sync2). The timing of the initiation of valve syn-thesis differed slightly in the two replicates as determined bydecreased silicate levels in the media (indicating increasedcellular uptake). In Sync1, valve synthesis began between 3 and4 h, and in Sync2, it began between 4 and 5 h (Fig. 4, toppanel); from previous results (33), S phase of the cell cycle isknown to occur immediately prior to these times (Fig. 4, bot-tom panel). For TpSIT1 andTpSIT2, mRNA levels in bothreplicates peaked during S phase of the cell cycle (Fig. 4). ForSync1, a distinct peak was visible at 3 h for both TpSIT1 andTpSIT2, and for Sync2, a broader peak was visible between 3and 4 h. In both replicates, mRNA levels for TpSIT1 andTpSIT2 dropped gradually following the peak in S phase. Asignificant difference in the two replicates was mRNA levels at0 h, which were relatively low in Sync1 and highly induced inSync2. For TpSIT3 (Fig. 4, bottom panel), mRNA responsesdiffered in the two replicates but generally varied slightly overtime with the exception of the large decrease in levels at 1 h inSync2. Comparing the means of values for all time points foreach TpSIT in both replicates indicated that TpSIT1 mRNAlevels were approximately twofold higher than those forTpSIT2, and TpSIT3 mRNA levels were substantially lower,approximately 40- to 80-fold lower than those for TpSIT1 andTpSIT2.
Surge uptake rate through the cell cycle. Surge uptake ratesduring synchronized cell cycle progression were measured us-
FIG. 4. mRNA levels for TpSIT1, TpSIT2, and TpSIT3 determinedby qRT-PCR on two independent synchronized cultures (designatedSync1 and Sync2). mRNA levels are plotted as normalized nanogramequivalents of standards of genomic DNA (see Materials and Meth-ods). In each graph, data from Sync1 are represented by a solid lineand closed circles and data from Sync2 are represented by a dotted lineand open circles. In the top graph, the means of triplicate measure-ments of the silicon concentration in the medium are shown with errorbars indicating standard errors. Arrows (solid line for Sync1 and dottedline for Sync2) denote a decrease in silicon in the medium, indicatingthe onset of valve formation, which began 1 h later in Sync2 than inSync1. The bottom three graphs display qRT-PCR data for each TpSITgene. Time 0 corresponds to cells harvested prior to the addition of
silicate. For Sync1, the means of results for three technical replicatesare shown for TpSIT1 and TpSIT2, with the exception of the value for1 h for TpSIT1, which is the mean of results for two technical replicates(see Materials and Methods). Errors bars represent standard errors.Data from a single qRT-PCR for TpSIT3 in Sync1 are shown. ForSync2, the means of results for two technical replicates for each TpSITgene are shown along with standard errors. Data for TpSIT1 Sync2 areplotted on the secondary y axis. Note the difference in scales of the yaxis for TpSIT3 compared with TpSIT1 or TpSIT2. The approximatetiming of cellular events during synchronized growth is shown in thetimeline at the bottom, with solid and dotted lines representing Sync1and Sync2, respectively.
FIG. 5. Maximum rates of surge uptake at 100 �M silicate (V100)during synchronized cell growth. Average values (in fmol cell�1 h�1)from a sample assayed in triplicate are shown for each time point, witherror bars showing standard deviations. Numbers above bars are V100values.
276 THAMATRAKOLN AND HILDEBRAND EUKARYOT. CELL
Dow
nloa
ded
from
http
s://j
ourn
als.
asm
.org
/jour
nal/e
c on
08
Febr
uary
202
2 by
101
.235
.251
.17.

ing radiolabeled germanic acid as a tracer for silicic acid (Fig.5). The rate was low at 0 h but increased and was relativelyconstant between 2 and 4 h, at approximately 30 fmol cell�1
h�1. At 5 h, during the period of valve synthesis, the uptakerate increased and eventually peaked at 8 h at 147 fmol cell�1
h�1. At 9 h, the rate decreased to 113 fmol cell�1 h�1.
DISCUSSION
SITs were first identified in the late 1990s (32, 34), but untilnow, tools for an in-depth characterization of protein, mRNA,and uptake activities during the cell cycle were not available. Inthis study, biochemical, molecular, and physiological toolswere used to characterize the patterns of SIT protein andmRNA expression and relate that information to silicon up-take activity. Because of the tight coupling between siliconuptake and the cell cycle, it is only with the ability to synchro-nize the growth of T. pseudonana cultures that these analyseswere possible. Interpretation of the data requires discussionabout events occurring during synchronized growth of T.pseudonana, details of which are published elsewhere (33) butare summarized here. T. pseudonana cells starved for siliconfor 24 h arrest predominantly in the G1 stage of the cell cycle.Upon silicate replenishment, cells progress through G1 forapproximately 3 h while girdle band synthesis occurs. As thecells enter S phase (3 to 4.5 h), girdle band production ceases(33). After S phase, valve synthesis is observed between 4 and6 h, with the exact timing varying between synchronized cul-tures. Data from different synchronized cultures can be com-pared because the timing of valve synthesis can be monitoredeither by direct visualization by fluorescence microscopy withrhodamine 123- or PDMPO-stained cells or by measurementof a characteristic fivefold increase in net silicic acid uptakeover that occurring during girdle band synthesis (33). Upon thecompletion of valve synthesis, cells separate and additionalgirdle bands are synthesized. Similar to that of other diatomspecies (10), synchronized growth of T. pseudonana culturesdoes not result in all of the cells entrained at the same stage ofthe cell cycle; typically, 80% are arrested under silicate starva-tion in G1, with the remaining 20% in G2/M or S phase (33).
In general, the pattern and levels of SIT protein expressioncorrelated with active periods of silica incorporation into cellwall substructures (Fig. 3). Upon silicate replenishment, SITprotein levels increased coincident with girdle band synthesisuntil 3 h (Fig. 3). During S phase (3 to 4.5 h), when cells are notmaking silica structures (33), SIT levels were minimal (Fig. 3).Considering that 20% of the cells may not be in S phase at thattime, it is possible that SIT protein levels are even lower orundetectable in S-phase cells. During valve and subsequentgirdle band synthesis, when silicon demands increase, SIT pro-tein levels increased again (Fig. 3).
SIT protein levels and silicon uptake were not strictly cor-related. SIT protein levels were not substantially different be-tween 0.5 to 2.5 h and 5 to 8 h, yet net silicic acid uptake, asmeasured by the disappearance of silicic acid from the medium(Fig. 3, middle panel), and surge uptake, as measured by short-term uptake of radiolabeled 68Ge(OH)4 (Fig. 5), increasedfivefold in the later time period. These observations are con-sistent with the idea that the abundance of SIT protein is nota primary determinant of net uptake, suggesting that the cell
may rely more on the regulation of the activity of SITs than thelevel of SIT protein. This possibility is consistent with an in-ternally controlled uptake mechanism (15) in which the regu-lation of uptake is largely dictated by the rate of cell wall silicaincorporation. Surge uptake data (Fig. 5) indicated that thecells were capable of taking up 7.5-fold more silicon than theydid on longer time scales, also consistent with an internallycontrolled SIT regulatory mechanism. An alternative explana-tion for the lack of correlation between SIT protein levels anduptake rates could be because immunoblot analysis measurestotal SIT protein, it is possible that some SITs measured maynot be localized to the plasma membrane. If, as has beendemonstrated for glucose transporters (8, 22), SITs cycle be-tween the plasma membrane and intracellular vesicles as partof a regulatory mechanism, changes in uptake rates without aconcomitant change in total protein could result.
There was no direct correlation between mRNA and proteinlevels. mRNA levels for TpSIT1 and TpSIT2 in both replicatespeaked during S phase of the cell cycle (Fig. 4), at a time whenno silicification occurs (33) and when SIT protein levels wereat a minimum (Fig. 3). This indicates that although SIT tran-script levels increased, the transcripts were not translated intoprotein. The accumulation of nontranslated mRNA occurs inother organisms (2) and may enable a cell to respond morerapidly, or target mRNAs more specifically (37), in response tochanges in cell cycle events or environmental conditions. Incontrast, when SIT protein levels peaked during valve synthe-sis, mRNA levels decreased, suggesting either increased trans-lational efficiency or an inhibition of protein degradation.These data are consistent with a translational or posttransla-tional regulatory mechanism over SIT expression.
Interestingly, mRNA levels at 0 h were consistently higherfor each TpSIT in Sync2 than for those in Sync1, suggestingthat the cells had different responses to silicon starvation. It iscommon for cells to induce nutrient transporter mRNA levelswhen starved for a particular nutrient (29, 31). Because dia-toms can accumulate intracellular pools of silicon (45), per-haps these pools in the cells in Sync2 were more depleted thanthose in Sync1, giving rise to higher mRNA levels. More rig-orous experiments are needed to test this hypothesis.
mRNA levels for each TpSIT were also measured in a singleexperiment in which the cells were grown in enough silicate toallow one complete cell division to occur before the cells be-came silicon starved (data not shown). These conditions maybe more representative of natural environmental conditionswhere cells may experience periods of gradual silicon starva-tion. The major conclusion from this experiment was that SITmRNA levels were not strictly controlled by extracellular sili-con concentrations, as had been observed in synchronized cul-tures (Fig. 4). In addition, TpSIT3 mRNA levels were, onaverage, 30-fold lower than those of TpSIT1 or TpSIT2.
The low levels of TpSIT3 mRNA compared to those ofTpSIT1 and TpSIT2 mRNA seen in both synchronized cultures(Fig. 4) and a culture gradually starved for silicon (data notshown) lead us to speculate that TpSIT3 may serve as a siliconsensor in T. pseudonana. In addition to being able to transportsilicon, diatoms could also have a mechanism for sensing sili-con; for example, to evaluate whether enough extracellularsilicon is present to complete a round of valve and girdle bandsynthesis. Specific members of other transporter families have
VOL. 6, 2007 T. PSEUDONANA SILICON TRANSPORTERS 277
Dow
nloa
ded
from
http
s://j
ourn
als.
asm
.org
/jour
nal/e
c on
08
Febr
uary
202
2 by
101
.235
.251
.17.

been shown to function as substrate sensors that regulate theexpression of other members in the family through a signaltransduction cascade (35, 51). Some known substrate sensorshave distinct characteristics that differentiate them from thefunctional transporters (24, 66). One of these features is thelack of sequence conservation between sensors and othermembers of the transporter family. In the yeast ammoniumtransporter family, Mep1 and Mep3 share 80% amino acididentity but are only 39 to 41% identical to the ammoniumsensor Mep2 (21, 41, 43, 44). Similarly, the glucose sensorsSnf3p and Rgt2p are only 26 to 30% identical to other mem-bers of the family (38), while the other members share 64 to87% identity (36, 38). Structural differences in substrate sen-sors have also been identified. Snf3p and Rgt2p have an ex-tended C terminus compared to those of the other glucosetransporters (51), and the amino acid permease sensor Ssy1phas an N terminus that is 140 amino acids longer and an extra25- to 35-amino-acid region in a hydrophilic loop (35). Genesencoding Snf3p and Rgt2p are also weakly expressed com-pared to other family members, with expression levels beingapproximately 100 to 300-fold lower (48, 51).
TpSIT1 and TpSIT2 shared 88% amino acid identity, butTpSIT3 was only 46% identical (Fig. 1). In addition, the pre-dicted amino acid sequence based on genome data for TpSIT3suggests a 34-amino-acid extension at the N terminus com-pared to TpSIT1 and TpSIT2 (Fig. 1). A BLAST search (1)using this sequence did not reveal significant similarity toknown proteins, nor were any conserved functional domainsidentified. SignalP (50) did not predict the presence of a signalpeptide cleavage site, suggesting that TpSIT3 may not neces-sarily be differentially targeted. qRT-PCR data showed thatthe level of TpSIT3 mRNA was 40- to 80-fold lower than thatof TpSIT1 and TpSIT2 during synchronized growth (Fig. 4).These points are consistent with the possibility of TpSIT3being a silicon sensor, although one alternative hypothesiscould be that TpSIT3 plays a specialized role in uptake (e.g.,specific intracellular targeting). High levels of expression ofTpSIT1 and TpSIT2 suggest that these proteins are activetransporters, but amino acid differences between them couldresult in different affinities or capacities for silicic acid. Forexample, one could be a high-affinity, low-capacity transporterand the other a low-affinity, high-capacity transporter, allowingthe cell to take advantage of a wider range of silicic acidconcentrations. Definitively determining whether TpSIT3 is asilicon sensor and whether TpSIT1 and TpSIT2 have differentaffinities or capacities for silicic acid will require additionalinvestigation.
In conclusion, data obtained in this study indicate that amajor regulatory step for SIT expression is at the translationalor posttranslational level and that SIT activity is controlledlargely by intracellular processes and not by protein levels.Circumstantial data suggest that TpSIT3 may be a silicon sen-sor, and future work focusing on determining the transportcapacities and silicon affinities of SITs should provide furtherinsight into the roles each SIT plays in meeting the overalltransport needs of the cell. In addition, the first SIT-specificantibody is now available, which will be integral in futureinvestigations into SIT function and regulation.
ACKNOWLEDGMENTS
We thank Luciano Frigeri and Sandra Hazelaar for technical assis-tance, Brian Palenik for the use of an epifluorescence microscope, andDori Landry for kindly providing a frozen Emiliania huxleyi cell pellet.We would also like to thank Michael Latz for use of lab space andequipment. Navicula pelliculosa (Brebisson et Kuetzing) Hilse CCMP543was provided as part of a collaborative project with Sandra Hazelaar andWinfried W. C. Gieskes.
This work was supported by Air Force Office of Scientific ResearchMultidisciplinary University Research Initiative grant RF00965521.
Instrumentation was purchased with support from a National Sci-ence Foundation grant (0115801).
REFERENCES
1. Altschul, S. F., W. Gish, W. Miller, E. W. Myers, and D. J. Lipman. 1990.Basic local alignment search tool. J. Mol. Biol. 215:403–410.
2. Anderson, P., and N. Kedersha. 2002. Stressful initiations. J. Cell Sci. 115:3227–3234.
3. Armbrust, E. V., J. A. Berges, C. Bowler, B. R. Green, D. Martinez, N. H.Putnam, S. Zhou, A. E. Allen, K. E. Apt, M. Bechner, M. A. Brzezinski, B. K.Chaal, A. Chiovitti, A. K. Davis, M. S. Demarest, J. C. Detter, T. Glavina, D.Goodstein, M. Z. Hadi, U. Hellsten, M. Hildebrand, B. D. Jenkins, J. Jurka,V. V. Kapitonov, N. Kroger, W. W. Y. Lau, T. W. Lane, F. W. Larimer, J. C.Lippmeier, S. Lucas, M. Medina, A. Montsant, M. Obornik, M. S. Parker, B.Palenik, G. J. Pazour, P. M. Richardson, T. A. Rynearson, M. A. Saito, D. C.Schwartz, K. Thamatrakoln, K. Valentin, A. Vardi, F. P. Wilkerson, andD. S. Rokhsar. 2004. The genome of the diatom Thalassiosira pseudonana:ecology, evolution, and metabolism. Science 306:79–86.
4. Azam, F. 1974. Silicic acid uptake in diatoms studied with [68Ge]germanicacid as a tracer. Planta 121:205–212.
5. Bendz, G., and I. Lindqvist (ed.). 1978. The biochemistry of silicon andrelated problems. Plenum Press, New York, NY.
6. Bhattacharyya, P., and B. E. Volcani. 1980. Sodium dependent silicate trans-port in the apochlorotic marine diatom Nitzschia alba. Proc. Natl. Acad. Sci.USA 77:6386–6390.
7. Birchall, J. D. 1995. The essentiality of silicon in biology. Chem. Soc. Rev.24:351–357.
8. Bryant, N., R. Govers, and D. James. 2002. Regulated transport of theglucose transporter GLUT4. Nat. Rev. Mol. Cell Biol. 3:267–277.
9. Brzezinski, M. A. 1992. Cell-cycle effects on the kinetics of silicic acid uptakeand resource competition among diatoms. J. Plankton Res. 14:1511–1539.
10. Brzezinski, M. A., R. J. Olson, and S. W. Chisholm. 1990. Silicon availabilityand cell cycle progression in marine diatoms. Mar. Ecol. Prog. Ser. 67:83–96.
11. Bustin, S. A. 2002. Quantification of mRNA using real-time reverse tran-scription PCR (RT-PCR): trends and problems. J. Mol. Endocrinol. 29:23–39.
12. Carlisle, E. M. 1981. Silicon in bone formation, p. 69–94. In T. L. Simpsonand B. E. Volcani (ed.), Silicon and siliceous structures in biological systems.Springer-Verlag, New York, NY.
13. Claquin, P., V. Martin-Jezequel, J. C. Kromkamp, M. J. Veldhuis, and G. W.Kraay. 2002. Uncoupling of silicon compared with carbon and nitrogenmetabolisms and the role of the cell cycle in continuous cultures of Thalas-siosira pseudonana (Bacillariophyceae) under light, nitrogen, and phospho-rous control. J. Phycol. 38:922–930.
14. Combet, C., C. Blanchet, C. Geourjon, and G. Deleage. 2000. NPS@: net-work protein sequence analysis. Trends Biochem. Sci. 25:147–150.
15. Conway, H. L., and P. J. Harrison. 1977. Marine diatoms grown in chemo-stats under silicate or ammonium limitations. IV. Transient response ofChaetoceros debilis, Skeletonema costatum, and Thalassiosira gravida to asingle addition of the limiting nutrient. Mar. Biol. 43:33–43.
16. Conway, H. L., P. J. Harrison, and C. O. Davis. 1976. Marine diatoms grownin chemostats under silicate or ammonium limitation. II. Transient responseof Skeletonema costatum to a single addition of the limiting nutrient. Mar.Biol. 35:187–199.
17. Crawford, R. M. 1981. The siliceous components of the diatom cell wall andtheir morphological variation, p. 129–156. In T. L. Simpson and B. E. Vol-cani (ed.), Silicon and siliceous structures in biological systems. Springer-Verlag, New York, NY.
18. Crawford, R. M., and A. M. M. Schmid. 1986. Ultrastructure of silica dep-osition in diatoms, p. 291–314. In B. S. Leadbeater and R. Riding (ed.),Biomineralization in lower plants and animals, vol. 30. The SystematicsSociety, London, United Kingdom.
19. Darley, W. M., and B. E. Volcani. 1969. Role of silicon in diatom metabolism:a silicon requirement for deoxyribonucleic acid synthesis in the diatomCylindrotheca fusiformis Reimann and Lewin. Exp. Cell Res. 58:334–342.
20. Del Amo, Y., and M. A. Brzezinski. 1999. The chemical form of dissolved Sitaken up by marine diatoms. J. Phycol. 35:1162–1170.
21. Dubois, E., and M. Grenson. 1979. Methylamine/ammonia uptake systems inSaccharomyces cerevisiae: multiplicity and regulation. Mol. Gen. Genet. 175:67–76.
278 THAMATRAKOLN AND HILDEBRAND EUKARYOT. CELL
Dow
nloa
ded
from
http
s://j
ourn
als.
asm
.org
/jour
nal/e
c on
08
Febr
uary
202
2 by
101
.235
.251
.17.
22. Dugani, C. B., and A. Klip. 2005. Glucose transporter 4: cycling, compart-ments and controversies. EMBO Rep. 12:1137–1142.
23. Epstein, E. 1994. The anomaly of silicon in plant biology. Proc. Natl. Acad.Sci. USA 91:11–17.
24. Forsberg, H., and P. O. Ljungdahl. 2001. Sensors of extracellular nutrients inSaccharomyces cerevisiae. Curr. Genet. 40:91–109.
25. Frigeri, L. G., T. R. Radabaugh, P. A. Haynes, and M. Hildebrand. 2006.Identification of proteins from a cell wall fraction of the diatom Thalassiosirapseudonana: insights into silica structure formation. Mol. Cell. Proteomics5:182–193.
26. Gietz, R. D., and R. A. Woods. 2002. Transformation of yeast by the LiAc/SScarrier DNA/PEG method. Methods Enzymol. 350:87–96.
27. Guillard, R. R., and J. H. Ryther. 1962. Studies of marine planktonic dia-toms. I. Cyclotella nana Hustedt and Detonula confervacea Cleve. Can. J.Microbiol. 8:229–239.
28. Guillard, R. R. L. 1975. Culture of phytoplankton for feed marine inverte-brates, p. 29–60. In W. L. Smith and M. H. Chanley (ed.), Culture of marineinvertebrate animals. Plenum Press, New York, NY.
29. Hildebrand, M. 2005. Cloning and functional characterization of ammoniumtransporters from the marine diatom Cylindrotheca fusiformis (Bacillario-phyceae). J. Phycol. 41:105–113.
30. Hildebrand, M. 2000. Silicic acid transport and its control during cell wallsilicification in diatoms, p. 171–188. In E. Bauerlein (ed.), Biomineralization:from biology to biotechnology and medical applications. Wiley-VCH, Wein-heim, Germany.
31. Hildebrand, M., and K. Dahlin. 2000. Cloning and characterization ofnitrate transporter genes from the diatom Cylindrotheca fusiformis. J. Phycol.36:30.
32. Hildebrand, M., K. Dahlin, and B. E. Volcani. 1998. Characterization of asilicon transporter gene family in Cylindrotheca fusiformis: sequences, expres-sion analysis, and identification of homologs in other diatoms. Mol. Gen.Genet. 260:480–486.
33. Hildebrand, M., L. G. Frigeri, and A. K. Davis. Synchronized growth ofThalassiosira pseudonana (Bacillariophyceae) provides novel insights intocell wall synthesis processes in relation to the cell cycle. J. Phycol., in press.
34. Hildebrand, M., B. E. Volcani, W. Gassmann, and J. I. Schroeder. 1997. Agene family of silicon transporters. Nature 385:688–689.
35. Iraqui, I., S. Vissers, F. Bernard, J.-O. de Craene, E. Boles, A. Urrestarazu,and B. Andre. 1999. Amino acid signaling in Saccharomyces cerevisiae: apermease-like sensor of external amino acids and F-box protein Grr1p arerequired for transcriptional induction of the AGP1 gene, which encodes abroad-specificity amino acid permease. Mol. Cell. Biol. 19:989–1001.
36. Kasahara, T., and M. Kasahara. 2003. Transmembrane segments 1, 5, 7, and8 are required for high-affinity glucose transport by Saccharomyces cerevisiaeHxt2 transporter. Biochem. J. 372:247–252.
37. Kindler, S., H. Wang, D. Richter, and H. Tiedge. 2005. RNA transport andlocal control of translation. Annu. Rev. Cell Dev. Biol. 21:223–245.
38. Ko, C. H., H. Liang, and R. F. Gaber. 1993. Roles of multiple glucosetransporters in Saccharomyces cerevisiae. Mol. Cell. Biol. 13:638–648.
39. Lewin, J. C. 1954. Silicon metabolism in diatoms. I. Evidence for the role ofreduced sulfur compounds in silicon utilization. J. Gen. Physiol. 37:589–599.
40. Lewin, J. C. 1955. Silicon metabolism in diatoms. III. Respiration and siliconuptake in Navicula pelliculosa. Can. J. Microbiol. 3:427–433.
41. Lorenz, M. C., and J. Heitman. 1998. The MEP2 ammonium permeaseregulates pseudohyphal differentiation in Saccharomyces cerevisiae. EMBO J.17:1236–1247.
42. Ma, J. F., K. Tamai, N. Yamaji, N. Mitani, S. Konishi, M. Katsuhara, M.Ishiguro, Y. Murata, and M. Yano. 2006. A silicon transporter in rice. Nature440:688–691.
43. Marini, A.-M., S. Soussi-Boudekou, S. Vissers, and B. Andre. 1997. A familyof ammonium transporters in Saccharomyces cerevisiae. Mol. Cell. Biol. 17:4282–4293.
44. Marini, A.-M., S. Vissers, A. Urrestarazu, and B. Andre. 1994. Cloning and
expression of the MEP1 gene encoding an ammonium transporter in Sac-charomyces cerevisiae. EMBO J. 13:3456–3463.
45. Martin-Jezequel, V., M. Hildebrand, and M. A. Brzezinski. 2000. Siliconmetabolism in diatoms: implications for growth. J. Phycol. 36:821–840.
46. Milligan, A., D. E. Varela, M. A. Brzezinski, and F. M. M. Morel. 2004.Dynamics of silicon metabolism and silicon isotopic discrimination in amarine diatom as a function of pCO2. Limnol. Oceanogr. 49:322–329.
47. Mitchison, J. 2003. Growth during the cell cycle. Int. Rev. Cytol. 226:165–258.
48. Neigeborn, L., P. Schwartzberg, R. Reid, and M. Carlson. 1986. Nullmutations in the SNF3 gene of Saccharomyces cerevisiae cause a differentphenotype than do previously isolated missense mutations. Mol. Cell.Biol. 6:3569–3574.
49. Nelson, D. M., P. Treguer, M. A. Brzezinski, and A. Leynaert. 1995. Pro-duction and dissolution of biogenic silica in the ocean: revised global esti-mates, comparison with regional data and relationship to biogenic sedimen-tation. Global Biogeochem. Cycles 9:359–372.
50. Nielsen, H., J. Engelbrecht, S. Brunak, and G. von Heijne. 1997. Identificationof prokaryotic and eukaryotic signal peptides and prediction of their cleavagesites. Protein Eng. 10:1–6.
51. Ozcan, S., J. Dover, A. G. Rosenwald, S. J. Wolfl, and M. Johnston. 1996.Two glucose transporters in Saccharomyces cerevisiae are glucose sensorsthat generate a signal for induction of gene expression. Proc. Natl. Acad. Sci.USA 93:12428–12432.
52. Pickett-Heaps, J., A. M. M. Schmid, and L. A. Edgar. 1990. The cell biologyof diatom valve formation., p. 1–168. In F. E. Round and D. J. Chapman(ed.), Progress in phycological research, vol. 7. Biopress Ltd., Bristol, UnitedKingdom.
53. Reimann, B. E. F., J. C. Lewin, and B. E. Volcani. 1966. Studies on thebiochemistry and fine structure of silica shell formation in diatoms. II. Thestructure of the cell wall of Navicula pelliculosa (Breb.) Hilse. J. Phycol.2:74–84.
54. Richmond, K. E., and M. Sussman. 2003. Got silicon? The non-essentialbeneficial plant nutrient. Curr. Opin. Plant Biol. 6:268–272.
55. Schmid, A. M. M. 1994. Aspects of morphogenesis and function of diatomcell walls with implication for taxonomy. Protoplasma 181:43–60.
56. Schmid, A. M. M., M. A. Borowitzka, and B. E. Volcani. 1981. Morphogen-esis and biochemistry of diatom cell walls, p. 63–97. In O. Kiermayer (ed.),Cytomorphogenesis in plants, vol. 8. Springer-Verlag, New York, NY.
57. Schwarz, K., and D. B. Milne. 1972. Growth-promoting effects of silicon inrats. Nature 239:333–334.
58. Strickland, J. D. H., and T. R. Parsons. 1968. A practical handbook of seawater analysis. Bull. Fish. Res. Board Canada 167:1–311.
59. Sullivan, C. W. 1976. Diatom mineralization of silicic-acid. I. Si(OH)4 trans-port characteristics in Navicula pelliculosa. J. Phycol. 12:390–396.
60. Sullivan, C. W. 1977. Diatom mineralization of silicic acid. II. Regulation ofSi(OH)4 transport rates during the cell cycle of Navicula pelliculosa. J.Phycol. 13:86–91.
61. Thamatrakoln, K., A. J. Alverson, and M. Hildebrand. 2006. Comparativesequence analysis of diatom silicon transporters: towards a mechanisticmodel for silicon transport. J. Phycol. 42:822–834.
62. Thompson, J. D., D. R. Higgins, and T. J. Gibson. 1994. CLUSTAL W:improving the sensitivity of progressive multiple sequence alignment throughsequence weighting, position-specific gap penalties and weight matrix choice.Nucleic Acids Res. 22:4673–4680.
63. Treguer, P., D. M. Nelson, A. J. Van Bennekom, D. J. DeMaster, A. Leynaert,and B. Queguiner. 1995. The silica balance in the world ocean: a reestimate.Science 268:375–379.
64. Treguer, P., and P. Pondaven. 2000. Silica control of carbon dioxide. Nature406:358–359.
65. Tusnady, G. E., and I. Simon. 2001. The HMMTOP transmembrane topol-ogy prediction server. Bioinformatics 17:849–850.
66. Van Belle, D., and B. Andre. 2001. A genomic view of yeast membranetransporters. Curr. Opin. Cell Biol. 13:389–398.
VOL. 6, 2007 T. PSEUDONANA SILICON TRANSPORTERS 279
Dow
nloa
ded
from
http
s://j
ourn
als.
asm
.org
/jour
nal/e
c on
08
Febr
uary
202
2 by
101
.235
.251
.17.
Related Documents
![Ions channels/transporters and chloroplast regulation · transporters/pumps and secondary transporters (according to the Transport Classification system [1]). Channels transport](https://static.cupdf.com/doc/110x72/601623c1d6936b1074546c48/ions-channelstransporters-and-chloroplast-transporterspumps-and-secondary-transporters.jpg)