ANALYSIS OF SOCIOECONOMIC DEVELOPMENT DIFFERENTIALS IN KOGI STATE, NIGERIA BY Grace Foluke BALOGUN (P16PSGS9098) PHD/SCIE/03095/2009-2010 A DISSERTATION SUBMITTED TO THE SCHOOL OF POSTGRADUATE STUDIES AHMADU BELLO UNIVERSITY ZARIA IN PARTIAL FULFILLMENT FOR THE AWARD OF THE DOCTOR OF PHILOSOPHY (PHD) DEGREE IN GEOGRAPHY DEPARTMENT OF GEOGRAPHY AND ENVIRONMENTAL MANAGEMENT FACULTY OF PHYSICAL SCIENCES AHMADU BELLO UNIVERSITY, ZARIA Title Page MAY, 2018

Welcome message from author
This document is posted to help you gain knowledge. Please leave a comment to let me know what you think about it! Share it to your friends and learn new things together.
Transcript
ANALYSIS OF SOCIOECONOMIC DEVELOPMENT DIFFERENTIALS IN
KOGI STATE, NIGERIA
BY
Grace Foluke BALOGUN
(P16PSGS9098)
PHD/SCIE/03095/2009-2010
A DISSERTATION SUBMITTED TO THE SCHOOL OF POSTGRADUATE
STUDIES AHMADU BELLO UNIVERSITY ZARIA IN PARTIAL
FULFILLMENT FOR THE AWARD OF THE DOCTOR OF PHILOSOPHY
(PHD) DEGREE IN GEOGRAPHY
DEPARTMENT OF GEOGRAPHY AND ENVIRONMENTAL MANAGEMENT
FACULTY OF PHYSICAL SCIENCES
AHMADU BELLO UNIVERSITY,
ZARIA
Title Page
MAY, 2018
ii
DECLARATION
I declare that this thesis entitled ―Analysis of Socioeconomic Development
Differentials in Kogi State, Nigeria is done by me - Grace Foluke BALOGUN in the
Department of Geography and Environmental Management, Ahmadu Bello University,
Zaria under the supervision of Prof. J. O. Adefila, Dr. R.O. Yusuf and Prof. I. J. Musa.
The information derived from the literature has been duly acknowledged in the text and
a list of references provided. No part of this Thesis was previously presented as a
degree or diploma at this or any other institution.
_______________________ __________________ _________________
Grace Foluke BALOGUN Signature Date
iii
CERTIFICATION
This thesis entitled “Analysis of Socioeconomic Development Differentials in Kogi
State, Nigeria”is produced by Grace Foluke BALOGUN and meets the regulations
governing the award of Doctor of Philosophy (PhD) degree of the Ahmadu Bello
University Zaria, Nigeria and is approved for its contribution to knowledge and literary
presentation.
_______________________ ________________ ________________
Prof. J. O. Adefila Signature Date
Chairman Supervisory Committee
_______________________ ________________ ________________
Prof. I. J. Musa Signature Date
Member Supervisory Committee
_______________________ ________________ ________________
Dr. R. O. Yusuf Signature Date
Member Supervisory Committee
_______________________ ________________ ________________
Dr. A. K. Usman Signature Date
Head of Geography Department
_______________________ ________________ ________________
Prof. S.Z Abubakar Signature Date
Dean, School of Postgraduate Studies

iv
DEDICATION
This work is dedicated to my lovely children Precious Eniola Balogun, Praise
Oluwatobiloba Balogun and Peace Okikiola Balogun and to the hopeless and helpless
individuals who keep on longing for a better future.
v
ACKNOWLEDGEMENTS
To God almighty be Praise, Honour and Glory for giving me the grace to complete this
work. To acknowledge the assistance I received from those whom I have considered
and who have contributed in one way or the other toward making this research a reality
would be impossible. I can only say that I have at all times been helped by others,
without whose goodwill and interest, this research would not have been possible. My
unreserved gratitude goes to my well and able supervisor Prof. J. O. Adefila for his
fatherly support and contributions towards the success of this research work. It is only
God that can repay you. May God‘s hand continue to uplift you and your household,
Furthermore, I am indebted to the supervisory team including, Dr. R. O. Yusuf a
counsellor and a role model and Prof. I. J. Musa, the immediate past Head of the
Department for your painstaking efforts, pieces of advice and encouragement towards
the success of this study. May God Almighty continue to bless and increase you. I also
sincerely express my profound gratitude to my beloved Mother - Mrs Marion Ajike
Philip for her prayer, love, advice and moral support given to me at all times.
My heartfelt gratitude goes to my jewels, Precious Eniola Balogun, Praise Oluwatobi
Balogun and Peace Okikiola Balogun for their love, care, understanding and support
that you gave me as your mother. May God Almighty bring you to the fulfilment of
your dreams in life. I also want to acknowledge the assistance of the University
librarians, the trained field staff, Chairmen of the various Local Government Areas
(LGAs), the Commissioners and the various organizations too numerous to mention.
Also, to all individuals who stood by me during this time including my sisters and
brothers namely, Rtd Sqn Ldr and Mrs KunleFlorence Obadiah, Ms Comfort Philip, Mr

vi
and Mrs Olorunjuwon Phillips, Mrs Omolade Obaja, Egnr. and Mrs Tope Bewarang,
Dr and Mrs Femi Anjorin, Mr and Mrs Joseph Olowo, Mr and Mrs Olabowumi
Fagbemi, Dr Stanley O. Balogun and others; I say a very big thank you, God bless you
all.
To my friends, Mr and Mrs Daniel Okorie, Mr and Mrs O. Onileowo, Mrs Titilayo
Ekunode, Mr and Mrs Remilekun Adeyemo-Ojo, Mr and Mrs Isaac Ajanaku, Mr and
Mrs Rotimi Badiru, Mr and Mrs Onakanowoja, Mr and Mrs Samuel Oyetoro, Engr. and
Mrs Remi Ukhora, Mrs Fatima Aminu, Mr and Mrs Glory Momoh, Mr Dele Laniyan,
Gray‘s College Family as a whole and others too numerous to mention, may God
continue to bless and keep you all. To my boss and pastor in person of Pastor Edmund
Harold, I say a very big thank you, my friend and my examiner Dr. Bernadine Akpu,
God bless you.
This acknowledgement will not be complete without expressing my gratitude to all
lecturers in the Department of Geography and Environmental Management Ahmadu
Bello University, Zaria and National Defence Academy, Kaduna who despite their tight
schedules, still find time to make meaningful contributions to my life in the
Department, may your labour of love be crowned with resounding success. I say thank
you.
vii
ABSTRACT
There are environmental contrasts in terms of variations in the distribution of resources
among regions. The disparities are glaring among the regions that make up Nigeria and
this fact is entrenched in the Second National Development Plan (1970 – 1974). It
recognized the spatial inequalities in the country and efforts are being made to reduce
the gap among the geographical units. The country has not satisfactorily addressed the
issue of how development can be evenly or spatially achieved. The major goal of this
study is to assess the differentials in socioeconomic infrastructures development in
Kogi State. Questionnaire survey and documented materials constituted major sources
of data. All the twenty-one Local Government Areas of the state formed the study area.
Some 784 respondents were randomly selected in the state for the administration of the
questionnaire. The descriptive statistics method was employed involving the
calculation of percentages, mean, frequency counts and averages to summarize the data
into tabular forms. Also, inferential statistics were employed namely Location
Quotient (LQ), Standardized Score (Z-score) and Factor Analysis techniques. The
location quotient result is categorized into upper, middle and bottom thirds based on the
performance of each LGA in the distribution of the socioeconomic facilities. The upper
group includes Ogori (1.82), Idah (1.78)and Bassa (1.63), while the middle group
includes Ibaji (1.18), Olamaboro (1.16) and Dekina (1.12) and the bottom group
include Yagba-East (0.86), Kabba-Bunu (0.82) and Ofu (0.80) among others. For the
purpose of comparism, the Standardized Scores (Z-Scores) was employed using the
five dimensions and the associated 23 variables. The Z-score result showed varying
degrees of the indicators of socioeconomic development infrastructures among the
LGAs, such that seven areas were found to be advantaged namely Ogori, Idah, Bassa
and Omala in the upper category, while the disadvantaged areas include Yagba-East,
Kabba-Bunu, Ofu and Ankpa. The Factor Analysis result showed the strength of each
factor responsible for the pattern of socioeconomic distribution in the study area. The
study revealed a polarized pattern of socioeconomic development in Kogi State. On the
basis of the findings, the study recommends that there should be a discriminatory
investment in favour of the less privileged areas in subsequent resource allocations by
government, community leaders and individual philanthropists. Developing
marginalized areas can abate misunderstanding and discontentment that may arise
when backward communities feel they are uncared for.
viii
TABLE OF CONTENTS
Title Page i
Certification iii
Dedication iv
Acknowledgements v
Abstract vii
Table of Contents viii
List of Tables xii
List of Figures xiii
Lists of Appendices xiv
CHAPTER ONE:INTRODUCTION 1
1.1 Background to the Study 1
1.2 Statement of the Research Problem 6
1.3 Aim and Objectives 10
1.4 Research Hypothesis 11
1.5 Scope of the Study 11
1.6 Significance of the Study 12
CHAPTER TWO:CONCEPTUAL, THEORETICAL FRAMEWORK AND
LITERATURE REVIEW 14
2.1 Conceptual Framework 14
2.1.1 Concept of economic development 14
2.1.2 Spatial inequality in economic development 14
2.2 Theories of Inequalities in Regional Development 23
2.2.1 Economic base theory 29
2.2.2 Circular cumulative causation theory 30
2.2.3 Trickle down model 34
2.2.4 Core - Periphery Theory 34
2.3 Literature Review 37
2.3.1 Evidence of regional spatial inequality 37
2.3.2 Regional inequality in developing countries 41
2.3.3 Regional inequality in developed countries 42
2.3.4 Evidence of Urban Spatial Inequality 46
2.3.5 Evidence of spatial inequality in nigeria 48
2.3.6 National development planning in nigeria 53
2.3.6.1 Pre-Independence Plan 54
ix
2.3.6.2 First National Development Plan (1962-1968) 54
2.3.6.3 The Second National Development Plan (1970-1974) 55
2.3.6.4 The Third National Development Plan (1975-1980) 57
2.3.6.5 Fourth National Development Plan (1981-1985) 59
2.3.6.6 The Fifth National Development Plan (1985-1989) 61
2.3.6.7 The Perspective Plan and the Rolling Plans (1990-1998) 62
2.3.6.8 National Economic Empowerment and Development Strategy (NEEDS)
(2003-2007) 63
2.3.6.9 Vision 20:2020 65
2.3.6.10 Institutions and Spatial Inequality 65
2.4 Surrogates of Socioeconomic Development In Kogi State 67
2.4.1 Transport and Communication 67
2.4.2 Education 68
2.4.3 Commerce and Trade 71
2.4.4 Health Care Facilities 73
2.4.5 Industries 75
CHAPTER THREE:STUDY AREA AND METHODOLOGY 77
3.1 The Study Area 77
3.1.1 Location and Size 77
3.1.2 Climate 77
3.1.3 Relief and drainage 79
3.1.4 Vegetation 80
3.1.5 Population, people and Economic Activity 81
3.2 Methodology 81
3.2.1 Reconnaissance Survey 81
3.2.2 Types of Data Utilized 82
3.2.3 Sources of Data 82
3.2.3.1 Primary Source of Data 82
3.2.3.2 Secondary Sources of Data 83
3.2.4 Sample size and sampling techniques 83
3.2.5 Data Analysis 86
x
CHAPTER FOUR:RESULTS AND DISCUSSION 90
4.1 Socioeconomic Profile of the Respondents 90
4.1.1 Gender of Respondents 90
4.1.2 Age-group of Respondents 92
4.1.3 Marital Status of the Respondents 93
4.1.4 Education Level of the Respondents 94
4.1.5 Occupation of the respondents 91
4.1.6 Income Level of the Respondents 97
4.1.7 Household Size 98
4.2 Extent of Spatial Inequalities in SocioeconomicDevelopment 99
4.2.1 Performance of the LGAs in Each of the Selected Variables 100
4.2.1.1 Spatial Inequalities in Transport and Communication 100
4.2.1.2 Spatial Inequalities in Educational Facilities 103
4.2.1.3 Spatial Inequalities in commerce and Trade. 106
4.2.1.4 Spatial Inequalities in Health care Facilities 108
4.2.1.5 Spatial Inequalities in the distribution of Industries 112
4.3 Comparative Analysis of Socioeconomic Developmentin Kogi State 115
4.4 Spatial Pattern of Socioeconomic Development 118
4.4.1 Inequalities in transport and communication facilities 118
4.4.2 Hypothesis testing 121
4.4.3 Inequalities in educational facilities 121
4.4.4 Hypothesis testing 124
4.4.5 Inequalities in commerce and trade facilities 124
4.4.6 Hypothesis testing 127
4.4.7 Inequality in health care facilities distribution 127
4.4.8 Hypothesis testing 129
4.4.9 Inequalities in Industrial Facilities distributiom 131
4.4.10 Hypothesis testing 132
4.4.11 Comparative analysis of the standardized scores on the five dimensions 134
4.5 The processes underlying the spatial patternof socioeconomic
development in kogi state 137
4.5.1 The factors influencing the spatial dimension of socioeconomic
development 137
4.5.2 Rotated matrix of factors influencing pattern of socioeconomic
development 138
xi
4.5.3 Addressing the challenges facing socioeconomic development in kogi
state 142
4.5.4 Miscellaneous factors responsible for the pattern of socioeconomic
development in kogi state 147
4.5.4.1 Senatorial Divide 147
4.5.4.2 Natural Environment 148
4.5.4.3 Proximity to State Headquarters 149
4.5.4.4 Political Power 150
CHAPTER FIVE: SUMMARY, CONCLUSION AND RECOMMENDATIONS
152
5.1 Summary of Findings 152
5.2 Conclusion 154
5.3 Recommendations 155
5.4 Suggestions for Further Studies 156
References 158
Appdendices 171
xii
LIST OF TABLES
Tables Pages
3. 1: Selected Socio-economic Development Indicators 83
3. 2: Sample Size by Local Government Areas 85
4. 1: Income Level of the Respondents 98
4. 2: Household Size of the Respondents 99
4. 3: Aggregate LQ values on LGAs on Transport and Communication 101
4. 4: Aggregate LQ values on Spatial Inequalities in Education Facilities 103
4. 5: Aggregate LQ values on Spatial Inequalities in Commerce and Trade 106
4. 6: Aggregate LQ values on Spatial Inequalities in Health Care Facilities 109
4. 7: Aggregate LQ values on Spatial Inequalities in Industries 112
4. 8: The Aggregate LQ of all the Socioeconomic Variables used 116
4. 9:The Z-Scores on Transport and Communication for Kogi State 119
4. 10: Transport and Communication Dimension 121
4. 11: The Standardized Scores On Educational Facilities 122
4. 12:Education Dimension 124
4. 13: The Standardized Scores on Commerce and Trade facilities. 125
4. 14: Commerce and Trade Dimension 127
4. 15: The Standardized Scores on Healthcare Facilities 128
4. 16: Healthcare Dimension 129
4. 17: The Standardized Scores on Industrial Facilities 131
4. 18: Industry Dimension 132
4. 19: Comparative Analysis of Z-Score for Socioeconomic Development Indicators in
Kogi State 135
4. 20: Matrix of Factors Influencing Socioeconomic Development in Kogi State 139
4. 21: The Underlying Dimensions of Socioeconomic Development in the Study Area 141
4. 22: Possible factors influencing the Location of Facilities in Kogi State 143
4. 23: Other Factors responsible for the Differetials in Socioeconomic Development 147
xiii
LIST OF FIGURES
Figures Page
3. 1: Kogi State showing the Senatorial districts and the Local Government Areas 78
4.1: Gender of the Respondents 91
4.2: Chart showing respondents‘ age distribution 92
4.3: Marital Status of the Respondents 94
4.4: Chart showing the Educational Background of Respondents. 95
4.5: Occupation of the Respondents 96
4.6: The pattern presented by LQ of Transport and Communication 102
4.7: The Pattern presented by LQ of Educational Facilities 105
4. 8: The Pattern of LQ of Commerce and Trade 107
4. 9: The Pattern of LQ of Health Care Facility 111
4. 10: The Pattern Presented by LQ of Industrial Facilities. 114
4. 11: General Pattern of the LQs for the LGAs. 117
4. 12:The performance of the LGAs in Trans and Communication Facility. 120
4. 13: The performance of the LGAs in Educational Facility 123
4. 14:Pattern of socioeconomic Development of Commerce and Trade in Kogi
State 126
4. 15: Pattern of Socioeconomic Development of Healthcare Facility in Kogi State 130
4. 16: Pattern of Socioeconomic Development of Industrial Facilities 133
4. 17: The Pattern Depicted by the Mean of all the Facilities Used. 136
4. 18: Distribution of Factors Loadings 142
xiv
LISTS OF APPENDICES
Appendix Pages
I: Questionnaire for Respondents 171
II: Questionnaire for Local Government Headquaters 176
III: Data for Socio-Economic Variables 181
IV: Location Quotient for the Variables 181
V: LQ for Transport and Communication (Number of Post Office) 182
VI: LQ for Transport and Communication (Number of Global Communication Mast) 182
VII: LQ for Transport and Communication (% of People Using Mobile Phones) 183
VIII: LQ for Transport and Communication (%of People Using radio/TV sets) 183
IX: Data for Education Facilities 184
X: LQ for Education Facilities (Number of Primary Schools) 184
XI: LQ for Education Facilities (Number of Teachers in Primary Schools) 185
XII: LQ For Education Facilities (Number of Secondary Schools) 185
XIII: LQ For Education Facilities (Number of Teacher in Secondary Schools) 186
XIV: LQ for Education Facilities (Number of Tertiary Institution) 186
XV: LQ for Education Facilities (Secondary School Student - Teacher Ratio) 187
XVI: Data for Commerce and Trade 187
XVII: LQ for Commerce and Trade (Number of Markets Facilities) 188
XVIII: LQ For Commerce and Trade (Number of Banks) 188
XIX: LQ for Commerce AND TRADE (Number of Cooperative Society) 189
XX: LQ for Commerce and Trade (Number of Community Development
Organisation) 189
XXI: Data for Health Care Facilities 190
XXII: LQ for Health Care and Sanitation (Number of Health Care Centres) 190
XXIII: LQ for Health Care and Sanitation (Number of Hospital Beds) 191
xv
XXIV: LQ for Health Care and Sanitation (Number of Medical Doctors) 191
XXV: LQ for Health Care and Sanitation (Number of Nurses) 192
XXVI: LQ for Health CarE and Sanitation (Number of Pharmacists) 192
XXVII: Data for Industries 193
XXVIII:LQ FOR Industries (Number of Local Craft Industries) 193
XXIX: LQ for Industries (Number of Manufacturing Industries) 194
XXX: LQ for Industries (Number of People Employed in the Industries) 194
XXXI: The correlation Matrix of the Socio-Economic Variables 195
1
CHAPTER ONE
INTRODUCTION
1.1 BACKGROUND TO THE STUDY
Economic development is the process by which a nation improves the economic,
political and social well-being of its people (Schumpeter and Backhaus, 2003). In the
developing economies such as Nigeria spatial inequalities are noticeable between rural
areas with traditional agriculture, low income per capita, and poor living conditions on
the one hand and their urban counterparts with modern commercial activities, industrial
revolution, high per capita income and better condition of living on the other hand
(Akpan, 2000). The issue of regional inequalities is very glaring in developing
countries, but the problem of disparity in development among nations and among the
different regions of any nation is not only restricted to developing countries (Umoren,
2013). This phenomenon has given rise to polarized pattern of development. On the
one hand, the concentration of urban population in only a few large metropolitan areas
has reinforced and maintained dualistic economic growth and has reinstated disparities
in regional development. On the other hand, the population is distributed so widely that
an articulated settlement system capable of supporting the variety of services and
facilities needed for rural development is yet to emerge (NISER, 2001).
Sulyman (2009) remarked that the highly centralized spatial structure of the Nigerian
economy with its associated marked variations in regional wealth and in standards of
living is deeply rooted in history of colonization. The author further stated that an
institutional basis of the British political economy in the country was a few trading
companies that handled the collection and dispatch of all goods produced for export
and the importation and distribution of manufactured goods. This brought about inter-
2
regional gaps in development. Another component of the British economic policy that
influenced the spatial development of the country was the introduction of new
agricultural commodities such as cocoa and the valorization of existing ones such as
groundnuts, cotton, palm-produce and rubber. Pursuant to these policies priority was
accorded the construction of the transport network. A number of regional economies
thus quickly emerged each based on its comparative advantages for the production of
cocoa, oil-palms, and groundnuts. An important consequence of these for economic
development was that the impulses of development propelled along the transportation
system initiated a dynamic situation in which labour moved to areas of new export crop
production and to the towns that served them. Since independence this trend in
migration has profound influence on the pattern of national and regional development
investments and expenditures such that state capitals and local government
headquarters become centres of socioeconomic development compared to adjoining
hinterlands (Ighodaro, 2009).
In the sixties a reduction in inequality has been regarded as a major component of the
development process and a step towards raising living standards (Ita, Bisong, Eni and
Iwara 2012). Adefila, (2012b) remarked that socioeconomic activities are spatially
spread unevenly and that historical factors, political, cultural, natural endowment to
economic processes among others are the cause. The researcher further stated that
with the understanding of processes at work, attempts have always been made
towards the identification of spatial inequalities among the regions and to produce a
body of theory for their areal explanation.
3
The first explicit awareness of spatial disparity was shown in Nigeria‘s second
National Development Plan (1970-1974). This plan clearly spelt out five principal
objectives of establishing Nigeria as: a united, strong and self-reliant nation; a great
and dynamic economy; a just and egalitarian society; a land of bright and full
opportunities for all citizens; and a free and democratic society. The objectives stated
in this plan were to represent the long-term goals of the country‘s development efforts
in the bid to reduce ‗inequalities in interpersonal incomes, and promoting balanced
development among the various communities in the different geographical areas in
the country‘ (FGN, 1970).
The Third National Development Plan (1975-1980) was the first National
Development Plan with serious concern for rural infrastructure development. The plan
recognized that the extreme rural-urban disparities in the provision of social amenities
and living conditions are responsible for rural-urban migration which is inimical to
economic development (FGN, 1975). The plan emphasized the need to reduce
regional disparities in order to foster national unity through the adoption of Integrated
Rural Development (IRD). IRD has been defined as a consciously formulated,
systematic, multi-sectional programme to attain the integration of the rural people in
the mainstream of economic groups in a country. The objective was to ensure the
provision of rural infrastructure and that through this, rural productivity quality of life
would be increased (Ebehikhalu, 2004).
The fourth national plan (Nigeria, 1980-85) recognized the widening disparities in the
level of development particularly between the rural and urban areas in the country and
evolved some strategies to ameliorate the existing gap through the creation of more
4
states and local governments. The rationale behind this policy is to allay the fear of
the minority group by bringing government and development close to the people at
the grass root. This brought about the decentralization of decision-making process
through the creation of States and local government which tend to counterbalance the
centre-down approach. Thus, the creation of more states and local government areas
brought in a more rational spatial arrangement (Ajayi, 2007).
The revenue allocation formula had progressively de-emphasized the principle of
derivation and placed more attention on the principles of equality, needs and national
unity. This revenue sharing formula is to be adopted by government at all level, but it
was not strictly followed. This is evident from Ogoni uprising while agitating for
resource control over their land now in Rivers State. Petroleum has been the life-wire
of Nigeria‘s economy and since its discovery in 1958 some estimated 100 billion
dollars‘ worth of oil and gas has been carted away from Ogoni land. The exploitation
of oil and gas led to environmental degradation in terms of pollution, deforestation
and deprivation of the oil producing communities. The continual agitation, neglect of
the people benefit from economic growth and development led to the formation of the
Movement for the survival of the Ogoni people (MOSOP), a non-violent action group
for social and ecological justice headed by the late Ken Saro-Wiwa (MOSOP 2014). It
would be recalled that it was on this issue of resource control that Ogoni leader was
killed by the military junta in 1994.
Yunusa, (1991) observed that the pressing issue of socio-economic development has
being the challenge of the widening gap between the rich and the poor worldwide.
This phenomenon is manifested between individuals, between rural-urban locations,
5
between regions in a country, and between developed and developing countries at a
global level. Recardo; (2004), Sandra; (2004) and Enrique (2004) had remarked that
the world‘s population can be divided into two groups namely, the rich and the poor
and that the gap between them has been widening and in many cases has led to
worsening conditions for the poor segments whose majority are rural based. Adefila
(2008) also remarked that Nigerian society has been polarized into a few urban,
commercialized, industrialized, rich on the one hand and extensive rural, agricultural
and poor on the other. This pattern of lopsidedness in development is glaring within
the space economy in the developing countries.
The polarization of Nigerian society into a larger rural sector and a smaller urban
component is hardly arguable. Equally familiar is the heavily skewed nature of
industrial, commercial, infrastructural and administrative development in favour of
the few urban centres at the expense of their rural counterparts (Ita et al, 2012). In
Kogi State, there seems to be a discernible pattern of inequalities in socioeconomic
indicators across Local Government Areas of the State. Some Local Government
Areas enjoy huge government presence, while others suffer complete neglect or fairly
enjoy government presence. For example on the issue of transportation, a great
percentage of the roads in Lokoja, the capital city and environs are tarred while a
greater percentage of the roads in other LGAs are not tarred. Similarly, while road
density and inter-connectivity are high in Lokoja, they are very low in each of the
other local government area of the state (Alabi and Ocholi, 2010). In addition, the
establishment and distribution of industries in the state leaves much to be desired.
6
A cursory look at the industrial map of kogi state shows that, the western senatorial
district has very few industries with majority of the industries sited in Lokoja town
and Kogi East Senatorial district. This is the same across with other development
indicators such as education, hospitals, electricity and others. The situation of things
in kogi state indicates inequality in the distribution of socioeconomic facilities.
Oyekanmi, Ayansina, Muyiwa and Jubril (2011) in their study reveal inequality in the
distribution of social infrastructure in rural areas of the study area which needs to be
addressed promptly to allow for even development. It is on this background that the
study analysis the socioeconomic development differentials in Kogi State.
1.2 STATEMENT OF THE RESEARCH PROBLEM
It is obvious that there are variations in the level of economic development among
regions and among countries of the world. It could be as a result of uneven distribution
of physical, human and natural resources. Abundant evidence exists in the literature on
inequalities in the distribution of socioeconomic facilities in Nigeria. While some
regions have some resources in abundance, other regions are lacking in the resources.
For instance, some areas have education facilities close to their area and as such pay
less to access the facility. It is also true for other facilities like health care, good
drinking water, electricity, accessible roads, communication network and others. The
areas that are lacking in having these facilities are affected adversely and as a result pay
heavily to access the facilities.
Kogi State from observation is dominated by undulating landscape, broken by hills
which formed resistant rocks which has profound influence on the pattern of settlement
in the area. The eastern region has a fairly undulating terrain which gave it higher
7
development as against the western region that is characterized by resistant rocks. Land
for development is relatively scarce in the western part of the state. The growth of
towns is therefore rapidly taking place where the land is relatively flat (Ocheja, 2010).
Socioeconomic facilities seem to be concentrated in particular areas of the state, giving
rise to a lopsided pattern of development. It is therefore logical to propose that the
availability and equitable distribution of infrastructures will accelerate or discourage
socioeconomic development of Kogi State.
For instance Adefila and Bulus (2014) examined Spatial Inequalities in Infrastructural
Development in Plateau State. Both primary and secondary data were used for the
study; the study revealed that some areas in Plateau State have more than average share
thus making infrastructural facilities to be localized. It was discovered that, the type of
lopsided spatial pattern of development tend to aggravate the problem of regional
imbalance. It was therefore recommended that the federal government should address
this regional imbalance with more seriousness.
Umoren (2013) examined the socioeconomic development inequalities among
Geographic units in Akwa Ibom State, Nigeria. Survey research method which includes
oral interview, questionnaire administration was adopted. Findings revealed among
others that there exist variation and patterns in the socioeconomic development in
Akwa-Ibom State. The study recommends the increase of the number of socioeconomic
indicators in the disadvantaged areas.
Ita, Bisong and Iwara (2012) investigated Spatial inequalities among geographic units
in cross river state, Nigeria. The study principally relied on secondary data (social and
8
economic indicators) sourced from record of available socioeconomic facilities in each
Local Government Areas of the state. Data obtained were subjected several statistical
analysis such as mean, standard score, factor analysis and analysis of variance. The
result of the analysis of variance showed that there was a significant variation in the
levels of socioeconomic development among the Local Government Areas. The
findings of the study revealed that inter-regional gaps in development and welfare were
reflections of deficiencies in the provision of necessary social services and physical
infrastructure. The study therefore recommends increase in the relative share of social
services and improves the availability of physical infrastructures in the
deprived/marginalized areas.
Adefila (2012b) examined the regional inequalities in socioeconomic development in
Nassarawa State of Nigeria. The study employed location quotient (LQ) to analyze the
data which revealed that the major urban areas in the State did not rank among the first
category of developed areas. The analysis of the indicators took a four dimensional
approach namely, economic, health, infrastructure and social. The result revealed that
socioeconomic facilities in those areas are inadequate for the teeming population. On
the basis of findings, the author recommends that communal self-help projects should
be encouraged in each area by embarking on building of schools, colleges and health
centres.
Oyekanmi, Ayansina, Muyiwa and Jubril (2011) conducted a study on the geo-political
patterns of health care facilities (HCF) in Kogi State, Nigeria. The total number of
health care facilities and their ownership in each stratum were determined and
analyzed. The result showed that there exist inequalities in the distribution of health
9
care facilities among the various senatorial districts in the state. There is a noticeable
spatial variation in the distribution of health care facilities among the various senatorial
districts. It was observed that Kogi Central is the most disadvantaged senatorial district.
One senatorial district ranked far ahead of the two others in the distribution of all
categories of health care facilities i.e (primary and Secondary). Kogi east senatorial
district ranked far ahead of the west and the central districts in the distribution of health
care facilities. The senatorial districts recorded 67.4% and 54.1% of Primary Health
Care (PHC) and Secondary Health Care (SHC) facilities respectively. The result also
pointed to the fact that in respect to facility-population ratio, Kogi east senatorial
district fares better than the two others. Whereas the facility-population ratios in Kogi
east are 1:1689 and 1:23736 respectively for PHC and SHC facilities; the ratios for
Kogi central are 1:6850 and 1:41859 respectively which is an extremely wide margin.
Akpan (2000) examined spatial inequality in development in Akwa-Ibom State Nigeria.
The study adopted analysis of variance (ANOVA) statistical technique and came up
with the finding that significant differences exist in levels of development among the
administrative units in the State. Akpan categorized these differences into three as
developed, fairly developed and the third being disadvantaged.
Having gone through the accessible past studies, it becomes obvious that much is yet to
be done particularly in the areas of the processes that gave rise to the lopsided polarized
pattern of socioeconomic development in Kogi state. The work of Oyekanmi, et al
(2011) in Kogi State is limited so much that only the spatial inequalities in health care
facilities were focused on. A review of the above studies revealed that not much has
been done in terms of formal analysis of factors that might have given rise to
10
inequalities in the State. The emphases of the various scholars have been on different
aspects of infrastructure, rural development and economic development in the state. It
is now glaring that the tempo of research in this regard is still low or absent as far as
Kogi State is concerned. The only available study was Balogun (1989) who examined
the regional pattern of development in Kwara State before the creation of Kogi State
out of Kwara and Benue in 1991. The author used non-hierarchical grouping to observe
the existence of dualism in the space economy and identified its existence in the space
economy of the study area, Kwara State.
The present study encompasses a wider coverage of socioeconomic surrogates to
measure and analyze development differentials in the study area. The study therefore
addressed the following research questions:-
1 What is the pattern of socioeconomic development in the study area?
2 What is the extent of spatial inequalities in socioeconomic development in the
study area?
3 What is the extent of variation in socioeconomic development among the
different areas in the study area?
4 What are the factors responsible for the pattern of socioeconomic development?
5 What are the challenges facing socioeconomic development in the study area?
1.3 AIM AND OBJECTIVES.
The aim of this study is to examine the pattern of spatial inequalities of
socioeconomic development in Kogi State, Nigeria. However, the specific
objectives are to:
i. analyze the spatial pattern of socioeconomic development in the study area.
11
ii. analyze the extent of spatial inequalities in socioeconomic development in
Kogi State.
iii. make a comparative analysis of socioeconomic development among
theLocal Government Areas.
iv. examine the factors responsible for the spatial pattern of development in the
study area.
v. examine the challenges facing the development of socioeconomic activities.
1.4 RESEARCH HYPOTHESIS
The null hypotheses for the study were:
H0: There is no significant difference in the distribution of socioeconomic facilities in
the study area.
1.5 SCOPE OF THE STUDY
This study is concerned with the analysis of socioeconomic development differentials
in Kogi State, Nigeria. The local government areas constitute the unit of observation. It
covers all the twenty one local government areas in the study area. This study covers
areas such as transport and communication, commerce and trade, education, health
care, cooperative societies and industrial infrastructures. The indicators are carefully
selected for the study because they are observed to play major influence on the socio-
economic development in the study area. The temporal frame of the study is confined
to 1992- 2016 when data could be readily available for the study. The researcher is
rightly informed of chosen the study area because since the geo-political re-structuring
of Nigeria and the emergence of Kogi State in 1991 little efforts have been made to
examine the changes in the pattern of economic development.
12
1.6 SIGNIFICANCE OF THE STUDY
There is a growing concern for correcting the spatial inequalities in economic
development usually premised on the notion of disequilibrium in the spread of benefits
from growth. Growth does not appear everywhere at the same time, it manifests itself
in points of ‗poles‘ of growth with variable intensities; it spreads by different channels
and with variable terminal effects for the economy as a whole. Therefore in order to
break the vicious circle of poverty, re-arrange the spatial structure and attain equity in
the economic growth and development within the space economy, the developing
countries often pursue industrialization as a prerequisite for development but
surprisingly, such industries are often urban based (Yunusa, 1991). The expectation is
that benefits of growth from the urban centers will trickle down to the rural hinterlands
but this has always been an illusion. Having realized the draw-backs of centre-down
approach in our planning efforts, attention has been shifted to bottom-up approach
which gave political power to the people at the grass root to participate actively in
development process. This is an approach that allows people at the community level to
choose their leaders through voting and saddled them with the responsibilities of
formulating, implementing and executing economic projects that could increase the
living standards at the third tier of government in Nigeria (Adefila, 2012a).
In pursuance of policy statement of ameliorating spatial inequalities in Nigeria,
successive governments have embarked on schemes and programmes such as creation
of more states, local government reforms of 1976 which allows local administrative
units some degree of autonomy and creation of additional ones in order to bring
government closer to the people at the grass root; development of agricultural sector as
a corner stone of rural economy, integrated rural development; river basin development
13
authority and rural development, community development and social mobilization are
among numerous strategies embarked upon by the government but could not address
spatial inequalities as expected hence, the widening gap between the rich and poor
units continue to persist.
Efforts to redress the imbalance in development in Nigeria are often constrained by
powerful socioeconomic and political forces inherent in our society. The powerful
forces facilitate concentration of development at some places and lack of development
in certain other places. It is within this perspective that one may talk of a growth center
as a function of combination of many factors such as available resources, spatial
characteristics of the area, government policies on location of development projects,
socio-economic and pluralistic of cultural characteristics of the people (Ogbuozobe,
1995).
Toyin and Adeniyi (2006) observed that economic growth and development do not
occur equally in the sectors of an economy and regions even though balanced growth is
highly desired in all countries. To redress the disparities in the level of development
over the territorial space of nations, attempts are often made to harmonize development
of richly endowed and less endowed regions through the adoption of specific
development policies most of which contain strong industrial development
components. It could be seen that the spatial spread of development in Nigeria is not
even. Some regions have developed while others are left underdeveloped.This study
will further enhance the understanding of spatial pattern of facilities and the factors
responsible for the observed patterns, and also, help in the effective distribution of
facilities.
14
CHAPTER TWO
CONCEPTUAL, THEORETICAL FRAMEWORK AND LITERATURE
REVIEW
2.1 CONCEPTUAL FRAMEWORK
2.1.1 Concept of Economic Development
Existing literature has so far shown that the concept of development is wide and multi-
dimensional, hence has been seen in different perspectives and given different
interpretations. When applied to the social sciences, the complex nature of human
societies makes the concept a complex one. Various authors such as; Wunsch and
Olowu (1990) stressed its economic, social and political dimensions to varying degrees,
and many paths to it are posited. Cutting across them however, and subsuming most of
the values they posit (economic abundance, social freedom, political capacity) is one
human reality. Development requires the production of complex economic, social and
political goods, one requiring complex and coordinated behavior by diverse people
across large area of time and space. Economists stress its economic aspect, sociologists
focus on its social aspects while political scientists emphasize its political aspects
(Wunsch and Olowu 1990).
2.1.2 Spatial inequality in Economic Development
Spatial inequality is a dimension of overall inequality, but it has added significance
when spatial and regional divisions align with political and ethnic tensions to
undermine social and political stability. Also important in the policy debate is a
perceived sense that increasing internal spatial inequality is related to greater openness
of economies and to globalization in general.
15
Why do spatial disparities arise in developing countries? The economic geographer‘s
distinction between first and second nature geography is helpful. First nature geography
simply says that some regions are favored by virtue of endowments of proximity to
rivers, coasts, ports, and borders. Evidently these factors account for some of the
success of coastal China relative to the interior, Coastal Lagos in Nigeria or Border
States of Mexico relative to the south. Second nature emphasizes the interactions
between economic agents, and in particular increasing returns that can be created by
dense agglomerations and interactions. Cities tend to have high productivity, and
agglomeration forces act to generate virtuous circles of self-reinforcing development
(Christiaensen, Demery and Paternostro, 2005). What determines the strength of these
forces? How do they depend on aspects of the economic environment such as openness
to trade, the stock of labor skills, the quality of infrastructure, and the policy
environment? Of course, once their nature is understood, changes in these forces can be
adduced as explanations for changing spatial disparities.
For Africa, the evidence on openness is more indirect. Te, Willen and Morrissey (2005)
find that in West Africa, foreign owned firms tend to locate in the capital city, pay
higher wages and employ more skilled workers, thereby exacerbating inequality vis a
vis rural areas. McCormick and Wahba (2003) find that in Egypt, there is a regional
bias in the location of firms and jobs created by returnees compared with non-migrants,
in favor of the capital city. There are two reasons why policy makers should be
concerned about spatial inequality, defined as inequality in economic and social
indicators of wellbeing across geographical units within a country. First, inequality
between a nation‘s regions is one component of overall national inequality across
individuals (the other component being of course inequality across individuals‘ within
16
each geographical unit or region). When spatial inequality goes up then, other things
being equal, so does national inequality. Second, inequality between a nation‘s regions
may be of concern in and of itself, especially when the geographical regions align with
political, ethnic, language or religion divisions.
The ―new economic geography‖ has emphasized that there are powerful forces of
agglomeration that tend to lead to a concentration of economic activity, magnifying
natural geographical advantages that a region may enjoy. Thus spatial agglomeration
brings the benefits of returns to scale, and hence helps efficiency and growth. At the
same time, openness to the outside world, which is well recognized as a long term
source of efficiency and growth, can also lead to spatial concentration. The evidence
presented in this work and other researches is clear. Spatial inequalities are high and
rising. Then, what should be the policy response, bearing in mind the tradeoffs
involved?
The theories of inequalities, evidence and causal analysis presented in some literatures
suggests a two pronged approach to addressing the problem of rising spatial
inequalities while still reaping the gains from agglomeration and international
openness. The first component of the strategy is to remove barriers to the
decocentration of economic activity. These can be political and institutional obstacles,
such as the need for firms to locate near political and administrative centers. It also
requires the development of economic and social infrastructure to facilitate
deconcentration, and to help interior and poorer regions benefit from integration into
the global economy. Such investments can also start growth poles in lagging regions -
new centers of activity can develop and reach a scale where they benefit from a
17
virtuous circle of agglomeration. The second component is to facilitate, or at least not
impede, the migration of individuals and households to areas of high and rising
wellbeing. This two sided approach stands the best chance of gaining the most from the
efficiencies of agglomeration and openness, without running into the potential
destabilization of rising spatial inequality. With this, equity in development may be
achieved.
Development has at various times been perceived as economic growth, modernization
and redistributive justice. In viewing development as economic growth, emphasis was
more on increasing economic growth than on distribution of the benefits. Though this
perception dominated development thinking for decades, its various limitations
necessitated its being abandoned. In perceiving development as modernization,
emphasis shifted to ―how to inculcate wealth-oriented behavior and value in
individuals. This, in a sense, represents a shift from commodity to a human approach.
Investment in education, or more broadly, in human resources, came to be seen as a
major and critical basis for social change (Hafiz, Muhammed, Ibrahim, Watirahyel and
Maiwada, 2016).
Recent thoughts place emphasis on human development as something distinct and
different from economic growth. In establishing priorities and strategies, this
distinction can be useful. There is abundant evidence to show that high rates of
economic growth do not necessarily lead to rapid improvements in living standards for
poorer sections of the population and that greater improvement in their living standards
can be achieved by strategies that do not focus exclusively on growth. This distinction
focuses on development priorities and the strategies, not on the essential nature of the
18
development process itself (Jacobs, Macfarlane and Asokan, 1997). In this approach,
development is seen not simple as raising per capita income but more importantly, as
reducing poverty level among the masses or, as it was picturesquely put, ―satisfying
their basic needs. Mabogunje (1980) emphasized that this development strategy paid
attention to disadvantaged target groups such as small peasant farmers, urban under-
employed and urban unemployed. This perception of development was upheld by the
United Nations Development Programme (UNDP), and is used in computing their table
of human Development report since 1990. Their report of 1990 is of the opinion that
human development involves improving people‘s chances of leading long healthy lives;
providing access to education, and making it possible for them to have a decent
standard of living (UNDP, 1996).
Various definitions point to the importance of human development in development
goals, that is perhaps why Ogunsanya (2002) saw development as a welfare
improvement, a better state of attainment goals with respect to who gets what, and
where. This state is characterized by ease of access to income earning opportunities and
modern social, economic and cultural facilities.One of the best attempts to-date at
defining a concept of development is that by Goulet who distinguishes three basic
components or core values, labeled as life-sustenance, self-esteem and freedom
(Todaro, 2000). Using Goulet‘s concept (1971) cited in Todaro (2000) of development,
therefore, it can be said that development has occurred when there has been an
improvement in basic needs, when economic progress has contributed to a greater sense
of self-esteem for the country and individual within it, and when material advancement
has expanded the range of choice for individuals. The fact that many of these
ingredients of development are not measurable does not detract from their importance
19
the condition of being developed is as much a state of mind as a physical condition
measurable by economic indices (Todaro 2000).
Jacobs et al (1997), after taking cognizance of existing concepts of development,
conclude that development is a function of society‘s capacity to organize human
energies and productive resource to respond to opportunities and challenges. They
observed that despite many decades of development experience, fundamental questions
about development remain unanswered. For instance, the world still lacks a
comprehensive theoretical framework that adequately explains such phenomenon as the
very high rates of development exhibited by East Asian countries for many years, the
failure of Malthusian projections. The growing contribution of non-material resources
not subject to depletion, the apparent failure of market policies in the transition of
Eastern Europe, and conflicting predictions about the future of work based on the
contrary recent experiences of North America and Western Europe. They proposed a
theory of social development and defined development as--an upward directional
movement of society from lesser to greater level of energy, efficiency, quality,
productivity, complexity, comprehension, creativity, enjoyment and accomplishment.
Jacobs etal also emphasized that development is a process and not a programme.
Development is not the result of a set of policies or programmes. It is the result of a
process by which society moves from lesser to greater levels of energy, quality,
productivity, complexity, comprehension, creativity, enjoyment and accomplishment.
The center-piece of the concept of development consists of improved living conditions
for the people in a defined geo-political area or economy (Uga and Aminu, 2000).
According to the World Bank (1991), economic development consists of a sustainable
20
increase in living standards that encompass material consumption, health care, and
environmental production. The improvement is a derivative of supplying increasingly
diverse economic goods to its population.
Since the primary focus of this thesis is to analyze the spatial inequality in
socioeconomic developmentdifferentials, emphasis is more on development theories
that exhibit spatial pattern. Theories like, economic base, growth pole, circular
cumulative causation theory, trickle down model and centre periphery. From the
foregoing definitions and explanations, it is clear that development is a social good,
which involves different processes of change in structures, entities, groups, units and
agencies. Hence, real development involves structural transformation of the economy,
society, poverty and culture of the people, permitting self-actualization of human
potentials. Development is therefore man-centered, which implies that the enhancement
of the quality of life of man (in all its ramifications) connotes development
(Onwumerobi, 1994).
Development is not evenly distributed; it takes place over time and space, and therefore
should have to do with equity considerations (Ogunsanya, 2002). Therefore, the
geography of the spatial aspect of development is basically concerned with the spatial
diffusion of innovations - the spread of new ideas, the adoption of new techniques and
the establishment of new forms of production, all of which involve changes in human
activity (Uga and Aminu, 2000). Spatial development is therefore a process concerned
with the locational aspects of development and involves the recognition of spatial
inequalities in socio-economic welfare, the process at work and the involving strategies
for modifying, changing or even reinforcing the observe pattern for purposes of more
21
equitable spread of welfare to the majority of the inhabitants of the region.(Olomola,
2003).
Development comes about through changes induced, framed and generated by
deliberate policies and through development agents. The result is that old forms and
ways of doing things are replaced as a result of contacts among societies and social
groups through various channels. For development to take place, a society must be
open to external influences and internal policy intervention and direction (Hanson and
Gordo, 2007). This means that the central and regional authorities, the political system,
the development policies and the development agents have great roles to play in the
development process.
Many studies at regional and global levels have been carried out on the different
aspects of development (Onwumerobi, 1994, Ogunsanya, 2002, and Ita et al, 2012). As
a result of these studies, many theories have been formulated with respect to the scope
and approaches to development. On the developing countries, a lot of broad conceptual
schemes have been formulated but they are originated and developed in the developed
countries where the social, economic, cultural and political settings are different from
what are obtained in developing countries (Recardo, 2004). The implication is that the
application of the theories and models in the developing countries may not be very
relevant and therefore may not be successful. As it were, many of these developing
countries apply these theories and models without thinking about the applicability to
their own situations. The result is that most, if not all of these theories and models fail
to solve the problems identified. The main reasons have to do with (i) The great
diversity in the circumstances of individual developing country (despite some common
22
characteristics) which make generalization very difficult and (ii) the experiences of the
developed countries would not be readily applicable to the developing countries with
often-dissimilar situations. Therefore, there is no ready-made theoretical practical
solution to the problems of the developing countries; each individual country has to
proffer the most suitable solutions to her quest for development (Mabogunje, 2007).
It can be remarked therefore, there is a wide range of views as to the meaning of the
term ‗development‘. For instance, while some view it from the perspective of increase
or growth in Gross Domestic Product (GDP) over a period of time (Olajuyin, 1980).
Others see development as a process of structural change in the economy, with
agriculture declining in importance while the industrial sector increases (Adedeji,
1989). Others, still, tend to stress the human aspect in development. For example, the
Guidelines to the fourth National Development Plan (FGN, 1980) states that ‗true
development must mean the development of man….‘
An extension of this view is that even development involves ‗creating opportunities for
everybody ….‘It is worth noting also that the close inter-relationship between
economic and social elements precludes any purely social or economic development,
but a single process called ‗development‘.Consequently, in this study on Kogi State,
development is conceived to mean improvement in the level of welfare or wellbeing of
the people. It is a welfare improvement …a better state of affairs with respect to who
gets what, where and how? This state is characterized by ease of access to income
earning opportunities and socioeconomic facilities.
23
2.2 THEORIES OF INEQUALITIES IN REGIONAL DEVELOPMENT
Regional development and planning emerged from the realization that there were
inequalities in the spatial distribution of wealth within nations and that the problems
posed by rural-urban migration and the existence of large metropolitan area needed to
be addressed (Ayeni, 2000). Spatial inequality is an important feature of many
developing countries that seems to increase with economic growth and development.
Spatial inequalities in income, health, education and poverty present significant
economic and political challenges for the governments of many developing counties.
This is because rapid economic growth is often associated with uneven regional and
urban development, it perhaps means that development is likely to exacerbate rather
than reduce spatial inequalities. Yet, despite these concerns, there seems to be little
consensus on the causes of spatial inequality and how to respond to growing spatial
inequalities.
From the standpoint of economic efficiency, spatial inequality may be beneficial or
harmful if spatial inequality results from regional specialization based on comparative
advantage or returns to scale in production, then spatial inequality may be beneficial as
productivity is increased. But if spatial inequality is caused by external economies that
are not internalized, then the level of inequality may not be optimal (Mabogunje, 2007).
In particular, spatial inequality in the form of the excessive concentration of urban
population in large primate cities may impose a variety of social ills in society. From
the standpoint of equity, spatial inequality may be socially undesirable if it contributes
to social inequality across regions. Moreover, spatial inequality may be socially
destabilizing if the regional divergence in economic welfare and political interests
contributes to general social instability.
24
In recent years, even though research on spatial inequality of developing countries
remains in a nascent stage, there has been an explosion of new research on the general
causes of spatial agglomeration both theoretical and empirical (Henderson and Thisse
2004). In theory, there have been significant advances in highlighting the
micro‐foundations of spatial agglomerations; in empirics, the advent of the computer
along with advances in empirical methods have greatly expanded the quality of
empirical evidence on agglomeration economies.
With this in mind, a basic knowledge of the developments in the theory of economic
geography may be needed to evaluate the merits of policies proposed by various
scholars. In economics, innovations in theory continue to dictate the course of scholarly
discourse. Empirical studies rarely have a decisive impact on policy or theory. While
issues concerning regional and urban inequality are usually addressed separately, but
there is a problem because their interdependent nature cannot be overemphasis, the
fields of regional and urban economics developed separately; the literature on spatial
inequality treats regional inequality and urban inequality as two separate phenomena.
The most important reason for this dichotomy is due to theory—namely, it is extremely
difficult to develop a unified theory of regions and cities in a satisfactory manner
(Fujita, Masahisa, Paul Krugman and Anthony 1999).
Only in the extreme case where cities are uniform in size and are uniformly distributed
across regions do we expect urban inequality to have limited impact on regional
inequality. In reality, city sizes and their geographic distribution are both very uneven,
to the extent that industrial revolution and urbanization go hand in hand, the rise of
North‐South regional core‐peripheries are likely to be intimately related to urban
25
development. The U.S. North‐South divergence in incomes and industrial structures
between the late nineteenth and the early twentieth centuries coincided with rapid urban
development in the North as compared to the South. Even at a more regional level, it is
impossible to imagine the rise of the city of Chicago as the mercantile center of the
Midwestern U.S. in the late nineteenth century without its access to a rich rural
hinterland (Cronon 1991). Conversely, for a given population, the extent of urban scale
economies is likely to influence the number of cities and their geographic distribution
across regions. In the United States, it is probably not a simple coincidence that urban
densities rose significantly when regional inequality rose but fell considerably when
regional inequality fell (Kim, 1995, 1998, 2007).
Studies vary greatly in terms of focus, but also in the researchers‘ methods of
measurement of spatial inequality, which often are not comparable. The problem is
most severe for studies of developing nations where scholars must resort to survey
rather than government census data. Taking into account the dynamic nature of spatial
inequality, researchers must be able to evaluate the impact of foreign trade on spatial
inequality and, perhaps most importantly, understand the role of political institutions on
spatial inequality.
From the perspective of theory, spatial inequality is fundamentally determined by the
location decisions of firms and households. Firms choose locations to maximize profits
whereas households do so to maximize job market outcomes and utility. While firms
and households generally care about the quality of both of their regional and urban
environments, there is no widely accepted general theory of spatial location that seems
to incorporate regional and urban location decisions in a unified manner (Fujita et al
26
1999; Fujita and Thisse, 2002; Berliant, 2007). Rather, the field of economic geography
is divided into two fields: regional and urban economics (Kim and Margo, 2004).
The traditional regional science models based on the central place theory possessed a
regional‐urban perspective, but these models have now been discredited as not having a
rigorous theoretical foundation. Instead, regional central place theory is not an
economic model based on optimization and the equilibrium behavior of firms and
households but rather a useful descriptive classification scheme. To reiterate the
importance of theory, international or interregional trade models usually do not address
cities because neoclassical models based on comparative advantage cannot be easily
adapted to incorporate city formation. Starret‘s theorem demonstrates that regional
specialization, cities and trade cannot be equilibrium outcomes under the standard
neoclassical assumptions (Fujita and Thisse 2002) models, to the extent that they exist,
and are largely based on models of international or interregional trade. While it is
impossible to imagine interregional (international) trade without the existence of cities,
a simple perusal of standard texts in international trade will reveal a complete absence
of discussion on cities. Conversely, urban models are devoid of regional location
decisions. In the classic Henderson (1974) model, cities are islands which differ only
by scale. The study of the size distribution of cities without references to their locations
forms an important research agenda for urban economists.
Since the various theories of economic geography provide different causal explanations
for spatial inequality and elicit different policy responses to combat inequality, it is
important to review them in some detail. In recent years, theoretical innovations in
modeling increasing returns have led to the formalization of many traditional concepts
27
such as Marshallian externalities (technological spillovers, labor market pooling, access
to non-traded intermediate inputs) and non-pecuniary externalities (forward and
backward linkages and market size), which in turn has clarified the forces of spatial
agglomeration and dispersion.
In general, spatial inequality is the net result of the balance of forces of concentration
and dispersion. From the regional perspective, the centripetal forces of geographic
concentration are natural advantages, Marshallian externalities, and non-pecuniary
externalities, whereas the centrifugal forces of dispersion are immobility in factors and
goods caused by high transportation and communications costs. From an urban
perspective, the most important difference is the addition of new costs of concentration
in the form of congestion costs that result from the fixed supply of land. Concentration
leads to increased housing and commuting costs as well as costs caused by greater
crime, pollution, and exposure to disease.
Considering the impact of globalization and trade on spatial inequality, the influence of
institutions on spatial inequality, and the relationship between household inequality and
spatial inequality cannot be overemphasized. First, globalization is a major force in
world development today. While the forces that determine the location of firms and
households caused by foreign and domestic trade are identical, citizens rarely view the
economic impact of foreign and domestic trade in similar ways. Second, regional
differences in institutions may affect regional inequality. Furthermore, the distribution
of political and fiscal power between the federal, state, and local governments is likely
to impact urban inequality.
28
Third, household income inequality is a big concern because it is important to
understand whether spatial inequality contributes to household income inequality. In
regional economics, there are two classes of models that possess very different policy
implications for dealing with regional inequality. In one class of models based on the
standard neoclassical assumptions of constant returns to scale and perfect competition,
the role of government involvement is relatively limited to infrastructural investments
that affect the mobility of goods, labor, and other factors. Governments may have little
ability to influence centripetal forces that are based on comparative advantage
stemming from technology or resources, but it may increase regional specialization or
inequality by lowering the mobility of goods or may decrease inequality by lowering
the mobility of factors.
The potential role for government intervention is significantly higher in the so‐called
―new models of economic geography‖ based on imperfect competition and increasing
returns. First, due to the potential for ―cumulative causation‖ forces, small subsidies
can potentially have significant first‐order effects. Second, infrastructural investments
that increase the mobility of goods, labor, and capital may have significant impact on
spatial inequality due to the self‐enforcing nature of increasing returns. Third, since the
equilibrium market allocations are inefficient in these models, markets will not reach
the optimal level of spatial inequality without government intervention.
When the sources of increasing returns are forward and backward linkages rather than
market size and internal scale economies in production, then it is possible to derive an
inverted U‐pattern of geographic concentration where regional inequality first rises and
then falls. Forward linkages exist when increased production by upstream firms
29
provides positive pecuniary externalities to downstream firms. Backward linkages exist
when increased production by downstream firms provides positive pecuniary
externalities to upstream firms. When labour is immobile, an initial fall in the
transportation costs of final goods leads to geographic concentration and regional
inequality, but when transportation costs fall further, then regional inequality declines
and the location of manufacturing firms becomes more dispersed. Thus, at least in
principle, a policy that significantly lowers the transportation costs of final goods may
under certain conditions lead to a long‐run reduction in regional inequality.
2.2.1 Economic Base Theory
This theory is an offshoot of the economic base of urban economists. It stresses the
importance of resource exploitation, usually minerals, in the development of a region.
Export of these resources and other services to other regions of the economy and
beyond brings capital into the region concerned which generates multiplier effects
(Olaniyan, 2009). The regional export base model was put forward by North (1955)
quoted in Olaniyan (2009) and is perhaps, one of the most detailed treatments of such
models. North (1955) viewed regional development as being tied to the development of
an export base through its multiplier effects.
The development may take place either as a result of the improved position of existing
exports relative to competing area or as a result of development of new exports (North,
1955 quoted in Olaniyan 2009). North believed that the development of new exports is
fostered through the development of transportation, growth of income, demand,
technical innovations and the provision of public overhead capital. The growths of
export-based and service industries are reinforced by the inflow of capital from outside,
usually from more developed regions (Adefolalu 1991). This eventually makes regional
30
production to be diversified, thereby creating more staples and reducing the relative
importance of the initial investment. Long-run factor mobility among regions, more
equalization of capital income and wider dispersion of production can be expected.
McNeil (1993) cited in Todaro (2000) has shed further light on determinants of
regional growth. According to the author, the potential volume of regional output is
directly related to the resource inputs within the region. These inputs are capital,
labour, transportation, technical knowledge and the social system. The researcher
argued that the actual realization of regional output would depend on both regional
aggregate demand and external demand for the region‘s goods and services.
It is generally agreed that the works represent a most comprehensive treatment of the
process of regional growth. It should be noted, however, that the emphasis of the
research is on economic growth rather than development. Gana, 1978 (cited in Todaro
2000), observed that development does not appear everywhere at once but it becomes
manifest at points or poles of growth with variable intensity‖. The author capped it as
“suffering from an obvious neglect of growth strategies”. Economic based theory help
in emphasizing the importance of economic activities in regional growth. It could thus
be useful in accounting for observed spatial inequalities in development. The theory
could, however, not be of much application in the present research (Kogi State) because
of paucity of relevant data on economic activities such as industrial output, profits level
among other variables in the study area.
2.2.2 Circular Cumulative Causation Theory
Scholars in this school of thought believe that it is very rare to find economic
development occurring evenly throughout a given State unit: that what is always
31
observable is the concentration of development at certain points, regions or urban
centres, thereby creating a series of areas of unequal economic prosperity. As originally
postulated by Myrdal (1976), the theory state that; ―economic progress and change do
not call for countervailing changes, but supports changes which move the system in the
same direction further than before‖. Applying this concept to regional development,
Myrdal concludes that the free play of market forces increased inequality between
regions. That is, once particular regions have move ahead of others in development,
new increment of activities and growth will tend to be concentrated in the already
expanding regions because of their derived comparative advantages.
A comparative advantage contains multiple equilibria, a slight perturbation caused by
an industrial subsidy to an industry in a given region which may increase spatial
inequality dramatically. Even if two regions are initially identical, a slight advantage
given to one region through tax subsidies may trigger a sharp rise in spatial inequality
between these regions. Because increasing returns create a momentum of their own,
cumulative causation will lead to the rise of core‐periphery regions (Krugman 1991a &
b).Krugman‘s (1991b) explained with two regions and two goods (agricultural and
manufacturing). According to Krugman, agricultural good is homogenous and is
produced using labour and land under constant returns to scale in a perfectly
competitive market; land is immobile; agricultural goods are freely mobile; consumers
have Spence‐Dixit‐Stiglitz preferences for varieties; and goods are produced with scale
economies but they can be used both as a final consumption good or as an intermediate
good for use in the same industry as in Ethier (1982). This latter specification captures
the idea of forward and backward linkages in the sense of Hirschman (1958). Puga,
Diego and Anthony (1999), ―At high trade costs, firms want to be where final demand
32
is, so they split between regions. At intermediate levels of trade costs, firms cluster to
exploit cost and demand linkages. However, without interregional labour mobility,
agglomeration opens wage differences. At low levels of trade costs, firms want to be
where immobile factors are cheaper, so they spread across regions again.‖ Small
subsidies can potentially have significant first‐order effects.
Second, infrastructural investments that increase the mobility of goods, labor, and
capital may have significant impact on spatial inequality due to the self‐enforcing
nature of increasing returns. Third, since the equilibrium market allocations are
inefficient, markets will not reach the optimal level of spatial inequality without
government intervention. When the sources of increasing returns are forward and
backward linkages rather than market size and internal scale economies in production,
then it is possible to derive an inverted U‐pattern of geographic concentration where
regional inequality first rises and then falls. Forward linkages exist when increased
production by upstream firms provides positive pecuniary externalities to downstream
firms.
Backward linkages exist when increased production by downstream firms provides
positive pecuniary externalities to upstream firms. When labor is immobile, an initial
fall in the transportation costs of final goods leads to geographic concentration and
regional inequality, but when transportation costs fall further, then regional inequality
declines and the location of manufacturing firms becomes more dispersed. Thus, at
least in principle, a policy that significantly lowers the transportation costs of final
goods may under certain conditions lead to a long‐run reduction in regional inequality.
33
Many other writers have also explained the mechanics of the cumulative growth that
follows initial investment (growth) in an area or centre to include expansion resulting
from successive rounds of subsequent investment in various sectors of the economy,
the resulting multiple effects and (forward and backward) linkage and the concomitant
intensification to the required threshold of both scale and agglomeration economies to
generate significant levels of external economies.
Todaro and Smith (2011) rightly remarked that the concept of cumulative causation is
not the only important feature of Myrdal‘s model. Myrdal pointed out that closely
connected with the concept of cumulative causation, is the process of interaction
between the growth and the stagnant regions. The researcher identifies the operation of
two forces in the process of regional interaction. These are the backwash effects‘ and
the ―spread effect‖ Regions where economic activity is expanding generate backwash
effects in the stagnant region by interacting with the flow of capital (locally generated),
people (skilled labour and the more enterprising young men), and raw materials from
these stagnant regions. These flows, by themselves, are the media through which the
cumulative process evolves upwards in the expanding regions and downward in the
stagnant ones. The author asserts that the provision of low quality infrastructure or the
neglect of the backwash areas in term of roads, health and education further frustrate
development in these areas.
Against the backwash effects, Myrdal says, are certain centrifugal ‗spread effects‘ of
expansionary momentum from the regions of economic expansion to the stagnant
regions. The spread effects are benefits arising from the increasing outlet of agricultural
and other products of the lagging region to the growth regions, especially if they
34
stimulate technical advance in the lagging regions. He concludes that if the impact of
‗spread‘ is greater than that of the ‗backwash‘, the process of cumulative causation may
well begin in another area leading to the development of new centres of self-sustained
economic development.
2.2.3 Trickle Down Model
Hirschman (1958) cited in Todaro and Smith (2011) formulated a model almost
identical to Myrdal‘s using the term ‗polarization‘ and ‗trickling down‘ for Myrdal‘s
‗backwash‘ and ‗spread‘ respectively. Empirical study on spread and backwash effects
in developing countries confirmed that the backwash effects are more pronounced, and
spread effects are often confined to the immediate vicinity of the growth centre, from
where the forms is that of a distance decay pattern of development change.
Willis (2007) observed that the Hirschman approach relied on income re-distribution
and welfare policies to stimulate demand in the less favoured regions as well as offer of
direct and indirect incentives from state aids and infrastructural improvements to
individual firms to locate to such regions. In essence, the Hirschman form of
development was meant to lead to a process of trickle down to the poorest people in
society, development benefits were meant to spread to different regions. The
implication of this theory is that economic development should be allowed to reach
individuals in the society in terms of employment opportunities, increased income and
improved quality of life which will reduce spatial inequalities among regions (Owen
1987).
2.2.4 Core - Periphery Theory
This theory is otherwise known as theory of polarized development. Although it was
initiated by scholars such as Meier and Baldwin (1963) cited in Friedmann (1972a), it
35
was brought into the limelight by Friedmann (1966, 1967, and 1972b). Writing jointly
with Alonso, Friedmann (1964) defines the terms of the core-periphery concept as
follows: For a variety of reasons, activities come to be concentrated in one or a few
centres. These centres according to the writer not only grow so rapidly as to create
problems of an entirely new order, but they also act as suction pumps, pulling in the
more dynamic elements from the more static regions. The author concluded that the
reminder of the country is thus relegated to a second-class, peripheral position. This
section is thus placed in a quasi-colonial relationship to the centre, experiencing net out
flows of people, capital and resources, most of which rebound to the advantage of the
centre where economic growth will tend to be rapid, sustained and cumulative. As a
result, income differences between centre and periphery tend to widen.
Friedmann (1972a) reformulated this theory in a rethinking after his Venezuelan
experience (Friedmann, 1966.) The redefinition set the major areas of innovation
changes as the ‗centre‘ and other areas within a given spatial system as the ‗periphery‘.
Like Hirschman, Friedman also agrees that, because unrestrained forces of a dynamic
market economy appear to be working against a reduction of the contrast between the
centre and the periphery, government intervention along the line of deliberate planning
is required to promote the development of peripheral economies. To the credit of
Friedmann‘s core-periphery model, it is applicable in economics, geography, political
science and sociology. That notwithstanding, the focus has spatial dimension. It is
indeed unlike the equilibrium model, which soothes policy – makers by assuring them
that the unhindered operation of market forces will inevitably tend to establish a spatial
equilibrium (Friedmann, 1972 b).
36
The model has been criticized on three major grounds: First, it is of a general and not
precise in nature but having specific ideas that incorporate the growth pole concept.
Second, Friedmann did not explain why some matrices become administrative centres:
and thirdly that eventually, industrial investment is concentrated within these regions.
The greatest asset of the model is Friedmann‘s assumption that once development
begins, core or urban areas of dominant importance in the growth process will establish
a spatial equilibrium.
In line with the thinking of this concept, many administrations in Nigeria have engaged
in deliberate intervention in regional development, especially with the aim of boosting
development in the peripheral areas (Umebah and Ebue 2001). One of the key
strategies adopted in the nation is to bridge the widening disparities in the level of
development between the rural and the urban areas. Hence, the theory is very much
relevant to this present study. The growth centre concept (Boudeville, 1966) and the
centre-periphery model (Friedmann, 1966, 1967 and 1972 a and b) envisage that
development impulses would spread from the centre (core areas) to the surrounding
area (periphery). In this case urban centres are core while rural areas are peripheral
areas.
It will also be of importance as shown in Puga and Anthony (1999), to see how the
extent of regional inequality may be limited by the manufacturing firms and the
agricultural sector. The ability to recruit workers from the agricultural sector to the
industrial sector brings about inequality. Thus, the potential for agglomeration depends
critically upon the labor mobility of workers between the two sectors. Regional
inequality generally arises as an economy shifts from agriculture to manufacturing, but
37
the degree of shift may depend on the rapidity by which consumers increase their
expenditure shares in manufacturing.The policy implication of this theory is that
governments in Nigeria have been engaging in deliberate intervention through
meaningful regional planning in order to reduce to barest minimum the adverse effects
of centre-down approach. Emphasis has been shifted to bottom-up approach in which
local people can participate in decision making process on matters affecting their
condition of living (Olaniyan 2009). In addition, there are rural development strategies
such as creation of more States and local government areas, Integrated Rural
Development, Community Development programmes, Mass Mobilization, River Basin
and Rural Development Authority and Agricultural Development programmes with a
bid to narrowing the gap between the centre urban and peripheral areas (rural
communities).
Having gone through some theories underlining spatial inequalities in economic growth
and development, it is therefore imperative to carry out a scientific research of this
nature in order to understand the spatial inequalities in socioeconomic development and
the processes that accounted for the pattern of development in Kogi State.
2.3 LITERATURE REVIEW
2.3.1 Evidence of Regional Spatial Inequality
Studies on regional inequality are somewhat challenging to summarize because they
differ on many dimensions such as indices of geographic concentration, geographic
units of observation, as well as theoretical motivation and empirical specification. In
addition, given the difficulty of constructing regional inequality measures that are
comparable across many nations, there is no international cross‐sectional or panel
analysis as in the urban inequality literature or as in the household income literature. As
38
a result, the literature on regional inequality is dominated by country‐specific studies.
Nevertheless, the review of the various nations in developed and developing nations
may facilitate comparisons.
Due to the scarcity of reliable census data, the evidence for developing nations is often
based on survey data and projected population figures (Asolo, 2000). Perhaps due to
poor data quality or greater variance in the economic circumstances of developing
nations, the evidence on spatial inequality is more varied. For developed nations, even
though there are important variations in the level of spatial inequality, the industrial
patterns of spatial localization are fairly similar across many countries.
Hafiz, Muhammed, Ibrahim, Watirahyel and Maiwada (2016) investigated the spatial
pattern of the distribution of government secondary schools in Giwa zone of Kaduna
State in northwestern Nigeria. The analyses were done in a Geographic Information
System (GIS) environment. Data used for the study were gathered from both secondary
and primary sources. The primary data was obtained using Germain GPS to take the
coordinates (longitudes and latitude) of the schools. The coordinates of the schools
were recorded in Excel and the Excel file was imported into GIS environment as point
data. The point data were overlaid on the shape files of the areas to show the
distribution of the schools. A 3km buffer was created around each school to analyze
accessibility and patronage pattern of the schools. The study found out that the pattern
of the distribution of the schools was found to be uneven in all the three LGAs. It was
found that about 80% of the secondary schools are concentrated in the northeastern part
of the area covering the headquarters of the LGAs. It also discovered that the
southwestern area of the study area were grossly underserved with very few or no
39
schools. The study therefore recommends that more schools should be provided in the
areas that are lacking.
Tari and Iteimowei (2017) examined the source of income inequality in Kogi State
using data from Egwemi (2016) research survey. The study covered 240 households
administered with questionnaire in Egwemi (2016), information on their socioeconomic
characteristics and income. The income components used were wages and salaries,
trade and agriculture. The aggregate gini was decomposed based on the income
sources. Income from agricultural sources contributed 75.70 percent to inequality,
income from wages and salaries, and trade contributed 14.30 and 10.00 percent,
respectively. The overall gini index 0.29 showed minimal inequality, further findings
revealed that inequality increases with income from agriculture but reduces with
incomes from wages and salaries, and trade. The study therefore recommend that
efforts should be made to reduce income inequality in Kogi State by promoting on the
job-training, providing free education and business friendly environment to encourage
small and medium scale businesses and entrepreneurs.
Habibu, Russayani and Roslan (2014) measured the educational inequalities between
Northern and Southern regions of Nigeria and compared it with the educational
distribution within regions. The study made use of micro data drawn from the Living
Standard Measurement Survey (LSM) of 2010 on Nigerians. The survey provides rich
data on households‘ economic and demographic characteristics including educational
attainment of about five thousand households across the country. The Theil Index and
Decomposition Analysis was employed analyze the data and the result showed that,
educational inequality is higher in the North than in the South as 17 out of 19 states of
40
northern Nigeria have higher Theil index than the national Theil index. Educational
attainment and inequality are found to have a negative relationship. The result also
indicates that states with higher educational attainment are more likely to achieve more
equitable distribution of education. The research recommends the redistribution of
educational facilities.
Bernardin (2012) examined the nature and extent of gender and spatial inequalities in
educational attainment in Ghana using Gini Coefficient computed on the basis of years
of schooling of individual. The research found evidence of gender and spatial
inequality in education in Ghana. The three northern regions have lower education
attainment as well as higher education Gini coefficients compared to the rest of the
country. There appear to be inequality in education attainment with females
contributing proportionately more to the within-inequality component of the education
Gini. The research reveals a positive correlation between poverty incidence and
education inequality. The research recommended a greater equity in educational
opportunities across the country.
Akin-Olagunju and Omonona (2014) studied income inequality and poverty in Ibadan,
Oyo State. One hundred and twenty households from rural Ibadan were sampled using
a multistage sampling technique. The study used descriptive statistics in analyzing
socioeconomic variables and Gini coefficient decomposed based on income source
used to analyze the contribution of each income source to overall income inequality.
The result showed that agriculture contributed about 42% to overall income inequality;
non-farm self-employment (NFSE) contributed about 23% while non-farm wage
41
employment (NFWE) contributed 36%. The result also showed that agriculture and
NFSE were inequality-increasing.
The study by Oyekale, Adeoti and Oyekale, (2006) decomposes the sources of
inequality and poverty in Nigeria, using household survey data obtained from the
National Bureau of statistics (NBS). The results of their study revealed that in 2004,
income inequality was higher in rural areas than urban areas. It was also revealed that
employment income increases income inequality while agricultural income reduces
income inequality. Inequality between States, rural-urban areas, and geographical zones
were said to account for the greater portion of observed inequality.
2.3.2 Regional Inequality in Developing Countries
The most striking pattern that emerges from the data on the spatial inequality of
developing countries is its varied nature (Gana, 1992). Thus, nation‐specific geographic
and political factors may play a disproportionately larger role in shaping the patterns of
spatial inequality in developing as compared to developed nations. These variations in
the patterns of inequality of developing nations present significant challenges in
identifying the causes of spatial inequality. The World Institute for Development
Economics Research Project of the United Nations University titled ―Spatial Disparities
in Human Development,‖ directed by Ravi Kanbur and Anthony Venables, presents
evidence on the extent of spatial inequality for over 50 developing countries. While the
nature of evidence varies considerably across different countries, they argue that spatial
inequality has been increasing for many developing countries in recent years.
For many nations, there is evidence that inequality within regions is as significant as
inequality across regions. In the East European nations of the Czech Republic,
42
Hungary, Poland, and Russia, evidence suggests that regional inequalities rose in the
1990s and that regional inequality was the highest in Russia and lowest in Poland
(Forster, Michael, David and Timothy, 2005). The data also suggest that the vast
majority of the inequality was caused by intraregional rather than interregional
variation in these countries.
In Ecuador, Madagascar, and Mozambique, within‐community or intraregional
inequality was just as important as between‐community or interregional inequality. In
all these countries, Elbers, Chris, Peter Johan, Berk and Kenneth (2005) found that
there are considerable variations in inequality across communities and that geographic
location is a good predictor of local‐level inequality even after controlling for some
basic demographic and economic characteristics.
In some countries such as Brazil, regional spatial inequality was significant but
declined between 1981 and 1997 (Azzoni, Carlos, Naercio and Taitane, 2005), but in
other countries, regional inequality was stable at relatively low levels. In Peru, regional
inequality measured using expenditure and literacy was low and remained relatively
low between 1972–93 (Escobal and Torero, 2005). In the Philippines, regional spatial
inequality seems to have declined in recent years between 1985–2000 (Balisacan and
Fuwa, 2006), as it has also done in Indonesia between 1984–1999 (Friedman, 2005)
and in South Africa between 1990 and 2000 (Naude and Krugell, 2003).
2.3.3 Regional Inequality in Developed Countries
For developed countries, the evidence on regional spatial inequality is much more
robust and consistent across countries. Despite important variations, the main source of
spatial inequality in developed nations seems to be driven by geographic differences in
43
industrial concentration. Since some industries such as textiles are much more
geographically concentrated than industries such as food or electrical machinery,
spatial inequality is caused by the spatial variations in concentrated industries. In
general, other industries such as agricultural and mining tend to contribute to spatial
inequality as natural resources are distributed unequally, whereas most services,
especially those that serve local markets, tend to reduce spatial inequality.
For the United States, there is considerable evidence for a long‐run inverted U‐pattern
of regional inequality, especially in the manufacturing sector. Kim (1995) finds that
U.S. regions became more specialized or unequal between the mid‐nineteenth and the
turn of the twentieth centuries and then became significantly de-specialized in the
second half of the twentieth century. Similar results are obtained from industrial
localization patterns over time. Based on the locational Gini coefficient at the 2‐digit
and 3‐digit industries, Kim (1995) finds that manufacturing industries became more
localized between 1890 and the turn of the twentieth century, but then became
significantly more dispersed over the second half of the twentieth century. At any given
point in time, the traditional, low‐tech industries such as textiles, apparel, and tobacco
were much more localized than the medium‐ to high‐tech industries such as electricity,
transportation, and so forth. Consequently, the gradual shift in manufacturing from
low‐tech to high‐tech industries contributed to the general dispersal of manufacturing
over time.
Wu and Gopinath (2008) examined the causes of spatial inequality of economic
development in the United States using multistage sampling technique and descriptive
statistics in analyzing the data. The study found out that infrastructure, is the primary
44
cause of the differences in income, employment and development density between the
top and the bottom.
For the United Kingdom, Duranton and Overman (2005) show that if a distance‐based
measure is used to measure localization as compared to the Ellison‐Glaeser index,
industries in the United Kingdom are much less localized. If they use the
Ellison‐Glaeser index, they find that 94 percent of UK industries are localized;
however, if the distance measure is used, they find that only a bare majority or 51
percent of industries in the United Kingdom are localized whereas 26 percent are
dispersed.
For Spain, Tirado et al. (2002) found that the geographic concentration of industries
rose remarkably during the industrial period between 1856 and 1893, causing a sharp
rise in regional inequality. The UK industry localization patterns at the 4‐digit industry
level seem to differ slightly from that of the United States; Duranton and Overman
(2005) found that textiles, publishing, instruments, and appliances were most localized
whereas food and drink, wood, petroleum, and minerals are dispersed. From a longer
perspective, Crafts and Mulatu (2006) found that industry localization and regional
specialization in the United Kingdom remained relatively stable over a surprisingly
long period between 1841 and 1911.
For France, Maurel and Sédillot (1999) used a slight variation of the Ellison‐Glaeser
index to investigate the geographic concentration in 1993. They found that 27 percent
of the French industries at the 4‐digit industry level were much localized, 23 percent
moderately localized, and that about half of the industries displayed a low degree of
45
concentration. The most localized industries were extractive industries such as iron ore
and coal, shipbuilding, traditional industries such as leather and textiles, and printing
and publishing. Least localized industries were motor vehicles, sound recording and
reproducing apparatus, farm machinery, electronic components, rubber products, metal
work for construction, and nonferrous metals. Surprisingly, they found that the
correlation between the U.S. and French industry localization was 0.60; the main
outliers were furniture and transportation, which were significantly more localized in
the U.S. and printing and publishing, which were more localized in France.
For Europe as a whole, Midelfart, Overman, Redding and Venables (2000) provided a
useful summary of the patterns of regional inequality and industry localization for the
period between 1970 and 1995. When compared to the United States, European
regional specialization or inequality is smaller and European industries are generally
more dispersed. Yet surprisingly, European regional inequality in income per capita is
higher than that of the United States (Puga and Anthony, 2002).
The trends in European regional industrial inequality seem to differ from those in
regional income inequality as well. For most European countries, the industrial
structure converged during the 1970s, reversed the trend in the early 1980s, and then
diverged significantly toward the 1990s. On the other hand, European regional income
per capita converged between 1950 and 1980 and then stopped converging between
1980 and 1995. When the regional incomes were decomposed in greater detail between
1980 and 1995, however, evidence shows that regional inequalities widened
significantly but that this divergence was counter‐balanced by a substantial
convergence in inequalities between countries (Puga and Anthony, 2002).
46
Midelfart‐Knarvik et al (2000) found that many industries experienced significant
changes in their location between 1970 and 1995. Many slow‐growing, labor‐intensive
industries were initially dispersed but became more concentrated over time in
peripheral low‐wage regions (Alonso-villar, 2010). Whereas about half of the
geographically concentrated industries remained concentrated over time, many
medium‐to high‐tech industries in high‐growth sectors became more dispersed across
Europe. Like in the United States, services were generally more dispersed so that the
shift from manufacturing to services contributed to the general decrease in regional
inequality in Europe.
2.3.4 Evidence of Urban Spatial Inequality
One of the most basic measures of urban inequality is the urban‐rural wage gap.
Because urban wages are typically higher than rural wages, urbanization introduces
spatial inequality in wages and incomes between cities and rural areas as well as cities
of different sizes. Rosenthal and Strange (2004), summarizing the evidences from
numerous studies that estimated the level of urbanization economies, reported that
productivity increased approximately between 3 to 8 percent as a city‘s size doubles.
Similarly, Glaeser and Maré (2001) found that U.S. workers in cities earn 33 percent
more than those in rural areas. The urban wage premium is also found by Wheeler
(2004) and Kim (2006) among others. Given these findings, the recent urban
experience in Africa presents a significant puzzle. Since cities are associated with
higher wages and productivity, urbanization is usually correlated with income growth.
For example, Henderson (2002) found out, that 70 percent of the cross‐country
variation in urbanization is explained by variations in GDP per capita.
47
However, between 1970 and 1995, Africa‘s GDP per capita fell by 0.66 percent per
year but its urban population grew by 5.3 percent per year (Fay and Opal, 2000). Thus,
Africa‘s urbanization may have been caused by ―pathological‖ noneconomic factors
such as war, ethnic conflict, or bright lights, rather than by urban agglomeration
economies and higher productivity.
Fay and Opal (2000) argued that Africa‘s level of urbanization is not altogether
different from countries with similar levels of income and economic structure. Rather,
because Africa was under‐urbanized during the colonial period, they suggested that the
recent surge in urbanization without growth may be accounted for by a catching‐up
hypothesis. Kessides (2005) also argued that urbanization in Africa is not excessive or
imbalanced, but that the sub-Saharan Africa‘s urbanization, as well as urbanization in
South Asia, Middle East, North Africa, Latin America, and the Caribbean seems only
weakly correlated with industrialization. Rather, urbanization in these regions seems to
be fueled by the growth in the informal service sector.
However, Barrios, Salvador, Luisito and Eric, (2006) finds that the rural migrants to
cities were not pulled by these jobs but rather were pushed out of their rural locations.
Climatic change, namely the lack of rain, significantly dampened agricultural
productivity in rural sub-Saharan Africa and pushed farmers into cities. In addition,
McCormick and Wahba (2003) found that international migrants who return back home
brings greater savings into Egypt‘s urban areas as compared to rural areas further widen
spatial inequalities.
48
The distribution of city sizes by population provides another important alternative
measure for urban spatial inequality. Urban inequality is greater when the urban
population is concentrated in few of the largest cities but is much lower if the
population is evenly distributed across cities large and small. While the estimates are
often sensitive to the definition of a city, Rosen and Resnick (1980) found that a large
majority of countries possess city‐size distribution that favors smaller cities. Thus,
urban inequality seems moderate for a majority of nations. However, there seems to be
some evidence that urban inequality is greater in developing countries. Soo (2005)
found out that, size distribution is significantly skewed toward larger cities in Kenya,
Morocco, Mozambique, Columbia, Ecuador, Guatemala, Jordan, Malaysia, Saudi
Arabia, and the Republic of Korea but toward the smaller cities in most of the
developed nations such as Canada, Belgium, Denmark, the United Kingdom, and the
United States.
2.3.5 Evidence of Spatial Inequality in Nigeria
The provision of infrastructural facilities for socioeconomic development in Nigeria
varies between one region and another (Habibu, Russayani and Roslan 2014). The
provision and spatial distribution of these facilities have been of vital importance in
both developed and developing countries. The need to provide facilities is for the
purpose of promoting and sustaining growth and development, there is no doubt that
equitable and adequate distribution of infrastructure within regions will trigger regional
transformation, enhance socio-economic development, and improve the quality of life.
However, available literature indicated that a great proportion of the population still
remained deprived (Olayiwola and Adeleke 2005). Several authors have documented
the nature of the distribution of infrastructures in rural areas of the country. For
49
example, Oyekale, Adeoti and Oyekale (2006) reported that the rural areas which
harbor about 70% of the Nigerian population is evidently deplorable because they lack
the basic infrastructural facilities required for meeting the needs of the modern man.
Similarly, Adefila (2008) reported that in most rural areas in Nigeria, basic
infrastructures where they exist at all are inadequate for any meaningful development.
According to the researcher, physical infrastructures like motor able roads are often
lacking, while many pastoralists and their livestock (in many rural areas) depend on
shallow wells and guinea worm-infested ponds for their water supply. In the same vein,
Ebehikhalu (2004) documented that in the rural areas of Nigeria, electricity, potable
water supply, improved medical facilities which are generally concentrated in the urban
centres are just illusive. Thus, the people living in the rural areas lack the necessary
attributes and means, which could have been used as catalyst for rural transformation
and development (Oyekale, Adeoti and Oyekale 2006).
In recognition of the importance of spatial distribution of infrastructural facilities in the
socio-economic development, therefore, various efforts have been made over the years
by various governments; non-governmental organizations (NGO) private sector‘s
including local communities to develop strategies and policies to spread these services
to all segments of human settlements (Jolayemi, 1992). These efforts according to
Afolayan (2008) which are yet to achieve the desired results are manifested in the
various successive development and rolling plans in Nigeria.
During the colonial period, the development and provision of infrastructural facilities
began with promulgation of 1917 ordinance (Babangida, 1986). This ordinance
50
classified settlements in the country into three classes: namely, the first, the second and
the third class township. The first class township was occupied by the Europeans and
their workers. There was therefore heavy concentration of infrastructure in these
settlements e.g. Lagos, Calabar, Jos, Enugu, and Benin (Ebehikhalu, 2004; Olayiwola
and Adeleye, 2005). The first class township differs from second and third class
Township which had little or no facilities; the situation continued until 1952 when local
government councils were established (Afolayan 2005). The councils were seen as
avenues through which infrastructural facilities in the council‘s headquarters could
spread to other areas under the jurisdiction of each council. This was the situation of
infrastructural distribution in the pre independence era.
Since independence, Nigeria has embarked on series of National Development plans
and visions in her endless efforts to search for appropriate development strategy. But
these development plans and visions seem to have failed to achieve their expected
objectives (Alapiki 2009). This is evident from widespread poverty, dilapidated
infrastructure, massive unemployment, high incidence of diseases and excessive debt
burden among others (Iheanacho, 2012).
Successive governments in Nigeria have adopted development plans as appropriate
strategy to address development challenges in the country Asolo (2000). Tordoff
(1993) observes that there is a general consensus that the instrument of both diagnosis
and remedy to development is the ―development plan‖ In the same vein Adedeji (1989)
opines that the economic aspirations of Nigeria since independence are perhaps best
exemplified by her various development plans. Since the past four decades, Nigeria has
embarked on series of development plans to fasten the rate of economic growth and
51
improve the standard of living of the people. It is noteworthy that Nigeria has gone
through four national development plans in her post-independence history, (the fifth
National Development Plan did not materialize) (Iheanacho 2012).
These plans are: First National Development Plan (1962), the Second National
Development Plan (1970-74), Third National Development Plan (1975-80), and Fourth
National Development Plan 1981-85. Apart from the five year National Development
Plans, the Federal Government also embarked on three year rolling plans between 1990
and 1998 and long term perspective planning in her endless efforts to search for
appropriate developmental strategy. The federal government introduced another
ambitious programme between 2003 and 2007 known as the National Economic
Empowerment and Development Strategy (NEEDS). It was a medium term planning
which focused on wealth creation, employment generation, poverty reduction and value
orientation. Vision 20:2020 was also launched as part of the endless search for
developmental strategy aimed at making Nigeria a fully developed economy. Though
development planning has been a consistent phenomenon in Nigeria‘s administrative
system, the plans have not been able to achieve the expected results. This is evident
from widespread poverty, dilapidated infrastructural facilities, massive unemployment,
low capacity utilization, technological backwardness, short-life expectancy, urban
congestion, excessive debt burden, environmental degradation and high incidence of
diseases which beset the country.
It is obvious that Nigeria is an underdeveloped country and occupies very low position
among the poorest countries of the world in spite of her huge potential in natural and
human resources. In the opinion of Obikeze and Obi (2004) ―a review of the various
52
plans clearly shows that the country is still very far from where it was envisaged it will
be today as at 2017. This is simply as a result of either faulty implementation of the
plan, distortions or even non-implementation‖.
Development planning can be better comprehended by explaining the concepts of
development and planning separately. Development is ―a multi-dimensional process
involving changes in structures, attitudes and institutions as well as the acceleration of
economic growth, the reduction of inequality and eradication of absolute poverty
(Todaro, 1977). Development is a process of societal transformation from a traditional
to a modern society and such transformation is also known as modernization (Sapru,
1994). Hahn-Been (1970) defines development as a process of acquiring a sustained
growth of a system‘s capacity to cope with new continuous changes towards the
achievement of progressive political, economic and societal objectives.
Therefore, development is nothing but improving the welfare of the individuals which
is usually measured in terms of providing infrastructural facilities that could afford
them a chance for better life. Improving the standard of living, education, health and
opening out new and equal opportunities for richer and varied life are all important
ingredient of development. So there for, the primary goal of development is to improve
man and his environment (Iheanacho, 2012).
Planning on the other hand is deciding what actions to be taken in the future for the
purpose of achieving organizational goals, it involves thinking ahead, initiating and
taking a predetermined course of action and deciding in advance what should be done,
how, when and by whom. Without planning, the activities of organizations, institutions,
53
societies and nations may well become a series of random actions with meaningless
objectives (Datta, 2010). According to Cole (1993), planning is an activity which
involves decisions about ends as well as means and about conduct as well as result.
Planning is deciding what to do, how to do it and who is to do it (Koonzt, Donnel and
Weihrich, 2006). Nwachukwu (1998) observed that planning entails determination of
control, direction and methods of accomplishing the overall organization or national
objective. Plans must be directed and controlled towards achieving desired objectives.
Todaro (1992) conceptualizes development planning as the conscious governmental
effort to influence, direct and in some cases, even control changes in the principal
economic variables of a country over the course of time in order to achieve
predetermined set of objectives‖. From the above it is obvious that without adequate
planning, no meaningful development can take place in any system or State.
Development planning as a long-term programme is designed to effect some permanent
structural changes in the economy; is connected with the involvement of government in
the economy whereby it set out objectives about the way it wants the economy to
develop in future and then intervenes to try to achieve those objectives (UNDP, 2008).
Development planning involves processes which ensure that national policies and
strategies are realized and development concerns at all levels are fully integrated into
the overall national development thrust (Datta, 2010). This will help to alleviate the
problems of inequality if sincerely pursued.
2.3.6 National Development Planning in Nigeria
Development plans have been accepted as a suitable strategy to address development
and inequality challenges in Nigeria. Therefore, the analysis of various development
plans in Nigeria before and after independence becomes necessary.
54
2.3.6.1 Pre-Independence Plan
Nigeria‘s planning experience began with the Ten-Year Plan of Development and
Welfare for Nigeria which was introduced in 1946 by the colonial government (1945-
1956) sequel to a circular from the Secretary of State for Colonies to all British
colonies, directing the setting up of a Central Development Board (Onah, 2010). The
Ten Year Plan of Development and Welfare for Nigeria could not be actually termed as
plan in real sense because it contained mainly a list of uncoordinated projects in various
regions. The objective of the plan, though not stated was to meet the perceived needs of
the colonial government rather than any conscious attempt to influence the overall
performance of the Nigerian economy then (Egonmwan and Ibodje, 2001).
The primary interest of the colonial government was to produce agricultural products
such as groundnuts, palm oil, and cocoa that were required by the British factories. No
attempt was made to articulate and incorporate the needs and interest of Nigerian
people into the objectives and priorities of development plans (Onah 2010). Ayo (1988)
observed that the programme ―suffered from non-specialized colonial administrators
approach to development planning, the inadequacy of planning machinery and absence
of clearly defined national objectives.‖ The plan also further increased the evil of the
inequality in Nigeria. The plan served as a launch pad to subsequent development plans
in Nigeria.
2.3.6.2 First National Development Plan (1962-1968)
Immediately after attainment of independence in 1960, the first National Development
Plan (1962-1968) was launched. The objectives of the plan were: to bring about equal
distributions of national income; to speed up the rate of economic growth; to generate
savings for investments so as to reduce its dependence on external capital for the
55
development of the nation; to get enough capital for the development of manpower; to
increase the standard of living of the masses particularly in respect of food, housing,
health and clothing and to develop the infrastructure of the nation (Onyenwigwe,
2009). It had a proposed total investment expenditure of about N2, 132million. The
public sector was expected to invest about N1, 352.3million while the remaining
investment expenditure of N780 million was expected to be made by the private sector
(Obi, 2006). Though, the plan appeared impressive, but due to political upheaval in the
country which resulted in 30 month civil war, the plan almost became redundant.
The researcher also observed that, the objectives and targets of the 1962-68 plans were
too large and over-ambitious and therefore out of tune with financial technical and
managerial capabilities of the country. This made the plan to lack clarity and precision
in the formulation of objectives and targets (Onah, 2010). Despite the weaknesses of
the plan, some major projects were executed during that period. These included the
Nigerian Security and Minting Plant, the Jebba Paper Mill, the Sugar Mill, Niger Dam,
the Niger Bridge, Onitsha, Kainji Dam and Port Harcourt Refinery. Even with the
executed projects, the problem of inequality was not solved because the projects were
not evenly distributed in the country; the margin is getting wider and wider.
2.3.6.3 The Second National Development Plan (1970-1974)
At the end of 1970, national reconstruction and rehabilitation were the focus of
attention of the federal government. In order to fasten the growth of national economy
and ensure equitable distribution of national income, it became imperative to launch the
Second National Development Plan. Initially, the plan was meant to cover the four year
period, 1970-1974, it was later extended to cover the fiscal year of 1974-1975. The plan
56
put forward five national objectives: a United, strong and self-reliant nation; a just and
egalitarian society; a land of bright and full opportunities for all citizens; and a free and
democratic society (Onyenwigwe, 2009). Ayo (1988) outlined the difference between
this plan and others as: besides being much bigger in size and more diversified in its
project composition, it was in fact the first truly national and fully integrated plan
which viewed the economy as an organic unit: the twelve states were fully integrated
into national development plan. Also, unlike the first plan, the second plan was
formulated wholly by Nigerians.
The total capital projected expenditure of about 4.9 billion was contained in the plan.
Out of this figure, the proposed public sector investment was 3.3 billion while the
private sector was expected to invest 1.6 billion (Obi, 2006). The highest orders of
priorities in public sector projected expenditure were accorded to transport and
communication, manufacturing, housing and education (Onah, 2010). Second National
Development Plan laid much emphasis on indigenization. In the opinion of Okowa
(1991) ―indigenization was seen by this plan as an instrument towards the long term
objective of economic independence‖.
Although the Second National Development Plan also attached importance on
agriculture, industry and the development of high level and intermediate level
manpower, the plan was beset with problems as in the first National Development Plan.
Onah (2010) alludes to this fact that ―the high priority given to agriculture and industry
was not matched with action during the implementation of the plan‖. One of the basic
tenets of Second National Development Plan is indigenization policy. Indigenization
policy was carefully designed to encourage Nigerians to participate fully in the
57
commercial, industrial and financial activities of the Nigerian economy. Several
indigenization decrees were made to realize the objectives of this policy.
It is also worthy of note that despite the much talk about indigenization policy, there
were over 16 multinational oil companies representing the United States, Dutch,
Japanese, British, Italian, German and French interest that had firm and massive grip on
Nigeria‘s Petroleum after the expiration of the plan (Koha, 1994). An interesting
feature of the Second National Development Plan was the objective of creating ―a free
and democratic society‖ that was being challenged by the military government. This
objective was put in place without considering any discussion on political development
in the plan document and any means of returning to civilian rule. Despite the
inadequacies of the plan, it witnessed achievements in the areas of industry and
agriculture.
The industrial sector recorded more improvements. Many industries in the war affected
areas were rehabilitated, coupled with establishment of two salt factories in Kaduna.
Super phosphates project and two vehicle assembly plants were also established. Other
achievements included the establishment of colleges of technology and trade centers by
state governments and reconstruction of about 3000 kilometers of roads (Egonmwan
and Ibodje, 2001). Despite these achievements, inequality was not resolved in the
country; some areas were favored over others.
2.3.6.4 The Third National Development Plan (1975-1980)
The Third National Development Plan had a projected jumbo investment of N30 billion
which was later increased to N43.3 billion. This represented ten times that of the

58
Second Plan and about 15 times that of the First Plan (Obi, 2006). The objectives of the
plan were: increase in per capita income; more even distribution of income; reduction
in the level of unemployment; increase in the supply of higher level manpower;
diversification of the economy; balanced development and indigenization of economic
activities (Obi, 2006). The approach of the plan was to utilize resources from oil to
develop the productive capacity of the economy and thereby permanently improve the
standard of living of the people. Therefore, the plan was premised on the need for the
public factor to provide facilities for the poorer sections of the population including
electrification, water supplies, health services, urban housing and education
(Egonmwan and Ibodje, 2001).
The assessment of the plan showed it focused to give priority to projects and
programmes that would directly impact positively on the rural dwellers, but the meager
allocations to agriculture and social development schemes did not indicate sincere
intention of the government to achieve the objective. According to Okigbo (1989)
agriculture and social development scheme (education, housing, health, welfare etc)
that have direct bearing on the living conditions of the rural population received only 5
per cent and 11.5 per cent respectively of the financial allocations contained in the plan.
It is appropriate to state here that the meager allocation to agriculture and social
development schemes, which were priority areas, indicated the ―lack of focus of the
planners to careful sifting of the criteria for allotting principles‖ (Onah, 2010).
The third plan did not really achieve its set targets i.e, the desired objectives.
Irrespective of the inadequacies of this plan, it witnessed achievements in some areas.
In the opinion of Okowa (1991), in terms of achievement, the manufacturing sector
59
recorded the fastest growth rate with an average of 18.1 per cent per annum. Some
other sectors that witnessed growth were building and construction and government
services. This aspect of achievement all things being equal should bring development to
Nigeria because development comes about through changes induced, framed and
generated by deliberate policies and through development agents. If this is sustained, it
can spread to the periphery to alleviate inequalities in economic development.
2.3.6.5 Fourth National Development Plan (1981-1985)
The Fourth National Development Plan (1981-85) came on board in 1981. It was the
first that the civilian government prepared since the intervention of the military in
Nigerian politics in 1966. The objectives of the plan according to Obi (2006) were: (i)
increase in the real income of the average citizen; (ii) more even distribution of income
among individuals and socio-economic groups (iii) reduction in the level of
unemployment and under employment; (iv) increase in the supply of skilled manpower;
(v) reduction of the dependence of the economy on the narrow range of activities; (vi)
increased participation by the citizens in the ownership and management of productive
enterprises; (vii) greater self-reliance that is, increased dependence on local resources in
seeking to achieve the various objectives of society; (viii) development of technology;
(ix) increased productivity and (x) the promotion of a new national orientation
conducive to greater discipline, better attitude to work and cleaner environment. The
projected capital investment of the plan was put at N82billion. Out of this figure, the
public sector investment was N70.5 billion while the private sector was expected to
invest N11.7 billion (Obi, 2006).
60
According to Adedeji (1989) the plan was ―the largest and most ambitious programme
of investment over launched in Nigeria‖. The plan also adopted as its main strategy the
use of resources generated from oil to ensure all-round expansion in production
capacity of the economy and to lay a foundation for self-sustaining growth
(Egonmwam and Ibodje, 2001). It was anticipated in the Fourth Plan that exports led by
petroleum products would generate enough funds to actualize the plan that had been
formulated. Eventually, the revenue realized from exports was far below anticipated
projections. It is a sad commentary that only 54 per cent of the export proceeds
projected for the period was realized in 1984. For instance, it was projected that
N79.449 million would be earned from petroleum exports between 1980 and 1984, but
only N52.78 million some 66.4 per cent of the projected figure was earned (Okigbo,
1989).
With the dwindling resources to finance the Fourth Plan, the Nigerian economy
witnessed debt service and balance of payment problem coupled with high level of
inflation. Most of the projects that were started at the beginning of the plan period
could not be completed and these together with several spillover projects from previous
plan had to be abandoned (Jaja, 2000). The growth rate of Gross Domestic Product
(GDP) per annum was only 1.25 percent compared to 5.5, 13.2 and 4.6 percent under
the previous National Development plans (Onah, 2010). Another problem of this plan
was rise in the cost of living that led to a reduction in the standard of living of a
common man. There was also phenomenal increase in unemployment among school
leavers in the country. Our external reserves kept on declining.

61
Commenting on the plan, Alapiki (2009) observed that ―the plan period 1981-85
proved to be the most dismal in the economic history of Nigeria at that time‖. The
Fourth National Development Plan recorded some achievements in some areas in spite
of its drawbacks. The implementation of Agricultural Development Programme (ADP)
in most states was successfully completed, the commissioning of Egbim Power Station,
Dry Dock Project at snake Island, Lagos and the 87 telephone exchanges located all
over the federation which increased the number subscribers to telephone lines from
188,000 in 1981 to 297,000 in 1985 (Egonmwan and Ibodje, 2001).
2.3.6.6 The Fifth National Development Plan (1985-1989)
Due to poor implementation of the Fourth National Development Plan, machinery was
put in place for preparation of the Fifth National Development Plan. In order to
facilitate the exercise, a conference was held at the University of Ibadan in November
1984 to deliberate on the appropriate mechanisms for the Fifth National Development
Plan. The conference suggested some measures which formed the corner stone of the
policies and strategies incorporated in the Fifth National Development Plan.
The objectives of the Fifth National Development Plan were: (i) diversification of the
nation‘s economy away from the monoculture one to which it has been pushed by the
fortunes of the oil sector; (ii) revitalization of the agricultural sector with a view to
achieving thorough integrated rural development programmes; (iii) domestic
production of raw materials for local industries in order to reduce the importation of
locally manufactured goods and (iv) promotion of employment opportunities in order to
arrest the deteriorating mass unemployment (Onyenwigwe, 2009). The primary focus
of the plan was to correct the structural defects in the economy and create a more self-
reliant economy that would largely be regulated by market forces. The economy was
62
therefore expected to be restructured in favour of the production sector especially those
of agriculture and manufacturing (Onyenwigwe, 2009). More than ever; the linkage
between the agricultural and manufacturing sectors of the economy was to be
emphasized during the plan (Ayo, 1988). The Fifth National Development Plan did not
materialize. It was later incorporated in the Structural Adjustment Programme (SAP).
The two year SAP brought to an end the five year planning model in Nigeria. The
Federal government changed the two year model to three year rolling plans.
2.3.6.7 The Perspective Plan and the Rolling Plans (1990-1998)
The Babangida government had abandoned the previous fixed five year development
plans and replaced it with two types of national plans viz: perspective plan which will
cover a period of 15-20 years that will provide opportunity for a realistic long-term
view of the problem of the country and the rolling plan which will cover three years
subject to review every year to ascertain whether economy is progressing or not. The
perspective plan which was to start from 1990 together with rolling plans did not take
off until 1996 when Abacha set-up the Vision 2010 Committee.
The main report of Vision 2010 submitted to Abacha government in September 1997
among other things recommended that the vision should provide the focus of all plans
including long (perspective), medium (rolling) and annual plans (budgets) (Adubi,
2002). Therefore, the Vision became the first perspective plan for the country even
though it failed to proceed beyond Abacha‘s death in 1998. The three year rolling plan
became operational from 1990 with the introduction of the First National Rolling Plan
(1990-1992). The primary objective of the rolling plan was to afford the country the
opportunity of revision in the ―midst of increasing socio-political and economic
63
uncertainties‖ (Ikeanyibe, 2009). But the preparation of medium term plans turned out
to be a yearly event and became almost indistinguishable from annual budgets and
rolling plans are being prepared annually at all levels of government (Okojie, 2002)
2.3.6.8 National Economic Empowerment and Development Strategy (NEEDS) (2003-
2007)
When the Obasanjo‘s government was re-elected in 2003, it realized the necessity for
comprehensive socio-political and economic reform of the country since the previous
plans did not put the Nigerian economy on sound footings. It was in this context that
the National Economic Empowerment and Development Strategy (NEEDS) that
appeared to be a road map to address the development challenges in Nigeria were
launched. The basic thrust of NEEDS focused on: empowerment, wealth creation,
employment generation and poverty reduction as well as value reorientation (NEEDS,
2004).
It is worrisome that the government has not realized most of the professed objectives of
NEEDS; this is because many regions are still back ward in terms of socio-economic
development infrastructures. Within the period of NEEDS 2003-2007, Nigeria‘s annual
budget crossed the threshold of billions into trillions of naira, but the per capita income
of Nigeria falls into the one dollar per head level of the poorest countries (Ikeanyibe,
2009). Education which is expected to empower citizens has witnessed increase in the
number of educational institutions from primary to tertiary institutions. The universities
have increased from about forty in 1999 and mainly belonging to federal and state
governments to about eighty nine in April 2007, with greater private sector
participation (Ikeanyibe, 2009). It is regrettable that despite increase in the number of
64
educational institutions, the cost of education is very exorbitant. For example an
average private university charges fees as high as N500, 000 per session. This has led
to the reduction of number of citizens that can have access to higher education.
Therefore, empowerment of such citizens is grievously hampered (NEEDS, 2004). The
universities also are not equitably distributed; access to education by some regions is
highly hindered because of distance.
NEEDS had planned to create about seven million jobs by 2007, but the reality is that
most policies adopted by the government to realize this objective were inimical to
employment generation. In her efforts to reform government institutions, many
employees have actually lost their jobs which will eventually affect economic
development. The Central Bank of Nigeria alone severed 804 employees through
mandatory retirement in 2005 (CBN, 2005). In the area of infrastructural development,
NEEDS has also failed to achieve the expected objectives. Electricity which
coincidently was a major policy choice area of the government rather than show
improvement seemed to have declined tremendously (Ikeanyibe, 2009). The poor
supply of electricity in the country has reached a dangerous proportion by 2007.
Adegboyega (2006) observed the fact to look beyond Obasanjo‘s reformation package
if Nigeria must get out of the power quagmire. As a medium term plan, most of the
objectives of NEEDS should have been achieved before the expiration of Obasanjo‘s
administration in May 2007. The truth is that NEEDS as a development planning did
not achieve the expected results like previous development plans in Nigeria. The four
main objectives Viz: employment generation, poverty reduction, wealth creation and
65
value re-orientation remains only on paper; which has further deepened the problem of
inequality in Nigeria.
2.3.6.9 Vision 20:2020
Nigerian leaders under President Olusegun Obasanjo have added Vision 20:2020 to one
of its endless search for appropriate development strategy. The objective of the Vision
20:2020 was to make Nigeria one of the first 20 economics in the world by the year
2020 (Adegboyega, 2006). To actualize this lofty dream, Nigeria‘s GDP per capita was
to grow at an incalculable rate (different from the present 0.8%) from US$ 752 to
$30,000 at least and the GDP of those countries (over US $29,000) Nigeria wishes to
displace and/or join must stop growing (now they grow at 2%) (Eneh, 2011). The rural
areas in Nigeria must be transformed from age-long poverty and misery centres to
urban status of world standard.
2.3.6.10 Institutions and Spatial Inequality
Institutions matter for growth and development, but they also matter for spatial
inequality. While most of the recent studies have focused on understanding the impact
of institutions on the development and growth of nations, regional differences in the
quality of institutions may also significantly impact regional economic development
within nations (Banerjee and Iyer, 2005; Kapur and Kim, 2006; Kim, 2007b; and Bruhn
and Gallego, 2007). Moreover, political institutions that determine the distribution of
power and fiscal resources between federal, state, and local governments can play a
major role in determining spatial inequality (Henderson, 2002; Kim, 2008).
Scholars have proposed a variety of explanations for why nations or regions possess
different institutions such as accidents of history (North, 1990), factor endowments
66
(Engerman and Sokoloff, 1997), climate and native population density (Acemoglu,
Simon and James 2001) (Acemoglu, 2002). While differences in the institutions of
regions within a nation may be more difficult to sustain than those at the international
level, regional differences do persist, and even when these differences are removed,
their impact may persist over time especially in developing nations. Political
institutions are likely to contribute to urban inequality if property rights are easier to
establish and defend in cities where one has access to courts and the legal system.
Moreover, political corruption and instability may also contribute to urban inequality in
the form of urban primacy if proximity to a primate city makes it easier to shield
oneself from the threat of violence, to make illegal bribes easier to conceal, or to have
access to information and communication. In a simplified model, Ades and Glaeser
(1995) showed that the benefits of political primacy are likely to be higher in
dictatorships than in democracies. Federalism or the balance of political power between
the federal, state, and local jurisdictions is also likely to matter greatly for spatial
inequality. In the United States, the nation emerged with a weak federal government
that gave significant political power to the states and local governments until the
second half of the twentieth century. As a consequence, American‐style federalism is
likely to have contributed to greater spatial equality over time (Kim, 2008). On the
other hand, many countries in Latin America emerged with strong federal but weak
local governments (Sokoloff and Zolt, 2006). Latin American–style federalism is likely
to have contributed significantly to great spatial inequality over time.
67
2.4 SURROGATES OF SOCIOECONOMIC DEVELOPMENT IN KOGI
STATE
The major socioeconomic factors (surrogates) that were used for this study in Kogi
State include transport and communication, Education, Commerce and Trade, Health
Care and Industries.
2.4.1 Transport and Communication
In Nigeria, prior to the British colonial rule, levels of development were with
insignificant difference between regional, urban and rural standards of living. As
colonial activities advanced, however, export crop economy was created; the economy
was monetized along with the construction of national communication system,
particularly railway and the subsequent establishment of new towns. Capitalism as
brought by colonialism intensified problems of regional inequality in Nigeria.
Transport and communication are capable of assisting the diffusion of ideas and
innovation. In terms of transport, Kogi State connects the Federal Capital Territory
with Twenty-two Southern States. Good telecommunications services are available in
the state (Canback, 2000). In development process, the role of transport and
communication cannot be over-emphasized in that they help in no small measure to
spread the benefit of development from the industrial urban centre to the rural hinter-
land usually in form of spread effects (Rotimi, 1994). In the same vein, Ogunsanya
(2002) had remarked that transport was analogous to internal organs of human body
that often worked as the life-wire of our Socioeconomic and political life.
Transportation in Kogi State is considered as an indispensable factor in her economic
growth and development. In the past, the general assumption was that transport and
development always go together. This idea was so popular that, for some time there
68
was little critical assessment of the actual contribution of road transport to
socioeconomic development (Ellis, 1997). Today, there is widespread agreement
among scholars that transport is very important to spatial, economic and social growth;
but there is no specific agreement on its specific roles in the developmental process
(NISER, 2001).
Three distinct viewpoints however exist on the role of transport in development.
Transport may have positive, permissive or negative impacts. (Usman, 2012). On the
positive and the permissive impact, Umoh (2000) assessed the impact of rural
electricity and roads as facilitators of socioeconomic development of rural areas in
Kaura Namoda, Zamfara State and revealed that recent installation of rural electricity
supply and construction of access roads has increased volume of investments in areas
of transport services and which has contributed immensely to economic growth in the
study area.
On the negative impact is the influence of the British political economy in the country
as earlier explained in chapter one. Ali-Nejadfard (2000) opined that development
propelled along the transportation system, labour moved along the road, the towns and
villages that were opportune developed very fast, migration was towards these towns
and villages. There was rural depopulation and regional inequality as result of road
development. In Kogi State, areas with good road and better communication network
are highly populated and with development indicators on ground.
2.4.2 Education
Education is regarded as an engine of growth and plays a unique role in economic
development and the social transformation process (Adefila, 2008). Education
generally is sine-qua-non for any development effort in both urban and rural areas. In

69
Kogi State, education is one of their main industries, but how are the schools
distributed? In the rural areas, a lot of scholars have advocated informal or non-formal
education as more relevant to the development of the rural areas. The development of
educational infrastructure is a pre-requisite to national development (Hafiz, et al 2016).
Educational facilities are very important in both rural and urban areas. Therefore,
therefore, their distribution, accessibility as well as utilization have become issues of
interest to geographers, (Olamiju and Olujimi, 2011).
Education is crucial to achieving both the Education for All (EFA) goals, and the
Millennium Development Goals (MDGs) aimed at eradicating extreme poverty and
hunger, ensuring universal primary education by 2015, promoting gender equity and
ensuring environmental sustainability (F.G.N, 2007). In 1996, the World Food Summit
in Rome stressed increased access to education for the poor and members of
disadvantaged groups, including rural people, as a key to achieving poverty eradication,
food security, durable peace and sustainable development. The 2002 World Summit on
Sustainable Development, held in Johannesburg, also emphasized the role of education
(Claude and Dias 2007).
As the majority of the world‘s poor, illiterate and undernourished live in rural areas, it
is a major challenge to ensure their access to quality education. The lack of learning
opportunities is both a cause and an effect of poverty. Hence, education and training
strategies need to be integrated within all aspects of sustainable development, through
plans of actions. Education provides the means by which skilled national man-power
supply is obtained. One of the most outstanding educational problems in Nigeria, as in
other parts of the developing world, is the inadequate number of schools secondary
70
schools especially in the northern part of the country (Inobeme and Ayanwole, 2009).
The spatial disparity in the distribution of secondary school is most severe between
urban and rural areas. Inobeme and Ayanwole, (2009) observed that even in the urban
areas, there is inequality in the distribution of schools due to a number of factors
ranging from political to environmental accessibility.
Mustapha, Akintunde, Alaga, Sharafdeen, Sunday, Ibrahim, Hafeez, and Muibi, (2015)
used GIS techniques to evaluate accessibility to government primary schools in Ilorin
West of Kwara State in northerncentral Nigeria and discovered that, there is a random
pattern in the spatial distribution of the schools in the area.
Musa and Mohammed (2012) examined the spatial distribution of secondary schools in
Bida Town of northcentral Nigeria. They observed inequality in the distribution of the
schools and low level of utilization by the residents.Ogunyemi, Muibi, Eguaroye,
Fabiyi and Halilu (2014) employed Geographical Information System (GIS) to analyze
accessibility to secondary schools in Ogun State of Southwestern Nigeria. Their
findings revealed that only about 50% of the students have good access to schools in
the area.Adefila, (2008) in the research ―spatial variation in infrastructural development
in Benue State‖ asserted that education affects the pattern of employment, income
status, housing, food and nutritional status and the overall level of well-being. It aids
development of intellectual abilities, cultural attitudes and the acquisition of skills and
knowledge. Bernardin (2012) in the research ―Education Inequality in Ghana; gender
and spatial dimension recommended for a design and implementation of policies to
address gender and spatial inequalities in education and also to tackle within-gender
and within- spatial inequalities.
71
One of the critical problems facing developing countries is the inadequate provision
and maintenance of infrastructural facilities and that the poor state of infrastructure in
many areas is posing a great challenge to economic development efforts (Abumere,
Okafor and Oluwasola, 2002). The proliferation and maintenance of schools connotes
that many people would have easy access to education, and subsequently economic
development if things are done the way they should. There are schools of different
cadre in some part of Kogi State; the availability of these schools is seen to be one of
the variables that should have positive contribution to the socioeconomic development
of the area, since education is the state‘s main social industry. Kogi State has a great
number of educated youths who are out of job either because of their geographical
location or other unforeseen circumstances.
2.4.3 Commerce and Trade
Commerce and trade is the backbone of a developing society. It cannot be over-
emphasized in that it helps in no small measure to spread the benefit of development
from the industrial urban centre to the rural hinter-land usually in form of spread
effects. Commerce and trade is very important to spatial, economic and social growth.
In kogi state, the industry took its foot from the time of the colonial masters where the
state capital Lokoja served as the colonial capital. As a result of this, about two-third of
the buying and selling in Kogi State are found in Lokoja the state capital. Adefila,
(2008) had remarked that the level of buying and selling in any region is a function of
the level of development. Regional inequality is a ubiquitous phenomenon in both
developed and developing nations. Developing nations are characterized by wide-
spread inequality among regions and social groups and especially between the large
72
expanse of rural areas and a few urban centers where development efforts have been
concentrated (Todaro 1992).
In the developing nations, the prevailing inequality is greatly related to their colonial
experience. Colonial administration emphasized export production thus there was
massive development of export crops and mineral resources within a laissez-faire
philosophy of development. The implication is that economic production activities
were initiated and concentrated in favorable ecological zones. The concentration of
development in a few towns of Zambia, and the emergence of various cash crops or
minerals exploitation belts in Nigeria are manifestations of the laissez faire approach to
development. (Yunusa, 1991).
Generally, developing nations‘ economies are predominantly agricultural, lacking
essential framework for development. Also lacking are efficient transport services and
network, marketing and other such facilities. This is in agreement with the result of Wu
and Gopinath (2008), which examined the causes of spatial inequality of economic
development in the United States and found out that infrastructure, is the primary cause
of the differences in income, employment and development density between the top
and the bottom. The colonial administration provided the facilities to enhance
administration and commerce. Specifically, transport facilities (roads, rail lines and
ports) were developed to ease the problems of evacuation of local resources. The end
product has been greater centralization of governmental and economic activities in a
few centres to the neglect of other areas of the community. As Todaro (1992) rightly
noted, it is hazardous to generalize about all developing nations, but the common
problems of poverty, unemployment, inequality and sizable and growing imbalance
73
between rural and urban areas in terms of incomes and life opportunities are common
knowledge. All these problems are linked to existing economic structures and
development approaches in these countries.
2.4.4 Health Care Facilities
Health is central to community well-being as well as to personal welfare. It affects
educational performance (and thus determines employment prospects) and it is
fundamental to people‘s ability to enjoy and appreciate all other aspects of life
(Balogun 2009). There is a close association between health status and the general
socio-economic well-being of a population. Ajala and Adeyinka (2001) remarked that
accessibility to health care facilities is a major indicator of development and the
importance of adequate health care facilities in providing sustainable rural development
can therefore not be over-emphasized.
Access to medical services is one of the basic necessities of any modern human
community. It is a major complement to a strong, dynamic and progressive society. In
Nigeria, health services are provided by the government (Federal, State, and Local
Government), private individuals and organizations that establish and run private
medical centers USAID, (2006). Health planning did not start in Nigeria until 1946
with the launching of the 1946 – 56 ten year development plans (with emphasis on
curative aspect). At the end of the plan period, not much had been achieved because
common indicators of health revealed a deplorable situation. In addition, the problems
of inadequate and lopsided distribution of these institutions favored the urban areas to
the neglect of rural areas where about 75 percent of the population live.
74
During the Third National Development plan (1975 – 80), the government in an effort
to remove the constraints posed by inadequate health facilities, decided to re-organized
and re-orientate the health care delivery system. The primary health care system which
came into being in 1975 was reorganized and broadened to cater for the need of the
population at the grassroots level FGN (1980). To achieve the articulated tasks of
implementing the programmes, three levels of responsibilities were identified; Federal,
State and Local government. The Federal Government would be responsible for policy
and implementation guidelines, resource assistance in the area of manpower guidelines
and the coordination of all the agencies involved in the implementation of the activities.
The states through their respective ministries of health would execute the delivery of
services in the states. The local government had the responsibility of also providing
services because of their close proximity to the people with respect to the distribution
of health care facilities, personnel, hospital beds and the population they serve. To
ascertain the level of proximity to the people in Kogi state, this study became
necessary. This is necessary to enable government to determine how best to meet the
health-related needs of the population.
Nengak and Osagbemi, (2011) examined and explained the pattern of distribution of
health facilities from year 2000 to 2009 in Nasarawa State. Secondary data was
analyzed using ratios and percentages. The study showed a progressive trend of
development of healthcare facilities and concluded that the most striking features of the
distribution of healthcare facilities in the state is the marked concentration of state
sector hospitals and key healthcare personnel in the urban areas. In line with this, the
study recommends that more incentives must be created to enable healthcare personnel
to work in the rural areas.
75
Oyekanmi, Ayansina, Muyiwa and Jubril (2011) in the geo-political patterns of health
care facilities in Kogi State, revealed that two out of the three senatorial districts are
lagging behind in the provision of heath care facilities and consequently inadequate
development in the two districts. Fanan and Felix, (2014) examined the spatial
distribution of health facilities in Benue State. The research used secondary data which
was subjected to factorial analysis of variance using factorial uni-variance ANOVA
design, which is an extension of one-way ANOVA. It involves the analysis of two or
more independent variables at a time. Pearson Product Moment Correlation was also
applied to investigate the relationships between population and number of health care
facilities. The result shows a positive relationship between the number of health
facilities and population of the LGAs. It discovered that the line of fit is linear while the
coefficient of correlation is 0.75 which is highly significant at 0.05 confidence level. It
implies that the larger the population of LGAs, the greater the number of healthcare
facilities provided. This situation therefore negates the principle of equity and social
justice. It implies that some LGAs are disadvantaged while others are at advantaged in
terms of number of health infrastructures.
2.4.5 Industries
Industrialization is one of the key determinants of the level of socio-economic
development of a district. Kogi State possesses a number of industries that have helped
in human development and consequently socioeconomic development. Industries in
Kogi state includes Cassava Processing industries, Boja Industries, Saw mills
Industries, Pure water Industries, Iron and Steel industry, Dangote Cement factory,
bread and confessionary industries etc. It is plausible, as some scholars suggest, that the
76
relative high levels of socioeconomic development in urban areas is as a result of
investment decisions made by government that are biased in favour of such areas.
Where industries exist, they are located at the ports to process imports or exports. The
ports are usually the capital and possibly the largest city. To take such advantages as
nearness to government, transport and communication facilities, labour supply and
large market, investment in industry and overhead capital projects have been
concentrated in a few towns. Thus, it can be noted that industries, where they exist,
were located and developed according to the dictates of markets forces rather than the
needs of the people during and after the colonial era (NEEDS, 2004). In West Africa,
industrial development followed a laissez faire approach and became concentrated in
few centres like Dakar, Abidjan, Tema, Takoradi, Accra, Kaduna, Kano and Lagos.
These few towns dominate the economies of their countries (Oduro, Pepra and
Adamtey 2014). While cost of living sourced in such few centres due to over
concentration of government and port activities, commerce, industry and social
services, the vast rural areas remain neglected and poorly developed. The study of
Idike (1992) asserted that in most rural areas in Nigeria, basic infrastructure where they
exist at all is inadequate for any meaningful development.
In Kogi State the available industries are not commensurate with the number of people
that the industries are meant to serve. It is in this line that the State government
embarked on different programs among which is Youth Advancement and
Development Programme (YAD4KOGI) for youths to alleviate the problem of
unemployment in the State.
77
CHAPTER THREE
STUDY AREA AND METHODOLOGY
3.1 THE STUDYAREA
3.1.1 Location and Size
Kogi state is located between Latitudes 60 49″ - 8
0 30″ north of the Equator and
Longitudes 50 35″ - 7
0 45″ East of the Green Wich Meridian. It is located in the North-
central zone of Nigeria with a total landmass of about 30,345.74 Km/Sq and it is the
15th largest State in terms of landmass. It is popularly known as the ‗Confluence State‘
due to the fact that the confluence of Rivers Niger and Benue is at Lokoja, the State
Capital. It is the most centrally located of all the states of the federation (Figure 3.1). It
shares boundary with Niger State and the Federal Capital Territory, Nasarawa to the
north, Benue and Enugu States to the east, while Edo, Ondo, Ekiti and Kwara States are
on the western side (Kogi State, 1992).
3.1.2 Climate
The study area has an average maximum temperature of 33.20
C and an average
minimum temperature of 22.80
C. Lokoja, the State Capital is generally very hot
between the months of October and April each year, though the intervening harmattan
from late November to early February normally cushions its effects. Despite the
cushioning effects of the harmattan, there are times when Lokoja the State Capital‘s
weather is unbearable. The climatic condition has in no small measure affected the
socio-economic development of the state. People that would have invested in the area
have been scared away by the weather conditions of the area. The uncompromising
weather condition coupled with the rugged terrain explains why Lord Lugard moved
his administrative Headquarters from Lokoja to Zungeru and later to Kaduna. If the
administrative Headquarter was not moved there would have been greater concentration
of governmental and economic activities which would have led to the development of
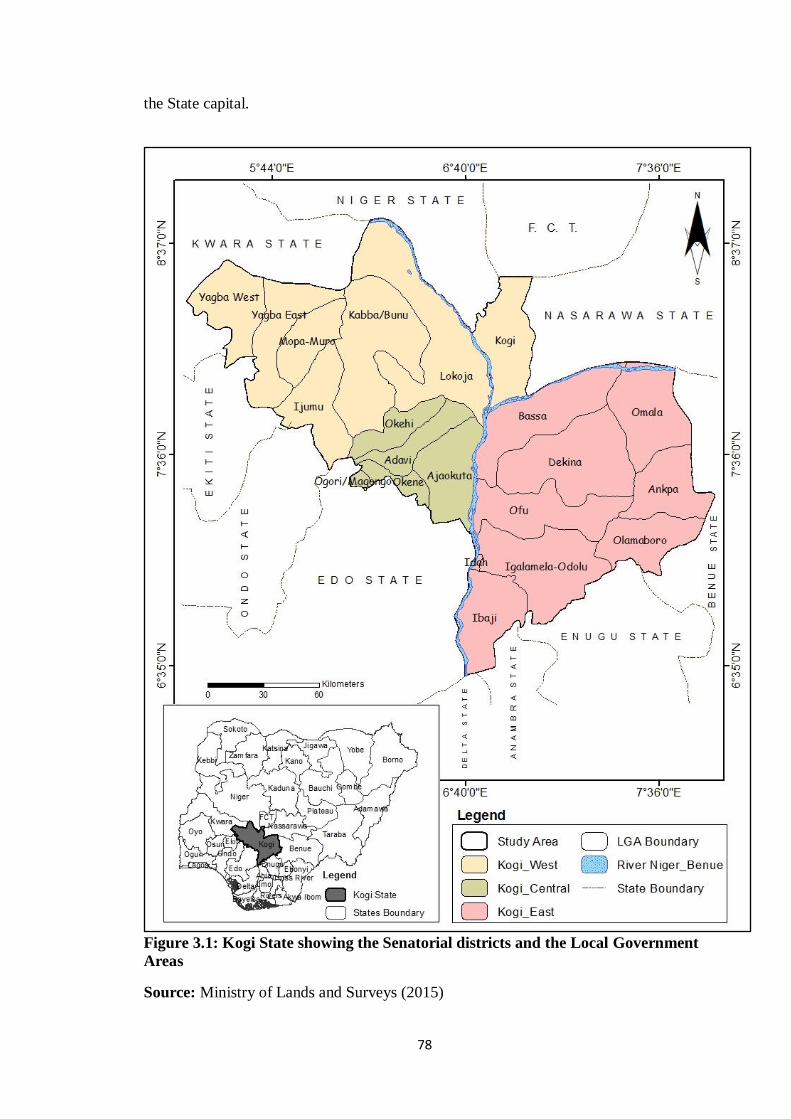
78
the State capital.
Figure 3.1: Kogi State showing the Senatorial districts and the Local Government
Areas
Source: Ministry of Lands and Surveys (2015)
79
If the state capital is developed there would been a trickling down effect of
development to the hinterlands. It is also worrisome that there is prevalence of sleeping
sickness and malaria fever which has contributed to the general low population density
of the study area which one of the common features of the middle-belt in the country
(Sadibo and Jacob, 2006).
3.1.3 Relief and Drainage
The land rises from 300 meters along the Niger/Benue confluence, to the heights of
between 300 and 600 meters above sea level in the upland area of Agbaja Plateau and
much higher in Okoro-Agbo hills in Ijumu local government area of Kogi State. Like
most towns in the Niger-Benue Confluence area, Lokoja is dominated by undulating
landscapes, broken by hills formed of resistant rocks and this has profound influence on
the pattern of settlement in the study area. The fairly undulating terrain in the eastern
region of the state has contributed to high development in such areas as against the
western region that is characterized by resistant rocks. Land for development is
relatively scarce in the area. The growth of towns is therefore rapidly taking place
where the land is relatively flat (Ocheja, 2010). The state is drained by the Niger and
Benue rivers and their tributaries.
The rivers have had considerable influence on many phases of human activities
including the growth of settlements, transportation and hydro-power (Sadibo and Jacob,
2006). Rivers Niger and Benue have also contributed to the socio-economic
development of Kogi State such that most of the dry land that are not properly drained
and often considered not very useful for farming due to their low organic content thus,
such areas is underdeveloped. An example is the western district of the State. On the
other hand there are high densities of population where there are well drained, fertile
80
soils. Human beings usually settle first in areas of fertile soils and plain land. This is
partly why the eastern senatorial district of the State is observed to be more developed
than the other areas.
3.1.4 Vegetation
The rain forest vegetation covers Dekina, Ofu, Ankpa, Olamaboro, Idah and Bassa
local government areas with rich wooded trees including palms, Iroko and mahogany.
The rain forest vegetation is a natural advantage for the eastern senatorial district. It has
attracted lumbering activities from the neighboring villages and states which in turn led
to the establishment of saw mill industries of various categories in the region. There are
more job opportunities in the area compared to the other senatorial districts. As a result
of the saw mill industries, other local and small medium scale industries emerges, such
as upholstery, carpentry, food vending, snacks and drinks shops and a host of others.
All these have led to inequalities in the socio-economic activities of the area. Other
local government areas in the west and the central senatorial districts such as Yagba-
East, Yagba-West, Kabba/Bunu, Ijumu, Kogi, Mopa-muro, Lokoja and Kogi are in the
guinea savannah with some parkland vegetation. The grasses are tall and very
luxuriant. These areas do not have the natural advantage of forest vegetation the eastern
senatorial district has that has led to some form economic development. The trees in
some areas usually appear green during the rainy season with luxuriant leaves but
remained open due to bush burning during the dry season. The trees which grow in
clusters are up to six meters tall, interspersed with grasses which grow up to about three
meters. The trees species include locust bean, shea butter and oil bean trees. The
different types of vegetation are however, not in their natural luxuriant state owing to
the prevailing human activities (Kogi State MDGs, 2008).
81
3.1.5 Population, people and Economic Activity
There are three main ethnic groups in the study area namely, the Igalas, Ebiras, and the
Okuns with the Igalas being the largest and powerful ethnic group in the State. The
State creation exercise of 1967 and the abolition of provinces and regions led to the
merging of the then Ilorin and Kabba provinces to form Kwara State with its capital in
Ilorin. This Status quo remained until 1976 when, in another state creation exercise, the
former Igala division was exercised and merged with Benue province to form Benue
State with the headquarters in Markudi. The State was created in 1991 during
Babangida‘s military administration. (Kogi State MDGs, 2008).
The headquarters of the local government areas served as important traditional,
cultural and market centres in their localities for varying lengths of time, since the
nineteenth century, and sometimes even earlier which may be one of the causes of
spatial inequality in socio-economic development of the area. The population is mostly
rural communities and the predominant economic activity is agriculture that is
practiced at subsistence level of production. The sector employs a vast majority of the
total workforce. Farm labour is supplied mainly by families, hired labourers and work
groups. Education is the state‘s main social industry. Each of the local government
areas has primary schools and colleges. (Kogi State MDGs, 2008).
3.2 METHODOLOGY
This section discusses the various methods that were used in the generation of study
data. The section also highlights the type of data generated, the description of the
indicators, sources of data, the sampling design, questionnaire administration and
methods of analyzing generated data.
3.2.1 Reconnaissance Survey
A reconnaissance survey of the study area was made to get familiarized and acquainted
82
with the area. During the exercise, efforts were made to intimate with the village heads,
local government council Chairmen, Councilors, civil servants on ground and the
Secretaries to all the Commissioners in the Ministries in the state. This was done to
solicit for their support in the area of data collection for the study. The reconnaissance
survey was successful.
3.2.2 Types of Data Utilized
In line with the objectives of the study, the data used are data on theSelected
Socioeconomic Development Indicators as presented in Table 3.1. Data on
socioeconomic characteristics of respondents, data on factors responsible for the pattern
of socioeconomic development in the study area and data on the challenges facing the
development of socioeconomic activities. These socioeconomic development indicators
for the study were carefully selected as they are applicable to the study area.
3.2.3 Sources of Data
Data for this study were collected through both primary and secondary sources.
3.2.3.1 Primary Source of Data
The primary source of data was from questionnaire survey. There were two sets of
structured questionnaire. One forselected persons of the communities and the second
for the Officials of the Local Government headquarters. The selected respondents are
community leaders, civil servants, students, traders, farmers and artisans. Structured
questionnaire (Appendix 1 and 11) were used to obtain data on socio-demographic
profile of the respondents, length of road between settlements and state capitals,
education, basic health care services, commerce, trade, social organizations, industries,
and the challenges facing their areas and the way forward.
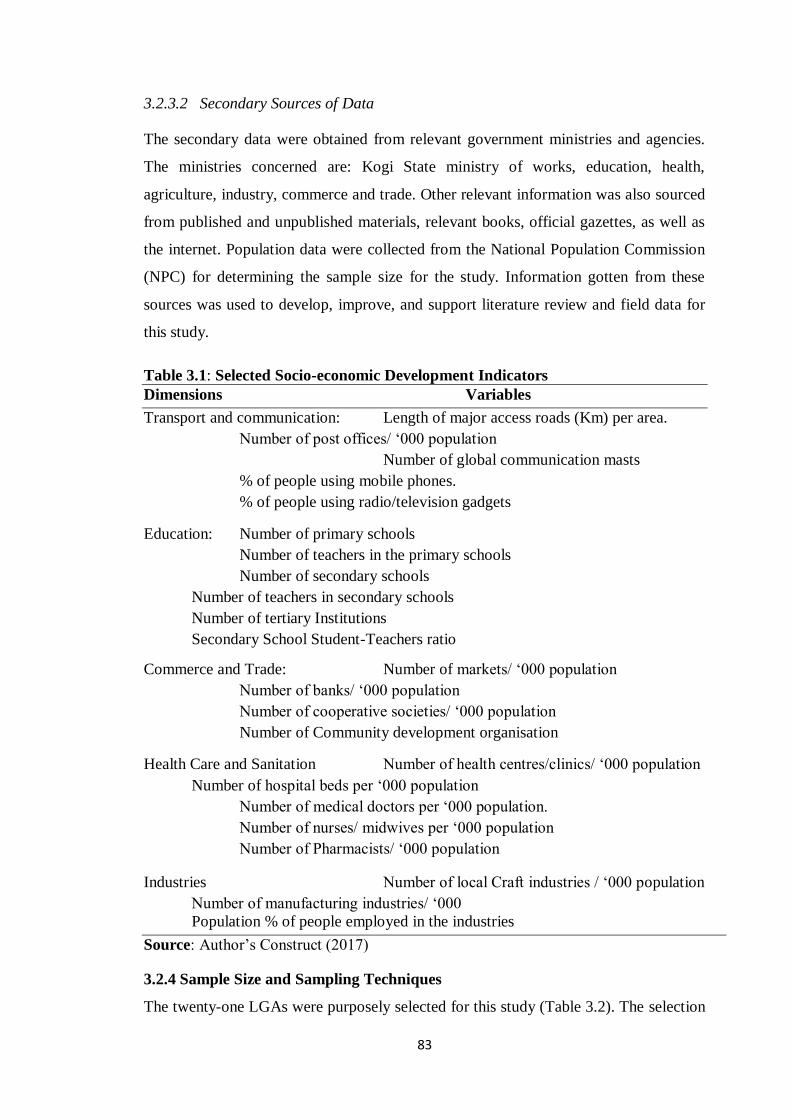
83
3.2.3.2 Secondary Sources of Data
The secondary data were obtained from relevant government ministries and agencies.
The ministries concerned are: Kogi State ministry of works, education, health,
agriculture, industry, commerce and trade. Other relevant information was also sourced
from published and unpublished materials, relevant books, official gazettes, as well as
the internet. Population data were collected from the National Population Commission
(NPC) for determining the sample size for the study. Information gotten from these
sources was used to develop, improve, and support literature review and field data for
this study.
Table 3.1: Selected Socio-economic Development Indicators
Dimensions Variables
Transport and communication: Length of major access roads (Km) per area.
Number of post offices/ ‗000 population
Number of global communication masts
% of people using mobile phones.
% of people using radio/television gadgets
Education: Number of primary schools
Number of teachers in the primary schools
Number of secondary schools
Number of teachers in secondary schools
Number of tertiary Institutions
Secondary School Student-Teachers ratio
Commerce and Trade: Number of markets/ ‗000 population
Number of banks/ ‗000 population
Number of cooperative societies/ ‗000 population
Number of Community development organisation
Health Care and Sanitation Number of health centres/clinics/ ‗000 population
Number of hospital beds per ‗000 population
Number of medical doctors per ‗000 population.
Number of nurses/ midwives per ‗000 population
Number of Pharmacists/ ‗000 population
Industries Number of local Craft industries / ‗000 population
Number of manufacturing industries/ ‗000
Population % of people employed in the industries
Source: Author‘s Construct (2017)
3.2.4 Sample Size and Sampling Techniques
The twenty-one LGAs were purposely selected for this study (Table 3.2). The selection
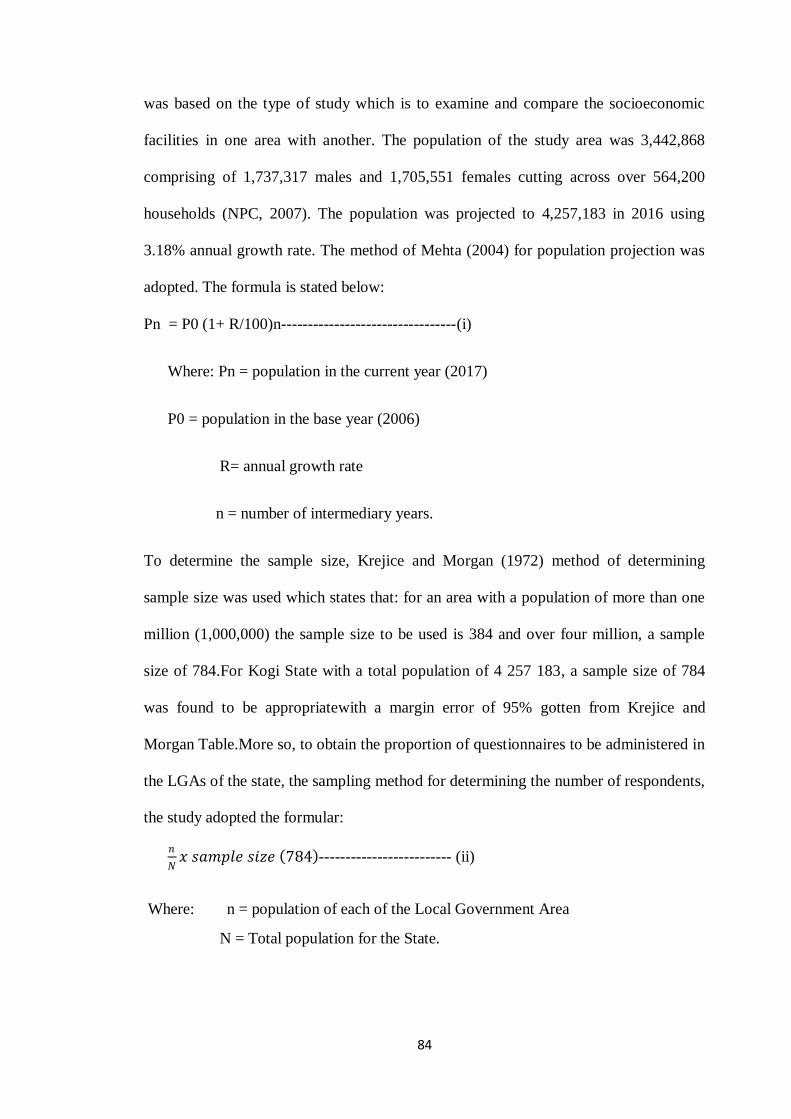
84
was based on the type of study which is to examine and compare the socioeconomic
facilities in one area with another. The population of the study area was 3,442,868
comprising of 1,737,317 males and 1,705,551 females cutting across over 564,200
households (NPC, 2007). The population was projected to 4,257,183 in 2016 using
3.18% annual growth rate. The method of Mehta (2004) for population projection was
adopted. The formula is stated below:
Pn = P0 (1+ R/100)n---------------------------------(i)
Where: Pn = population in the current year (2017)
P0 = population in the base year (2006)
R= annual growth rate
n = number of intermediary years.
To determine the sample size, Krejice and Morgan (1972) method of determining
sample size was used which states that: for an area with a population of more than one
million (1,000,000) the sample size to be used is 384 and over four million, a sample
size of 784.For Kogi State with a total population of 4 257 183, a sample size of 784
was found to be appropriatewith a margin error of 95% gotten from Krejice and
Morgan Table.More so, to obtain the proportion of questionnaires to be administered in
the LGAs of the state, the sampling method for determining the number of respondents,
the study adopted the formular:
𝑛
𝑁𝑥 𝑠𝑎𝑚𝑝𝑙𝑒 𝑠𝑖𝑧𝑒 784 ------------------------- (ii)
Where: n = population of each of the Local Government Area
N = Total population for the State.
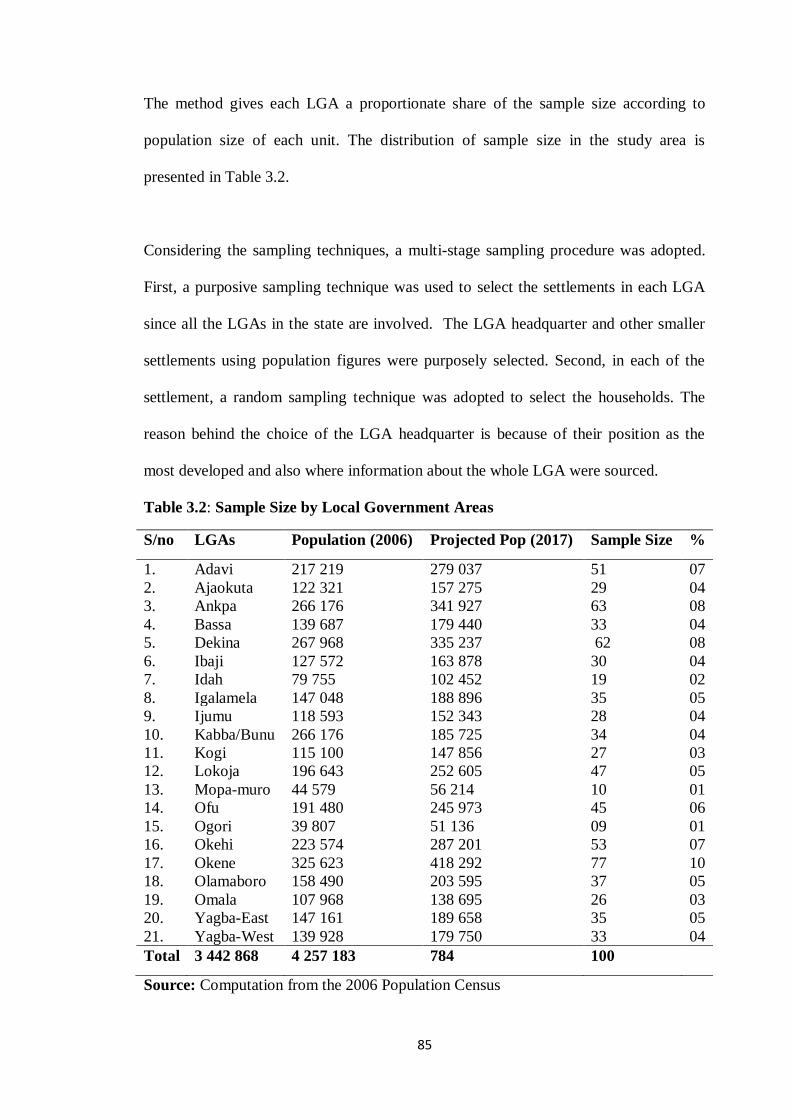
85
The method gives each LGA a proportionate share of the sample size according to
population size of each unit. The distribution of sample size in the study area is
presented in Table 3.2.
Considering the sampling techniques, a multi-stage sampling procedure was adopted.
First, a purposive sampling technique was used to select the settlements in each LGA
since all the LGAs in the state are involved. The LGA headquarter and other smaller
settlements using population figures were purposely selected. Second, in each of the
settlement, a random sampling technique was adopted to select the households. The
reason behind the choice of the LGA headquarter is because of their position as the
most developed and also where information about the whole LGA were sourced.
Table 3.2: Sample Size by Local Government Areas
S/no LGAs Population (2006) Projected Pop (2017) Sample Size %
1. Adavi 217 219 279 037 51 07
2. Ajaokuta 122 321 157 275 29 04
3. Ankpa 266 176 341 927 63 08
4. Bassa 139 687 179 440 33 04
5. Dekina 267 968 335 237 62 08
6. Ibaji 127 572 163 878 30 04
7. Idah 79 755 102 452 19 02
8. Igalamela 147 048 188 896 35 05
9. Ijumu 118 593 152 343 28 04
10. Kabba/Bunu 266 176 185 725 34 04
11. Kogi 115 100 147 856 27 03
12. Lokoja 196 643 252 605 47 05
13. Mopa-muro 44 579 56 214 10 01
14. Ofu 191 480 245 973 45 06
15. Ogori 39 807 51 136 09 01
16. Okehi 223 574 287 201 53 07
17. Okene 325 623 418 292 77 10
18. Olamaboro 158 490 203 595 37 05
19. Omala 107 968 138 695 26 03
20. Yagba-East 147 161 189 658 35 05
21. Yagba-West 139 928 179 750 33 04
Total 3 442 868 4 257 183 784 100
Source: Computation from the 2006 Population Census
86
Thirdly, the households selected constituted the units where questionnaire was
administered. Ten field staff assistants were recruited for questionnaire administration.
The research assistants were undergraduate students from the Federal University
Lokoja, Kogi State.
3.2.5 Data Analysis
Considering the large amount of data base involved, the study employed a variety of
descriptive and inferential statistical techniques to analyze the data. For the socio-
economic characteristics of the respondents, descriptive statistics such as frequency
counts, percentages, averages and mean were used to summarize the data into tabular
forms, graphs and charts.
Objective i: The standardized score (Z-score) technique was adopted to analyze the
spatial pattern of socio-economic development in Kogi State. This technique measures
the relative departure of the individual observations from the ‗mean‘ of observations
usually expressed in a comparative form Michael, Lewmis, Alan and Tim, 2004). The
score of each Local Government Area in each of the variables is standardized into Z-
score by changing the scores into zero mean and unit standard deviation. The zero
mean was produced and forms the baseline from which departures of scores of
observation in particular variable was compared. Standardized score technique (Z-
score) was adopted because it affords the opportunity to rank the unit areas in
accordance with their performance in the distribution of the facilities in a region.
Rotimi (1994) adopted standardized score (Z-score) approach to investigate the spatial
variations in socio-economic facilities in Kwara State, Nigeria. Aderamo and Aina,
(2011) employed the technique in their study of spatial inequalities in social amenities
in developing countries: A case from Nigeria. Fabiyi (2011) also used the method in his
study of spatial distribution and performance of water pumps in the rural areas of
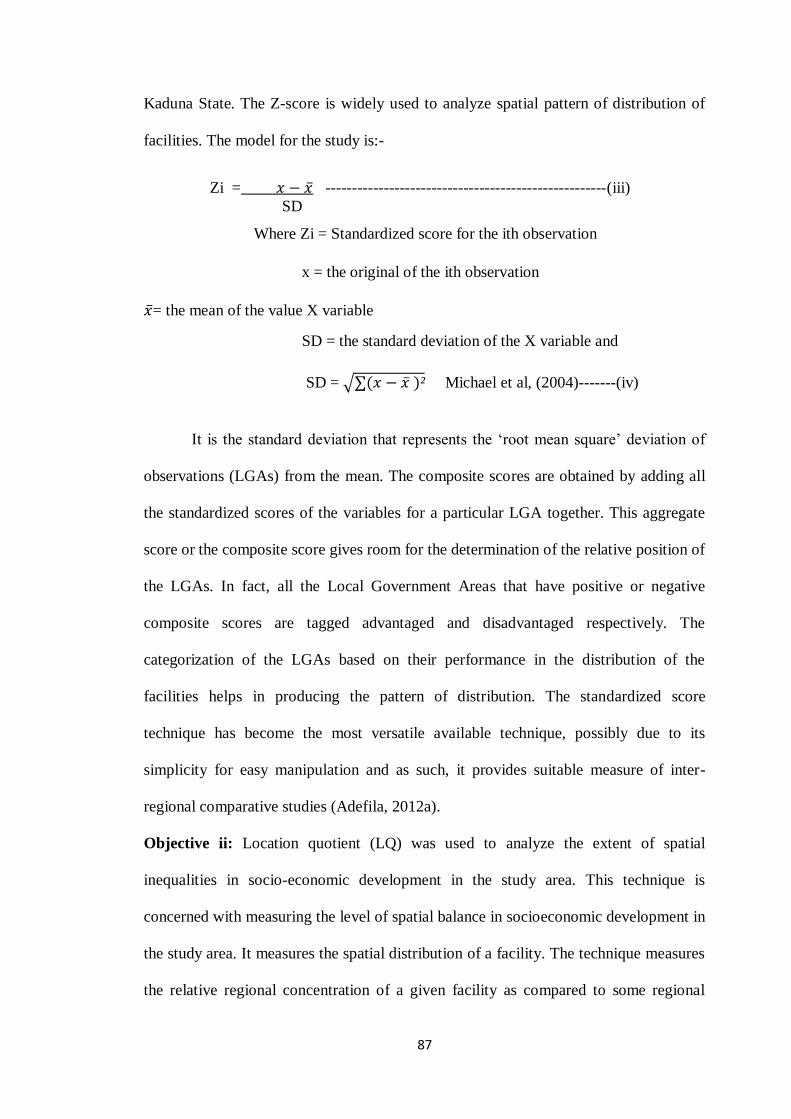
87
Kaduna State. The Z-score is widely used to analyze spatial pattern of distribution of
facilities. The model for the study is:-
Zi = 𝑥 − 𝑥 -----------------------------------------------------(iii) SD
Where Zi = Standardized score for the ith observation
x = the original of the ith observation
𝑥 = the mean of the value X variable
SD = the standard deviation of the X variable and
SD = ∑(𝑥 − 𝑥 )² Michael et al, (2004)-------(iv)
It is the standard deviation that represents the ‗root mean square‘ deviation of
observations (LGAs) from the mean. The composite scores are obtained by adding all
the standardized scores of the variables for a particular LGA together. This aggregate
score or the composite score gives room for the determination of the relative position of
the LGAs. In fact, all the Local Government Areas that have positive or negative
composite scores are tagged advantaged and disadvantaged respectively. The
categorization of the LGAs based on their performance in the distribution of the
facilities helps in producing the pattern of distribution. The standardized score
technique has become the most versatile available technique, possibly due to its
simplicity for easy manipulation and as such, it provides suitable measure of inter-
regional comparative studies (Adefila, 2012a).
Objective ii: Location quotient (LQ) was used to analyze the extent of spatial
inequalities in socio-economic development in the study area. This technique is
concerned with measuring the level of spatial balance in socioeconomic development in
the study area. It measures the spatial distribution of a facility. The technique measures
the relative regional concentration of a given facility as compared to some regional
88
aggregate. The co-efficient is derived by calculating each LGA‘s percentage share of
the State population and its percentage share of each of the variables. The differences
between the percentage population and share of the parameters are obtained.
Thereafter, the sum of the positive or negative difference is calculated for each
parameter for all LGAs in the state and the values range from zero to unity, with zero
indicating an even distribution of facility and unity indicating that such facility is
localized. On the ranking of the LGAs, it is based on the sum of the LQ values for all
the variables divided by the number of the variables to arrive at the mean. The mean
value for each LGA is arranged in a descending order of performance and categorized
into upper, middle and bottom third accordingly. Morenikeji, (1995) employed the
method to analyze the spatial pattern of development in Ondo State, Nigeria. Also,
Madu, (2007) adopted the method to analyze the distribution of rural infrastructural
facilities in Nsukka region of Southern Nigeria.
The LQ model for this study is given as:-
LQ = 𝑆𝑖/𝑆
𝑁𝑖/𝑁 ------------------------------ (v)
where:-
LQ = location quotient
Si = the number of facilities for the local government i
S = the total number of facilities in the State
Ni = population of the local government i
N = population of the State. Beyene, Erebor, Boucher and Chandna, (2005)
The technique is popular for depicting spatial pattern of distribution of facilities in a
region.
Objective iii: make a comparative analysis of socioeconomic development among the
local government areas. This objective was achieved by the interpretation of the
89
patterns of development exhibited among the local government areas (LGAs) in
objective i above using descriptive statistical statistics such as frequency counts,
averages, percentages and Scree Plot to summarize the data into tabular form.
Objective iv: Factor analysis was employed toexamine the factors that are responsible
for the spatial pattern of development in Kogi State. This technique was employed to
identify and characterize the underlying factors responsible for the spatial pattern of
development in the study area. It is useful in identifying the major factors that account
for variation in the pattern of socioeconomic development. Jolayemi (1992) used factor
analysis to identify the important factors that account for higher percentages in the
socio-economic development of settlements in the former Irepodun local government
area of Kwara State. In addition, Madu (2007) employed the method to determine the
pattern and underlying factors of rural development in Nsukka, South Eastern Nigeria.
Afolayan (2008) applied the method to examine the spatial impact of infrastructure-
based socio-economic development in the medium towns in Kwara State. The
Statistical Package for Social Sciences (SPSS) version 17.0 was employed to analyze
the data.
Objective v: Descriptive statistics was employed to examine the challenges facing the
development of socioeconomic activities in the study area. This include: frequency
count, the mean averages and percentages to explain and summarize the data.
90
CHAPTER FOUR
RESULTS AND DISCUSSION
4.1 SOCIOECONOMIC PROFILE OF THE RESPONDENTS
This section provides a better understanding of how availability, access and the
utilization of infrastructures are related to socioeconomic development. The summary
of respondents‘ age, gender, marital status, educational attainment, occupation and
income were examined.
4.1.1 Gender of Respondents
The study examined the gender of the respondents and the result is presented in Figure
4.1. It showed a very little difference in gender. It was found that 54.5% of the
respondents were females while males constitute 45.5%. Out of the seven hundred and
eight-four (784) respondents sampled, one hundred and eight (108) of them
representing about one-third of the total male respondents are from Kogi central
senatorial district, one hundred and forty about one-third are females. Kogi East has
174, which is more than half of the population of the respondents which are males and
190 respondents which is more than half are females. Kogi west has seventy-five which
is one-fifth to be males and 97 about one-fourth to be females. The larger number of
females to males may be due to the attitude of the respondents and the socioeconomic
condition of the area which may be interpreted as, the male as an explorer and known
to always want to subdue his environment, seen to be dominant in the quest for
knowledge and even in the game of risk taking and always searching for what to give to
his family. The males don‘t have the time and patience to give audience to researchers.
The men in the western senatorial district are farmers and lumbermen in the eastern
part of the state. The central senatorial district comprise of different occupations.
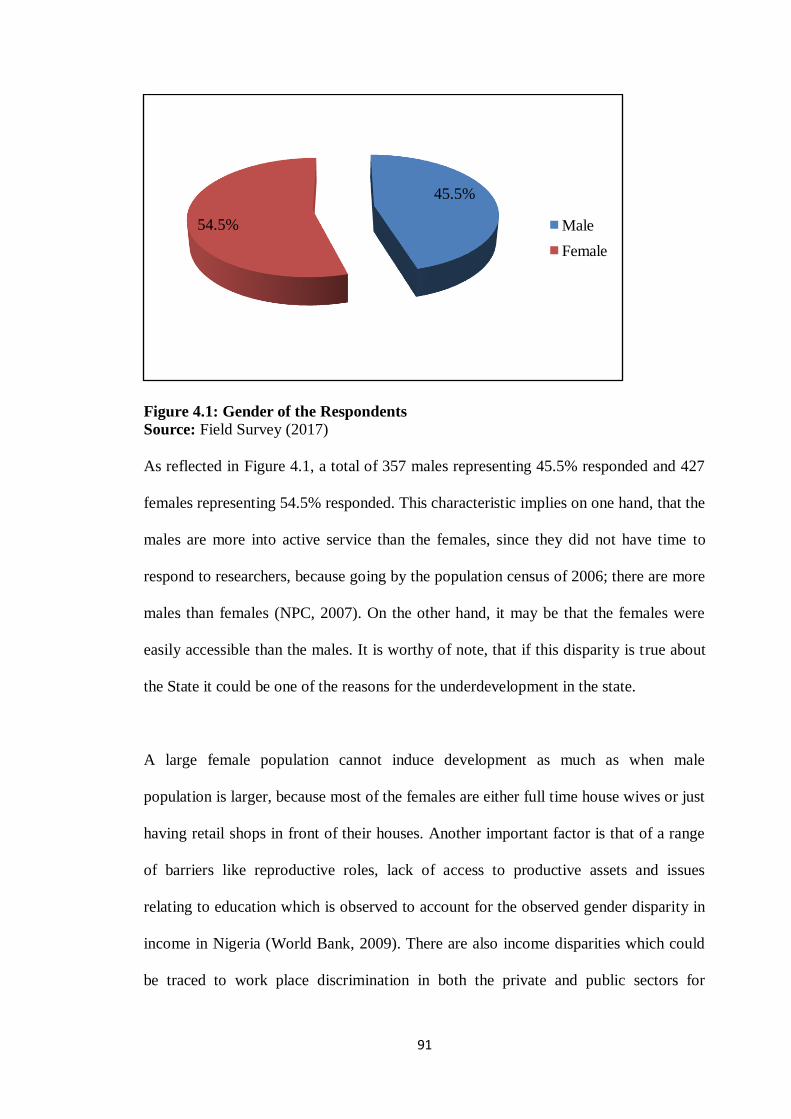
91
Figure 4.1: Gender of the Respondents Source: Field Survey (2017)
As reflected in Figure 4.1, a total of 357 males representing 45.5% responded and 427
females representing 54.5% responded. This characteristic implies on one hand, that the
males are more into active service than the females, since they did not have time to
respond to researchers, because going by the population census of 2006; there are more
males than females (NPC, 2007). On the other hand, it may be that the females were
easily accessible than the males. It is worthy of note, that if this disparity is true about
the State it could be one of the reasons for the underdevelopment in the state.
A large female population cannot induce development as much as when male
population is larger, because most of the females are either full time house wives or just
having retail shops in front of their houses. Another important factor is that of a range
of barriers like reproductive roles, lack of access to productive assets and issues
relating to education which is observed to account for the observed gender disparity in
income in Nigeria (World Bank, 2009). There are also income disparities which could
be traced to work place discrimination in both the private and public sectors for
45.5%
54.5% Male
Female
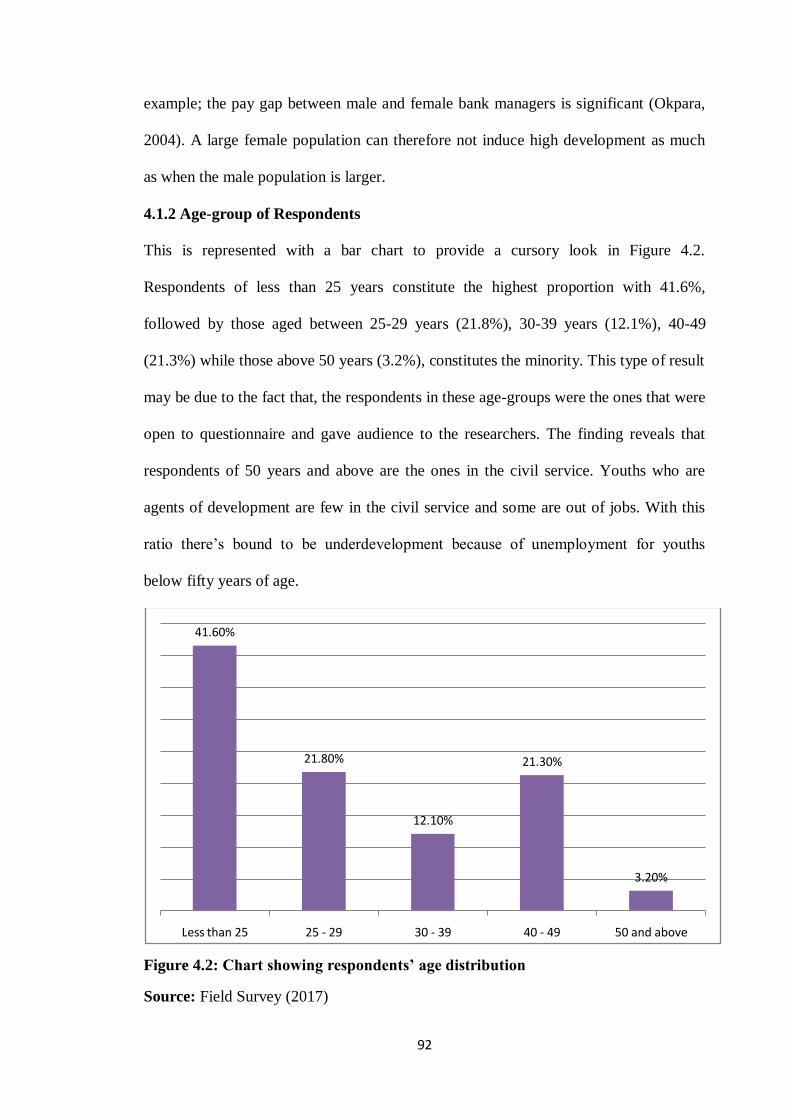
92
example; the pay gap between male and female bank managers is significant (Okpara,
2004). A large female population can therefore not induce high development as much
as when the male population is larger.
4.1.2 Age-group of Respondents
This is represented with a bar chart to provide a cursory look in Figure 4.2.
Respondents of less than 25 years constitute the highest proportion with 41.6%,
followed by those aged between 25-29 years (21.8%), 30-39 years (12.1%), 40-49
(21.3%) while those above 50 years (3.2%), constitutes the minority. This type of result
may be due to the fact that, the respondents in these age-groups were the ones that were
open to questionnaire and gave audience to the researchers. The finding reveals that
respondents of 50 years and above are the ones in the civil service. Youths who are
agents of development are few in the civil service and some are out of jobs. With this
ratio there‘s bound to be underdevelopment because of unemployment for youths
below fifty years of age.
Figure 4.2: Chart showing respondents’ age distribution
Source: Field Survey (2017)
41.60%
21.80%
12.10%
21.30%
3.20%
Less than 25 25 - 29 30 - 39 40 - 49 50 and above
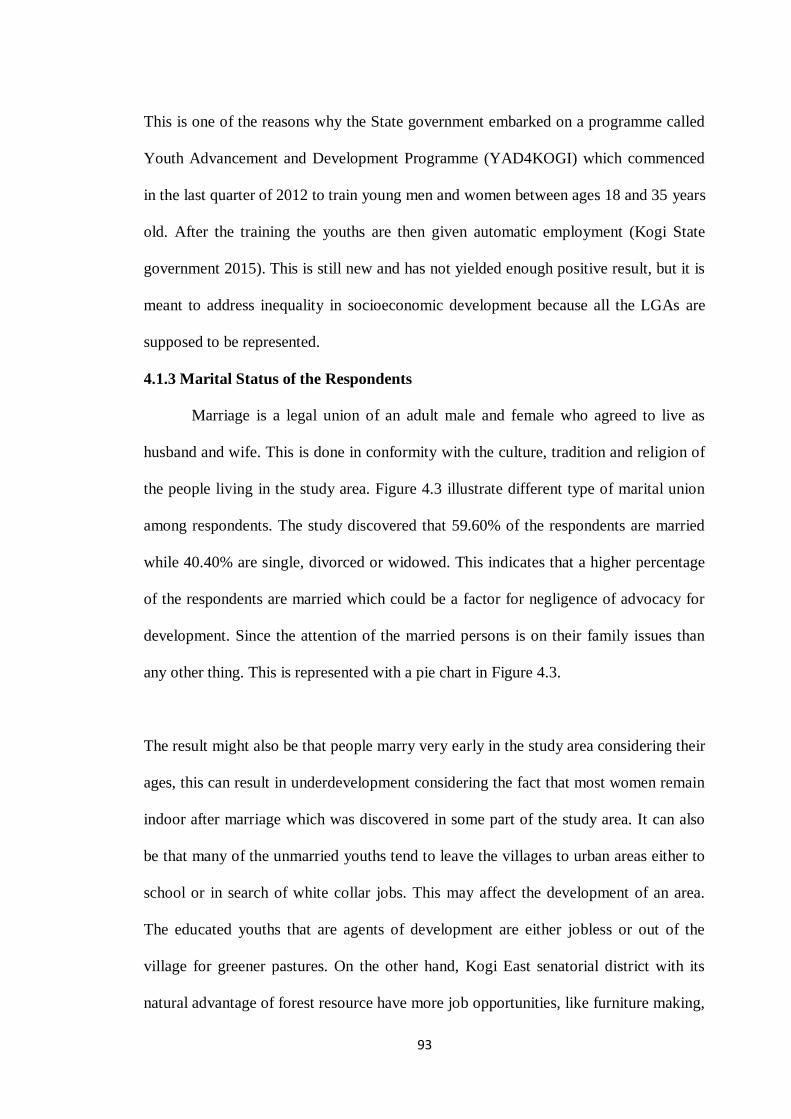
93
This is one of the reasons why the State government embarked on a programme called
Youth Advancement and Development Programme (YAD4KOGI) which commenced
in the last quarter of 2012 to train young men and women between ages 18 and 35 years
old. After the training the youths are then given automatic employment (Kogi State
government 2015). This is still new and has not yielded enough positive result, but it is
meant to address inequality in socioeconomic development because all the LGAs are
supposed to be represented.
4.1.3 Marital Status of the Respondents
Marriage is a legal union of an adult male and female who agreed to live as
husband and wife. This is done in conformity with the culture, tradition and religion of
the people living in the study area. Figure 4.3 illustrate different type of marital union
among respondents. The study discovered that 59.60% of the respondents are married
while 40.40% are single, divorced or widowed. This indicates that a higher percentage
of the respondents are married which could be a factor for negligence of advocacy for
development. Since the attention of the married persons is on their family issues than
any other thing. This is represented with a pie chart in Figure 4.3.
The result might also be that people marry very early in the study area considering their
ages, this can result in underdevelopment considering the fact that most women remain
indoor after marriage which was discovered in some part of the study area. It can also
be that many of the unmarried youths tend to leave the villages to urban areas either to
school or in search of white collar jobs. This may affect the development of an area.
The educated youths that are agents of development are either jobless or out of the
village for greener pastures. On the other hand, Kogi East senatorial district with its
natural advantage of forest resource have more job opportunities, like furniture making,
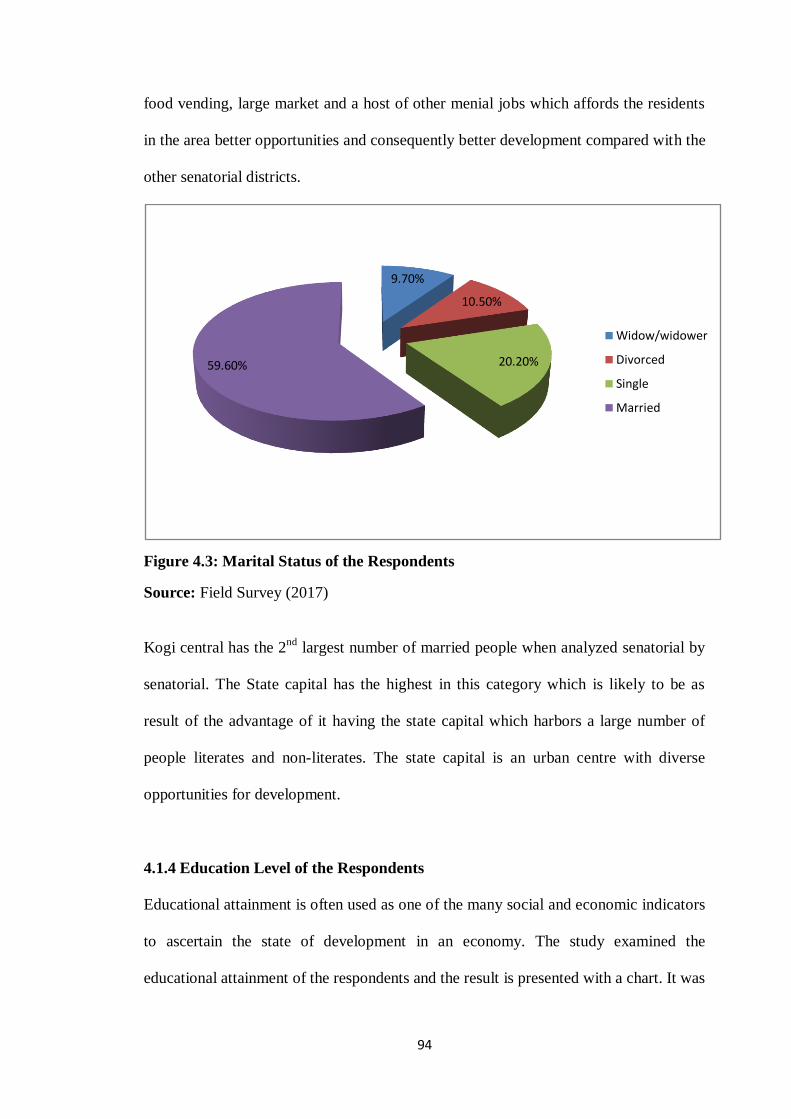
94
food vending, large market and a host of other menial jobs which affords the residents
in the area better opportunities and consequently better development compared with the
other senatorial districts.
Figure 4.3: Marital Status of the Respondents
Source: Field Survey (2017)
Kogi central has the 2nd
largest number of married people when analyzed senatorial by
senatorial. The State capital has the highest in this category which is likely to be as
result of the advantage of it having the state capital which harbors a large number of
people literates and non-literates. The state capital is an urban centre with diverse
opportunities for development.
4.1.4 Education Level of the Respondents
Educational attainment is often used as one of the many social and economic indicators
to ascertain the state of development in an economy. The study examined the
educational attainment of the respondents and the result is presented with a chart. It was
9.70%
10.50%
20.20%59.60%
Widow/widower
Divorced
Single
Married
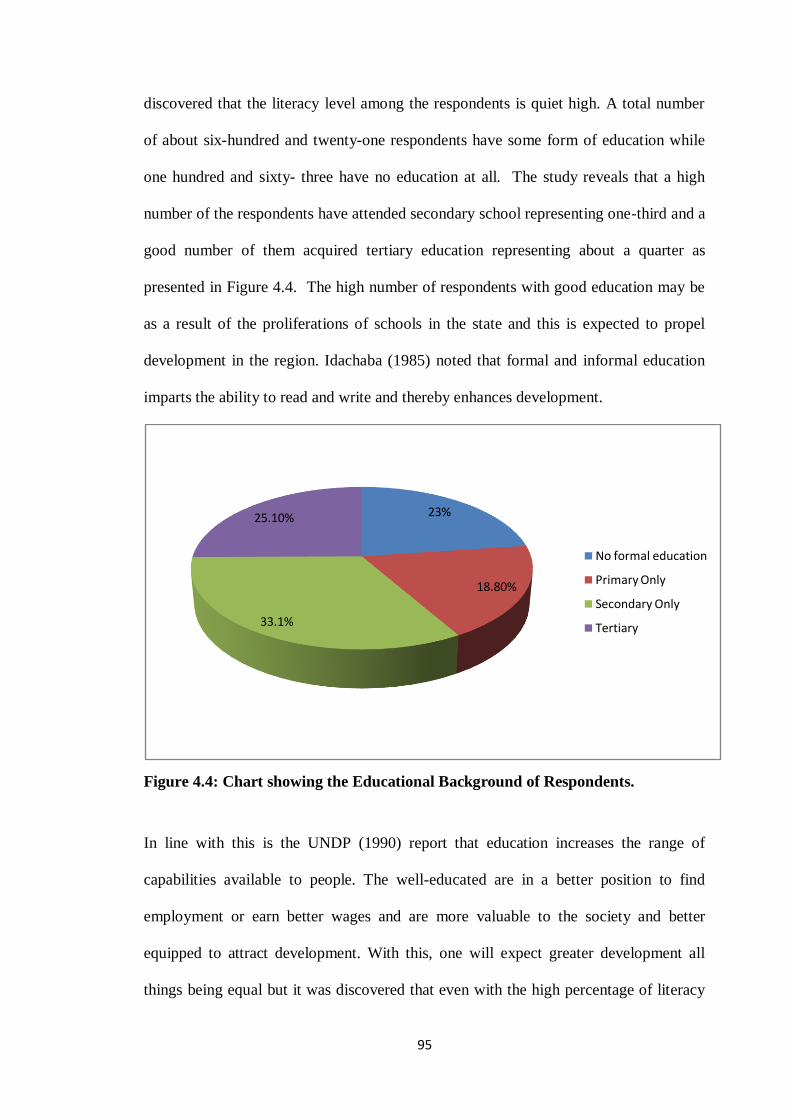
95
discovered that the literacy level among the respondents is quiet high. A total number
of about six-hundred and twenty-one respondents have some form of education while
one hundred and sixty- three have no education at all. The study reveals that a high
number of the respondents have attended secondary school representing one-third and a
good number of them acquired tertiary education representing about a quarter as
presented in Figure 4.4. The high number of respondents with good education may be
as a result of the proliferations of schools in the state and this is expected to propel
development in the region. Idachaba (1985) noted that formal and informal education
imparts the ability to read and write and thereby enhances development.
Figure 4.4: Chart showing the Educational Background of Respondents.
In line with this is the UNDP (1990) report that education increases the range of
capabilities available to people. The well-educated are in a better position to find
employment or earn better wages and are more valuable to the society and better
equipped to attract development. With this, one will expect greater development all
things being equal but it was discovered that even with the high percentage of literacy
23%
18.80%
33.1%
25.10%
No formal education
Primary Only
Secondary Only
Tertiary
96
in the Kogi state, development is still at its lowest level in most of the villages. There is
also educational gap within as well as across regions. Lower educational inequality has
been found to be associated with higher educational attainment level.
4.1.5 Occupation of the Respondents
The study investigated different occupations of the respondents in the study area and
result is presented in Figure 4.5. The occupation type of the people is an indication of
the socio-economic development of the particular area given that it determines the
income level. It revealed that more than half of the respondents are traders; this is
followed by respondents that are into farming, while civil servants and others constitute
a very little percentage. This result could be as a result of the gender nature of the
respondents which is 54.5% females to 45.5% males, since majority of females engage
in trading in the study area, the males take into lumbering, welding and the likes (all
these are summed up into trading). With the large percentage of respondents in trading,
it is expected to trigger economic development.
Figure 4.5: Occupation of the Respondents
Source: Field Survey (2017)
The study discovered that, Kogi east senatorial district has a large population in the
trade industry by virtue of its location in the rainforest belt. This location has afforded
0
10
20
30
40
50
60
Farming Trading Civil service Others
20.4%
51.7%
8.3%
19.6%
97
the senatorial district to have saw mill industries and other small and medium scale
industries which emerged as a result of the saw mill industries in the area. This singular
point has positive impact on the population of the eastern senatorial district of the state.
This is in line with the work of Fanan and Felix, (2014), that there is always a positive
relationship between the population and available facilities, the more the population,
the more the facilities all things being equal. This relationship put Kogi west and Kogi
central at a disadvantage in terms of provision of facilities in the study area. The
districts are having a location disadvantage which is responsible for the low population
of the district as a result of youths migrating to other regions.
4.1.6 Income Level of the Respondents.
The various income classes of the respondents are presented in Table 4.1. A cross
examination of all the LGAs that make up the senatorial districts revealed that majority
of the respondents were traders, followed by farmers and then other occupations. This
is the main reason why there is a high percentage of people with no fixed income
across the three senatorial districts. People with fixed income are very few. This could
be a reason for low development because the people with fixed income have low
income and their purchasing power will be low. The group without fixed income could
at one time have much, at another time little and non at other times.
In the study of inequality, a common element often chosen to measure is individuals‘
or households‘ income. Income comprises of salaries and wages, earnings from
investments and rents on properties. There is evidence that the income distribution of
the state is asymmetric because they are from different source like; agriculture,
industries, petty trading and others. This is an indication that the income in the state is
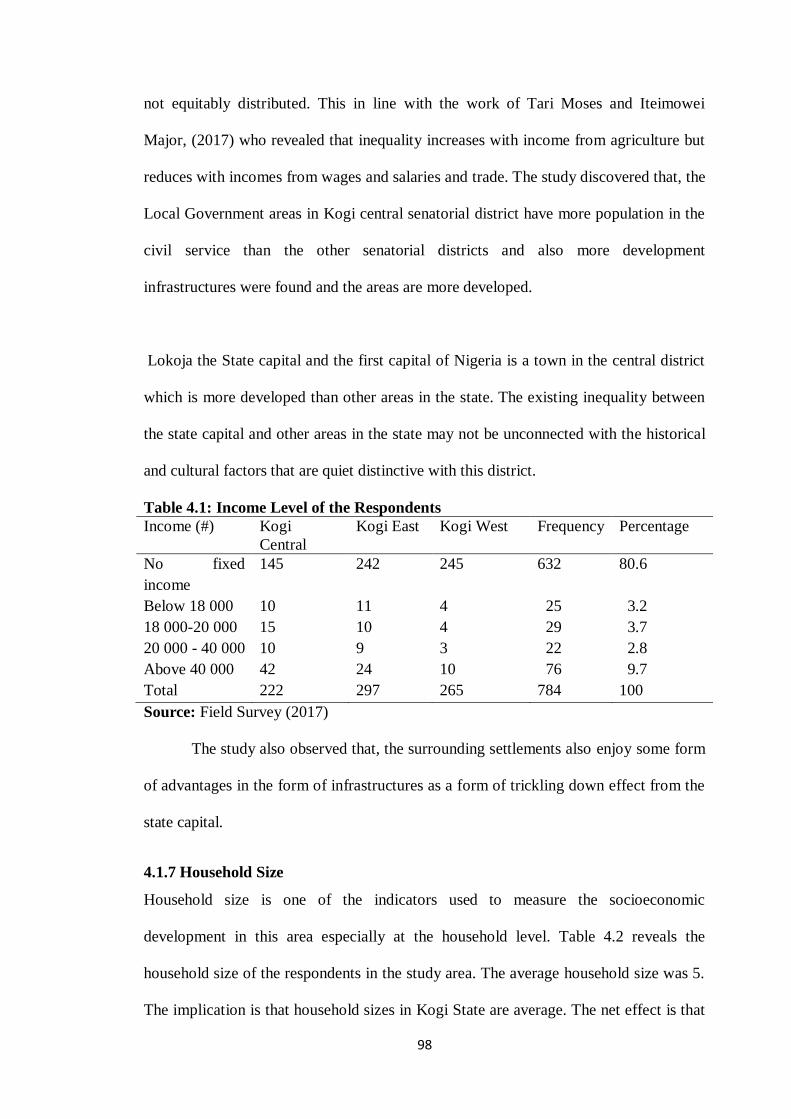
98
not equitably distributed. This in line with the work of Tari Moses and Iteimowei
Major, (2017) who revealed that inequality increases with income from agriculture but
reduces with incomes from wages and salaries and trade. The study discovered that, the
Local Government areas in Kogi central senatorial district have more population in the
civil service than the other senatorial districts and also more development
infrastructures were found and the areas are more developed.
Lokoja the State capital and the first capital of Nigeria is a town in the central district
which is more developed than other areas in the state. The existing inequality between
the state capital and other areas in the state may not be unconnected with the historical
and cultural factors that are quiet distinctive with this district.
Table 4.1: Income Level of the Respondents
Income (#) Kogi
Central
Kogi East Kogi West Frequency Percentage
No fixed
income
145 242 245 632 80.6
Below 18 000 10 11 4 25 3.2
18 000-20 000 15 10 4 29 3.7
20 000 - 40 000 10 9 3 22 2.8
Above 40 000
Total
42
222
24
297
10
265
76
784
9.7
100
Source: Field Survey (2017)
The study also observed that, the surrounding settlements also enjoy some form
of advantages in the form of infrastructures as a form of trickling down effect from the
state capital.
4.1.7 Household Size
Household size is one of the indicators used to measure the socioeconomic
development in this area especially at the household level. Table 4.2 reveals the
household size of the respondents in the study area. The average household size was 5.
The implication is that household sizes in Kogi State are average. The net effect is that
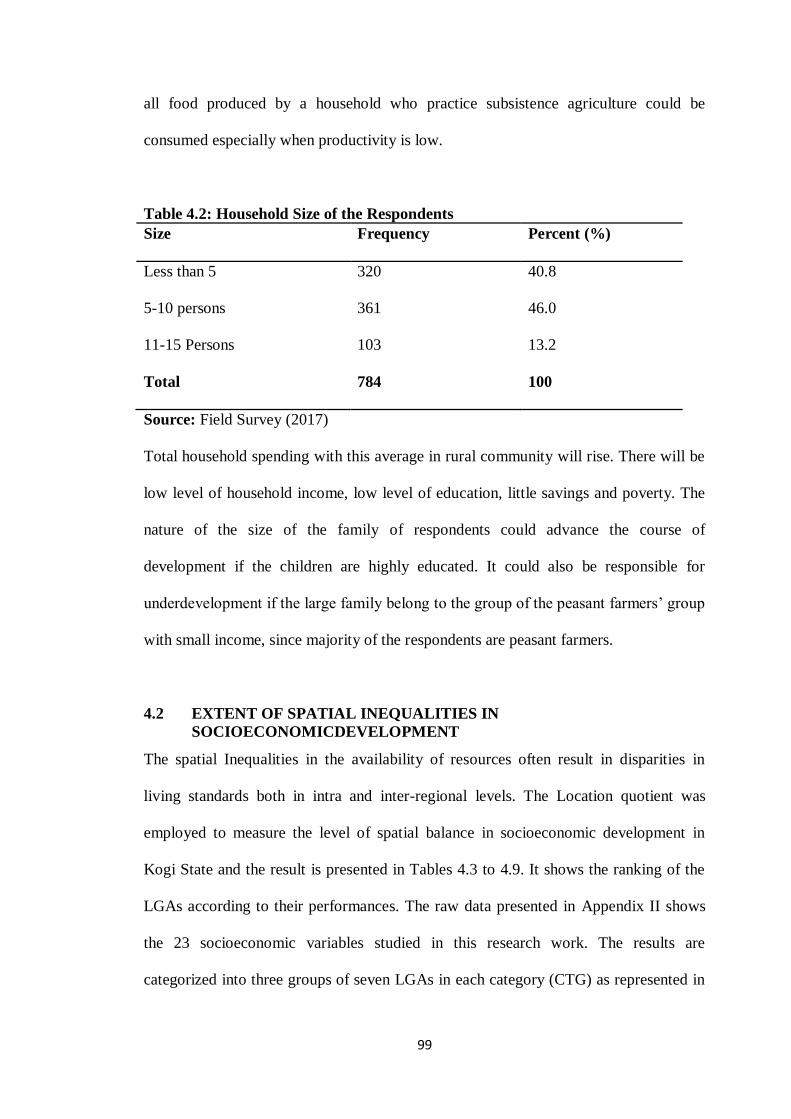
99
all food produced by a household who practice subsistence agriculture could be
consumed especially when productivity is low.
Table 4.2: Household Size of the Respondents
Size Frequency Percent (%)
Less than 5 320 40.8
5-10 persons 361 46.0
11-15 Persons 103 13.2
Total 784 100
Source: Field Survey (2017)
Total household spending with this average in rural community will rise. There will be
low level of household income, low level of education, little savings and poverty. The
nature of the size of the family of respondents could advance the course of
development if the children are highly educated. It could also be responsible for
underdevelopment if the large family belong to the group of the peasant farmers‘ group
with small income, since majority of the respondents are peasant farmers.
4.2 EXTENT OF SPATIAL INEQUALITIES IN
SOCIOECONOMICDEVELOPMENT
The spatial Inequalities in the availability of resources often result in disparities in
living standards both in intra and inter-regional levels. The Location quotient was
employed to measure the level of spatial balance in socioeconomic development in
Kogi State and the result is presented in Tables 4.3 to 4.9. It shows the ranking of the
LGAs according to their performances. The raw data presented in Appendix II shows
the 23 socioeconomic variables studied in this research work. The results are
categorized into three groups of seven LGAs in each category (CTG) as represented in
100
the last column on the tables. The upper third is the most developed, middle third
averagely developed and the bottom third as the least developed LGAs. The Tables
gives comprehensive analysis of the results.
4.2.1 Performance of the LGAs in Each of the Selected Variables
The Tables reveals the spatial distribution of the socioeconomic facilities that
cumulates into development in Kogi state, the variables were analyzed critically one by
one. The facilities under transport and communication variable is presented on Table
4.3
4.2.1.1 Spatial Inequalities in Transport and Communication
The result shows that disparity exists among the LGAs, (Appendix II and Table
4.3). The 21 LGAs is divided into 3 categories (CTG), to make seven in each group.
The first seven LGAs performed better in the facilities ranked and fell under the upper
third in the distribution of transport and communication facilities. In the second group
are the LGAs under the middle third. These LGAs performed moderately well in the
distribution of the facilities; while the last seven LGAs falls under the bottom third in
the ranking which means, these LGAs did not perform well. Figure 4.6 reveals the
pattern of the LQ at a glance.
The study observed that some LGAs like Igalamela and Ajaokuta with low
score in about four facilities still performed averagely well because of the number of
people available to use the facilities. A local government may have ten units of a
particular facility and another LGA have only 3; when computed with the statistical
method used in this research it came out to be that the facility is localized not
proportionately distributed, some facilities have high LQs of 1, which is because of
relatively low population sharing available facilities. It shows clearly that some local
government areas performed better than others both as a result of either low or high
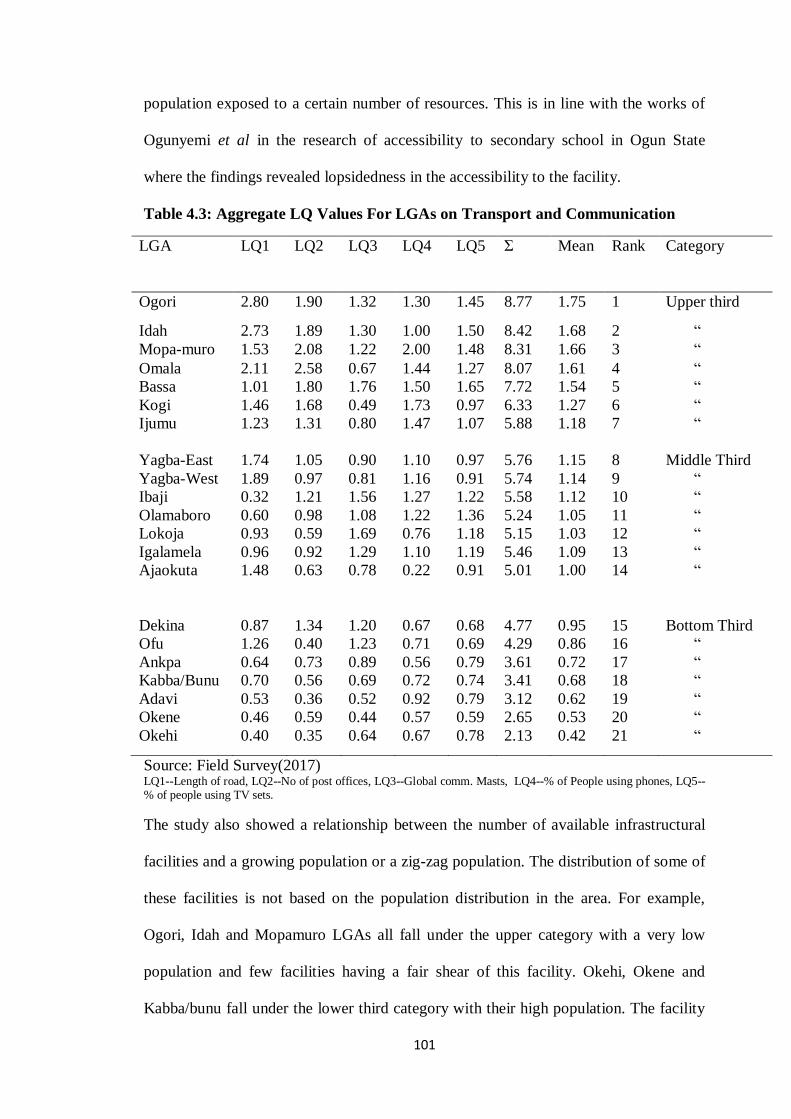
101
population exposed to a certain number of resources. This is in line with the works of
Ogunyemi et al in the research of accessibility to secondary school in Ogun State
where the findings revealed lopsidedness in the accessibility to the facility.
Table 4.3: Aggregate LQ Values For LGAs on Transport and Communication
LGA LQ1 LQ2 LQ3 LQ4 LQ5 Ʃ Mean
Rank Category
Ogori 2.80 1.90 1.32 1.30 1.45 8.77 1.75 1 Upper third
Idah 2.73 1.89 1.30 1.00 1.50 8.42 1.68 2 ―
Mopa-muro 1.53 2.08 1.22 2.00 1.48 8.31 1.66 3 ―
Omala 2.11 2.58 0.67 1.44 1.27 8.07 1.61 4 ―
Bassa 1.01 1.80 1.76 1.50 1.65 7.72 1.54 5 ―
Kogi 1.46 1.68 0.49 1.73 0.97 6.33 1.27 6 ―
Ijumu 1.23 1.31 0.80 1.47 1.07 5.88 1.18 7
―
Yagba-East 1.74 1.05 0.90 1.10 0.97 5.76 1.15 8 Middle Third
Yagba-West 1.89 0.97 0.81 1.16 0.91 5.74 1.14 9 ―
Ibaji 0.32 1.21 1.56 1.27 1.22 5.58 1.12 10 ―
Olamaboro 0.60 0.98 1.08 1.22 1.36 5.24 1.05 11 ―
Lokoja 0.93 0.59 1.69 0.76 1.18 5.15 1.03 12 ―
Igalamela 0.96 0.92 1.29 1.10 1.19 5.46 1.09 13 ―
Ajaokuta 1.48 0.63 0.78 0.22 0.91 5.01 1.00 14
―
Dekina 0.87 1.34 1.20 0.67 0.68 4.77 0.95 15 Bottom Third
Ofu 1.26 0.40 1.23 0.71 0.69 4.29 0.86 16 ―
Ankpa 0.64 0.73 0.89 0.56 0.79 3.61 0.72 17 ―
Kabba/Bunu 0.70 0.56 0.69 0.72 0.74 3.41 0.68 18 ―
Adavi 0.53 0.36 0.52 0.92 0.79 3.12 0.62 19 ―
Okene 0.46 0.59 0.44 0.57 0.59 2.65 0.53 20 ―
Okehi 0.40 0.35 0.64 0.67 0.78 2.13 0.42 21 ―
Source: Field Survey(2017) LQ1--Length of road, LQ2--No of post offices, LQ3--Global comm. Masts, LQ4--% of People using phones, LQ5--% of people using TV sets.
The study also showed a relationship between the number of available infrastructural
facilities and a growing population or a zig-zag population. The distribution of some of
these facilities is not based on the population distribution in the area. For example,
Ogori, Idah and Mopamuro LGAs all fall under the upper category with a very low
population and few facilities having a fair shear of this facility. Okehi, Okene and
Kabba/bunu fall under the lower third category with their high population. The facility
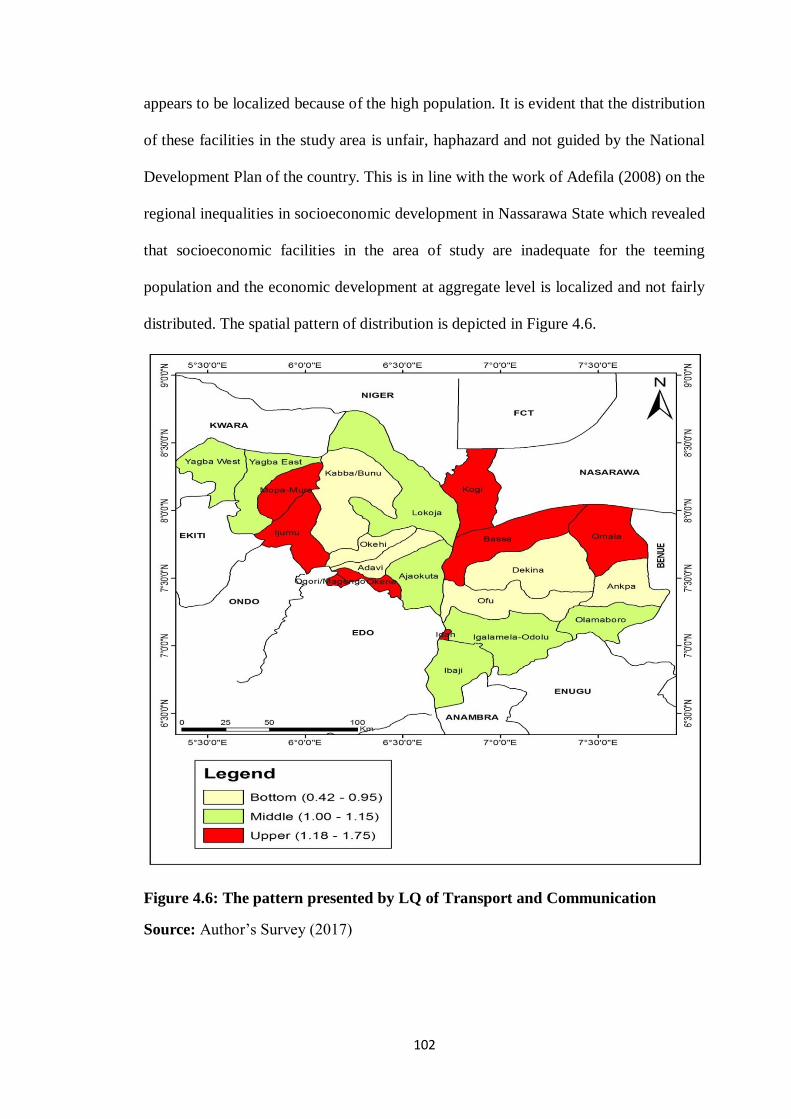
102
appears to be localized because of the high population. It is evident that the distribution
of these facilities in the study area is unfair, haphazard and not guided by the National
Development Plan of the country. This is in line with the work of Adefila (2008) on the
regional inequalities in socioeconomic development in Nassarawa State which revealed
that socioeconomic facilities in the area of study are inadequate for the teeming
population and the economic development at aggregate level is localized and not fairly
distributed. The spatial pattern of distribution is depicted in Figure 4.6.
Figure 4.6: The pattern presented by LQ of Transport and Communication
Source: Author‘s Survey (2017)
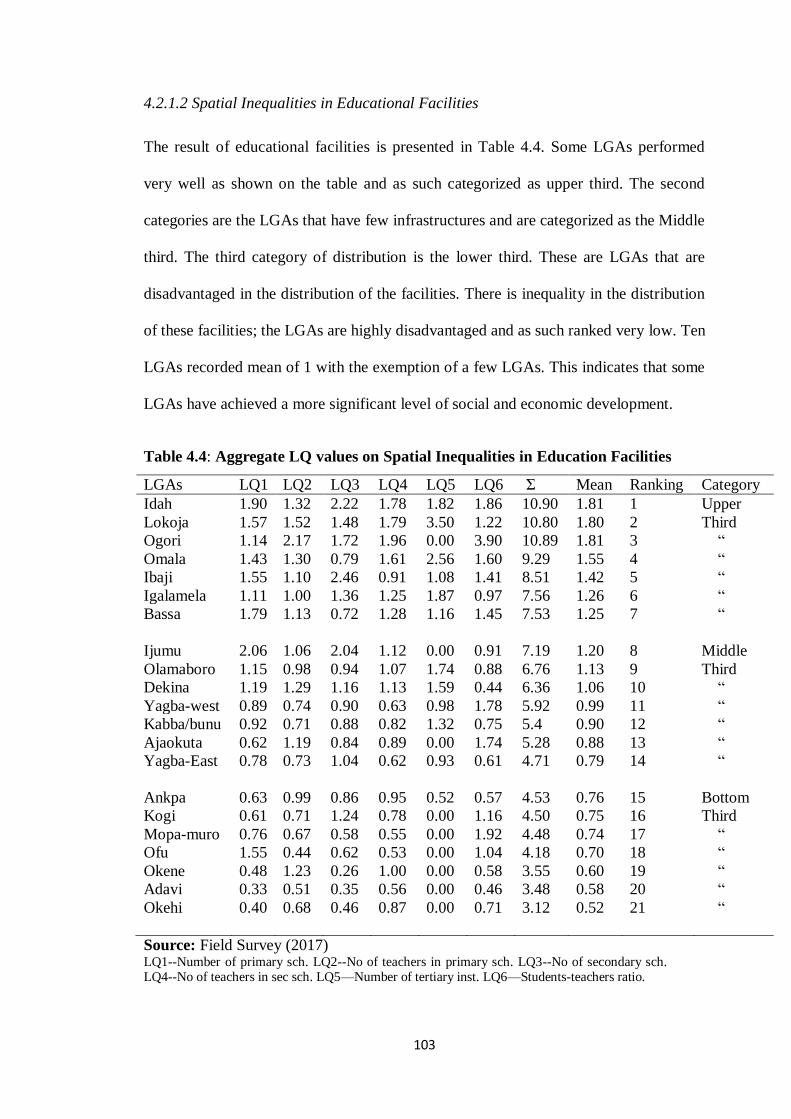
103
4.2.1.2 Spatial Inequalities in Educational Facilities
The result of educational facilities is presented in Table 4.4. Some LGAs performed
very well as shown on the table and as such categorized as upper third. The second
categories are the LGAs that have few infrastructures and are categorized as the Middle
third. The third category of distribution is the lower third. These are LGAs that are
disadvantaged in the distribution of the facilities. There is inequality in the distribution
of these facilities; the LGAs are highly disadvantaged and as such ranked very low. Ten
LGAs recorded mean of 1 with the exemption of a few LGAs. This indicates that some
LGAs have achieved a more significant level of social and economic development.
Table 4.4: Aggregate LQ values on Spatial Inequalities in Education Facilities
LGAs LQ1 LQ2 LQ3 LQ4 LQ5 LQ6 Ʃ Mean Ranking Category
Idah 1.90 1.32 2.22 1.78 1.82 1.86 10.90 1.81 1 Upper
Lokoja 1.57 1.52 1.48 1.79 3.50 1.22 10.80 1.80 2 Third
Ogori 1.14 2.17 1.72 1.96 0.00 3.90 10.89 1.81 3 ―
Omala 1.43 1.30 0.79 1.61 2.56 1.60 9.29 1.55 4 ―
Ibaji 1.55 1.10 2.46 0.91 1.08 1.41 8.51 1.42 5 ―
Igalamela 1.11 1.00 1.36 1.25 1.87 0.97 7.56 1.26 6 ―
Bassa 1.79 1.13 0.72 1.28 1.16 1.45 7.53 1.25 7
―
Ijumu 2.06 1.06 2.04 1.12 0.00 0.91 7.19 1.20 8 Middle
Olamaboro 1.15 0.98 0.94 1.07 1.74 0.88 6.76 1.13 9 Third
Dekina 1.19 1.29 1.16 1.13 1.59 0.44 6.36 1.06 10 ―
Yagba-west 0.89 0.74 0.90 0.63 0.98 1.78 5.92 0.99 11 ―
Kabba/bunu 0.92 0.71 0.88 0.82 1.32 0.75 5.4 0.90 12 ―
Ajaokuta 0.62 1.19 0.84 0.89 0.00 1.74 5.28 0.88 13 ―
Yagba-East 0.78 0.73 1.04 0.62 0.93 0.61 4.71 0.79 14
―
Ankpa 0.63 0.99 0.86 0.95 0.52 0.57 4.53 0.76 15 Bottom
Kogi 0.61 0.71 1.24 0.78 0.00 1.16 4.50 0.75 16 Third
Mopa-muro 0.76 0.67 0.58 0.55 0.00 1.92 4.48 0.74 17 ―
Ofu 1.55 0.44 0.62 0.53 0.00 1.04 4.18 0.70 18 ―
Okene 0.48 1.23 0.26 1.00 0.00 0.58 3.55 0.60 19 ―
Adavi 0.33 0.51 0.35 0.56 0.00 0.46 3.48 0.58 20 ―
Okehi 0.40 0.68 0.46 0.87 0.00 0.71 3.12 0.52 21
―
Source: Field Survey (2017) LQ1--Number of primary sch. LQ2--No of teachers in primary sch. LQ3--No of secondary sch. LQ4--No of teachers in sec sch. LQ5—Number of tertiary inst. LQ6—Students-teachers ratio.
104
The study revealed that huge educational gaps exist within as well as across districts.
Educational inequality is more pronounced in some LGAs than some others in the
study area.Findings of previous studies have shown that education affects the pattern of
employment, income status, housing, food and nutritional status and the overall level of
well-being (Adefila, 2008), the availability of more schools in some part of the study
area than others were seen to have contributed a great deal, to the observed spatial
pattern of socioeconomic development in Kogi State.
It corroborates with the work of Musa and Mohammed (2012) on the spatial
distribution of secondary schools in Bida Town of northcentral Nigeria. The findings of
the work show that spatial inequality exists in the state and that regional disparity has
increased rather than diminish over time. This is true of Kogi state that regional
disparity has increased rather than diminish over time; this is because some LGAs have
been marginalized in the distribution of educational institutions. The pattern depicted is
shown on Figure 4.7. Kogi east senatorial district houses two-third of the institutions as
against the other two senatorial districts according to the study. It is also in line with the
work of Mustapha et al (2015) in the work accessibility to government primary schools
in Ilorin West of Kwara State. Findings of their study showed a random pattern in the
spatial distribution of the schools in the area.
It also corroborates the work of Ogunyemi et al (2014) in the work accessibility to
secondary schools in Ogun State. Their findings revealed inequality in the accessibility
to schools in the area.
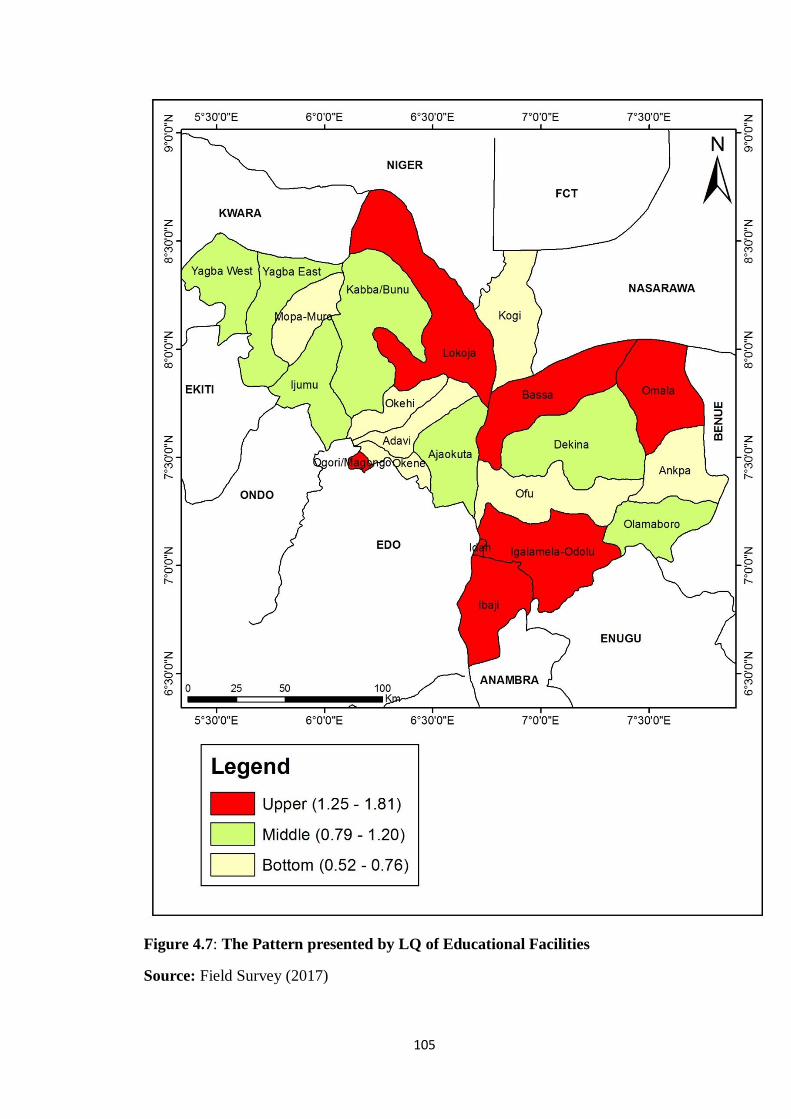
105
Figure 4.7: The Pattern presented by LQ of Educational Facilities
Source: Field Survey (2017)
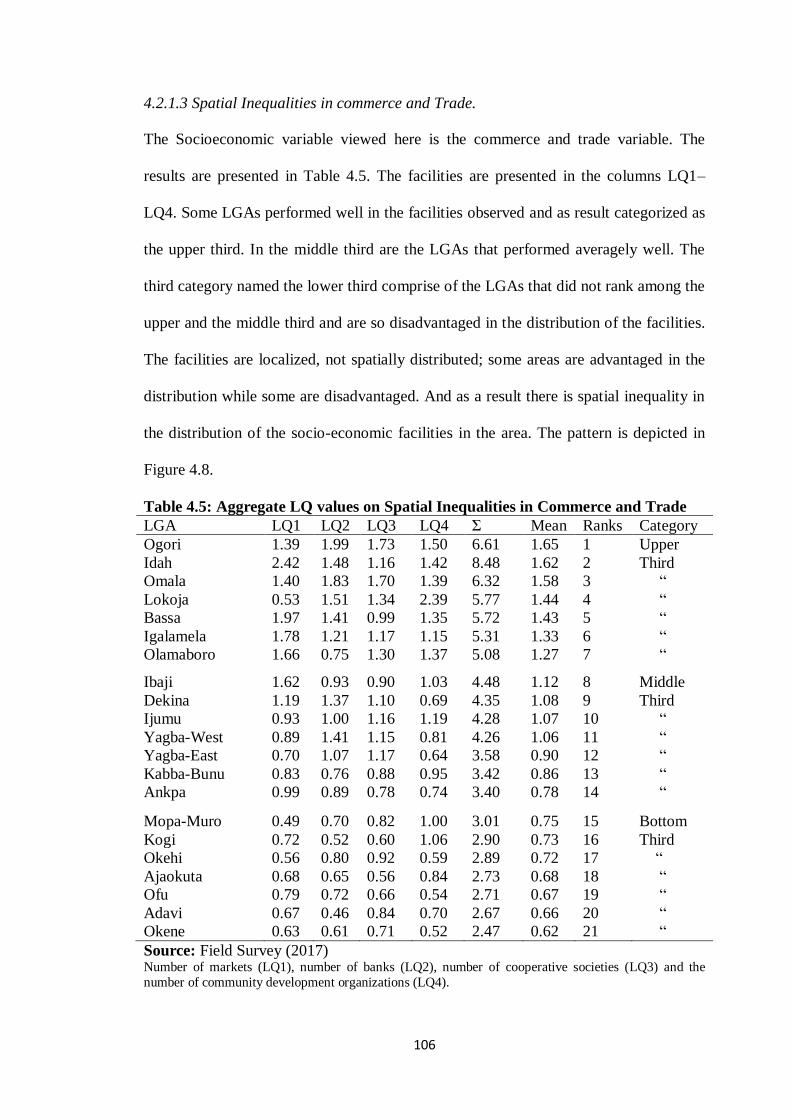
106
4.2.1.3 Spatial Inequalities in commerce and Trade.
The Socioeconomic variable viewed here is the commerce and trade variable. The
results are presented in Table 4.5. The facilities are presented in the columns LQ1–
LQ4. Some LGAs performed well in the facilities observed and as result categorized as
the upper third. In the middle third are the LGAs that performed averagely well. The
third category named the lower third comprise of the LGAs that did not rank among the
upper and the middle third and are so disadvantaged in the distribution of the facilities.
The facilities are localized, not spatially distributed; some areas are advantaged in the
distribution while some are disadvantaged. And as a result there is spatial inequality in
the distribution of the socio-economic facilities in the area. The pattern is depicted in
Figure 4.8.
Table 4.5: Aggregate LQ values on Spatial Inequalities in Commerce and Trade
LGA LQ1 LQ2 LQ3 LQ4 Ʃ Mean Ranks Category
Ogori 1.39 1.99 1.73 1.50 6.61 1.65 1 Upper
Idah 2.42 1.48 1.16 1.42 8.48 1.62 2 Third
Omala 1.40 1.83 1.70 1.39 6.32 1.58 3 ―
Lokoja 0.53 1.51 1.34 2.39 5.77 1.44 4 ―
Bassa 1.97 1.41 0.99 1.35 5.72 1.43 5 ―
Igalamela 1.78 1.21 1.17 1.15 5.31 1.33 6 ―
Olamaboro 1.66 0.75 1.30 1.37 5.08 1.27 7
―
Ibaji 1.62 0.93 0.90 1.03 4.48 1.12 8 Middle
Dekina 1.19 1.37 1.10 0.69 4.35 1.08 9 Third
Ijumu 0.93 1.00 1.16 1.19 4.28 1.07 10 ―
Yagba-West 0.89 1.41 1.15 0.81 4.26 1.06 11 ―
Yagba-East 0.70 1.07 1.17 0.64 3.58 0.90 12 ―
Kabba-Bunu 0.83 0.76 0.88 0.95 3.42 0.86 13 ―
Ankpa 0.99 0.89 0.78 0.74 3.40 0.78 14
―
Mopa-Muro 0.49 0.70 0.82 1.00 3.01 0.75 15 Bottom
Kogi 0.72 0.52 0.60 1.06 2.90 0.73 16 Third
Okehi 0.56 0.80 0.92 0.59 2.89 0.72 17 ―
Ajaokuta 0.68 0.65 0.56 0.84 2.73 0.68 18 ―
Ofu 0.79 0.72 0.66 0.54 2.71 0.67 19 ―
Adavi 0.67 0.46 0.84 0.70 2.67 0.66 20 ―
Okene 0.63 0.61 0.71 0.52 2.47 0.62 21 ―
Source: Field Survey (2017) Number of markets (LQ1), number of banks (LQ2), number of cooperative societies (LQ3) and the
number of community development organizations (LQ4).
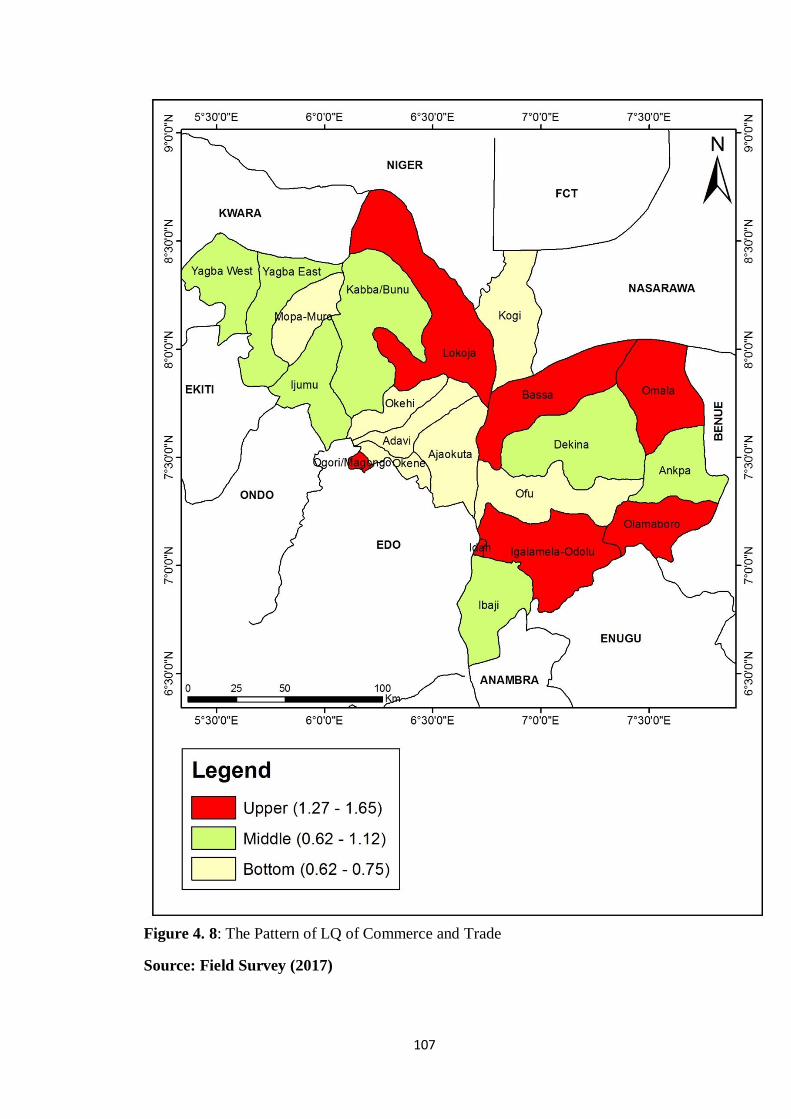
107
Figure 4. 8: The Pattern of LQ of Commerce and Trade
Source: Field Survey (2017)
108
This indicates that some LGAs have achieved a significant level of social and economic
development than others in this particular facility. Lokoja, the State capital did not even
rank among the LGAs that achieved the significant level. This may be among other
reasons that there is a very high population competing for the available resources. In
the number of banks in the study area, ten LGAs recorded fair distribution. In this
facility, some LGAs achieved a more significant level of social and economic
development than others. In the number of cooperative societies, eleven LGAs recorded
fair share while ten LGAs performed just better. The LGAs performed fairly well since
more than half of them have LQs 1 indicating a fair distribution of the facility. Another
facility under this variable is the number of community development organizations.
Under this facility, eleven LGAs have LQs of 1 showing that they performed well. Ten
LGAs have their LQs less than 1 and as such did not perform well in the facility.
Generally, in this socioeconomic variable, eleven LGAs have LQs of one and above.
The table also revealed that some facilities are not equitably distributed; there is a
degree of localization in the distribution of the facilities. This is in agreement with the
work of Akpan (2000) in Akwa Ibom state which established that significant
differences exist in level of development among the administrative units of Akwa Ibom
state which is categorized into three classes as the developed, fairly developed and the
disadvantaged. The distribution of these facilities in the study area (Kogi State) reveals
an inequality in the distribution of the facilities. Commerce and trade in this study have
contributed to the observed spatial pattern of socioeconomic development in the State.
4.2.1.4 Spatial Inequalities in Health care Facilities
Table 4.6 shows the result of the study with five facilities represented in five columns.
The resulst of these facilities are represented with LQ1 – LQ5 in the column. In the first
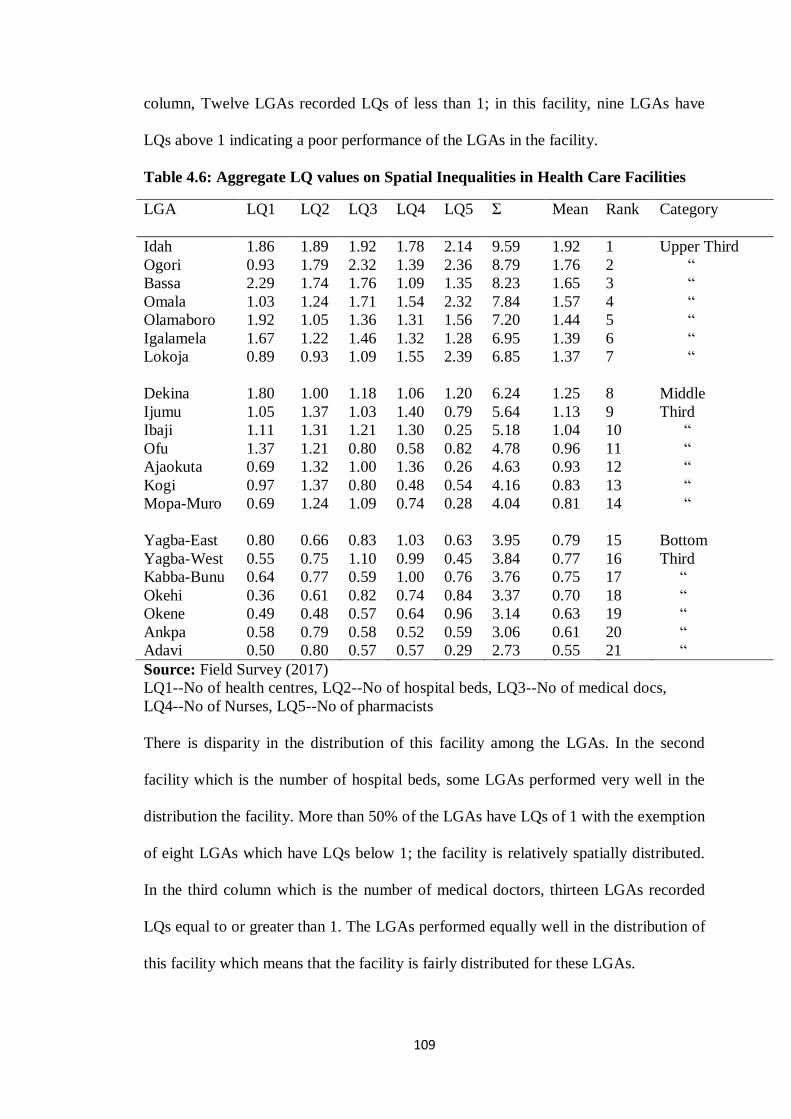
109
column, Twelve LGAs recorded LQs of less than 1; in this facility, nine LGAs have
LQs above 1 indicating a poor performance of the LGAs in the facility.
Table 4.6: Aggregate LQ values on Spatial Inequalities in Health Care Facilities
LGA LQ1 LQ2 LQ3 LQ4 LQ5 Ʃ Mean
Rank Category
Idah 1.86 1.89 1.92 1.78 2.14 9.59 1.92 1 Upper Third
Ogori 0.93 1.79 2.32 1.39 2.36 8.79 1.76 2 ―
Bassa 2.29 1.74 1.76 1.09 1.35 8.23 1.65 3 ―
Omala 1.03 1.24 1.71 1.54 2.32 7.84 1.57 4 ―
Olamaboro 1.92 1.05 1.36 1.31 1.56 7.20 1.44 5 ―
Igalamela 1.67 1.22 1.46 1.32 1.28 6.95 1.39 6 ―
Lokoja 0.89 0.93 1.09 1.55 2.39 6.85 1.37 7
―
Dekina 1.80 1.00 1.18 1.06 1.20 6.24 1.25 8 Middle
Ijumu 1.05 1.37 1.03 1.40 0.79 5.64 1.13 9 Third
Ibaji 1.11 1.31 1.21 1.30 0.25 5.18 1.04 10 ―
Ofu 1.37 1.21 0.80 0.58 0.82 4.78 0.96 11 ―
Ajaokuta 0.69 1.32 1.00 1.36 0.26 4.63 0.93 12 ―
Kogi 0.97 1.37 0.80 0.48 0.54 4.16 0.83 13 ―
Mopa-Muro 0.69 1.24 1.09 0.74 0.28 4.04 0.81 14
―
Yagba-East 0.80 0.66 0.83 1.03 0.63 3.95 0.79 15 Bottom
Yagba-West 0.55 0.75 1.10 0.99 0.45 3.84 0.77 16 Third
Kabba-Bunu 0.64 0.77 0.59 1.00 0.76 3.76 0.75 17 ―
Okehi 0.36 0.61 0.82 0.74 0.84 3.37 0.70 18 ―
Okene 0.49 0.48 0.57 0.64 0.96 3.14 0.63 19 ―
Ankpa 0.58 0.79 0.58 0.52 0.59 3.06 0.61 20 ―
Adavi 0.50 0.80 0.57 0.57 0.29 2.73 0.55 21 ―
Source: Field Survey (2017)
LQ1--No of health centres, LQ2--No of hospital beds, LQ3--No of medical docs,
LQ4--No of Nurses, LQ5--No of pharmacists
There is disparity in the distribution of this facility among the LGAs. In the second
facility which is the number of hospital beds, some LGAs performed very well in the
distribution the facility. More than 50% of the LGAs have LQs of 1 with the exemption
of eight LGAs which have LQs below 1; the facility is relatively spatially distributed.
In the third column which is the number of medical doctors, thirteen LGAs recorded
LQs equal to or greater than 1. The LGAs performed equally well in the distribution of
this facility which means that the facility is fairly distributed for these LGAs.
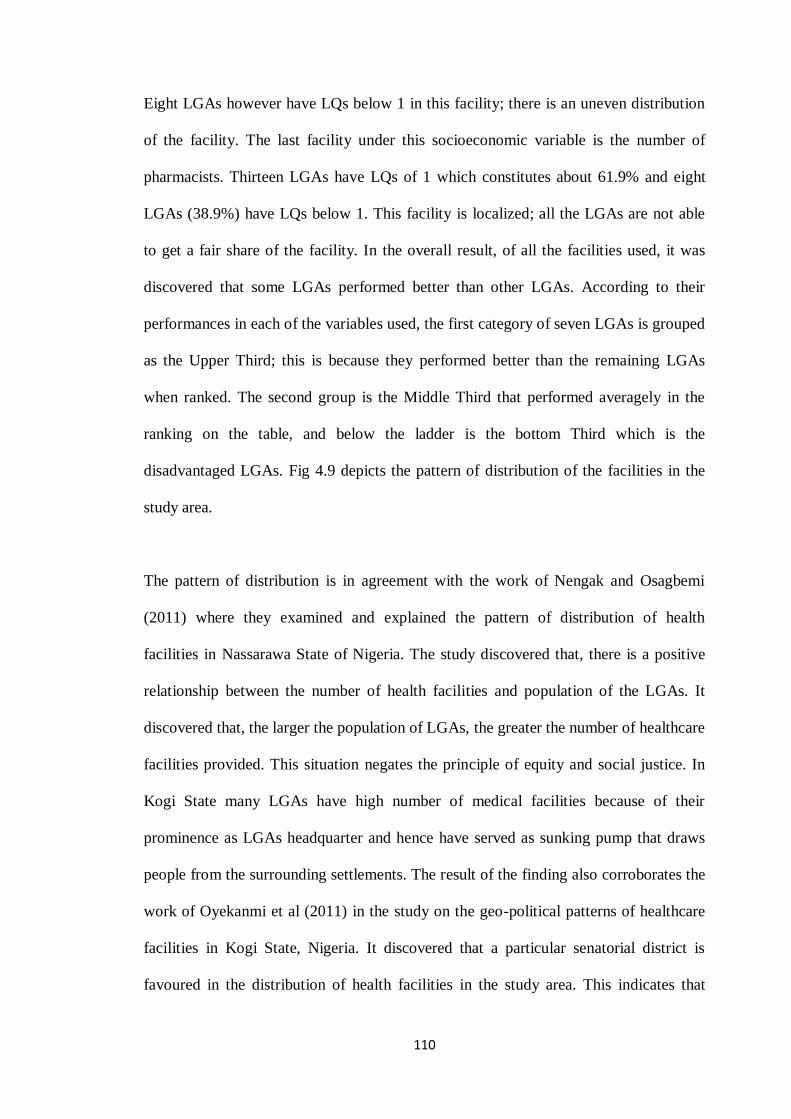
110
Eight LGAs however have LQs below 1 in this facility; there is an uneven distribution
of the facility. The last facility under this socioeconomic variable is the number of
pharmacists. Thirteen LGAs have LQs of 1 which constitutes about 61.9% and eight
LGAs (38.9%) have LQs below 1. This facility is localized; all the LGAs are not able
to get a fair share of the facility. In the overall result, of all the facilities used, it was
discovered that some LGAs performed better than other LGAs. According to their
performances in each of the variables used, the first category of seven LGAs is grouped
as the Upper Third; this is because they performed better than the remaining LGAs
when ranked. The second group is the Middle Third that performed averagely in the
ranking on the table, and below the ladder is the bottom Third which is the
disadvantaged LGAs. Fig 4.9 depicts the pattern of distribution of the facilities in the
study area.
The pattern of distribution is in agreement with the work of Nengak and Osagbemi
(2011) where they examined and explained the pattern of distribution of health
facilities in Nassarawa State of Nigeria. The study discovered that, there is a positive
relationship between the number of health facilities and population of the LGAs. It
discovered that, the larger the population of LGAs, the greater the number of healthcare
facilities provided. This situation negates the principle of equity and social justice. In
Kogi State many LGAs have high number of medical facilities because of their
prominence as LGAs headquarter and hence have served as sunking pump that draws
people from the surrounding settlements. The result of the finding also corroborates the
work of Oyekanmi et al (2011) in the study on the geo-political patterns of healthcare
facilities in Kogi State, Nigeria. It discovered that a particular senatorial district is
favoured in the distribution of health facilities in the study area. This indicates that
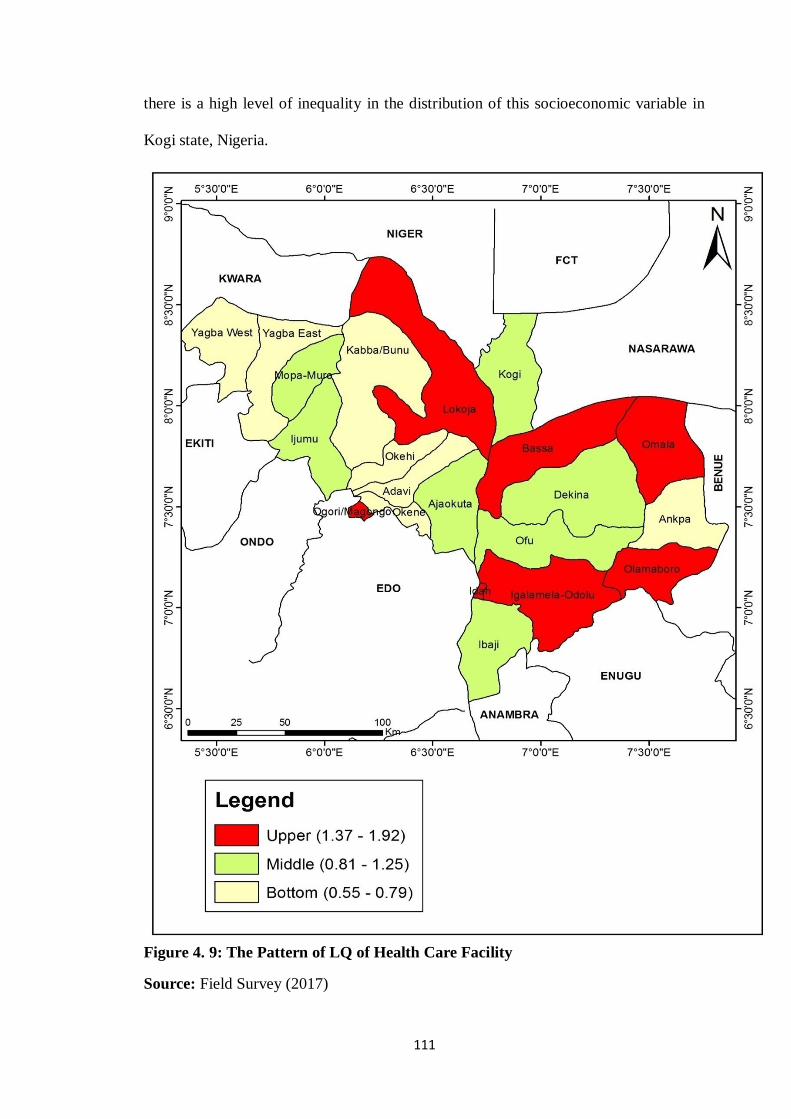
111
there is a high level of inequality in the distribution of this socioeconomic variable in
Kogi state, Nigeria.
Figure 4. 9: The Pattern of LQ of Health Care Facility
Source: Field Survey (2017)
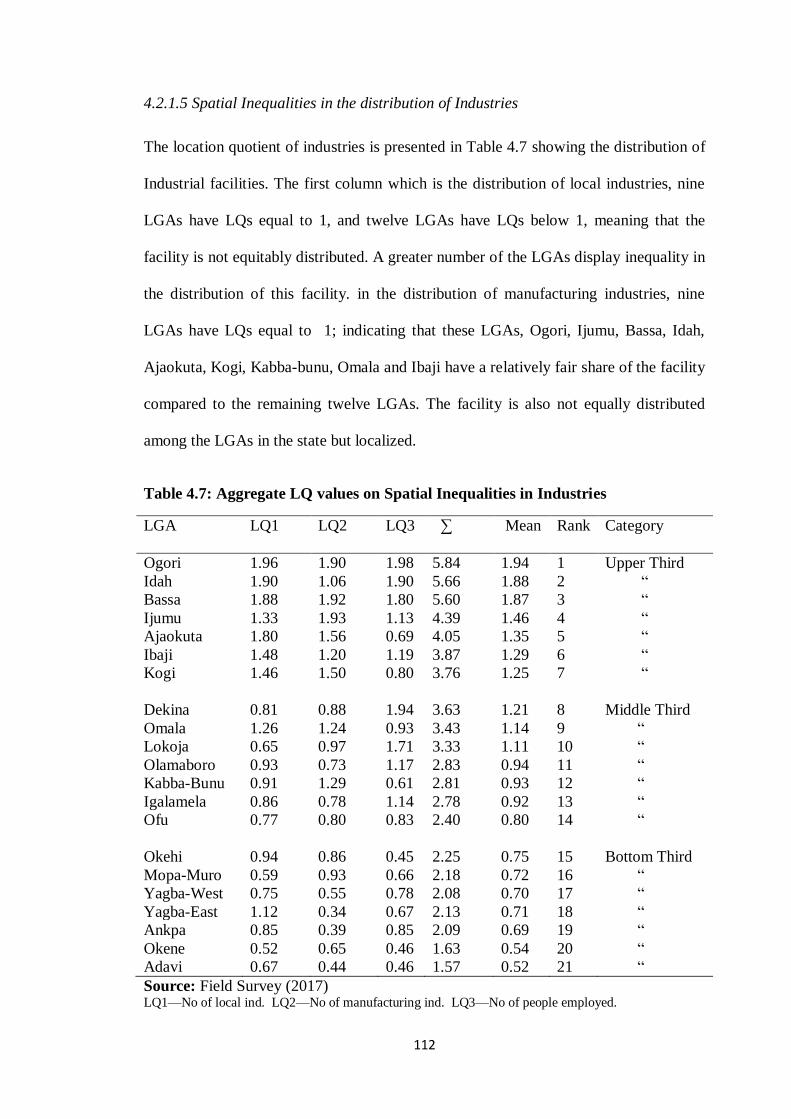
112
4.2.1.5 Spatial Inequalities in the distribution of Industries
The location quotient of industries is presented in Table 4.7 showing the distribution of
Industrial facilities. The first column which is the distribution of local industries, nine
LGAs have LQs equal to 1, and twelve LGAs have LQs below 1, meaning that the
facility is not equitably distributed. A greater number of the LGAs display inequality in
the distribution of this facility. in the distribution of manufacturing industries, nine
LGAs have LQs equal to 1; indicating that these LGAs, Ogori, Ijumu, Bassa, Idah,
Ajaokuta, Kogi, Kabba-bunu, Omala and Ibaji have a relatively fair share of the facility
compared to the remaining twelve LGAs. The facility is also not equally distributed
among the LGAs in the state but localized.
Table 4.7: Aggregate LQ values on Spatial Inequalities in Industries
LGA LQ1 LQ2 LQ3 ∑
Mean Rank Category
Ogori 1.96 1.90 1.98 5.84 1.94 1 Upper Third
Idah 1.90 1.06 1.90 5.66 1.88 2 ―
Bassa 1.88 1.92 1.80 5.60 1.87 3 ―
Ijumu 1.33 1.93 1.13 4.39 1.46 4 ―
Ajaokuta 1.80 1.56 0.69 4.05 1.35 5 ―
Ibaji 1.48 1.20 1.19 3.87 1.29 6 ―
Kogi 1.46 1.50 0.80 3.76 1.25 7
―
Dekina 0.81 0.88 1.94 3.63 1.21 8 Middle Third
Omala 1.26 1.24 0.93 3.43 1.14 9 ―
Lokoja 0.65 0.97 1.71 3.33 1.11 10 ―
Olamaboro 0.93 0.73 1.17 2.83 0.94 11 ―
Kabba-Bunu 0.91 1.29 0.61 2.81 0.93 12 ―
Igalamela 0.86 0.78 1.14 2.78 0.92 13 ―
Ofu 0.77 0.80 0.83 2.40 0.80 14
―
Okehi 0.94 0.86 0.45 2.25 0.75 15 Bottom Third
Mopa-Muro 0.59 0.93 0.66 2.18 0.72 16 ―
Yagba-West 0.75 0.55 0.78 2.08 0.70 17 ―
Yagba-East 1.12 0.34 0.67 2.13 0.71 18 ―
Ankpa 0.85 0.39 0.85 2.09 0.69 19 ―
Okene 0.52 0.65 0.46 1.63 0.54 20 ―
Adavi 0.67 0.44 0.46 1.57 0.52 21 ―
Source: Field Survey (2017) LQ1—No of local ind. LQ2—No of manufacturing ind. LQ3—No of people employed.
113
The findings on the number of people employed in the various industries as presented
on the table, shows that nine LGAs have LQs equal to1. This indicates that these LGAs
are advantaged in the distribution of this facility. The most advantaged LGAs are Ogori
with a mean of 1.94, Idah with a mean of 1.88 and Bassa with a mean of 1.87. Twelve
LGAs are disadvantaged because they have LQs below 1, these include among others
LGAs like Adavi with a mean of 0.52, Okene with a mean of 0.54 and Ankpa with a
mean of 0.69. There is disparity in the distribution of this facility, and the finding in
this facility indicates that the facility is highly localized. There is great disparity in the
distribution of the facility.
The study also found out that, some LGAs ranked very high than others. The mean of
the LQs was calculated, and it allowed the LGAs to be categorized into three main
groups of seven LGAs per group according to their level of performance in the ranking.
These groups include the upper third with LQ ranging between 1.94 to 1.25, the middle
third with LQ ranging between 1.21 to 0.80 and the bottom third with LQ ranging from
0.75 to 0.52; under this socioeconomic variable, the LGAs that performed better and
are in the upper third have achieved a reasonable level of performance in the facilities
than the other LGAs. The second group which is the middle third includes LGAs that
performed averagely like Dekina, Omala and others; the facilities are not well
distributed and therefore have more LGAs with mean value that is less than one.
The LGAs in the third CTG are classified as the bottom third; this is because they did
not achieve a high level performance in the overall facilities. LGAs in this category
include Okehi, Mopamuro and Adavi.The implication of this is that, there will be a
high level of unemployment in these LGAs since the facility is about industries.
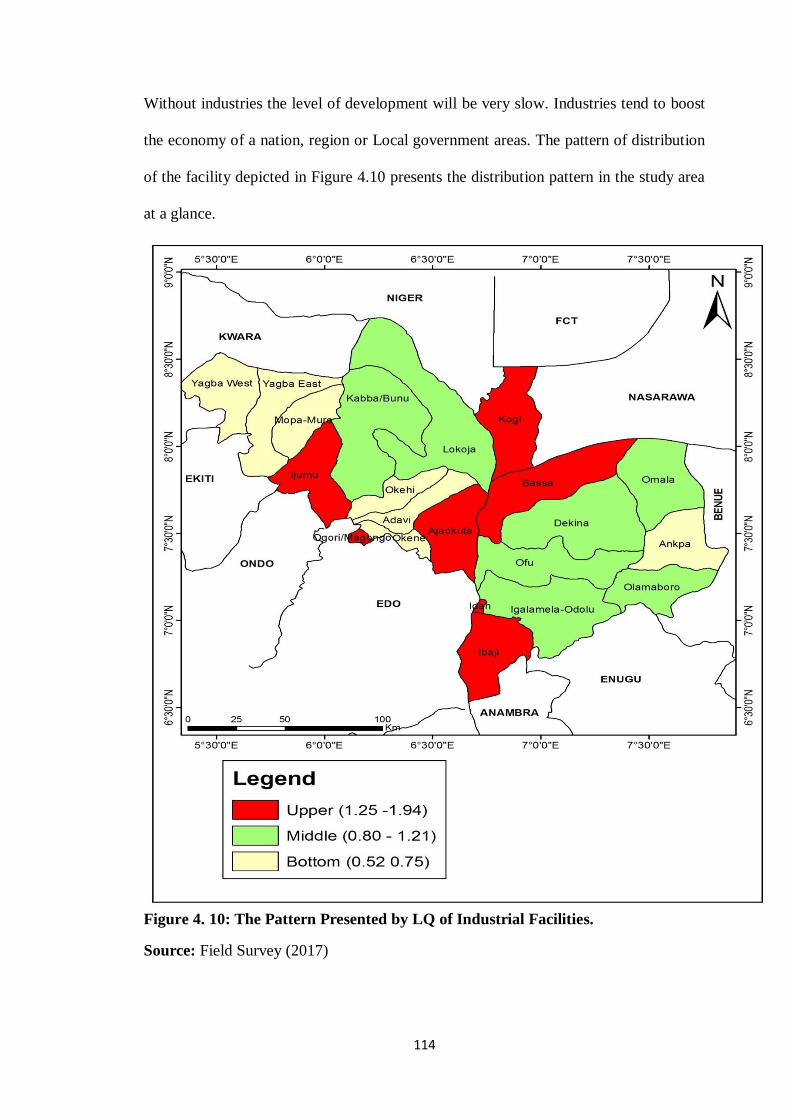
114
Without industries the level of development will be very slow. Industries tend to boost
the economy of a nation, region or Local government areas. The pattern of distribution
of the facility depicted in Figure 4.10 presents the distribution pattern in the study area
at a glance.
Figure 4. 10: The Pattern Presented by LQ of Industrial Facilities.
Source: Field Survey (2017)
115
4.3 COMPARATIVE ANALYSIS OF SOCIOECONOMIC
DEVELOPMENTIN KOGI STATE
Spatial inequalities of socioeconomic development variables in Kogi State as presented
in Table 4.8 and Figure 4.10 shows a clearer picture of the distribution of these
facilities. In this combined ranking, the lower the sum of the variables, the better for the
LGA. The study reveals disparity in the distribution of facilities among the LGAs
showing the leading LGAs to be Idah, Ogori, Bassa, Lokoja, Omala, Igalamela and
Olamaboro in the first category. These LGAs appeared at the top of the development
ladder in the distribution of the facilities and are advantaged over the remaining LGAs.
The seven leading LGAs account for 47.3% of the total score. In the State, there is a
significant degree of inequality in levels of development among the LGAs.
This finding is in agreement with earlier studies like those of Tari and Iteimowei (2017)
who examined the source of income inequality in Kogi State using wages and salaries.
Their study revealed that inequality increases with level of income. Habibu et al (2014)
also confirmed inequality in education attainment in Nigeria in the study, regional
inequality of educational attainment in Nigeria. The study used theil index and
decomposition analysis and found out that inequality exists within regions rather than
between regions. The study of Hafiz et al (2016) also confirmed inequality in the
distribution of government secondary schools in Giwa Zone of Kaduna State, Nigeria.
The study using Buffer and overlay analyses revealed that 80% of the secondary
schools are concentrated in the northeastern part the area. These studies show that
large disparities exist in the economic development dimensions. Some LGAs in Kogi
State are either geographically advantaged or disadvantaged as a consequence of
uneven impact of nature, trade, government policies and others. There is also an
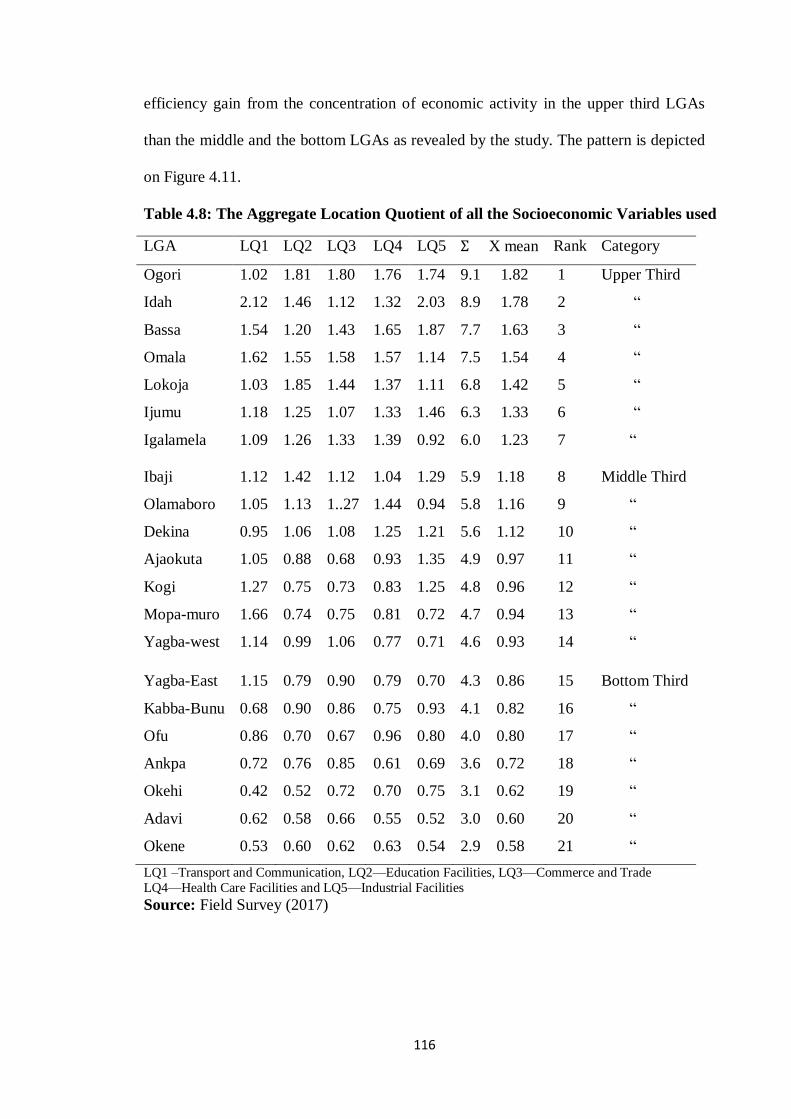
116
efficiency gain from the concentration of economic activity in the upper third LGAs
than the middle and the bottom LGAs as revealed by the study. The pattern is depicted
on Figure 4.11.
Table 4.8: The Aggregate Location Quotient of all the Socioeconomic Variables used
LGA LQ1 LQ2 LQ3 LQ4 LQ5 Ʃ X mean Rank Category
Ogori 1.02 1.81 1.80 1.76 1.74 9.1 1.82 1 Upper Third
Idah 2.12 1.46 1.12 1.32 2.03 8.9 1.78 2 ―
Bassa 1.54 1.20 1.43 1.65 1.87 7.7 1.63 3 ―
Omala 1.62 1.55 1.58 1.57 1.14 7.5 1.54 4 ―
Lokoja 1.03 1.85 1.44 1.37 1.11 6.8 1.42 5 ―
Ijumu 1.18 1.25 1.07 1.33 1.46 6.3 1.33 6 ―
Igalamela 1.09 1.26 1.33 1.39 0.92 6.0 1.23 7
―
Ibaji 1.12 1.42 1.12 1.04 1.29 5.9 1.18 8 Middle Third
Olamaboro 1.05 1.13 1..27 1.44 0.94 5.8 1.16 9 ―
Dekina 0.95 1.06 1.08 1.25 1.21 5.6 1.12 10 ―
Ajaokuta 1.05 0.88 0.68 0.93 1.35 4.9 0.97 11 ―
Kogi 1.27 0.75 0.73 0.83 1.25 4.8 0.96 12 ―
Mopa-muro 1.66 0.74 0.75 0.81 0.72 4.7 0.94 13 ―
Yagba-west 1.14 0.99 1.06 0.77 0.71 4.6 0.93 14
―
Yagba-East 1.15 0.79 0.90 0.79 0.70 4.3 0.86 15 Bottom Third
Kabba-Bunu 0.68 0.90 0.86 0.75 0.93 4.1 0.82 16 ―
Ofu 0.86 0.70 0.67 0.96 0.80 4.0 0.80 17 ―
Ankpa 0.72 0.76 0.85 0.61 0.69 3.6 0.72 18 ―
Okehi 0.42 0.52 0.72 0.70 0.75 3.1 0.62 19 ―
Adavi 0.62 0.58 0.66 0.55 0.52 3.0 0.60 20 ―
Okene 0.53 0.60 0.62 0.63 0.54 2.9 0.58 21 ―
LQ1 –Transport and Communication, LQ2—Education Facilities, LQ3—Commerce and Trade
LQ4—Health Care Facilities and LQ5—Industrial Facilities
Source: Field Survey (2017)
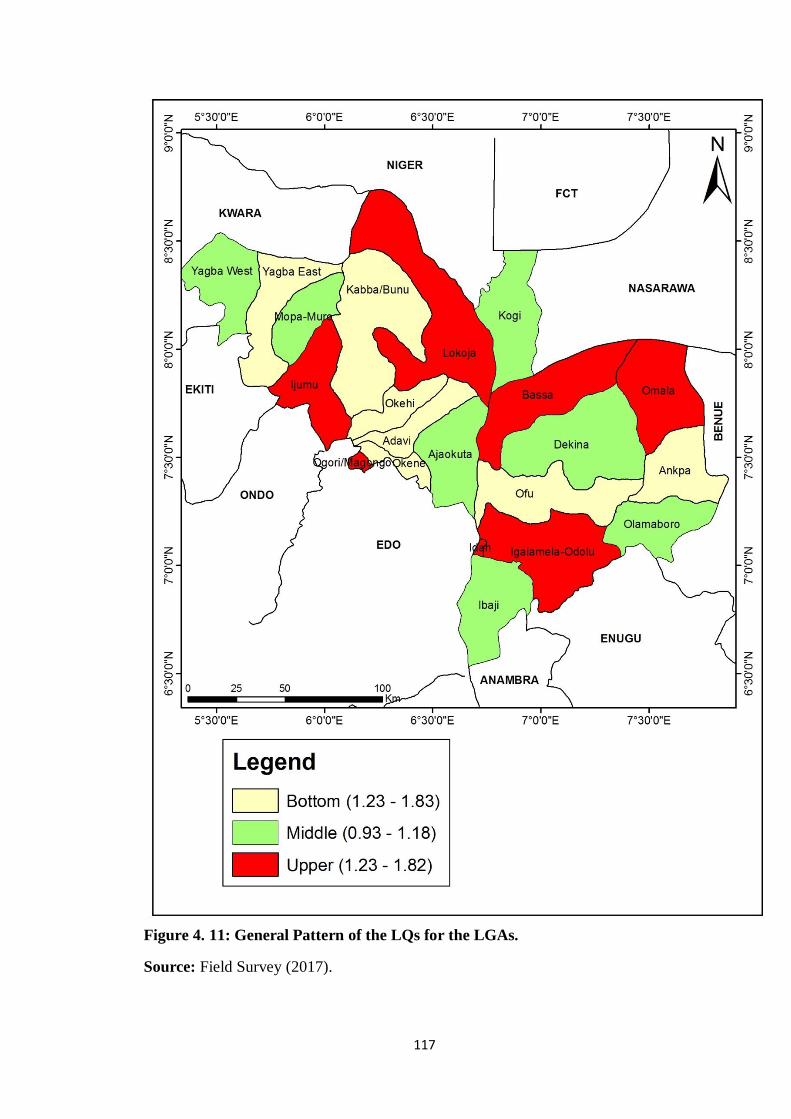
117
Figure 4. 11: General Pattern of the LQs for the LGAs.
Source: Field Survey (2017).
118
4.4 SPATIAL PATTERN OF SOCIOECONOMIC DEVELOPMENT
The study examined the pattern of socioeconomic development in the study area. The
standardized scores of the entire variable are presented in Tables below. Five major
variables selected for the study are; transport and communication, education, commerce
and trade, health care and industries as indicators of socioeconomic development. All
the variables in this study are treated equally, that is they have a weight of unity as far
as the study area is concerned. The data was also subjected to hypothesis testing to
know the extent of inequality. The data for the analysis is presented in Appendix II.
4.4.1 Inequalities in Transport and Communication Facilities
This criterion is presented in Table 4.10. It shows the data matrix in respect of
standardized score values for the state. It revealed that in kogi state, eight (38.1%) of
the local government areas (LGAs) have positive scores and are advantaged and the
remaining thirteen (69.1%) are at disadvantaged which is categorized as the middle and
the bottom third (column 7). The scores of the LGAs in the advantaged category, which
is categorized as the upper third ranged from 1.51 to 0.26 in a descending order. The
reasons for this may be due to factors ranging from natural to economic and to political.
Some LGAs like Dekina, Ofu, Ankpa, Olamaboro Idah and Bassa performed better
than others by reason of the advantage they have as a result of their natural
environment, having economic trees that generates other multiplier effects, their
population size and some as a result of their influence in politics. In the middle
category are LGAs which performed averagely in the socio-economic variable used as
indicated on the table.The disadvantaged category is classified as the bottom third
which ranges from -1.3 to -4.2. This division is depicted in Figure 4.12. Lokoja which
is the State‘s capital and a Local government headquarter is not the most privileged in
this dimension as one will expect. This is so because of the population that has to share
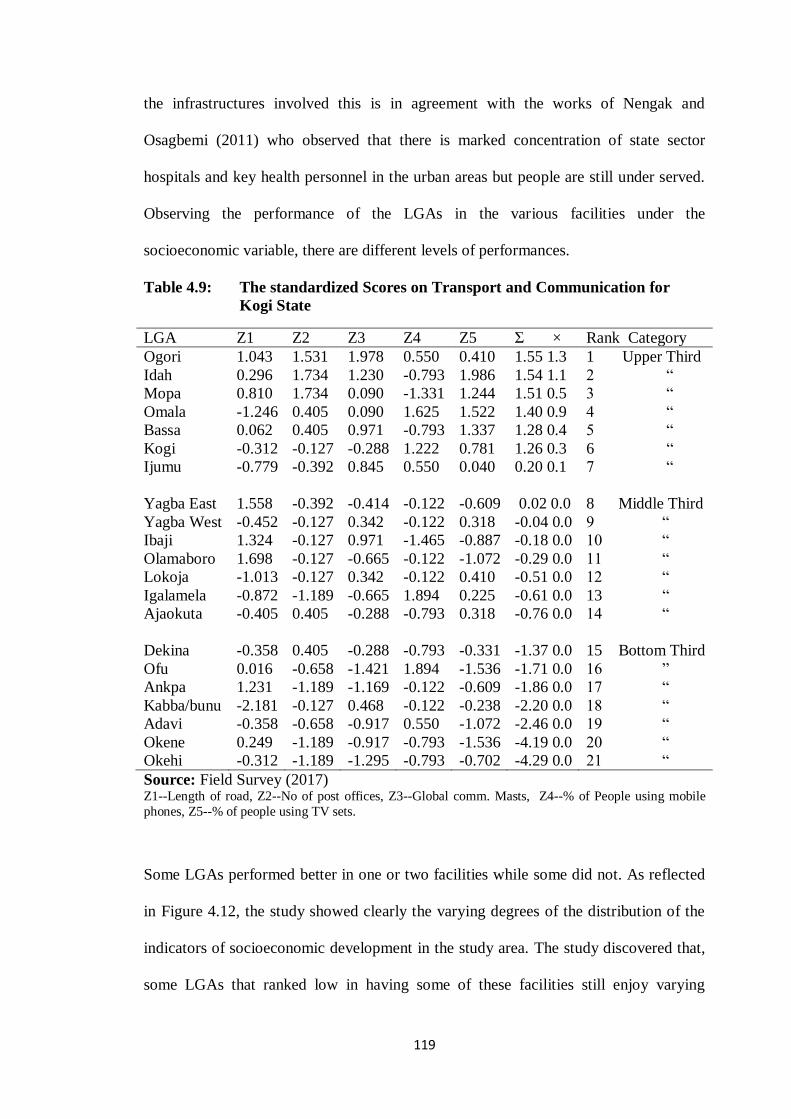
119
the infrastructures involved this is in agreement with the works of Nengak and
Osagbemi (2011) who observed that there is marked concentration of state sector
hospitals and key health personnel in the urban areas but people are still under served.
Observing the performance of the LGAs in the various facilities under the
socioeconomic variable, there are different levels of performances.
Table 4.9: The standardized Scores on Transport and Communication for
Kogi State
LGA Z1 Z2 Z3 Z4 Z5 Ʃ × Rank Category
Ogori 1.043 1.531 1.978 0.550 0.410 1.55 1.3 1 Upper Third
Idah 0.296 1.734 1.230 -0.793 1.986 1.54 1.1 2 ―
Mopa 0.810 1.734 0.090 -1.331 1.244 1.51 0.5 3 ―
Omala -1.246 0.405 0.090 1.625 1.522 1.40 0.9 4 ―
Bassa 0.062 0.405 0.971 -0.793 1.337 1.28 0.4 5 ―
Kogi -0.312 -0.127 -0.288 1.222 0.781 1.26 0.3 6 ―
Ijumu -0.779 -0.392 0.845 0.550 0.040 0.20 0.1 7 ―
Yagba East 1.558 -0.392 -0.414 -0.122 -0.609 0.02 0.0 8 Middle Third
Yagba West -0.452 -0.127 0.342 -0.122 0.318 -0.04 0.0 9 ―
Ibaji 1.324 -0.127 0.971 -1.465 -0.887 -0.18 0.0 10 ―
Olamaboro 1.698 -0.127 -0.665 -0.122 -1.072 -0.29 0.0 11 ―
Lokoja -1.013 -0.127 0.342 -0.122 0.410 -0.51 0.0 12 ―
Igalamela -0.872 -1.189 -0.665 1.894 0.225 -0.61 0.0 13 ―
Ajaokuta -0.405 0.405 -0.288 -0.793 0.318 -0.76 0.0 14 ―
Dekina -0.358 0.405 -0.288 -0.793 -0.331 -1.37 0.0 15 Bottom Third
Ofu 0.016 -0.658 -1.421 1.894 -1.536 -1.71 0.0 16 ‖
Ankpa 1.231 -1.189 -1.169 -0.122 -0.609 -1.86 0.0 17 ―
Kabba/bunu -2.181 -0.127 0.468 -0.122 -0.238 -2.20 0.0 18 ―
Adavi -0.358 -0.658 -0.917 0.550 -1.072 -2.46 0.0 19 ―
Okene 0.249 -1.189 -0.917 -0.793 -1.536 -4.19 0.0 20 ―
Okehi -0.312 -1.189 -1.295 -0.793 -0.702 -4.29 0.0 21 ―
Source: Field Survey (2017) Z1--Length of road, Z2--No of post offices, Z3--Global comm. Masts, Z4--% of People using mobile
phones, Z5--% of people using TV sets.
Some LGAs performed better in one or two facilities while some did not. As reflected
in Figure 4.12, the study showed clearly the varying degrees of the distribution of the
indicators of socioeconomic development in the study area. The study discovered that,
some LGAs that ranked low in having some of these facilities still enjoy varying
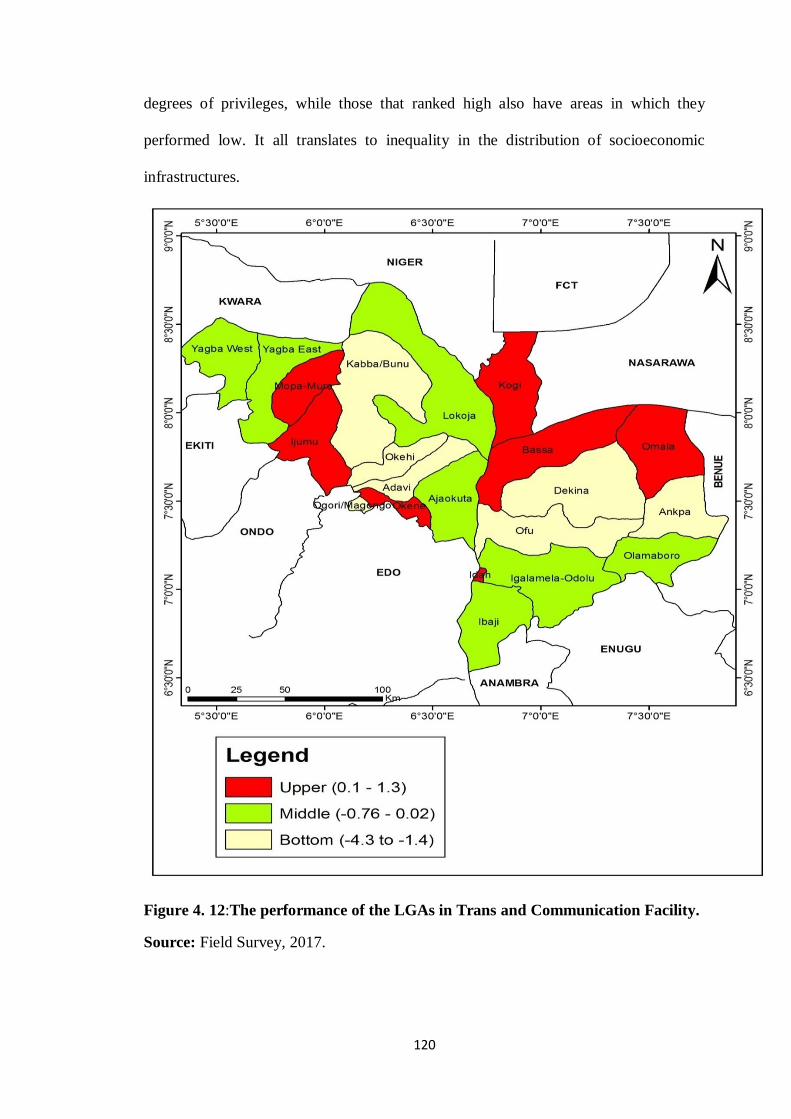
120
degrees of privileges, while those that ranked high also have areas in which they
performed low. It all translates to inequality in the distribution of socioeconomic
infrastructures.
Figure 4. 12:The performance of the LGAs in Trans and Communication Facility.
Source: Field Survey, 2017.
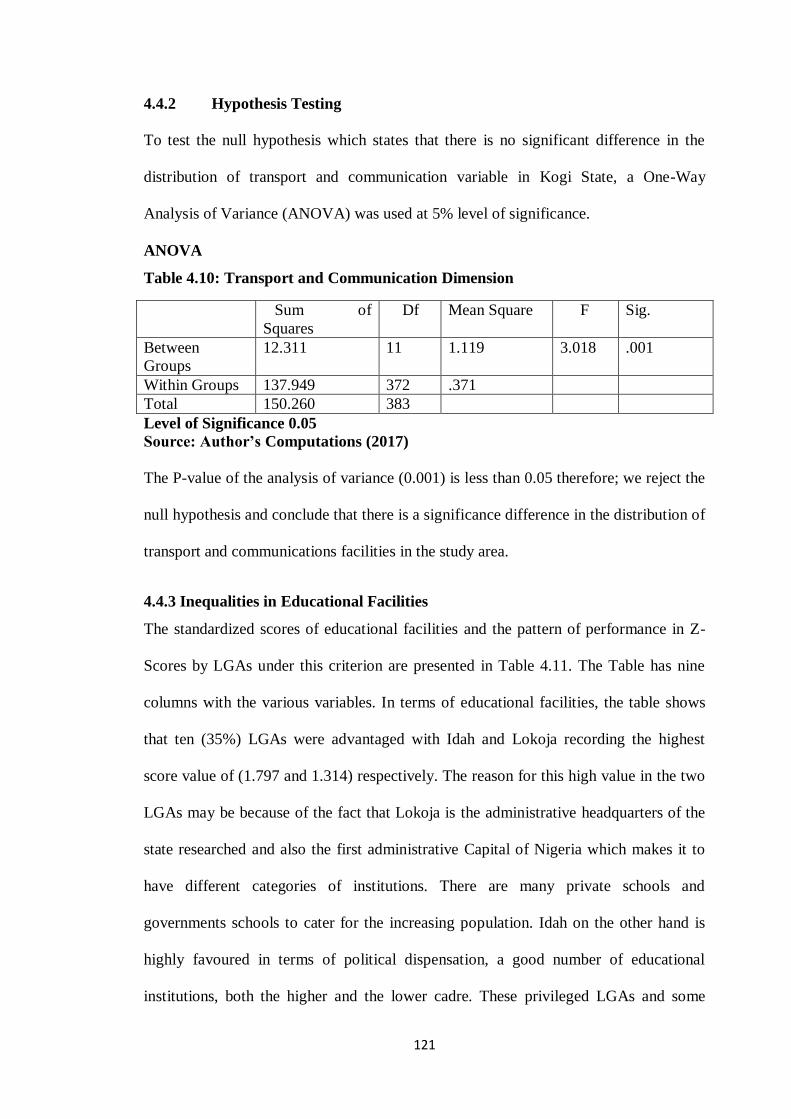
121
4.4.2 Hypothesis Testing
To test the null hypothesis which states that there is no significant difference in the
distribution of transport and communication variable in Kogi State, a One-Way
Analysis of Variance (ANOVA) was used at 5% level of significance.
ANOVA
Table 4.10: Transport and Communication Dimension
Sum of
Squares
Df Mean Square F Sig.
Between
Groups
12.311 11 1.119 3.018 .001
Within Groups 137.949 372 .371
Total 150.260 383
Level of Significance 0.05
Source: Author’s Computations (2017)
The P-value of the analysis of variance (0.001) is less than 0.05 therefore; we reject the
null hypothesis and conclude that there is a significance difference in the distribution of
transport and communications facilities in the study area.
4.4.3 Inequalities in Educational Facilities
The standardized scores of educational facilities and the pattern of performance in Z-
Scores by LGAs under this criterion are presented in Table 4.11. The Table has nine
columns with the various variables. In terms of educational facilities, the table shows
that ten (35%) LGAs were advantaged with Idah and Lokoja recording the highest
score value of (1.797 and 1.314) respectively. The reason for this high value in the two
LGAs may be because of the fact that Lokoja is the administrative headquarters of the
state researched and also the first administrative Capital of Nigeria which makes it to
have different categories of institutions. There are many private schools and
governments schools to cater for the increasing population. Idah on the other hand is
highly favoured in terms of political dispensation, a good number of educational
institutions, both the higher and the lower cadre. These privileged LGAs and some
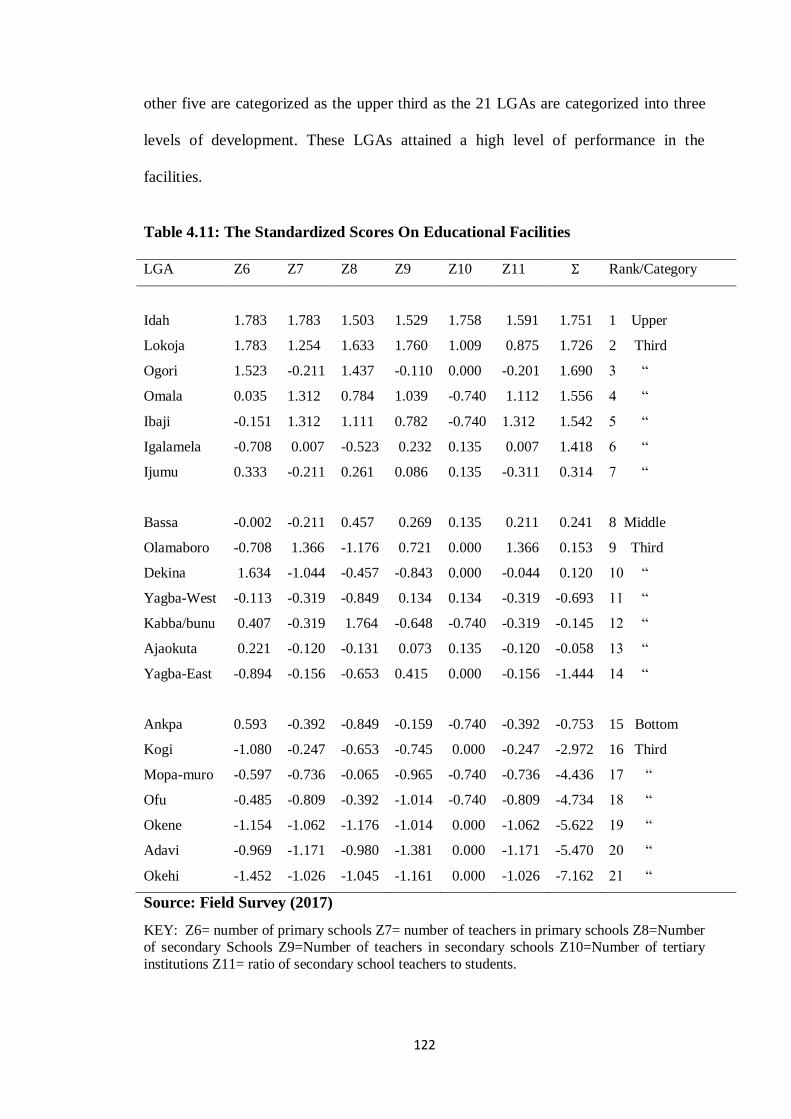
122
other five are categorized as the upper third as the 21 LGAs are categorized into three
levels of development. These LGAs attained a high level of performance in the
facilities.
Table 4.11: The Standardized Scores On Educational Facilities
LGA Z6 Z7 Z8 Z9 Z10 Z11 Ʃ Rank/Category
Idah 1.783 1.783 1.503 1.529 1.758 1.591 1.751 1 Upper
Lokoja 1.783 1.254 1.633 1.760 1.009 0.875 1.726 2 Third
Ogori 1.523 -0.211 1.437 -0.110 0.000 -0.201 1.690 3 ―
Omala 0.035 1.312 0.784 1.039 -0.740 1.112 1.556 4 ―
Ibaji -0.151 1.312 1.111 0.782 -0.740 1.312 1.542 5 ―
Igalamela -0.708 0.007 -0.523 0.232 0.135 0.007 1.418 6 ―
Ijumu 0.333 -0.211 0.261 0.086 0.135 -0.311 0.314 7 ―
Bassa -0.002 -0.211 0.457 0.269 0.135 0.211 0.241 8 Middle
Olamaboro -0.708 1.366 -1.176 0.721 0.000 1.366 0.153 9 Third
Dekina 1.634 -1.044 -0.457 -0.843 0.000 -0.044 0.120 10 ―
Yagba-West -0.113 -0.319 -0.849 0.134 0.134 -0.319 -0.693 11 ―
Kabba/bunu 0.407 -0.319 1.764 -0.648 -0.740 -0.319 -0.145 12 ―
Ajaokuta 0.221 -0.120 -0.131 0.073 0.135 -0.120 -0.058 13 ―
Yagba-East -0.894 -0.156 -0.653 0.415 0.000 -0.156 -1.444 14 ―
Ankpa 0.593 -0.392 -0.849 -0.159 -0.740 -0.392 -0.753 15 Bottom
Kogi -1.080 -0.247 -0.653 -0.745 0.000 -0.247 -2.972 16 Third
Mopa-muro -0.597 -0.736 -0.065 -0.965 -0.740 -0.736 -4.436 17 ―
Ofu -0.485 -0.809 -0.392 -1.014 -0.740 -0.809 -4.734 18 ―
Okene -1.154 -1.062 -1.176 -1.014 0.000 -1.062 -5.622 19 ―
Adavi -0.969 -1.171 -0.980 -1.381 0.000 -1.171 -5.470 20 ―
Okehi -1.452 -1.026 -1.045 -1.161 0.000 -1.026 -7.162 21 ―
Source: Field Survey (2017)
KEY: Z6= number of primary schools Z7= number of teachers in primary schools Z8=Number
of secondary Schools Z9=Number of teachers in secondary schools Z10=Number of tertiary
institutions Z11= ratio of secondary school teachers to students.
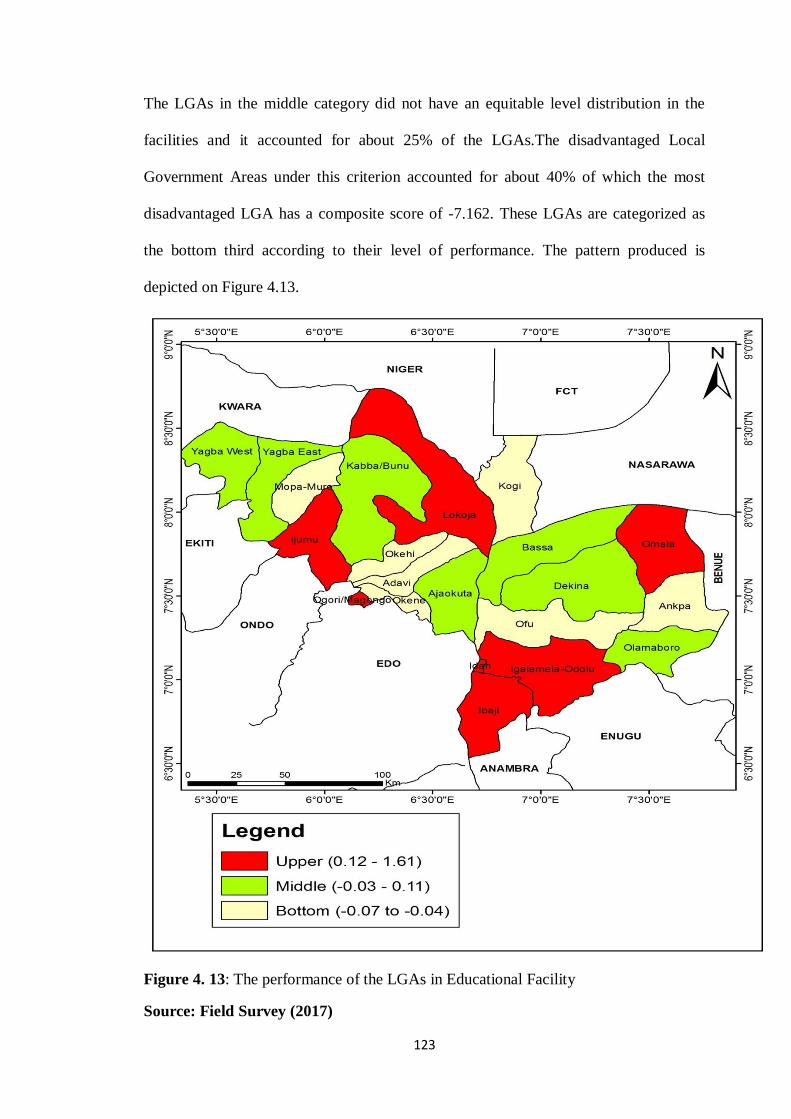
123
The LGAs in the middle category did not have an equitable level distribution in the
facilities and it accounted for about 25% of the LGAs.The disadvantaged Local
Government Areas under this criterion accounted for about 40% of which the most
disadvantaged LGA has a composite score of -7.162. These LGAs are categorized as
the bottom third according to their level of performance. The pattern produced is
depicted on Figure 4.13.
Figure 4. 13: The performance of the LGAs in Educational Facility
Source: Field Survey (2017)
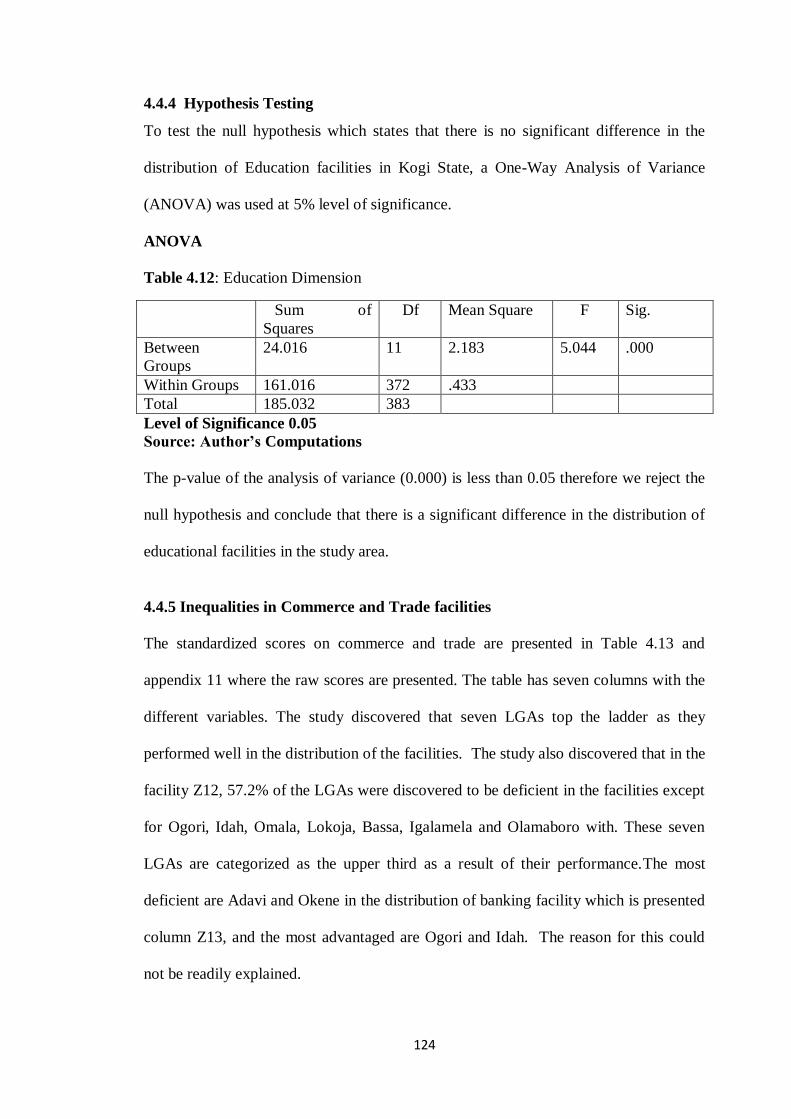
124
4.4.4 Hypothesis Testing
To test the null hypothesis which states that there is no significant difference in the
distribution of Education facilities in Kogi State, a One-Way Analysis of Variance
(ANOVA) was used at 5% level of significance.
ANOVA
Table 4.12: Education Dimension
Sum of
Squares
Df Mean Square F Sig.
Between
Groups
24.016 11 2.183 5.044 .000
Within Groups 161.016 372 .433
Total 185.032 383
Level of Significance 0.05
Source: Author’s Computations
The p-value of the analysis of variance (0.000) is less than 0.05 therefore we reject the
null hypothesis and conclude that there is a significant difference in the distribution of
educational facilities in the study area.
4.4.5 Inequalities in Commerce and Trade facilities
The standardized scores on commerce and trade are presented in Table 4.13 and
appendix 11 where the raw scores are presented. The table has seven columns with the
different variables. The study discovered that seven LGAs top the ladder as they
performed well in the distribution of the facilities. The study also discovered that in the
facility Z12, 57.2% of the LGAs were discovered to be deficient in the facilities except
for Ogori, Idah, Omala, Lokoja, Bassa, Igalamela and Olamaboro with. These seven
LGAs are categorized as the upper third as a result of their performance.The most
deficient are Adavi and Okene in the distribution of banking facility which is presented
column Z13, and the most advantaged are Ogori and Idah. The reason for this could
not be readily explained.
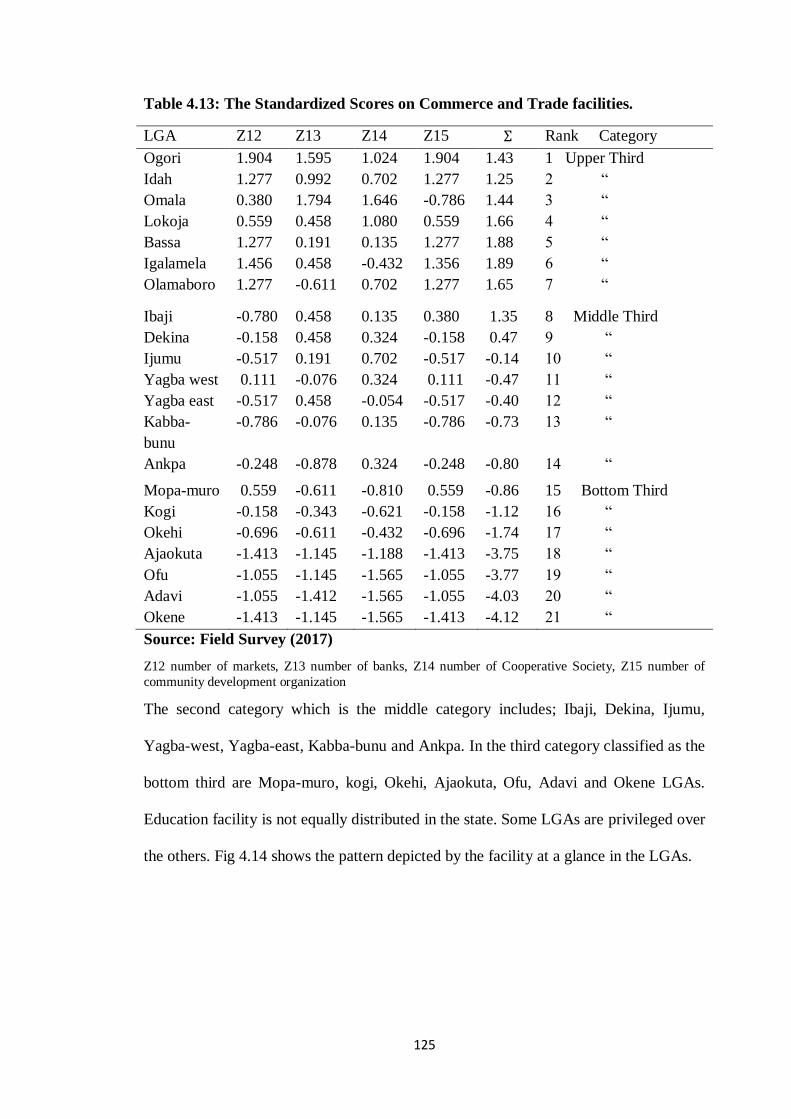
125
Table 4.13: The Standardized Scores on Commerce and Trade facilities.
LGA Z12 Z13 Z14 Z15 Ʃ Rank Category
Ogori 1.904 1.595 1.024 1.904 1.43 1 Upper Third
Idah 1.277 0.992 0.702 1.277 1.25 2 ―
Omala 0.380 1.794 1.646 -0.786 1.44 3 ―
Lokoja 0.559 0.458 1.080 0.559 1.66 4 ―
Bassa 1.277 0.191 0.135 1.277 1.88 5 ―
Igalamela 1.456 0.458 -0.432 1.356 1.89 6 ―
Olamaboro 1.277 -0.611 0.702 1.277 1.65 7 ―
Ibaji -0.780 0.458 0.135 0.380 1.35 8 Middle Third
Dekina -0.158 0.458 0.324 -0.158 0.47 9 ―
Ijumu -0.517 0.191 0.702 -0.517 -0.14 10 ―
Yagba west 0.111 -0.076 0.324 0.111 -0.47 11 ―
Yagba east -0.517 0.458 -0.054 -0.517 -0.40 12 ―
Kabba-
bunu
-0.786 -0.076 0.135 -0.786 -0.73 13 ―
Ankpa -0.248 -0.878 0.324 -0.248 -0.80 14 ―
Mopa-muro 0.559 -0.611 -0.810 0.559 -0.86 15 Bottom Third
Kogi -0.158 -0.343 -0.621 -0.158 -1.12 16 ―
Okehi -0.696 -0.611 -0.432 -0.696 -1.74 17 ―
Ajaokuta -1.413 -1.145 -1.188 -1.413 -3.75 18 ―
Ofu -1.055 -1.145 -1.565 -1.055 -3.77 19 ―
Adavi -1.055 -1.412 -1.565 -1.055 -4.03 20 ―
Okene -1.413 -1.145 -1.565 -1.413 -4.12 21 ―
Source: Field Survey (2017)
Z12 number of markets, Z13 number of banks, Z14 number of Cooperative Society, Z15 number of
community development organization
The second category which is the middle category includes; Ibaji, Dekina, Ijumu,
Yagba-west, Yagba-east, Kabba-bunu and Ankpa. In the third category classified as the
bottom third are Mopa-muro, kogi, Okehi, Ajaokuta, Ofu, Adavi and Okene LGAs.
Education facility is not equally distributed in the state. Some LGAs are privileged over
the others. Fig 4.14 shows the pattern depicted by the facility at a glance in the LGAs.
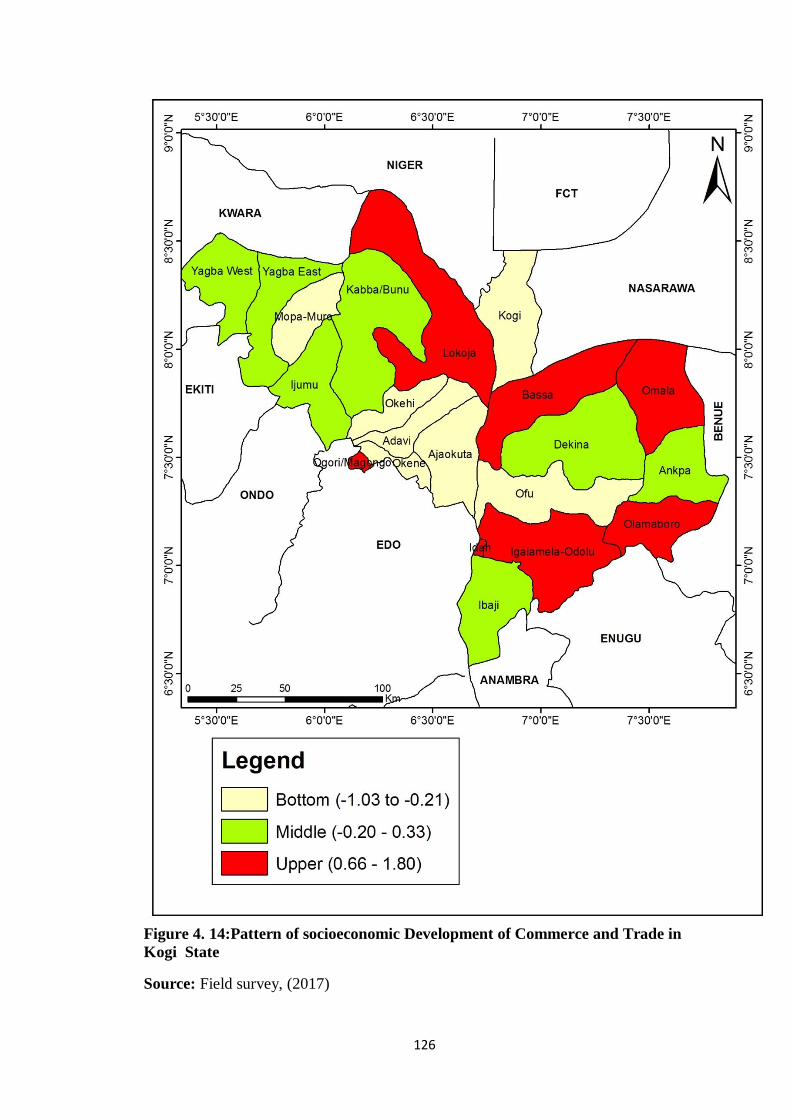
126
Figure 4. 14:Pattern of socioeconomic Development of Commerce and Trade in
Kogi State
Source: Field survey, (2017)
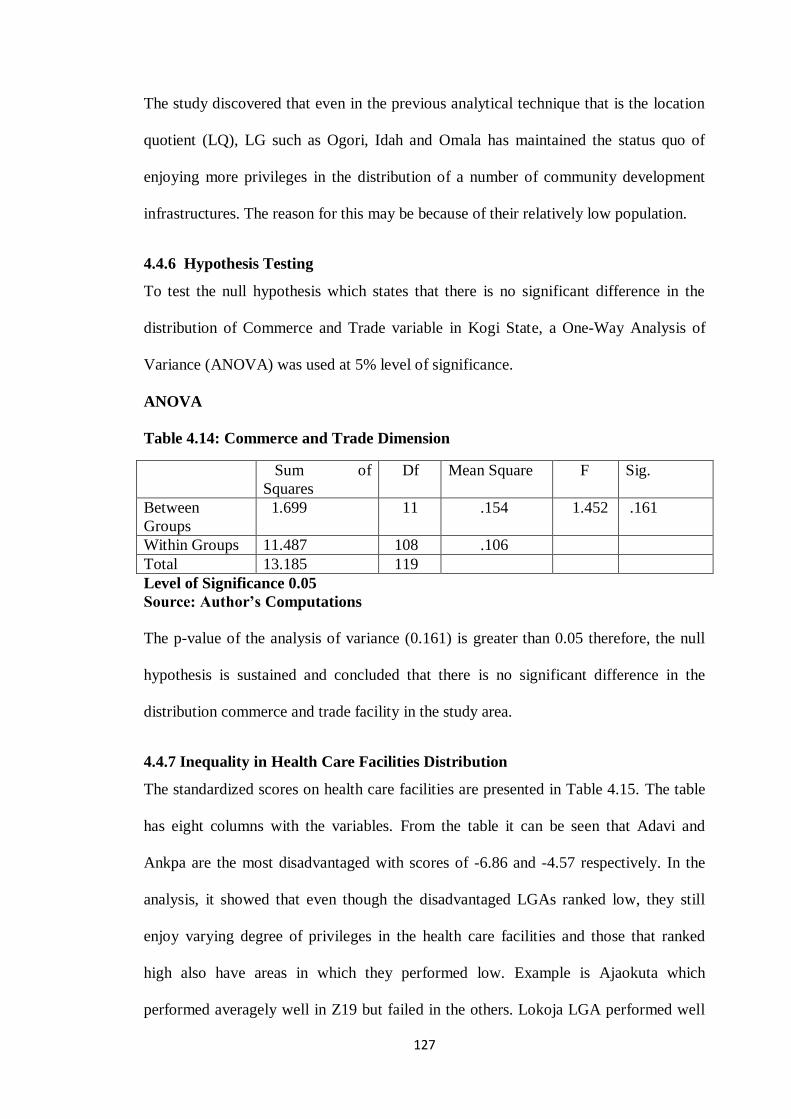
127
The study discovered that even in the previous analytical technique that is the location
quotient (LQ), LG such as Ogori, Idah and Omala has maintained the status quo of
enjoying more privileges in the distribution of a number of community development
infrastructures. The reason for this may be because of their relatively low population.
4.4.6 Hypothesis Testing
To test the null hypothesis which states that there is no significant difference in the
distribution of Commerce and Trade variable in Kogi State, a One-Way Analysis of
Variance (ANOVA) was used at 5% level of significance.
ANOVA
Table 4.14: Commerce and Trade Dimension
Sum of
Squares
Df Mean Square F Sig.
Between
Groups
1.699 11 .154 1.452 .161
Within Groups 11.487 108 .106
Total 13.185 119
Level of Significance 0.05
Source: Author’s Computations
The p-value of the analysis of variance (0.161) is greater than 0.05 therefore, the null
hypothesis is sustained and concluded that there is no significant difference in the
distribution commerce and trade facility in the study area.
4.4.7 Inequality in Health Care Facilities Distribution
The standardized scores on health care facilities are presented in Table 4.15. The table
has eight columns with the variables. From the table it can be seen that Adavi and
Ankpa are the most disadvantaged with scores of -6.86 and -4.57 respectively. In the
analysis, it showed that even though the disadvantaged LGAs ranked low, they still
enjoy varying degree of privileges in the health care facilities and those that ranked
high also have areas in which they performed low. Example is Ajaokuta which
performed averagely well in Z19 but failed in the others. Lokoja LGA performed well
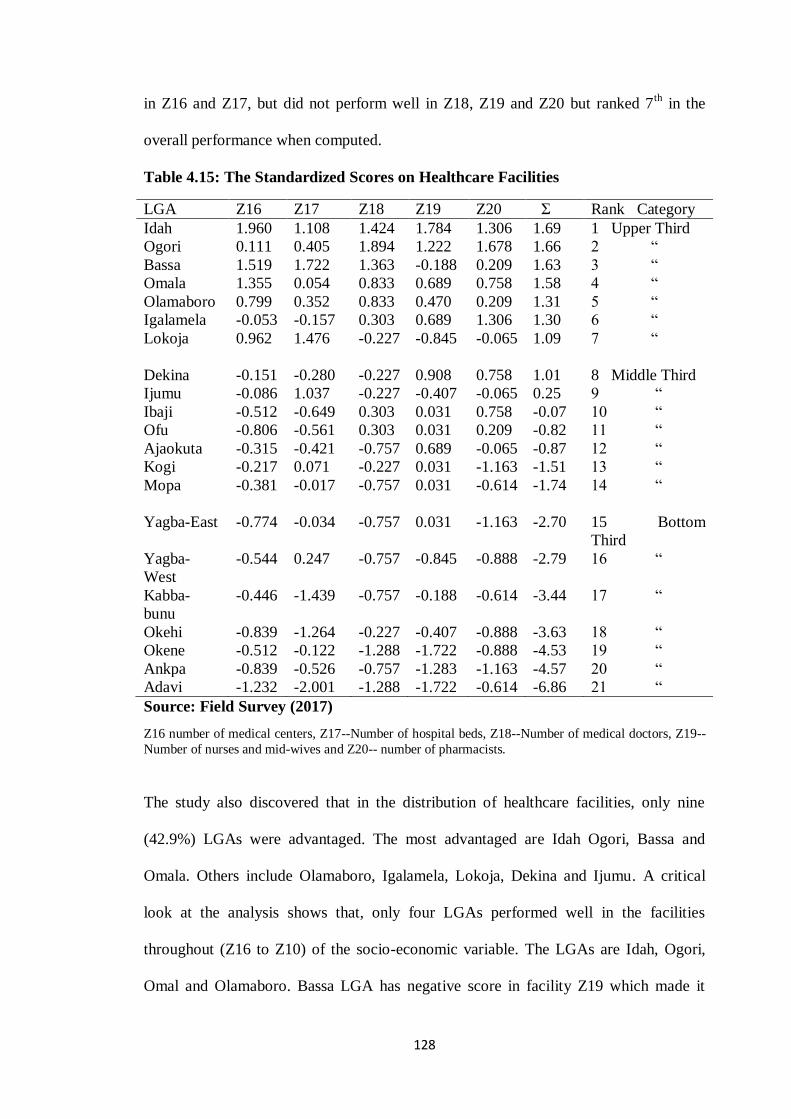
128
in Z16 and Z17, but did not perform well in Z18, Z19 and Z20 but ranked 7th
in the
overall performance when computed.
Table 4.15: The Standardized Scores on Healthcare Facilities
LGA Z16 Z17 Z18 Z19 Z20 Ʃ Rank Category
Idah 1.960 1.108 1.424 1.784 1.306 1.69 1 Upper Third
Ogori 0.111 0.405 1.894 1.222 1.678 1.66 2 ―
Bassa 1.519 1.722 1.363 -0.188 0.209 1.63 3 ―
Omala 1.355 0.054 0.833 0.689 0.758 1.58 4 ―
Olamaboro 0.799 0.352 0.833 0.470 0.209 1.31 5 ―
Igalamela -0.053 -0.157 0.303 0.689 1.306 1.30 6 ―
Lokoja 0.962 1.476 -0.227 -0.845 -0.065 1.09 7 ―
Dekina -0.151 -0.280 -0.227 0.908 0.758 1.01 8 Middle Third
Ijumu -0.086 1.037 -0.227 -0.407 -0.065 0.25 9 ―
Ibaji -0.512 -0.649 0.303 0.031 0.758 -0.07 10 ―
Ofu -0.806 -0.561 0.303 0.031 0.209 -0.82 11 ―
Ajaokuta -0.315 -0.421 -0.757 0.689 -0.065 -0.87 12 ―
Kogi -0.217 0.071 -0.227 0.031 -1.163 -1.51 13 ―
Mopa -0.381 -0.017 -0.757 0.031 -0.614 -1.74 14 ―
Yagba-East -0.774 -0.034 -0.757 0.031 -1.163 -2.70 15 Bottom
Third
Yagba-
West
-0.544 0.247 -0.757 -0.845 -0.888 -2.79 16 ―
Kabba-
bunu
-0.446 -1.439 -0.757 -0.188 -0.614 -3.44 17 ―
Okehi -0.839 -1.264 -0.227 -0.407 -0.888 -3.63 18 ―
Okene -0.512 -0.122 -1.288 -1.722 -0.888 -4.53 19 ―
Ankpa -0.839 -0.526 -0.757 -1.283 -1.163 -4.57 20 ―
Adavi -1.232 -2.001 -1.288 -1.722 -0.614 -6.86 21 ―
Source: Field Survey (2017)
Z16 number of medical centers, Z17--Number of hospital beds, Z18--Number of medical doctors, Z19--
Number of nurses and mid-wives and Z20-- number of pharmacists.
The study also discovered that in the distribution of healthcare facilities, only nine
(42.9%) LGAs were advantaged. The most advantaged are Idah Ogori, Bassa and
Omala. Others include Olamaboro, Igalamela, Lokoja, Dekina and Ijumu. A critical
look at the analysis shows that, only four LGAs performed well in the facilities
throughout (Z16 to Z10) of the socio-economic variable. The LGAs are Idah, Ogori,
Omal and Olamaboro. Bassa LGA has negative score in facility Z19 which made it
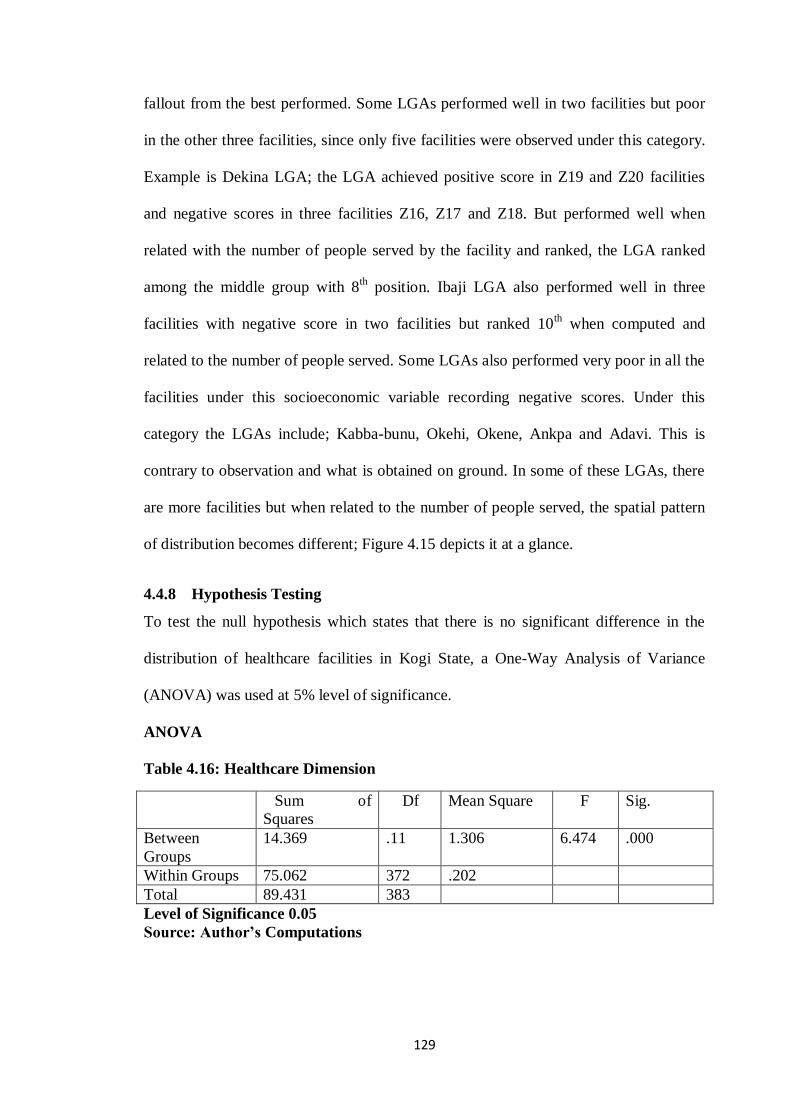
129
fallout from the best performed. Some LGAs performed well in two facilities but poor
in the other three facilities, since only five facilities were observed under this category.
Example is Dekina LGA; the LGA achieved positive score in Z19 and Z20 facilities
and negative scores in three facilities Z16, Z17 and Z18. But performed well when
related with the number of people served by the facility and ranked, the LGA ranked
among the middle group with 8th position. Ibaji LGA also performed well in three
facilities with negative score in two facilities but ranked 10th when computed and
related to the number of people served. Some LGAs also performed very poor in all the
facilities under this socioeconomic variable recording negative scores. Under this
category the LGAs include; Kabba-bunu, Okehi, Okene, Ankpa and Adavi. This is
contrary to observation and what is obtained on ground. In some of these LGAs, there
are more facilities but when related to the number of people served, the spatial pattern
of distribution becomes different; Figure 4.15 depicts it at a glance.
4.4.8 Hypothesis Testing
To test the null hypothesis which states that there is no significant difference in the
distribution of healthcare facilities in Kogi State, a One-Way Analysis of Variance
(ANOVA) was used at 5% level of significance.
ANOVA
Table 4.16: Healthcare Dimension
Sum of
Squares
Df Mean Square F Sig.
Between
Groups
14.369 .11 1.306 6.474 .000
Within Groups 75.062 372 .202
Total 89.431 383
Level of Significance 0.05
Source: Author’s Computations
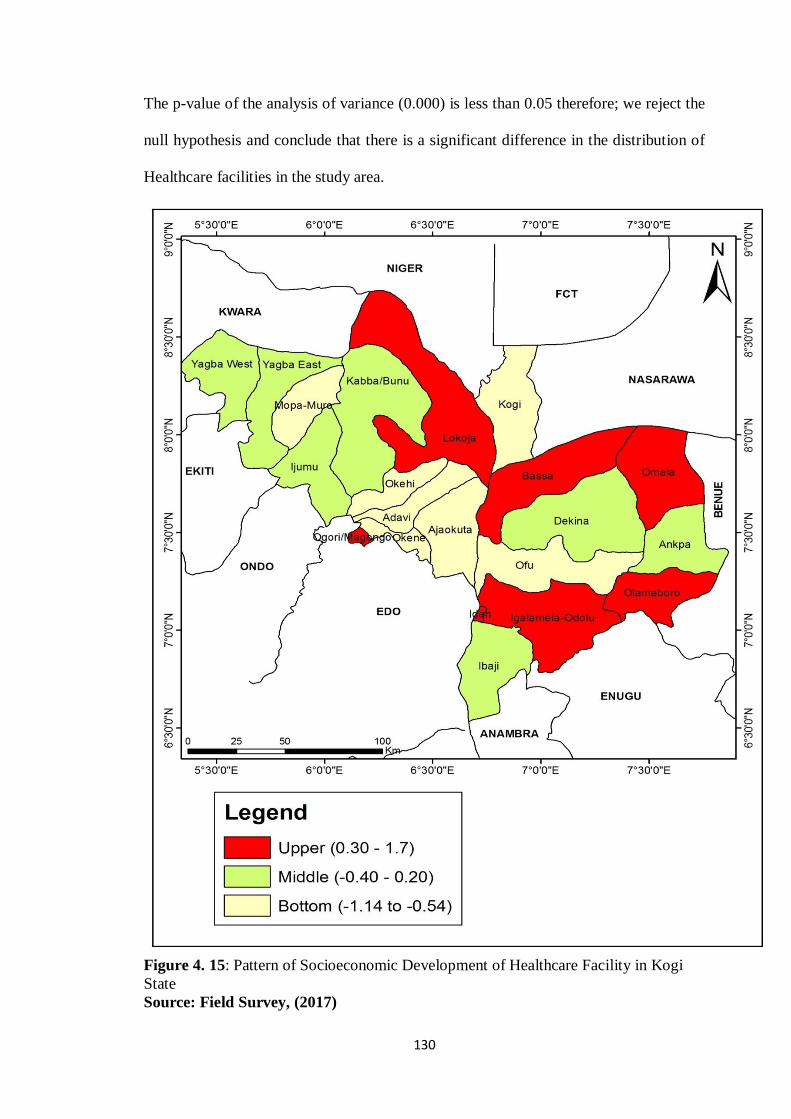
130
The p-value of the analysis of variance (0.000) is less than 0.05 therefore; we reject the
null hypothesis and conclude that there is a significant difference in the distribution of
Healthcare facilities in the study area.
Figure 4. 15: Pattern of Socioeconomic Development of Healthcare Facility in Kogi
State
Source: Field Survey, (2017)
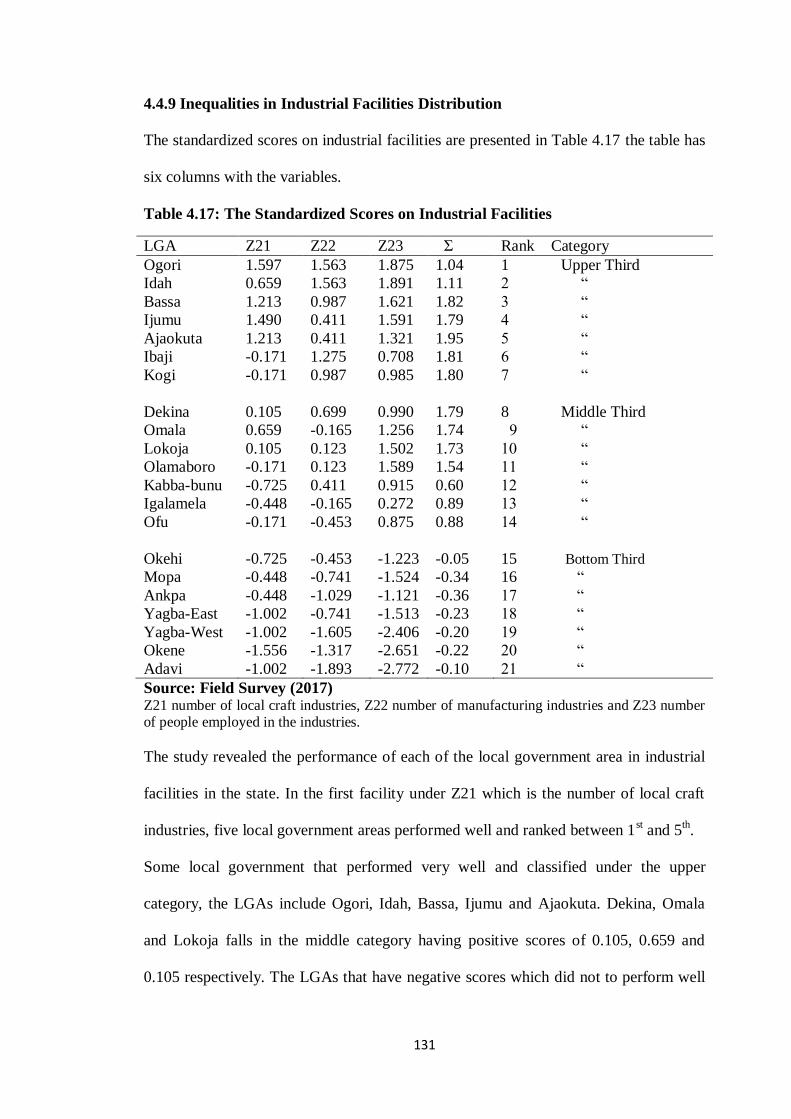
131
4.4.9 Inequalities in Industrial Facilities Distribution
The standardized scores on industrial facilities are presented in Table 4.17 the table has
six columns with the variables.
Table 4.17: The Standardized Scores on Industrial Facilities
LGA Z21 Z22 Z23 Ʃ Rank Category
Ogori 1.597 1.563 1.875 1.04 1 Upper Third
Idah 0.659 1.563 1.891 1.11 2 ―
Bassa 1.213 0.987 1.621 1.82 3 ―
Ijumu 1.490 0.411 1.591 1.79 4 ―
Ajaokuta 1.213 0.411 1.321 1.95 5 ―
Ibaji -0.171 1.275 0.708 1.81 6 ―
Kogi -0.171 0.987 0.985 1.80 7 ―
Dekina 0.105 0.699 0.990 1.79 8 Middle Third
Omala 0.659 -0.165 1.256 1.74 9 ―
Lokoja 0.105 0.123 1.502 1.73 10 ―
Olamaboro -0.171 0.123 1.589 1.54 11 ―
Kabba-bunu -0.725 0.411 0.915 0.60 12 ―
Igalamela -0.448 -0.165 0.272 0.89 13 ―
Ofu -0.171 -0.453 0.875 0.88 14 ―
Okehi -0.725 -0.453 -1.223 -0.05 15 Bottom Third
Mopa -0.448 -0.741 -1.524 -0.34 16 ―
Ankpa -0.448 -1.029 -1.121 -0.36 17 ―
Yagba-East -1.002 -0.741 -1.513 -0.23 18 ―
Yagba-West -1.002 -1.605 -2.406 -0.20 19 ―
Okene -1.556 -1.317 -2.651 -0.22 20 ―
Adavi -1.002 -1.893 -2.772 -0.10 21 ―
Source: Field Survey (2017) Z21 number of local craft industries, Z22 number of manufacturing industries and Z23 number of people employed in the industries.
The study revealed the performance of each of the local government area in industrial
facilities in the state. In the first facility under Z21 which is the number of local craft
industries, five local government areas performed well and ranked between 1st and 5
th.
Some local government that performed very well and classified under the upper
category, the LGAs include Ogori, Idah, Bassa, Ijumu and Ajaokuta. Dekina, Omala
and Lokoja falls in the middle category having positive scores of 0.105, 0.659 and
0.105 respectively. The LGAs that have negative scores which did not to perform well
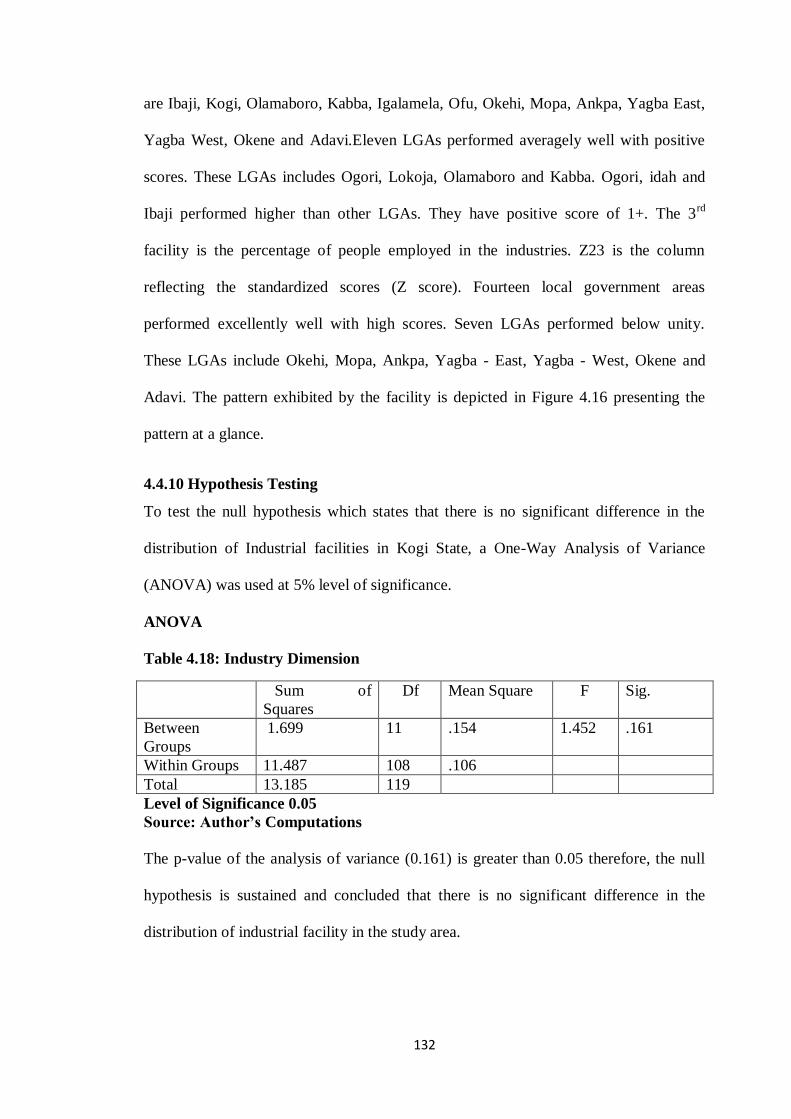
132
are Ibaji, Kogi, Olamaboro, Kabba, Igalamela, Ofu, Okehi, Mopa, Ankpa, Yagba East,
Yagba West, Okene and Adavi.Eleven LGAs performed averagely well with positive
scores. These LGAs includes Ogori, Lokoja, Olamaboro and Kabba. Ogori, idah and
Ibaji performed higher than other LGAs. They have positive score of 1+. The 3rd
facility is the percentage of people employed in the industries. Z23 is the column
reflecting the standardized scores (Z score). Fourteen local government areas
performed excellently well with high scores. Seven LGAs performed below unity.
These LGAs include Okehi, Mopa, Ankpa, Yagba - East, Yagba - West, Okene and
Adavi. The pattern exhibited by the facility is depicted in Figure 4.16 presenting the
pattern at a glance.
4.4.10 Hypothesis Testing
To test the null hypothesis which states that there is no significant difference in the
distribution of Industrial facilities in Kogi State, a One-Way Analysis of Variance
(ANOVA) was used at 5% level of significance.
ANOVA
Table 4.18: Industry Dimension
Sum of
Squares
Df Mean Square F Sig.
Between
Groups
1.699 11 .154 1.452 .161
Within Groups 11.487 108 .106
Total 13.185 119
Level of Significance 0.05
Source: Author’s Computations
The p-value of the analysis of variance (0.161) is greater than 0.05 therefore, the null
hypothesis is sustained and concluded that there is no significant difference in the
distribution of industrial facility in the study area.
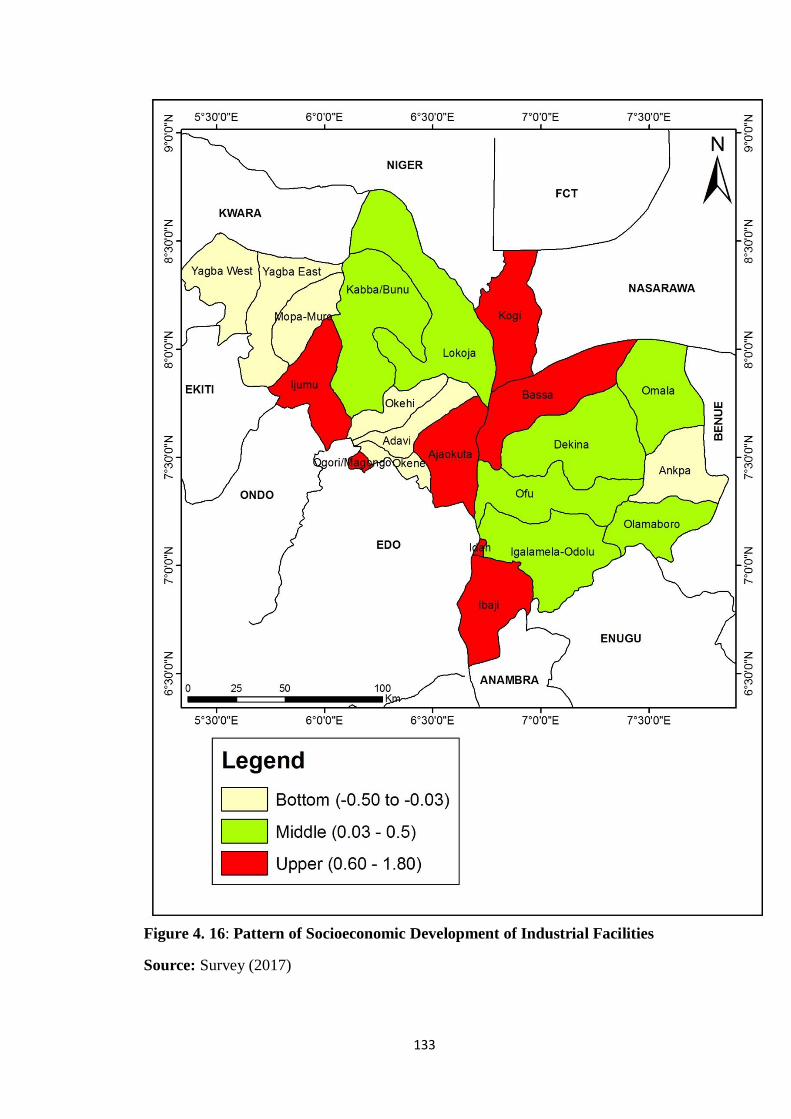
133
Figure 4. 16: Pattern of Socioeconomic Development of Industrial Facilities
Source: Survey (2017)
134
4.4.11 Comparative Analysis of the Standardized Scores on the Five Dimensions
The combined standardized scores of all the variables analyzed are presented on Table
4.19. A critical look at the scores shows the spatial nature of the distribution of the
facilities across board. It shows an uneven distribution of the facilities. This is in line
with the study of Ita et al (2012) on the spatial inequalities in development among
geographic units in Cross River state but with a difference. The result of Ita et al
showed that urban based LGAs consistently remain at the top of the development
ladder, while the rural based LGAs are at the bottom of the ladder, thus demarcating the
inequality problem in the state along rural-urban dichotomy.
In this study, it was discovered that there are some degree of variation in the pattern of
distribution of the socio-economic facilities. Looking at the combined facilities for each
LGA in the state, it showed that Idah, Ogori, Bassa, Lokoja, Omala, Igalamela and
Olamaboro have a fair share of the facilities. Some of these Local government areas are
not urban based but appeared at the top of the ladder as the LGAs having more of the
socioeconomic variables.While some LGAs are urban based but have negative scores
and are thus deprived of equal share of the facilities. It also agrees and at the same time
disagrees with the findings of Oyekanmi etal (2011) in the study of healthcare facilities
in Kogi state along senatorial districts. Oyekanmi etal found out that, there exist
inequalities in the distribution of HCF facilities along the senatorial districts in the
state. This present study found out, that of a truth, there exist inequalities in the
distribution of facilities but not along senatorial districts in the state.
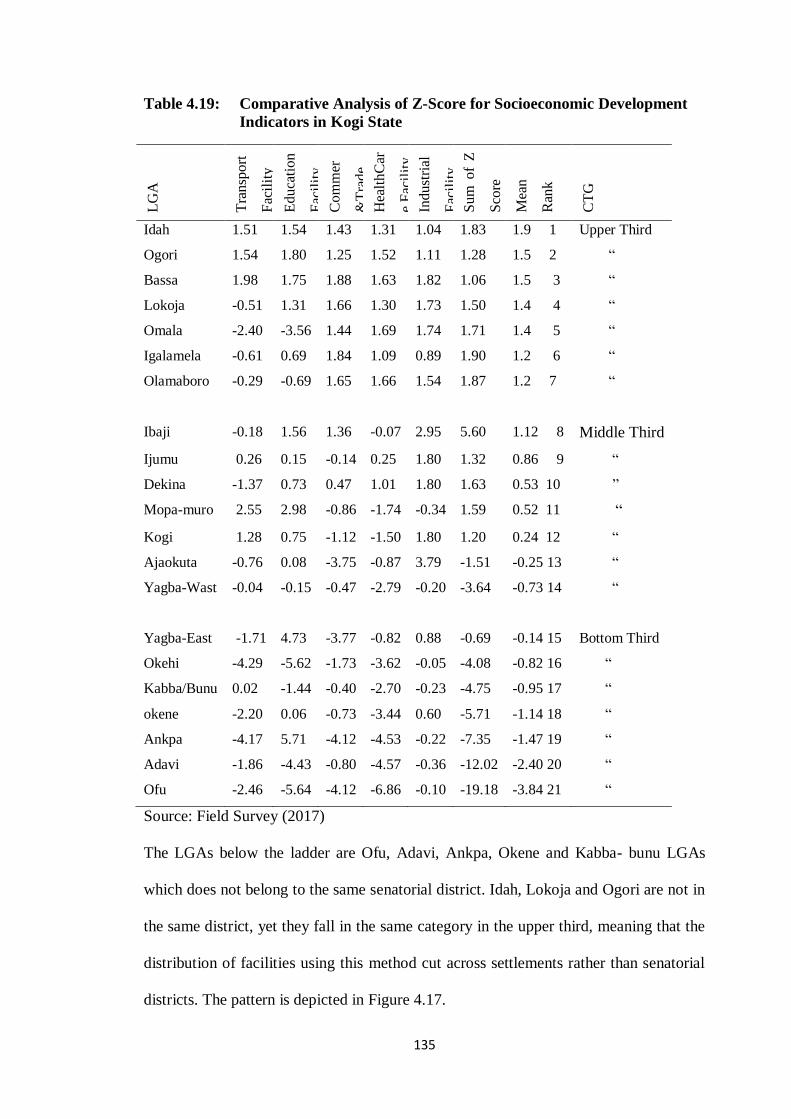
135
Table 4.19: Comparative Analysis of Z-Score for Socioeconomic Development
Indicators in Kogi State
LG
A
Tra
nsp
ort
Fac
ilit
y
Ed
uca
tio
n
Fac
ilit
y
Co
mm
er
&T
rad
e
Hea
lth
Car
e F
acil
ity
Ind
ust
rial
Fac
ilit
y
Su
m o
f Z
Sco
re
Mea
n
Ran
k
CT
G
Idah 1.51 1.54 1.43 1.31 1.04 1.83 1.9 1 Upper Third
Ogori 1.54 1.80 1.25 1.52 1.11 1.28 1.5 2 ―
Bassa 1.98 1.75 1.88 1.63 1.82 1.06 1.5 3 ―
Lokoja -0.51 1.31 1.66 1.30 1.73 1.50 1.4 4 ―
Omala -2.40 -3.56 1.44 1.69 1.74 1.71 1.4 5 ―
Igalamela -0.61 0.69 1.84 1.09 0.89 1.90 1.2 6 ―
Olamaboro -0.29 -0.69 1.65 1.66 1.54 1.87 1.2 7
―
Ibaji -0.18 1.56 1.36 -0.07 2.95 5.60 1.12 8 Middle Third
Ijumu 0.26 0.15 -0.14 0.25 1.80 1.32 0.86 9 ―
Dekina -1.37 0.73 0.47 1.01 1.80 1.63 0.53 10 ‖
Mopa-muro 2.55 2.98 -0.86 -1.74 -0.34 1.59 0.52 11 ―
Kogi 1.28 0.75 -1.12 -1.50 1.80 1.20 0.24 12 ―
Ajaokuta -0.76 0.08 -3.75 -0.87 3.79 -1.51 -0.25 13 ―
Yagba-Wast -0.04 -0.15 -0.47 -2.79 -0.20 -3.64 -0.73 14
―
Yagba-East -1.71 4.73 -3.77 -0.82 0.88 -0.69 -0.14 15 Bottom Third
Okehi -4.29 -5.62 -1.73 -3.62 -0.05 -4.08 -0.82 16 ―
Kabba/Bunu 0.02 -1.44 -0.40 -2.70 -0.23 -4.75 -0.95 17 ―
okene -2.20 0.06 -0.73 -3.44 0.60 -5.71 -1.14 18 ―
Ankpa -4.17 5.71 -4.12 -4.53 -0.22 -7.35 -1.47 19 ―
Adavi -1.86 -4.43 -0.80 -4.57 -0.36 -12.02 -2.40 20 ―
Ofu -2.46 -5.64 -4.12 -6.86 -0.10 -19.18 -3.84 21 ―
Source: Field Survey (2017)
The LGAs below the ladder are Ofu, Adavi, Ankpa, Okene and Kabba- bunu LGAs
which does not belong to the same senatorial district. Idah, Lokoja and Ogori are not in
the same district, yet they fall in the same category in the upper third, meaning that the
distribution of facilities using this method cut across settlements rather than senatorial
districts. The pattern is depicted in Figure 4.17.
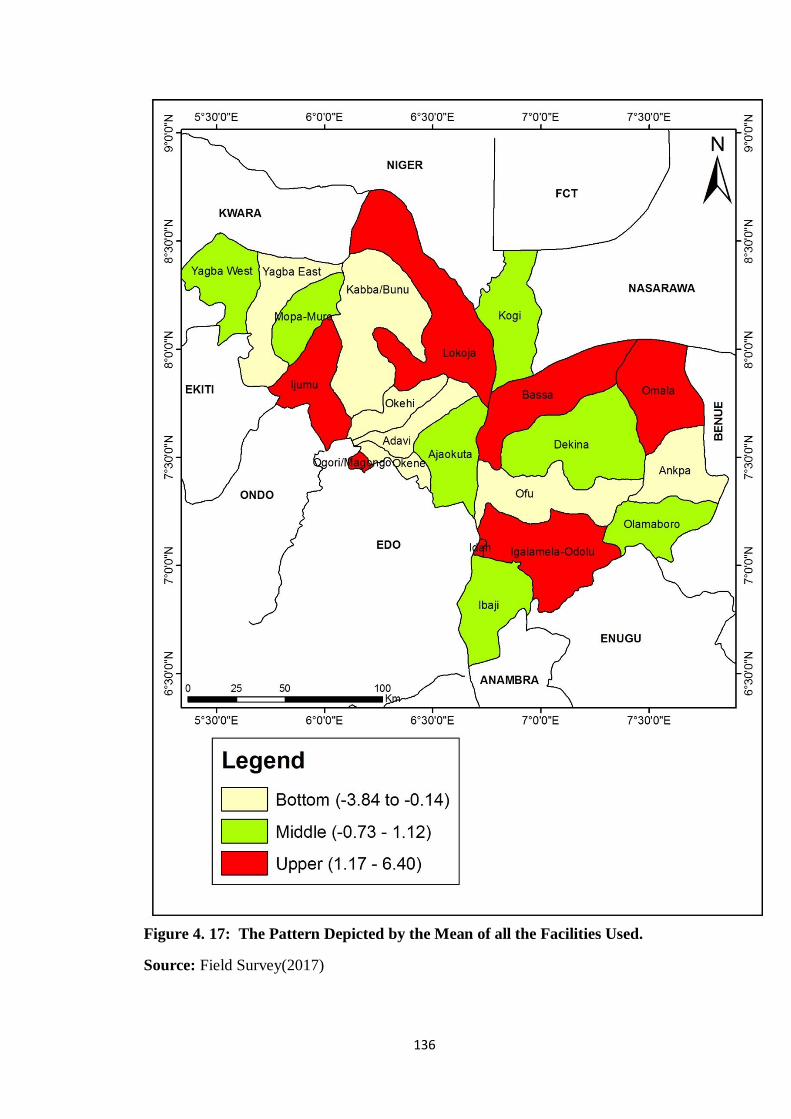
136
Figure 4. 17: The Pattern Depicted by the Mean of all the Facilities Used.
Source: Field Survey(2017)
137
4.5 THE PROCESSES UNDERLYING THE SPATIAL PATTERNOF
SOCIOECONOMIC DEVELOPMENT IN KOGI STATE
4.5.1 The Factors influencing the Spatial Dimension of Socioeconomic
Development
The study examined the processes that are responsible for the spatial pattern of socio-
economic development in Kogi State by subjecting the data to factor analysis.
However, as a precondition to factor analysis is the relationship between the
socioeconomic variables used in this study. In determining the degree of association
between these socioeconomic development indicators, appendix iii shows the
correlation matrix of the twenty-three indicators considered in this study. These
include; X1 (lengths of road), X2 (number of post offices), X3 (number of global
communication masts), X4 (people using mobile phones), X5 (people using
radio/television gadgets), X6 (number of primary schools), X7 (number of teachers in
the primary schools), X8 (number of secondary schools), X9(number of teachers in
secondary schools), X10 ( number of tertiary institutions), X11 (secondary school
student-teachers ratio), X12 (number of markets), X13 (number of banks), X14
(number of cooperative societies), X15 (Number of community development
organization), X16 (Number of health care centres), X17 (number of hospital beds),
X18 (number of medical doctors), X19 ( number of nurses/midwives), X20(number of
pharmacists), X21 (number of local craft industries), X22 (number of manufacturing
industries)and X23 (% of people employed in the industries). The relationship between
these socioeconomic development indicators is a precondition for factor analysis that is
used in this work.
138
4.5.2 Rotated Matrix of Factors Influencing Pattern of Socioeconomic
Development
The rotated matrix in respect of the variables influencing the spatial pattern of
socioeconomic development in Kogi State after correlation is presented in Table
4.20. The results of the factor analysis (Varimax rotated) reduced the 23
independent variables to seven factors of socioeconomic development, this is also
presented on Table 4.21 with a cumulative percentage variance of 63.5%, thus
leaving 36.5% of the total variance unexplained. The unexplained variances are
the socio-economic variables not captured in this research work.
Factor I has significant loadings on 10 variables, namely X4 (number of people
using mobile phones), X5 (number of people using radio/television gadgets), X6
(number of primary schools), X7 ( number of people teachers in the primary
school), X9 (number of teachers in secondary schools), X10 (number of tertiary
institutions), X11(secondary school students-teachers ratio), X12 (number of
markets), X15 ( Number of banks), X16 (Number of health care centres).These
variables accounts for 39.1% of the total variance.
Factor II has significant loadings on 2 variables with an eigenvalue of 2.97 and
explains 11.0% of the total variance. The variables are X1 (Length of major
access roads), X2 (Number of Post Offices), The underlying factor is therefore
labeled transport and Communication.
Factor III has a significant loading on 3 variables, namely X17 (number of
hospital beds), X18 (number of medical doctors) and X19 (number of
nurses/midwives). It explains 6.2% of the total variance, and has an eigenvalue of
1.68. Consequently, the factor is described as medical infrastructural facilities.
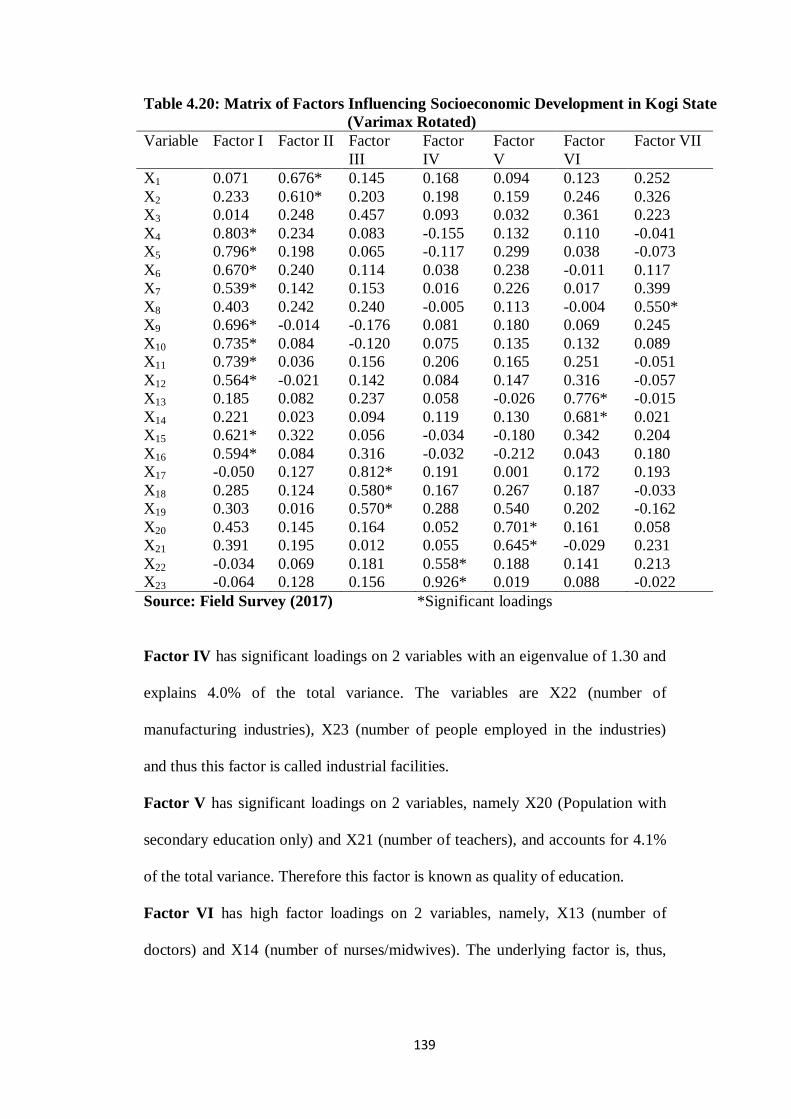
139
Table 4.20: Matrix of Factors Influencing Socioeconomic Development in Kogi State
(Varimax Rotated)
Variable Factor I Factor II Factor
III
Factor
IV
Factor
V
Factor
VI
Factor VII
X1 0.071 0.676* 0.145 0.168 0.094 0.123 0.252
X2 0.233 0.610* 0.203 0.198 0.159 0.246 0.326
X3 0.014 0.248 0.457 0.093 0.032 0.361 0.223
X4 0.803* 0.234 0.083 -0.155 0.132 0.110 -0.041
X5 0.796* 0.198 0.065 -0.117 0.299 0.038 -0.073
X6 0.670* 0.240 0.114 0.038 0.238 -0.011 0.117
X7 0.539* 0.142 0.153 0.016 0.226 0.017 0.399
X8 0.403 0.242 0.240 -0.005 0.113 -0.004 0.550*
X9 0.696* -0.014 -0.176 0.081 0.180 0.069 0.245
X10 0.735* 0.084 -0.120 0.075 0.135 0.132 0.089
X11 0.739* 0.036 0.156 0.206 0.165 0.251 -0.051
X12 0.564* -0.021 0.142 0.084 0.147 0.316 -0.057
X13 0.185 0.082 0.237 0.058 -0.026 0.776* -0.015
X14 0.221 0.023 0.094 0.119 0.130 0.681* 0.021
X15 0.621* 0.322 0.056 -0.034 -0.180 0.342 0.204
X16 0.594* 0.084 0.316 -0.032 -0.212 0.043 0.180
X17 -0.050 0.127 0.812* 0.191 0.001 0.172 0.193
X18 0.285 0.124 0.580* 0.167 0.267 0.187 -0.033
X19 0.303 0.016 0.570* 0.288 0.540 0.202 -0.162
X20 0.453 0.145 0.164 0.052 0.701* 0.161 0.058
X21 0.391 0.195 0.012 0.055 0.645* -0.029 0.231
X22 -0.034 0.069 0.181 0.558* 0.188 0.141 0.213
X23 -0.064 0.128 0.156 0.926* 0.019 0.088 -0.022
Source: Field Survey (2017) *Significant loadings
Factor IV has significant loadings on 2 variables with an eigenvalue of 1.30 and
explains 4.0% of the total variance. The variables are X22 (number of
manufacturing industries), X23 (number of people employed in the industries)
and thus this factor is called industrial facilities.
Factor V has significant loadings on 2 variables, namely X20 (Population with
secondary education only) and X21 (number of teachers), and accounts for 4.1%
of the total variance. Therefore this factor is known as quality of education.
Factor VI has high factor loadings on 2 variables, namely, X13 (number of
doctors) and X14 (number of nurses/midwives). The underlying factor is, thus,
140
accessibility to credit facilities. This factor has an eigenvalue of 0.76 and explains
2.8% of the total variance.
Finally, Factor VII has a significant loading on only 1 variable, namely, X8
which is (percentage of people employed in industries). It has a factor loading of
0.550, explains 2.7% of the total variance, and has an eigenvalue of 0.72.
Variable X3 did not load and therefore not accounted for, either because of the
inconsistent data among other factors.
The factor analysis explained further according to (Norman and Streiner (1986) cited in
Tabachnick and Fidell, (2001); that if there are few correlations above 0.30 it is
inappropriate using factor analysis which clearly is not an issue with the correlation
coefficient matrix of the socioeconomic development indicators in this study.
Reliability test using KMO and Bartlett‘s Test of sampling adequacy was carried out to
determine the strength of the correlated variables to allow for the factor analysis which
varies between 0 and 1. The values closer to 1 are better and the value of 0.60 is the
suggested minimum. The approximate Chi-square is 10175.867 with 351 degrees of
freedom, which is significant at 0.05 Level of significance and KMO statistic of 0.832,
hence the appropriateness of factor analysis for this data. Generally observable was the
positive correlation co-efficient typical between most of the socioeconomic
development indicators with only a few having negative relationship between them.
This shows the interdependency of the various socioeconomic development indicators
in the study area.
According to this study, the possible factors underlying the spatial dimension of
socioeconomic development came out to be historical, political, social, infrastructural,
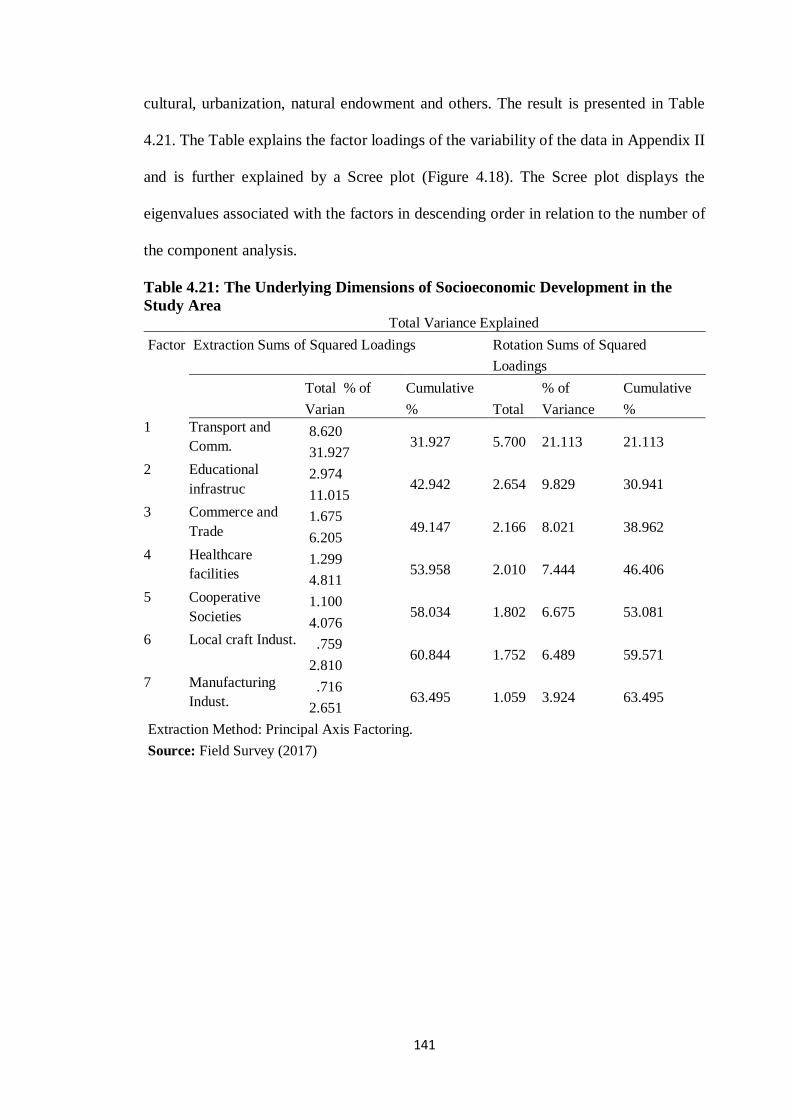
141
cultural, urbanization, natural endowment and others. The result is presented in Table
4.21. The Table explains the factor loadings of the variability of the data in Appendix II
and is further explained by a Scree plot (Figure 4.18). The Scree plot displays the
eigenvalues associated with the factors in descending order in relation to the number of
the component analysis.
Table 4.21: The Underlying Dimensions of Socioeconomic Development in the
Study Area Total Variance Explained
Factor Extraction Sums of Squared Loadings Rotation Sums of Squared
Loadings
Total % of
Varian
Cumulative
%
Total
% of
Variance
Cumulative
%
1 Transport and
Comm. 8.620
31.927 31.927 5.700 21.113 21.113
2 Educational
infrastruc 2.974
11.015 42.942 2.654 9.829 30.941
3 Commerce and
Trade 1.675
6.205 49.147 2.166 8.021 38.962
4 Healthcare
facilities 1.299
4.811 53.958 2.010 7.444 46.406
5 Cooperative
Societies 1.100
4.076 58.034 1.802 6.675 53.081
6 Local craft Indust. .759
2.810 60.844 1.752 6.489 59.571
7 Manufacturing
Indust. .716
2.651 63.495 1.059 3.924 63.495
Extraction Method: Principal Axis Factoring.
Source: Field Survey (2017)
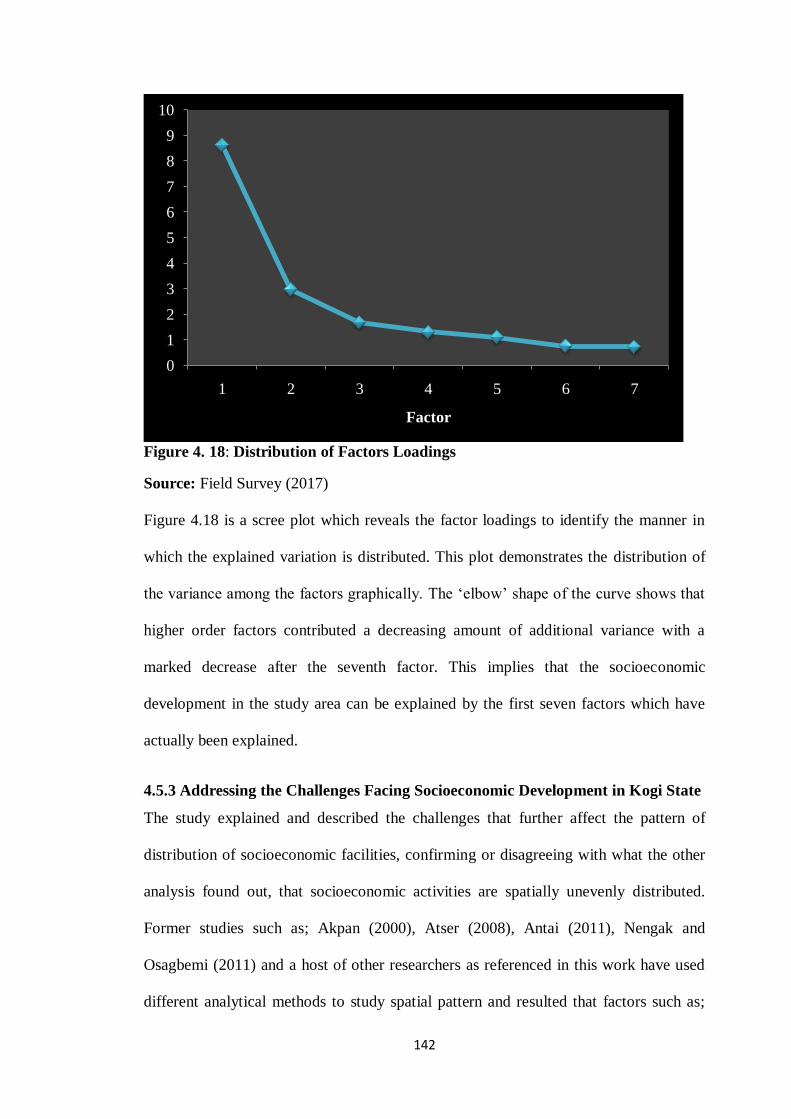
142
Figure 4. 18: Distribution of Factors Loadings
Source: Field Survey (2017)
Figure 4.18 is a scree plot which reveals the factor loadings to identify the manner in
which the explained variation is distributed. This plot demonstrates the distribution of
the variance among the factors graphically. The ‗elbow‘ shape of the curve shows that
higher order factors contributed a decreasing amount of additional variance with a
marked decrease after the seventh factor. This implies that the socioeconomic
development in the study area can be explained by the first seven factors which have
actually been explained.
4.5.3 Addressing the Challenges Facing Socioeconomic Development in Kogi State
The study explained and described the challenges that further affect the pattern of
distribution of socioeconomic facilities, confirming or disagreeing with what the other
analysis found out, that socioeconomic activities are spatially unevenly distributed.
Former studies such as; Akpan (2000), Atser (2008), Antai (2011), Nengak and
Osagbemi (2011) and a host of other researchers as referenced in this work have used
different analytical methods to study spatial pattern and resulted that factors such as;
0
1
2
3
4
5
6
7
8
9
10
1 2 3 4 5 6 7
Factor
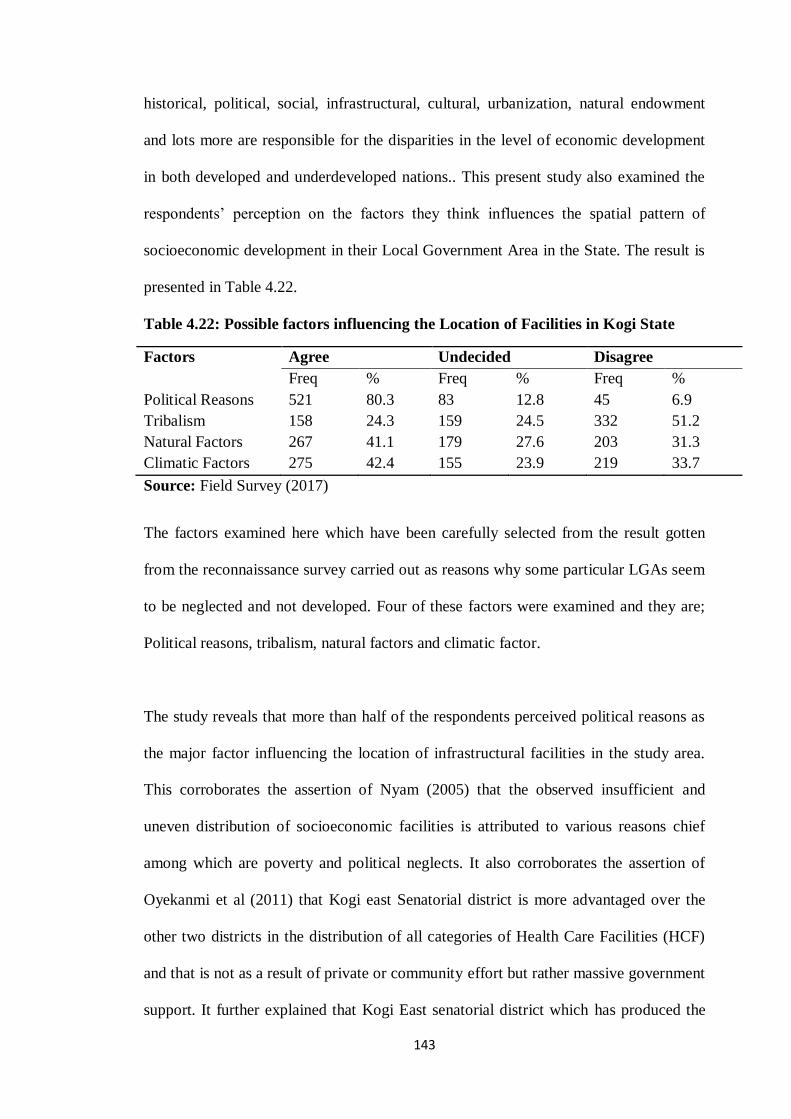
143
historical, political, social, infrastructural, cultural, urbanization, natural endowment
and lots more are responsible for the disparities in the level of economic development
in both developed and underdeveloped nations.. This present study also examined the
respondents‘ perception on the factors they think influences the spatial pattern of
socioeconomic development in their Local Government Area in the State. The result is
presented in Table 4.22.
Table 4.22: Possible factors influencing the Location of Facilities in Kogi State
Factors Agree Undecided Disagree
Freq % Freq % Freq %
Political Reasons 521 80.3 83 12.8 45 6.9
Tribalism 158 24.3 159 24.5 332 51.2
Natural Factors 267 41.1 179 27.6 203 31.3
Climatic Factors 275 42.4 155 23.9 219 33.7
Source: Field Survey (2017)
The factors examined here which have been carefully selected from the result gotten
from the reconnaissance survey carried out as reasons why some particular LGAs seem
to be neglected and not developed. Four of these factors were examined and they are;
Political reasons, tribalism, natural factors and climatic factor.
The study reveals that more than half of the respondents perceived political reasons as
the major factor influencing the location of infrastructural facilities in the study area.
This corroborates the assertion of Nyam (2005) that the observed insufficient and
uneven distribution of socioeconomic facilities is attributed to various reasons chief
among which are poverty and political neglects. It also corroborates the assertion of
Oyekanmi et al (2011) that Kogi east Senatorial district is more advantaged over the
other two districts in the distribution of all categories of Health Care Facilities (HCF)
and that is not as a result of private or community effort but rather massive government
support. It further explained that Kogi East senatorial district which has produced the
144
civilian Chief Executives of the state since its creation in 1991 until recently 2016/2017
which made the district to rank far ahead of the other two districts in the distribution of
HCFs. It also agreed with Friedmann (1972) in Todaro (2000) which stated that the use
of government and economic power is probably the most important single influence on
spatial differentiation of human life chances in the development of urban systems. Also
the significance of politics in other regions as well as Kogi State in determining
intercity distribution has been stressed by writers in geography. A distinction is often
made between institutional bases of influence and power vested in individual.
In the former, power is attributed to people‘s access to political parties, business
corporations, religious organization and others which have power resources in such
forms as wealth, votes or prestige; persons able to employ an institution‘s power
resources are considered to have power. In the later, the compliance of others is based
on the power that an individual can bring to interpersonal relations, such as those
between monarch and subjects, employer and employees, union leaders and members,
or consumer and monopoly supplier. With this there is bound to be uneven distribution
of resources.
Tribalism as perceived by the respondents reveals that a few above half of the
respondents ‗disagreed (51.2%) that tribe does not play a key role in the location of
facilities in the study area. 24.5% were undecided and 24.3 agreed totally. In the study
area, the sample of population in agreement is the minority group in a section of the
community who feel cheated. This is also in agreement with the research of Oyekanmi
et al (2011) which retreated that a particular tribe in the state has been in the fore front
of producing the civilian chief executives of the state since the creation of the state.
145
This may be the reason why the eastern senatorial district is more developed holding all
other factors constant.
The research also confirmed that 41% of people agreed that natural factor is responsible
for the pattern of infrastructural distribution. 31% did not agree and 27% were
indifferent. This corroborate with the work of Oduro et al (2014), where natural factor
such as forest resources in the forest zones are more socio-economically developed
than those located in the savannah zone. This may account for the reason why Kogi
east senatorial district is more developed than the other two districts. This is reflected in
chapter three of this work under vegetation in the study area where it is observed that
the rain forest vegetation covers Dekina, Ofu, Ankpa, Olamabore, Idah and Bassa
which are the LGAs in the eastern senatorial district.
The west and the central senatorial districts such as Yagba-East, Yagba-West, Kabba-
bunu, Ijumu, Kogi, Mopa-muro, Lokoja and Kogi are in the guinea savannah with some
parkland vegetation. These areas do not have the natural advantage of forest vegetation
the eastern senatorial district has that has lead to some form of the economic
development. This also is a possible factor of uneven development holding all other
factors constant.
Climatic factor is also among the factors that may possibly determine infrastructural
distribution in the state as observed by the respondents. There is the possibility that the
type of climate in the eastern senatorial district of the state favours the growth of
luxuriant vegetation which in essence affects the socio-economic development of the
146
areas under the LGA holding other factors constant. Less than half (42.2%) of the
respondents agreed, 23.9% were undecided and 33.7% disagreed.
Climatic factor may be responsible for the differential distribution of some
socioeconomic infrastructures like markets, industries, communication services and a
host of other infrastructures in the study area. As seen in chapter three of this work
under climate, that climatic condition has in no small measure has affected the
socioeconomic development of Kogi state. Climatic type is responsible for the
vegetation type in the study area which in essence brings about some kinds of
industries and employment opportunities. The type of vegetation in an area can be
bring about some kinds of multiplier effects in terms of lumbering industries, sawmill
industries and other things. This is in agreement with the work of Oduro et al (2014) in
the analysis of the determinant of spatial inequality in Ghana, the result shows that as
Ghana is concerned, districts located in the forest zone tend to be more socio-
economically developed than districts located in the savannah zone. This is primarily
due to a number of peculiar natural constraints that hinder development in the savannah
zone. These include long periods of drought, perennial bushfires, frequent and
extensive spates of flooding, and a short farming season.
The consequences of these factors for communities located in the savannah zone
include seasonal unemployment (during the long dry season), food insecurity, limited
sources of livelihoods, high levels of poverty, and out-migration of the youthful and
educated segments of the population. This brings about inequality in development.
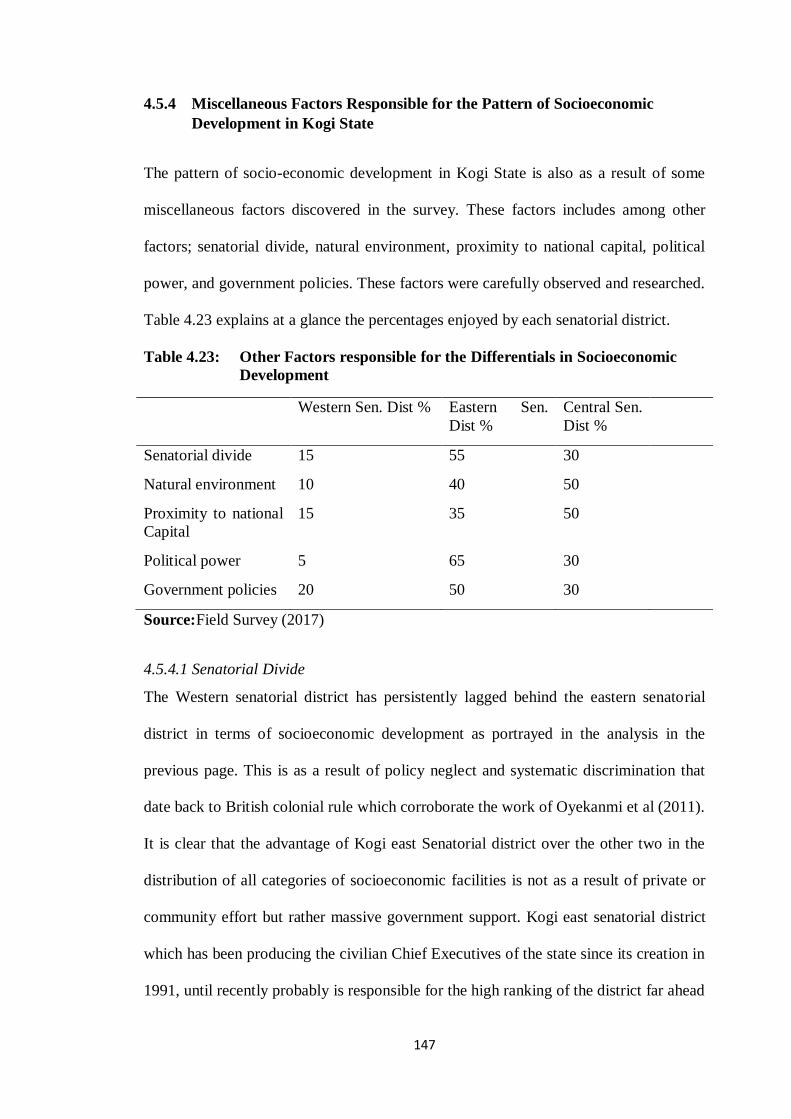
147
4.5.4 Miscellaneous Factors Responsible for the Pattern of Socioeconomic
Development in Kogi State
The pattern of socio-economic development in Kogi State is also as a result of some
miscellaneous factors discovered in the survey. These factors includes among other
factors; senatorial divide, natural environment, proximity to national capital, political
power, and government policies. These factors were carefully observed and researched.
Table 4.23 explains at a glance the percentages enjoyed by each senatorial district.
Table 4.23: Other Factors responsible for the Differentials in Socioeconomic
Development
Western Sen. Dist % Eastern Sen.
Dist %
Central Sen.
Dist %
Senatorial divide 15 55 30
Natural environment 10 40 50
Proximity to national
Capital
15 35 50
Political power 5 65 30
Government policies 20 50 30
Source:Field Survey (2017)
4.5.4.1 Senatorial Divide
The Western senatorial district has persistently lagged behind the eastern senatorial
district in terms of socioeconomic development as portrayed in the analysis in the
previous page. This is as a result of policy neglect and systematic discrimination that
date back to British colonial rule which corroborate the work of Oyekanmi et al (2011).
It is clear that the advantage of Kogi east Senatorial district over the other two in the
distribution of all categories of socioeconomic facilities is not as a result of private or
community effort but rather massive government support. Kogi east senatorial district
which has been producing the civilian Chief Executives of the state since its creation in
1991, until recently probably is responsible for the high ranking of the district far ahead
148
of the other two districts in the distribution of the various facilities. There are more
healthcare facilities in the eastern senatorial district based on the Z-Score and the LQ
analysis. This is also the same for other facilities. Table 4.22 reveals the percentage
distribution.
4.5.4.2 Natural Environment
The natural environment is also a probable factor. It is proposed that the level of socio-
economic development of a region holding every other factor constant is dependent on
the natural environment within which it is located, including ecological conditions and
natural resource endowments (Oduro et al, 2014). That is, differences between districts
in terms of natural forces are expected to translate into different levels of human
wellbeing. The natural environment in this area includes the rain forest and the savanna
vegetation.
The rain forest vegetation which covers Dekina, Ofu, Ankpa, Olamaboro, Idah and
Bassa local government areas with rich wooded trees including palms, Iroko and
mahogany. The rain forest vegetation is a natural advantage for the eastern senatorial
district. It has attracted lumber men from the neighboring villages and states which in
turn led to the establishment of saw mill industries of various categories in the
senatorial districts. There are more job opportunities in the senatorial district compared
to the other two senatorial districts. As a result of the saw mill industries, other local
and small medium scale industries emerged, such as upholstery, carpentry, food
vending, snacks and drinks shops and a host of others. All these have led to inequalities
in the socio-economic activities of the area. Other local government areas in the west
and the central senatorial districts such as Yagba-East, Yagba-West, Kabba/Bunu,
Ijumu, Kogi, Mopa-muro, Lokoja and Kogi are in the guinea savannah with some
149
parkland vegetation which only favour some form of farming activities. The grasses are
tall and very luxuriant, but do not have the natural advantage of forest vegetation the
eastern senatorial district has that has led to some form economic development. These
senatorial districts engage in farming according to what their environment can offer.
4.5.4.3 Proximity to State Headquarters
By reason of a LGA status and administrative centres, (capitals) they attract more
governmental and non-governmental activities and population than ordinary towns and
cities. Thus, by virtue of their status and functions, State and Local government
headquarters have the potential to develop faster than other settlements which are not.
In the 21 LGAs, It is only Lokoja that doubles as a regional, state and local government
headquarters which by implication perform better than those that are not. That is,
holding all other factors constant, it is proposed that towns that double as regional, state
capitals and Local government headquarters are more developed than ordinary districts.
The state capital, Lokoja is the state‘s industrial and commercial hub and thus receives
more investments than any other district, which is expected to make it the most
developed LGA in the state all things been equal. This may not be because of a number
of reasons among which is population that is available to share the available facilities.
The Local government area is also closer to the National Capital (Abuja) and as a result
of these commercial activities the LGA is supposed to be more viable than the other
Local government areas. It was also gathered that the LGAs closer to Lokoja the State
Capital enjoy some form of developments than those farther away. This can be
summarized into distance barrier, political and other things. Roads are more developed
in these LGAs, water, healthcare and other infrastructures are better developed in these
areas. This is agreement with the works of Oduro et al, (2014) in Ghana which support
150
the works of Acquah 1957 cited in Grant and Yankson (2003) which states that Accra
should not have been the most developed city in Ghana.
The work further states that, the city of Accra which is located at the heart of the
narrow coastal savannah belt which is dryer and experiences harsher ecological
conditions than districts located in the interior (northern) savannah. It went further to
explain, that about 200 years ago, Accra was little more than a trading post,
undifferentiated from many of the other post along the Gold coast. But the decision of
the British colonialists to develop the place as a new colonial capital in 1877
transformed Accra from a village to a city. And as the country‘s industrial and
commercial hub, Accra together with the neighboring city of Tema receives more
investments than any other district. And it found out, that the city has over the decades
played the role of a national development node from which innovations, economic
growth and social transformation originate and trickle down to other parts of the
country. Lokoja is found to have such an advantage with her status as a road junction,
LGA headquarters and a state capital.
4.5.4.4 Political Power
The only general agreement appears to be that power involves the capacity of a person
or group to achieve compliance from others to bring about or resist change (Isa, 2006).
In other words, power concerns ability to influence the actions and beliefs of others.
Who get what, where, and how? Is very much a matter of practical politics? The use of
government and economic power is probably the most important single influence on
spatial differentiation of human life chances in the development of urban systems.
Also, the significance of politics in determining infrastructural distribution is
veryimportant.
151
Kogi State was created in 1991 and since the creation of the state till 2015, the eastern
senatorial district has been producing the state governors, names cannot be mentioned
for security reasons. And by reason of their status as the people in government, the
district attracts more governmental and non-governmental activities, which is in
agreement with Nyam (2005) that the observed insufficient and uneven distribution of
socioeconomic facilities inNigeria is attributed to various reasons among which are
political neglect.
The Eastern senatorial district stands as the state‘s industrial and commercial hub and
thus receives more investments than any other district, making it the most developed
district in the state. Kogi East senatorial district consistently remained at the top of the
development ladder, while, Kogi Central remained persistently at the bottom of ranks
and Kogi west senatorial district occupied the middle position.
152
CHAPTER FIVE
SUMMARY, CONCLUSION AND RECOMMENDATIONS
5.1 SUMMARY OF FINDINGS
The analysis has shown clearly that there exists inequality in the distribution of the
socioeconomic variables that cumulates into inequality in economic development in
Kogi State, Nigeria.
The distribution of the facilities of economic development employed in this study has a
reflection of marked spatial variations among the LGAs in the study area. All the
dimensions used manifested some levels of spatial inequality in their distribution.
While some LGAs recorded LQs of 1 indicating a high performance in the
socioeconomic development infrastructures, Some LGAs recorded negative scores
indicating low performance. The LQ technique showed that some local government
areas performed better than others in the distribution of essential services to the people.
It is clear that some areas have more than their average shares in some of the variables
while some others have less. The pattern of distribution of socioeconomic development
infrastructures is compact and concentrated in a few urban areas of the state compared
with distant areas. Some areas actually receive more government support than others.
These areas enjoy high level of infrastructural facilities and as such are developed than
others.
The extent of spatial inequality in socioeconomic development infrastructures was also
determined by subjecting the data to hypothetical tests at different levels of
significances. The study reveals a significant pattern of inequalities in the level of
distribution of the various socioeconomic infrastructural facilities used in this study.
153
The level of socioeconomic development among the LGAs showed categories of
development which cumulated into the LGAs being ranked as upper, middle and
bottom based on their performance in the distribution of facilities. It was discovered
that the upper group has seven LGAs that performed excellently well with high LQs
having Ogori (1.82) and Idah (1.78) to be the most advantaged. It was also discovered,
that seven LGAs were highly disadvantaged of which Adavi (0.60) and Okene (0.58)
were the most disadvantaged.
In kogi state, there seems to be a discernible pattern of inequalities in development
indicators across LGAs of the state. Some LGAs enjoy huge government presence,
while others suffer complete neglect or fairly enjoy government presence. The study
also revealed that among other factors responsible for the observed pattern in the study
area include economic, environmental, government, geographical location among
others.
On the basis of factors responsible for the pattern of socioeconomic development
differentials in the study area, the study discovered thatnatural factor 27.6 % and
tribalism 24.5%ranked very high than other factors.
The challenges of the pattern of socioeconomic development in the study area were
examined. It was discovered that the socioeconomic differentials was attributed to
political reasons and a huge government presence.It is important to write here that; as a
result of the varying proportions of inequalities experienced in this study, it shows that
the government both at the top and the lower level have enormous role to play within
the space-economy as it affects the distribution of socioeconomic facilities. The issue
154
of inequality in the distribution of basic socioeconomic facilities is not confined to the
local government areas alone but also serious attention should be focused on both intra-
local and state administrative entities.
5.2 CONCLUSION
This study has been able to address some major issues in the spatial inequalities in
socioeconomic development in kogi state. It has been able to analyze the extent of
spatial variation in socioeconomic development in the state stressing major
developmental problems in the study area that requires serious attention. One of the
reasons why it requires serious policy attention is that it threatens national security.
The study has revealed that some areas are having more than average shares, thus
making such facilities to be localized. In fact, education, health care, good water, good
roads and electricity are basic and fundamental to survival of life. No citizen should be
denied or deprived of these essential services. But it is clear that, these services are
localized in the study area which, thus means, that one would have to travel long
distances before you can enjoy them, like having to live in bigger towns. This kind of
lopsided spatial pattern of development tends to aggravate the problem of regional
imbalance which the federal government should try to correct.
While government recognized the population mobility from the rural to urban centres
and each successive government had always come out with rural development
strategies, it has always been effort in futility. Some of the strategies include river basin
development scheme, better-life for rural women, community development scheme,
integrated rural development, directorate of food, roads and rural infrastructures and
155
mass mobilization programme. The failure of these strategies to achieve the desired
goals is centered on non-programmatic approach to development planning.
The result revealed that there is a consistently high level of infrastructural distribution
inequality in the study area. Generally most of the LGAs are found to be
disadvantaged in these facilities. This is a pointer to the socioeconomic planners that
many LGAs and people in the state are still marginalized and wallowing in abject
poverty.
5.3 RECOMMENDATIONS
The following recommendations are proffered to help tackle the problems and
challenges militating against infrastructural distribution injustice in Kogi State,
Nigerian in order to achieve a better infrastructural distribution.
(1) The government has to be more proactive in developing ways and means of
bridging the gap between the advantaged and the disadvantaged areas of the
state. Part of this would involve more positive discriminatory investments in
favour of the less privileged areas in subsequent resource allocations by
government, community leaders and individual philanthropists. Really there is
no doubt that if all areas had equal amount of influence in the manner that
common resources are distributed, there definitely would have been greater
degree of equality.
(2) The community development strategy can be encouraged with the community
that embarked upon socioeconomic projects like building of schools,
construction of roads, bridges, health centres, electrification and water projects
by giving such communities financial and technical assistance. By doing so,
156
both the government and the community can be partners in progress and
inequality can be bridged to some extent.
(3) The disadvantaged local government areas can also be transformed by
purposeful discriminatory investments in favour of those areas that are
disadvantaged. This can be done by concentrating investments in such local
government areas. The process of rehabilitation may be by redirecting
government‘s development projects and attention to such communities or
accelerate development process through private collaboration and efforts of
corporate individuals.
(4) Developing marginalized areas can abate misunderstanding and discontentment
that may arise when backward communities feel they are unfairly catered for.
Rehabilitating backward communities will promote economic growth and help
to improve the well-being of the communities concerned. The people in
authority need to improve on the spatial distribution of all economic facilities
such that a distributive justice is ascertained in all areas that make up the state
and Nigeria as a whole. A situation where over a half of the territory of its
jurisdiction suffered from deprivation suggests that there is room for
improvement.
(5) In conclusion, the study therefore suggests a business friendly environment to
encourage small and medium scale business and entrepreneurs to partner with
the state government to develop the state through developmental projects.
5.4 SUGGESTIONS FOR FURTHER STUDIES
This study identified that there are a good number of policy and planning implications
for economic growth and development with regard to spatial inequalities in Kogi State
and the country as a whole. It is apparent from the foregoing that tremendous research
157
efforts have gone into the study of spatial inequalities of socioeconomic development,
yet there still exist gaps in knowledge. The following gaps have been identified:
First, subsequent studies can use political economy perspective for the understanding of
the structure and pattern of spatial inequalities, both in the rural and urban areas.
Secondly, there is not enough studies that has used economic, social and spatial
measures of development that capture social structure, national institutions, quality of
environment and poverty alleviation for understanding the inner meaning of spatial
inequalities of socio-economic development.
Thirdly, further studies may undertake to examine spatial inequalities in socio-
economic development using different statistical techniques such as Lorenz curves, and
Gini-co-efficient different from those adopted in this present study.
Lastly, this study adopted local governments as unit of observation; subsequent studies
may decide to use senatorial, districts or wards and compare results.
158
REFERENCES
Abumere, S.I., Okafor S.I and Oluwasola, O (2002). Rural Infrastructure and
Development Process in Rural Nigeria. Research Report No. 36. Development
Policy Center, Ibadan, Nigeria.
Acemoglu, D., Simon, J., and James A. R (2001). The Colonial Origins of Comparative
Development: An Empirical Investigation. American Economic Review 91: 1369–
1401.
Acemoglu, D. (2002). Reversal of Fortunes: Geography and Institutions in the Making
of the Modern World Income Distribution.‖ Quarterly Journal of Economics
117:1231–94.
Ades, A.F., and Glaeser, E.L .(1995).Trade and Circuses: Explaining Urban
Giants.Quarterly Journal of Economics 110: 195–227. Ades, A.F., and
Glaeser,E.L 1995. Trade and Circuses: Explaining Urban Giants.‖ Quarterly
Journal of Economics 110: 195–227.
Adedeji, A. (1989). Towards A Dynamic African Economy: Selected Speeches and
Lectures. Great Britain: Frank Cass and Company Limited.
Adefila, J.O. (2008). Spatial variations in infrastructural development in Benue
State‖.Savanna: Journal of environmental and social sciences.Ahmadu Bello
University Press. Zaria. 21(1&2):137-145
Adefila, J. O. (2012a).Geo-political structure and integration strategies in Nigeria since
independence: A critiqueJournal of public administration and governance
(JPAG). 2(2):9-18. Macrothink Institute. Las Vegas. United States‘ University.
Nevada
Adefila, J. O. (2012b). Regional inequalities in socio-economic development in
Nassarawa State of Nigeria: A spatial analysis for planning.Journal of Asian
Social Science. 9(1):1-6.
Adefila, J.O and Bulus, J.S (2014). Spatial Inequalities in Infrastructural Development
in Plateau State, Nigeria. American International Journal of Contemporary
Research
Adefolalu, A.A (1991).Towards a realization of better transport services in Nigeria. In
Onakoraiye, S.O and Ekanem, N.F. (Eds).Transport in Nigerian National
Development.Proceedings of National Conference, July 4th
-9th, 1977, University
of Ibadan.NISSER. Ibadan. Pp 159-178.
Adegboyega, T. (2006). Reforms: OBJ‘s Santimonious Sermon. The Nation
Newspaper, December 10 2005.
Aderamo, A.J and Aina, O.A (2011). Spatial Inequalities in Accessibility to Social
amenities in developing Countries: a case from Nigeria. Australian journal of
Basic and Applied Science, 5(6): 316-322
159
Adubi, A.A (2002). Pre- Budget Link in Nigeria: An Explrating Investigation.NCENI
Policy Analysis Series.
Afolayan, G.P (2008). Community Participation in Urban Infrastructure Provision: The
case of medium-sized towns in Kwara State. Unpublished Ph.D Thesis submitted
to the Department of Geography, University of Ilorin, Nigeria.
Ajala, O.A and Adeyinka S.A. (2001). Accessibility to Health Care Facilities: A
Panacea for Sustainable Rural Development, Osun State, South Western Nigeria.
Ajayi, G., (2007).The Military and the Nigerian State, 1966-1993: AStudy of the
Strategies of Political Power Control Africa World Press, Trenton New Jersey.
Akin-Olagunju, O.A and Omoniwa, B.T (2014). Income sources, inequality and
poverty among rural households in Ibadan, Oyo State, Nigeria, Journal of
Agricultural Economics and Rural Development, 6(1): 75-82
Akpan, P.A., (2000). Spatial Inequality in Nigeria in Nigerian Development. The Case
of Akwa Ibom State.African Journal of Development Studies, 2(1 and 2) 78-86
Alabi, M.O and Ocholi I (2010). State of Infrastructure and Funding in Kogi State,
Nigeria. Current Research Journal of Social Sciences 2(3): 209-213. ISSN: 2041-
3246
Alapiki, H. (2009): Politics and Governance in Nigeria. Owerri: Corporate Impressions.
Ale, M.O., Abisuwa, T.A., Olagunagba F.O. and Ijarotimi, O., (2011). Rural
infrastructural Development, Food Security and city congestion in Nigeria.
Ali-Nejadfard, F., (2000). Rural travel and transport and economic development:
Problems and Prospects- examples from Malawi and Zimbabwe in Kaumbutho,
P.G: Pearson, R.G. and (ds) Empowering Farmers with Animal Tradition.
Proceedings of ATNESA Workshop, September, 1999, Mpumelanga, South
Africa.http://www.atnesa.org
Alonso-Villar O. (2010). Large metropolisein the Third world: An Explanation. Urban
Studies 38(8).
Asolo , A.A.A (2000). Development Issues in Nigeria. The challenges of NGOs in the
New Millennium African Journal of Social and Policy Studies 1(2):
Ayeni, B; (2000). Africa‘s experience with regional development planning and
management Downloaded from Regional Perspective
(http/157.150.118.3/home.htm) 25/6/2002
Ayo, E.J. (1988) Development Planning in Nigeria. Ibadan: University Press.
Azzoni, C., Menezes‐Filho, N and Taitane, M. (2005).Opening the Convergence Black
Box: Measurement Problems and Demographic Aspects.In Spatial Inequality and
Development, eds. R. Kanbur and A.J. Venables. Oxford: Oxford University
Press.
160
Babangida I.B (1986).Mobilizing Popular Participation for Rural Development.
Address at Seminar on Inegrated Rural Development; held at the National Istitute
of International Affairs, Lagos.
Balisacan, A.M., and Nobuhiko F. (2006).Changes in Spatial Income Inequality in the
Philippines: An Exploratory Analysis. In Spatial Disparities in Human
Development: Perspectives from Asia. Edited by R. Kanbur, A. Venables, and G.
Wan. United Nations Press.
Balogun, G.F; (2009). Analysis of the Spatial Distribution of Accredited Hospitals of
the National Health Insurance Scheme (NHIS) in Kaduna Metropolis. M.SC
thesis, Geogrphy, Department of Social Sciences Nigerian Defence Academy,
Kaduna.
Balogun, O; (1989). Pattern of development in the space economy of Kwara
State.Ph.D. thesis. Geography, Social Sciences.University of Ibadan.
Banerjee, A. V., and Lakshmi I. (2005).History, Institutions and Economic
Performance: The Legacy of Colonial Land Tenure Systems in India.‖American
Economic Review 95: 1190–1213.
Barrios, S. Luisito, B. and Eric S. (2006).Climatic Change and Rural‐Urban Migration:
The Case of Sub‐Saharan Africa.‖Journal of Urban Economics 60: 357–71.
Berliant, M. (2007): Prospects for a Unified Urban General Equilibrium Theory‖
Regional Science and Urban Economics 37: 466–71.
Bernardin, S. (2012). Education Inequality in Ghana: Gender and Spatial Dimensions.
Journal of Economic Studies, Vol.39 Issue: 6, PP 724-739, https://
doi.org/10.1108
Beyene, J., Erabor, O., Boucher, S.R and Chandna, R.C., (2005). Method for
Confidence Interval Estimation of a Ration Parameter with Application to
Location Quotients. PMCID: PMC 1274325. Accessed on 21st July 2016.
Boudiville, J.P (1966). Problems of Regional Economic Planning, Edinburg, University
press.
Bruhn, M., and Francisco A. (2007): Good, Bad, and Ugly Colonial Activities:
Studying Development Across the Americas.Unpublished paper.
Canback, D (2008).C-GIDD (Canback Global Income Distribution
Database).http://dx.doi.org/10,4135/97141. Accessed on 20/08/2008
Central Bank of Nigeria (2005). CBNBrief (2004-2005 Edition). Abuja: Research and
Statistics Department of Central Bank of Nigeria.
Christianesen, L, Lionel, D and Stefano, P.(2005).Reforms, remoteness and Risk in
Africa: Understanding Inequality and Poverty During the 1990s.‖In Ravi Kanbur
and Anthony J. Venables (editors), Spatial Inequality and Development.Oxford
University Press.January.
161
Claude, S and Dias P. (2007). Using Indicators in Planning education for rural people:
A practical guide. FAO-UNESCO- HEP. International Institute for Educational
Planning.
Cole, G.A (1993). Management: Theory and Practice (4th
Edition). London; DP
Publications
Crafts, N, and Abay M. (2006).How Did the Location of Industry Respond to Falling
Transportation Costs in Britain Before World War I?Journal of Economic History
66: 575–606
Cronon, W. (1991).Nature’s Metropolis. W.W. Norton & Company.Journal of
Economic Studies, Vol.39 Issue: 6, PP 652-670, https:// doi.org/10.1108
Datta, A.K (2010). Integrated Material Management: A Functional Approach. New
Delhi: Prentice Hall International Publishers.
Dumais, G, Glenn E, and Edward L. G. (2002).Geographic Concentration Dynamic
Process.Review of Economics and Statistics 84: 193–204.
Duranton, G and Henry G. O (2005)Testing for Localization Using Micro‐Geographic
Data.Review of Economic Studies 72: 1077–1106.
Ebehikhalu, N.O. (2004). The impact of infrastructural facilities on the Development of
Rural Areas of Esan Community, Edo State, Nigeria‖ Unpublished M.SC Thesis
Submitted to the Department of Urban and Regional Planning, Obafemi
Awolowo University, Ile-Ife, Nigeria.
Egonmwan, J.S and Ibodje, S. (2001). Development Administration: Theory and
practice. Benin City: Thesyin (Nig) Company.
Elbers, C, Peter L, Johan, M, Berk, Ö, and Kenneth R. S. (2005).Are Neighbours
Equal? Estimating Local Inequality in Three Developing Countries.In Spatial
Inequality and Development, eds. R. Kanbur and A.J.Venables. Oxford: Oxford
University Press.
Ellis, S.D. (1997). Key issues in rural transport in developing countries. TRL Report
no.260.Transport Research Laboratory, Crow Thorne.
Eneh, C.O. (2011). Nigeria‘s vision 20:2020-Issues, Challenges and Implication for
Development Management.Asian Journal of Rural Developments.
Engerman, S L., and Kenneth L. S. (1997).Factor Endowments, Institutions, and
Differential Paths of Growth among New World Economies: A View From
Economic Historians of the United States. In How Latin America Fell Behind:
Essays on the Economic Histories of Brazil and Mexico 1800‐1914.Stanford
University Press.
Enrique, R .C. (2004). The 1980s: The Debt Crises and the Lost Decade USA Centre
for International Finance and Development, the University of Iowa, USA.
162
Escobal, J, and Maximo T. (2005).Adverse Geography and Differences in Welfare in
Peru.In Spatial Inequality and Development, eds. R. Kanbur and A.J. Venables.
Oxford: Oxford University Press.
Ethier, W. J. (1982).National and International Returns to Scale in the Modern Theory
of International Trade.American Economic Review
Fabiyi, I.P (2011). Spatial distribution and performance of water pumps in the rural
areas of Kaduna State, Nigeria; before the Second Republic. European Journal of
Social Sciences. 26(1): 15-25
Fanan, U and Felix K (2014). Analysis of the Spatial Distribution of Health Facilities in
Benue State, Nigeria.
Fay, M, and Charlotte O.(2000). Urbanization without Growth: A Not So Uncommon
Phenomenon.‖Unpublished paper.
Federal Government of Nigeria (1970). Second National Development plan (1970-74),
Lagos, Federal Ministry of Finance.Vol 1 and 11.
Federal Government of Nigeria (1975). Third National Development plan (1975-80),
vol. 1 and 11.Federal Ministry of Economic Development, Lagos.
Federal Government of Nigeria (1980). Fourth National Development Plan 1981-85 vol
1 and 11, Federal ministry of National planning Lagos.
FGN (2007). Federal Republic of Nigeria Official Gazette, Vol. 94 (24): 190-191.
Printed and Published by the Federal Government Printer, Lagos, Nigeria.
Federal Republic of Nigeria (2001). National Policy on Integrated Rural Development.
Federal Ministry of Agriculture and Rural Development. Abuja
Forster, M, David J, and Timothy S.(2005). Regional Poverty and Income Inequality in
Central and Eastern Europe: Evidence from the Luxembourg Income Study. In
Spatial Inequality and Development, eds. R. Kanbur and A.J. Venables.Oxford:
Oxford University Press.
Friedmann, J. (1966). Regional Development Policy: a Case Study of Venezuela.
Cambridge, Mass: M.I.T. Press.
Friedmann, J. (1967). A general theory of polarized development. In The Ford
Foundation Urban and Regional Advisory Programme in Chile , Santiago.
Friedmann, J and Alonso, W (1964). Regional Development and Planning: A review.
Cambridge, Mass; The M.I.T. Press. P 209.
Friedmann, J. (1972a).A general theory of polarized development.M. Hansen, editor,
Growth Centres in Regional Economic Development. The Free Press, New York.
Friedmann, J. (1972b).The Spatial Organization of Power in the Development of Urban
Systems in Development and Change 4(3) Pp 12-50.
163
Fujita, M, Paul K, and Anthony J. V.(1999).The Spatial Economy: Cities, Regions, and
International Trade. MIT Press.
Fujita, M, and Jacques‐François T. (2002).Economics of Agglomeration: Cities,
Industrial Location, and Regional Growth. Cambridge: Cambridge University
Press.
Gana, J.A; (1992).Growth Center and Rural Development; A Review of Case Studies;
Paper Presented at the 29th annual Conference of the Nigerian Geographical
Association at Ahmadu Bello University, Zaria.
Glaeser, E. L., and David C. M. (2001).Cities and Skills.Journal of Labor Economics
19 (2): 316–42
Grant, R and Yankson, P (2003) City Profile; Accra Cities, 20(1), 65-74
Habibu, M.U., Russayani I and Roslan A (2014). Regional Inequality of Educational
Attainment in Nigeria. British Journal of Economics, Management and Trade
4(3): 420-430.
Hafiz A.U, Muhammed I, Ibrahim M. J, Watirahyel W, Maiwada A (2016). Spatial
Analysis of Distribution of Secondary Schools in Giwa Zone of Kaduna State,
Nigeria GUSAU-NIGERIA
Hanson, G. H. (1997).Increasing Returns, Trade and the Regional Structure of
Wages.Economic Journal 107: 113–33.
Hanson, G. H (2007).Globalization, Labor Income and Poverty in Mexico. In
Globalization and Poverty, A. Harrison, ed. Chicago: University of Chicago
Press.
Henderson, J. V. (1974). The Sizes and Types of Cities.American Economic Review 64:
640–56.
Henderson, J. V. (2002).Urbanization in Developing Countries.World Bank Research
Observer 17(1): 89–112.
Henderson, J. V, and Jacques‐François T. (2004). .Handbook of Regional and Urban
Economics, Volume 4. Amsterdam: North Holland
Hehn-Been, L (1970). The Role of the Higher Civil Service under Rapid Social and
Political Change. In Weidner (ed) Development of Administration in Asia:
Durban N.C Dukes University Press.
Hirschman, A. O. (1958).Strategies of Economic Development.Yale University Press.
Idachaba F.S (1985). Rural Infrastructure in Nigeria. Federal Department of Rural
development Ibadan , university press.
Idike, A.A (1992.) Rural Development in Nigeria, an overview in Olisa, M.S.O and
Obiukwu, J.I (Eds) Rural Development in Nigeria: Dynamics and Strategies.
Awka, mekslink Publishers.
164
Idike, A.A (1992).Rural Development in Nigeria, an overview in Olisa, M.S.O and
Obiukwu, J.I (Eds) Rural Development in Nigeria: Dynamics and Strategies.
Awka, mekslink Publishers.
Ighodaro, C.U.A., (2009). Transport Infrastructure and Economic Growth in Nigeria.
Journal of Research in National Development 7 (2): 1-
11http:www.transcampus.org/journal SV7 No21 Dec 2009 25.html.Assessed on
20/12/1
Iheanacho, E.N (2012). Bureaucracy and Development in Nigeria. In Obi E.A,
Obikeze, S.O Onyekwelu, R.U. (ed). Introduction to Public Administration.
Onitsha: Bookpoint Educational Ltd.
Ikeanyibe, O.M (2009).Development Planning in Nigeria:Reflections on the National
Economic Empowerment and Development Strategy (Needs) 2003. 2007, Journal
of Social Sciences, 20, 3.
Inobeme, J and Ayanwole, A (200). An Assessment of the Spatial Distribution of
Government Secondary schools in Zaria Area, Kaduna State. The Information
Manager, Vol.9 No.1,PP1-9.
Ita, A.E, Bisong, F.E,Eni, D.D and Iwara, A.I., (2012).Development inequalities
amoung geographic units in Cross River State, Nigeria.Continental J. Sustainable
development 3 (3): 1-10, 2012 .
Jacobs, G, Macfarlane, R, and Asokan N., (1997). Comprehensive theory of social
development International Centre for Peace and Development, Napa,
USA.Downloaded [email protected] on 02/08/2013
Jolayemi, M.B., (1992). Socio-Economic Development of Rural Settlements in the
former Irepodun Local Government Area of Kwara State. Unpublished Ms.c
Thesis Submitted to the Department of Geography, University of Ilorin, Ilorin,
Nigeria.
Jaja, S. (2000). History of Budgeting and Planning in Nigeria: Lessons for the fourth
Republic. In Akpuru-Ala, A. and Emeribe, E (eds) Policy and Contending Issues
in Nigeria National Development.Strategy. Enugu: John Jacobs Publishers.
Kapur, S and Kim S. (2006): British Colonial Institutions and Economic Development
in India. NBER Working Paper #12613.National Bureau of Economic Research,
Cambridge, MA.
Kessides, C. (2005).The Urban Transition in Sub‐Saharan Africa: Implications for
Economic Growth and Poverty Reduction. World Bank, Africa Region: Working
Paper Series No. 97. World Bank, Washington, D.C
Kim, S. (1995).Expansion of Markets and the Geographic Distribution of Economic
Activities: The Trends in U.S. Regional Manufacturing Structure, 1860–
1987.Quarterly Journal of Economics 110 (4): 881–908
Kim, S. (1998). Economic Integration and Convergence: U.S. Regions, 1840–
1990.Journal of Economic History 58: 659–83.
165
Kim, S. (2008).Political Institutions, Federalism and U.S. Urban Development: The
Case of American Exceptionalism inDevelopment in the United States.
Kim, S and Robert M. (2004).Historical Perspectives on U.S. Economic Geography in
Handbook of Regional and Urban Economics, Volume 4, J. V. Henderson and
J‐F. Thisse, eds. Amsterdam: North Holland.
Kim, S (2006). Division of Labor and the Rise of Cities: Evidence from U.S.
Industrialization, 1850–1880.Journal of Economic Geography 6: 469–91.
Kim, S. (2007b).Institutions and U.S. Regional Development: A Study of
Massachusetts and Virginia.NBER Working Paper #13431.National Bureau of
Economic Research, Cambridge, MA.
Kogi State M.D.Gs., (2008). Multilateral UN Millennium Developmental Goals.
Kogi State, (1992): Government Profile.www.kogi State.gov.ng/resource.htm
Kogi State Government.(2015). Kogi State Confluence of opportunities 2015.
Confluence Strides: vol 1 NO 2. May 2015, building for tomorrow.
Koha, S (1994). Nigeria: The Political Economy of Oil. London: Oxford University
Press.
Koontz, H.O, Donnel, C and Weihrich, H (2006). Management. Aukland: Megraw-Hill
Internationa Book Company.
Krejcie, R.V and Morgan, D.W., (1972). Determining Sample Size for Research
Activities. Journal of Educational and Psychological Measurement. Pp30, 607-
610.
Krugman, P. (1991a).Geography and Trade. Cambridge: MIT Press.
Krugman, P. (1991b). Increasing Returns and Economic Geography.Journal of
Political Economy 99: 483–99.
Mabogunje, A.L., (1980). The Development Process: A Spatial Perspective. University
Press Ibadan.
Mabogunje, A.L (2007). Thirty Years After reflections on the development progress in
Nigeria. Faculty Distinguished lecture. Series NO.2, Ibadan .Ibadan University
press.
Madu, I.A., (2007). The underlying factors of Rural development Patterns in the
Nsukka Region of Southeastern NigeriaJournal of Rural and Community
development Pp 110-122.
Maurel, F and Sédillot B. (1999).A Measure of Geographic Concentration in French
Manufacturing Industries.Regional Science and Urban Economics 29: 575–604.
McCormick, B and Wahba J. (2003).Return International Migration and Geographical
Inequality: The Case of Egypt. Journal of African Economies 12:
166
Mehta, A.C (2004). Projections of population, Enrolment and Teachers. Module on
Enrolment and population projections. Retrieved from http://
www.Educationforallinindia on 15/03/ 2016
Michael, S., Lewmis, B., Alan, B and Tim, F.L (2004). The Sage Enctclopedia of
Social Sciences and Research Methods. http://dx.doi.org/10,4135/97141.
Accessed on 13th/10/2016
Midelfart‐Knarvik, H. G. O, ReddingS.J, and A. J. Venables. (2000).The Location of
European Industry. Report for the European Commission.
Morenikeji, W (1995). Spatial pattern of development in Ondo State. An inter-local
government area analysis. Journal of economic and Social Studies, 37(1), 41-45.
MOSOP (2014). Movement for the survival of the Ogoni people. A Mass-based
Umbrella Social Movement of the Indigenous Ogoni
people.WWW.MOSOP.org/Ogoni bill of rights.html (retrieved on the 3/03/2014).
Musa, H.D and Mohammed, B.B (2012). An Analysis of Spatial Distribution of
Primary and Secondary Schools in Bida Town, Nigeria. Abuja Journal of
Geography and Development, 3(2): 30-40
Mustapha, O.O., Akintunde, O.S., Alaga, A.T., Sarafdeen, O.B., Sunday, K., Ibrahim, I
and Muibi, K.H (2015). A Geospatial Approach to Evaluation of Accessibility to
Government Primary Schools in Ilorin West LGA, Kwara State, Nigeria.
European International Journal of Science and Technology, 4(8): 96-107.
Myrdal, G., (1976). Economic theory and Underdeveloped Regions, Duckworth,
London.
National Population Commission (2007): The 2006 Population Census Official Gazette
Extraordinary, Volume 94.
National Economic Empowerment and Development Strategy.(2004). (National
Planning Commission) (NEEDS).
Naude, W and Waldo K. (2003).An Inquiry into Cities and their Role in Sub national
Economic Growth in South Africa.Journal of African Economies 12: 4
Nengak, D and Osagbemi M (2011). The Spatial Pattern of Health Facilities in
Nassarawa State, North Central Nigeria. Journal of Sustainable Development in
Africa, Vol. 13 No. 6) ISSN: 1520-5509
NISER (2001). National Institute of Social and Economic Research. NISER Review of
Nigeria Development 2000: The State in Nigerian Development. NISER. Ibadan.
North, D. C. (1990).Institutions, Institutional Change and Economic Performance.
Cambridge University Press.
N.P.C.(2009). 2006 Population and Housing Census of the Federal Republic of Nigeria.
National and State population and Housing Priority Tables, Volume 1. National
Population Commission, Abuja, Nigeria.www.Population.Gov.ng.
167
Nwachukwu, C. C (1998). Management: Theory and Practice.Onitsha: African-Fed
Publishers.
Nyam O (2005). Insufficient and Uneven Distribution of Socio-economic Facilities in
Nigeria
Obi, E.A. (2006): Development Administration. Onitsha: Book point Ltd.
Obikeze, O.S and Obi, E.A (2004). Public Administration in Nigeria. A development
Approach Onitsha.Book Point Educational Ltd.
Ocheja, D.H (2010). Lokoja, The mother of Nigeria.History of Lokoja from 1800 to
2005.
Oduro C.Y, Peprah, C and Adamtey R (2014). Analysis of theDeterminant of Spatial
Inequality in Ghana Using Two-Stage Least – Square Regression.
Ogbuozobe, J.E., (1995). Regional in development: A case study of Nigeria, Ph.d
thesis, Geography, Social Sciences, University of Ibadan.
OECD and ECMT (Joint Transport Research Centre (2007). Managing Urban Traffic
Congestion (Summary Document).
Ogunsanya, A.A (2002). Maker and breaker of Cities.The fifty-ninth inaugural lecture.
University of Ilorin. Ilorin.
Ogunyemi, S.A, Muibi, K.H, Eguaroje, O.E, Fabiyi, O.O and Halilu, A.S (2014). A
geospatial approach to evaluation of accessibility to secondary educational
instution in Ogun State, Nigeria. 7th IGRSM International Remote Sensing and
GIS Conference and Exhibition. IOP Conf. Series: Earth and Environmental
Science, 20 (2014) 012045.
Okigbo, P. (1989). National Development Plan in Nigeria.1900-1907.Enugu. Fourth
Dimension Publishers Ltd.
Okojie, C.E (2002). Development Planning since Independence in Iyoha, M.A. and
Itsede. C.O.(eds) Nigerian Economy: Structure, Growth and Development. Benin
City: Mindex Publishers.
Okowa, W (1991). Political Economy of Development Planning in Nigeria. Port
Harcourt: Pam Unique Publishers.
Olajuyin, L.O (1980). Industrial concentration in regional development: The case of
Ekiti in Ekiti State, Nigeria‘. Unpublished Ph.D. Thesis, University of Sheffield,
Sheffield.
Olajuyin L.O. and Olayiwola and S Adeyinka (1997). Locational analysis of health
facilities: A case study of Irewole Local Government Area of Ogun State,
Nigeria.
Olaniyan, F.A; (2009). Perspectives on Regional Development, An Area Paper of
Staff/Graduate Seminar, Department of Geography, University of Ibadan.
168
Olayiwola, L.M. and Adeleye, O.A., (2005). Rural Infrastructural Development in
Nigeria: Between 1960 and 1990- Problems and Challenges Journal of Social
Sciences.Vol. 11(2) pp.91-96.
Olomola, A.S; (2003). Understanding Poverty in Nigeria: Highlights from NISER
Review of Nigerian Development‖. In NISEREEL the Magazine of the Nigerian
Institute of Economic and Social Research, No. 4&5.
Onah, F.O (2010). Managing Public Programmes (2nd
Edition).Nsukka: Great AP
Express Publishers.
Onwumerobi, A.S; (1994). Population, Urbanization and Developmentin Population,
Space and Development in Nigeria. Report of Nigerian Team on Club du Sahel,
Directed by Jibrin Ibrahim, ABU, Zaria.
Onyenwigwe, P.I (2009). Principles of Development Administration: Third World
Perspectives. Owerri:Ambix Printers Nigeria.
Owen, W; (1987). Transportation and World Development. Hutchinson. London, cited
in Hilling.D. (1996) Transport and developing Countries.Routeledge. London.
Oyekale, A.S, A.I. Adeoti and T.O Oyekale (2006). Measures and sources of income
inequality in rural and urban Nigeria. A report submitted to the Poverty and
Economic Policy Network, Universite Laval, Canada
Oyekanmi, B, Ayansina, A, Muyiwa B, and Jubril O.Y., (2011). Geo-political Patterns
of Health Care Facilities in Kogi State, Nigeria. The open Geography journal,
2011,4, pp141-147
Puga, D and Anthony J. V. (1999).Agglomeration and Economic Development: Import
Substitution vs. Trade Liberalisation.Economic Journal 109: 292–311
Puga, D and Anthony J.V. (2002).European Regional Policies in Light of Recent
Location Theories.Journal of Economic Geography 2 (4): 372–406.
Rosenthal, S. S and Willian C. S (2004).Evidence on the Nature and Sources of
Agglomeration Economies. In Handbook of Regional and Urban Economics,
Volume 4, J. V. Henderson and J‐F. Thisse, eds. Amsterdam: North Holland
Resnick, J (2011).The Scorecard on Development, 1960-2016. China and Global
Economic Rebound (Report). Washington, DC. Center for Economic and Policy
Research.
Recardo, C., (2004). Competing Theories of Economic Development, Center for
International FinanceandDevelopment, the University of Iowa, USA.
Rotimi, D.A.(1994). Regional Socio-economic inequality in Kwara State, Nigeria. A
spatial analysis in development planning.Unpublished Ph.d Thesis, Department of
Geography, University of Ilorin.
169
Sandra, B (2004). The 1960s and 1970s. The World Bank Attacks Poverty, developing
Countries Attack the IMF. Center for International Finance and Development, the
University of Iowa, USA
Sadibo, W.B and Jacob A.A., (2006). The making of Nigeria: Niger Benue Confluence.
A Publication of the National Commission for Museums and Monuments,
Nigeria.Pp20-23.
Sapru, K.K (1994). Development Administration. New Delhi, Sterling Publishers
Schumpeter, J and Backhaus, U (2003): The Theory of Economic Development,
in Joseph Alois Schumpeter.
Sokoloff, K. L, and Eric M. Z. (2006).Inequality and the Evolution of Institution of
Taxation: Evidence from the Economic History of the Americas.Unpublished
paper.
Soo, K. T. (2005). Zip‘s Law for Cities: A Cross‐Country Investigation.Regional
Science and Urban Economics 35: 239–63.
Sulyman, A.O., (2009). Infrastructural Facility Provision and Socio-Economic
Development in Rural Settlement of Niger State, Nigeria Unpublished PhD
proposal presented at thestaff/post Graduate Seminar, Department of Geography,
Faculty of Social Sciences University of Ilorin, Kwara State.
Tari, M.K and Iteimowei M (2017). Inequality in Kogi State: Income Source-Based
Decomposition. Equatorial Journal of Social Science and Human Behaviour
2017; 2(2): 56-73. Journal Homepage: www.erjournals.com ISSN Online: 0184-
7937 (14/05/2018)
Te W, Willem D, and Morrissey O. (2005).Spatial Inequality for Manufacturing
Wages in Five African Countries. In Ravi Kanbur and Anthony J. Venables
(editors), Spatial Inequality and Development.Oxford University Press.January.
Tirado, D. A., Elisenda P, and Jordi P. (2002).Economic Integration and Industrial
Location: The Case of Spain before World War I.Journal of Economic
Geography 2: 343–63
Todaro, M.P (1977). Todaro, M.P (2000). Economics for Development World.
London:Sterling Publishers.
Todaro, M.P (1992). Economics for the developing World: An Introduction to
Principles, Problems and Policies for Development. London: Longman Group Ltd
Todaro, M.P and Smith, S.C (2011). Economic Development (11th
ed).Pearson
Edition.Edinburgh , England.
Todaro, M.P (2000). Economics for the developing Countries. New York, Willey Press.
Tordoff, W (1993). Government and Policies in Africa. London: The Macmillan Press
Ltd.
170
Toyin, O and Adeniyi B.,(2006). Kogi at 15: So far How Well? Kogi Agenda, A
newspaper, November, 2011, Vol 1 no 4.
Uga, E.O. and A. Aminu., (2000). The Political Economy of State Creation and
Nigerian development under fiscalunitarism in Nigerian Journal of Economic and
Social Studies vol. 42, No 3 pp 313-351.
Umebah, E.E. and Ebue, M.I. (2001). Role of Non –Government Organizations
(NGOs) in Rural Development: A study of Enugu state. Paper presented and
published in the National conference proceedings on the Rural Environment and
Sustainable Development in Nigeria. Department of geography, University of
Ado –Ekiti.
Umoh , E.A (2000). Infrastructure and Socio-Economic Development in Sahelian
Nigeria: The Case of Kaura Namoda. African Journal of Social and Policy
Studies 1(2):
Umoren, V; Ikurekong, E.E; Emmanuel, A. and Udida, A.A (2009). Development of
Road Infrastructure as a Tool of Transforming Ibiono Ibom Local Government
Area. Global Journal of Social Sciences, 8 (2): 53-59.
United Nations Development Program (UNDP) (1996).Human Development Report
1996. New York:United Nations Development Program (UNDP) (2006) Human
Development Report 2005‖. New York: UNDP.
UNDP (2008). Human Development Report. New York: UNDP
Usman, B.A (2012).Impact of Road Transport on Socio-Economic Development of
Rural areas in Kwara State, Nigeria. An unpublished PhD Thesis presented to the
Department of Geography, Faculty of Sciences, ABU Zaria, Kaduna State,
Nigeria. Vision 20:20
Willis, K., (2007).Theories and Practices of Development in Cloke p, Grand P and
Godwin M, (Eds)(2005) Introducing Human Geographies 2nd
Edition, Hodder
Arnold, part 2, Section 2, Chapter 13, pp. 188-222.
Wheeler, C. (2004).Wage Inequality and Urban Density.Journal of Economic
Geography 4: 421–37.
World Bank (1991). World Bank Report.The World Bank, Washington DC.
Wu J and Gopinath M. (2008).What causes Spatial Variations in Economic
Development in the United States.American Journal of Agricultural Economics
90:Pp232-248.
Wunsch, J. and Olowu, D. (eds) (1990). The Failure of Centralized State: Institution
and Self-Governance in Africa. San Francisco: Institute for Contemporary studies
Yunusa M.B., (1991). Socio-Spatial Effects of Ajaokuta Steel Complex (Unpublished
Phd Thesis Submitted to Geography Department A.B.U Zaria, Nigeria).

171
APPDENDICES
Appendix I:
QUESTIONNAIRE FOR RESPONDENTS
DEPARTMENT OF GEOGRAPHY AND ENVIRONMENTAL
MANAGEMENT, AHMADU BELLO UNIVERSITY, ZARIA
Dear Respondent,
I am a student of the above named department undertaking a study. This questionnaire
is designed to elicit information on the spatial Inequalities in socio-economic
development in Kogi State, and you are one of the carefully selected respondents. The
exercise is purely an academic work and all information will be treated confidentially. I
plead for your maximum cooperation in completing the questionnaire.
Thanks
Grace Foluke Balogun
Instruction: Please tick in the appropriate boxes to the following questions as
appropriate.
SECTION A: SOCIO-ECONOMIC PROFILE OF THE RESPONDENTS
1. Name Of Local Government Area/ Ward__________________
2. Sex: (a) Male ( ) (b) Female ( )
3. Age (a) Less than 25 years (b) 25-29 years (c) 30-39 years (d) 40-49 years (e) above
50 years
4.Marital Status: Single ( ) Married ( ) Divorced ( ) Widow/Widower ( )
5.Educational qualification : No formal education ( ), primary education ( ) secondary
education ( ) Tertiary education ( ), others (specify) ----------------
6. Occupation: Farming ( ) Trading ( ) Civil service ( ) Any other (specify) ----------
7. Income level: No fixed income ( ) below N18 000 ( ) N18 000 – N20 000 ( ) N20
000-N40 000 Above N40 000 ( )
Family Size: Less than 5 ( ) 6-10 ( ) 11-15 ( ) Above 15
8. Which of the following facilities is/are available in your village?
i.Schools ( ) ii.Hospitals ( ) iii. Hotels ( ) iv. Communication system ( ) v. market (
) vi. Tv viewing centres ( ) vii.Town Halls ( ) viii. Banks( ) PHCN ( ) Transport
system
9.What are the socioeconomic effects of the above facilities on economic growth and
development on your village?
S/N
Variables
Agree
Undecided
Disagree
1 Increase in level of Literacy
2 Easy to communicate to people outside
the village
3 Reduction in the rate at which people die
from preventable diseases
4 Connection to the National Grid (PHCN)
has increased sales drastically.
5 More people are educated now than
before
6 People settling more in the village
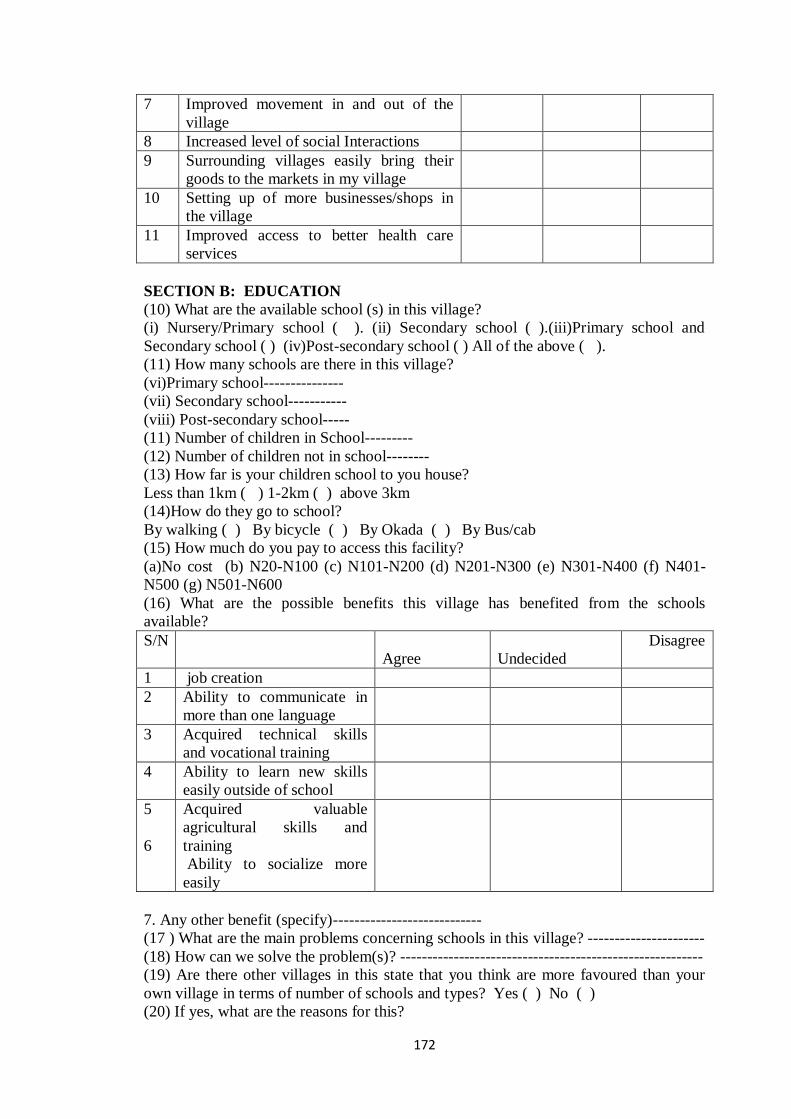
172
7 Improved movement in and out of the
village
8 Increased level of social Interactions
9 Surrounding villages easily bring their
goods to the markets in my village
10 Setting up of more businesses/shops in
the village
11 Improved access to better health care
services
SECTION B: EDUCATION
(10) What are the available school (s) in this village?
(i) Nursery/Primary school ( ). (ii) Secondary school ( ).(iii)Primary school and
Secondary school ( ) (iv)Post-secondary school ( ) All of the above ( ).
(11) How many schools are there in this village?
(vi)Primary school---------------
(vii) Secondary school-----------
(viii) Post-secondary school-----
(11) Number of children in School---------
(12) Number of children not in school--------
(13) How far is your children school to you house?
Less than 1km ( ) 1-2km ( ) above 3km
(14)How do they go to school?
By walking ( ) By bicycle ( ) By Okada ( ) By Bus/cab
(15) How much do you pay to access this facility?
(a)No cost (b) N20-N100 (c) N101-N200 (d) N201-N300 (e) N301-N400 (f) N401-
N500 (g) N501-N600
(16) What are the possible benefits this village has benefited from the schools
available?
S/N
Agree
Undecided
Disagree
1 job creation
2 Ability to communicate in
more than one language
3 Acquired technical skills
and vocational training
4 Ability to learn new skills
easily outside of school
5
6
Acquired valuable
agricultural skills and
training
Ability to socialize more
easily
7. Any other benefit (specify)----------------------------
(17 ) What are the main problems concerning schools in this village? ----------------------
(18) How can we solve the problem(s)? ---------------------------------------------------------
(19) Are there other villages in this state that you think are more favoured than your
own village in terms of number of schools and types? Yes ( ) No ( )
(20) If yes, what are the reasons for this?

173
S/N Factor Agree Undecided Disagree
1 Political reason
2 Tribalism
3 Natural factor
4 Climatic factor
SECTION C: COMMERCE AND TRADE
(21) How many markets do you have in this village? -------------------------------
(22) What type are they?
Periodic ( ) Daily ( ) Both ( ).
(23) Do people from surrounding villages come to the market?
Yes ( ) No ( )
(24) If yes, what is the distance from their villages to the market?
Less than 1km ( ) 1-2km ( ) Above 3km ( )
(25)How much do you pay to access this facility?
(a)No cost (b) N20-N100 (c) N101-N200 (d) N201-N300 (e) N301-N400 (f) N401-
N500 (g) N501-N600
(26) In what ways has the market (s) been of benefit to the community?
S/N Variables
Agree
Undecided Disagree
1
A major source of income
2
provides sources of employment
3
Acts as an agent of innovative
diffusion
(d)Any other (specify) ------------------------------
SECTION D: BANKING SERVICES
(27)Which of the following banks are available in your area?
(i) First Bank( ) (ii)Skye Bank ( )
(iii) Eco Bank ( ) (iv) Community Bank ( )
(v) GT Bank ( ) (vi) Micro Credit Finance House( )
(vii) Unity Bank ( ) (viii) No Bank ( )
(ix)Any other, Specify ----------------------
(28)What benefits have you derived from the banks?
___________________________________________________________________
(29)How much do you pay to access this facility?
(a)No cost (b) N20-N100 (c) N101-N200 (d) N201-N300 (e) N301-N400 (f) N401-
N500 (g) N501-N600
(30)How long do you walk to access these health facilities?
Less than 1km ( ), 1-2km ( ), Above 3km ( ).
(32) What problems do people in this community face with banking?
___________________________________________________________________
(33)How can these problems be solved?
___________________________________________________________________
SECTION E: ADMINISTRATION
(34)Which of the following local Government Offices is located in this Town/village?
i L.G, Headquarter ( ).
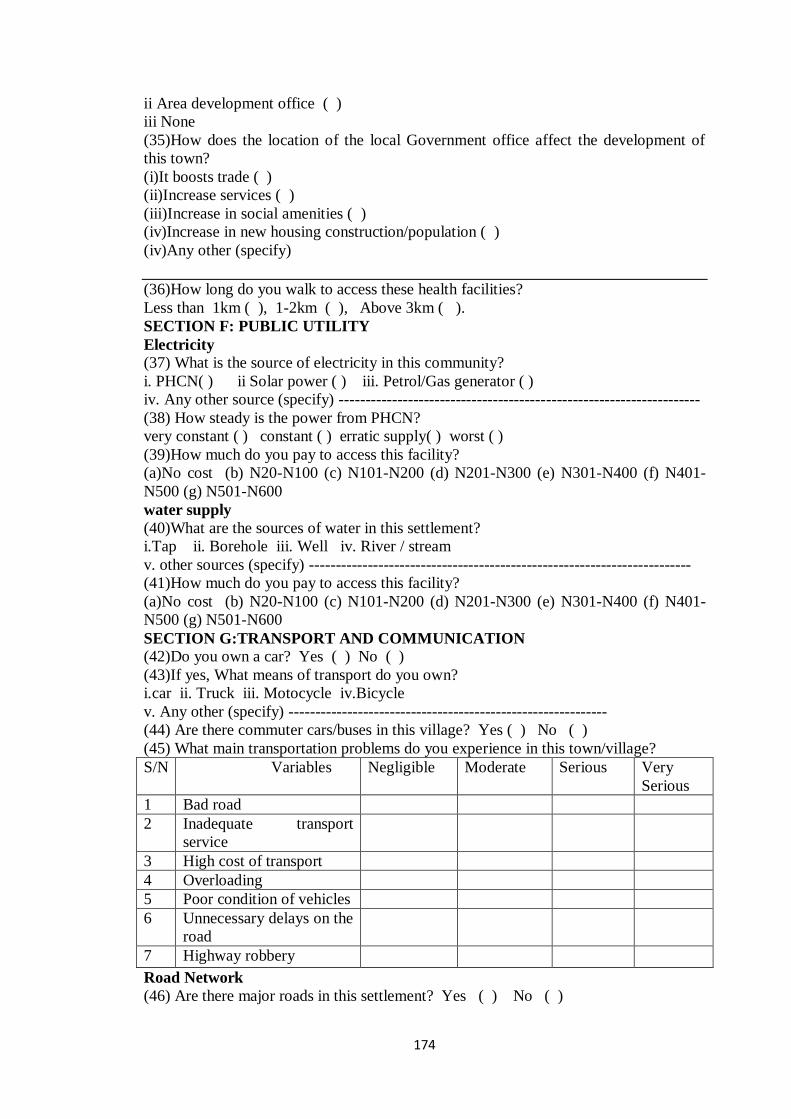
174
ii Area development office ( )
iii None
(35)How does the location of the local Government office affect the development of
this town?
(i)It boosts trade ( )
(ii)Increase services ( )
(iii)Increase in social amenities ( )
(iv)Increase in new housing construction/population ( )
(iv)Any other (specify)
(36)How long do you walk to access these health facilities?
Less than 1km ( ), 1-2km ( ), Above 3km ( ).
SECTION F: PUBLIC UTILITY
Electricity
(37) What is the source of electricity in this community?
i. PHCN( ) ii Solar power ( ) iii. Petrol/Gas generator ( )
iv. Any other source (specify) --------------------------------------------------------------------
(38) How steady is the power from PHCN?
very constant ( ) constant ( ) erratic supply( ) worst ( )
(39)How much do you pay to access this facility?
(a)No cost (b) N20-N100 (c) N101-N200 (d) N201-N300 (e) N301-N400 (f) N401-
N500 (g) N501-N600
water supply
(40)What are the sources of water in this settlement?
i.Tap ii. Borehole iii. Well iv. River / stream
v. other sources (specify) ------------------------------------------------------------------------
(41)How much do you pay to access this facility?
(a)No cost (b) N20-N100 (c) N101-N200 (d) N201-N300 (e) N301-N400 (f) N401-
N500 (g) N501-N600
SECTION G:TRANSPORT AND COMMUNICATION
(42)Do you own a car? Yes ( ) No ( )
(43)If yes, What means of transport do you own?
i.car ii. Truck iii. Motocycle iv.Bicycle
v. Any other (specify) ------------------------------------------------------------
(44) Are there commuter cars/buses in this village? Yes ( ) No ( )
(45) What main transportation problems do you experience in this town/village?
S/N Variables Negligible Moderate Serious Very
Serious
1 Bad road
2 Inadequate transport
service
3 High cost of transport
4 Overloading
5 Poor condition of vehicles
6 Unnecessary delays on the
road
7 Highway robbery
Road Network
(46) Are there major roads in this settlement? Yes ( ) No ( )
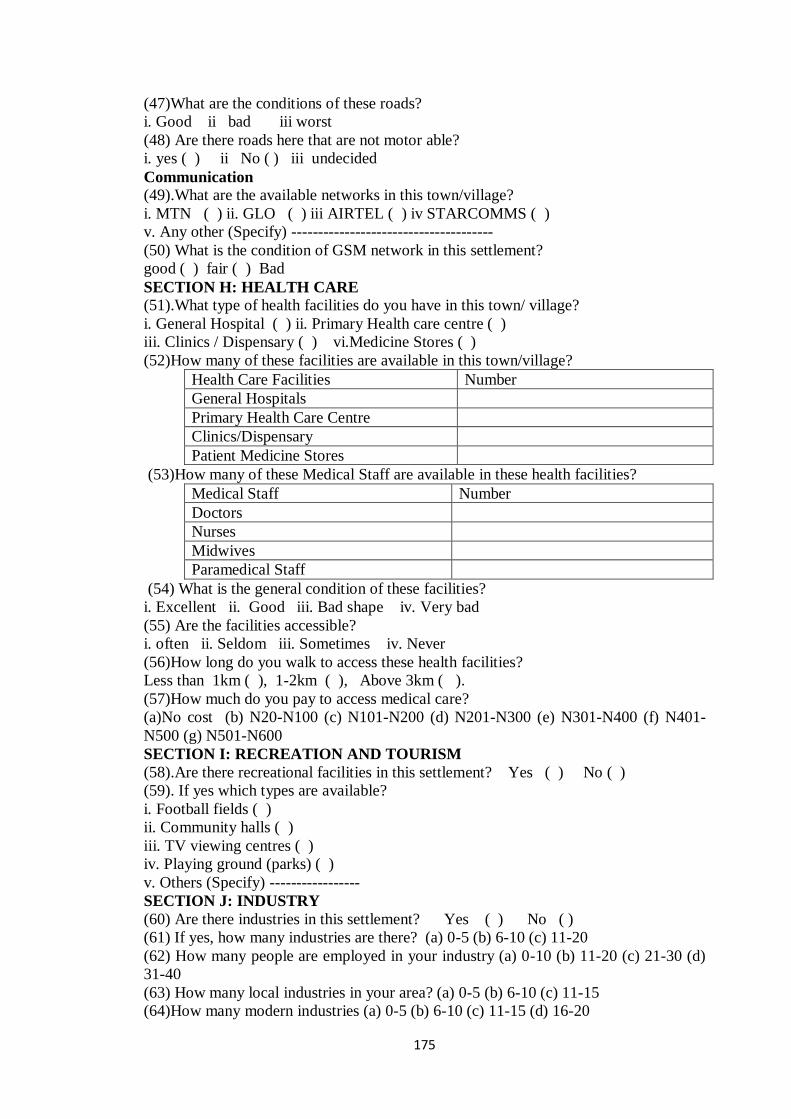
175
(47)What are the conditions of these roads?
i. Good ii bad iii worst
(48) Are there roads here that are not motor able?
i. yes ( ) ii No ( ) iii undecided
Communication
(49).What are the available networks in this town/village?
i. MTN ( ) ii. GLO ( ) iii AIRTEL ( ) iv STARCOMMS ( )
v. Any other (Specify) --------------------------------------
(50) What is the condition of GSM network in this settlement?
good ( ) fair ( ) Bad
SECTION H: HEALTH CARE
(51).What type of health facilities do you have in this town/ village?
i. General Hospital ( ) ii. Primary Health care centre ( )
iii. Clinics / Dispensary ( ) vi.Medicine Stores ( )
(52)How many of these facilities are available in this town/village?
Health Care Facilities Number
General Hospitals
Primary Health Care Centre
Clinics/Dispensary
Patient Medicine Stores
(53)How many of these Medical Staff are available in these health facilities?
Medical Staff Number
Doctors
Nurses
Midwives
Paramedical Staff
(54) What is the general condition of these facilities?
i. Excellent ii. Good iii. Bad shape iv. Very bad
(55) Are the facilities accessible?
i. often ii. Seldom iii. Sometimes iv. Never
(56)How long do you walk to access these health facilities?
Less than 1km ( ), 1-2km ( ), Above 3km ( ).
(57)How much do you pay to access medical care?
(a)No cost (b) N20-N100 (c) N101-N200 (d) N201-N300 (e) N301-N400 (f) N401-
N500 (g) N501-N600
SECTION I: RECREATION AND TOURISM
(58).Are there recreational facilities in this settlement? Yes ( ) No ( )
(59). If yes which types are available?
i. Football fields ( )
ii. Community halls ( )
iii. TV viewing centres ( )
iv. Playing ground (parks) ( )
v. Others (Specify) -----------------
SECTION J: INDUSTRY
(60) Are there industries in this settlement? Yes ( ) No ( )
(61) If yes, how many industries are there? (a) 0-5 (b) 6-10 (c) 11-20
(62) How many people are employed in your industry (a) 0-10 (b) 11-20 (c) 21-30 (d)
31-40
(63) How many local industries in your area? (a) 0-5 (b) 6-10 (c) 11-15
(64)How many modern industries (a) 0-5 (b) 6-10 (c) 11-15 (d) 16-20

176
Appendix II:
QUESTIONNAIRE FOR LOCAL GOVERNMENT HEADQUATERS
DEPARTMENT OF GEOGRAPHY AND ENVIRONMENTAL MANAGEMENT
AHMADU BELLO UNIVERSITY, ZARIA
Dear Respondent,
I am a student of the above named department undertaking a study. This questionnaire
is designed to elicit information on the spatial Inequalities in socio-economic
development in Kogi State, and you are one of the carefully selected respondents. The
exercise is purely an academic work and all information will be treated confidentially. I
plead for your maximum cooperation in completing the questionnaire.
Thanks
Grace
Foluke Balogun
Instruction: Please tick in the appropriate boxes to the following questions as
appropriate.
NAME OF L.G.A________________________________________
SECTION A: EDUCATION
(i) What are the available schools in this L.G.A?
(ii) Primary school ( )
(iii) Secondary school ( )
(iv)Post-secondary school ( )
(v) How many of these schools are here in this L.G.A?
(vi) Nusery/Primary school---------------
(vii) Secondary school-----------
(viii) Post-secondary school--------
SECTION B: COMMERCE AND TRADE
(i) How many markets do you have in this L.G.A? -------------------------------
(ii) What type are they?
Periodic ( ) Daily ( ) Both ( ).
(iii) How many are periodic? ( )
(iv) How many are Daily? ( )
SECTION C: BANKING SERVICES
Which of the following banks are available in this L.G.A?
(i) First Bank( ) (ii)Skye Bank ( )
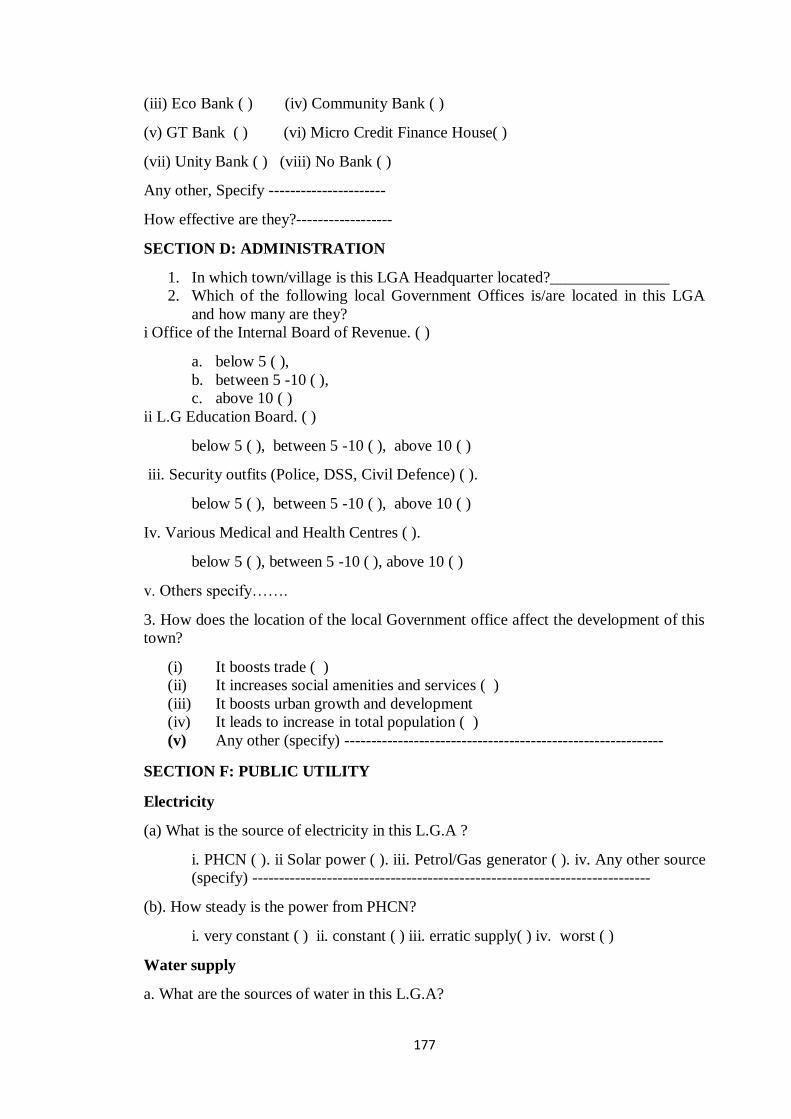
177
(iii) Eco Bank ( ) (iv) Community Bank ( )
(v) GT Bank ( ) (vi) Micro Credit Finance House( )
(vii) Unity Bank ( ) (viii) No Bank ( )
Any other, Specify ----------------------
How effective are they?------------------
SECTION D: ADMINISTRATION
1. In which town/village is this LGA Headquarter located?_______________
2. Which of the following local Government Offices is/are located in this LGA
and how many are they?
i Office of the Internal Board of Revenue. ( )
a. below 5 ( ),
b. between 5 -10 ( ),
c. above 10 ( )
ii L.G Education Board. ( )
below 5 ( ), between 5 -10 ( ), above 10 ( )
iii. Security outfits (Police, DSS, Civil Defence) ( ).
below 5 ( ), between 5 -10 ( ), above 10 ( )
Iv. Various Medical and Health Centres ( ).
below 5 ( ), between 5 -10 ( ), above 10 ( )
v. Others specify…….
3. How does the location of the local Government office affect the development of this
town?
(i) It boosts trade ( )
(ii) It increases social amenities and services ( )
(iii) It boosts urban growth and development
(iv) It leads to increase in total population ( )
(v) Any other (specify) ------------------------------------------------------------
SECTION F: PUBLIC UTILITY
Electricity
(a) What is the source of electricity in this L.G.A ?
i. PHCN ( ). ii Solar power ( ). iii. Petrol/Gas generator ( ). iv. Any other source
(specify) ---------------------------------------------------------------------------
(b). How steady is the power from PHCN?
i. very constant ( ) ii. constant ( ) iii. erratic supply( ) iv. worst ( )
Water supply
a. What are the sources of water in this L.G.A?
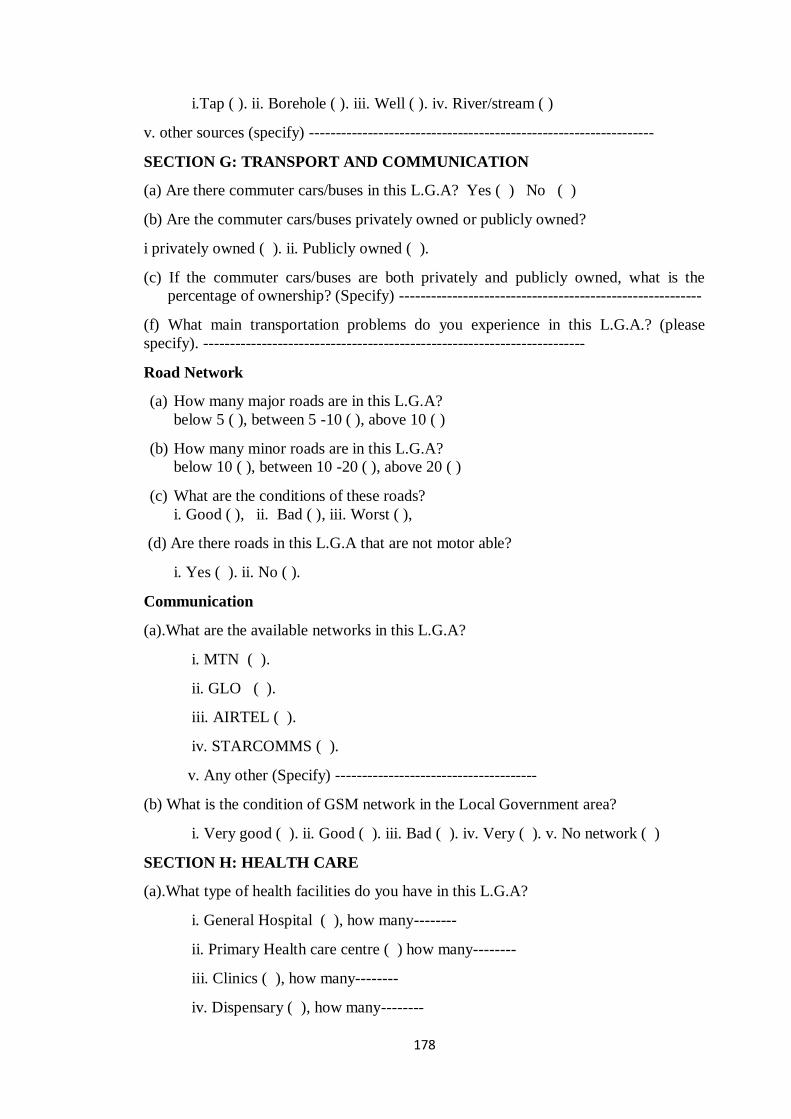
178
i.Tap ( ). ii. Borehole ( ). iii. Well ( ). iv. River/stream ( )
v. other sources (specify) -----------------------------------------------------------------
SECTION G: TRANSPORT AND COMMUNICATION
(a) Are there commuter cars/buses in this L.G.A? Yes ( ) No ( )
(b) Are the commuter cars/buses privately owned or publicly owned?
i privately owned ( ). ii. Publicly owned ( ).
(c) If the commuter cars/buses are both privately and publicly owned, what is the
percentage of ownership? (Specify) ---------------------------------------------------------
(f) What main transportation problems do you experience in this L.G.A.? (please
specify). ------------------------------------------------------------------------
Road Network
(a) How many major roads are in this L.G.A?
below 5 ( ), between 5 -10 ( ), above 10 ( )
(b) How many minor roads are in this L.G.A?
below 10 ( ), between 10 -20 ( ), above 20 ( )
(c) What are the conditions of these roads?
i. Good ( ), ii. Bad ( ), iii. Worst ( ),
(d) Are there roads in this L.G.A that are not motor able?
i. Yes ( ). ii. No ( ).
Communication
(a).What are the available networks in this L.G.A?
i. MTN ( ).
ii. GLO ( ).
iii. AIRTEL ( ).
iv. STARCOMMS ( ).
v. Any other (Specify) --------------------------------------
(b) What is the condition of GSM network in the Local Government area?
i. Very good ( ). ii. Good ( ). iii. Bad ( ). iv. Very ( ). v. No network ( )
SECTION H: HEALTH CARE
(a).What type of health facilities do you have in this L.G.A?
i. General Hospital ( ), how many--------
ii. Primary Health care centre ( ) how many--------
iii. Clinics ( ), how many--------
iv. Dispensary ( ), how many--------
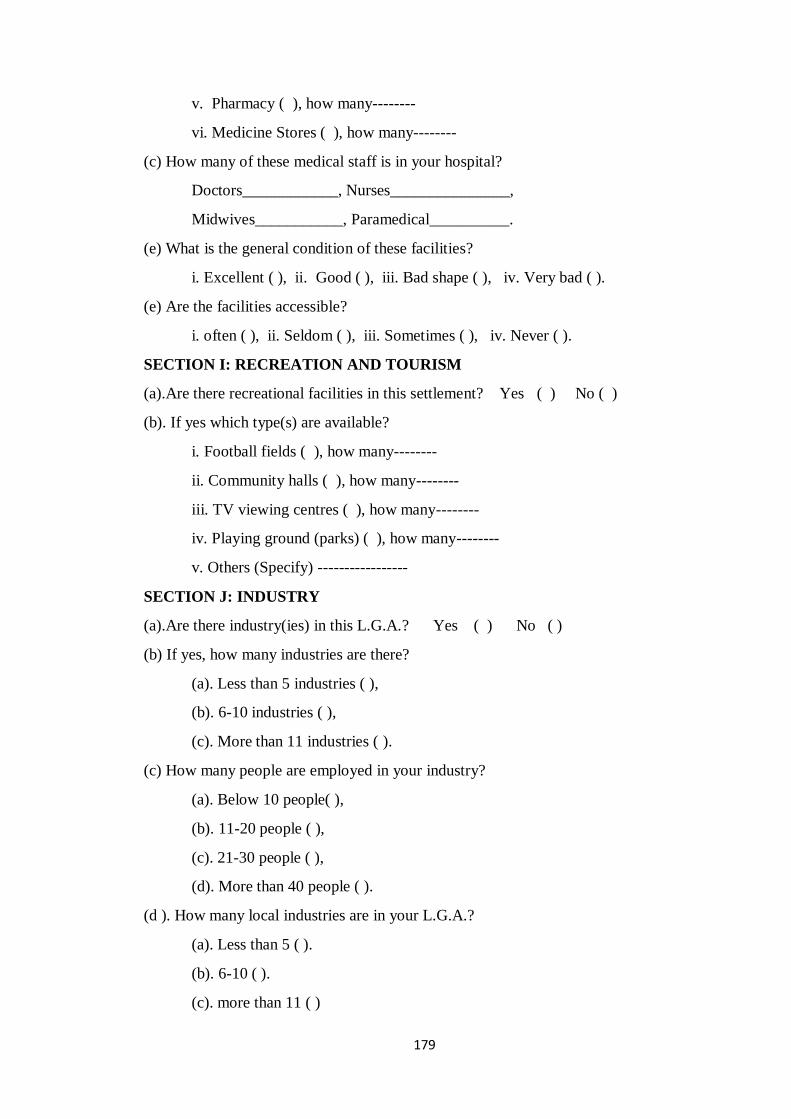
179
v. Pharmacy ( ), how many--------
vi. Medicine Stores ( ), how many--------
(c) How many of these medical staff is in your hospital?
Doctors____________, Nurses_______________,
Midwives___________, Paramedical__________.
(e) What is the general condition of these facilities?
i. Excellent ( ), ii. Good ( ), iii. Bad shape ( ), iv. Very bad ( ).
(e) Are the facilities accessible?
i. often ( ), ii. Seldom ( ), iii. Sometimes ( ), iv. Never ( ).
SECTION I: RECREATION AND TOURISM
(a).Are there recreational facilities in this settlement? Yes ( ) No ( )
(b). If yes which type(s) are available?
i. Football fields ( ), how many--------
ii. Community halls ( ), how many--------
iii. TV viewing centres ( ), how many--------
iv. Playing ground (parks) ( ), how many--------
v. Others (Specify) -----------------
SECTION J: INDUSTRY
(a).Are there industry(ies) in this L.G.A.? Yes ( ) No ( )
(b) If yes, how many industries are there?
(a). Less than 5 industries ( ),
(b). 6-10 industries ( ),
(c). More than 11 industries ( ).
(c) How many people are employed in your industry?
(a). Below 10 people( ),
(b). 11-20 people ( ),
(c). 21-30 people ( ),
(d). More than 40 people ( ).
(d ). How many local industries are in your L.G.A.?
(a). Less than 5 ( ).
(b). 6-10 ( ).
(c). more than 11 ( )
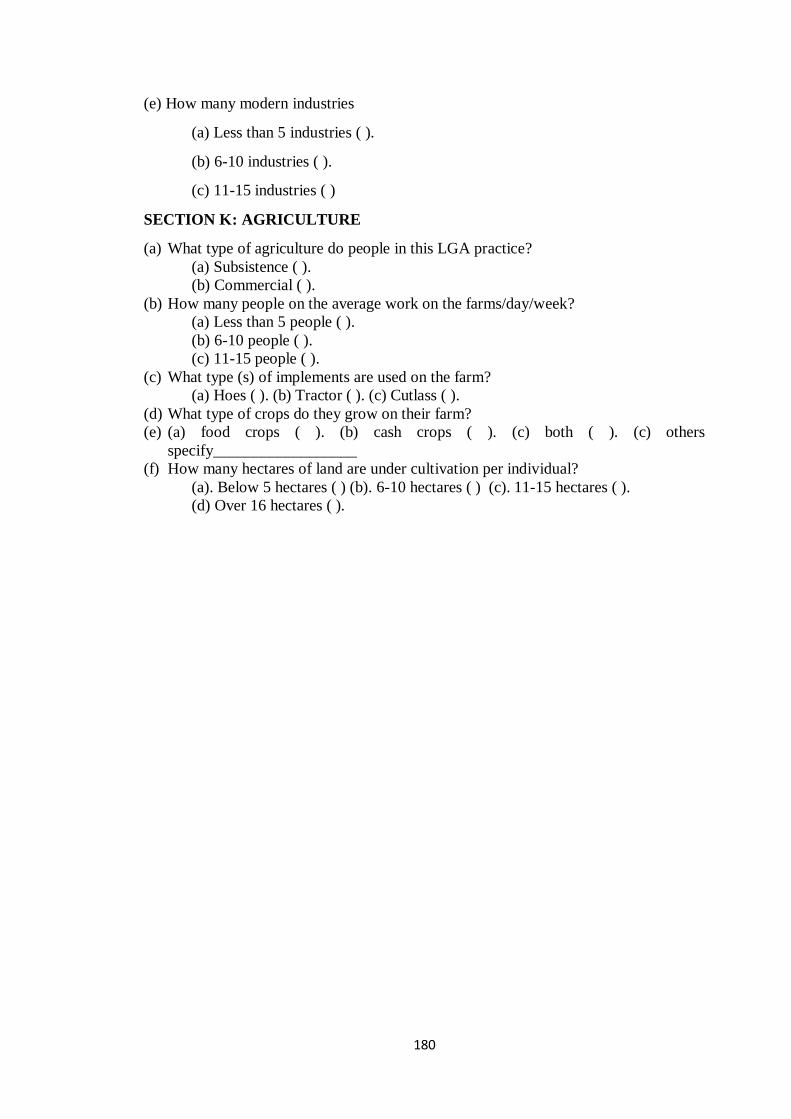
180
(e) How many modern industries
(a) Less than 5 industries ( ).
(b) 6-10 industries ( ).
(c) 11-15 industries ( )
SECTION K: AGRICULTURE
(a) What type of agriculture do people in this LGA practice?
(a) Subsistence ( ).
(b) Commercial ( ).
(b) How many people on the average work on the farms/day/week?
(a) Less than 5 people ( ).
(b) 6-10 people ( ).
(c) 11-15 people ( ).
(c) What type (s) of implements are used on the farm?
(a) Hoes ( ). (b) Tractor ( ). (c) Cutlass ( ).
(d) What type of crops do they grow on their farm?
(e) (a) food crops ( ). (b) cash crops ( ). (c) both ( ). (c) others
specify__________________
(f) How many hectares of land are under cultivation per individual?
(a). Below 5 hectares ( ) (b). 6-10 hectares ( ) (c). 11-15 hectares ( ).
(d) Over 16 hectares ( ).
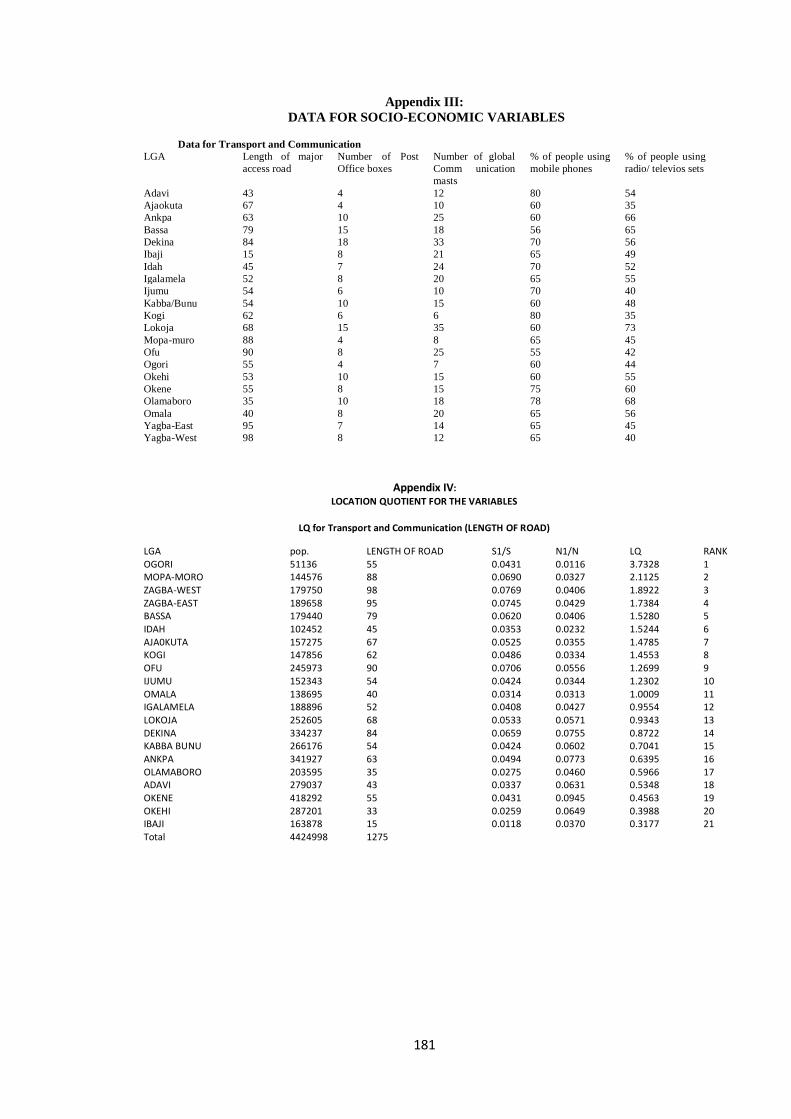
181
Appendix III:
DATA FOR SOCIO-ECONOMIC VARIABLES
Data for Transport and Communication
LGA Length of major
access road
Number of Post
Office boxes
Number of global
Comm unication
masts
% of people using
mobile phones
% of people using
radio/ televios sets
Adavi 43 4 12 80 54
Ajaokuta 67 4 10 60 35
Ankpa 63 10 25 60 66
Bassa 79 15 18 56 65
Dekina 84 18 33 70 56
Ibaji 15 8 21 65 49
Idah 45 7 24 70 52
Igalamela 52 8 20 65 55
Ijumu 54 6 10 70 40
Kabba/Bunu 54 10 15 60 48
Kogi 62 6 6 80 35
Lokoja 68 15 35 60 73
Mopa-muro 88 4 8 65 45
Ofu 90 8 25 55 42
Ogori 55 4 7 60 44
Okehi 53 10 15 60 55
Okene 55 8 15 75 60
Olamaboro 35 10 18 78 68
Omala 40 8 20 65 56
Yagba-East 95 7 14 65 45
Yagba-West 98 8 12 65 40
Appendix IV:
LOCATION QUOTIENT FOR THE VARIABLES
LQ for Transport and Communication (LENGTH OF ROAD)
LGA pop. LENGTH OF ROAD S1/S N1/N LQ RANK OGORI 51136 55 0.0431 0.0116 3.7328 1 MOPA-MORO 144576 88 0.0690 0.0327 2.1125 2 ZAGBA-WEST 179750 98 0.0769 0.0406 1.8922 3 ZAGBA-EAST 189658 95 0.0745 0.0429 1.7384 4 BASSA 179440 79 0.0620 0.0406 1.5280 5 IDAH 102452 45 0.0353 0.0232 1.5244 6 AJA0KUTA 157275 67 0.0525 0.0355 1.4785 7 KOGI 147856 62 0.0486 0.0334 1.4553 8 OFU 245973 90 0.0706 0.0556 1.2699 9 IJUMU 152343 54 0.0424 0.0344 1.2302 10 OMALA 138695 40 0.0314 0.0313 1.0009 11 IGALAMELA 188896 52 0.0408 0.0427 0.9554 12 LOKOJA 252605 68 0.0533 0.0571 0.9343 13 DEKINA 334237 84 0.0659 0.0755 0.8722 14 KABBA BUNU 266176 54 0.0424 0.0602 0.7041 15 ANKPA 341927 63 0.0494 0.0773 0.6395 16 OLAMABORO 203595 35 0.0275 0.0460 0.5966 17 ADAVI 279037 43 0.0337 0.0631 0.5348 18 OKENE 418292 55 0.0431 0.0945 0.4563 19 OKEHI 287201 33 0.0259 0.0649 0.3988 20 IBAJI 163878 15 0.0118 0.0370 0.3177 21 Total 4424998 1275
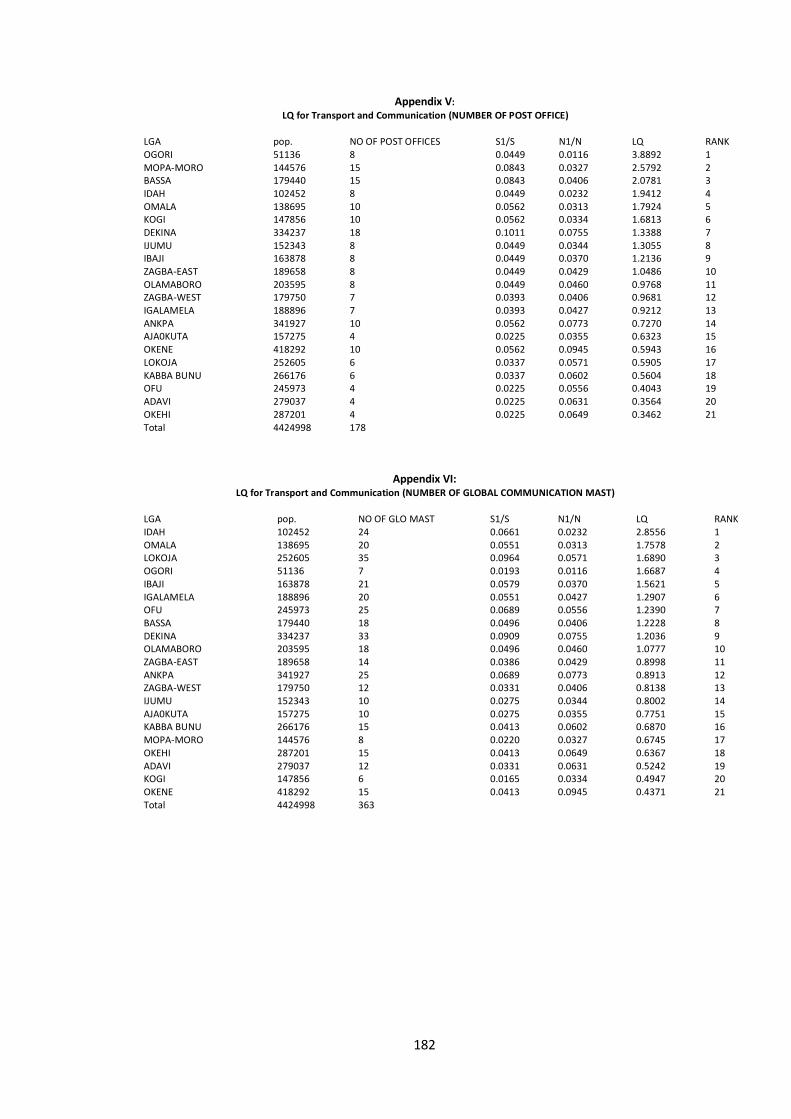
182
Appendix V:
LQ for Transport and Communication (NUMBER OF POST OFFICE)
LGA pop. NO OF POST OFFICES S1/S N1/N LQ RANK OGORI 51136 8 0.0449 0.0116 3.8892 1 MOPA-MORO 144576 15 0.0843 0.0327 2.5792 2 BASSA 179440 15 0.0843 0.0406 2.0781 3 IDAH 102452 8 0.0449 0.0232 1.9412 4 OMALA 138695 10 0.0562 0.0313 1.7924 5 KOGI 147856 10 0.0562 0.0334 1.6813 6 DEKINA 334237 18 0.1011 0.0755 1.3388 7 IJUMU 152343 8 0.0449 0.0344 1.3055 8 IBAJI 163878 8 0.0449 0.0370 1.2136 9 ZAGBA-EAST 189658 8 0.0449 0.0429 1.0486 10 OLAMABORO 203595 8 0.0449 0.0460 0.9768 11 ZAGBA-WEST 179750 7 0.0393 0.0406 0.9681 12 IGALAMELA 188896 7 0.0393 0.0427 0.9212 13 ANKPA 341927 10 0.0562 0.0773 0.7270 14 AJA0KUTA 157275 4 0.0225 0.0355 0.6323 15 OKENE 418292 10 0.0562 0.0945 0.5943 16 LOKOJA 252605 6 0.0337 0.0571 0.5905 17 KABBA BUNU 266176 6 0.0337 0.0602 0.5604 18 OFU 245973 4 0.0225 0.0556 0.4043 19 ADAVI 279037 4 0.0225 0.0631 0.3564 20 OKEHI 287201 4 0.0225 0.0649 0.3462 21 Total 4424998 178
Appendix VI: LQ for Transport and Communication (NUMBER OF GLOBAL COMMUNICATION MAST)
LGA pop. NO OF GLO MAST S1/S N1/N LQ RANK IDAH 102452 24 0.0661 0.0232 2.8556 1 OMALA 138695 20 0.0551 0.0313 1.7578 2 LOKOJA 252605 35 0.0964 0.0571 1.6890 3 OGORI 51136 7 0.0193 0.0116 1.6687 4 IBAJI 163878 21 0.0579 0.0370 1.5621 5 IGALAMELA 188896 20 0.0551 0.0427 1.2907 6 OFU 245973 25 0.0689 0.0556 1.2390 7 BASSA 179440 18 0.0496 0.0406 1.2228 8 DEKINA 334237 33 0.0909 0.0755 1.2036 9 OLAMABORO 203595 18 0.0496 0.0460 1.0777 10 ZAGBA-EAST 189658 14 0.0386 0.0429 0.8998 11 ANKPA 341927 25 0.0689 0.0773 0.8913 12 ZAGBA-WEST 179750 12 0.0331 0.0406 0.8138 13 IJUMU 152343 10 0.0275 0.0344 0.8002 14 AJA0KUTA 157275 10 0.0275 0.0355 0.7751 15 KABBA BUNU 266176 15 0.0413 0.0602 0.6870 16 MOPA-MORO 144576 8 0.0220 0.0327 0.6745 17 OKEHI 287201 15 0.0413 0.0649 0.6367 18 ADAVI 279037 12 0.0331 0.0631 0.5242 19 KOGI 147856 6 0.0165 0.0334 0.4947 20 OKENE 418292 15 0.0413 0.0945 0.4371 21 Total 4424998 363
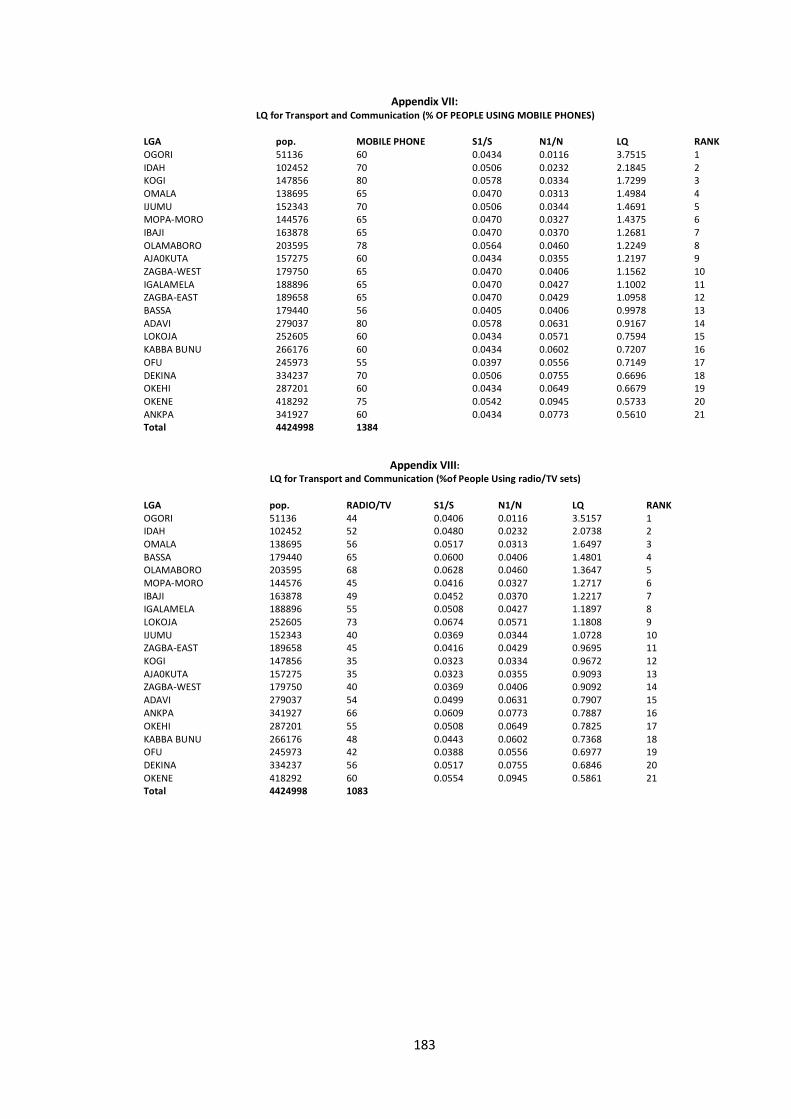
183
Appendix VII: LQ for Transport and Communication (% OF PEOPLE USING MOBILE PHONES)
LGA pop. MOBILE PHONE S1/S N1/N LQ RANK OGORI 51136 60 0.0434 0.0116 3.7515 1 IDAH 102452 70 0.0506 0.0232 2.1845 2 KOGI 147856 80 0.0578 0.0334 1.7299 3 OMALA 138695 65 0.0470 0.0313 1.4984 4 IJUMU 152343 70 0.0506 0.0344 1.4691 5 MOPA-MORO 144576 65 0.0470 0.0327 1.4375 6 IBAJI 163878 65 0.0470 0.0370 1.2681 7 OLAMABORO 203595 78 0.0564 0.0460 1.2249 8 AJA0KUTA 157275 60 0.0434 0.0355 1.2197 9 ZAGBA-WEST 179750 65 0.0470 0.0406 1.1562 10 IGALAMELA 188896 65 0.0470 0.0427 1.1002 11 ZAGBA-EAST 189658 65 0.0470 0.0429 1.0958 12 BASSA 179440 56 0.0405 0.0406 0.9978 13 ADAVI 279037 80 0.0578 0.0631 0.9167 14 LOKOJA 252605 60 0.0434 0.0571 0.7594 15 KABBA BUNU 266176 60 0.0434 0.0602 0.7207 16 OFU 245973 55 0.0397 0.0556 0.7149 17 DEKINA 334237 70 0.0506 0.0755 0.6696 18 OKEHI 287201 60 0.0434 0.0649 0.6679 19 OKENE 418292 75 0.0542 0.0945 0.5733 20 ANKPA 341927 60 0.0434 0.0773 0.5610 21 Total 4424998 1384
Appendix VIII: LQ for Transport and Communication (%of People Using radio/TV sets)
LGA pop. RADIO/TV S1/S N1/N LQ RANK OGORI 51136 44 0.0406 0.0116 3.5157 1 IDAH 102452 52 0.0480 0.0232 2.0738 2 OMALA 138695 56 0.0517 0.0313 1.6497 3 BASSA 179440 65 0.0600 0.0406 1.4801 4 OLAMABORO 203595 68 0.0628 0.0460 1.3647 5 MOPA-MORO 144576 45 0.0416 0.0327 1.2717 6 IBAJI 163878 49 0.0452 0.0370 1.2217 7 IGALAMELA 188896 55 0.0508 0.0427 1.1897 8 LOKOJA 252605 73 0.0674 0.0571 1.1808 9 IJUMU 152343 40 0.0369 0.0344 1.0728 10 ZAGBA-EAST 189658 45 0.0416 0.0429 0.9695 11 KOGI 147856 35 0.0323 0.0334 0.9672 12 AJA0KUTA 157275 35 0.0323 0.0355 0.9093 13 ZAGBA-WEST 179750 40 0.0369 0.0406 0.9092 14 ADAVI 279037 54 0.0499 0.0631 0.7907 15 ANKPA 341927 66 0.0609 0.0773 0.7887 16 OKEHI 287201 55 0.0508 0.0649 0.7825 17 KABBA BUNU 266176 48 0.0443 0.0602 0.7368 18 OFU 245973 42 0.0388 0.0556 0.6977 19 DEKINA 334237 56 0.0517 0.0755 0.6846 20 OKENE 418292 60 0.0554 0.0945 0.5861 21 Total 4424998 1083
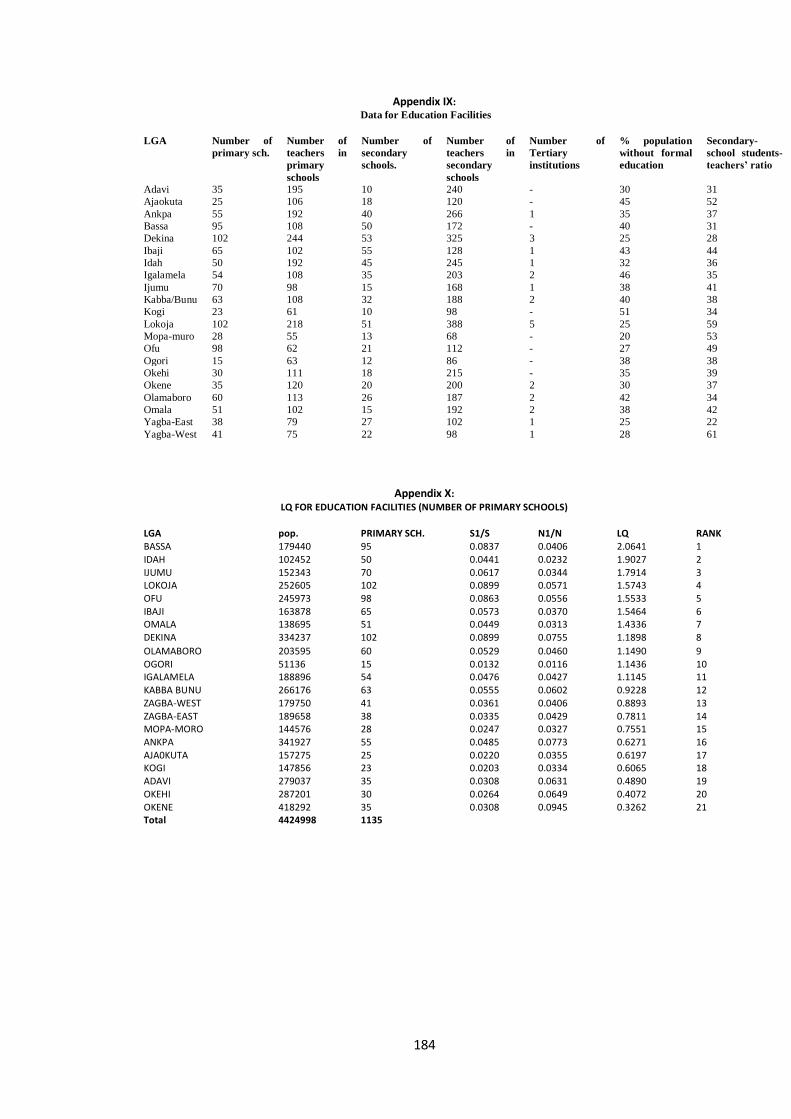
184
Appendix IX:
Data for Education Facilities
LGA Number of
primary sch.
Number of
teachers in
primary
schools
Number of
secondary
schools.
Number of
teachers in
secondary
schools
Number of
Tertiary
institutions
% population
without formal
education
Secondary-
school students-
teachers’ ratio
Adavi 35 195 10 240 - 30 31
Ajaokuta 25 106 18 120 - 45 52
Ankpa 55 192 40 266 1 35 37
Bassa 95 108 50 172 - 40 31
Dekina 102 244 53 325 3 25 28
Ibaji 65 102 55 128 1 43 44
Idah 50 192 45 245 1 32 36
Igalamela 54 108 35 203 2 46 35
Ijumu 70 98 15 168 1 38 41
Kabba/Bunu 63 108 32 188 2 40 38
Kogi 23 61 10 98 - 51 34
Lokoja 102 218 51 388 5 25 59
Mopa-muro 28 55 13 68 - 20 53
Ofu 98 62 21 112 - 27 49
Ogori 15 63 12 86 - 38 38
Okehi 30 111 18 215 - 35 39
Okene 35 120 20 200 2 30 37
Olamaboro 60 113 26 187 2 42 34
Omala 51 102 15 192 2 38 42
Yagba-East 38 79 27 102 1 25 22
Yagba-West 41 75 22 98 1 28 61
Appendix X:
LQ FOR EDUCATION FACILITIES (NUMBER OF PRIMARY SCHOOLS)
LGA pop. PRIMARY SCH. S1/S N1/N LQ RANK BASSA 179440 95 0.0837 0.0406 2.0641 1 IDAH 102452 50 0.0441 0.0232 1.9027 2 IJUMU 152343 70 0.0617 0.0344 1.7914 3 LOKOJA 252605 102 0.0899 0.0571 1.5743 4 OFU 245973 98 0.0863 0.0556 1.5533 5 IBAJI 163878 65 0.0573 0.0370 1.5464 6 OMALA 138695 51 0.0449 0.0313 1.4336 7 DEKINA 334237 102 0.0899 0.0755 1.1898 8
OLAMABORO 203595 60 0.0529 0.0460 1.1490 9 OGORI 51136 15 0.0132 0.0116 1.1436 10 IGALAMELA 188896 54 0.0476 0.0427 1.1145 11 KABBA BUNU 266176 63 0.0555 0.0602 0.9228 12 ZAGBA-WEST 179750 41 0.0361 0.0406 0.8893 13 ZAGBA-EAST 189658 38 0.0335 0.0429 0.7811 14 MOPA-MORO 144576 28 0.0247 0.0327 0.7551 15 ANKPA 341927 55 0.0485 0.0773 0.6271 16 AJA0KUTA 157275 25 0.0220 0.0355 0.6197 17 KOGI 147856 23 0.0203 0.0334 0.6065 18 ADAVI 279037 35 0.0308 0.0631 0.4890 19 OKEHI 287201 30 0.0264 0.0649 0.4072 20 OKENE 418292 35 0.0308 0.0945 0.3262 21 Total 4424998 1135
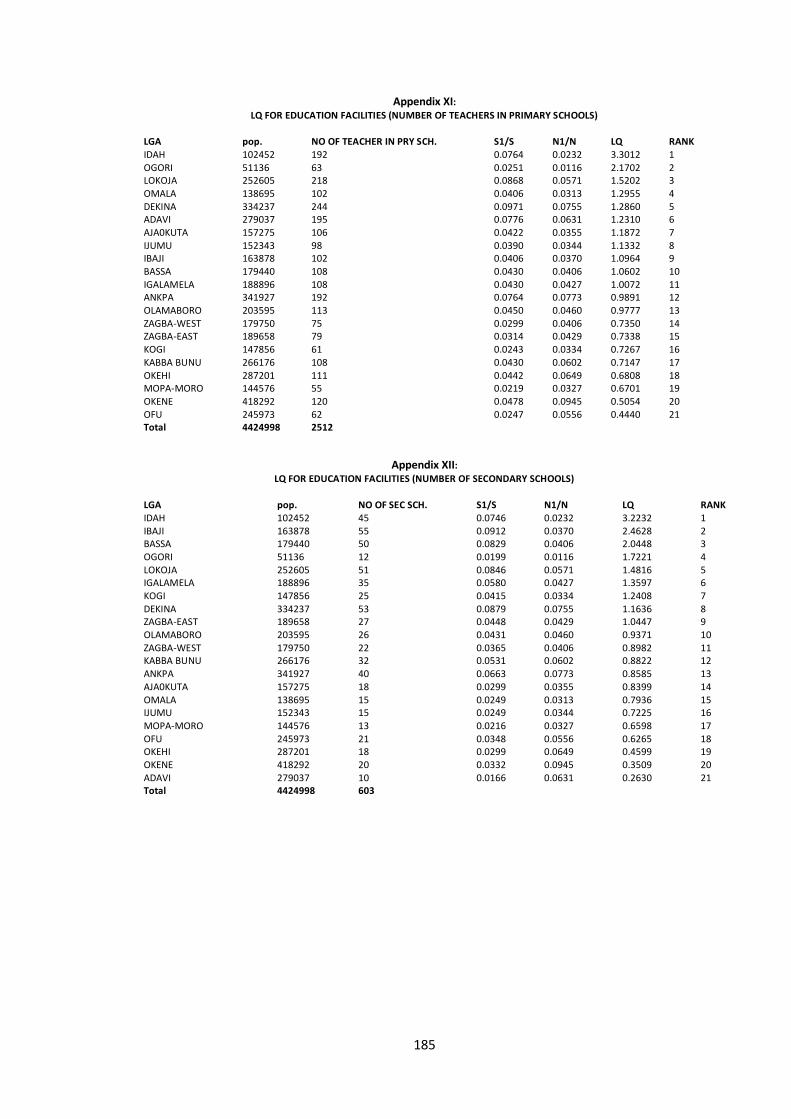
185
Appendix XI: LQ FOR EDUCATION FACILITIES (NUMBER OF TEACHERS IN PRIMARY SCHOOLS)
LGA pop. NO OF TEACHER IN PRY SCH. S1/S N1/N LQ RANK IDAH 102452 192 0.0764 0.0232 3.3012 1 OGORI 51136 63 0.0251 0.0116 2.1702 2 LOKOJA 252605 218 0.0868 0.0571 1.5202 3 OMALA 138695 102 0.0406 0.0313 1.2955 4 DEKINA 334237 244 0.0971 0.0755 1.2860 5 ADAVI 279037 195 0.0776 0.0631 1.2310 6 AJA0KUTA 157275 106 0.0422 0.0355 1.1872 7 IJUMU 152343 98 0.0390 0.0344 1.1332 8 IBAJI 163878 102 0.0406 0.0370 1.0964 9 BASSA 179440 108 0.0430 0.0406 1.0602 10 IGALAMELA 188896 108 0.0430 0.0427 1.0072 11 ANKPA 341927 192 0.0764 0.0773 0.9891 12 OLAMABORO 203595 113 0.0450 0.0460 0.9777 13 ZAGBA-WEST 179750 75 0.0299 0.0406 0.7350 14 ZAGBA-EAST 189658 79 0.0314 0.0429 0.7338 15 KOGI 147856 61 0.0243 0.0334 0.7267 16 KABBA BUNU 266176 108 0.0430 0.0602 0.7147 17 OKEHI 287201 111 0.0442 0.0649 0.6808 18 MOPA-MORO 144576 55 0.0219 0.0327 0.6701 19 OKENE 418292 120 0.0478 0.0945 0.5054 20 OFU 245973 62 0.0247 0.0556 0.4440 21 Total 4424998 2512
Appendix XII: LQ FOR EDUCATION FACILITIES (NUMBER OF SECONDARY SCHOOLS)
LGA pop. NO OF SEC SCH. S1/S N1/N LQ RANK IDAH 102452 45 0.0746 0.0232 3.2232 1 IBAJI 163878 55 0.0912 0.0370 2.4628 2 BASSA 179440 50 0.0829 0.0406 2.0448 3 OGORI 51136 12 0.0199 0.0116 1.7221 4 LOKOJA 252605 51 0.0846 0.0571 1.4816 5 IGALAMELA 188896 35 0.0580 0.0427 1.3597 6 KOGI 147856 25 0.0415 0.0334 1.2408 7 DEKINA 334237 53 0.0879 0.0755 1.1636 8 ZAGBA-EAST 189658 27 0.0448 0.0429 1.0447 9 OLAMABORO 203595 26 0.0431 0.0460 0.9371 10 ZAGBA-WEST 179750 22 0.0365 0.0406 0.8982 11 KABBA BUNU 266176 32 0.0531 0.0602 0.8822 12 ANKPA 341927 40 0.0663 0.0773 0.8585 13 AJA0KUTA 157275 18 0.0299 0.0355 0.8399 14 OMALA 138695 15 0.0249 0.0313 0.7936 15 IJUMU 152343 15 0.0249 0.0344 0.7225 16 MOPA-MORO 144576 13 0.0216 0.0327 0.6598 17 OFU 245973 21 0.0348 0.0556 0.6265 18 OKEHI 287201 18 0.0299 0.0649 0.4599 19 OKENE 418292 20 0.0332 0.0945 0.3509 20 ADAVI 279037 10 0.0166 0.0631 0.2630 21 Total 4424998 603
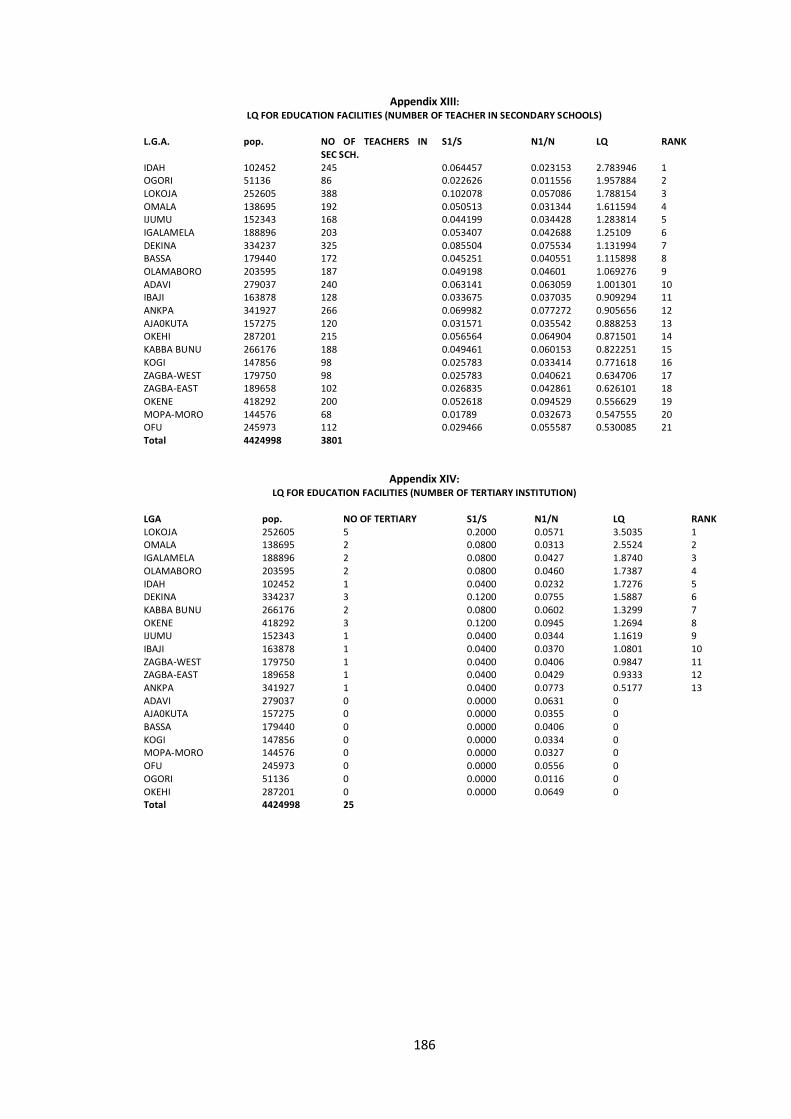
186
Appendix XIII: LQ FOR EDUCATION FACILITIES (NUMBER OF TEACHER IN SECONDARY SCHOOLS)
L.G.A. pop. NO OF TEACHERS IN SEC SCH.
S1/S N1/N LQ RANK
IDAH 102452 245 0.064457 0.023153 2.783946 1 OGORI 51136 86 0.022626 0.011556 1.957884 2 LOKOJA 252605 388 0.102078 0.057086 1.788154 3 OMALA 138695 192 0.050513 0.031344 1.611594 4 IJUMU 152343 168 0.044199 0.034428 1.283814 5 IGALAMELA 188896 203 0.053407 0.042688 1.25109 6 DEKINA 334237 325 0.085504 0.075534 1.131994 7 BASSA 179440 172 0.045251 0.040551 1.115898 8 OLAMABORO 203595 187 0.049198 0.04601 1.069276 9 ADAVI 279037 240 0.063141 0.063059 1.001301 10 IBAJI 163878 128 0.033675 0.037035 0.909294 11 ANKPA 341927 266 0.069982 0.077272 0.905656 12 AJA0KUTA 157275 120 0.031571 0.035542 0.888253 13 OKEHI 287201 215 0.056564 0.064904 0.871501 14 KABBA BUNU 266176 188 0.049461 0.060153 0.822251 15 KOGI 147856 98 0.025783 0.033414 0.771618 16 ZAGBA-WEST 179750 98 0.025783 0.040621 0.634706 17 ZAGBA-EAST 189658 102 0.026835 0.042861 0.626101 18 OKENE 418292 200 0.052618 0.094529 0.556629 19 MOPA-MORO 144576 68 0.01789 0.032673 0.547555 20 OFU 245973 112 0.029466 0.055587 0.530085 21 Total 4424998 3801
Appendix XIV:
LQ FOR EDUCATION FACILITIES (NUMBER OF TERTIARY INSTITUTION)
LGA pop. NO OF TERTIARY S1/S N1/N LQ RANK LOKOJA 252605 5 0.2000 0.0571 3.5035 1 OMALA 138695 2 0.0800 0.0313 2.5524 2 IGALAMELA 188896 2 0.0800 0.0427 1.8740 3 OLAMABORO 203595 2 0.0800 0.0460 1.7387 4 IDAH 102452 1 0.0400 0.0232 1.7276 5 DEKINA 334237 3 0.1200 0.0755 1.5887 6 KABBA BUNU 266176 2 0.0800 0.0602 1.3299 7 OKENE 418292 3 0.1200 0.0945 1.2694 8 IJUMU 152343 1 0.0400 0.0344 1.1619 9 IBAJI 163878 1 0.0400 0.0370 1.0801 10 ZAGBA-WEST 179750 1 0.0400 0.0406 0.9847 11 ZAGBA-EAST 189658 1 0.0400 0.0429 0.9333 12 ANKPA 341927 1 0.0400 0.0773 0.5177 13 ADAVI 279037 0 0.0000 0.0631 0 AJA0KUTA 157275 0 0.0000 0.0355 0 BASSA 179440 0 0.0000 0.0406 0 KOGI 147856 0 0.0000 0.0334 0 MOPA-MORO 144576 0 0.0000 0.0327 0 OFU 245973 0 0.0000 0.0556 0 OGORI 51136 0 0.0000 0.0116 0 OKEHI 287201 0 0.0000 0.0649 0 Total 4424998 25
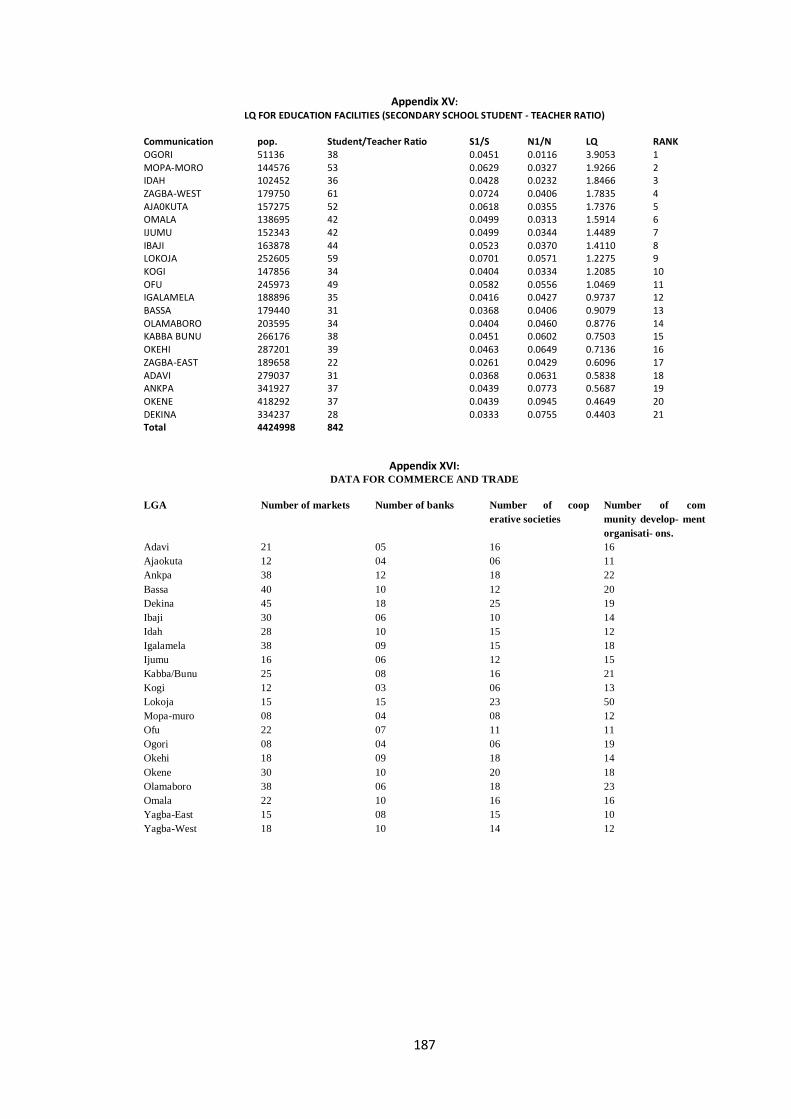
187
Appendix XV:
LQ FOR EDUCATION FACILITIES (SECONDARY SCHOOL STUDENT - TEACHER RATIO)
Communication pop. Student/Teacher Ratio S1/S N1/N LQ RANK OGORI 51136 38 0.0451 0.0116 3.9053 1 MOPA-MORO 144576 53 0.0629 0.0327 1.9266 2 IDAH 102452 36 0.0428 0.0232 1.8466 3 ZAGBA-WEST 179750 61 0.0724 0.0406 1.7835 4 AJA0KUTA 157275 52 0.0618 0.0355 1.7376 5 OMALA 138695 42 0.0499 0.0313 1.5914 6 IJUMU 152343 42 0.0499 0.0344 1.4489 7 IBAJI 163878 44 0.0523 0.0370 1.4110 8 LOKOJA 252605 59 0.0701 0.0571 1.2275 9 KOGI 147856 34 0.0404 0.0334 1.2085 10 OFU 245973 49 0.0582 0.0556 1.0469 11 IGALAMELA 188896 35 0.0416 0.0427 0.9737 12 BASSA 179440 31 0.0368 0.0406 0.9079 13 OLAMABORO 203595 34 0.0404 0.0460 0.8776 14 KABBA BUNU 266176 38 0.0451 0.0602 0.7503 15 OKEHI 287201 39 0.0463 0.0649 0.7136 16 ZAGBA-EAST 189658 22 0.0261 0.0429 0.6096 17 ADAVI 279037 31 0.0368 0.0631 0.5838 18 ANKPA 341927 37 0.0439 0.0773 0.5687 19 OKENE 418292 37 0.0439 0.0945 0.4649 20 DEKINA 334237 28 0.0333 0.0755 0.4403 21 Total 4424998 842
Appendix XVI: DATA FOR COMMERCE AND TRADE
LGA Number of markets Number of banks Number of coop
erative societies
Number of com
munity develop- ment
organisati- ons.
Adavi 21 05 16 16
Ajaokuta 12 04 06 11
Ankpa 38 12 18 22
Bassa 40 10 12 20
Dekina 45 18 25 19
Ibaji 30 06 10 14
Idah 28 10 15 12
Igalamela 38 09 15 18
Ijumu 16 06 12 15
Kabba/Bunu 25 08 16 21
Kogi 12 03 06 13
Lokoja 15 15 23 50
Mopa-muro 08 04 08 12
Ofu 22 07 11 11
Ogori 08 04 06 19
Okehi 18 09 18 14
Okene 30 10 20 18
Olamaboro 38 06 18 23
Omala 22 10 16 16
Yagba-East 15 08 15 10
Yagba-West 18 10 14 12
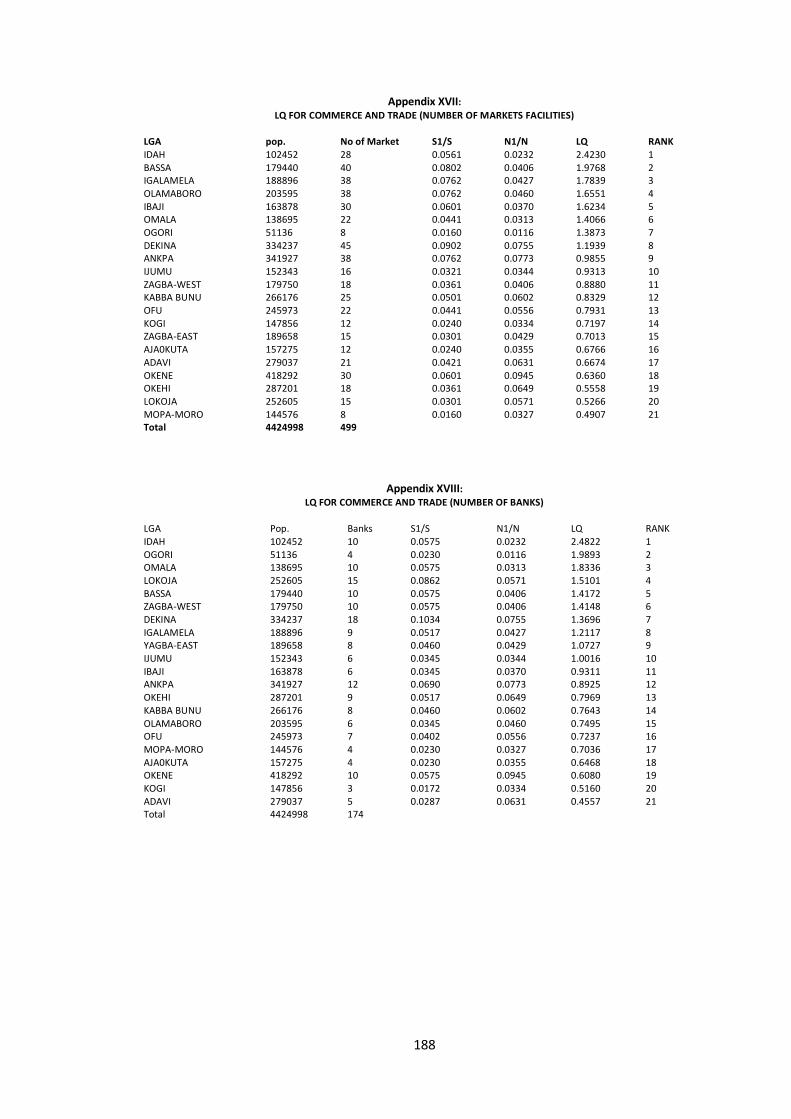
188
Appendix XVII: LQ FOR COMMERCE AND TRADE (NUMBER OF MARKETS FACILITIES)
LGA pop. No of Market S1/S N1/N LQ RANK IDAH 102452 28 0.0561 0.0232 2.4230 1 BASSA 179440 40 0.0802 0.0406 1.9768 2 IGALAMELA 188896 38 0.0762 0.0427 1.7839 3 OLAMABORO 203595 38 0.0762 0.0460 1.6551 4 IBAJI 163878 30 0.0601 0.0370 1.6234 5 OMALA 138695 22 0.0441 0.0313 1.4066 6 OGORI 51136 8 0.0160 0.0116 1.3873 7 DEKINA 334237 45 0.0902 0.0755 1.1939 8 ANKPA 341927 38 0.0762 0.0773 0.9855 9 IJUMU 152343 16 0.0321 0.0344 0.9313 10 ZAGBA-WEST 179750 18 0.0361 0.0406 0.8880 11 KABBA BUNU 266176 25 0.0501 0.0602 0.8329 12 OFU 245973 22 0.0441 0.0556 0.7931 13 KOGI 147856 12 0.0240 0.0334 0.7197 14 ZAGBA-EAST 189658 15 0.0301 0.0429 0.7013 15 AJA0KUTA 157275 12 0.0240 0.0355 0.6766 16 ADAVI 279037 21 0.0421 0.0631 0.6674 17 OKENE 418292 30 0.0601 0.0945 0.6360 18 OKEHI 287201 18 0.0361 0.0649 0.5558 19 LOKOJA 252605 15 0.0301 0.0571 0.5266 20 MOPA-MORO 144576 8 0.0160 0.0327 0.4907 21 Total 4424998 499
Appendix XVIII: LQ FOR COMMERCE AND TRADE (NUMBER OF BANKS)
LGA Pop. Banks S1/S N1/N LQ RANK IDAH 102452 10 0.0575 0.0232 2.4822 1 OGORI 51136 4 0.0230 0.0116 1.9893 2 OMALA 138695 10 0.0575 0.0313 1.8336 3 LOKOJA 252605 15 0.0862 0.0571 1.5101 4 BASSA 179440 10 0.0575 0.0406 1.4172 5 ZAGBA-WEST 179750 10 0.0575 0.0406 1.4148 6 DEKINA 334237 18 0.1034 0.0755 1.3696 7 IGALAMELA 188896 9 0.0517 0.0427 1.2117 8 YAGBA-EAST 189658 8 0.0460 0.0429 1.0727 9 IJUMU 152343 6 0.0345 0.0344 1.0016 10 IBAJI 163878 6 0.0345 0.0370 0.9311 11 ANKPA 341927 12 0.0690 0.0773 0.8925 12 OKEHI 287201 9 0.0517 0.0649 0.7969 13 KABBA BUNU 266176 8 0.0460 0.0602 0.7643 14 OLAMABORO 203595 6 0.0345 0.0460 0.7495 15 OFU 245973 7 0.0402 0.0556 0.7237 16 MOPA-MORO 144576 4 0.0230 0.0327 0.7036 17 AJA0KUTA 157275 4 0.0230 0.0355 0.6468 18 OKENE 418292 10 0.0575 0.0945 0.6080 19 KOGI 147856 3 0.0172 0.0334 0.5160 20 ADAVI 279037 5 0.0287 0.0631 0.4557 21 Total 4424998 174
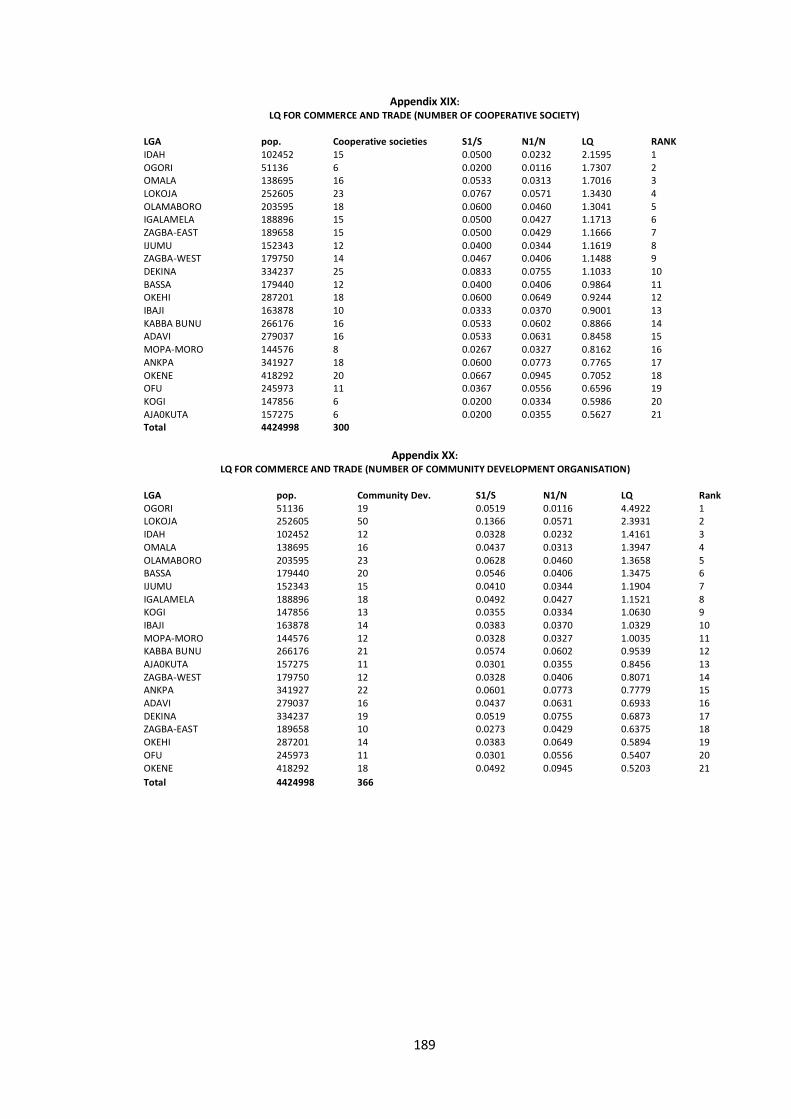
189
Appendix XIX:
LQ FOR COMMERCE AND TRADE (NUMBER OF COOPERATIVE SOCIETY)
LGA pop. Cooperative societies S1/S N1/N LQ RANK IDAH 102452 15 0.0500 0.0232 2.1595 1 OGORI 51136 6 0.0200 0.0116 1.7307 2 OMALA 138695 16 0.0533 0.0313 1.7016 3 LOKOJA 252605 23 0.0767 0.0571 1.3430 4 OLAMABORO 203595 18 0.0600 0.0460 1.3041 5 IGALAMELA 188896 15 0.0500 0.0427 1.1713 6 ZAGBA-EAST 189658 15 0.0500 0.0429 1.1666 7 IJUMU 152343 12 0.0400 0.0344 1.1619 8 ZAGBA-WEST 179750 14 0.0467 0.0406 1.1488 9 DEKINA 334237 25 0.0833 0.0755 1.1033 10 BASSA 179440 12 0.0400 0.0406 0.9864 11 OKEHI 287201 18 0.0600 0.0649 0.9244 12 IBAJI 163878 10 0.0333 0.0370 0.9001 13 KABBA BUNU 266176 16 0.0533 0.0602 0.8866 14 ADAVI 279037 16 0.0533 0.0631 0.8458 15 MOPA-MORO 144576 8 0.0267 0.0327 0.8162 16 ANKPA 341927 18 0.0600 0.0773 0.7765 17 OKENE 418292 20 0.0667 0.0945 0.7052 18 OFU 245973 11 0.0367 0.0556 0.6596 19 KOGI 147856 6 0.0200 0.0334 0.5986 20 AJA0KUTA 157275 6 0.0200 0.0355 0.5627 21 Total 4424998 300
Appendix XX:
LQ FOR COMMERCE AND TRADE (NUMBER OF COMMUNITY DEVELOPMENT ORGANISATION)
LGA pop. Community Dev. S1/S N1/N LQ Rank OGORI 51136 19 0.0519 0.0116 4.4922 1 LOKOJA 252605 50 0.1366 0.0571 2.3931 2 IDAH 102452 12 0.0328 0.0232 1.4161 3 OMALA 138695 16 0.0437 0.0313 1.3947 4 OLAMABORO 203595 23 0.0628 0.0460 1.3658 5 BASSA 179440 20 0.0546 0.0406 1.3475 6 IJUMU 152343 15 0.0410 0.0344 1.1904 7 IGALAMELA 188896 18 0.0492 0.0427 1.1521 8 KOGI 147856 13 0.0355 0.0334 1.0630 9 IBAJI 163878 14 0.0383 0.0370 1.0329 10 MOPA-MORO 144576 12 0.0328 0.0327 1.0035 11 KABBA BUNU 266176 21 0.0574 0.0602 0.9539 12 AJA0KUTA 157275 11 0.0301 0.0355 0.8456 13 ZAGBA-WEST 179750 12 0.0328 0.0406 0.8071 14 ANKPA 341927 22 0.0601 0.0773 0.7779 15 ADAVI 279037 16 0.0437 0.0631 0.6933 16 DEKINA 334237 19 0.0519 0.0755 0.6873 17 ZAGBA-EAST 189658 10 0.0273 0.0429 0.6375 18 OKEHI 287201 14 0.0383 0.0649 0.5894 19 OFU 245973 11 0.0301 0.0556 0.5407 20 OKENE 418292 18 0.0492 0.0945 0.5203 21
Total 4424998 366
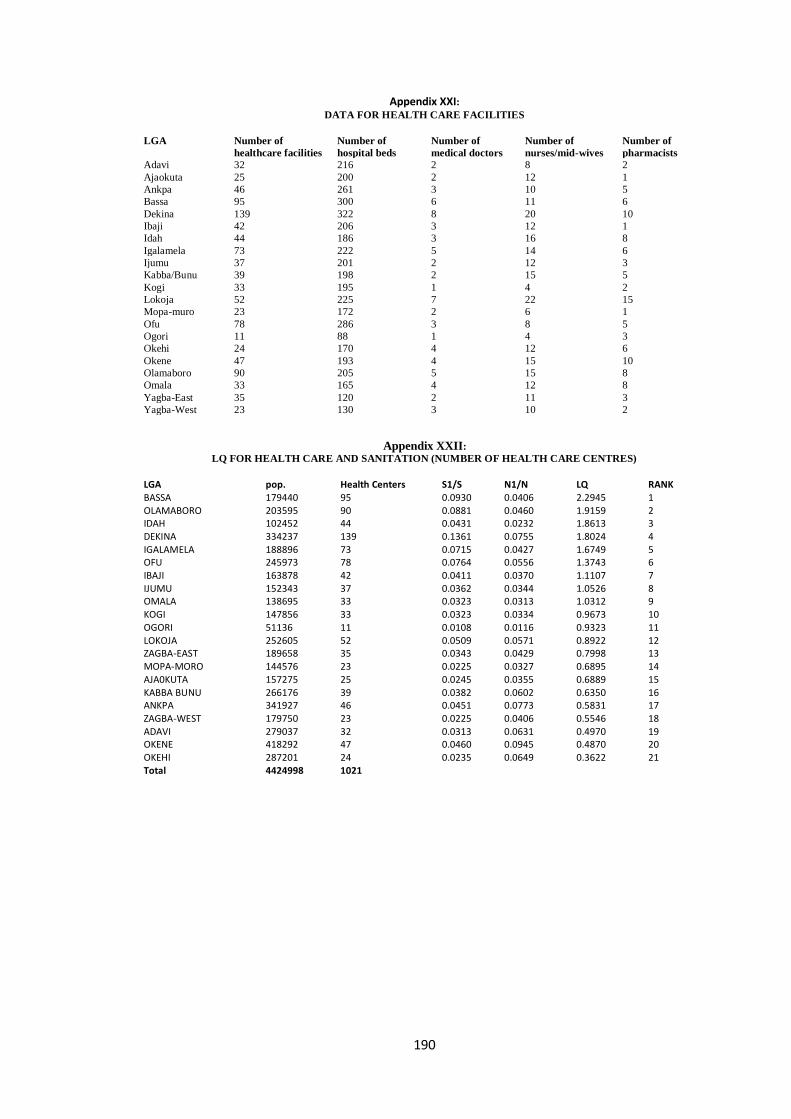
190
Appendix XXI: DATA FOR HEALTH CARE FACILITIES
LGA Number of
healthcare facilities
Number of
hospital beds
Number of
medical doctors
Number of
nurses/mid-wives
Number of
pharmacists
Adavi 32 216 2 8 2
Ajaokuta 25 200 2 12 1
Ankpa 46 261 3 10 5
Bassa 95 300 6 11 6
Dekina 139 322 8 20 10
Ibaji 42 206 3 12 1
Idah 44 186 3 16 8
Igalamela 73 222 5 14 6
Ijumu 37 201 2 12 3
Kabba/Bunu 39 198 2 15 5
Kogi 33 195 1 4 2
Lokoja 52 225 7 22 15
Mopa-muro 23 172 2 6 1
Ofu 78 286 3 8 5
Ogori 11 88 1 4 3
Okehi 24 170 4 12 6
Okene 47 193 4 15 10
Olamaboro 90 205 5 15 8
Omala 33 165 4 12 8
Yagba-East 35 120 2 11 3
Yagba-West 23 130 3 10 2
Appendix XXII:
LQ FOR HEALTH CARE AND SANITATION (NUMBER OF HEALTH CARE CENTRES)
LGA pop. Health Centers S1/S N1/N LQ RANK BASSA 179440 95 0.0930 0.0406 2.2945 1 OLAMABORO 203595 90 0.0881 0.0460 1.9159 2 IDAH 102452 44 0.0431 0.0232 1.8613 3 DEKINA 334237 139 0.1361 0.0755 1.8024 4 IGALAMELA 188896 73 0.0715 0.0427 1.6749 5 OFU 245973 78 0.0764 0.0556 1.3743 6 IBAJI 163878 42 0.0411 0.0370 1.1107 7 IJUMU 152343 37 0.0362 0.0344 1.0526 8 OMALA 138695 33 0.0323 0.0313 1.0312 9 KOGI 147856 33 0.0323 0.0334 0.9673 10 OGORI 51136 11 0.0108 0.0116 0.9323 11 LOKOJA 252605 52 0.0509 0.0571 0.8922 12 ZAGBA-EAST 189658 35 0.0343 0.0429 0.7998 13 MOPA-MORO 144576 23 0.0225 0.0327 0.6895 14 AJA0KUTA 157275 25 0.0245 0.0355 0.6889 15 KABBA BUNU 266176 39 0.0382 0.0602 0.6350 16 ANKPA 341927 46 0.0451 0.0773 0.5831 17 ZAGBA-WEST 179750 23 0.0225 0.0406 0.5546 18 ADAVI 279037 32 0.0313 0.0631 0.4970 19 OKENE 418292 47 0.0460 0.0945 0.4870 20 OKEHI 287201 24 0.0235 0.0649 0.3622 21 Total 4424998 1021
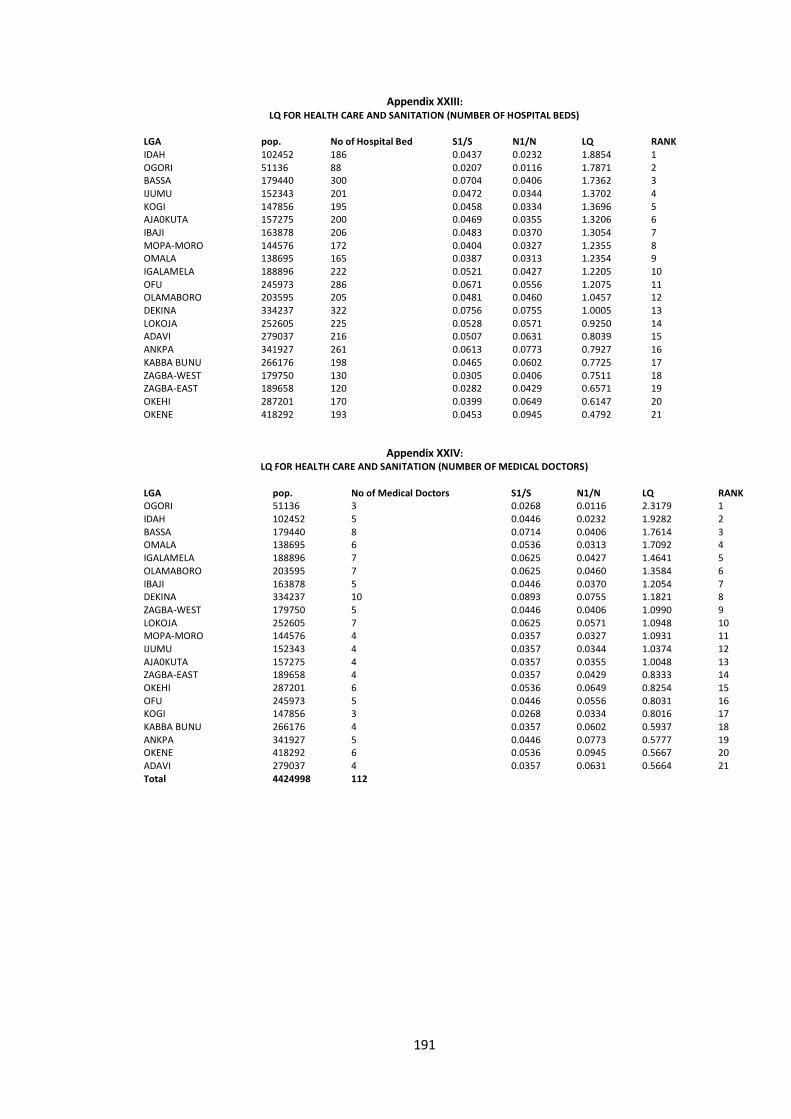
191
Appendix XXIII: LQ FOR HEALTH CARE AND SANITATION (NUMBER OF HOSPITAL BEDS)
LGA pop. No of Hospital Bed S1/S N1/N LQ RANK IDAH 102452 186 0.0437 0.0232 1.8854 1 OGORI 51136 88 0.0207 0.0116 1.7871 2 BASSA 179440 300 0.0704 0.0406 1.7362 3 IJUMU 152343 201 0.0472 0.0344 1.3702 4 KOGI 147856 195 0.0458 0.0334 1.3696 5 AJA0KUTA 157275 200 0.0469 0.0355 1.3206 6 IBAJI 163878 206 0.0483 0.0370 1.3054 7 MOPA-MORO 144576 172 0.0404 0.0327 1.2355 8 OMALA 138695 165 0.0387 0.0313 1.2354 9 IGALAMELA 188896 222 0.0521 0.0427 1.2205 10 OFU 245973 286 0.0671 0.0556 1.2075 11 OLAMABORO 203595 205 0.0481 0.0460 1.0457 12 DEKINA 334237 322 0.0756 0.0755 1.0005 13 LOKOJA 252605 225 0.0528 0.0571 0.9250 14 ADAVI 279037 216 0.0507 0.0631 0.8039 15 ANKPA 341927 261 0.0613 0.0773 0.7927 16 KABBA BUNU 266176 198 0.0465 0.0602 0.7725 17 ZAGBA-WEST 179750 130 0.0305 0.0406 0.7511 18 ZAGBA-EAST 189658 120 0.0282 0.0429 0.6571 19 OKEHI 287201 170 0.0399 0.0649 0.6147 20 OKENE 418292 193 0.0453 0.0945 0.4792 21
Appendix XXIV: LQ FOR HEALTH CARE AND SANITATION (NUMBER OF MEDICAL DOCTORS)
LGA pop. No of Medical Doctors S1/S N1/N LQ RANK OGORI 51136 3 0.0268 0.0116 2.3179 1 IDAH 102452 5 0.0446 0.0232 1.9282 2 BASSA 179440 8 0.0714 0.0406 1.7614 3 OMALA 138695 6 0.0536 0.0313 1.7092 4 IGALAMELA 188896 7 0.0625 0.0427 1.4641 5 OLAMABORO 203595 7 0.0625 0.0460 1.3584 6 IBAJI 163878 5 0.0446 0.0370 1.2054 7 DEKINA 334237 10 0.0893 0.0755 1.1821 8 ZAGBA-WEST 179750 5 0.0446 0.0406 1.0990 9 LOKOJA 252605 7 0.0625 0.0571 1.0948 10 MOPA-MORO 144576 4 0.0357 0.0327 1.0931 11 IJUMU 152343 4 0.0357 0.0344 1.0374 12 AJA0KUTA 157275 4 0.0357 0.0355 1.0048 13 ZAGBA-EAST 189658 4 0.0357 0.0429 0.8333 14 OKEHI 287201 6 0.0536 0.0649 0.8254 15 OFU 245973 5 0.0446 0.0556 0.8031 16 KOGI 147856 3 0.0268 0.0334 0.8016 17 KABBA BUNU 266176 4 0.0357 0.0602 0.5937 18 ANKPA 341927 5 0.0446 0.0773 0.5777 19 OKENE 418292 6 0.0536 0.0945 0.5667 20 ADAVI 279037 4 0.0357 0.0631 0.5664 21 Total 4424998 112
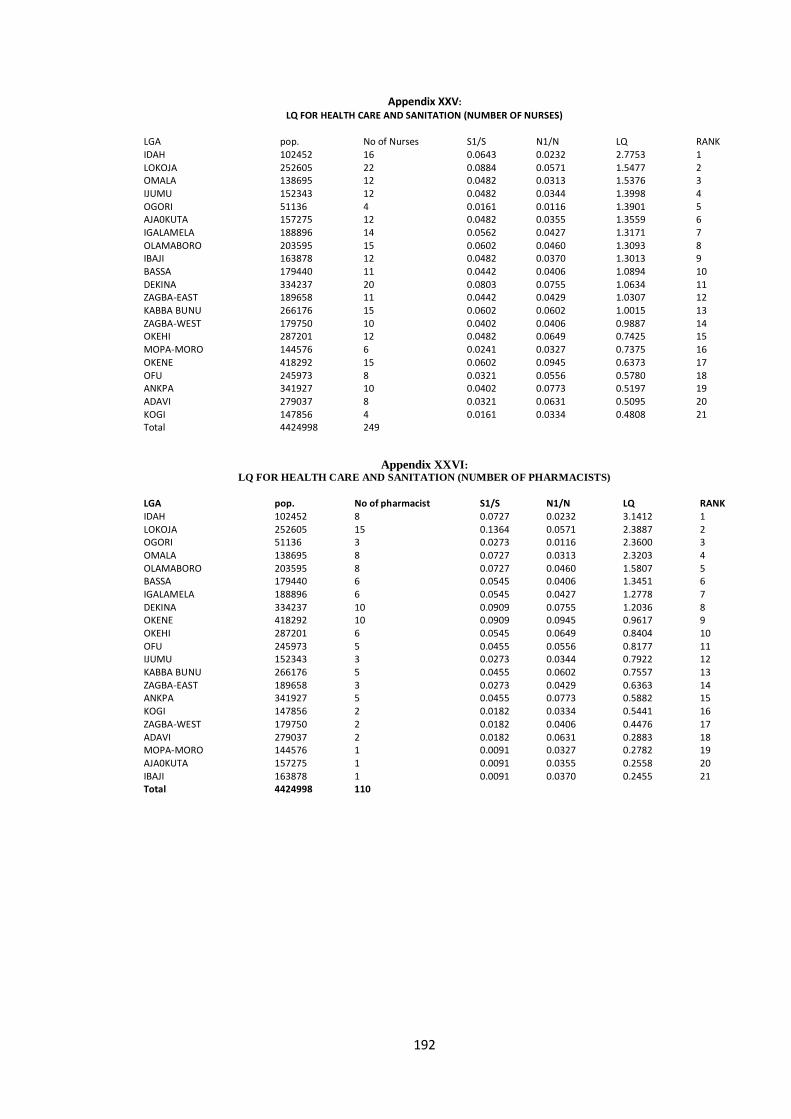
192
Appendix XXV:
LQ FOR HEALTH CARE AND SANITATION (NUMBER OF NURSES)
LGA pop. No of Nurses S1/S N1/N LQ RANK IDAH 102452 16 0.0643 0.0232 2.7753 1 LOKOJA 252605 22 0.0884 0.0571 1.5477 2 OMALA 138695 12 0.0482 0.0313 1.5376 3 IJUMU 152343 12 0.0482 0.0344 1.3998 4 OGORI 51136 4 0.0161 0.0116 1.3901 5 AJA0KUTA 157275 12 0.0482 0.0355 1.3559 6 IGALAMELA 188896 14 0.0562 0.0427 1.3171 7 OLAMABORO 203595 15 0.0602 0.0460 1.3093 8 IBAJI 163878 12 0.0482 0.0370 1.3013 9 BASSA 179440 11 0.0442 0.0406 1.0894 10 DEKINA 334237 20 0.0803 0.0755 1.0634 11 ZAGBA-EAST 189658 11 0.0442 0.0429 1.0307 12 KABBA BUNU 266176 15 0.0602 0.0602 1.0015 13 ZAGBA-WEST 179750 10 0.0402 0.0406 0.9887 14 OKEHI 287201 12 0.0482 0.0649 0.7425 15 MOPA-MORO 144576 6 0.0241 0.0327 0.7375 16 OKENE 418292 15 0.0602 0.0945 0.6373 17 OFU 245973 8 0.0321 0.0556 0.5780 18 ANKPA 341927 10 0.0402 0.0773 0.5197 19 ADAVI 279037 8 0.0321 0.0631 0.5095 20 KOGI 147856 4 0.0161 0.0334 0.4808 21 Total 4424998 249
Appendix XXVI:
LQ FOR HEALTH CARE AND SANITATION (NUMBER OF PHARMACISTS)
LGA pop. No of pharmacist S1/S N1/N LQ RANK IDAH 102452 8 0.0727 0.0232 3.1412 1 LOKOJA 252605 15 0.1364 0.0571 2.3887 2 OGORI 51136 3 0.0273 0.0116 2.3600 3 OMALA 138695 8 0.0727 0.0313 2.3203 4 OLAMABORO 203595 8 0.0727 0.0460 1.5807 5 BASSA 179440 6 0.0545 0.0406 1.3451 6 IGALAMELA 188896 6 0.0545 0.0427 1.2778 7 DEKINA 334237 10 0.0909 0.0755 1.2036 8 OKENE 418292 10 0.0909 0.0945 0.9617 9 OKEHI 287201 6 0.0545 0.0649 0.8404 10 OFU 245973 5 0.0455 0.0556 0.8177 11 IJUMU 152343 3 0.0273 0.0344 0.7922 12 KABBA BUNU 266176 5 0.0455 0.0602 0.7557 13 ZAGBA-EAST 189658 3 0.0273 0.0429 0.6363 14 ANKPA 341927 5 0.0455 0.0773 0.5882 15 KOGI 147856 2 0.0182 0.0334 0.5441 16 ZAGBA-WEST 179750 2 0.0182 0.0406 0.4476 17 ADAVI 279037 2 0.0182 0.0631 0.2883 18 MOPA-MORO 144576 1 0.0091 0.0327 0.2782 19 AJA0KUTA 157275 1 0.0091 0.0355 0.2558 20 IBAJI 163878 1 0.0091 0.0370 0.2455 21 Total 4424998 110
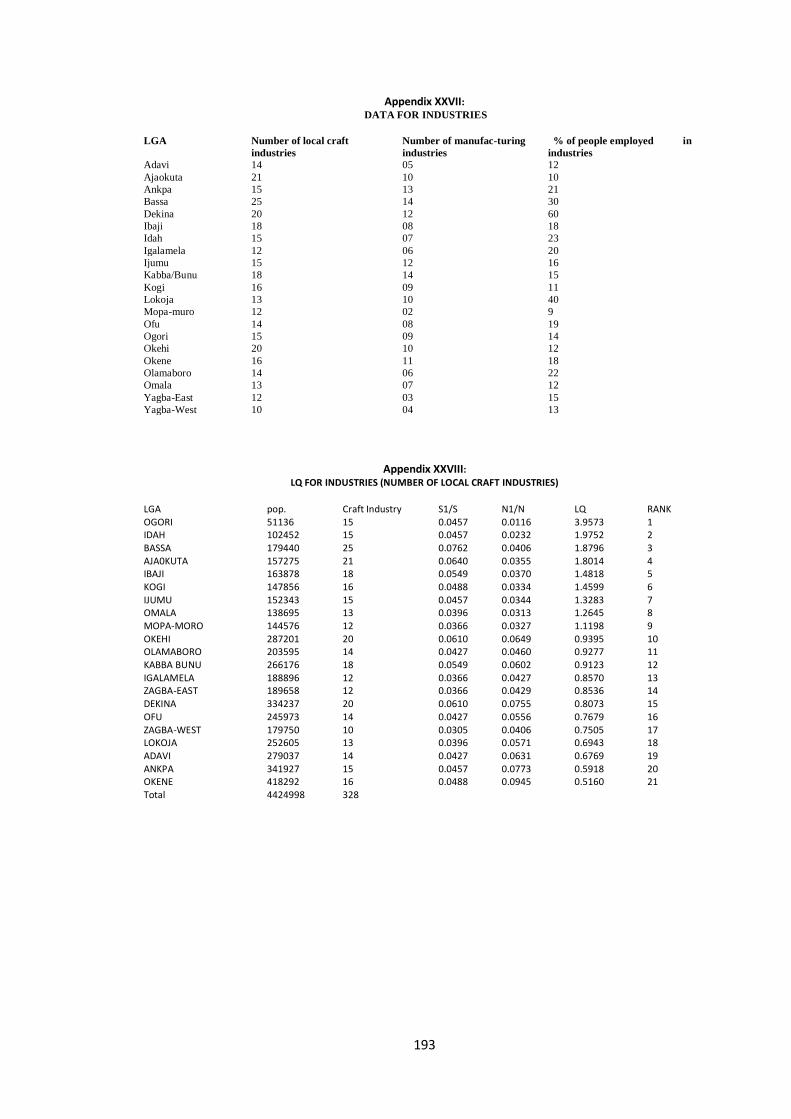
193
Appendix XXVII: DATA FOR INDUSTRIES
LGA Number of local craft
industries
Number of manufac-turing
industries
% of people employed in
industries
Adavi 14 05 12
Ajaokuta 21 10 10
Ankpa 15 13 21
Bassa 25 14 30
Dekina 20 12 60
Ibaji 18 08 18
Idah 15 07 23
Igalamela 12 06 20
Ijumu 15 12 16
Kabba/Bunu 18 14 15
Kogi 16 09 11
Lokoja 13 10 40
Mopa-muro 12 02 9
Ofu 14 08 19
Ogori 15 09 14
Okehi 20 10 12
Okene 16 11 18
Olamaboro 14 06 22
Omala 13 07 12
Yagba-East 12 03 15
Yagba-West 10 04 13
Appendix XXVIII: LQ FOR INDUSTRIES (NUMBER OF LOCAL CRAFT INDUSTRIES)
LGA pop. Craft Industry S1/S N1/N LQ RANK OGORI 51136 15 0.0457 0.0116 3.9573 1 IDAH 102452 15 0.0457 0.0232 1.9752 2 BASSA 179440 25 0.0762 0.0406 1.8796 3 AJA0KUTA 157275 21 0.0640 0.0355 1.8014 4 IBAJI 163878 18 0.0549 0.0370 1.4818 5 KOGI 147856 16 0.0488 0.0334 1.4599 6 IJUMU 152343 15 0.0457 0.0344 1.3283 7 OMALA 138695 13 0.0396 0.0313 1.2645 8 MOPA-MORO 144576 12 0.0366 0.0327 1.1198 9 OKEHI 287201 20 0.0610 0.0649 0.9395 10 OLAMABORO 203595 14 0.0427 0.0460 0.9277 11 KABBA BUNU 266176 18 0.0549 0.0602 0.9123 12 IGALAMELA 188896 12 0.0366 0.0427 0.8570 13 ZAGBA-EAST 189658 12 0.0366 0.0429 0.8536 14 DEKINA 334237 20 0.0610 0.0755 0.8073 15 OFU 245973 14 0.0427 0.0556 0.7679 16 ZAGBA-WEST 179750 10 0.0305 0.0406 0.7505 17 LOKOJA 252605 13 0.0396 0.0571 0.6943 18 ADAVI 279037 14 0.0427 0.0631 0.6769 19 ANKPA 341927 15 0.0457 0.0773 0.5918 20 OKENE 418292 16 0.0488 0.0945 0.5160 21 Total 4424998 328
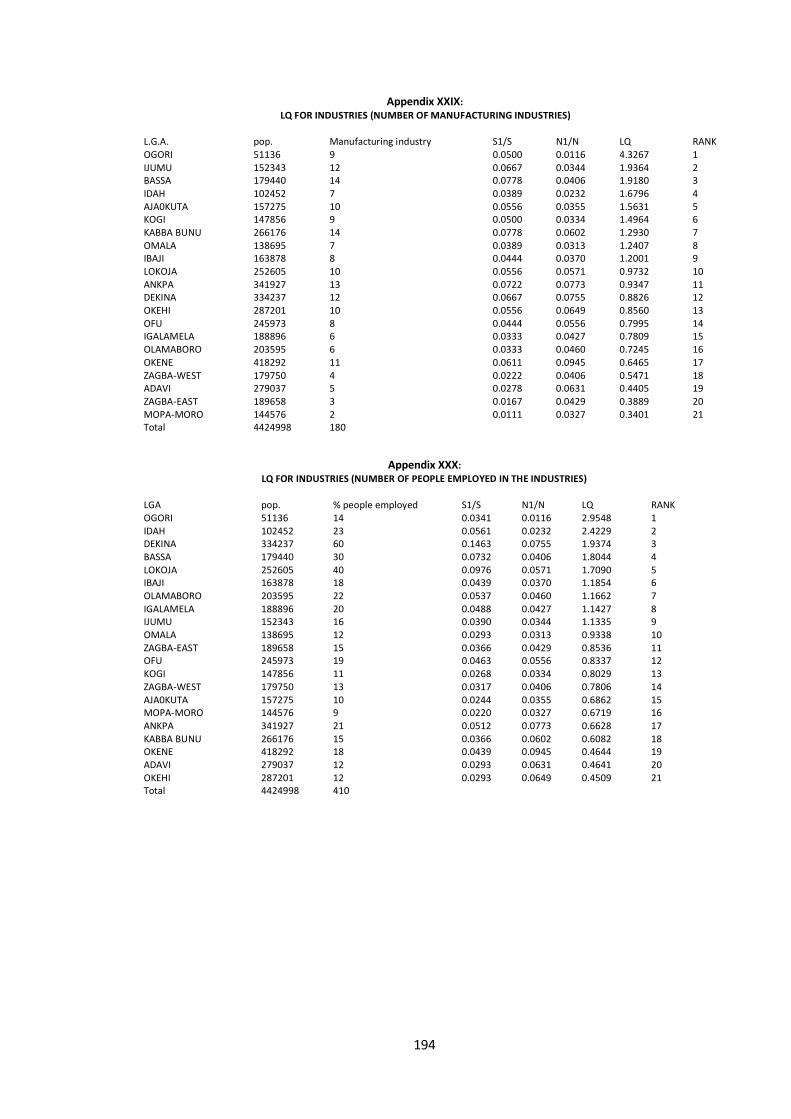
194
Appendix XXIX:
LQ FOR INDUSTRIES (NUMBER OF MANUFACTURING INDUSTRIES)
L.G.A. pop. Manufacturing industry S1/S N1/N LQ RANK OGORI 51136 9 0.0500 0.0116 4.3267 1 IJUMU 152343 12 0.0667 0.0344 1.9364 2 BASSA 179440 14 0.0778 0.0406 1.9180 3 IDAH 102452 7 0.0389 0.0232 1.6796 4 AJA0KUTA 157275 10 0.0556 0.0355 1.5631 5 KOGI 147856 9 0.0500 0.0334 1.4964 6 KABBA BUNU 266176 14 0.0778 0.0602 1.2930 7 OMALA 138695 7 0.0389 0.0313 1.2407 8 IBAJI 163878 8 0.0444 0.0370 1.2001 9 LOKOJA 252605 10 0.0556 0.0571 0.9732 10 ANKPA 341927 13 0.0722 0.0773 0.9347 11 DEKINA 334237 12 0.0667 0.0755 0.8826 12 OKEHI 287201 10 0.0556 0.0649 0.8560 13 OFU 245973 8 0.0444 0.0556 0.7995 14 IGALAMELA 188896 6 0.0333 0.0427 0.7809 15 OLAMABORO 203595 6 0.0333 0.0460 0.7245 16 OKENE 418292 11 0.0611 0.0945 0.6465 17 ZAGBA-WEST 179750 4 0.0222 0.0406 0.5471 18 ADAVI 279037 5 0.0278 0.0631 0.4405 19 ZAGBA-EAST 189658 3 0.0167 0.0429 0.3889 20 MOPA-MORO 144576 2 0.0111 0.0327 0.3401 21 Total 4424998 180
Appendix XXX:
LQ FOR INDUSTRIES (NUMBER OF PEOPLE EMPLOYED IN THE INDUSTRIES)
LGA pop. % people employed S1/S N1/N LQ RANK OGORI 51136 14 0.0341 0.0116 2.9548 1 IDAH 102452 23 0.0561 0.0232 2.4229 2 DEKINA 334237 60 0.1463 0.0755 1.9374 3 BASSA 179440 30 0.0732 0.0406 1.8044 4 LOKOJA 252605 40 0.0976 0.0571 1.7090 5 IBAJI 163878 18 0.0439 0.0370 1.1854 6 OLAMABORO 203595 22 0.0537 0.0460 1.1662 7 IGALAMELA 188896 20 0.0488 0.0427 1.1427 8 IJUMU 152343 16 0.0390 0.0344 1.1335 9 OMALA 138695 12 0.0293 0.0313 0.9338 10 ZAGBA-EAST 189658 15 0.0366 0.0429 0.8536 11 OFU 245973 19 0.0463 0.0556 0.8337 12 KOGI 147856 11 0.0268 0.0334 0.8029 13 ZAGBA-WEST 179750 13 0.0317 0.0406 0.7806 14 AJA0KUTA 157275 10 0.0244 0.0355 0.6862 15 MOPA-MORO 144576 9 0.0220 0.0327 0.6719 16 ANKPA 341927 21 0.0512 0.0773 0.6628 17 KABBA BUNU 266176 15 0.0366 0.0602 0.6082 18 OKENE 418292 18 0.0439 0.0945 0.4644 19 ADAVI 279037 12 0.0293 0.0631 0.4641 20 OKEHI 287201 12 0.0293 0.0649 0.4509 21 Total 4424998 410
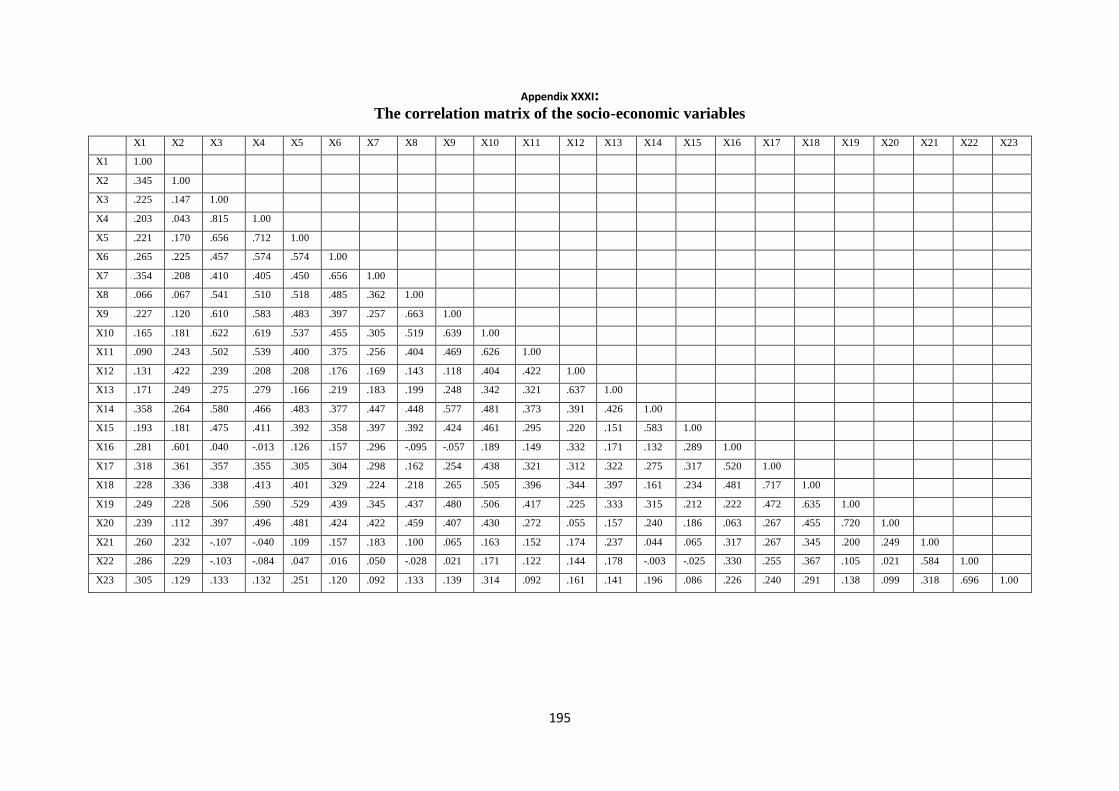
195
Appendix XXXI:
The correlation matrix of the socio-economic variables
X1 X2 X3 X4 X5 X6 X7 X8 X9 X10 X11 X12 X13 X14 X15 X16 X17 X18 X19 X20 X21 X22 X23
X1 1.00
X2 .345 1.00
X3 .225 .147 1.00
X4 .203 .043 .815 1.00
X5 .221 .170 .656 .712 1.00
X6 .265 .225 .457 .574 .574 1.00
X7 .354 .208 .410 .405 .450 .656 1.00
X8 .066 .067 .541 .510 .518 .485 .362 1.00
X9 .227 .120 .610 .583 .483 .397 .257 .663 1.00
X10 .165 .181 .622 .619 .537 .455 .305 .519 .639 1.00
X11 .090 .243 .502 .539 .400 .375 .256 .404 .469 .626 1.00
X12 .131 .422 .239 .208 .208 .176 .169 .143 .118 .404 .422 1.00
X13 .171 .249 .275 .279 .166 .219 .183 .199 .248 .342 .321 .637 1.00
X14 .358 .264 .580 .466 .483 .377 .447 .448 .577 .481 .373 .391 .426 1.00
X15 .193 .181 .475 .411 .392 .358 .397 .392 .424 .461 .295 .220 .151 .583 1.00
X16 .281 .601 .040 -.013 .126 .157 .296 -.095 -.057 .189 .149 .332 .171 .132 .289 1.00
X17 .318 .361 .357 .355 .305 .304 .298 .162 .254 .438 .321 .312 .322 .275 .317 .520 1.00
X18 .228 .336 .338 .413 .401 .329 .224 .218 .265 .505 .396 .344 .397 .161 .234 .481 .717 1.00
X19 .249 .228 .506 .590 .529 .439 .345 .437 .480 .506 .417 .225 .333 .315 .212 .222 .472 .635 1.00
X20 .239 .112 .397 .496 .481 .424 .422 .459 .407 .430 .272 .055 .157 .240 .186 .063 .267 .455 .720 1.00
X21 .260 .232 -.107 -.040 .109 .157 .183 .100 .065 .163 .152 .174 .237 .044 .065 .317 .267 .345 .200 .249 1.00
X22 .286 .229 -.103 -.084 .047 .016 .050 -.028 .021 .171 .122 .144 .178 -.003 -.025 .330 .255 .367 .105 .021 .584 1.00
X23 .305 .129 .133 .132 .251 .120 .092 .133 .139 .314 .092 .161 .141 .196 .086 .226 .240 .291 .138 .099 .318 .696 1.00
Related Documents