Journal Of Geophysical Research MAR 13 2007; 112 (F1) NIL_1-NIL_29 http://dx.doi.org/10.1029/2005JF000408 © 2007 American Geophysical Union An edited version of this paper was published by AGU . Archimer http://www.ifremer.fr/docelec/ Archive Institutionnelle de l’Ifremer Analysis of slope failures in submarine canyon heads: An example from the Gulf of Lions Nabil SULTAN *(1) , Matthieu GAUDIN (1,2) Serge BERNE (1) , Miquel CANALS (3) , Roger URGELES (3) and Sara LAFUERZA (3) . (1) Ifremer, Département Géosciences Marines, BP 70, Plouzané F-29280, France. (2) U. Bordeaux I, Dépt, Géologie et Océanographie, UMR 5805 EPOC, Av. des Facultés, Talence F- 33405, France (3) U. Barcelona, GRC Geociències Marines, Dept. d'Estratigrafia, Paleontologia i Geociències Marines, Campus de Pedralbes, Barcelona, Spain. *: Corresponding author : [email protected] Abstract: To improve understanding of evolution of submarine canyons, a three-dimensional slope-stability model is applied to Bourcart Canyon in the western Gulf of Lions in the Mediterranean Sea. The model builds on previous work by Chen and others, and it uses the upper bound theorem of plasticity to calculate the factor of safety of a kinematically admissible failing mass. Examples of three-dimensional failure surfaces documented in the literature were used to test the model formulation. Model application to Bourcart Canyon employed the results of a detailed stratigraphic analyses based on data acquired by swath bathymetry, sub-bottom profiling, high-resolution seismic reflection surveys, and piston coring. The sediment layers were also characterized using in-situ geotechnical measurements and laboratory tests. The effects of three loading scenarios were analyzed: (1) earthquake shaking, (2) hemipelagic sedimentation, and (3) axial incision. These three mechanisms influenced the predicted volumes and shapes of slope failures along the flanks of Bourcart Canyon, and comparison of these predictions with failure geometries inferred from seafloor morphology showed that mass failures could account for the observed morphology along the canyon walls as well as a mechanism of canyon widening. 1

Welcome message from author
This document is posted to help you gain knowledge. Please leave a comment to let me know what you think about it! Share it to your friends and learn new things together.
Transcript
Journal Of Geophysical Research MAR 13 2007; 112 (F1) NIL_1-NIL_29 http://dx.doi.org/10.1029/2005JF000408 © 2007 American Geophysical Union An edited version of this paper was published by AGU.
Archimer http://www.ifremer.fr/docelec/Archive Institutionnelle de l’Ifremer
Analysis of slope failures in submarine canyon heads: An example from the Gulf of Lions
Nabil SULTAN*(1), Matthieu GAUDIN(1,2) Serge BERNE(1), Miquel CANALS(3), Roger
URGELES(3) and Sara LAFUERZA(3).
(1) Ifremer, Département Géosciences Marines, BP 70, Plouzané F-29280, France. (2) U. Bordeaux I, Dépt, Géologie et Océanographie, UMR 5805 EPOC, Av. des Facultés, Talence F-33405, France (3) U. Barcelona, GRC Geociències Marines, Dept. d'Estratigrafia, Paleontologia i Geociències Marines, Campus de Pedralbes, Barcelona, Spain. *: Corresponding author : [email protected]
Abstract: To improve understanding of evolution of submarine canyons, a three-dimensional slope-stability model is applied to Bourcart Canyon in the western Gulf of Lions in the Mediterranean Sea. The model builds on previous work by Chen and others, and it uses the upper bound theorem of plasticity to calculate the factor of safety of a kinematically admissible failing mass. Examples of three-dimensional failure surfaces documented in the literature were used to test the model formulation. Model application to Bourcart Canyon employed the results of a detailed stratigraphic analyses based on data acquired by swath bathymetry, sub-bottom profiling, high-resolution seismic reflection surveys, and piston coring. The sediment layers were also characterized using in-situ geotechnical measurements and laboratory tests. The effects of three loading scenarios were analyzed: (1) earthquake shaking, (2) hemipelagic sedimentation, and (3) axial incision. These three mechanisms influenced the predicted volumes and shapes of slope failures along the flanks of Bourcart Canyon, and comparison of these predictions with failure geometries inferred from seafloor morphology showed that mass failures could account for the observed morphology along the canyon walls as well as a mechanism of canyon widening.
1
Introduction
Slope failures in submarine canyon heads are receiving increasing attention to better
understand canyon formation and sediment transfer from shallow water into deep-sea basins.
While slope failures represent an increasing hazard to offshore development and exploitation
of marine resources, they are one of the main processes that shape canyon morphology, re-
mobilize sediment and initiate long-distance sediment transport in submarine canyons. The
primary goal of this study is to improve our understanding of the causes of slope failures in
submarine canyons, to determine the morphological and dynamic characteristics of individual
failures and potential slip planes, and to analyze how these affect canyon morphological
evolution.
Major submarine canyons generally begin on the continental shelf, cross the shelfbreak and
continue down the continental slope to the continental rise. Many of these canyons with
second order and third order tributaries in their upper parts have been considered to be the
seaward continuation of terrestrial drainage systems that crossed the shelf during low stands
of sea-level in the Pleistocene [Spencer, 1903; Stetson, 1936]. There is no doubt that subaerial
erosion processes effectively created some presently buried shelf valleys [Knebel et al., 1979;
Torres et al., 1995]. Pleistocene rivers delivered to the shelf break both suspended and
bedload sediment that subsequently entered the submerged canyon heads. Several theories
and hypothesis have been developed during recent decades to explain the formation and
evolution of submarine canyons. Daly [1936] and Kuenen [1937] proposed that canyons are
cut by turbidity currents, Bucher [1940] suggested that tsunamis are agents of canyon cutting,
Shepard [1936] proposed that canyons might be the result of a succession of emersion,
erosion and infill phases, and Johnson [1939] pointed out the role of artesian sapping in
canyon formation. Most of these authors thought that a single process might explain the origin
of submarine canyons. In the mid-1960s, echosounding and sediment sampling became
2
relatively effective tools in mapping submarine canyons, thereby improving our knowledge
and understanding of their structure and their dimensions as well as the major role played by
turbidity currents as observed by the original experiments made by Kuenen [1955]. In the
early 80’s, Twitchell and Roberts [1982] and Farre et al. [1983] emphasized the role of
retrogressive mass wasting processes in canyon formation. On the other hand, Pratson et al.
[1994] demonstrated that submarine canyons could form from headward erosion driven by
sediment flow originating on the shelf. Mulder et al. [2003] have recently supported the
Pratson et al. [1994] hypothesis by the discovery of a turbidite deposited in 1999 in the
Capbreton canyon [Mulder et al., 2001]. On the other hand, hyperpycnal activity has been
recorded in the Var canyon linked to recent catastrophic Var river floods [Mulder et al.,
1998]. Orange and Breen [1992], Orange et al. [1994, 1997] and McAdoo et al. [1997]
hypothesized that the hydraulic gradient within canyon sidewalls and headwalls may be high
enough to induce internally driven seepage failure and the formation of headless submarine
canyons. More recently, Baztan [2004] and Baztan et al. [2005] have discussed the origin and
the influence of the axial incision observed in most submarine canyons in the western part of
the Gulf of Lions. They proposed that minor erosion related to the axial incision had a key
influence on canyon evolution as it triggers mass wasting of different sizes affecting the
canyon's major valley (head and flanks). Baztan et al. [2005] concluded that the canyon's
major valley cannot be the result of a single erosive episode; the widening and deepening of
the canyon's major valley is the consequence of recurrent erosive activities.
Thus, several questions exist about whether canyon initiation and excavation are the products
of erosive forces of shelf sediments that go down the slope, the products of other processes
such as canyon flank destabilization, or a mix of several processes that could be time-
dependant. To better constrain these aspects, a 3D slope-stability analysis method is
developed in this work in order to 1) accurately consider the role of external mechanisms on
3
slope-instability processes and 2) identify the geometry that better explains how canyon heads
and internal flanks may evolve through slope-instability processes.
The Bourcart Canyon in the Western Gulf of Lions is selected as a case study. Inputs to the
slope-stability model come from (i) high-resolution seismic reflection profiles that we used to
identify erosional surfaces and evaluate missing sediment volumes associated with slope
failure, (ii) swath bathymetry data that helped to locate recent failure scars (from Calmar 99
and Strataform cruises [Berné et al., 2004]), and (iii) geotechnical parameters from in-situ
measurements and sedimentary cores (from GMO2-CARNAC [Sultan and Voisset, 2002] and
PROMESS1 [Berné et al., 2004] cruises) that we used to correlate mechanical properties of
sediments from different layers.
3D slope-stability analysis
Theoretical development
Hazard assessment from sediment instability in planar slopes can be successfully conducted
using 1-D infinite or 2-D slope-stability analysis because margin morphology and sediment
layer thickness are rather constant along slope [e.g., Lee and Baraza, 1999; Leynaud et al.,
2004; Sultan et al., 2004; Kvalstad et al., 2005; Urgeles et al., 2006]. However, slopes are
more complex and heterogeneous in canyon heads and internal walls, therefore neglecting the
third dimension in such settings may lead to oversimplification and induce inaccurate
simulation results, which is always conservative according to Duncan [1996].
The 3D stability analysis method developed in this work is based on the upper bound theorem
of plasticity that was previously developed by Chen et al. [2001a, 2001b]. It is numerically
simple and stable and theoretically more rigorous than other simplified limit-equilibrium
methods that lead to significant errors as both kinematic and static admissibility are violated
[Yu et al., 1998]. This method requires us to postulate 1) a valid failure surface that satisfies
4
the mechanical boundary conditions and 2) a kinematically admissible velocity field that
satisfies the boundary conditions and allows the determination of strain rates in the sediment
within the failure surface.
Failure surface
The equation used to define the failure surfaces depends on 8 shape parameters
. Properties and parameters used in this study are listed in ( xcBMzM ,,,,,,, 21 δδβα ) Table 1. The
failure surface in the x-y-z space is set as flexible as possible to identify as accurately
as possible the most critical surface:
),,( zyxf
( )xcBMzMzyxfunctionzyxf ,,,,,,,,,,:),,( 21 δδβα ( 1 )
The analytical expression of the failure surface developed in this work is given by the
following equation:
( ) ( ) ( )B
xyxzyxf
12
1,, ⎥⎦
⎤⎢⎣
⎡⎟⎠⎞
⎜⎝⎛−−= ωπ ( 2 )
( )xωB is a shape parameter defining the ellipticity of the failure surface in the y-z plane. is
the equation of the failure surface in the x-y plane (see figure1) and is defined as the
maximum value of y for a given x:
( )( )
( ) ( )( )xcx
xcx
xcx
xcx
xcMx−−−
−=
111
1.
βαω ( 3 )
5
figure1 shows how the four parameters M, xc, α and β control the size and the shape of the
failure surface in the x-y plane. M defines the ellipticity of the failure surface in the x-y plane.
xc defines the size of the failure surface in the x-y plane and along the main direction of
sliding. α and β are two parameters defining the curvature of the failure surface in the x-y
plane (α and β < 1).
( )xπ is the equation of the failure surface in the x-z plane (see figure2) and it corresponds to
the maximum value of z for a given x; it is defined as:
( )( ) ( ) ( ) ( )
( ) ( )⎥⎦⎤
⎢⎣⎡
⎟⎠⎞
⎜⎝⎛ −−−⎥⎦
⎤⎢⎣⎡ −−
−⎥⎦
⎤⎢⎣
⎡−−−+−+
+=
xcxax
xcxax
zaxcxaxxcxcMzxcMzzazax
11.1
22..
21
222
δδπ ( 4 )
Figure2 shows how the three shape parameters Mz, δ1 and δ2 control the shape of the failure
surface in the x-z plane. Mz defines the ellipticity of the failure surface in the x-z plane. δ1 and
δ2 are two parameters defining the curvature of the failure surface in the x-z plane (δ1 and δ2 <
1). xa and za are the coordinates of the upper corner of the failure surface in the x-z plane
(Figure2).
Figure3 shows an example with six 3D surfaces generated using 6 sets of parameters, thereby
illustrating how flexible the shape of the postulated failure surface might be. Figure3
illustrates a morphological change of the failure surface from spherical and elliptical shapes to
spread or elongated shapes. For the range of the shape parameters described previously (α, β,
δ1 and δ2 < 1), curves and surfaces defined in equations 1 through 4 are continuous and have
continuous derivatives generating exclusively arcuate failure surfaces. These arcuate
morphologies are appropriate for homogenous submarine soft sediment. For sediment with
6
discontinuities such as weak bedding layer, the failure surface can be considered as the
intersection of an arcuate surface and the discontinuity plane.
The 3D energy approach proposed in this work approximates the failure surface by
discretizing the sediment mass bounded by the postulated rupture surface into a number of
prisms with inclined side faces (Figure4).
Kinematically admissible velocity field
To determine the velocity field, the sediment is considered as a Mohr–Coulomb material with
an associative flow law. Therefore, the normal velocity Vn and tangential velocity Vs follow
the relationship below [e.g., Chen 1975]:
( )'tan ϕ−=s
n
VV ( 5 )
where ϕ’ is the internal friction angle. This implies that the plastic velocity is inclined at an
angle ϕ’ to the failure plane.
The most fundamental requirement for an application of the upper bound theorem is the
establishment of a kinematically admissible velocity field. The velocity field for each prism
element is derived if the external boundary conditions and the normal velocity-continuity
condition at the interfaces between adjacent elements are satisfied. Inside the failure mass, it
is supposed that along the vertical plane of symmetry (Figure4) no lateral movement relative
to the main direction of sliding occurs [Chen et al., 2001a]. The intersection between the
vertical plane of symmetry and the seafloor is called the Neutral Line (NL).
1,0 −jVFor the NL in Figure4, the plastic velocity vectors applied to the right and left prisms,
and jV ,0 respectively, and the relative vector velocity of the left prism with respect to the right
7

jVR ,0one, are all inclined at an angle ϕ’ to their respective failure surface (see Figure4). By
definition we have:
jjj VVVR ,01,0,0 −= − ( 6 )
jVR ,0jV ,0jV ,0 jVR ,0Thus the magnitude and of the two velocity vectors and can be
obtained from the following equations:
( )( )jr
jljj VV
θθθθ
−−
= − sinsin
1,0,0 ( 7 )
( )( )jr
lrjj VVR
θθθθ
−−= − sin
sin1,0,0 ( 8 )
jVR ,0 1,0 −jVjV ,0where θl, θj and θr are respectively the angle of the velocity vectors , and with
respect to the positive x-axis.
For prisms that do not belong to NL nor to the edge of the failure mass, the velocity vector
jiV , of prism i,j is calculated from the velocities of their left and lower neighboring columns
as described by Chen et al. [2001a]. The velocity of the first prism of a prism series, such as
the one numbered i,k in Figure4 is calculated from the known velocity vector kiV ,1− as
described by Chen et al. [2001a]:
kiki VV ,1, −=ξ ( 9 )
8
ξ is an optimizing parameter of the velocity field. According to Chen et al. [2001a],
considering ξ =1 leads to a solution which is acceptable. The determination of the velocity
field allows us to calculate the FOS and to establish the direction and rate of movement of the
failure surface as shown in Figure5.
Upper bound theorem
We consider the postulated failure surface as a limit state including material that is assumed
to be plastic everywhere. The sediment collapses along the failure surface, if the work
performed by the external loads, by any mechanism, exceeds the internal plastic dissipation.
Under these conditions the upper bound theorem states that, amongst all possible external
loads applied to a kinematically admissible plastic zone, minimizing the following work-
energy balance equation allows a determination of the external load that brings the sediment
to failure:
Rate of internal energy dissipation = Rate of external work
∫∫ +=+** Γ
****
Ω
*ij
*ij .VTW.VdDdv.εσ ( 10 )
where and are respectively the stress and plastic strain rate tensors, V* is a virtual
plastic velocity, is the rate of internal energy dissipation within the failure volume
Ω*, dv is the differential volume, dD* is the energy dissipation rate along a slip plane per unit
area, is the rate of internal energy dissipation along the slip surface Γ*, is the
external work rate generated by the body force W and is the external work rate
generated by the external load T*.
*ijσ *
ijε
∫*Ω
*ij
*ij dv.εσ
∫*Γ
*dD *W.V
**.VT
9
Because the 3D energy approach used in this study approximates the failure volume using a
series of prisms, equation 10 can be evaluated in the form of a summation [Chen et al.,
2001a]:
***jijiji .VTW.VDDD +=++ ∑∑∑ ↔ *,**
b ( 11 )
where the symbols b and are used to represent the interfaces between two adjacent
columns and between two adjacent rows of prisms, respectively [Chen et al., 2001a]. The
three terms in the left-hand side of the equation approximate the energy dissipation rate on the
row-to-row ( ) and column-to-column interfaces (
↔
∑ ↔* ∑ * jiDbiD j ) and on the slip surface
( ), respectively [Chen et al., 2001a]. ∑ *, jiD
Based on the associated flow law and the Mohr-Coulomb failure criterion, Chen [1975] and
Giam and Donald [1991] show that the virtual plastic velocity V* along a failure plane is
inclined at an angle ϕ’ (internal friction angle). They also show that dD* can be determined
without knowledge of the internal stresses in the following way:
** ')sin.'cos'.( VucdD ϕϕ −= ( 12 )
*'.cos'. Vc ϕwhere c’ is the cohesion, the term is the rate of internal energy dissipation
developed by the effective stress and *'.sin. Vu ϕ is the work rate done by the pore water
pressure u.
For undrained analyses, when the excess pore pressure generated by relatively rapid loading
cannot escape due to the low permeability of the sediment and the short time available, the
10
cohesion c’ and the internal friction angle ϕ’ in equation 12 can be replaced by the undrained
shear strength Su and zero, respectively.
By employing a Mohr-Coulomb failure criterion with associative flow law, our approach
involves an important assumption. Indeed, not many sedimentary materials display
associative flow behavior during loading [e.g., Cui et al., 1998]. However, sediments do
exhibit dilatancy during failure, and more or less offer a plastic deformation inclined at an
angleϕ’ to the failure plane at the limiting equilibrium state [Chen et al., 2001a]. According to
Chen et al. [2001a] “the adoption of an associative flow law for the upper bound method,
where loading only occurs during failure, can be justified as this considerably simplifies the
solution process without significant loss in accuracy”. On the other hand, Wang et al. [2001]
show that the difference in the FOS for associated and non-associated flow laws is within
10 %.
To compute the three terms in the left-hand side of equation 11, the sediment shear strength
parameters (c’ and ϕ’ for drained conditions and Su for undrained conditions) and the pore
water pressure u distribution applied on the slip plane must be known. We also need to
establish the virtual plastic velocity of prism i,j and its relative velocity with respect to its
immediate neighbors. The latter is calculated by satisfying the flow law and displacement
compatibility. A detailed description of the methodology for the determination of the virtual
plastic velocity field is presented in Donald and Chen [1997].
Numerical approach and illustrative examples
Once the velocity field is known for a given postulated failure surface, the energy dissipation
along the slip surface and interfaces can be determined according to equations 11 and 12.
With the proposed method, the traditional definition of FOS is conserved (For FOS values
greater than 1 means the slope is stable, while values lower that 1 means slope is instable) so
that the results from the proposed model can be directly compared with other methods. The
11
FOS is used as a strength reduction factor to reduce the shear strength parameters c’ or Su
(cohesion or undrained shear strength) and ϕ’ (internal friction angle) according to the
following equations, to bring the slope to a limiting state or failure:
FOSccFOS'= ( 13 )
⎟⎠⎞
⎜⎝⎛= −
FOSFOS'tan 1 ϕϕ ( 14 )
where cFOS and ϕFOS are the partial cohesion and partial internal friction angle.
An iterative procedure is necessary to determine the FOS, which is implicitly involved in
equations 5 through 14. In this work, the Newton-Raphson technique is used. For a given load
generated by an external mechanism, the 3D critical failure surface corresponding to the
minimum FOS, is identified by means of an optimization algorithm with respect to the
different shape parameters. Indeed, the evaluation of the stability of a slope becomes a
numerical problem of finding a set of variables (shape parameters and velocity optimizing
parameter ξ) that gives the minimum FOS. According to Reid et al. [2000] optimization
techniques are not generally able to determine all local FOS minima. They have shown that
for a given range of volumes (or areas) of interest, it is better to use a direct force search
method. In this work, the probabilistic optimization method proposed by Chen et al. [2001b]
is adopted and shows a rapid convergence to the minimum FOS (Appendix A).
Our 3D slope-stability method is implemented in the present work in a computer program
named SAMU-3D (slope-Stability Analysis Method using Upper bound theorem). Two
examples reported in the literature [Zhang, 1988; Hungr et al., 1989; Chen et al., 2001a] are
re-analyzed using SAMU-3D to investigate the validity of our approach. For the first example,
12
the failure surface is partially elliptic in a homogenous cohesive-frictional material. The unit
weight γ and the shear strength parameters (c’ and ϕ’) are presented in Figure5. The failure
mass is divided into 36 columns along the NL (x-direction) and into a maximum of 36
columns in the y-direction. The minimum FOS is found equal to 2.213 (Table 2). This can be
compared to the value of 2.122 obtained by Zhang [1988] using the limit-equilibrium method
(Bishop’s method) and 2.262 obtained by Chen et al. [2001a, Table 2] using the upper bound
theorem. The velocity field along the NL section is presented in Figure5.
The second example concerns a spherical failure surface in a purely cohesive soil
characterized by a unit weight γ of 9.8 kN/m3 and an undrained shear strength Su of 49.8 kPa.
The failure mass is divided into 24 columns along the NL (x-direction) and into a maximum
of 10 columns in the y-direction. The minimum FOS is found equal to 1.423. This can be
compared to the value of 1.422 obtained by Hungr et al. [1989] using the limit-equilibrium
method (Bishop’s method) and 1.422 obtained by Chen et al. [2001a] using the upper bound
theorem.
For the two considered examples, the limit equilibrium method has revealed lower FOS
showing that the limit equilibrium method underestimate the slope stability. On the other
hand, the upper bound method is numerically simple and stable and theoretically more
rigorous than limit-equilibrium methods that lead to significant errors as both kinematic and
static admissibility are violated [Yu et al., 1998]. Indeed, forces involved in equilibrium
methods are statically indeterminate and all equilibrium methods make assumptions to
balance the number of equilibrium equations and the number of unknowns in the problem
[Espinoza et al., 1992].
The tiny difference in terms of FOS observed between Chen et al. [2001a] results and the
present results comes probably from the use of different spatial discretization geometry (not
clearly defined in Chen et al. [2001a]) and the use of two different numerical schemes.
13
Bourcart Canyon
Geological setting and seafloor features
The Bourcart Canyon (also known as Aude Canyon) is located in the Western Gulf of Lions
in the Mediterranean Sea and is one of the many canyons incised in the Gulf of Lions
continental margin. The shelf edge, which is defined here as the line beyond which the slope
exceeds 1%, is situated 70 km off the coastline at 110 m water depth around the canyon head
that is incised on the outer shelf. The canyon width reaches 5-6 km in its middle section, with
wall relief up to 890 m and 820 m and wall slopes of 20 degree and 10 degree in the western
and eastern walls, respectively. The canyon floor displays a well-developed axial incision or
thalweg [Baztan, 2004]. The axial incision is on average 50 m deeper than the surrounding
canyon floor and has an average width of about 300 m. It initiates as a meandering channel
between 110 m and 450 m water depth, where the channel is incised 60 m deep (Figure6). Its
path straightens between 450 m and 1400 m depth. At 1400 m depth, 58 km from the canyon
head, the Bourcart Canyon opens into the Lacaze-Duthiers Canyon which is captured, at
about 1900 m water depth, by the Sète canyon, that collects all canyons from the western Gulf
of Lions [Berné et al., 1999]. Sediments have accumulated within and around this canyon
since the last glacial maximum (M. Gaudin, preprint, 2006). They are still accumulating today
at a much lower rate, and they exhibit evidence of past failure (M. Gaudin, preprint, 2006).
On both walls of the Bourcart canyon, semi-circular landslide scars are observed (Figure6).
Geotechnical characterization
Data from GMO2-CARNAC cruise: canyon head and surrounding areas
One of the main objectives of the GMO2-CARNAC cruise conducted in 2002 [Sultan and
Voisset, 2002] was to characterize the physical, mechanical and elastic properties of the upper
sediment layers within the Bourcart Canyon and adjacent slope. During the GMO2-CARNAC
14
cruise, in-situ measurements using the “Module Géotechnique” [Baltzer et al., 1994] were
carried out in 4 different areas (MGG8, MGG9, MGG10 and MGG11) within and around the
Bourcart Canyon (Figure6). Measurements within each area were performed at several
stations that are labeled with a suffix (e.g. MGG8-S1, MGG8-S2, etc).
The “Module Géotechnique” is equipped with an electric cone at the end of a rod that is
pushed into the sediment at a constant rate in order to conduct a CPTU (Cone Penetration Test
with additional measurement of the pore water pressure). The electric cone used during the
GMO2-CARNAC cruise gave a continuous measurement of the tip resistance (qc), sleeve
friction (fs) and excess pore pressure (Δu2) measured by means of a porous filter located
immediately behind the cone (called U2 type cone). The maximum penetration of the CPTU
is 2 m below the seafloor (mbsf). Figure7 (a, b and c) shows the variation of the tip resistance
qc with depth obtained in areas MGG8, MGG10 and MGG11. The tip resistances obtained
from area MGG9 are comparable to the tip resistance obtained from area MGG8. Excluding
the high tip resistance observed over the first few decimeters and which is probably an
apparent over-consolidation as the one described by Sultan et al. [2000], a minor linear
increase of qc with depth for the two first areas, MGG8 and MGG10, can be observed in
Figure7-a and Figure7-b. The small changes of the qc values versus depth shown in Figure7a
andb, suggest that the sediments over the first 2 meters in MGG8 and MGG10 are probably
not subject to any significant erosion. Oedometer tests carried out on sediment samples
recovered near the areas of MGG8 and MGG10 confirm the normally consolidated state of
the sediment.
The tip resistance values obtained for stations S2, S4 and S11 in MGG11 (see Figure6 for
location) are presented in Figure 7-c. The tip resistance qc at MGG11-S2 and MGG11-S4 is
more than 10 times higher than the tip resistance from the three other areas, MGG8, MGG9
and MGG10. Such high tip resistance could be related either to a lithology change (coarser
15
sediment) or to the consolidation state indicating a higher past maximum sediment thickness
that has been eroded at the location of those two stations. The variability of the tip resistance
from stations MGG11-S2 and MGG11-S4 indicates that the top first two peaks are probably
related to lithology changes. The variation in tip resistance with depth from station MGG11-
S11 is presented in Figure 7-c; where again the small changes of the qc values versus depth
(excluding the first few decimeters and the peak at around 1.5 mbsf) suggests a normally
consolidated sediment at this station.
For cohesive sediment, an estimate of the undrained shear strength Su can be obtained from
the following equation:
NkqSu net= ( 15 )
where qnet is the net cone resistance that depends on the tip resistance qc, the in-situ vertical
effective stress, and the effective cone section ratio. Nk (assumed to be 12 in this case) is an
empirical cone factor that depends on lithology [e.g., Lunne et al., 1997]. Therefore, the use
of a constant value of NK for the area MGG11 is probably not appropriate as the lithology is
most likely changing with depth and between stations.
On the other hand, the undrained shear strength Su for normally consolidated sediment can be
empirically related to the plasticity index PI of the sediment according to the Skempton [1954]
equation:
11.0.0037.0'
+= PISupσ
( 16 )
where is the preconsolidation pressure. p'σ
16
In equation 16, we use a mean PI equal to 15 as determined from sediment samples collected
in the study area.
From equations 15 and 16, it is possible to identify , the preconsolidation pressure or
maximum past effective stress that the sediment has been subject to. The Over-Consolidation
Difference OCD [Olsen et al., 1986] is therefore estimated according to the following
equation:
p'σ
( )∫−=−=z
pvp dzzOCD0
'''' γσσσ ( 17 )
where is the in-situ vertical effective stress calculated from the submerged unit weight γ’
of the sediment. Figure 7-d shows estimated values of OCD as a function of water depth for
MGG11-S2, MGG11-S4 and MGG11-S11. According to Figure7-d, sediments at MGG11-S2
were subject to a mean OCD of 75 kPa (for a mean value of γ’ = 7.5 kN/m3 with 10 m of
sediment), site MGG11-S4 to a mean OCD of 120 kPa (for a mean value of γ’ = 8 kN/m3 with
15 m of sediment) and MGG11-S11 to a mean OCD of 15 kPa (for a mean value of γ’ = 5
kN/m3 with 3 m of sediment). Results from Figure 7-d are representative of the other stations
in area MGG11 and confirm the former observations regarding submarine erosion in the study
area. It should be pointed out that the approach used to estimate the OCD relies on two
empirical methods and this might induce high uncertainties in the outcome of the quantitative
values. However, the OCD estimates provided in this study are in agreement with
morphological evidence that the seafloor was, and still is, subject to erosion in the areas were
positive OCD values occur. The most striking evidence is the cemented beachrock forming
circular and elongated pinnacles, up to 22m above the surrounding sea-floor [Berné et al.,
1998]. They are particularly abundant in the vicinity of the Bourcart Canyon head, but are
v'σ
17
observed all along the outer continental shelf in the Gulf of Lions. The main phase of erosion
in the area probably occurred between 21 and 15 cal ka BP, i.e., between the Last Glacial
Maximum and melt water pulse 1A (M.A. Bassetti, preprint, 2006). In addition, seismic
profiles in the area exhibit truncation of the uppermost seismic reflections down to a depth of
about 140 m, which probably corresponds to the lower limit of wave action during the last
low sea-level (G. Jouet, preprint, 2006).
Data from PROMESS1 cruise
In addition to the data provided by the “Module Géotechnique” for the upper two meters of
the sediment cover, geotechnical data from deeper levels were obtained from boreholes
performed during the PROMESS1 drilling cruise in 2004 [Berné et al., 2004] onboard SRV
BAVENIT operated by FUGRO. During that cruise geotechnical samples were collected and
in-situ tests were carried out at site PRGL1 (see Figure6 for location) on the interfluve
between Bourcart and Hérault canyons at 300 m water depth. One of the holes at this site
(PRGL1) was drilled to 150 mbsf, with continuous CPTU measurements (PRGL1-3). Another
hole was devoted to geotechnical sampling and discontinuous in-situ vane test measurements
between the sea-floor and 125 mbsf (PRGL1-5). The large amount of available geophysical
data (high quality seismic reflection profiles and acoustic data and sediment logs) from the
study site added to the in-situ (CPTU and vane shear) and laboratory geotechnical data
acquired during the PROMESS1 cruise proved to be essential in defining the 3D geotechnical
structure of the area. Figure8 shows selected in-situ and laboratory geotechnical results from
site PRGL1. The vertical effective stress obtained from the unit weight of the core samples
and the corrected tip resistance qt presented in Figure 8-a and b show a quasi linear increase
with depth.
Figure 8-c shows the variation of the undrained shear strength Su with depth as obtained from
the Fall cone, the Torvane, laboratory shear vane and in-situ shear vane. The divergence
18
between in-situ and on-board and laboratory measurements of Su at about 25 mbsf coincides
well with observed evidence of gas exsolution from around 22 mbsf down to the bottom of
the hole. The gas exsolution probably remolded the sediment and consequently decreased the
measured laboratory undrained shear strength relative to the in-situ measurements.
Accordingly, the reference undrained shear strength profile used in this paper is taken from
the in-situ measurements. Figure 8-d shows the variation in water content (ratio of the mass of
water in a sediment sample to the mass of that wet sample, multiplied by 100) with depth that
decreases from 44% at the seafloor to around 24 % at 125 mbsf. The plasticity index PI, is
presented in Figure 8-e, shows low values (PI< 10) except for a couple of measurements at
around 40 mbsf where the plasticity index is higher than 15. In Figure 8-f is presented as a
function of depth the Shansep factor αs which is the rate between in-situ undrained shear
strength and the preconsolidation pressure σ’p obtained from oedometer tests carried out at
different levels from PRGL1-5 (S. Lafuerza, in preparation). Figure 8-f shows that αs values
fluctuate between 0.195 and 0.245.
Intact values of c' (cohesion) and ϕ' (internal friction angle) are determined from consolidated
and undrained CU triaxial shearing tests [e.g., Germaine and Ladd, 1990] made at various
confining pressures (100–1000 kPa) on samples from PRGL1-5 (Figure9 and Table 3).
Figure9 shows triaxial test results in a shear stress q- mean effective stress p’ diagram.
Sediments from level SP15 and SP37 display an internal friction angle of 33 degree (Figure9).
The internal friction angle from the surrounding clayey sediment is 30 degree (Figure9).
Stratigraphic correlation between the study areas and borehole PRGL1
Two areas from the western wall of the Bourcart Canyon are selected (see Figure10) to assess
slope-stability. In these two areas, the slope angle at the toe of the slope is higher than
15 degree (Figure 10–b). A very high resolution Chirp seismic reflection profile crossing site
19
PRGL1 is used for correlation with some of the main stratigraphic discontinuities in the study
area recognized by Rabineau et al. [2005] and Baztan et al. [2005]. The Chirp signal provides
a vertical resolution of 0.3-0.5 m and a depth penetration of 100-150 m that is dependent on
the nature of the sediments. The Chirp resolution / penetration ratio is optimum for fine-
grained sediments like the ones constituting the bulk of the sedimentary sequence forming the
Aude-Herault interfluve (Figure6 - PRGL1 borehole).
A depth correlation between the seismic line at site PRGL1 and hole PRGL1 is achieved by
considering changes in acoustic impedance with depth. Based on a synthetic compressional
velocity profile, the depth below the seafloor of each reflector and discontinuity is determined
and associated to the sediment from site PRGL1.
Figure 11-a shows the 3D relief and geometry of five sedimentary layers in zone 1 picked
from seismic reflection profiles. At this stage, layers’ geometry is based on the acoustic
impedance discontinuities identified from seismic profiles without any sedimentological
significance. The slice CS1 across the bathymetry and the 5 different layers, presented in
Figure 11-b, shows the seafloor truncation of the upper three layers as discussed by Baztan et
al. [2005], which is interpreted as an indication of the high erosional activity of the canyon
during the Last Glacial Maximum. Figure12 shows a similar view for zone 2. In this area, the
upper three layers were also eroded by past events that shaped the Bourcart Canyon.
Slope destabilization triggering mechanisms
For both study areas shown in Figure10, the large amount of available geophysical data
allowed us to correlate seismic reflectors with in-situ (CPTU) and laboratory geotechnical
data acquired during the PROMESS1 cruise. Therefore, we could precisely define the 3D
geotechnical structure of the studied sites. This structure is needed to assess the role of
different external trigger mechanisms (i.e. earthquakes, sediment load, undercutting by axial
incision) that may lead to slope instabilities within the canyon.
20
Because the sediment shear strength depends not only on stratigraphy and lithology but also
on the previous loading history, correlation of sediment layers in zones 1 and 2 (Figure10)
with those in PRGL1 is not sufficient to determine and understand the present shear strength
profile nor to assess slope-instability. Therefore, a reconstruction of the history of sediment
layers in the two study zones is needed. The major role of erosion and/or slope instabilities in
the Bourcart Canyon were shown by Baztan et al. [2005] from seismic reflection profiles; this
allows the reconstruction of stratal geometry before canyon incision occurred.
By considering a mean submerged unit weight profile for normally consolidated sediment in
the study area and the reconstructed sedimentary layers of Figure 13-a, we can determine
OCD values as a function of water depth (Figure 13-a). OCD and PI values are needed to
calculate the preconsolidation pressure σ’p and, therefore, determine the undrained shear
strength of the sediment (equation 16) for the two zones in Figure10. The stratal correlation
from these two zones and the sediment geotechnical properties of site PRGL1, allowed us to
define the geotechnical properties of the five sediment layers defined from the acoustic
impedance discontinuities in both study zones under drained and undrained conditions (Table
4). This further enabled us to assess the 3D slope-stability of both zones. Although a clear
interface is identified between layer 4 and layer 5 from the seismic profiles, the geotechnical
properties corresponding to those two layers (4 and 5) are similar except for the mean grain
size (Table 4). Sediment from the 5 layers is mainly silty clay with a mean pore size between
5 and 11 µm (Table 4).
When sediment is sheared under an applied stress, excess pore pressure is generated that may
(drained conditions) or may not (undrained conditions) dissipate depending on the
permeability of the sediment and the time available. However, under gradual slow loading
(equivalent to stress controlled triaxial test), failure may occur under undrained conditions
[Imposimato and Nova, 1998]. Indeed, the maximum deformation (or the maximum pore
21
pressure variation) occurs in the shear post-peak phase, without any additional loading or
applied stress.
For this reason, even for a gradual loading scenario, stability analyses include both total stress
(undrained conditions) and effective stress (drained conditions) analyses, with the aim to
determine under which conditions (drained or undrained) the sediment is less stable.
Gravity loading
To understand the origin of the slides observed on the internal walls of the Bourcart Canyon
and to get a reference analysis, the FOS against sliding of several slopes subject to their own
weight is considered for the two study zones. The 3D geotechnical structure of zones 1 and 2,
which responds to the 3D geometry of the strata and their geotechnical properties (Figure11,
Figure12 and Table 4), is used in the calculation. The analysis is carried out under gravity
loading considering only the weight of sediment as the driving force. It must be pointed out
that the morphology of the seabed develops slowly and over a long-time period, and it is
probably more appropriate to conduct the analysis under drained conditions. However, failure
in undrained conditions may also occur, even if only very gradual loading of the slope occurs,
thereby mobilizing the undrained shear strength. For this reason, the two types of analysis are
compared (drained and undrained) to determine the analysis giving the lowest FOS.
The optimization procedure steps (appendix A), are performed to obtain the minimum FOS
and the most critical failure surface: 5000 step calculations were necessary to obtain the most
critical failure surface in each study zone for each condition (drained and undrained). Under
drained conditions, the minimum FOS was greater than 4 for the whole area. The output in
Figure14 shows the projection of three potential failure surfaces (Z1-a, Z2-a and Z2-b) on the
bathymetry of the study area. The results in undrained conditions confirm the metastable state
of the west inner wall of the Bourcart Canyon, where the potential failure surface Z1-a has a
FOS of 1.32, the Z2-a surface a FOS of 1.41 and the Z2-b surface a FOS of 1.36 (Table 5).
22
The 3D geometry of the three critical sediment volumes is presented in Figure15. The shape
parameters of the three critical failure surface are given in Table 6. Figure 15-a shows the
shape of the failure surface Z1-a in the x-y plane with two cross sections, along NL and an
arbitrary line called AL. The maximum depth below the seafloor of surface Z1-a along NL is
about 100 m. Figure 15-b shows the same construction for failure surface Z2-a, which shows
a maximum depth below seafloor of about 120 m. This failure surface is connected to a
former failure zone on the western wall, which can be clearly observed in Figure14. The
maximum depth below the seafloor of surface Z2-b is about 60 m and toes out in the Bourcart
Canyon axis (Figure 15-c).
The deformed meshes of Figure 15-a-b and -c are derived from the three velocity fields. The
amplitude of each velocity vector is relative to the supposed virtual plastic velocity applied at
the first wedge of the NL.
External mechanisms
We tested different scenarios to evaluate the effect of external mechanisms on triggering
sediment instability in canyon walls. These can also be used to compare the present failure
geometries inferred from bathymetric and seismic analysis to the predicted ones. The
following three most probable failure scenarios are considered:
1- Instabilities under seismic loading (earthquake);
2- Instabilities generated by sediment overloading (sedimentation);
3- Instabilities generated by axial incision.
An important mechanism of canyon formation and distribution involving hydrologic forcing
and seepage proposed by Orange et al. [1994] was not assessed in this work. They showed
that hydraulic gradients are significantly influenced by the presence of incision focusing fluid
flow toward the canyon tip and that the increase of head gradient at the canyon head may
attain the critical value for slope failures. This flow focusing might be more important during
23
lowstands. The lack of in-situ measurements and monitoring of the head gradient prevents us
from evaluating the effect of the hydrologic seepage on slope instabilities in the Bourcart
Canyon.
Seismic loading
Figure 16-a shows the historical seismicity of the Gulf of Lions during the last 100 years from
the database of United States Geological Survey (USGS, http://neic.usgs.gov/neis/epic/).
Figure 16-a shows that only a few earthquakes have occurred between 1904 and 2004 on the
continental slope of the Gulf of Lions. The epicenter of an earthquake with a maximum
magnitude of 6.2 in 1909 was about 170 km away from the study area (Figure16-b). In any
case, 100 years is a too short period in geologic terms to be considered as fully representative
of a given area and that the few data available in the area do not allow us to extrapolate what
the maximum PHA (Peak Horizontal Acceleration also called PGA for Peak Ground
Acceleration) might have been over longer periods of time. Therefore, our approach consists
in determining the minimum PHA (or minimum magnitude) needed to generate slope
instabilities on the canyon walls and to compare it to the maximum PHA observed during the
last 100 years.
Earthquakes generate horizontal and vertical accelerations that induce shear and normal
stresses in the sediment column. Shear stresses have the potential of driving the sediment to
failure and respond most strongly to horizontal accelerations [Lee and Edwards, 1986]. In
addition, earthquakes cause a build up of pore pressure and a consequent decrease in shear
resistance, that may drive the slope to failure. A simplified approach proposed by Lee and
Edwards [1986] is to assume that a given earthquake at a given distance from the epicenter
can be represented by a characteristic horizontal acceleration kx (expressed in g’s, where g is
the gravitational acceleration). This method is called the “pseudo-static” approach. Although
real seismic loadings are dynamic, cyclic, and non-stationary, a constant static loading is
24
applied in this simplified approach for ease of computation. The pseudo-static approach has
certain limitations [Cotecchia, 1987; Kramer, 1996; Biscontin and Pestana, 2006], but this
methodology is considered to be generally conservative, and is the one most often used in
current practice.
The external load T* of equation 10 generated by the earthquake in the pseudo-static approach
is represented by a force acting horizontally at the center of gravity, which is calculated as the
product of the characteristic horizontal acceleration and the weight of the potential sliding
mass W:
WgkT x=* ( 18 )
This approach requires estimates of the PHA (Peak Horizontal Acceleration) and earthquake
magnitude for the selection of an appropriate horizontal acceleration kx. A suitable value of kx
should consider implicitly the possible acceleration amplification [Lee and Edwards, 1986].
Many peak acceleration attenuation relationships have been developed to derive the maximum
PHA from the earthquake magnitude and distance to epicenter. In this work, the Idriss [1993]
relationship is used to determine the PHA presented in Figure 16-c. According to Figure 16-c,
the maximum PHA generated by earthquakes during the last 100 years at the head of the
Bourcart Canyon did not exceed 0.02g (2% g). Several calculations are carried out for
different horizontal accelerations (kx) using the pseudo-static approach. Slope instabilities
(FOS≤1) are observed for kx higher than 0.07g. Classically, the horizontal acceleration used in
the pseudo-static approach is taken equal to half the PHA characterizing an earthquake at a
certain location, which corresponds to Magnitude 7 at 30 km from the Bourcart canyon.
25
Table 7 shows the FOS values obtained for the 3D predicted failure surfaces presented in
Figure17-a. For the three surfaces of Figure 17-a, the FOS is around 1. Figure 17-b shows the
resulting bathymetry after removing the sediment mass above failure surface Z1-a.
Figure 18-a shows the shape of predicted failure surface Z1-a in the x-y plane with cross
sections NL and AL. The maximum depth below seafloor of surface Z1-a along the NL is
about 90 m whereas it is about 160 m for surface Z2-a and about 55 m for surface Z2-b
(Figure18).
Sediment overloading
Modern accumulation rates around the canyon head have been estimated using excess 210Pb.
The accumulation rates show that sediment, including sand, is still occasionally deposited,
probably during periods of cascading of cold dense water formed on the shelf (M. Gaudin,
preprint, 2006). However, at present this is mostly a “bypassing zone” rather than a
“deposition zone”, with the net sediment accumulation over the entire Holocene period
(10,000 years) being less than 1 m on average (sedimentation rate of 0.1 m/kyr). On the other
hand, the canyon head, as well as the interfluves that were under the influence of sediment
plumes generated at the outlet of large rivers (mostly the Rhône), experienced sedimentation
rates in excess of 1 m/kyr during the last glacial period, when discharge occurred near the
shelf break [Berné et al., 2004]. Besides “regular” sedimentation fed by plumes, catastrophic
events may generate deposition of sediment at a higher (several orders of magnitude) rate.
The morphology of the modern Rhône prodelta was swath-mapped prior to and after the
centennial December 2003 flood [Berné et al., 2004]. The comparative map of the survey area
shows that up to 3 m of sediment, sourced from a slump scar cutting across the delta front,
was deposited seaward, forming an elongated sediment body (1 x 0.5 km) across the prodelta.
It is very likely that, during glacial periods when the sediment fluxes of Mediterranean rivers
were much larger, similar sediment bodies accumulated on the shelf edge during each flood.
26
For a complete analysis, we assess the potential role of rapidly deposited sediment bodies in
triggering failures in canyon heads and upper canyon reaches during glacial periods. This is
evaluated for zone 2 in Figure10 (the nearest to the shoreline), under a deposit of up to two
meters in the overloading area, as shown in Figure19. The 2 m deposit leads to an increase of
the driving force but also to an increase in the pore pressure proportional to the deposition
rate. In this study case, sedimentation is considered low enough to not generate significant
excess pore pressure. Drained and undrained conditions are considered, but focus is on the
analysis type resulting in the lowest FOS. As in the case for gravity loading, the FOS is most
critical under undrained conditions. Under drained conditions, the minimum FOS is greater
than 3 for the entire area of zone 2. Figure19 shows the resulting bathymetry after removal of
the sediment mass bounded by the failure surface (undrained conditions). Calculations show
that failure occurs (FOS=1.033) when the load of the 2 m sediment layer is applied by
increasing the external work rate generated by the body force W. Figure20 shows this failure
surface in the x-y plane with two cross sections NL and AL. In contrast with the two former
analyses (Figure 15-b and Figure 18-b), the maximum depth below the seafloor along the NL
is around 55 m.
Axial incision
A detailed morphological analysis of the outer shelf and continental slope of the Western Gulf
of Lions carried out by Baztan et al. [2005] has shown that an axial incision is present in most
submarine canyons in the area. Erosion related to the formation of axial incision could have a
key influence on canyon evolution, because it might trigger mass wasting that affects the head
and the walls of the canyons at different scales. The present axial incision observed in the
Bourcart Canyon is a prominent erosive feature interpreted as the product of hyperpycnal
currents that formed during the Last Glacial Maximum when the canyon head was directly
27
connected to the river. It is presently unknown whether this feature is presently relict, or
episodically rejuvenated during periods of dense water cascading.
The axial incision favors down-canyon sediment transport mostly during sea level low-stands
when the canyon head is connected to river mouths [Baztan et al., 2005]. Similar axial
incisions have been observed within buried canyons as seismo-stratigraphic discontinuities
attributed to previous sea level low-stands during the Quaternary. As a result, the widening
and deepening of the Bourcart Canyon main valley (as well as some other canyons in the Gulf
of Lions) could result from recurrent axial incision during glacial epochs [Baztan et al.,
2005].
We evaluated the influence of axial incision on the stability of the western inner wall of the
Bourcart Canyon to test the hypothesis of Baztan et al. [2005]. An instant erosion of 1 m in
the Bourcart Canyon axis is numerically simulated to evaluate the significance of the Last
Glacial Maximum axial incision on later canyon wall shaping. Figure 21-a shows (in blue) the
area where the canyon is eroded. The 1 m erosion is not enough to generate slope instabilities
on the canyon walls. In this case, the FOS dropped to 1.15 under undrained conditions. We
than numerically simulated the effects of instant erosion of about 5 m in the Bourcart Canyon
axis. The FOS of the failure surface presented in Figure 21-a under undrained conditions is
equal to 0.91, showing that an incision of about 5 meters may trigger slope instabilities and
modify the canyon walls. For drained conditions and 5 m erosion, the FOS is about 2.2 for the
entire zone.
Figure 21-b shows the bathymetry resulting from the removal of the sediment above the
failure surface. The failure surface shows a very good agreement between the predicted
failure geometry and the geometries of other failures inferred from multibeam bathymetric
data of the canyon wall.
28

Figure22 shows this failure surface in the x-y plane with two cross sections NL and AL. The
maximum depth below the seafloor along the NL is around 100 m. The shape parameters of
the critical failure surface are given in Table 6.
Modeling results and discussion
In this work we have developed a 3D slope-stability model (SAMU-3D) based on earlier
studies by Chen et al. [2001a, 2001b]. The shape of the potential failure surface was defined
as flexible as possible to reproduce slope failure geometries inferred from present seafloor
morphology and to facilitate the study of the post-failure travel of the slide mass that strongly
depends on the initial slide volume. In SAMU-3D, the use of the pseudo-static method to
assess earthquake effects on slope instabilities could be substituted by injecting the excess
pore pressure and horizontal acceleration profiles (G. Dan, in preparation) derived from
computer programs for non-linear site response analysis (e.g. Cyclic1D [Elgamal et al.; 2002]
and Ample2000 [Pestana and Nadim; 2000]).
The causes of sediment failures and slope instabilities in the Bourcart Canyon are difficult to
assess given that the large volume of sediment is in a metastable state. Indeed without an
external destabilizing mechanism, a mean FOS of around 1.35 characterizes the present walls
of the canyon (Table 5). However, the modeling exercise helps understanding the
morphologies observed in the Bourcart Canyon walls and also shows how prediction
capabilities on slope failure can be derived from the integrated analysis of comprehensive data
sets. Our analyses illustrate the relative importance of different triggering mechanisms in
destabilizing sediments in Bourcart Canyon.
The maximum horizontal acceleration (0.02 g) derived from the historical seismicity map of
the Gulf of Lions during the last 100 years (USGS data, http://neic.usgs.gov/neis/epic/) is not
enough to destabilize the sediments within the canyon. Indeed, a horizontal acceleration of at
least 0.07g is necessary to generate slope instabilities in the study area. However, an
29
earthquake with higher magnitude (at least Magnitude 6.2 at 30 km from the Bourcart
canyon) could be considered as a trigger for instabilities that occur within the walls of the
Bourcart Canyon.
Loading of the canyon walls with 2 m of sediment in zone 2 is sufficient to trigger slope
instability. The 3 m thick sedimentary deposit observed after the major flood that occurred in
December 2003 suggests that, during glacial maxima, this sediment loading be an important
external mechanism generating slope failures within canyon walls. However, it is likely that
the manner, in which the sediment deposition is simulated, as a localized sedimentation,
exaggerated the effect of this mechanism as an external trigger of slope-instability. Indeed
homogeneous sedimentation over the study area may destabilize the uppermost recent
sediment cover but not affect the older consolidated sedimentary layers lying below.
Our analyses show that substantial axial incision, proposed by Baztan et al. [2005] as the
main element controlling canyon formation, can effectively destabilize the modern inner
canyon walls. An axial incision of 5 m on the canyon floor has a strong effect on the FOS,
reducing it to 0.91. Good agreement between present canyon morphology and the shape of the
predicted failure surfaces generated by axial incision indicates that axial incision can be one
of the main external mechanisms leading to sediment destabilization of inner canyon walls.
From the three case studies with the three external mechanisms considered in this work it is
difficult to define an obvious link between the volume of the failure surfaces and the shape
parameters presented in Table 6 on one hand and the triggering mechanisms on the other
hand. However, it is clear that seismicity generates deep and large slope failures (Figure18)
while the axial incision seems to generate small volume failure surfaces directly connected to
the Bourcart Canyon axis (Figure21 and Figure22). The position and the volume of the
critical failure surfaces generated by the axial incision may initiate retrogressive failures.
30
Slope failures generated by sediment overloading seems to be more elongated (see Figure20)
and mobilizing only the upper sediment deposit (see Figure19 and Figure20).
Comparison between the predicted failure surfaces (under different external mechanisms) and
the surrounding geometries as imaged from multibeam bathymetric data illustrates that mass
failures could account for the observed morphology along the canyon walls as well as a
mechanism of canyon widening.
Conclusion
In this paper, we developed a 3D slope-stability analysis method based on the upper bound
theorem of plasticity [Chen et al., 2001a]. An illustrative case, the Bourcat Canyon, in the
Western Gulf of Lions, demonstrated the applicability of the proposed method to assess 3D
slope failures in canyon heads. We performed a detailed stratigraphic study of this canyon
using sediment cores, swath bathymetry data, sub-bottom profiles and high-resolution seismic
reflection profiles. In addition, geotechnical data acquired during the GMO2-CARNAC
[Sultan and Voisset, 2002] and the PROMESS1 [Berné et al., 2004] cruises were of great
importance in defining the geotechnical design parameters used in this work. The primary aim
of the 3D slope-stability analysis carried out was to test the effect of a number of external
mechanisms on the stability of the inner walls of the Bourcart Canyon. Our analyses
illustrated the relative importance of different triggering mechanisms in destabilizing
sediments in Bourcart Canyon. The primary conclusions drawn from the slope-stability
analyses are:
- For low seismicity equivalent to the one recorded during the last 100 years,
earthquakes seem to be an unlikely trigger for Bourcart Canyon wall instabilities.
However, earthquake with higher magnitude (at least 6.2) could destabilize sediments
from the internal flank of the Bourcart Canyon.
31
- Sediment deposition could be an external mechanism for slope failure within the
canyon walls. Considering the low sedimentation rate that presently characterizes the
study area, such a mechanism might only be active at times when the canyon is under
the direct influence of fluvial sediment input, i.e. during glacial maxima. The selected
position for the simulated depocenter probably accentuated the simulated effect of
sediment loading as a slope failure triggering mechanism. Homogeneous
sedimentation (such as that generated by river plume particle settling) would likely
destabilize the upper soft sediment deposit but probably not the underlying older
consolidated sedimentary layers.
- Axial incision of the canyon floor has a potentially strong effect on the stability of the
canyon walls, as proposed by Baztan et al. [2005]. It also provides a plausible
explanation for the noticeable width of canyons (about 5 km) that cannot be explained
by the repeated action of turbidite (or hyperpycnal) flows. The striking similarities
between present canyon morphology and the shape of the predicted failure surface as
generated by axial incision suggests that this process is one of the main external
mechanisms destabilizing sediments from the inner canyon walls.
- Shape and volume of the failure surfaces seems to be related to the trigger
mechanisms: seismicity generates deep and large slope failures, sediment overloading
generates elongated slope failure surfaces and the axial incision produces small
volume failure surfaces directly connected to the canyon axis.
Acknowledgement. This work has been developed within the European Commission (EC)
projects EUROSTRATAFORM (contract EVK3-CT-2002-00079), PROMESS1 (contract
EVR1-CT- 2002-40024), EURODOM (contract RTN2-2001-00281) and the Spanish project
SPACOMA (ref. REN2002-11217-E/MAR). R. U. acknowledges a “Ramón y Cajal” contract
and S.L. a FPI grant both from the Spanish Ministry of Education and Research. Funding by
32

Generalitat de Catalunya to GRC Geociències Marines is equally acknowledged. The support
by officers and crew during GMO2-CARNAC and PROMESS1 cruises is greatly appreciated,
as is the dedication of the FUGRO technical staff during the PROMESS1 cruise. The authors
acknowledge Bruno Savoye and Juan Baztan for their useful suggestions and remarks.
Constructive comments by three anonymous reviewers, and the Associate Editor helped
improve the manuscript significantly.
33
Reference List
Baltzer, A., P. Cochonat, and D.J.W. Piper (1994), In situ geotechnical characterisation of sediments on the Scotian Slope, eastern Canadian continental margin, Marine Geology, 120, 291–308. Baztan, J. (2004), Formation et évolution des canyons sous-marins du golfe du Lion: relation avec les cycles glacio-eustatiques, PhD thesis, 319 pp., Université de Bretagne Occidentale, Brest. Baztan, J., S. Berné, J.-L. Olivet, M. Rabineau, D. Aslanian, M. Gaudin, J.-P. Réhault, and M. Canals (2005), Axial Incision: the key to Understand Submarine Canyon Evolution, (In Submarine Canyons of The Western Gulf of Lions), Marine and Petroleum Geology, 22, 805-826. Berné, S., G. Lericolais, T. Marsset, J.-F. Bourillet, and M. De Batist (1998), Erosional offshore sand ridges and lowstand shorefaces: examples from tide- and wave-dominated environments of France, Journal of Sedimentary Research, 68, 540-555. Berné, S., B. Loubrieu, and the Calmar shipboard party (1999), Canyons and recent sedimentary processes on the western Gulf of Lions margin. First results of the Calmar cruise, Comptes Rendus de l'Académie des Sciences de Paris, 328, 471-477. Berné, S., M. Rabineau, J.A. Flores Villarejo, and F.J. Sierro (2004), The impact of Quaternary Global Changes on Strata Formation, Oceanography, 17(4), 92-103. Biscontin, G., and J.M. Pestana (2006), Factors affecting seismic response of submarine slopes, Natural Hazards and Earth System Sciences, 6, 97-107. Bucher, W.H. (1940), Submarine valleys and related geologic problems in the North Atlantic, Geol. Soc. America. Bull., 51, 489-512. Chen, W.F. (1975), Limit Analysis and Soil Plasticity, Elsevier Scientific Publishing Co., New York. Chen, Z., X. Wang, C. Haberfield, J. Yin, and Y. Wang (2001a), A three-dimensional slope stability analysis method using the upper bound theorem, Part I: Theory and methods, International Journal of Rock Mechanics and Mining Sciences, 38, 369-378. Chen, Z., J. Wang, J. Yin, Y. Wang, and C. Haberfield (2001b), A three-dimensional slope stability analysis method using the upper bound theorem, Part II: Numerical approaches, applications and extensions, International Journal of Rock Mechanics and Mining Sciences, 38, 379–397. Cotecchia, V. (1987), Earthquake-prone environments, in Slope Stability, Geotechnical Engineering and Geomorphology, edited by M.G. Anderson, pp. 287-330, John Wiley & Sons, New York. Cui, Y.J., N. Sultan, and P. Delage (1998), Plastic flow of an unsaturated compacted silt, in Proc. 2nd International Conference on Unsaturated Soils 98, pp. 467-472, International Academic Publishing House, China. Daly, R.A. (1936), Origin of the submarine canyons, American Journal of Science, 31, 401–420. Donald, I. B., and Z.Y. Chen (1997), Slope stability analysis by the upper bound approach: fundamentals and methods, Canadian Geotechnical Journal, 34, 853-862. Duncan, J. M. (1996), State of the art: limit equilibrium and finite-element analyses of slopes, Journal of Geotechnical Engineering Division, 122(7), 577-596. Elgamal, A., Z. Yang, and E. Parra, (2002), Computational modeling of cyclic mobility and post liquefaction site response, Soil Dynamics and Earthquake Engineering, 22, 259–271.
34
Espinoza, R. D., P. C. Repetto, and B. Muhunthan (1992), General framework for stability analysis of slopes, Géotechnique, 42(4), 603-615. Farre, J.A., B.A Mcgregor, W.B.F. Ryan, J.M. Robb, D.J. Stanley, and G.T. Moore (1983), Breaching the shelfbreak; passage from youthful to mature phase in submarine canyon evolution, in The Shelfbreak; Critical Interface on Continental Margins, Special Publication, Society of Economic Paleontologists and Mineralogists, 33, 25–39. Germaine, J.T., and C.C. Ladd (1990), Triaxial testing of saturated cohesive soils, ASTM Symposium on Advanced Triaxial Testing of Soil, 977, 421-459. Giam, P., and I. Donald (1991), Upper bound solutions to soil stability problems via general wedge methods, in Proceedings of the 7th International Conference on Computer Methods and Advances in Geomechanics, pp. 475–480, Cairns, Australia. Hungr, O., F. M. Salgado, and P. M. Byrne (1989), Evaluation of a three-dimensional method of slope stability analysis, Can. Geotech. J., 26(4), 679-686. Idriss, I. M. (1993), Procedures for selecting earthquake ground motions at rock sites, Tech. rept. NIST GCR 93-625, National Institute of Standards and Technology, U.S. Dept. of Commerce, Washington. Imposimato, S., and R. Nova (1998), An investigation on the uniqueness of the incremental response of elastoplastic models for virgin sand, Mech. Cohes. Frict. Mater., 3, 65-87. Johnson, D.W. (1939), The Origin of Submarine Canyons, 126 pp., Columbia University Press, New-York. Knebel, H., S.A. Wood, and E. Spiker (1979), Hudson River: evidence for extensive migration on the exposed continental shelf during the Pleistocene, Geology, 7, 254-258. Kramer, S.L. (1996), Geotechnical Earthquake Engineering, 653 pp., Prentice Hall, New Jersey. Kuenen, P.H. (1937), Experiments in connection with Daly’s hypothesis on the formation of submarine canyons, Leische Geologishe Medelingen, VIII, 316-351. Kuenen, P.H. (1955), Experiments in connection with turbidity currents and clay suspensions, in Submarine Geology and Geophysics, edited by W.B.F Whittard. and R. Bradshaw, pp. 47-74, Butterworths, London. Kvalstad,T.J., L. Andresen, C.F. Forsberg, K. Berg, P. Bryn, and M. Wangen (2005), The Storegga slide: evaluation of triggering sources and slide mechanics, Marine and Petroleum Geology, 22, 245-256. Lee, H.J., and B.D. Edwards (1986), Regional method to assess offshore slope stability, Journal of Geotechnical Engineering, 112, 489-509. Lee, H.J., and J. Baraza (1999), Geotechnical characteristics and slope stability in the Gulf of Cadiz, Mar. Geol., 155, 173-190. Leynaud, D., J. Mienert, and F. Nadim (2004), Slope stability assessment of the Helland Hansen area offshore the mid-Norwegian margin, Marine Geology, 213, 457-480. Lunne T., P.K. Robertson, and J.J.M. Powell (1997), Cone Penetration Testing in Geotechnical Practice, 312 pp., Blackie Academic & Professional, London. McAdoo, B., D.L. Orange, E. Screaton, H. Lee, and R. Kayen (1997), Slope basins, headless canyons, and submarine paleoseismology of the Cascadia accretionary complex, Basin Res., 9, 313–324.
35
Mulder, T., B. Savoye, J.P.M. Syvitski, and D.J.W. Piper (1998), The Var Submarine System: understanding Holocene sediment delivery processes and their importance to the geological record, in Geological Processes on Continental Margins: Sedimentation, Mass Wasting and Stability, edited by M.S. Stoker, D. Evans and A. Cramp, pp. 146-166, Spec. Publ. Geol. Soc. London, London. Mulder, T., J.P.M. Syvitski, S. Migeon, J.-C. Faugères, and B. Savoye (2003), Marine hyperpycnal flows: initiation, behavior, and related deposits: a review, Marine and Petroleum Geology, 20, 861-882. Mulder, T., O. Weber, P. Anschutz, F.J. Jorissen, and J.-M. Jouanneau (2001), A few months-old storm-generated turbidite deposited in the Capbreton Canyon (Bay of Biscay, S-W France), Geo-Marine Letters, 21(3), 149–156. Olsen H.W., T.L. Rice, P.W. Mayne, and R.D Ingh (1986), Piston core properties and disturbance effects, J. Geotech. Eng. ASCE, 112, 608–625. Orange, D.L., R.S. Anderson, and N. Breen (1994), Regular submarine canyon spacing in the submarine environment: the link between hydrology and geomorphology, GSA Today, 4, 36-39. Orange, D.L., and N.A. Beern (1992), The effects of fluid escape on accretionary wedges 2: Seepage force, slope failure, headless submarine canyons, and vents, Journal of Geophysical Research, 97(B6), 9277– 9295. Orange, D.L., B. McAdoo, C.J. Moore, H. Tobin, E. Screaton, H. Chezar, H. Lee, M. Reid, and R. Vail (1997), Headless submarine canyons and fluid flow on the toe of the Cascadia accretionary complex, Basin Res., 9, 303–312. Pestana, J. M., and F. Nadim (2000), Nonlinear site response analysis of submerged slopes, Tech. Rep. UCB/GT/2000-04, Department of Civil and Environmental Engineering, University of California, Berkeley. Pratson, L.F., W.B.F. Ryan, G.S. Mountain, and D.C. Twitchell (1994), Submarine canyon initiation by downslope-eroding sediment flows: evidence in late Cenozoic strata on the New Jersey continental slope, Geological Society of American Bulletin, 108, 395–412. Rabineau, M., S. Berné, D. Aslanian, J.-L. Olivet, P. Joseph, and F. Guillocheau (2005), Sedimentary sequences in the Gulf of Lions: a record of 100,000 years climatic cycles, Marine and Petroleum Geology, 22, 775-804. Reid, M.E., S.B. Christian, and D.L. Brien (2000), Gravitational stability of three-dimensional stratovolcano edifices, Jour. of Geophysical Res., B, Solid Earth and Planets, 105(3), 6042-6056. Shepard, F.P. (1936), The underlying causes of submarine canyons, National Academic Sciences of National Research Council Publication, 22, 496–502. Skempton, A.W. (1954), Discussion of the structure of inorganic soils, J. Soil Mech. Found Div., 80, 263–264. Spencer, J.W. (1903), Submarine valleys off the American coasts and in the North Atlantic, Geol. Soc. America. Bull., 14, 207-226. Stetson, H. C. (1936), Geology and Paleontology of the Georges Bank canyons, Geol. Soc. America. Bull., 47, 339-366. Sultan, N., P. Cochonat, F. Cayocca, J.-F. Bourillet, and J.-L. Colliat (2004), Analysis of submarine slumping in the Gabon continental slope, In High-Resolution Geophysical Studies of Continental Margins Geohazards, Special issue of AAPG Bulletin, 88(6), 781-799.
36
Sultan, N, P. Cochonat, B. Dennielou, JF Bourillet, B Savoye, and JL Colliat (2000), Apparent overconsolidation and osmotic pressure in a marine sediment, Comptes Rendus de l’Académie des Sciences, 331(5), 379 – 386. Sultan, N., and M. Voisset (2002), GMO2-CARNAC cruise report, Ifremer, Brest. Torres J., B. Savoye, and P. Cochonat (1995), The effects of Late Quaternary sea-level changes on the Rhône slope sedimentation (northwestern Mediterranean), as indicated by seismic stratigraphy, J. Sedim. Res., B65, 368-387. Twichell, D.C., and D.G. Roberts (1982), Morphology, distribution, and development of submarine canyons on the United States Atlantic continental slope between Hudson and Baltimore canyons, Geology, 10, 408–412. Urgeles, R., D. Leynaud, G. Lastras, M. Canals, and J. Mienert (2006), Back-analysis and failure mechanisms of a large submarine slide on the Ebro slope, NW Mediterranean, Marine Geology, 226, 185-206. Wang, Y.J., J.H. Yin, and C.F. Lee (2001), The influence of a non-associated flow rule on the calculation of the factor of safety of soil slopes, International Journal for Numerical and Analytical Methods in Geomechanics, 25(13), 1351–1359. Yu, H.S., R. Salgado, S.W. Sloan, and J.M. Kim (1998), Limit analysis versus limit equilibrium for slope stability, J. Geotech. and Geoenvir. Engrg., 124(1), 1-11. Zhang, X. (1988), Three-dimensional stability analysis of concave slopes in plan view, Journal of Geotechnical Engineering, ASCE, 114, 658–671.
37
Appendix A : Methodology used to search for the critical failure surface
The critical failure surface is defined by two different optimization procedures: the first
optimization consists in finding the most critical NL while the second optimization method
resides in finding, for a given NL, the shape of the potential failure surface. FigureA-1 and
FigureA-2 illustrate the procedure used to find the critical failure surface Z1-a presented in
Figure14. As a first step, two areas of search containing 40 nodes each are defined: the first
one for the upper corner of the NL and the second one for the lower corner of the NL
(FigureA-1).
Around 300 sets of shape parameters for each of the possible 1600 NL are tested
(480,000 calculations). Once the critical NL is identified, the second probabilistic
optimization procedure described by Chen et al. [2001b] is carried out in order to identify the
shape and the size of the critical failure surface. FigureA-2 shows the range change of the
FOS and the minimum FOS (dashed line) as a function of the number of calculation. After
each 500 step calculations, the failure surface shape parameters ranges are updated to center
around the minimum FOS. For the considered calculation, the minimum FOS is identified
after around 2000 step calculations (FigureA-2). For the calculation results presented in Table
6, between 2000 and 3000 step calculations are needed to detect the minimum FOS.
38
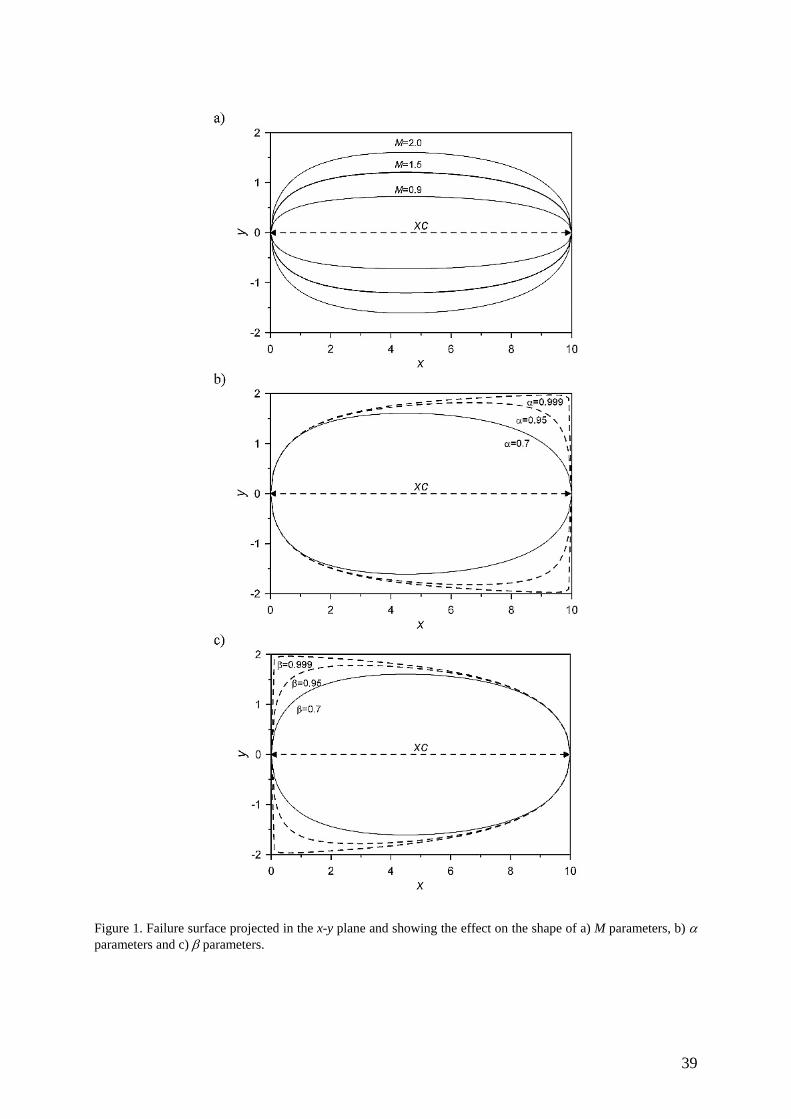
Figure 1. Failure surface projected in the x-y plane and showing the effect on the shape of a) M parameters, b) α parameters and c) β parameters.
39
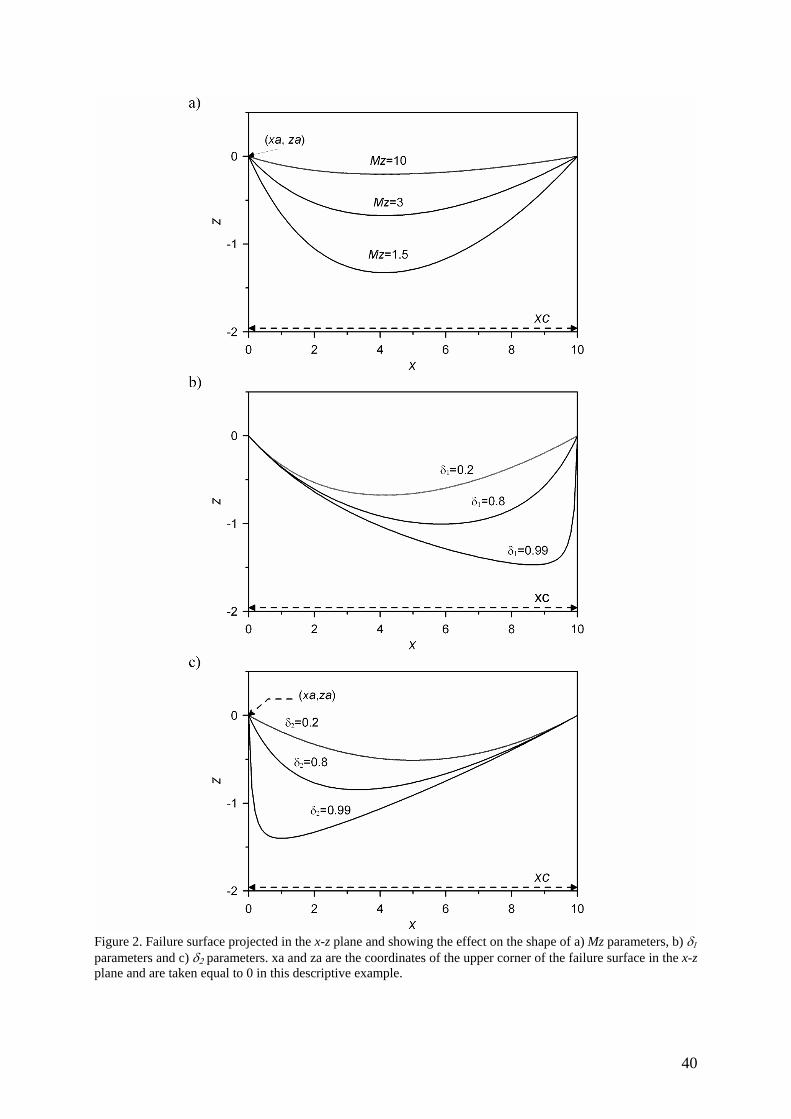
Figure 2. Failure surface projected in the x-z plane and showing the effect on the shape of a) Mz parameters, b) δ1 parameters and c) δ2 parameters. xa and za are the coordinates of the upper corner of the failure surface in the x-z plane and are taken equal to 0 in this descriptive example.
40
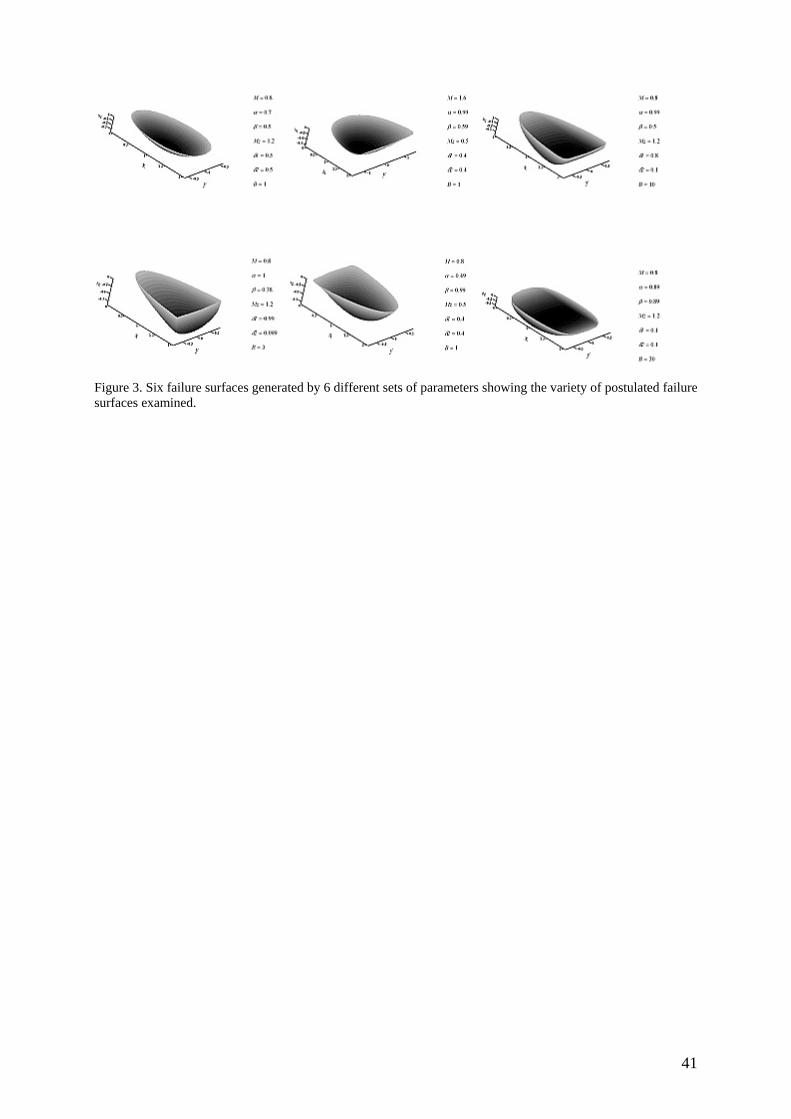
Figure 3. Six failure surfaces generated by 6 different sets of parameters showing the variety of postulated failure surfaces examined.
41
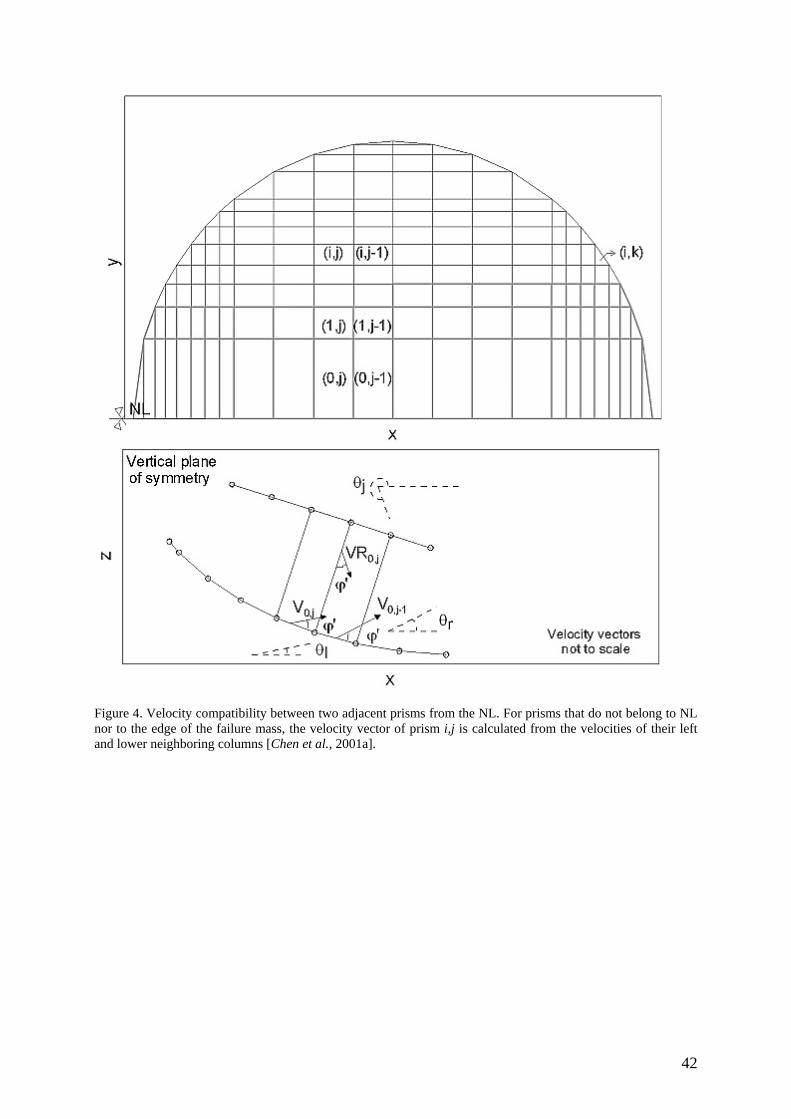
Figure 4. Velocity compatibility between two adjacent prisms from the NL. For prisms that do not belong to NL nor to the edge of the failure mass, the velocity vector of prism i,j is calculated from the velocities of their left and lower neighboring columns [Chen et al., 2001a].
42
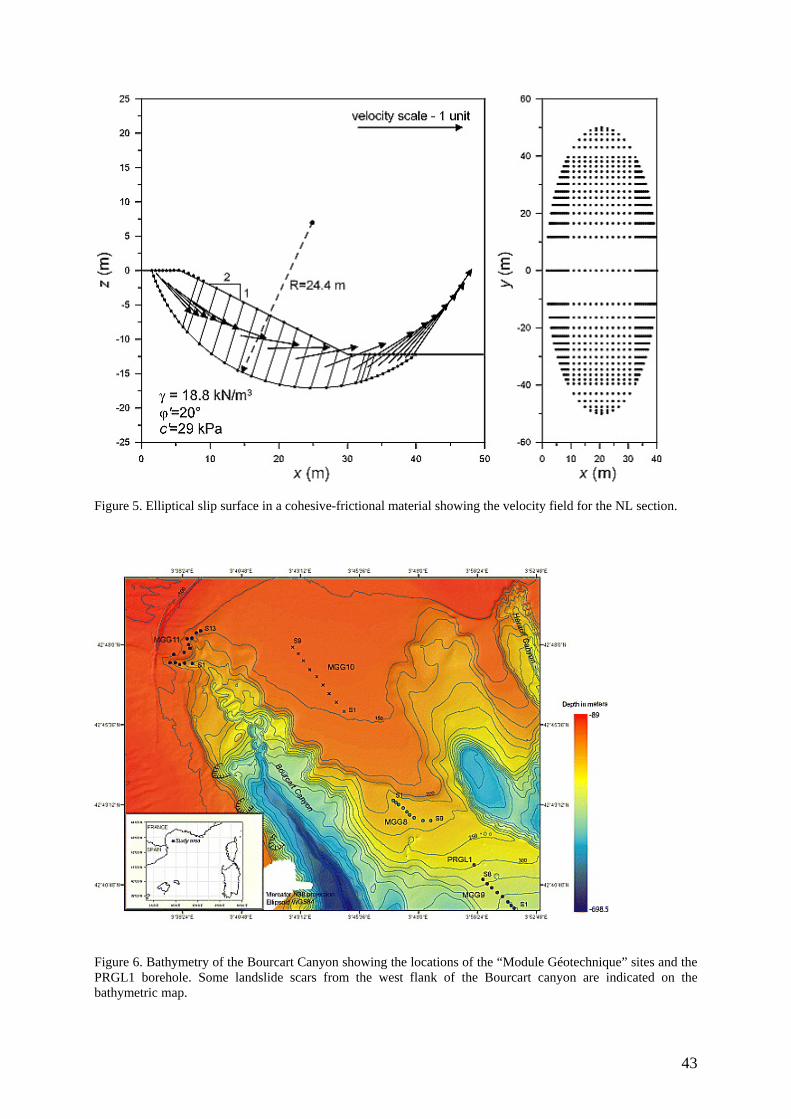
Figure 5. Elliptical slip surface in a cohesive-frictional material showing the velocity field for the NL section.
Figure 6. Bathymetry of the Bourcart Canyon showing the locations of the “Module Géotechnique” sites and the PRGL1 borehole. Some landslide scars from the west flank of the Bourcart canyon are indicated on the bathymetric map.
43
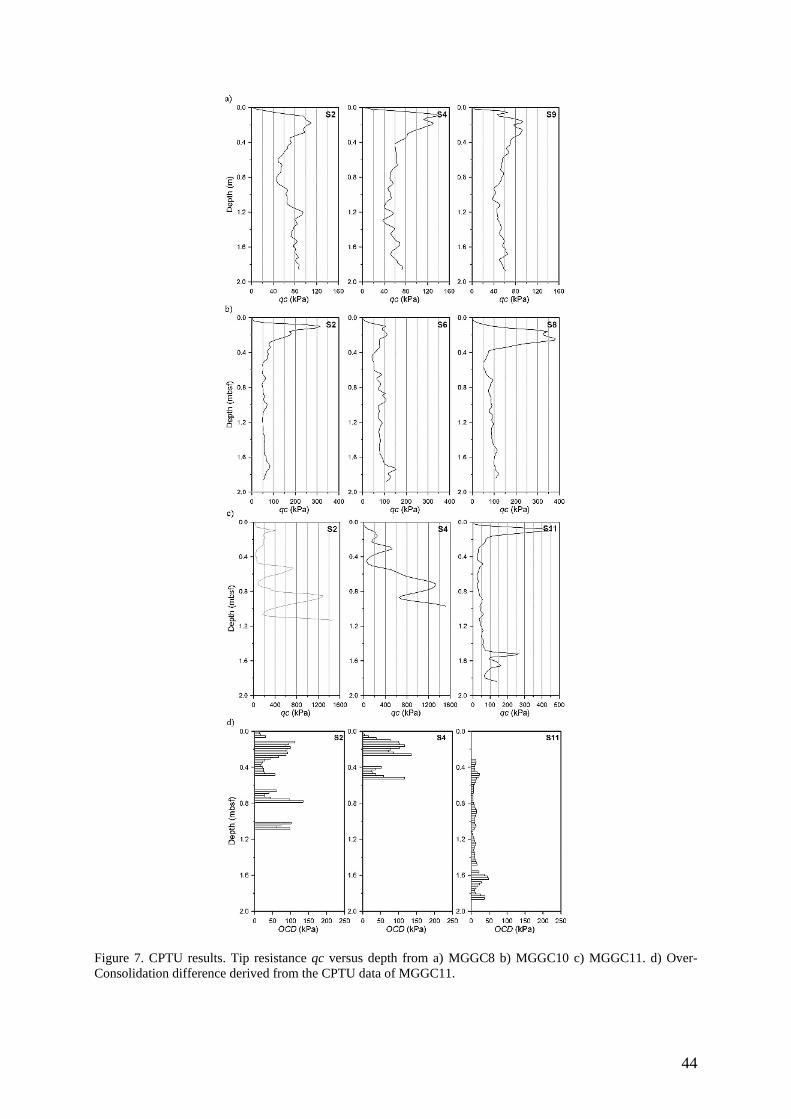
Figure 7. CPTU results. Tip resistance qc versus depth from a) MGGC8 b) MGGC10 c) MGGC11. d) Over-Consolidation difference derived from the CPTU data of MGGC11.
44
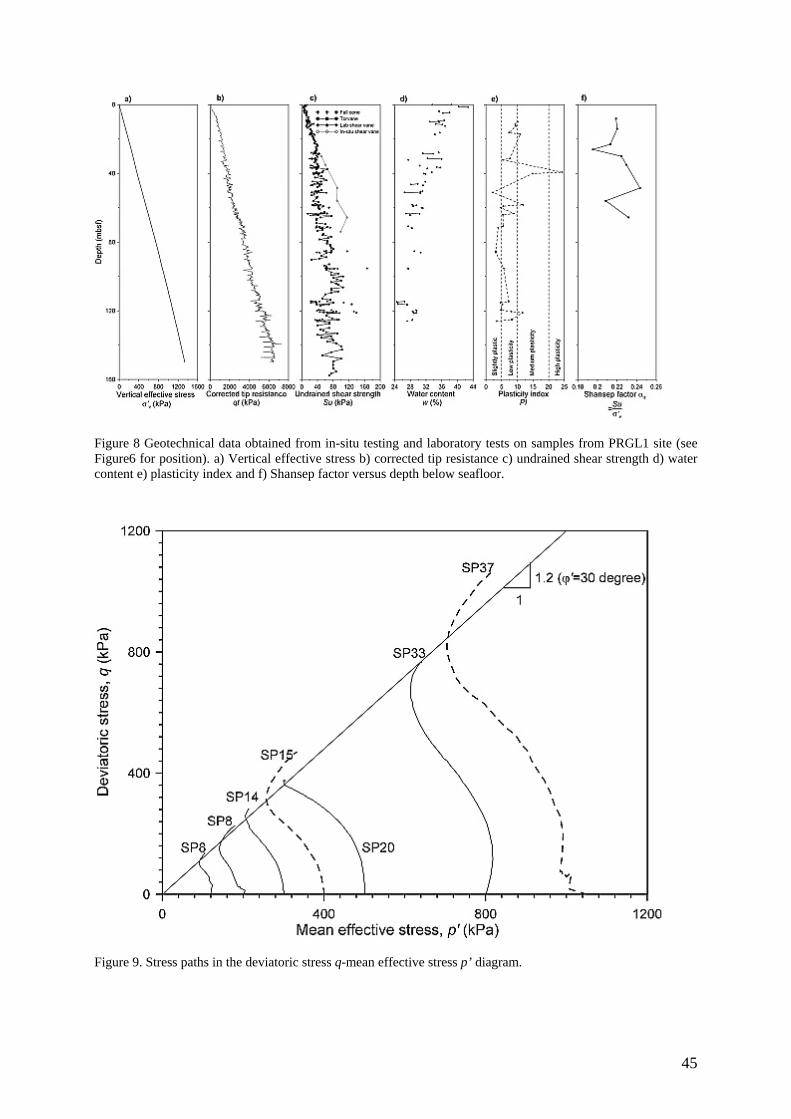
Figure 8 Geotechnical data obtained from in-situ testing and laboratory tests on samples from PRGL1 site (see Figure6 for position). a) Vertical effective stress b) corrected tip resistance c) undrained shear strength d) water content e) plasticity index and f) Shansep factor versus depth below seafloor.
Figure 9. Stress paths in the deviatoric stress q-mean effective stress p’ diagram.
45
Figure 10. a) Detailed bathymetric map of the western Bourcart Canyon flanks showing the two studied zones, b) Slope map of the western Bourcart Canyon flanks (Datum: WGS84 – Mercator N38).
46
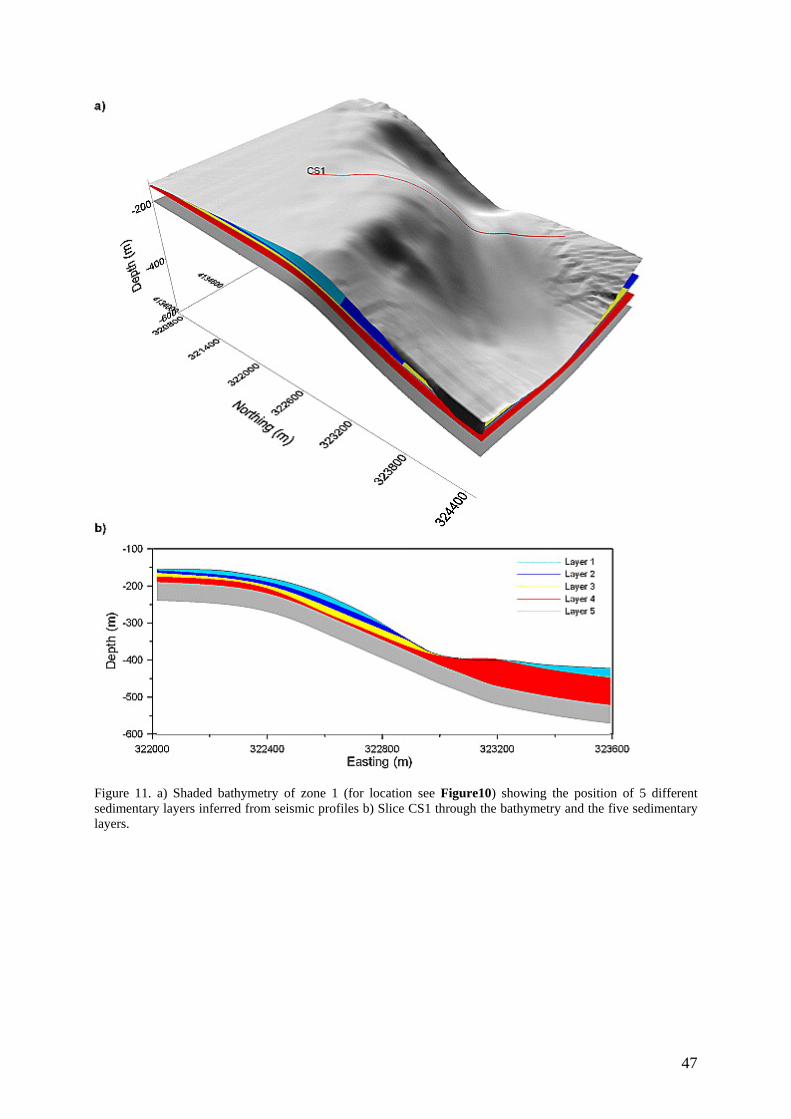
Figure 11. a) Shaded bathymetry of zone 1 (for location see Figure10) showing the position of 5 different sedimentary layers inferred from seismic profiles b) Slice CS1 through the bathymetry and the five sedimentary layers.
47
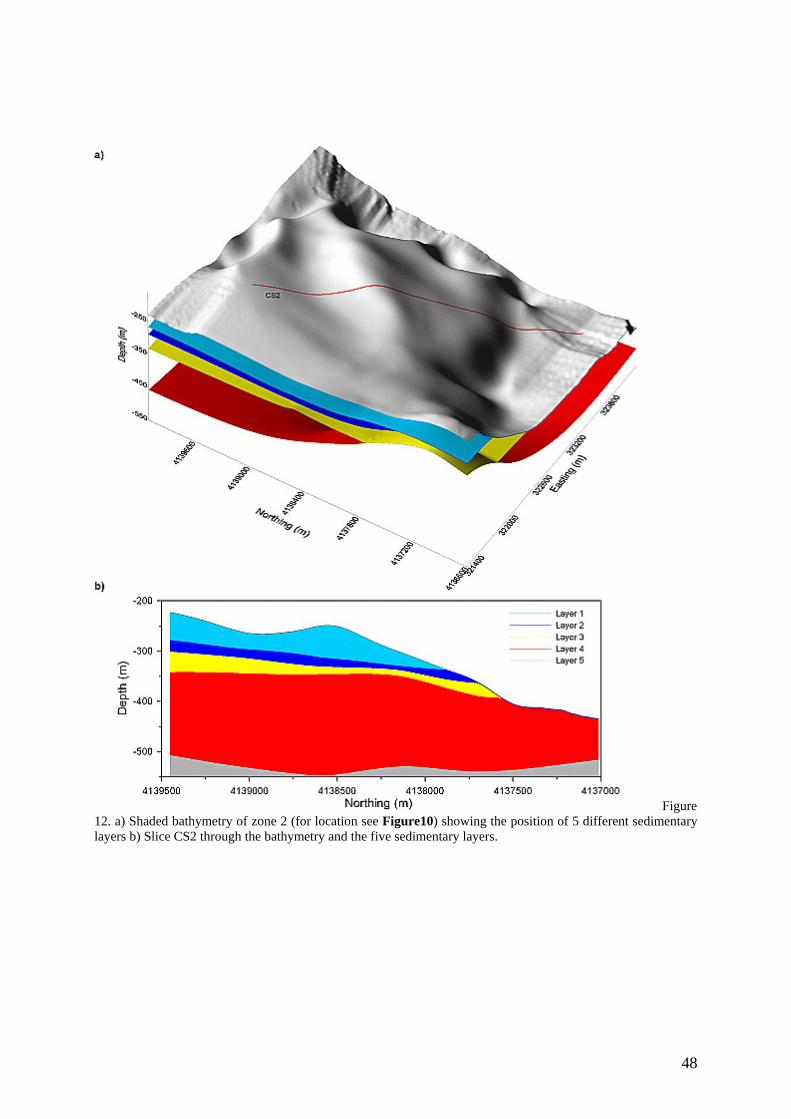
Figure 12. a) Shaded bathymetry of zone 2 (for location see Figure10) showing the position of 5 different sedimentary layers b) Slice CS2 through the bathymetry and the five sedimentary layers.
48
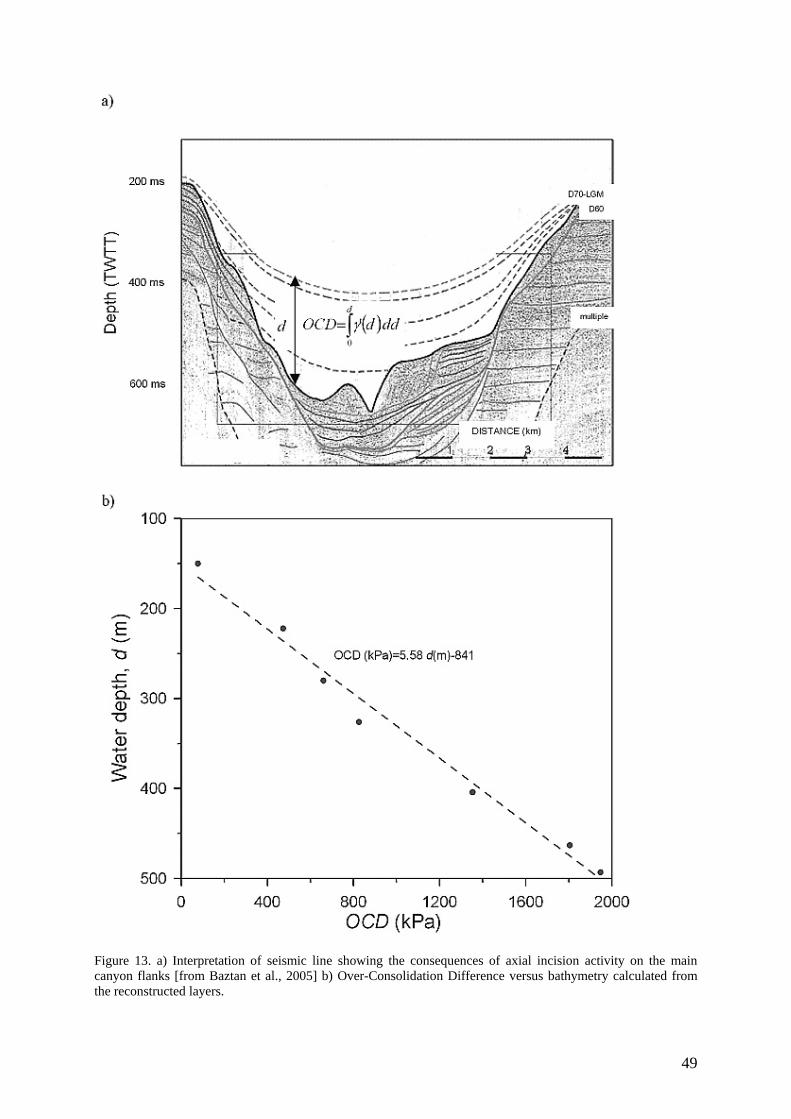
Figure 13. a) Interpretation of seismic line showing the consequences of axial incision activity on the main canyon flanks [from Baztan et al., 2005] b) Over-Consolidation Difference versus bathymetry calculated from the reconstructed layers.
49
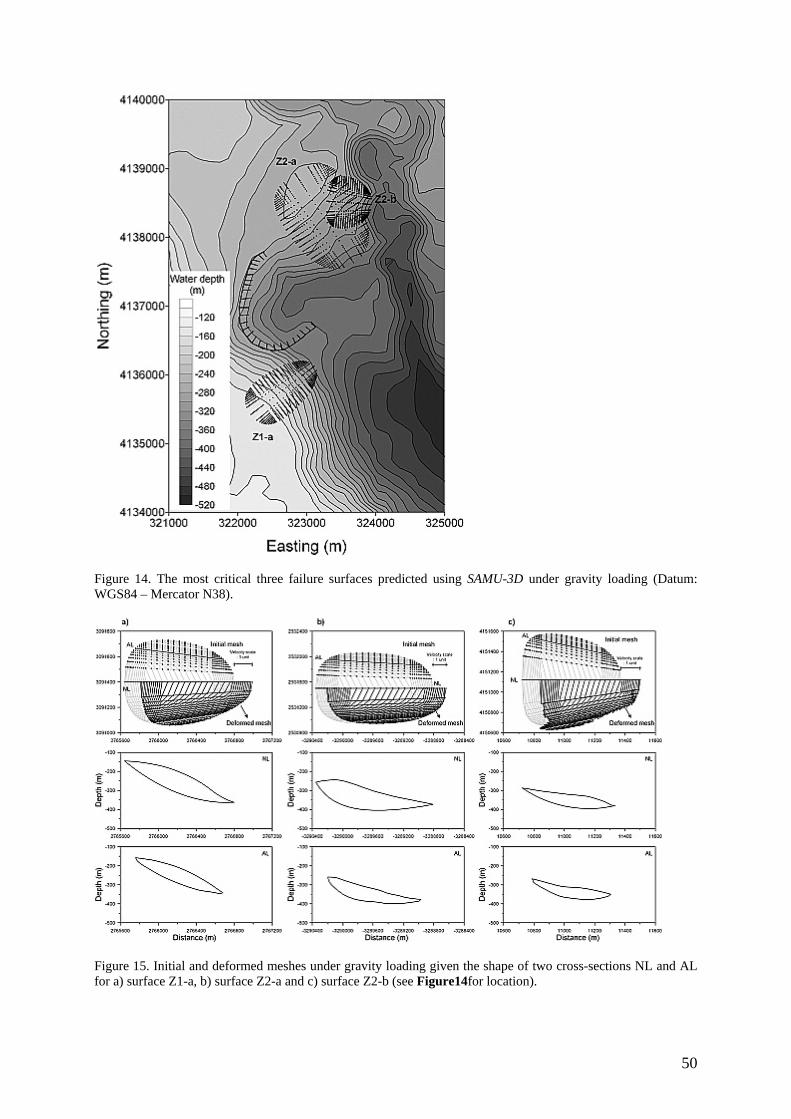
Figure 14. The most critical three failure surfaces predicted using SAMU-3D under gravity loading (Datum: WGS84 – Mercator N38).
Figure 15. Initial and deformed meshes under gravity loading given the shape of two cross-sections NL and AL for a) surface Z1-a, b) surface Z2-a and c) surface Z2-b (see Figure14for location).
50
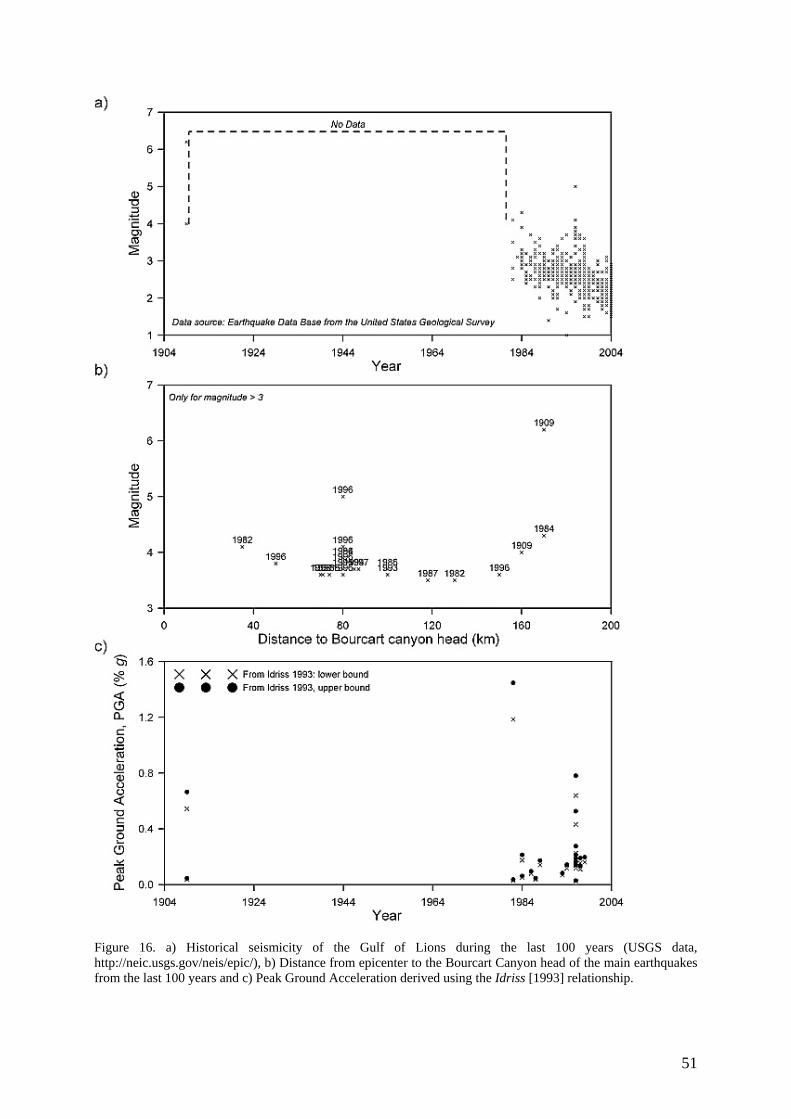
Figure 16. a) Historical seismicity of the Gulf of Lions during the last 100 years (USGS data, http://neic.usgs.gov/neis/epic/), b) Distance from epicenter to the Bourcart Canyon head of the main earthquakes from the last 100 years and c) Peak Ground Acceleration derived using the Idriss [1993] relationship.
51
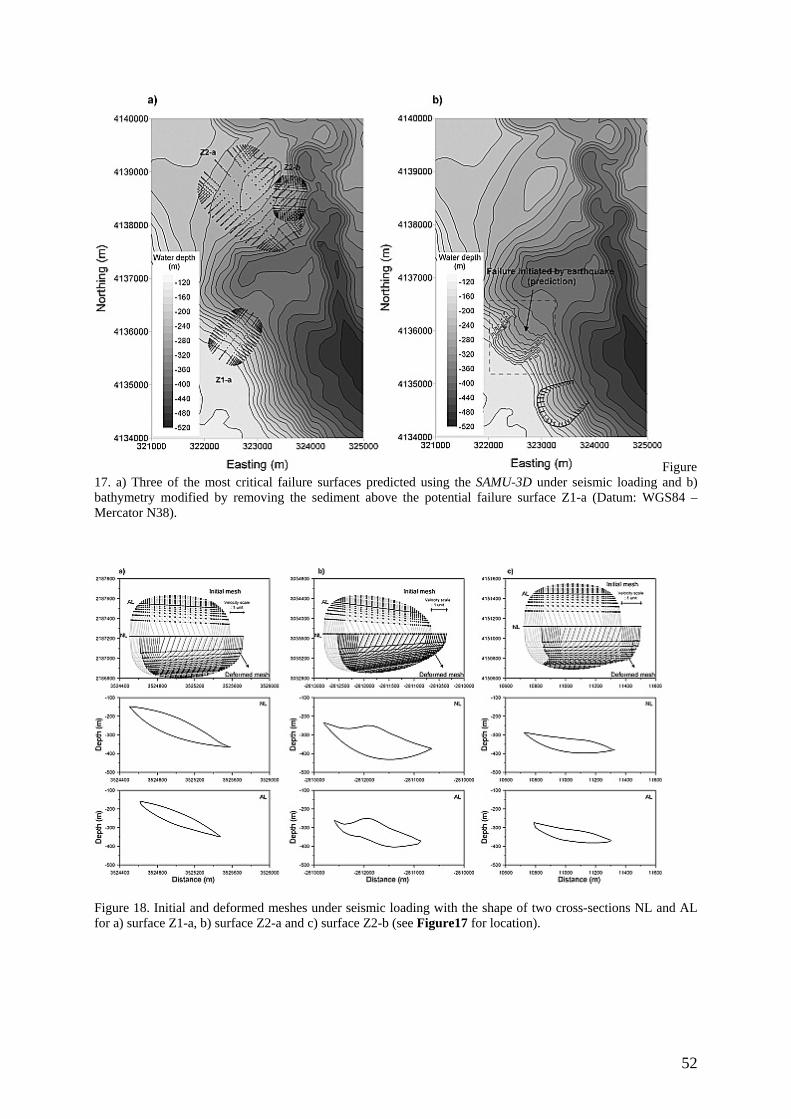
Figure 17. a) Three of the most critical failure surfaces predicted using the SAMU-3D under seismic loading and b) bathymetry modified by removing the sediment above the potential failure surface Z1-a (Datum: WGS84 – Mercator N38).
Figure 18. Initial and deformed meshes under seismic loading with the shape of two cross-sections NL and AL for a) surface Z1-a, b) surface Z2-a and c) surface Z2-b (see Figure17 for location).
52
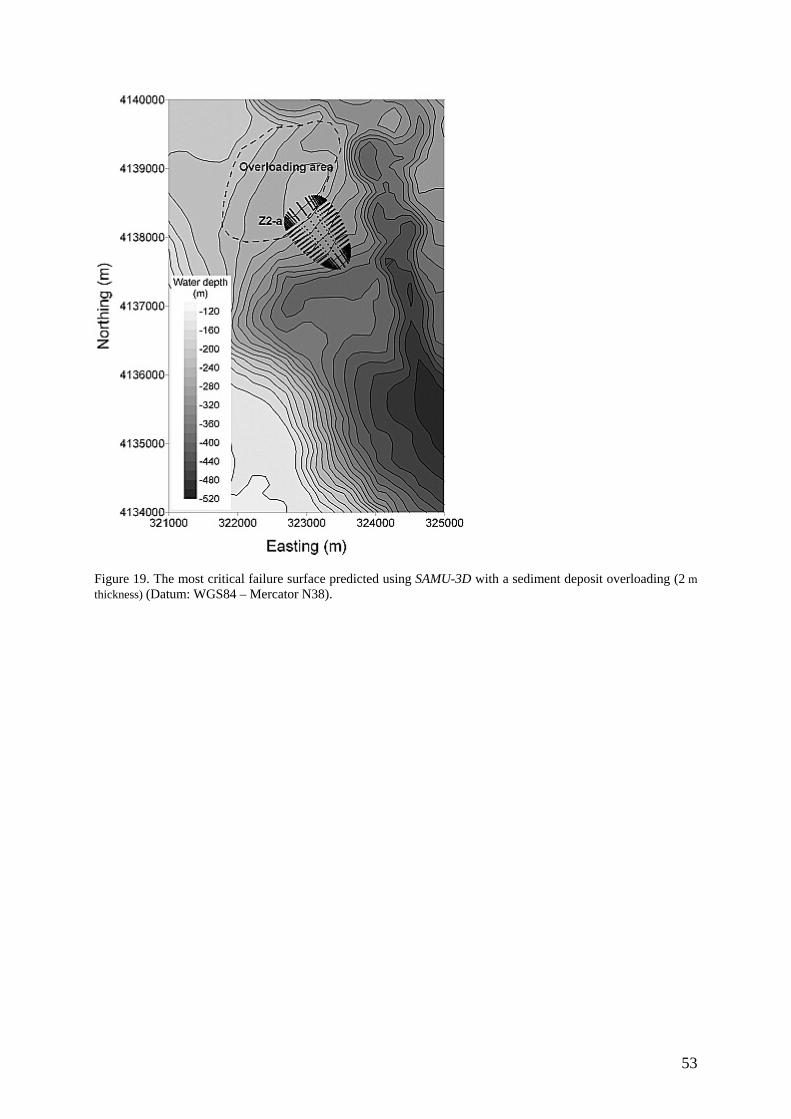
Figure 19. The most critical failure surface predicted using SAMU-3D with a sediment deposit overloading (2 m thickness) (Datum: WGS84 – Mercator N38).
53
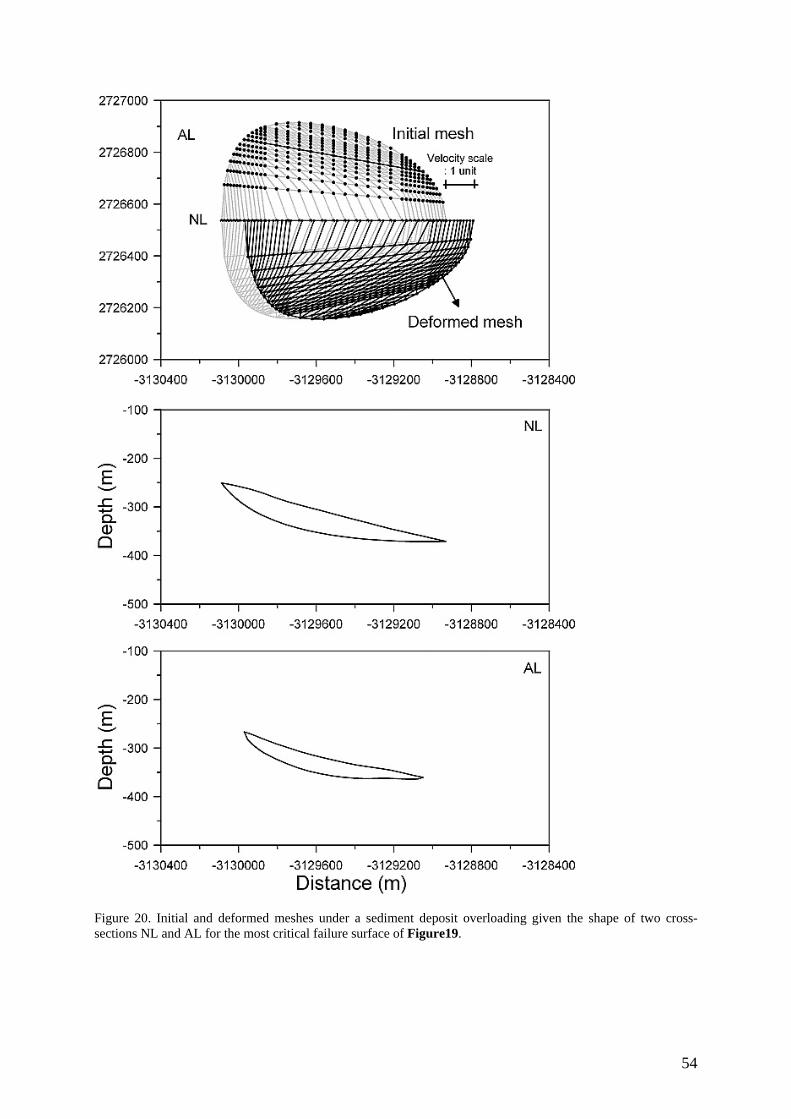
Figure 20. Initial and deformed meshes under a sediment deposit overloading given the shape of two cross-sections NL and AL for the most critical failure surface of Figure19.
54
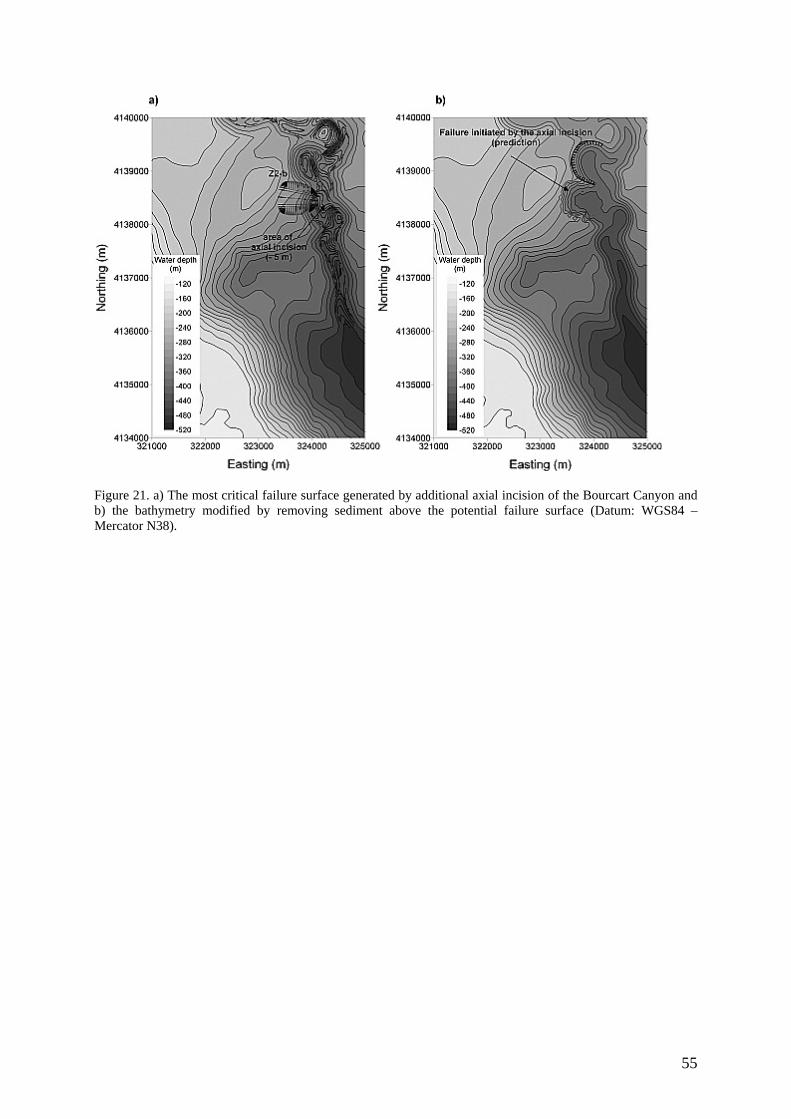
Figure 21. a) The most critical failure surface generated by additional axial incision of the Bourcart Canyon and b) the bathymetry modified by removing sediment above the potential failure surface (Datum: WGS84 – Mercator N38).
55
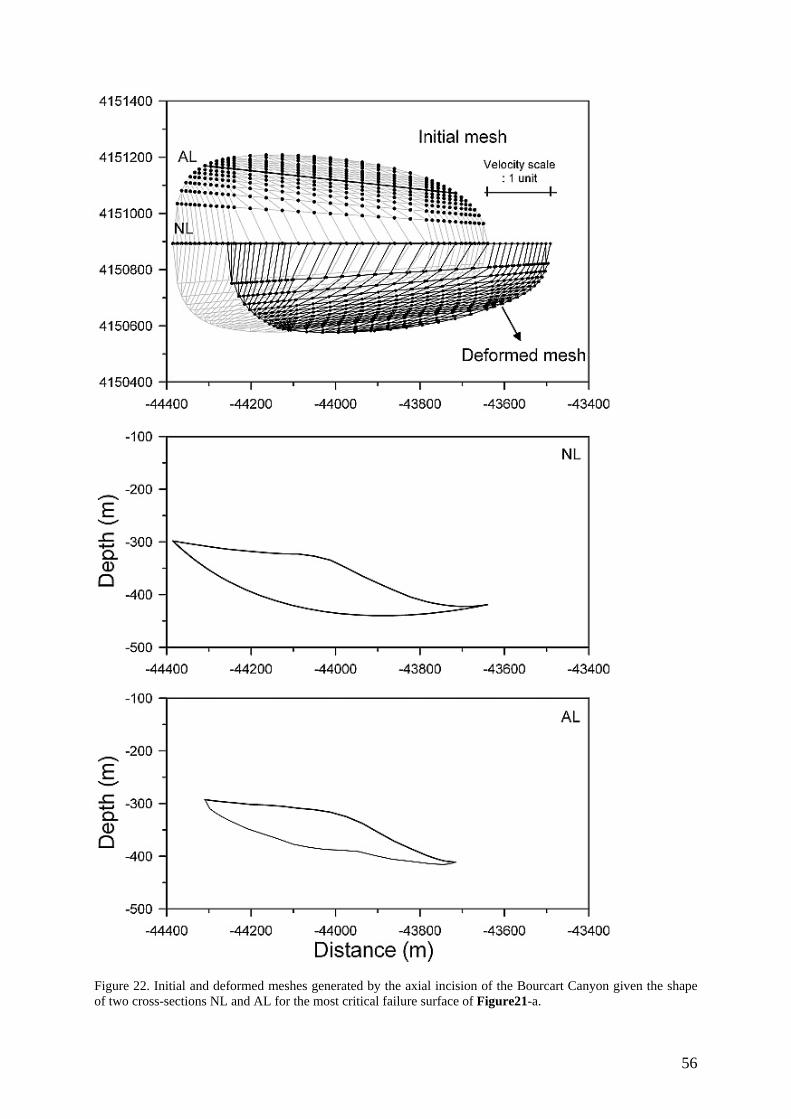
Figure 22. Initial and deformed meshes generated by the axial incision of the Bourcart Canyon given the shape of two cross-sections NL and AL for the most critical failure surface of Figure21-a.
56
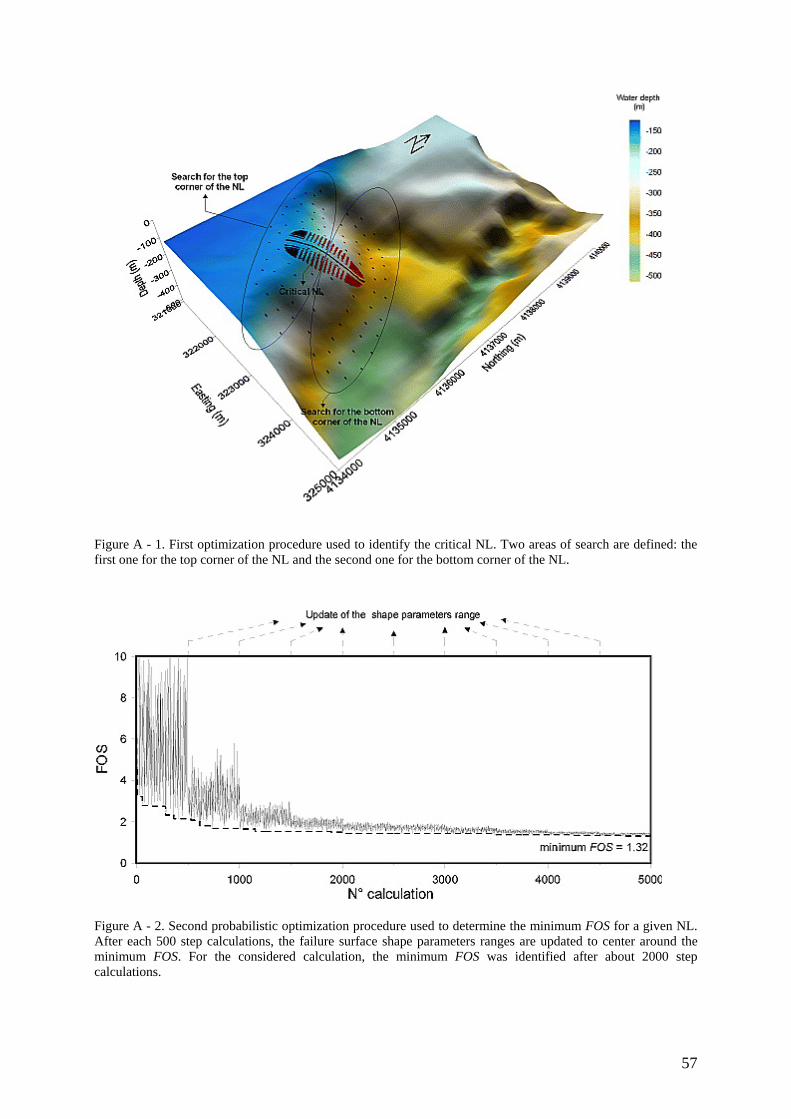
Figure A - 1. First optimization procedure used to identify the critical NL. Two areas of search are defined: the first one for the top corner of the NL and the second one for the bottom corner of the NL.
Figure A - 2. Second probabilistic optimization procedure used to determine the minimum FOS for a given NL. After each 500 step calculations, the failure surface shape parameters ranges are updated to center around the minimum FOS. For the considered calculation, the minimum FOS was identified after about 2000 step calculations.
57
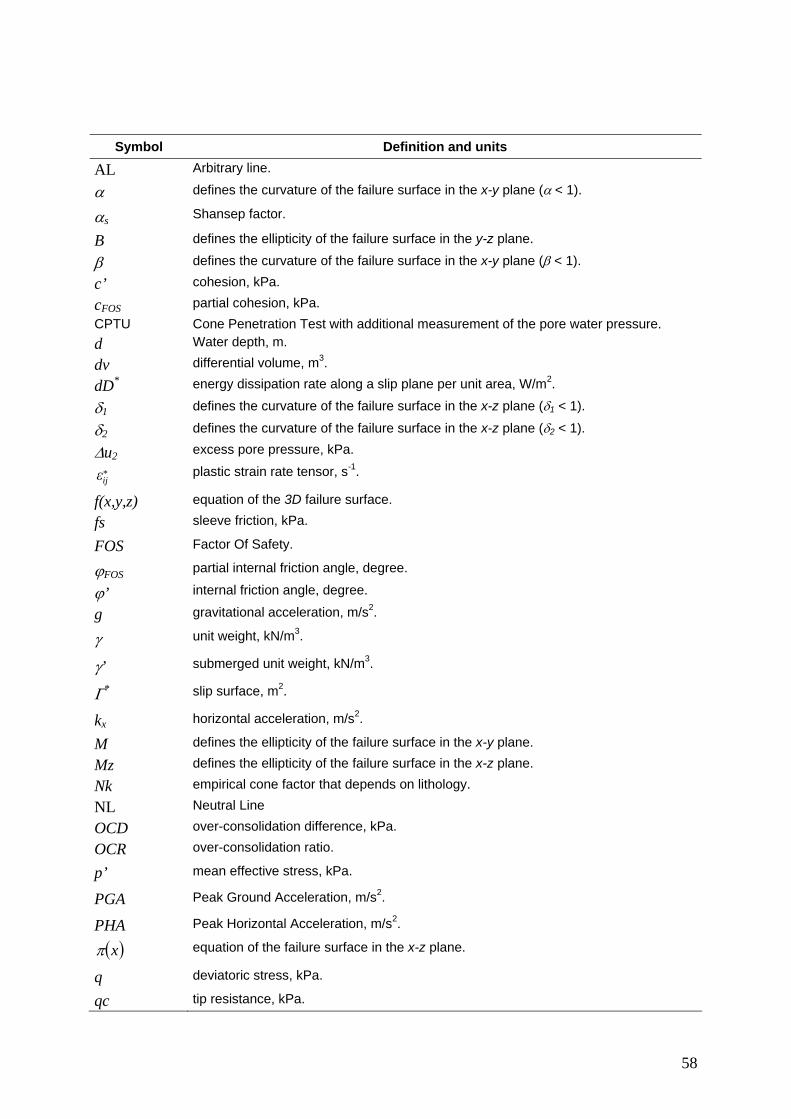
Symbol Definition and units
AL Arbitrary line.
α defines the curvature of the failure surface in the x-y plane (α < 1).
Shansep factor. αs B defines the ellipticity of the failure surface in the y-z plane.
β defines the curvature of the failure surface in the x-y plane (β < 1).
c’ cohesion, kPa.
cFOS partial cohesion, kPa. CPTU Cone Penetration Test with additional measurement of the pore water pressure. d Water depth, m.
differential volume, m3. dv dD* energy dissipation rate along a slip plane per unit area, W/m2.
δ1 defines the curvature of the failure surface in the x-z plane (δ1 < 1).
δ2 defines the curvature of the failure surface in the x-z plane (δ2 < 1). excess pore pressure, kPa. Δu2 plastic strain rate tensor, s-1. *
ijε
f(x,y,z) equation of the 3D failure surface.
fs sleeve friction, kPa.
FOS Factor Of Safety.
partial internal friction angle, degree. ϕFOS internal friction angle, degree. ϕ’ gravitational acceleration, m/s2. g unit weight, kN/m3. γ submerged unit weight, kN/m3. γ’ slip surface, m2. Γ* horizontal acceleration, m/s2. kx
M defines the ellipticity of the failure surface in the x-y plane.
Mz defines the ellipticity of the failure surface in the x-z plane.
Nk empirical cone factor that depends on lithology.
NL Neutral Line
OCD over-consolidation difference, kPa.
OCR over-consolidation ratio.
p’ mean effective stress, kPa.
Peak Ground Acceleration, m/s2. PGA Peak Horizontal Acceleration, m/s2. PHA
( )xπ equation of the failure surface in the x-z plane.
q deviatoric stress, kPa.
qc tip resistance, kPa.
58
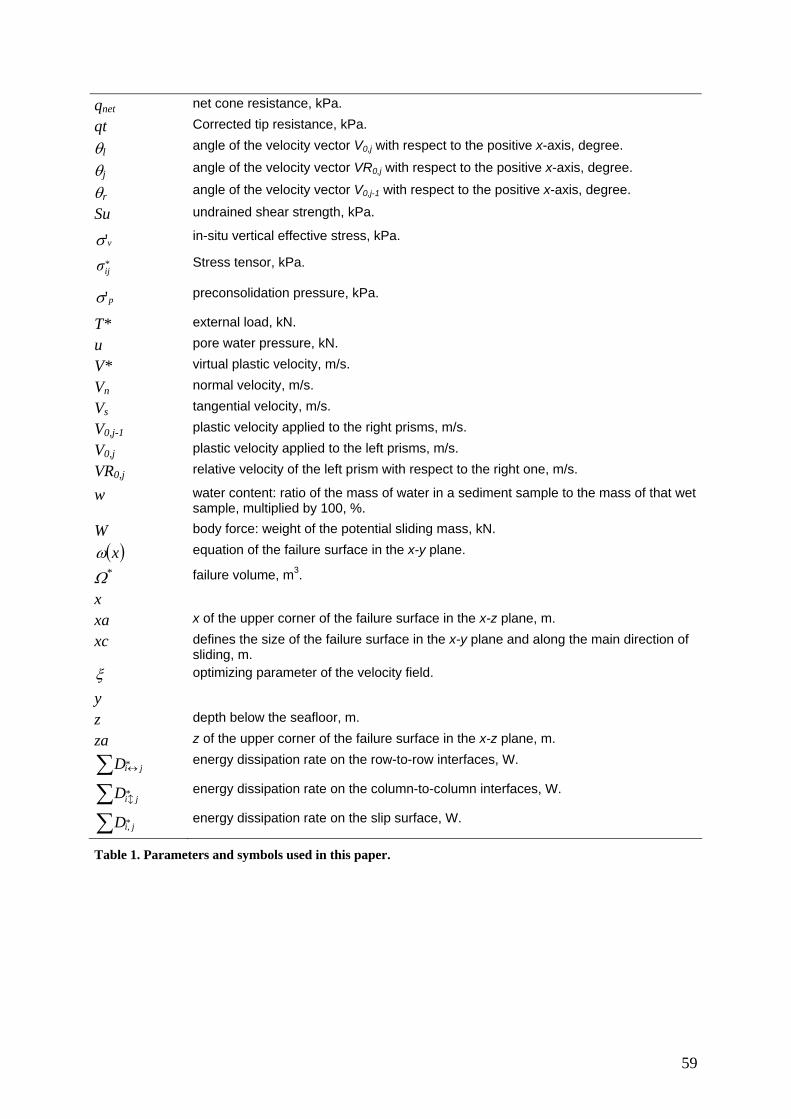
qnet net cone resistance, kPa.
qt Corrected tip resistance, kPa. angle of the velocity vector V0,j with respect to the positive x-axis, degree. θl angle of the velocity vector VR0,j with respect to the positive x-axis, degree. θj angle of the velocity vector V0,j-1 with respect to the positive x-axis, degree. θr
Su undrained shear strength, kPa.
in-situ vertical effective stress, kPa. v'σStress tensor, kPa. *
ijσ
preconsolidation pressure, kPa. p'σ
T* external load, kN.
u pore water pressure, kN.
V* virtual plastic velocity, m/s.
Vn normal velocity, m/s.
Vs tangential velocity, m/s.
V0,j-1 plastic velocity applied to the right prisms, m/s.
V0,j plastic velocity applied to the left prisms, m/s.
VR0,j relative velocity of the left prism with respect to the right one, m/s.
w water content: ratio of the mass of water in a sediment sample to the mass of that wet sample, multiplied by 100, %.
W body force: weight of the potential sliding mass, kN.
( )xω equation of the failure surface in the x-y plane. failure volume, m3. Ω*
x
xa x of the upper corner of the failure surface in the x-z plane, m.
xc defines the size of the failure surface in the x-y plane and along the main direction of sliding, m.
ξ optimizing parameter of the velocity field.
y
z depth below the seafloor, m.
za z of the upper corner of the failure surface in the x-z plane, m.
∑ ↔* jiD energy dissipation rate on the row-to-row interfaces, W.
∑ * jiDbenergy dissipation rate on the column-to-column interfaces, W.
∑ *, jiD energy dissipation rate on the slip surface, W.
Table 1. Parameters and symbols used in this paper.
59
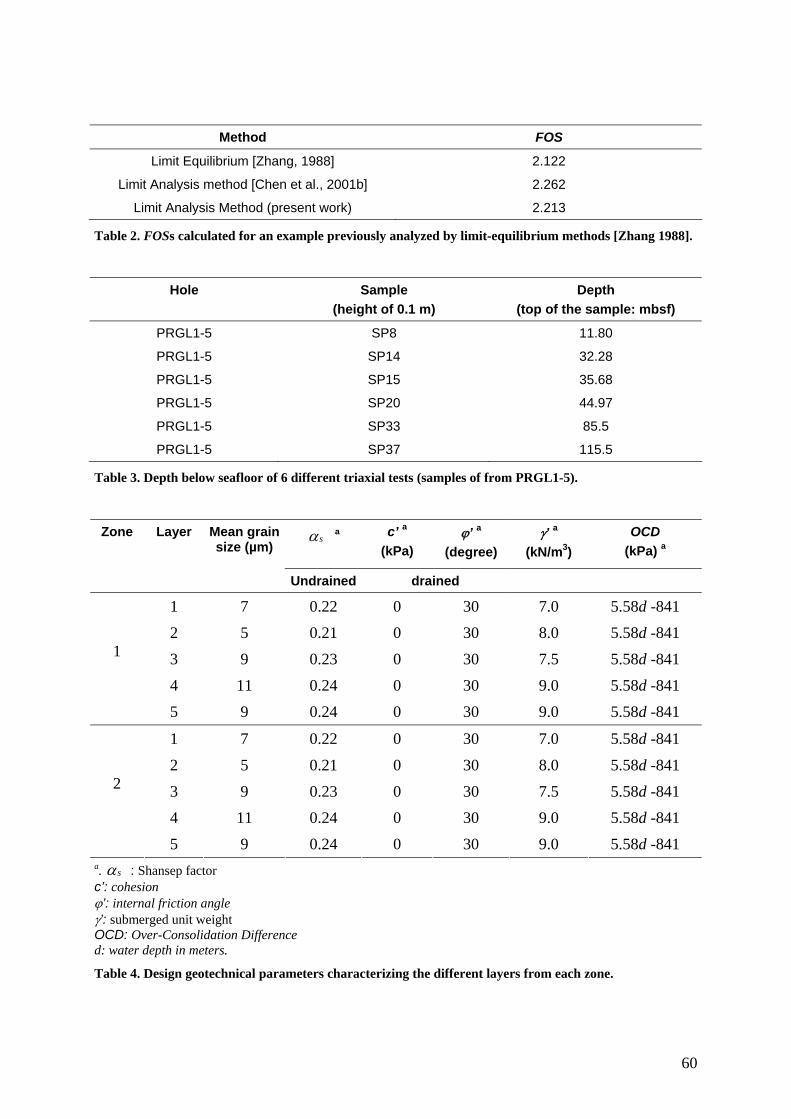
Method FOS
Limit Equilibrium [Zhang, 1988] 2.122
Limit Analysis method [Chen et al., 2001b] 2.262
Limit Analysis Method (present work) 2.213
Table 2. FOSs calculated for an example previously analyzed by limit-equilibrium methods [Zhang 1988].
Hole Sample Depth
(height of 0.1 m) (top of the sample: mbsf)
PRGL1-5 SP8 11.80
PRGL1-5 SP14 32.28
PRGL1-5 SP15 35.68
PRGL1-5 SP20 44.97
PRGL1-5 SP33 85.5
PRGL1-5 SP37 115.5
Table 3. Depth below seafloor of 6 different triaxial tests (samples of from PRGL1-5).
c’ a ϕ’ a γ’ a Zone Layer Mean grain
size (µm) OCD sα a
(kPa) a (kN/m3) (kPa) (degree)
Undrained drained
1 7 0.22 0 30 7.0 5.58d -841 2 5 0.21 0 30 8.0 5.58d -841 1 3 9 0.23 0 30 7.5 5.58d -841
4 11 0.24 0 30 9.0 5.58d -841
5 9 0.24 0 30 9.0 5.58d -841
1 7 0.22 0 30 7.0 5.58d -841 2 5 0.21 0 30 8.0 5.58d -841 2 3 9 0.23 0 30 7.5 5.58d -841
4 11 0.24 0 30 9.0 5.58d -841
5 9 0.24 0 30 9.0 5.58d -841 a. : Shansep factor sαc’: cohesion ϕ’: internal friction angle γ’: submerged unit weight OCD: Over-Consolidation Difference d: water depth in meters.
Table 4. Design geotechnical parameters characterizing the different layers from each zone.
60
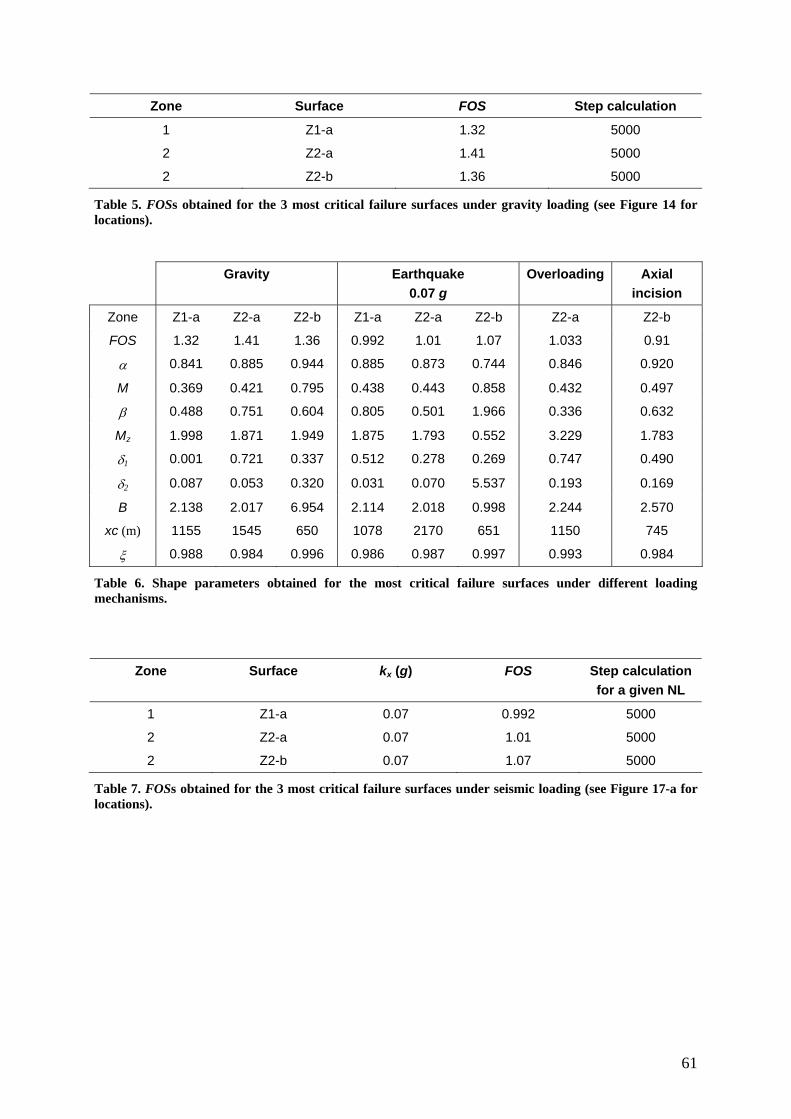
Zone Surface Step calculation FOS
1 Z1-a 1.32 5000
2 Z2-a 1.41 5000
2 Z2-b 1.36 5000
Table 5. FOSs obtained for the 3 most critical failure surfaces under gravity loading (see Figure 14 for locations).
Gravity Earthquake Overloading Axial
0.07 g incision
Zone Z1-a Z2-a Z2-b Z1-a Z2-a Z2-b Z2-a Z2-b
1.32 1.41 1.36 0.992 1.01 1.07 1.033 0.91 FOS
0.841 0.885 0.944 0.885 0.873 0.744 0.846 0.920 α
0.369 0.421 0.795 0.438 0.443 0.858 0.432 0.497 M
0.488 0.751 0.604 0.805 0.501 1.966 0.336 0.632 β
1.998 1.871 1.949 1.875 1.793 0.552 3.229 1.783 Mz
0.001 0.721 0.337 0.512 0.278 0.269 0.747 0.490 δ1
0.087 0.053 0.320 0.031 0.070 5.537 0.193 0.169 δ2
2.138 2.017 6.954 2.114 2.018 0.998 2.244 2.570 B
xc (m) 1155 1545 650 1078 2170 651 1150 745
0.988 0.984 0.996 0.986 0.987 0.997 0.993 0.984 ξ
Table 6. Shape parameters obtained for the most critical failure surfaces under different loading mechanisms.
Zone Surface kx (g) Step calculation FOS for a given NL
1 Z1-a 0.07 0.992 5000
2 Z2-a 0.07 1.01 5000
2 Z2-b 0.07 1.07 5000
Table 7. FOSs obtained for the 3 most critical failure surfaces under seismic loading (see Figure 17-a for locations).
61
Related Documents