Nat. Hazards Earth Syst. Sci., 6, 397–405, 2006 www.nat-hazards-earth-syst-sci.net/6/397/2006/ © Author(s) 2006. This work is licensed under a Creative Commons License. Natural Hazards and Earth System Sciences Analysis of severe convective events from two operational dual polarisation doppler radars M. Celano 1,2 , P. P. Alberoni 1 , V. Levizzani 3 , and A. R. Holt 4 1 ARPA-SIM, viale Silvani 6, 40122, Bologna, Italy 2 Universit` a degli Studi di Ferrara, Dip. di Fisica, via Saragat 1, 44100 Ferrara, Italy 3 ISAC-CNR, via Gobetti 101, 40129 Bologna, Italy 4 University of Essex, Dept. of Math. Sciences, Colchester, CO4 3SQ, UK Received: 8 December 2005 – Revised: 22 February 2006 – Accepted: 22 February 2006 – Published: 23 May 2006 Abstract. The recent gradual increase in the use of polari- metric radars prompts for possible improvements in the esti- mation of precipitation and the identification of the prevail- ing hydrometeor type. An analysis of different convection episodes (20 May 2003, 4 and 7 May 2004) is conducted in order to explore the attenuation effects at C band and their consequences on the rainfall field estimation using two po- larimetric radars in the Po Valley, Italy, located about 90km apart. A hydrometeor classification scheme, developed at the National Severe Storms Laboratory (NSSL), is used to detect the microphysical structure of the different cloud systems. The work is focused on the reconstruction of the 3-D organ- isation of the convective events, highlighting how the two radar systems “see” the storms from different points of view. Furthermore, the two distinct observations and the tempera- ture field are used to correct the effect of attenuation. 1 Introduction Polarimetric radars are sensitive to hydrometeor properties as size, shape, orientation, and thermodynamic phase (Doviak and Zrni´ c 1993), and for this reason are expected to play an important role in improving quantitative precipitation esti- mates through a better estimation of rain patterns (pioneer- ing work of Seliga and Bringi, 1976), validation of non- hydrostatic models, and improvement of initial conditions and constraints in numerical weather prediction (NWP) mod- els for short term forecasts. Moreover, the identification of hydrometeor types has important applications for operational monitoring such as hail warning (e.g., Aydin et al., 1986), and in diagnosing meteorological phenomena with a poten- tial impact in limited area models (LAM) initialisation. Correspondence to: M. Celano (mcelano@ arpa.emr.it) A summary of the state-of-the-art of polarimetry for weather radars can be found in the work of Zrni´ c and Ryzhkov (1999). To date most of the available literature on radar polarimetry dwells on S-band radars (e.g., Vivekanan- dan et al., 1999), but the perspective of the deployment of C-band polarimetric radars in Europe motivates the research community to a close examination of the observation capa- bilities at these wavelengths. The study is carried out using two polarimetric C-band radars located 90 km apart in the Po Valley of Northern Italy, in S. Pietro Capofiume (SPC hereafter) and Gattatico (GAT), both managed by ARPA Emilia-Romagna. Radar data at C or X-band are more affected by attenuation and resonance (Chandra et al., 1995; Upton and Fernandez-Duran, 1999; Zrni´ c et al., 2000) than those at longer wavelengths. There- fore, a combined scanning strategy of the two instruments was applied as a way of reconstructing the 3-D structure of the cloud systems, concentrating on convective episodes tak- ing place over the area between them. The analysis focuses on 1) a thorough reconstruction of the attenuation effects (especially differential attenuation) occur- ring at C-band and their consequences on hydrometeor clas- sification, 2) an investigation on how the two radar systems “see” the storm from different points of view, and 3) a re- construction of the 3-D storm structure for correcting for the attenuation. 2 Particle identification algorithms The hydrometeor classification algorithm used for the anal- ysis (Galletti et al., 2005) belongs to the fuzzy logic fam- ily and is a further implementation of the scheme developed at the National Severe Storms Laboratory (NSSL) (Zrni´ c at al., 2001) with a reduced set of polarimetric variables col- lected at C-band: reflectivity (Z) and differential reflectivity (ZDR). Published by Copernicus GmbH on behalf of the European Geosciences Union.

Welcome message from author
This document is posted to help you gain knowledge. Please leave a comment to let me know what you think about it! Share it to your friends and learn new things together.
Transcript
Nat. Hazards Earth Syst. Sci., 6, 397–405, 2006www.nat-hazards-earth-syst-sci.net/6/397/2006/© Author(s) 2006. This work is licensedunder a Creative Commons License.
Natural Hazardsand Earth
System Sciences
Analysis of severe convective events from two operational dualpolarisation doppler radars
M. Celano1,2, P. P. Alberoni1, V. Levizzani3, and A. R. Holt4
1ARPA-SIM, viale Silvani 6, 40122, Bologna, Italy2Universita degli Studi di Ferrara, Dip. di Fisica, via Saragat 1, 44100 Ferrara, Italy3ISAC-CNR, via Gobetti 101, 40129 Bologna, Italy4University of Essex, Dept. of Math. Sciences, Colchester, CO4 3SQ, UK
Received: 8 December 2005 – Revised: 22 February 2006 – Accepted: 22 February 2006 – Published: 23 May 2006
Abstract. The recent gradual increase in the use of polari-metric radars prompts for possible improvements in the esti-mation of precipitation and the identification of the prevail-ing hydrometeor type. An analysis of different convectionepisodes (20 May 2003, 4 and 7 May 2004) is conducted inorder to explore the attenuation effects at C band and theirconsequences on the rainfall field estimation using two po-larimetric radars in the Po Valley, Italy, located about 90 kmapart. A hydrometeor classification scheme, developed at theNational Severe Storms Laboratory (NSSL), is used to detectthe microphysical structure of the different cloud systems.The work is focused on the reconstruction of the 3-D organ-isation of the convective events, highlighting how the tworadar systems “see” the storms from different points of view.Furthermore, the two distinct observations and the tempera-ture field are used to correct the effect of attenuation.
1 Introduction
Polarimetric radars are sensitive to hydrometeor properties assize, shape, orientation, and thermodynamic phase (Doviakand Zrnic 1993), and for this reason are expected to play animportant role in improving quantitative precipitation esti-mates through a better estimation of rain patterns (pioneer-ing work of Seliga and Bringi, 1976), validation of non-hydrostatic models, and improvement of initial conditionsand constraints in numerical weather prediction (NWP) mod-els for short term forecasts. Moreover, the identification ofhydrometeor types has important applications for operationalmonitoring such as hail warning (e.g., Aydin et al., 1986),and in diagnosing meteorological phenomena with a poten-tial impact in limited area models (LAM) initialisation.
Correspondence to:M. Celano(mcelano@ arpa.emr.it)
A summary of the state-of-the-art of polarimetry forweather radars can be found in the work of Zrnic andRyzhkov (1999). To date most of the available literature onradar polarimetry dwells on S-band radars (e.g., Vivekanan-dan et al., 1999), but the perspective of the deployment ofC-band polarimetric radars in Europe motivates the researchcommunity to a close examination of the observation capa-bilities at these wavelengths.
The study is carried out using two polarimetric C-bandradars located 90 km apart in the Po Valley of Northern Italy,in S. Pietro Capofiume (SPC hereafter) and Gattatico (GAT),both managed by ARPA Emilia-Romagna. Radar data at Cor X-band are more affected by attenuation and resonance(Chandra et al., 1995; Upton and Fernandez-Duran, 1999;Zrnic et al., 2000) than those at longer wavelengths. There-fore, a combined scanning strategy of the two instrumentswas applied as a way of reconstructing the 3-D structure ofthe cloud systems, concentrating on convective episodes tak-ing place over the area between them.
The analysis focuses on 1) a thorough reconstruction of theattenuation effects (especially differential attenuation) occur-ring at C-band and their consequences on hydrometeor clas-sification, 2) an investigation on how the two radar systems“see” the storm from different points of view, and 3) a re-construction of the 3-D storm structure for correcting for theattenuation.
2 Particle identification algorithms
The hydrometeor classification algorithm used for the anal-ysis (Galletti et al., 2005) belongs to the fuzzy logic fam-ily and is a further implementation of the scheme developedat the National Severe Storms Laboratory (NSSL) (Zrnic atal., 2001) with a reduced set of polarimetric variables col-lected at C-band: reflectivity (Z) and differential reflectivity(ZDR).
Published by Copernicus GmbH on behalf of the European Geosciences Union.

398 M. Celano et al.: Hydrometeor classification using two polarimetric radars
Fig. 1. 20 May 2003; RHI of Z and ZDR for the GAT radar(a), (b), the SPC radar(c), (d) and the composite(e), (f) along the reference lineconnecting the two radars.
The fuzzy logic-based methodology was applied in thefirst place for implementing capabilities of distinguishing be-
tween several classes/types of hydrometeors. The crucialpoint of the classification scheme is the partitioning of the
Nat. Hazards Earth Syst. Sci., 6, 397–405, 2006 www.nat-hazards-earth-syst-sci.net/6/397/2006/

M. Celano et al.: Hydrometeor classification using two polarimetric radars 399
Fig. 2. 20 May 2003;(a) ZDR first elevation ray for the GAT (black line) and the SPC radar (red line) along the reference line. RHIhydrometeors classification for(b) GAT, (c) SPC radars and the composite(d).
multidimensional space generated by the polarimetric vari-ables in subsets related to specific particle classes. Thescheme is based on a combination of weighting functionsthat map the Z-ZDR space and that are associated with aparticular type of hydrometeor. These weighting functionshave a trapezoidal shape (a 3-D graph would appear as atruncated pyramid with lower base at 0 and upper base at1) whose variables are the horizontal reflectivity ZH andthe differential reflectivity ZDR that show the highest dis-criminating power for the classification process. In analogywith the probability density functions (PDF), the member-ship functions are the product of a 1-dimensional weight-ing function for ZH [Wj (ZH)] by a conditional weightingfunction for ZDR [Wj (ZDR,ZH)], and they decrease linearlywith distance from 1 to 0 along the “fuzzy boundaries”. Thetwo-dimensional polarimetric membership functions over theZH-ZDR space, developed for S-band radars, are describedby Straka et al. (2000). Galletti et al. (2005) provide a short
description of the functions for the C-band applications. Theenvironmental temperature is used to remove ambiguities inthe decision process by introducing the additional constraintthat every class of hydrometeors can only be found in clouda within a certain range of temperatures (e.g., dry snow orice crystals are not found at temperatures above zero). Thescheme makes use of a standard atmospheric profile of 6.5km−1 starting from the surface temperature measured by lo-cal groundstations. The integration of temperature in theclassification scheme thus helps considerably in discardingunreasonable results stemming from computational artifacts.
The algorithm can be expressed as:
Sj =Wj (ZDR, ZH) Wpol + Wj (T ) WT
Wpol + WT
(1)
where j is the j-th hydrometeor class, Sj the threshold value,Wj (ZDR,ZH) the polarimetric membership function, Wj (T)the temperature membership function, and Wpol and WT
www.nat-hazards-earth-syst-sci.net/6/397/2006/ Nat. Hazards Earth Syst. Sci., 6, 397–405, 2006

400 M. Celano et al.: Hydrometeor classification using two polarimetric radars
Fig. 3. 20 May 2003;(a) First elevation PPI composite of ZDR.(b) First elevation PPI composite of hydrometeor classification.(c) Locationin the ZH-ZDR domain (membership functions) of the unclassified cells (blue) and the large-drop cells (red) for both GAT and SPC radars.
multiplicative factors (≤1) that define the relative importanceof each variable.
The assignment to a class is accomplished by taking thehighest value of the combination of weighting functions. Inother words, each image pixel is associated with the hydrom-eteor class that maximizes the threshold Sj . In our schemethe multiplicative factors are set to 1 and the minimum ac-ceptable threshold is 0.55.
An attempt to discriminate between ten hydrometeorclasses is made: light rain (LR,<5 mm h−1), moderate rain
(MR, 5–30 mm h−1), heavy rain (HR,>30 mm h−1), largedrops (LD, when the raindrop size distribution is dominatedby a very low concentration of large drops), rain-hail mixture(RH), graupel-small hail (GSH), hail (HA), dry snow (DS),wet snow (WS), and ice crystals (IC). However, note that themethod was originally conceived for S-band radars with anenlarged set of polarimetric parameters. On some occasions,the 10-type classification may result overly optimistic.
Nat. Hazards Earth Syst. Sci., 6, 397–405, 2006 www.nat-hazards-earth-syst-sci.net/6/397/2006/
M. Celano et al.: Hydrometeor classification using two polarimetric radars 401
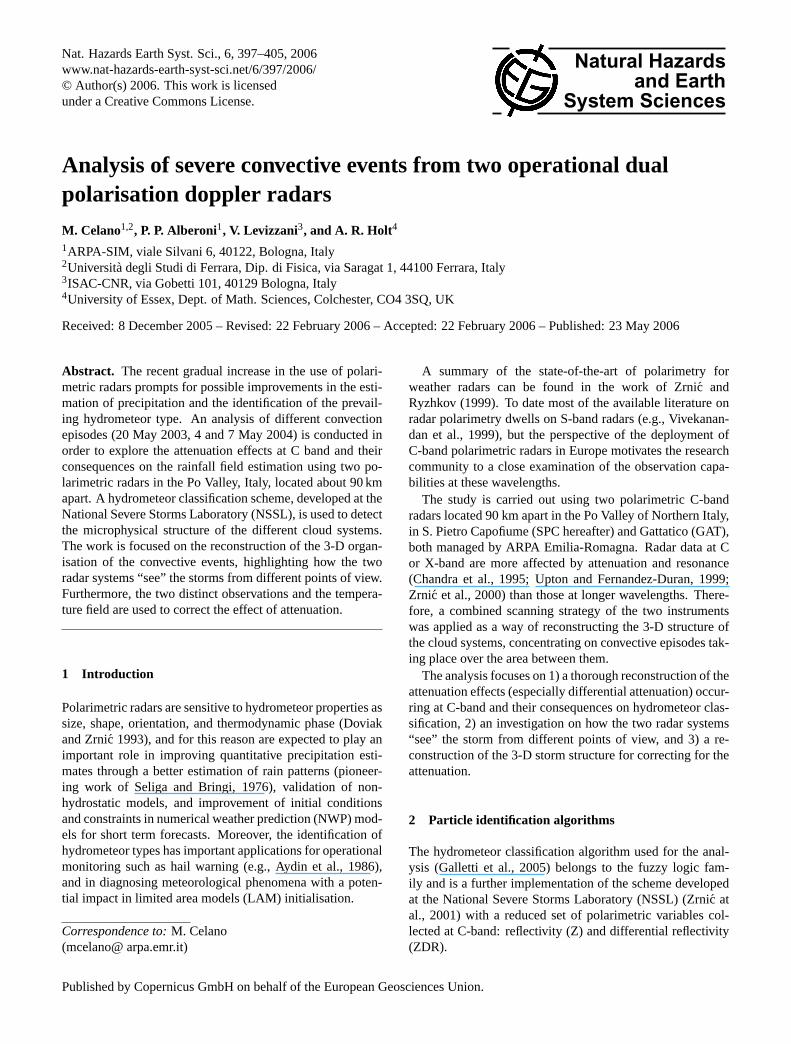
Fig. 4. 4 May 2004; ZLR maps for the GAT(a) and the SPC radars(b).
3 Case studies
3.1 20 May 2003 – Deep convection
During the night of 19/20 May 2003 a cold front, approach-ing from NW and moving across the Alps, caused a deepconvective event in the flat lands of North-Eastern Italy. Asevere hailstorm with very large hail hit the area monitoredby the two radars.
Figure 1 displays the Z and ZDR RHI vertical slicethrough the storm for GAT (Figs. 1a, b) and SPC (Figs. 1c,d) radars along the reference line connecting the two radars.
The core of the storm, characterized by high values ofZ(50< Z<60 dBZ), is located about 55–60 km from SPC and30–35 km from GAT. Note the different attenuation zones inthe ZDR maps within the two regions behind the convectivecore, depending on the different radar viewing angles. Theattenuation signature is clearly highlighted by analysing thefirst elevation rays of ZDR from each radar along the refer-ence line (Fig. 2a, red line for SPC and black line for GAT).
The SPC+GAT Z and ZDR RHI composite maps areshown in Figs. 1e, f. The composite map is made by tak-ing the highest values of Z and ZDR for each image pixeltrying to correct for the attenuation effect. The matching ofthe two radar data is a critical step, depending on the posi-tion of the storm with respect to the radars. Differences in Zand ZDR can be attributed to attenuation effects, but also tothe fact that the radars see different parts of the storm. Howexactly to carry on the data matching is still an open problemand it will be a subject of further investigation.
The hydrometeor classification for GAT (Fig. 2b) and SPC(Fig. 2c) radars are shown together with the final classifi-cation (Fig. 2d) using the two sets of radar data. The SPC
and GAT maps describe how the microphysics is detectedby the two radar systems, and they confirm that they werescanning the same event, since the two maps look very sim-ilar except for the evident attenuation effect. Moreover, theoverall classification appears a reasonable reconstruction ofthe storm. Note that 1 km-smoothed classifications are pre-sented, to reduce the chaotic pattern due to noise. The finalmatched classification presents the typical concentric struc-ture of a convective event. The presence of hail and rain-hailmixture are well detected in the core of the storm, with grau-pel around them. Ahead and behind the core there is rain(light, medium, heavy and large drops) close to the ground,and dry snow and ice crystals above the melting layer (wherewet snow is correctly detected). Note that the rainfall seenby the SPC radar is only partially seen by the GAT radar, andthe two classifications present different unclassified zones.
Another critical point is that, for some hydrometeorclasses, the C-band ZDR may be higher than the maximumZDR value of the membership functions displayed in Fig. 3c(∼6 dB); in this case, the radar cells will remain unclassified(Holt, 1984; Zrnic et al., 2000). The SPC and GAT classi-fication maps do in fact present unclassified regions in cor-respondence to high values of ZDR. Thus the highest ZDRvalues in the composite classification delimit unclassified ar-eas, such as the unclassified region all around the storm corecorrectly filled with hail. Figure 3c marks the location ofthe unclassified (blue) and the large-drop cells (red) for bothGAT and SPC radars in the ZH-ZDR domain. The unclas-sified points are connected to the negative bias due to atten-uation (ZDR< 0), but also to the very high values of ZDRthat do not fit the S-band membership functions (Fig. 3a dis-plays the composite 0.5 degree elevation PPI for ZDR). Thisis probably one of the reasons for such an extended large-drop region in the PPI classifications (Fig. 3b shows the first
www.nat-hazards-earth-syst-sci.net/6/397/2006/ Nat. Hazards Earth Syst. Sci., 6, 397–405, 2006

402 M. Celano et al.: Hydrometeor classification using two polarimetric radars
Fig. 5. 4 May 2004; RHI of Z for the SPC radar before(a) and after(b) the bias correction and the GAT radar(c) along the referenceline.
elevation PPI 1 km-smoothed composite classification). Zr-nic et al. (2000) point out that very large ZDR values can becaused by resonance effects. These occur at about 6 mm dropsize, which may contain ice cores or break around 6–8 mmsize. The algorithm is likely to need modifications takingcare of these situations.
Fig. 6. 4 May 2004; RHI hydrometeor classification for the SPCradar before(a) and after(b) the bias correction and the GAT radar(c) along the reference line.
3.2 4 May 2004 – Squall line in a shallow convective event
On 4 May 2004 a stratiform precipitating system passedover Emilia-Romagna: embedded convective cells were or-ganized into a squall line located (around 07:00 UTC) be-tween SPC and GAT radars and moving towards NW. Theground stations close to the radars reported rainfall duringthe whole day with surface T=14.5◦C, p=996 hPa, humid-ity=100%, and low visibility.
Nat. Hazards Earth Syst. Sci., 6, 397–405, 2006 www.nat-hazards-earth-syst-sci.net/6/397/2006/
M. Celano et al.: Hydrometeor classification using two polarimetric radars 403
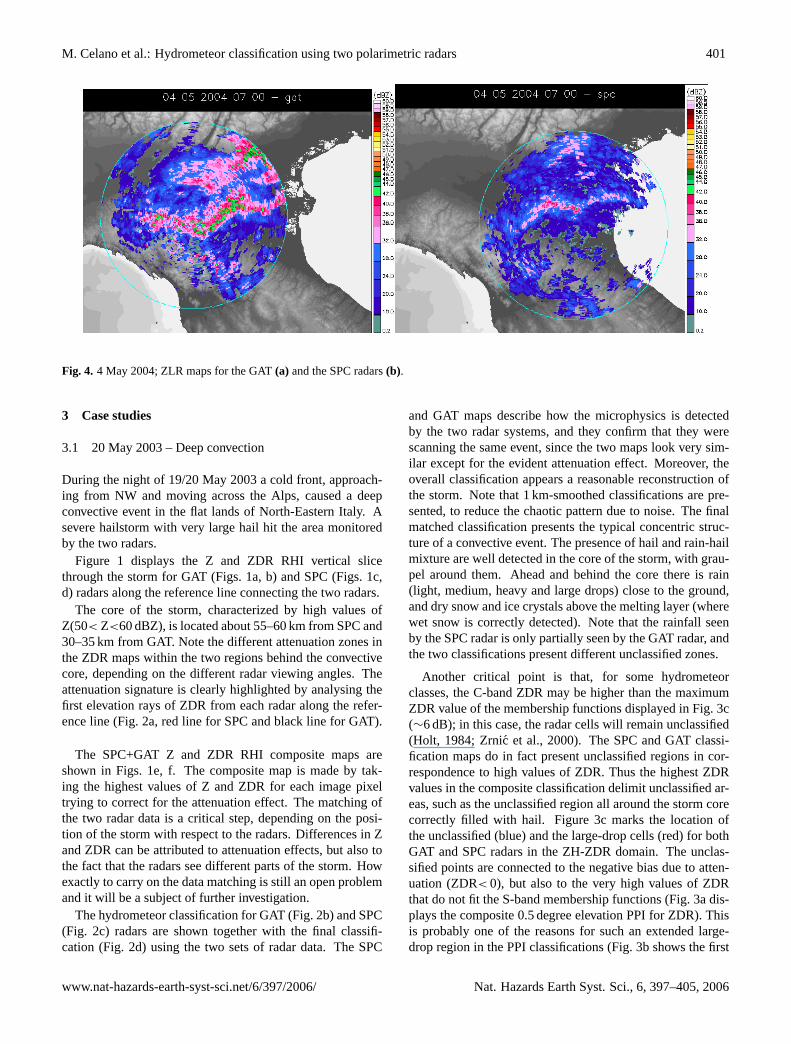
Fig. 7. 4 May 2004; First elevation PPI hydrometeor classificationfor the GAT radar(a), the SPC radar(b) and the composite classifi-cation(c).
In Fig. 4 the “low range reflectivity maps”, ZLR, for GATand SPC radars (i.e., the lowest elevation Z for each radarbeam excluding mountains or other obstacles) are displayed.A negative bias in SPC radar measurements with respect tothe GAT ones is evident and shows up in the RHI Z maps(see Figs. 5a and c for SPC and GAT radar, respectively).The power of the SPC radar signal for that day was very low,ranging from 4 kW for the first beam to 88 kW (against theoptimal range of about 200–400 kW), while the power ofGAT radar was quite constant (around 400 kW). This is prob-ably the main reason that caused the negative bias of 4 dB,especially evident in SPC data more than in GAT ones.
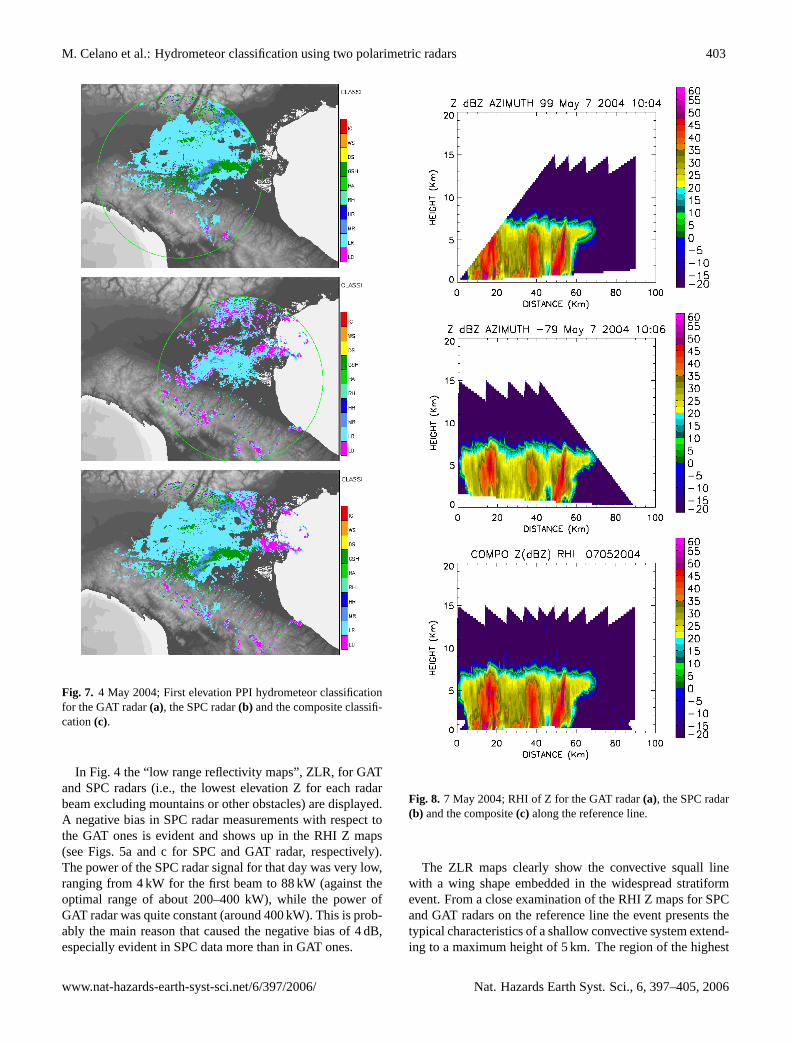
Fig. 8. 7 May 2004; RHI of Z for the GAT radar(a), the SPC radar(b) and the composite(c) along the reference line.
The ZLR maps clearly show the convective squall linewith a wing shape embedded in the widespread stratiformevent. From a close examination of the RHI Z maps for SPCand GAT radars on the reference line the event presents thetypical characteristics of a shallow convective system extend-ing to a maximum height of 5 km. The region of the highest
www.nat-hazards-earth-syst-sci.net/6/397/2006/ Nat. Hazards Earth Syst. Sci., 6, 397–405, 2006

404 M. Celano et al.: Hydrometeor classification using two polarimetric radars
Fig. 9. 7 May 2004; RHI hydrometeor classification for the GAT radar(a), the SPC radar(b) and the composite classification(c) along thereference line. In(d) the first elevation PPI of the composite hydrometeor classification.
Z value (∼45 dB, where the squall line is crossed by the radarbeam) is located 20 to 40 km from the GAT radar and 50 to70 km from the SPC radar where the bright band is particu-larly strong at about 2 km from the ground.
The RHI Z map for SPC after the correction of about 4 dB-negative bias, displayed in Fig. 5b, shows a better descriptionof the system core. The corrected reflectivity is in fact closerto that of the GAT radar. Moreover, a no-rain zone is seen byboth radars about 50–60 km from GAT.
As in the previous event, in the RHI ZDR maps the brightband signal and the different attenuation zones depending onthe different views of the two radars are detectable and the Zand ZDR two-radar composites give a reasonable and a morecomplete description of the event.
The hydrometeor classification of the GAT radar is shownin Fig. 6c. Wet snow is well detected at the melting layerheight, dry snow above, light rain close to the radar and be-yond the squall line. Note the heavier precipitation (namedmedium rain) in the convective cell with some pixels classi-fied as graupel.
The SPC classifications before and after the bias-correction are displayed in Fig. 6a, b. The classification prior
to the Z bias correction indicates the presence of light rain,but there are too many LD, an unrealistic fact for a predom-inantly stratiform event. The presence of the LD class de-creases after the bias correction (Fig. 6b) and the reason isrelated to the membership function, where a lower value of Zimplies for this case a larger number of pixels falling in theLD instead of the MR class.
The first elevation PPI classification for the GAT radar(Fig. 7a) shows a wide region of light rain with graupel andmedium rain along the convective line, while for the SPCradar light-medium rain and LD are detected (Fig. 7b, theamount of LD decreasing after the bias correction).
The composite PPI classification (Fig. 7c) is dominated bythe GAT data because it presents a medium-to-high signaland the classification is done by taking the highest reflectiv-ity value. Thus, this final composite classification using datacollected by both radars gives a better reconstruction of thesquall line; in particular the left part of the line is better de-scribed by the GAT radar and the right part by the SPC one.
Nat. Hazards Earth Syst. Sci., 6, 397–405, 2006 www.nat-hazards-earth-syst-sci.net/6/397/2006/

M. Celano et al.: Hydrometeor classification using two polarimetric radars 405
3.3 7 May 2004 – Multicell thunderstorm
On 7 May 2004 a multicell thunderstorm over the Apenninesmoved towards the plain pouring heavy rain and hailfall overthe whole Emilia Romagna region. The convective cells pre-sented a wide range of sizes and rain intensities.
Three convective cells lay centred at 15, 40 and 50 kmfrom GAT, and 40, 50 and 75 km from SPC radar as reportedin the RHI Z maps for GAT (Fig. 8a) and SPC (Fig. 8b) alongthe reference line. The maps of the two radars look very sim-ilar and the anvil is well detected on the right side of thestorm top about 8 km above ground. The RHI Z map aftermatching the two radar fields is shown in Fig. 8c
The hydrometeor identification results (see Figs. 9a, b, cfor GAT, SPC and the composite, respectively) show graupeland small hail diagnosed in the convective areas surroundedby light rain or dry snow depending on whether the cells areplaced above or below the melting level. The composite RHIclassification appears to be reasonable and consistent withthe expected microphysical processes in such kind of thun-derstorm.
The GAT classification presents more numerous unclassi-fied cells than does the SPC radar. This is connected to asmall negative bias of the ZDR data probably due to atten-uation or an acquisition problem. After examining the ZH-ZDR domain, the greater part of the unclassified cells fallsa little below the membership function named graupel andsmall hail (ZDR values slightly<0) that would represent anacceptable hydrometeor class in this case.
Finally, Fig. 9d shows the composite hydrometeor classifi-cation for the first elevation PPI that indicates the presenceof light, medium, heavy and large drop precipitation, andgraupel-small hail around the deepest and most intense cells.
4 Conclusions
The analysis confirms that C-band radars are strongly af-fected by differential attenuation, especially in case of deepconvective events.
The composite hydrometeors classification, taking advan-tage of the different point of view of the two radar systems,appears a reasonable approach to a 3-D-recontruction of dif-ferent convective events, particularly if they occur along theline connecting the two radars and for the first elevation clas-sification PPI (to avoid to consider significantly different al-titudes).
The future development of membership functions pur-posely created for C-band radar data is deemed of fundamen-tal importance, and will possibly introduce an improvementin the application of the hydrometeor classification algorithmactually in use, which is still very much linked to its originalS-band radar environment.
Acknowledgements.This work was partially supported by CARPEDIEM, a research project co-funded by the European Commissionunder the 5th FP (Contract No EVG1-CT-2001-0045), and by theINTERREG IIIB CADSES “RISK AWARE” 3B064 project. Par-ticular thanks go to D. Zrnic and A. Ryzhkov for the classificationcode. Thanks to P. Giordano for producing the power signal radardata.
Edited by: L. FerrarisReviewed by: two referees
References
Aydin, K., Seliga, T. A., and Balaji, V. : Remote sensing of hailwith a dual-linear polarization radar, J. Climate Appl. Meteorol.,25, 1475–1484, 1986.
Chandra, M., Wood, S. J., Lux, S. Holt, A. R., and Schroth,A.: Propagation effects in C-band polarisation – diversity mea-surements, “Cost75 Weather Radar Systems International semi-nar Brussels”, European Commission Report EUR 16‘ 013 EN,Brussels, 507–518, 1995.
Doviak, R. J. and Zrnic, D. S.: Doppler radar and weather observa-tions, Academic Press. Inc., San Diego, CA, 562, 1993.
Galletti, M., Alberoni, P. P. Levizzani, V., and Celano, M.: Assess-ment and tuning of the behaviour of a microphysical characteri-zation scheme, Adv. Geosci., 2, 145–150, 2005.
Holt, A. R.: Some factors affecting the remote sensing of rain by po-larisation diversity radar in the 3–35 GHz frequency range, RadioScience, 19, 1399–1412, 1984.
Seliga, T. A. and Bringi, V. N.: Potential use of radar differentialreflectivity measurements at orthogonal polarizations for mea-suring precipitation, J. Appl. Meteorol., 15, 69–76, 1976.
Straka, J. M., Zrnic, D. S., and Ryzhkov, A. V.: Bulk hydrometeorclassification and quantification using polarimetric radar data:synthesis of relations, J. Appl. Meteorol., 39, 1341–1372, 2000.
Upton, G. and Fernandez-Duran, J. J.: Statistical techniques forclutter removal and attenuation detection in radar reflectivity im-ages, “COST75 Advanced weather radar Systems internationalseminar Locarno”, European Commission, Brussels report EUR18567 EN, 747–757, 1999.
Vivekanandan, J., Zrnic, D. S., Ellis, S. M., Oye, R., Ryzhkov,A. V., and Straka, J. M.: Cloud microphysics retrieval using S-band dual-polarization radar measurements, Bull. Amer. Meteo-rol. Soc., 80, 381–388, 1999.
Zrnic, D. S. and Ryzhkov, A. V. : Polarimetry for weather surveil-lance radars, Bull. Amer. Meteorol. Soc., 80, 389–406, 1999.
Zrnic, D. S., Keenan, T. D., Carey, L. D., and May, P. T. : Sensitivityanalysis of polarimetric variables at a 5-cm wavelength in rain,J. Appl. Meteorol., 39, 1514–1526, 2000.
Zrnic, D. S., Ryzhkov, A. V. Straka, J. M., Liu, Y., and Vivekanan-dan, J.: Testing a procedure for automatic classification of hy-drometeor types, J. Atmos. Oceanic Technol., 18, 892–913,2001.
www.nat-hazards-earth-syst-sci.net/6/397/2006/ Nat. Hazards Earth Syst. Sci., 6, 397–405, 2006
Related Documents