© by PSP Volume 18 – No 8. 2009 Fresenius Environmental Bulletin 1462 ANALYSIS OF SEDIMENTS OF THE FOUR MAIN RIVERS (DRINI I BARDHË, MORAVA E BINÇËS, LEPENC AND SITNICA) IN KOSOVO Fatbardh Gashi 1 , Stanislav Frančišković-Bilinski 2 * and Halka Bilinski 2 1 Faculty of Natural Science, Department of Chemistry, University of Pristina, 10000 Pristina, Kosovo 2 Institute „Ruđer Bošković“, Division for marine and environmental research, POB 180, HR-10002 Zagreb, Croatia ABSTRACT Mineralogical, geochemical and contamination status of stream sediments of the rivers Drini i Bardhë, Morava e Binçës, Lepenc and Sitnica, which are of supra-regional interest, are presented for the first time. From the results ob- tained by X-ray fluorescence spectroscopy (XRF), it was concluded that the sediments of Drini i Bardhë River are weathering products of sandstones; the sediments of Mo- rava e Binçës, Sitnica and of the upper course of Lepenc are weathering products of magmatic rocks and sandstones; the sediments of the lower stretch of Lepenc are weathering products of magmatic rocks, sandstones and carbonates. The concentration of major and minor elements was determined by inductively coupled plasma mass spectroscopy (ICP- MS), the amounts of P and S by inductively coupled plasma in combination with optical emission spectrophotometry (ICP-OES), and the amounts of Hg by cold vapor in com- bination with adsorption atomic spectroscopy (CV-AAS). Assessment of sediment contamination with toxic elements was performed by comparison with the existing criteria for sediment quality. Results obtained by the box plot method showed the regions with determined anomalous element concentration values in stream sediments of Kosovo. Two locations in Sitnica River at Fushë Kosova (Kosovo Polje) and Mitrovica are significantly polluted as a result of Zn and Pb ore processing and Zn electrolysis. In the lower course of Morava River, sediments are contaminated with Cd. Increased concentrations of Mn were observed near the source of Drini i Bardhë River, suggesting natural ori- gin. Continuation of sediment monitoring is recommended, particularly on Sitnica and Morava rivers, which flow through Serbia to enter ultimately the Black Sea. KEYWORDS: Rivers of Kosovo, stream sediments, chemical composition, geochemical anomalies, pollution assessment INTRODUCTION Overexploitation of nature and uncontrolled use of natural resources, including inadequate processing of indus- trial wastes have caused large contamination of world eco- systems by toxic metals (Hg, Pb, Cd, Cu, Zn, Ni, Mn) which generally show considerable accumulation in river sedi- ments. Decomposition of organic matter and pollution due to anthropogenic activity are the main sources of pollution of water and stream sediments [1]. Sediments (silt and clay) containing toxic heavy metals, inorganic and organic sub- stances are important for studying water pollution [2]. There- fore, a multidisciplinary collaborative research is essential for understanding the processes of mechanical and chemical weathering of rocks, their products, the manner of release and consumption of CO 2 , and other natural processes to better understand the geochemical cycles associated with various trace elements. Based on the results of such stud- ies, it will be possible in the future to propose protection and detoxification measures of affected sediments and river waters and general protection and remediation of ecosys- tems. Considering more-lasting pollution in sediments in comparison to river water pollution, as well as adsorption of toxic elements, during last decades the interest for mor- phological and geochemical analysis of river sediments con- siderably increased, which is evident from increasing num- ber of publications of this scope in many journals. This work is a continuation of earlier studies of sediments in the area of nearby countries of Croatia and Slovenia [3- 10]. We could claim that the most polluted areas in the world are those with the densest population. It should therefore be the foremost goal of environmentalists to prevent such pollution, and to educate the population towards proper management of ecosystems [11]. The aim of the current work is to perform, for the first time, a research on mineralogical, geochemical and con- tamination status of the stream sediments (fraction <63 μm) of the rivers Drini i Bardhë, Morava e Binçës, Lepenc and Sitnica. These rivers, which belong to different watersheds, have drainage basins that cover a large area of Kosovo, be- ing as well of supra-regional interest. The sampling sites in Kosovo Rivers are, for the first time, geographically posi-

Welcome message from author
This document is posted to help you gain knowledge. Please leave a comment to let me know what you think about it! Share it to your friends and learn new things together.
Transcript
© by PSP Volume 18 – No 8. 2009 Fresenius Environmental Bulletin
1462
ANALYSIS OF SEDIMENTS OF THE FOUR MAIN RIVERS (DRINI I BARDHË, MORAVA E BINÇËS, LEPENC AND SITNICA) IN KOSOVO
Fatbardh Gashi1, Stanislav Frančišković-Bilinski2* and Halka Bilinski2
1Faculty of Natural Science, Department of Chemistry, University of Pristina, 10000 Pristina, Kosovo 2Institute „Ruđer Bošković“, Division for marine and environmental research, POB 180, HR-10002 Zagreb, Croatia
ABSTRACT
Mineralogical, geochemical and contamination status of stream sediments of the rivers Drini i Bardhë, Morava e Binçës, Lepenc and Sitnica, which are of supra-regional interest, are presented for the first time. From the results ob-tained by X-ray fluorescence spectroscopy (XRF), it was concluded that the sediments of Drini i Bardhë River are weathering products of sandstones; the sediments of Mo-rava e Binçës, Sitnica and of the upper course of Lepenc are weathering products of magmatic rocks and sandstones; the sediments of the lower stretch of Lepenc are weathering products of magmatic rocks, sandstones and carbonates. The concentration of major and minor elements was determined by inductively coupled plasma mass spectroscopy (ICP-MS), the amounts of P and S by inductively coupled plasma in combination with optical emission spectrophotometry (ICP-OES), and the amounts of Hg by cold vapor in com-bination with adsorption atomic spectroscopy (CV-AAS). Assessment of sediment contamination with toxic elements was performed by comparison with the existing criteria for sediment quality. Results obtained by the box plot method showed the regions with determined anomalous element concentration values in stream sediments of Kosovo. Two locations in Sitnica River at Fushë Kosova (Kosovo Polje) and Mitrovica are significantly polluted as a result of Zn and Pb ore processing and Zn electrolysis. In the lower course of Morava River, sediments are contaminated with Cd. Increased concentrations of Mn were observed near the source of Drini i Bardhë River, suggesting natural ori-gin. Continuation of sediment monitoring is recommended, particularly on Sitnica and Morava rivers, which flow through Serbia to enter ultimately the Black Sea.
KEYWORDS: Rivers of Kosovo, stream sediments, chemical composition, geochemical anomalies, pollution assessment
INTRODUCTION
Overexploitation of nature and uncontrolled use of natural resources, including inadequate processing of indus-trial wastes have caused large contamination of world eco-systems by toxic metals (Hg, Pb, Cd, Cu, Zn, Ni, Mn) which generally show considerable accumulation in river sedi-ments. Decomposition of organic matter and pollution due to anthropogenic activity are the main sources of pollution of water and stream sediments [1]. Sediments (silt and clay) containing toxic heavy metals, inorganic and organic sub-stances are important for studying water pollution [2]. There-fore, a multidisciplinary collaborative research is essential for understanding the processes of mechanical and chemical weathering of rocks, their products, the manner of release and consumption of CO2, and other natural processes to better understand the geochemical cycles associated with various trace elements. Based on the results of such stud-ies, it will be possible in the future to propose protection and detoxification measures of affected sediments and river waters and general protection and remediation of ecosys-tems. Considering more-lasting pollution in sediments in comparison to river water pollution, as well as adsorption of toxic elements, during last decades the interest for mor-phological and geochemical analysis of river sediments con-siderably increased, which is evident from increasing num-ber of publications of this scope in many journals. This work is a continuation of earlier studies of sediments in the area of nearby countries of Croatia and Slovenia [3- 10].
We could claim that the most polluted areas in the world are those with the densest population. It should therefore be the foremost goal of environmentalists to prevent such pollution, and to educate the population towards proper management of ecosystems [11].
The aim of the current work is to perform, for the first time, a research on mineralogical, geochemical and con-tamination status of the stream sediments (fraction <63 µm) of the rivers Drini i Bardhë, Morava e Binçës, Lepenc and Sitnica. These rivers, which belong to different watersheds, have drainage basins that cover a large area of Kosovo, be-ing as well of supra-regional interest. The sampling sites in Kosovo Rivers are, for the first time, geographically posi-
© by PSP Volume 18 – No 8. 2009 Fresenius Environmental Bulletin
1463
tioned using GIS (Geographic Information System). The results were interpreted using modern statistical methods that can be used to locate pollution sources. Locations at which anomalous element concentration values have been determined, and where certain toxic elements should be monitored and sediments possibly remediated, were high-lighted.
MATERIALS AND METHODS
Study Area
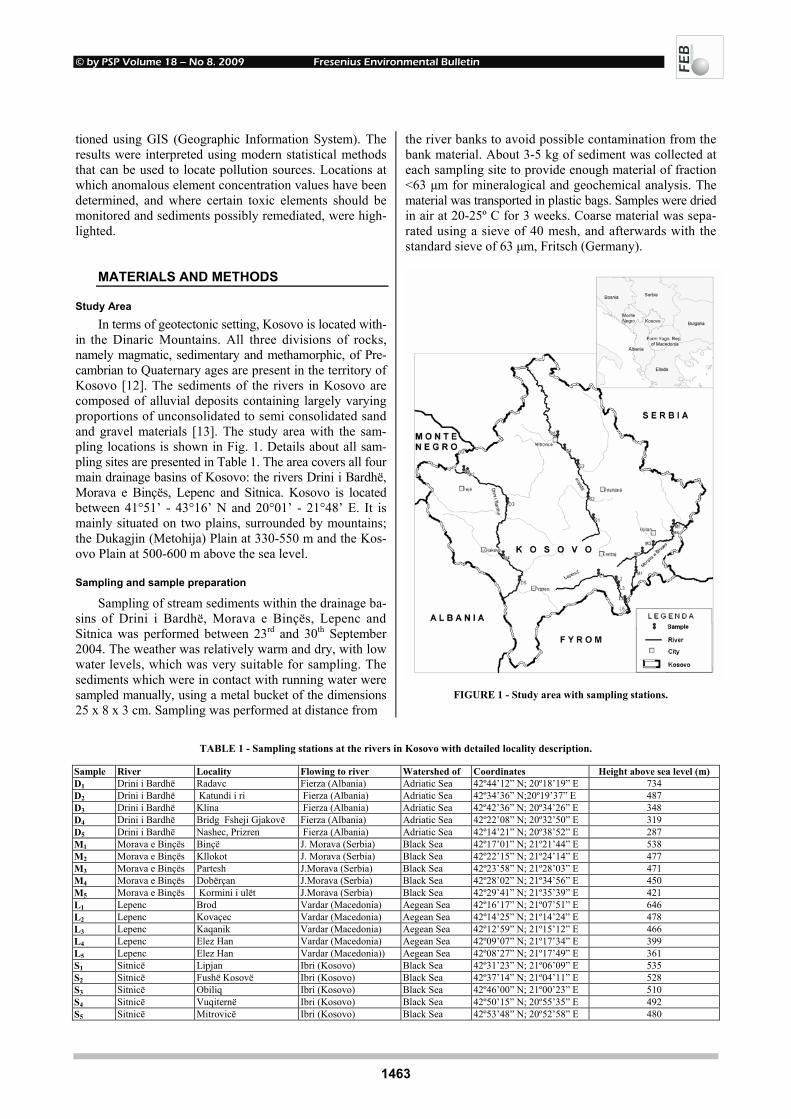
In terms of geotectonic setting, Kosovo is located with-in the Dinaric Mountains. All three divisions of rocks, namely magmatic, sedimentary and methamorphic, of Pre-cambrian to Quaternary ages are present in the territory of Kosovo [12]. The sediments of the rivers in Kosovo are composed of alluvial deposits containing largely varying proportions of unconsolidated to semi consolidated sand and gravel materials [13]. The study area with the sam-pling locations is shown in Fig. 1. Details about all sam-pling sites are presented in Table 1. The area covers all four main drainage basins of Kosovo: the rivers Drini i Bardhë, Morava e Binçës, Lepenc and Sitnica. Kosovo is located between 41°51’ - 43°16’ N and 20°01’ - 21°48’ E. It is mainly situated on two plains, surrounded by mountains; the Dukagjin (Metohija) Plain at 330-550 m and the Kos-ovo Plain at 500-600 m above the sea level.
Sampling and sample preparation
Sampling of stream sediments within the drainage ba-sins of Drini i Bardhë, Morava e Binçës, Lepenc and Sitnica was performed between 23rd and 30th September 2004. The weather was relatively warm and dry, with low water levels, which was very suitable for sampling. The sediments which were in contact with running water were sampled manually, using a metal bucket of the dimensions 25 x 8 x 3 cm. Sampling was performed at distance from
the river banks to avoid possible contamination from the bank material. About 3-5 kg of sediment was collected at each sampling site to provide enough material of fraction <63 µm for mineralogical and geochemical analysis. The material was transported in plastic bags. Samples were dried in air at 20-25º C for 3 weeks. Coarse material was sepa-rated using a sieve of 40 mesh, and afterwards with the standard sieve of 63 µm, Fritsch (Germany).
FIGURE 1 - Study area with sampling stations.
TABLE 1 - Sampling stations at the rivers in Kosovo with detailed locality description.
Sample River Locality Flowing to river Watershed of Coordinates Height above sea level (m) D1 Drini i Bardhë Radavc Fierza (Albania) Adriatic Sea 42º44’12” N; 20º18’19” E 734 D2 Drini i Bardhë Katundi i ri Fierza (Albania) Adriatic Sea 42º34’36” N;20º19’37” E 487 D3 Drini i Bardhë Klina Fierza (Albania) Adriatic Sea 42º42’36” N; 20º34’26” E 348 D4 Drini i Bardhë Bridg Fsheji Gjakovë Fierza (Albania) Adriatic Sea 42º22’08” N; 20º32’50” E 319 D5 Drini i Bardhë Nashec, Prizren Fierza (Albania) Adriatic Sea 42º14’21” N; 20º38’52” E 287 M1 Morava e Binçës Binçë J. Morava (Serbia) Black Sea 42º17’01” N; 21º21’44” E 538 M2 Morava e Binçës Kllokot J. Morava (Serbia) Black Sea 42º22’15” N; 21º24’14” E 477 M3 Morava e Binçës Partesh J.Morava (Serbia) Black Sea 42º23’58” N; 21º28’03” E 471 M4 Morava e Binçës Dobërçan J.Morava (Serbia) Black Sea 42º28’02” N; 21º34’56” E 450 M5 Morava e Binçës Kormini i ulët J.Morava (Serbia) Black Sea 42º29’41” N; 21º35’39” E 421 L1 Lepenc Brod Vardar (Macedonia) Aegean Sea 42º16’17” N; 21º07’51” E 646 L2 Lepenc Kovaçec Vardar (Macedonia) Aegean Sea 42º14’25” N; 21º14’24” E 478 L3 Lepenc Kaqanik Vardar (Macedonia) Aegean Sea 42º12’59” N; 21º15’12” E 466 L4 Lepenc Elez Han Vardar (Macedonia) Aegean Sea 42º09’07” N; 21º17’34” E 399 L5 Lepenc Elez Han Vardar (Macedonia)) Aegean Sea 42º08’27” N; 21º17’49” E 361 S1 Sitnicë Lipjan Ibri (Kosovo) Black Sea 42º31’23” N; 21º06’09” E 535 S2 Sitnicë Fushë Kosovë Ibri (Kosovo) Black Sea 42º37’14” N; 21º04’11” E 528 S3 Sitnicë Obiliq Ibri (Kosovo) Black Sea 42º46’00” N; 21º00’23” E 510 S4 Sitnicë Vuqiternë Ibri (Kosovo) Black Sea 42º50’15” N; 20º55’35” E 492 S5 Sitnicë Mitrovicë Ibri (Kosovo) Black Sea 42º53’48” N; 20º52’58” E 480
© by PSP Volume 18 – No 8. 2009 Fresenius Environmental Bulletin
1464
Determination of mineralogical composition
Mineralogical composition was determined by the XRD method, using a Philips PW 1050 X-ray diffractometer with a proportional counter and Cu-Kα irradiation at the Fac-ulty of Mining and Geology in Sofia, Bulgaria. For inter-pretation, Powder Diffraction File [14] was used. Minera-logical composition was determined semi-quantitatively as described by Boldrin et al. [15].
Geochemical characterization
Determination of major elements in stream sediments (fraction <63 µm) was performed in commercial laboratory ACTLABS, Ontario, Canada, using FUS-XRF method and equipment for irradiation beam (WDS, XRF, ARL 8410) as well as program 4C. Concentrations are expressed as per-centages of the corresponding oxides. Following standards were used: DNC-1, W2, SY-3, SGR-1 and BE-N.
Multielemental analysis of the samples (<63 µm) by ICP-MS was carried out by ACTLABS laboratory with the program “Ultratrace 2”. The procedure was as follows: 0.5 g of sample was dissolved in aqua regia at 90 ºC in a micro-wave digestion unit. The solution was diluted and analyzed with a Perkin Elmer SCIEX ELAN 6100 ICP-MS instru-ment. For analysis, the following reference materials were used: USGS GXR-1, GXR-2, GXR-4 and GXR-6, which were analyzed at the beginning and after each series of samples. Elements Ti, P and S were analyzed with ICP-OES (Inductively Coupled Plasma Optical Emission Spectrome-try) using a Perkin Elmer OPTIMA 3000 ICP spectropho-tometer.
Although this digestion is not total, its use is justified because the international standard methods for determin-ing action limits are based on aqua regia leach [16].
Mercury was determined also in ACTLABS, using the same solution as prepared from the sediment fraction <63 µm for ICP-MS analysis. The program 1G-Hg-CV was used as well as international standards SO-2, GXR-4, GXR-2 and GXR-1. Determination was performed using CV-AAS method (Cold Vapor Atomic Adsorption Spectrome-try). Hg was oxidized in the solution till the state of stable divalent ions has been reached. Their concentration was determined using Hg vapor, which is adsorbed at the wave-length of 253.7 nm, along with the reducing of Hg (II) in evaporating state (Hg0), using SnCl2. Argon was run through the mixture of the sample and the reducing solution, which transported Hg atoms into adsorption cell situated in beam of atomic adsorption spectrophotometer. According to
Beer’s law, adsorbed emission intensity is proportional to the concentration of Hg atoms in emission beam of
λ = 253.7 nm.
Statistical methods
Program Statistica 6.0 [17] has been used for all sta-tistical calculations in this work: cluster analysis of Q-modality, determination of basic statistical parameters and anomalies (extremes and outliers).
RESULTS
Mineralogical composition
Results of semi-quantitative mineralogical analysis of the selected sediment samples (fraction <63 µm) are pre-sented in Table 2. Quartz is the most abundant mineral, followed by different minerals from feldspar group (albite, microcline, plagioclase), mica group (muscovite, biotite), chlorite group, calcite group and hornblende group (am-phibole).
XRF analysis of major components
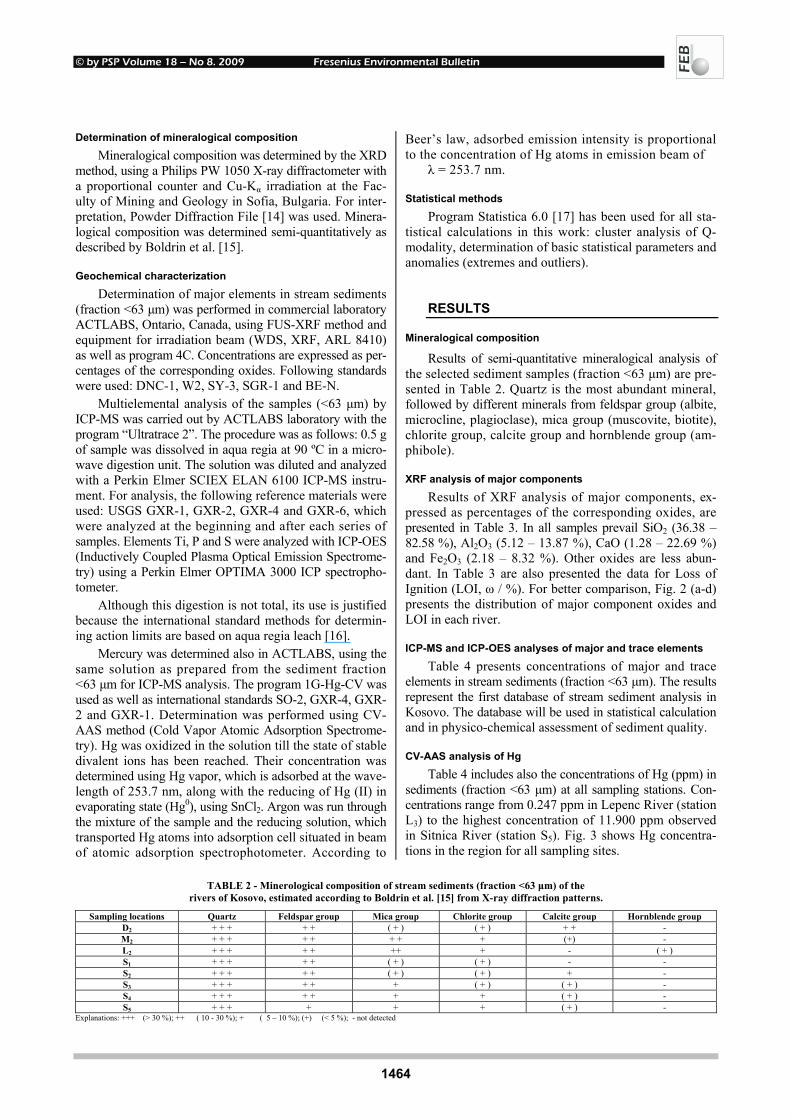
Results of XRF analysis of major components, ex-pressed as percentages of the corresponding oxides, are presented in Table 3. In all samples prevail SiO2 (36.38 – 82.58 %), Al2O3 (5.12 – 13.87 %), CaO (1.28 – 22.69 %) and Fe2O3 (2.18 – 8.32 %). Other oxides are less abun-dant. In Table 3 are also presented the data for Loss of Ignition (LOI, ω / %). For better comparison, Fig. 2 (a-d) presents the distribution of major component oxides and LOI in each river.
ICP-MS and ICP-OES analyses of major and trace elements
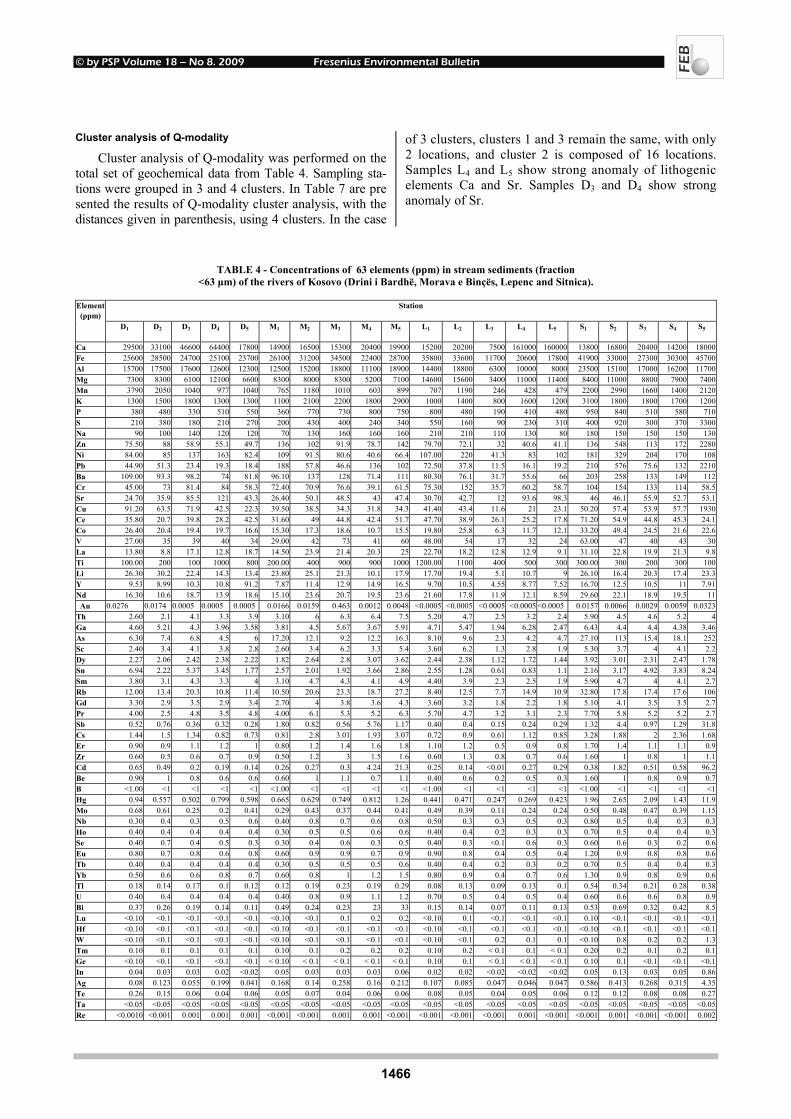
Table 4 presents concentrations of major and trace elements in stream sediments (fraction <63 µm). The results represent the first database of stream sediment analysis in Kosovo. The database will be used in statistical calculation and in physico-chemical assessment of sediment quality.
CV-AAS analysis of Hg
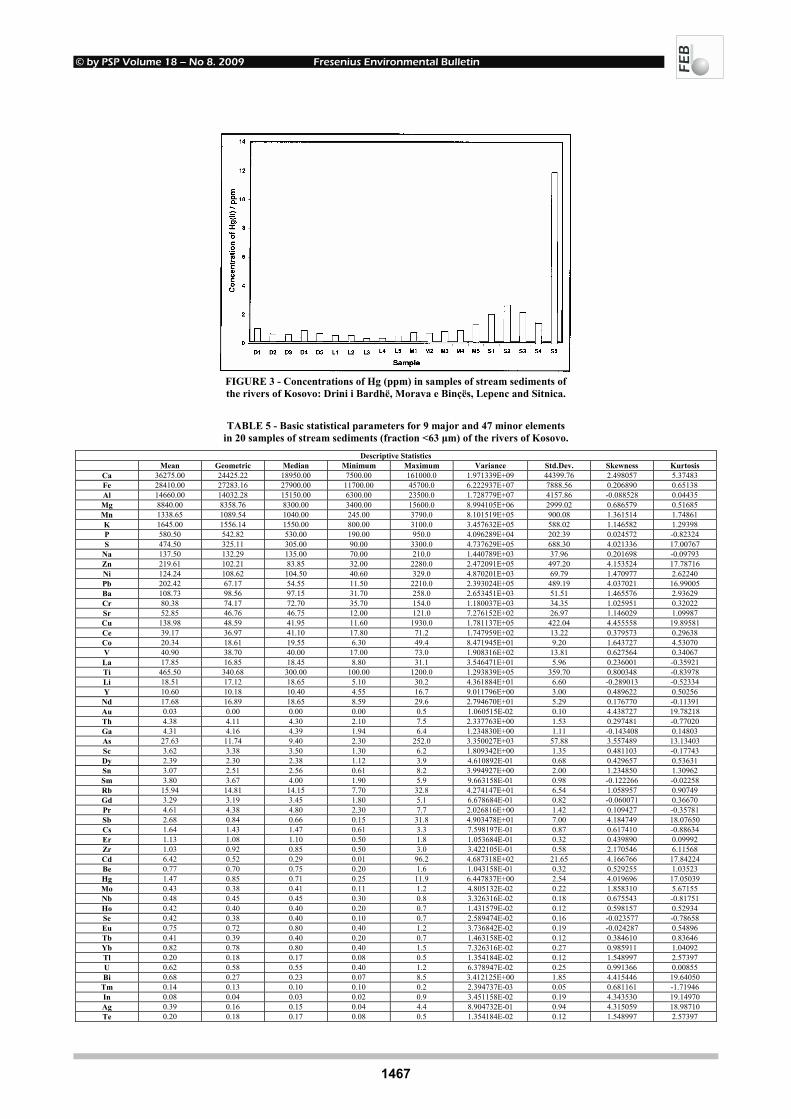
Table 4 includes also the concentrations of Hg (ppm) in sediments (fraction <63 µm) at all sampling stations. Con-centrations range from 0.247 ppm in Lepenc River (station L3) to the highest concentration of 11.900 ppm observed in Sitnica River (station S5). Fig. 3 shows Hg concentra-tions in the region for all sampling sites.
TABLE 2 - Minerological composition of stream sediments (fraction <63 µm) of the
rivers of Kosovo, estimated according to Boldrin et al. [15] from X-ray diffraction patterns.
Sampling locations Quartz Feldspar group Mica group Chlorite group Calcite group Hornblende group D2 + + + + + ( + ) ( + ) + + - M2 + + + + + + + + (+) - L2 + + + + + ++ + - ( + )
S1 + + + + + ( + ) ( + ) - - S2 + + + + + ( + ) ( + ) + - S3 + + + + + + ( + ) ( + ) - S4 + + + + + + + ( + ) - S5 + + + + + + ( + ) -
Explanations: +++ (> 30 %); ++ ( 10 - 30 %); + ( 5 – 10 %); (+) (< 5 %); - not detected
© by PSP Volume 18 – No 8. 2009 Fresenius Environmental Bulletin
1465
TABLE 3 - Results of XRF analysis of major components of sediments (fraction <µm) of the rivers Drini i Bardhë, Morava e Binçës, Lepenc and Sitnica, expressed as weight % of oxides.
Station
SiO2 %
Al2O3 %
Fe2O3 %
MnO %
MgO %
CaO %
Na2O %
K2O %
TiO2 %
P2O5 %
Cr2O3 %
LOI* %
Total %
D1 64.43 11.19 4.57 0.556 1.89 4.45 0.81 2.11 0.58 0.13 0.03 7.340 98.09 D2 58.11 11.59 4.85 0.280 1.92 4.79 0.95 1.97 0.67 0.16 0.02 11.770 97.08 D3 62.03 10.05 4.27 0.133 1.40 6.27 1.20 1.50 0.67 0.11 0.07 10.420 98.12 D4 56.27 9.10 4.66 0.141 2.77 9.80 1.72 1.14 0.64 0.17 0.21 11.480 98.11 D5 70.53 9.31 4.25 0.147 1.65 2.99 2.07 1.11 0.71 0.17 0.08 5.096 98.11 M1 65.95 11.86 4.73 0.107 1.98 2.54 1.67 1.93 0.87 0.13 0.04 7.569 99.38 M2 61.04 12.78 5.31 0.164 1.80 2.84 1.78 2.45 0.91 0.24 0.04 8.482 97.85 M3 58.52 13.37 6.15 0.162 2.34 3.35 2.06 2.14 1.03 0.23 0.04 8.804 98.20 M4 63.64 12.80 4.46 0.121 1.47 4.07 2.85 2.26 0.89 0.23 0.02 4.926 97.74 M5 58.51 13.87 5.55 0.154 1.88 4.10 2.38 2.30 1.01 0.24 0.02 7.506 97.52 L1 59.57 12.52 7.90 0.152 3.49 3.45 2.31 1.66 1.40 0.26 0.18 5.306 98.20 L2 58.86 12.35 6.99 0.187 4.00 3.80 1.74 1.66 0.96 0.16 0.10 7.729 98.54 L3 82.58 5.12 2.18 0.048 0.76 1.28 0.87 0.83 0.70 0.06 0.04 2.901 97.37 L4 41.32 6.98 3.42 0.078 2.12 21.12 0.85 0.92 0.63 0.13 0.03 20.010 97.61 L5 36.38 6.74 3.60 0.088 2.56 22.69 0.82 0.92 0.62 0.16 0.04 21.830 96.45 S1 61.13 12.34 6.44 0.289 1.77 2.21 1.14 1.81 0.77 0.30 0.04 9.780 98.02 S2 64.08 9.35 5.79 0.384 2.49 2.73 1.09 1.37 0.76 0.27 0.27 8.414 97.00 S3 62.21 11.80 5.13 0.217 2.05 3.33 1.26 1.70 0.76 0.17 0.06 9.304 97.99 S4 63.67 12.03 5.12 0.191 1.73 2.66 1.45 1.75 0.82 0.19 0.06 8.042 97.71 S5 61.37 11.47 8.32 0.285 1.49 2.79 0.86 1.92 0.67 0.27 0.05 8.394 7.75
* LOI - loss upon ignition at 900° C
0
10
20
30
40
50
60
70
80
SiO2 Al2O3 Fe2O3 MnO MgO CaO Na2O K2O TiO2 P2O5 Cr2O3 LOI*
Wei
ght /
%
D1
D2
D3
D4
D5
(a)
0
10
20
30
40
50
60
70
80
90
SiO2 Al2O3 Fe2O3 MnO MgO CaO Na2O K2O TiO2 P2O5 Cr2O3 LOI*
Wei
ght /
%
L1
L2
L3
L4
L5
(c)
0
10
20
30
40
50
60
70
SiO2 Al2O3 Fe2O3 MnO MgO CaO Na2O K2O TiO2 P2O5 Cr2O3 LOI*
Wei
ght /
%
M1
M2
M3
M4
M5
(b)
0
10
20
30
40
50
60
70
SiO2 Al2O3 Fe2O3 MnO MgO CaO Na2O K2O TiO2 P2O5 Cr2O3 LOI*
Wei
ght /
%
S1
S2
S3
S4
S5
(d)
FIGURE 2 - Distribution of oxides and of LOI (in %) in stream sediments of rivers Drini i Bardhë (a), Morava e Binçës (b), Lepenc (c) and Sitnica (d).
STATISTICAL ANALYSIS Determination of basic statistical parameters
Table 5 presents basic statistical parameters for 56 ele-ments in 20 samples of stream sediments (fraction <63 µm) which can be considered as preliminary values until a lar-ger dataset has been collected. For each element, the val-ues are given as arithmetic mean, geometric mean, median,
minimal and maximal concentration, variance, standard deviation, skewness and curtosis.
Determination of anomalies (extremes and outliers)
Table 6 presents the identified anomalous geochemi-cal data (extremes and outliers) both for the toxic and lithogenic elements, using experimental data from Table 4 and box plot approach [18].
© by PSP Volume 18 – No 8. 2009 Fresenius Environmental Bulletin
1466
Cluster analysis of Q-modality
Cluster analysis of Q-modality was performed on the total set of geochemical data from Table 4. Sampling sta-tions were grouped in 3 and 4 clusters. In Table 7 are pre sented the results of Q-modality cluster analysis, with the distances given in parenthesis, using 4 clusters. In the case
of 3 clusters, clusters 1 and 3 remain the same, with only 2 locations, and cluster 2 is composed of 16 locations. Samples L4 and L5 show strong anomaly of lithogenic elements Ca and Sr. Samples D3 and D4 show strong anomaly of Sr.
TABLE 4 - Concentrations of 63 elements (ppm) in stream sediments (fraction <63 µm) of the rivers of Kosovo (Drini i Bardhë, Morava e Binçës, Lepenc and Sitnica).
Station
Element (ppm)
D1
D2
D3
D4
D5
M1
M2
M3
M4
M5
L1
L2
L3
L4
L5
S1
S2
S3
S4
S5
Ca 29500 33100 46600 64400 17800 14900 16500 15300 20400 19900 15200 20200 7500 161000 160000 13800 16800 20400 14200 18000Fe 25600 28500 24700 25100 23700 26100 31200 34500 22400 28700 35800 33600 11700 20600 17800 41900 33000 27300 30300 45700Al 15700 17500 17600 12600 12300 12500 15200 18800 11100 18900 14400 18800 6300 10000 8000 23500 15100 17000 16200 11700Mg 7300 8300 6100 12100 6600 8300 8000 8300 5200 7100 14600 15600 3400 11000 11400 8400 11000 8800 7900 7400Mn 3790 2050 1040 977 1040 765 1180 1010 603 899 707 1190 246 428 479 2200 2990 1660 1400 2120K 1300 1500 1800 1300 1300 1100 2100 2200 1800 2900 1000 1400 800 1600 1200 3100 1800 1800 1700 1200P 380 480 330 510 550 360 770 730 800 750 800 480 190 410 480 950 840 510 580 710S 210 380 180 210 270 200 430 400 240 340 550 160 90 230 310 400 920 300 370 3300Na 90 100 140 120 120 70 130 160 160 160 210 210 110 130 80 180 150 150 150 130Zn 75.50 88 58.9 55.1 49.7 136 102 91.9 78.7 142 79.70 72.1 32 40.6 41.1 136 548 113 172 2280Ni 84.00 85 137 163 82.4 109 91.5 80.6 40.6 66.4 107.00 220 41.3 83 102 181 329 204 170 108Pb 44.90 51.3 23.4 19.3 18.4 188 57.8 46.6 136 102 72.50 37.8 11.5 16.1 19.2 210 576 75.6 132 2210Ba 109.00 93.3 98.2 74 81.8 96.10 137 128 71.4 111 80.30 76.1 31.7 55.6 66 203 258 133 149 112Cr 45.00 73 81.4 84 58.3 72.40 70.9 76.6 39.1 61.5 75.30 152 35.7 60.2 58.7 104 154 133 114 58.5Sr 24.70 35.9 85.5 121 43.3 26.40 50.1 48.5 43 47.4 30.70 42.7 12 93.6 98.3 46 46.1 55.9 52.7 53.1Cu 91.20 63.5 71.9 42.5 22.3 39.50 38.5 34.3 31.8 34.3 41.40 43.4 11.6 21 23.1 50.20 57.4 53.9 57.7 1930Ce 35.80 20.7 39.8 28.2 42.5 31.60 49 44.8 42.4 51.7 47.70 38.9 26.1 25.2 17.8 71.20 54.9 44.8 45.3 24.1Co 26.40 20.4 19.4 19.7 16.6 15.30 17.3 18.6 10.7 15.5 19.80 25.8 6.3 11.7 12.1 33.20 49.4 24.5 21.6 22.6V 27.00 35 39 40 34 29.00 42 73 41 60 48.00 54 17 32 24 63.00 47 40 43 30La 13.80 8.8 17.1 12.8 18.7 14.50 23.9 21.4 20.3 25 22.70 18.2 12.8 12.9 9.1 31.10 22.8 19.9 21.3 9.8Ti 100.00 200 100 1000 800 200.00 400 900 900 1000 1200.00 1100 400 500 300 300.00 300 200 300 100Li 26.30 30.2 22.4 14.3 13.4 23.80 25.1 21.3 10.1 17.9 17.70 19.4 5.1 10.7 9 26.10 16.4 20.3 17.4 23.3Y 9.53 8.99 10.3 10.8 91.2 7.87 11.4 12.9 14.9 16.5 9.70 10.5 4.55 8.77 7.52 16.70 12.5 10.5 11 7.91Nd 16.30 10.6 18.7 13.9 18.6 15.10 23.6 20.7 19.5 23.6 21.60 17.8 11.9 12.1 8.59 29.60 22.1 18.9 19.5 11 Au 0.0276 0.0174 0.0005 0.0005 0.0005 0.0166 0.0159 0.463 0.0012 0.0048 <0.0005 <0.0005 <0.0005 <0.0005 <0.0005 0.0157 0.0066 0.0029 0.0059 0.0323Th 2.60 2.1 4.1 3.3 3.9 3.10 6 6.3 6.4 7.5 5.20 4.7 2.5 3.2 2.4 5.90 4.5 4.6 5.2 4Ga 4.60 5.21 4.3 3.96 3.58 3.81 4.5 5.67 3.67 5.91 4.71 5.47 1.94 6.28 2.47 6.43 4.4 4.4 4.38 3.46As 6.30 7.4 6.8 4.5 6 17.20 12.1 9.2 12.2 16.3 8.10 9.6 2.3 4.2 4.7 27.10 113 15.4 18.1 252Sc 2.40 3.4 4.1 3.8 2.8 2.60 3.4 6.2 3.3 5.4 3.60 6.2 1.3 2.8 1.9 5.30 3.7 4 4.1 2.2Dy 2.27 2.06 2.42 2.38 2.22 1.82 2.64 2.8 3.07 3.62 2.44 2.38 1.12 1.72 1.44 3.92 3.01 2.31 2.47 1.78Sn 6.94 2.22 5.37 3.45 1.77 2.57 2.01 1.92 3.66 2.86 2.55 1.28 0.61 0.83 1.1 2.16 3.17 4.92 3.83 8.24Sm 3.80 3.1 4.3 3.3 4 3.10 4.7 4.3 4.1 4.9 4.40 3.9 2.3 2.5 1.9 5.90 4.7 4 4.1 2.7Rb 12.00 13.4 20.3 10.8 11.4 10.50 20.6 23.3 18.7 27.2 8.40 12.5 7.7 14.9 10.9 32.80 17.8 17.4 17.6 106Gd 3.30 2.9 3.5 2.9 3.4 2.70 4 3.8 3.6 4.3 3.60 3.2 1.8 2.2 1.8 5.10 4.1 3.5 3.5 2.7Pr 4.00 2.5 4.8 3.5 4.8 4.00 6.1 5.3 5.2 6.3 5.70 4.7 3.2 3.1 2.3 7.70 5.8 5.2 5.2 2.7Sb 0.52 0.76 0.36 0.32 0.28 1.80 0.82 0.56 5.76 1.17 0.40 0.4 0.15 0.24 0.29 1.32 4.4 0.97 1.29 31.8Cs 1.44 1.5 1.34 0.82 0.73 0.81 2.8 3.01 1.93 3.07 0.72 0.9 0.61 1.12 0.85 3.28 1.88 2 2.36 1.68Er 0.90 0.9 1.1 1.2 1 0.80 1.2 1.4 1.6 1.8 1.10 1.2 0.5 0.9 0.8 1.70 1.4 1.1 1.1 0.9Zr 0.60 0.5 0.6 0.7 0.9 0.50 1.2 3 1.5 1.6 0.60 1.3 0.8 0.7 0.6 1.60 1 0.8 1 1.1Cd 0.65 0.49 0.2 0.19 0.14 0.26 0.27 0.3 4.24 21.3 0.25 0.14 <0.01 0.27 0.29 0.38 1.82 0.51 0.58 96.2Be 0.90 1 0.8 0.6 0.6 0.60 1 1.1 0.7 1.1 0.40 0.6 0.2 0.5 0.3 1.60 1 0.8 0.9 0.7B <1.00 <1 <1 <1 <1 <1.00 <1 <1 <1 <1 <1.00 <1 <1 <1 <1 <1.00 <1 <1 <1 <1Hg 0.94 0.557 0.502 0.799 0.598 0.665 0.629 0.749 0.812 1.26 0.441 0.471 0.247 0.269 0.423 1.96 2.65 2.09 1.43 11.9Mo 0.68 0.61 0.25 0.2 0.41 0.29 0.43 0.37 0.44 0.41 0.49 0.39 0.11 0.24 0.24 0.50 0.48 0.47 0.39 1.15Nb 0.30 0.4 0.3 0.5 0.6 0.40 0.8 0.7 0.6 0.8 0.50 0.3 0.3 0.5 0.3 0.80 0.5 0.4 0.3 0.3Ho 0.40 0.4 0.4 0.4 0.4 0.30 0.5 0.5 0.6 0.6 0.40 0.4 0.2 0.3 0.3 0.70 0.5 0.4 0.4 0.3Se 0.40 0.7 0.4 0.5 0.3 0.30 0.4 0.6 0.3 0.5 0.40 0.3 <0.1 0.6 0.3 0.60 0.6 0.3 0.2 0.6Eu 0.80 0.7 0.8 0.6 0.8 0.60 0.9 0.9 0.7 0.9 0.90 0.8 0.4 0.5 0.4 1.20 0.9 0.8 0.8 0.6Tb 0.40 0.4 0.4 0.4 0.4 0.30 0.5 0.5 0.5 0.6 0.40 0.4 0.2 0.3 0.2 0.70 0.5 0.4 0.4 0.3Yb 0.50 0.6 0.6 0.8 0.7 0.60 0.8 1 1.2 1.5 0.80 0.9 0.4 0.7 0.6 1.30 0.9 0.8 0.9 0.6Tl 0.18 0.14 0.17 0.1 0.12 0.12 0.19 0.23 0.19 0.29 0.08 0.13 0.09 0.13 0.1 0.54 0.34 0.21 0.28 0.38U 0.40 0.4 0.4 0.4 0.4 0.40 0.8 0.9 1.1 1.2 0.70 0.5 0.4 0.5 0.4 0.60 0.6 0.6 0.8 0.9Bi 0.37 0.26 0.19 0.14 0.11 0.49 0.24 0.23 23 33 0.15 0.14 0.07 0.11 0.13 0.53 0.69 0.32 0.42 8.5Lu <0.10 <0.1 <0.1 <0.1 <0.1 <0.10 <0.1 0.1 0.2 0.2 <0.10 0.1 <0.1 <0.1 <0.1 0.10 <0.1 <0.1 <0.1 <0.1Hf <0.10 <0.1 <0.1 <0.1 <0.1 <0.10 <0.1 <0.1 <0.1 <0.1 <0.10 <0.1 <0.1 <0.1 <0.1 <0.10 <0.1 <0.1 <0.1 <0.1W <0.10 <0.1 <0.1 <0.1 <0.1 <0.10 <0.1 <0.1 <0.1 <0.1 <0.10 <0.1 0.2 0.1 0.1 <0.10 0.8 0.2 0.2 1.3Tm 0.10 0.1 0.1 0.1 0.1 0.10 0.1 0.2 0.2 0.2 0.10 0.2 < 0.1 0.1 < 0.1 0.20 0.2 0.1 0.2 0.1Ge <0.10 <0.1 <0.1 <0.1 <0.1 < 0.10 < 0.1 < 0.1 < 0.1 < 0.1 0.10 0.1 < 0.1 < 0.1 < 0.1 0.10 0.1 <0.1 <0.1 <0.1In 0.04 0.03 0.03 0.02 <0.02 0.05 0.03 0.03 0.03 0.06 0.02 0.02 <0.02 <0.02 <0.02 0.05 0.13 0.03 0.05 0.86Ag 0.08 0.123 0.055 0.199 0.041 0.168 0.14 0.258 0.16 0.212 0.107 0.085 0.047 0.046 0.047 0.586 0.413 0.268 0.315 4.35Te 0.26 0.15 0.06 0.04 0.06 0.05 0.07 0.04 0.06 0.06 0.08 0.05 0.04 0.05 0.06 0.12 0.12 0.08 0.08 0.27Ta <0.05 <0.05 <0.05 <0.05 <0.05 <0.05 <0.05 <0.05 <0.05 <0.05 <0.05 <0.05 <0.05 <0.05 <0.05 <0.05 <0.05 <0.05 <0.05 <0.05Re <0.0010 <0.001 0.001 0.001 0.001 <0.001 <0.001 0.001 0.001 <0.001 <0.001 <0.001 <0.001 0.001 <0.001 <0.001 0.001 <0.001 <0.001 0.002
© by PSP Volume 18 – No 8. 2009 Fresenius Environmental Bulletin
1467
FIGURE 3 - Concentrations of Hg (ppm) in samples of stream sediments of the rivers of Kosovo: Drini i Bardhë, Morava e Binçës, Lepenc and Sitnica.
TABLE 5 - Basic statistical parameters for 9 major and 47 minor elements in 20 samples of stream sediments (fraction <63 µm) of the rivers of Kosovo.
Descriptive Statistics Mean Geometric Median Minimum Maximum Variance Std.Dev. Skewness Kurtosis
Ca 36275.00 24425.22 18950.00 7500.00 161000.0 1.971339E+09 44399.76 2.498057 5.37483 Fe 28410.00 27283.16 27900.00 11700.00 45700.0 6.222937E+07 7888.56 0.206890 0.65138 Al 14660.00 14032.28 15150.00 6300.00 23500.0 1.728779E+07 4157.86 -0.088528 0.04435 Mg 8840.00 8358.76 8300.00 3400.00 15600.0 8.994105E+06 2999.02 0.686579 0.51685 Mn 1338.65 1089.54 1040.00 245.00 3790.0 8.101519E+05 900.08 1.361514 1.74861 K 1645.00 1556.14 1550.00 800.00 3100.0 3.457632E+05 588.02 1.146582 1.29398 P 580.50 542.82 530.00 190.00 950.0 4.096289E+04 202.39 0.024572 -0.82324 S 474.50 325.11 305.00 90.00 3300.0 4.737629E+05 688.30 4.021336 17.00767
Na 137.50 132.29 135.00 70.00 210.0 1.440789E+03 37.96 0.201698 -0.09793 Zn 219.61 102.21 83.85 32.00 2280.0 2.472091E+05 497.20 4.153524 17.78716 Ni 124.24 108.62 104.50 40.60 329.0 4.870201E+03 69.79 1.470977 2.62240 Pb 202.42 67.17 54.55 11.50 2210.0 2.393024E+05 489.19 4.037021 16.99005 Ba 108.73 98.56 97.15 31.70 258.0 2.653451E+03 51.51 1.465576 2.93629 Cr 80.38 74.17 72.70 35.70 154.0 1.180037E+03 34.35 1.025951 0.32022 Sr 52.85 46.76 46.75 12.00 121.0 7.276152E+02 26.97 1.146029 1.09987 Cu 138.98 48.59 41.95 11.60 1930.0 1.781137E+05 422.04 4.455558 19.89581 Ce 39.17 36.97 41.10 17.80 71.2 1.747959E+02 13.22 0.379573 0.29638 Co 20.34 18.61 19.55 6.30 49.4 8.471945E+01 9.20 1.643727 4.53070 V 40.90 38.70 40.00 17.00 73.0 1.908316E+02 13.81 0.627564 0.34067 La 17.85 16.85 18.45 8.80 31.1 3.546471E+01 5.96 0.236001 -0.35921 Ti 465.50 340.68 300.00 100.00 1200.0 1.293839E+05 359.70 0.800348 -0.83978 Li 18.51 17.12 18.65 5.10 30.2 4.361884E+01 6.60 -0.289013 -0.52334 Y 10.60 10.18 10.40 4.55 16.7 9.011796E+00 3.00 0.489622 0.50256
Nd 17.68 16.89 18.65 8.59 29.6 2.794670E+01 5.29 0.176770 -0.11391 Au 0.03 0.00 0.00 0.00 0.5 1.060515E-02 0.10 4.438727 19.78218 Th 4.38 4.11 4.30 2.10 7.5 2.337763E+00 1.53 0.297481 -0.77020 Ga 4.31 4.16 4.39 1.94 6.4 1.234830E+00 1.11 -0.143408 0.14803 As 27.63 11.74 9.40 2.30 252.0 3.350027E+03 57.88 3.557489 13.13403 Sc 3.62 3.38 3.50 1.30 6.2 1.809342E+00 1.35 0.481103 -0.17743 Dy 2.39 2.30 2.38 1.12 3.9 4.610892E-01 0.68 0.429657 0.53631 Sn 3.07 2.51 2.56 0.61 8.2 3.994927E+00 2.00 1.234850 1.30962 Sm 3.80 3.67 4.00 1.90 5.9 9.663158E-01 0.98 -0.122266 -0.02258 Rb 15.94 14.81 14.15 7.70 32.8 4.274147E+01 6.54 1.058957 0.90749 Gd 3.29 3.19 3.45 1.80 5.1 6.678684E-01 0.82 -0.060071 0.36670 Pr 4.61 4.38 4.80 2.30 7.7 2.026816E+00 1.42 0.109427 -0.35781 Sb 2.68 0.84 0.66 0.15 31.8 4.903478E+01 7.00 4.184749 18.07650 Cs 1.64 1.43 1.47 0.61 3.3 7.598197E-01 0.87 0.617410 -0.88634 Er 1.13 1.08 1.10 0.50 1.8 1.053684E-01 0.32 0.439890 0.09992 Zr 1.03 0.92 0.85 0.50 3.0 3.422105E-01 0.58 2.170546 6.11568 Cd 6.42 0.52 0.29 0.01 96.2 4.687318E+02 21.65 4.166766 17.84224 Be 0.77 0.70 0.75 0.20 1.6 1.043158E-01 0.32 0.529255 1.03523 Hg 1.47 0.85 0.71 0.25 11.9 6.447837E+00 2.54 4.019696 17.05039 Mo 0.43 0.38 0.41 0.11 1.2 4.805132E-02 0.22 1.858310 5.67155 Nb 0.48 0.45 0.45 0.30 0.8 3.326316E-02 0.18 0.675543 -0.81751 Ho 0.42 0.40 0.40 0.20 0.7 1.431579E-02 0.12 0.598157 0.52934 Se 0.42 0.38 0.40 0.10 0.7 2.589474E-02 0.16 -0.023577 -0.78658 Eu 0.75 0.72 0.80 0.40 1.2 3.736842E-02 0.19 -0.024287 0.54896 Tb 0.41 0.39 0.40 0.20 0.7 1.463158E-02 0.12 0.384610 0.83646 Yb 0.82 0.78 0.80 0.40 1.5 7.326316E-02 0.27 0.985911 1.04092 Tl 0.20 0.18 0.17 0.08 0.5 1.354184E-02 0.12 1.548997 2.57397 U 0.62 0.58 0.55 0.40 1.2 6.378947E-02 0.25 0.991366 0.00855 Bi 0.68 0.27 0.23 0.07 8.5 3.412125E+00 1.85 4.415446 19.64050
Tm 0.14 0.13 0.10 0.10 0.2 2.394737E-03 0.05 0.681161 -1.71946 In 0.08 0.04 0.03 0.02 0.9 3.451158E-02 0.19 4.343530 19.14970 Ag 0.39 0.16 0.15 0.04 4.4 8.904732E-01 0.94 4.315059 18.98710 Te 0.20 0.18 0.17 0.08 0.5 1.354184E-02 0.12 1.548997 2.57397

© by PSP Volume 18 – No 8. 2009 Fresenius Environmental Bulletin
1468
TABLE 6 - Samples of stream sediments of the rivers of Kosovo (fraction < 63 µm) with anomalous values (extremes
and outliers) of concentrations for particular elements (ppm).
Sample Extremes of elements (¤) (ppm) Outliers of elements (o) (ppm) D1 -
- -
Mn ( 3790.0 ) Sn ( 6.94 ) Te (0.26 )
D2 - - D3 - Sr ( 85.5 ) D4 Sr (121.0 ) Ca (64400.0 ) D5 - - M1 - - M2 - - M3 Au ( 0.463 )
- -
V ( 73.0 ) Sc ( 6.2 ) Zr (3.0)
M4 Cd ( 4.24 ) Sb ( 5.76 )
- -
M5 Cd ( 21.3 ) -
K ( 2900.0 ) Y (18.5 ) Yb (1.5 )
L1 - - L2 - Sc ( 6.2 )
Cr ( 152.0 ) L3 - - L4 Ca (161000.0 ) Sr ( 93.6 ) L5 Ca (160000.0 ) Sr ( 98.3 ) S1 -
- - - -
Y (16.7 ) Dy ( 3.91 ) Rb ( 32.8 ) Gd ( 5.1 ) Tl ( 0.54 )
K ( 3100.0 ) S2 Co (49.4 )
As ( 113.0) Cd ( 1.82 ) Pb (576.0 ) Zn ( 548.0)
Sb (4.4 )
Ni ( 329.0 ) Ba (258.0 ) Cr ( 154.0 ) Hg (2.65 ) S ( 920.0 ) In ( 0.13 )
S3 - - S4 - - S5 Au ( 0.0323 )
Ag ( 4.35 ) In ( 0.86 )
As (252.0 ) Sb ( 31.8 ) Cd ( 96.2 )
Cu (1930.0 ) Pb ( 2210.0 ) Zn ( 2280.0 ) Hg ( 11.9 ) S ( 3300.0 ) Bi ( 8.5 )
Mo ( 1.15 )
Sn ( 8.24 ) Te ( 0.27 )
- - - - - - - - -
TABLE 7 - Grouping of 20 samples of sediments
from the rivers of Kosovo by cluster analysis of Q-modality.
Clusters Samples
Cluster 1 L4 (242.9091)* L5 (242.9091)
Cluster 2
D1 (1291.178) D2 1860.526) D5 (427.5001) M1 (832.6213) M4 (518.9352) M5 (919.9263) L3 (2662.329) S3 (637.7465)
Cluster 3 D3 (1300.929) D4 (1300.929)
Cluster 4
M2 (712.0915) M3 (452.0736) L1 (715.4406) L2 (996.2620) S1 (1305.292) S2 (487.3896) S4 (842.3110) S5 (1642.505)
* In parenthesis is the distance of a cluster member (sample) from the centre of the respective cluster group.
TABLE 8 - Weathering indices A and B and compositional maturity index (M), calculated from XRF data from Table 3.
Location Index A Index B M D1 0.8651645 0.3970905 4.9259259 D2 0.8502777 0.3994819 4.7247387 D3 0.8760025 0.4716088 4.4423077 D4 0.8833782 0.5818015 2.2806236 D5 0.8917568 0.3985788 2.8010753 M1 0.8587254 0.3411111 3.7780822 M2 0.8420077 0.3561713 4.2541899 M3 0.8316969 0.3608987 3.5250000 M4 0.8505022 0.4176524 3.4861111 M5 0.8291030 0.387638 3.7957746 L1 0.8425355 0.3721163 2.4448276 L2 0.8424946 0.3682864 2.4407666 L3 0.9435377 0.3679012 3.6503067 L4 0.9019525 0.7663207 2.6599327 L5 0.9002221 0.7837664 2.2662722 S1 0.8430624 0.2948571 4.8625430 S2 0.8810735 0.3569464 2.9944134 S3 0.8530511 0.3477059 4.0785498 S4 0.8525012 0.3275573 4.3333333 S5 0.8537176 0.3268779 5.6978723
DISCUSSION
Discussion of mineralogical composition
Mineralogical analysis has shown that the most abun-dant mineral is quartz (>30%), followed by the minerals from feldspar group (10 – 30 %), except for the station S5 (5 – 10 %). Mica group, chlorite group and calcite group are less abundant (5 – 10%), except at stations M2 and L2 (10 – 30 %). Hornblende group was detected at the station L2 (<5 %). However, due to the limitation of XRD method, this hornblende group is less certain. Other sediments from Lepenc River have not been studied by XRD method. Min-eral composition of stream sediments is similar to the results obtained for sediments of Hugli River, northeast India [19].
From Table 2, one can get an idea about mineralogi-
cal maturity, which is commonly expressed by the quartz / feldspar ratio [20]. The high content of feldspars in all cases, except for S5, suggests mineralogical immaturity. Only the sediment in S5 can be considered to be submature, because lower feldspar concentrations give higher ratio of quartz to feldspar (stable to unstable mineral).
Discussion of XRF analysis
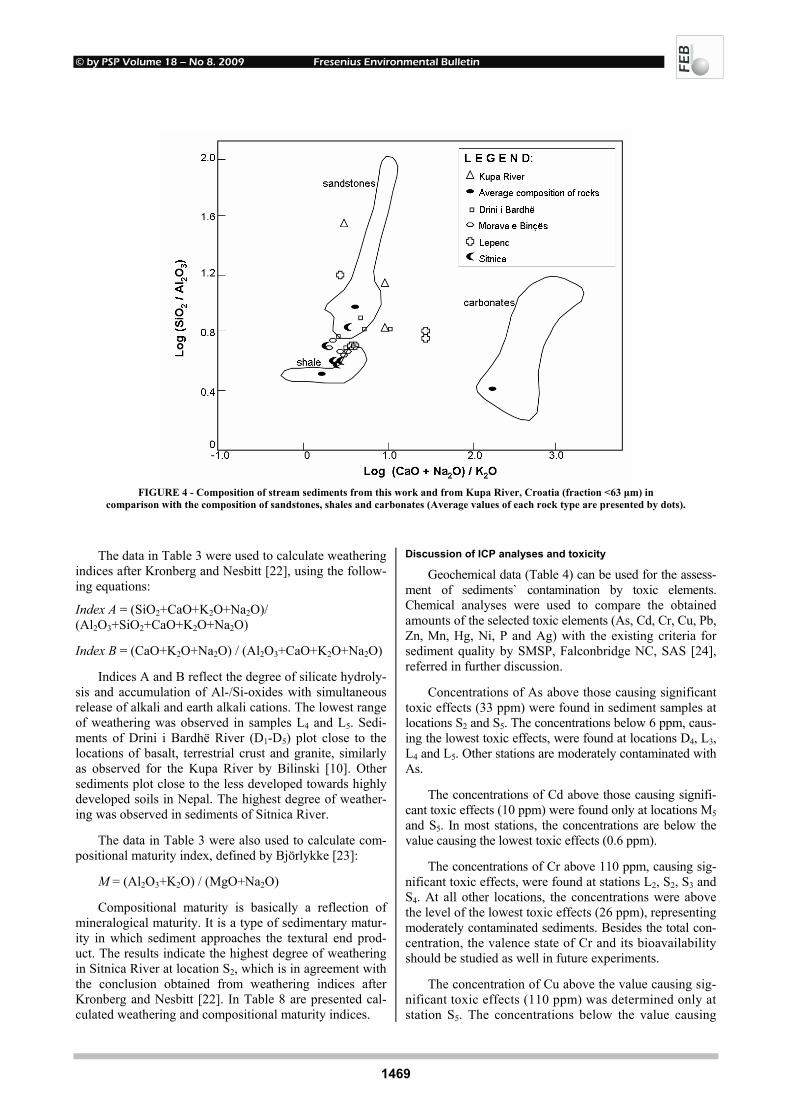
Results of XRF analysis presented in Table 3 can be used for comparison of sediment composition with average values of different rock types using the plot log (SiO2/ Al2O3) vs. log (CaO+Na2O)/K2O, which is shown in Fig. 4, a modified figure 10-2 in Prohić [21]. Samples D1–D5 plot in the region of sandstones. It has recently been reported by Bilinski [10] that Kupa River stream sediments were the weathering products of sandstones. To make comparison with the present work, data from Kupa River are presented as triangles in Fig. 4. Samples M1 – M5, L1 – L3 and S1 – S5 plot in the region between magmatic rocks and sand-stones. Samples L4 and L5 plot in the region between aver-age magmatic rocks, sandstones and carbonates.
© by PSP Volume 18 – No 8. 2009 Fresenius Environmental Bulletin
1469
FIGURE 4 - Composition of stream sediments from this work and from Kupa River, Croatia (fraction <63 µm) in
comparison with the composition of sandstones, shales and carbonates (Average values of each rock type are presented by dots).
The data in Table 3 were used to calculate weathering
indices after Kronberg and Nesbitt [22], using the follow-ing equations:
Index A = (SiO2+CaO+K2O+Na2O)/ (Al2O3+SiO2+CaO+K2O+Na2O)
Index B = (CaO+K2O+Na2O) / (Al2O3+CaO+K2O+Na2O)
Indices A and B reflect the degree of silicate hydroly-sis and accumulation of Al-/Si-oxides with simultaneous release of alkali and earth alkali cations. The lowest range of weathering was observed in samples L4 and L5. Sedi-ments of Drini i Bardhë River (D1-D5) plot close to the locations of basalt, terrestrial crust and granite, similarly as observed for the Kupa River by Bilinski [10]. Other sediments plot close to the less developed towards highly developed soils in Nepal. The highest degree of weather-ing was observed in sediments of Sitnica River.
The data in Table 3 were also used to calculate com-positional maturity index, defined by Björlykke [23]:
M = (Al2O3+K2O) / (MgO+Na2O)
Compositional maturity is basically a reflection of mineralogical maturity. It is a type of sedimentary matur-ity in which sediment approaches the textural end prod-uct. The results indicate the highest degree of weathering in Sitnica River at location S2, which is in agreement with the conclusion obtained from weathering indices after Kronberg and Nesbitt [22]. In Table 8 are presented cal-culated weathering and compositional maturity indices.
Discussion of ICP analyses and toxicity
Geochemical data (Table 4) can be used for the assess-ment of sediments` contamination by toxic elements. Chemical analyses were used to compare the obtained amounts of the selected toxic elements (As, Cd, Cr, Cu, Pb, Zn, Mn, Hg, Ni, P and Ag) with the existing criteria for sediment quality by SMSP, Falconbridge NC, SAS [24], referred in further discussion.
Concentrations of As above those causing significant toxic effects (33 ppm) were found in sediment samples at locations S2 and S5. The concentrations below 6 ppm, caus-ing the lowest toxic effects, were found at locations D4, L3, L4 and L5. Other stations are moderately contaminated with As.
The concentrations of Cd above those causing signifi-cant toxic effects (10 ppm) were found only at locations M5 and S5. In most stations, the concentrations are below the value causing the lowest toxic effects (0.6 ppm).
The concentrations of Cr above 110 ppm, causing sig-nificant toxic effects, were found at stations L2, S2, S3 and S4. At all other locations, the concentrations were above the level of the lowest toxic effects (26 ppm), representing moderately contaminated sediments. Besides the total con-centration, the valence state of Cr and its bioavailability should be studied as well in future experiments.
The concentration of Cu above the value causing sig-nificant toxic effects (110 ppm) was determined only at station S5. The concentrations below the value causing
© by PSP Volume 18 – No 8. 2009 Fresenius Environmental Bulletin
1470
minimal toxic effects (28 ppm) were found at stations D5, L3, L4 and L5. All other locations are moderately con-taminated.
The concentrations of Pb above the value of significant toxic effects (250 ppm) were present only at stations S2 and S5. Very clean environment, where the concentrations of Pb were below the value of minimal toxic effect (31 ppm), was found at locations D3, D4, D5, L3, L4 and L5. All other loca-tions are moderately contaminated with Pb.
Zn levels above the value causing significant toxic ef-fects (200 ppm) were found at stations S2 and S5. Concen-trations of Zn below 90 ppm, representing non-contami- nated sediments, were found at M4 and at all stations of Lepenc and of Drini i Bardhë rivers.
The concentrations of Mn above 1100 ppm, possibly causing significant toxic effects, were found at stations D1, D2, L2, M2 and in S1-S5. The highest concentration was found at station D1 (3790 ppm), which is significantly higher than the concentration present in average earth crust (1000 ppm) or in basalt (1700 ppm). Concentration of Mn measured at D1 is higher than that found in the eastern part of the Kupa River drainage basin by Frančišković-Bilinski [5, 7], where the influence of mining was observed. This highest value of Mn at D1 is supposed to come from ore mineralization. The concentrations below the lowest toxic effects (460 ppm) were found only at stations L3 and L4. In future studies, determination of valence states of man-ganese and its bioavailability are recommended.
Sediments contaminated with Hg in which the values are exceeding 2 ppm were found only at locations S2 and S5. All other sediments are moderately contaminated with Hg, because the concentrations are above 0.2 ppm, which is the limit for the lowest toxic effects.
The concentrations of Ni are above 75 ppm, causing significant toxic effects, and were found at most of the stations: D1-D5, M1-M3, L1, L2, L4, L5, S1-S5. The highest value was obtained at S2 (329 ppm). All Ni values are higher than those found in the Kupa River drainage basin by Frančišković-Bilinski [7], and at most locations of the upper Sava River drainage basin by Frančišković-Bilinski [8].
The concentrations of P slightly above 600 ppm, in-dicating minimal toxic effects, were found at locations M2- M5, L1, S1, S2 and S5. The highest value (950 ppm) was found at S1. These values are below those in average earth crust (1100 ppm) and are far from 2000 ppm, which causes significant toxic effects.
Elevated concentrations of Ag were found at two loca-tions. At S1 the concentration is slightly above 0.5 ppm, indicating minimal toxic effects. It is significantly higher at S5 (4.35 ppm), almost double than maximal concentrations reported for the polluted sites of the upper Sava River [8].
Discussion of anomalies
Results of the box plot detection of anomalies, pre-sented in Table 5, show several contaminated areas in Kos-
ovo. The most contaminated, with a number of toxic ele-ments, is Sitnica River at the locations S2 and S5, as the result of anthropogenic pollution due to the industrial proc-esses in the adjacent Kishnica and in Mitrovica towns. Locations M4 and M5 are contaminated with Cd. Location D1 shows increased concentration of Mn, and location M3 of Au. They deserve further investigation and looking for possible Mn and Au ores in the vicinity.
CONCLUSIONS
Mineralogical, geochemical and statistical investiga-tion of the stream sediments of main rivers in Kosovo have been described for the first time. Their drainage basins are of supra-regional interest, because in the lower courses these rivers flow through Albania (Drini i Bardhë), Serbia (Mo-rava e Binçës and Sitnica) and Macedonia (Lepenc).
Mineralogical analysis has shown that the most abun-dant minerals are quartz and feldspars, less abundant are mica, chlorite and calcite. Mineralogical maturity, expressed by the quartz/feldspar ratio, suggests mineralogical imma-turity of all sediments, with the exception of sediment S5 (from Sitnica River), considered to be submature.
For better understanding of sediments as weathering products, XRF analysis results were used for the compari-son with average rock types from the literature. All sedi-ments from Drini i Bardhë plot in the region of sandstones. All sediments of Morava e Binçës and Sitnica and three sediments of the upper course of Lepenc plot in the region between magmatic rocks and sandstones. Sediments from the lower course of Lepenc plot between average magmatic rock, sandstones and carbonates, and show the lowest de-gree of weathering. The highest degree of weathering shows the sediment from Sitnica River. Compositional maturity shows the highest degree of weathering in Sitnica River, which is in agreement with calculated weathering indices.
By comparing the concentrations of toxic elements with the existing criteria for sediment quality, it was found that two sites in Sitnica River are significantly polluted. These are the locations in Fushë Kosova (Kosovo Polje) (S2) and in Mitrovica (S5). Near location S2, there is ore (containing Zn, Pb) processing by flotation. Near location S5, there is a factory for Zn electrolysis. In Morava e Bin-çës River, two sites are polluted with Cd: Dobrqan (M4) and Kormini i ulët (M5). Locations with increased Mn (D1) and Au (M3) concentrations can be suggested for future investigations with regard of ore deposits.
The authors of this paper suggest future monitoring of sediments and possibly remediation of Sitnica and Morava e Binçës rivers, which ultimately flow into the Black Sea.
© by PSP Volume 18 – No 8. 2009 Fresenius Environmental Bulletin
1471
ACKNOWLEDGEMENTS
This paper is a part of PhD Thesis of Fatbardh Gashi, defended at the University of Pristina, Kosovo, in June 2006 (supervisor Dr. Halka Bilinski, from the Ruđer Bošk-ović Institute, Zagreb, Croatia). MSc Florim Isufi from the Department of Geography, University of Pristina is thanked for his assistance with geographical positioning of sampling stations using GIS and drawing maps. Special thanks go to the collaborators of the Faculty of Natural Science, Department of Chemistry and Geography, University of Pristina: Dr. Naser Troni, Dr. Mustafë Bacaj, Dr. Selim Jusufi and Dr. Valdet Pruthi for useful discussions and for participation in this work. Mrs. Marija Kumbatović, lin-guist, is thanked for her kind help in editing of English language of the paper. Part of the work and preparation of the manuscript was partly financed through the projects of Croatian Ministry of Science Education and Sport No. 0098041 and No. 098-0982934-2720.
REFERENCES
[1] Montgomery, J.M. (1996). Water Treatment, Principles and De-sign. John Wiley & Sons, New York
[2] Halamić, J., Bukovec, D., Miko, S. and Galović, L. (2001). A factor model of the relationship between stream sediment geo-chemistry and adjacent drainage basin lithology, Medvednica Mt., Croatia. Geologia Croatica 54(1), 37-51.
[3] Frančišković-Bilinski, S., Bilinski, H., Tibljaš, D. and Rantitsch, G. (2005). Effects of mercury mining regions from NW Dinarides on quality of stream sediments. Fresenius Environmental Bulletin 14(10), 913-927.
[4] Frančišković-Bilinski, S., Bilinski, H., Tibljaš, D. and Hanžel, D. (2006). Sediments from Savinja, Voglajna and Hudinja rivers (Slovenia), reflecting anomalies in an old metallurgic area. Fre-senius Environmental Bulletin 15(3), 220-228.
[5] Frančišković-Bilinski, S. (2005). Geochemistry of stream sedi-ments in Kupa River drainage basin, Dissertation. University of Zagreb, 197 pp.
[6] Frančišković-Bilinski, S. (2006). Barium anomaly in Kupa River drainage basin. Journal of Geochemical Exploration 88(1-3), 106-109.
[7] Frančišković-Bilinski, S. (2007). An assessment of multielemen-tal composition in stream sediments of Kupa River drainage ba-sin, Croatia for evaluating sediment quality guidelines. Fresenius Environmental Bulletin 16(5), 561-575.
[8] Frančišković-Bilinski, S. (2008). Detection of geochemical anoma-lies in stream sediments of the upper Sava River drainage basin (Slovenia, Croatia). Fresenius Environmental Bulletin 17(2), 188-196.
[9] Frančišković-Bilinski, S. (2008). Detection of coal combustion products in stream sediments by chemical analysis and magnetic susceptibility measurements. Mineralogical Magazine 72(1), 43-48.
[10] Bilinski, H. (2008). Weathering of sandstones studied from the composition of stream sediments of the Kupa River (Croatia). Mineralogical Magazine 72(1), 23-26.
[11] Šajn, R., Bidovec, M., Andjelov, M., Pirc, S. and Gosar, M. (1998). Geokemični atlas Ljubljane in okolice. Geološki Zavod Slovenije, Ljubljana.
[12] Sikošek, B. (1971). Explanation for Geological map of Yougo-slavia, scale 1:500000, Federal Geological Institute, Belgrade.
[13] Ivković, A., Šarin, A. and Komatina, M. (1983). Explanation for the Hydrogeological Map of SFR Yugoslavia 1:500000, Federal Geological Institute, Belgrade.
[14] Powder Diffraction File (1997). International Center for Diffrac-tion Data, Newtown Square, PA, USA.
[15] Boldrin, A., Juračić, M., Mengazzo Vitturi, L., Rabitti, S. and Rampazzo, G. (1992). Sedimentation of river-borne material in a shallow shelf sea: Adiga River, Adriatic Sea. Marine Geology 103, 473-485.
[16] Salminen, R. and Tarvainen, T. (1997). The problem defining geochemical baselines. A case study of selected elements and geological materials in Finland. Journal of Geochemical Explora-tion 60, 91-98.
[17] StatSoft, Inc. (2001). STATISTICA (data analysis software sys-tem), version 6. http://www.statsoft.com
[18] Tukey, J.W. (1977). Exploratory data analysis. Reading: Addi-son-Wesley.
[19] Sarkar, S.K., Frančišković-Bilinski, S., Bhattacharya, A., Saha, M., Bilinski, H. (2004). Levels of elements in the surficial estuarine sediments of the Hugli River, northeast India and thier environ-mental implications. Environment International 30, 1089-1098.
[20] Dockal, J.A. (2006). Sedimentary petrology: Sediment or sand observation and description (lectures). University of North Caro-lina, Wilmington. Available at: http://people.uncw.edu/dockal/ GLY312/grainsize/grainsize.htm
[21] Prohić, E. (1998). Geokemija. Manualia Universitatis Studiorum Zagrebiensis, Targa, Zagreb, Croatia, 554 pp (in Croatian).
[22] Kronberg, B.I. and Nesbitt, H.W. (1981). Quantification of weath-ering, soil geochemistry and soil fertility. Journal of Soil Science 32, 453-459.
[23] Björlikke, K. (1974). Geochemical and mineralogical influence of Ordovician Island Arcs on epicontinental clastic sedimentation. A study of Lower Paleozoic sedimentation in the Oslo Region, Norway. Sedimentology 21, 251-272.
[24] SMSP and FALCONBRIDGE NC SAS (2005). Koniambo project, Environmental and Social Impact Assessment, Chapter 4 Mine, 4.2-7 Quality criteria for freshwater sediment. Available at:http://www.falconbridge.com/documents/koniambo_esia/vol2/Chapter04/4_2__7/4_2_7.pdf
Received: December 22, 2008 Revised: February 16, 2009 Accepted: March 23, 2009 CORRESPONDING AUTHOR
Stanislav Frančišković-Bilinski Institute „Ruđer Bošković“ Division of Marine and Environmental Research POB 180 10002 Zagreb CROATIA E-mail: [email protected]
FEB/ Vol 18/ No 8/ 2009 – pages 1462 - 1471
Related Documents


