Analysis of Research Data Statistical Analysis of Research Data

Analysis of Research Data Statistical Analysis of Research Data.
Dec 21, 2015
Welcome message from author
This document is posted to help you gain knowledge. Please leave a comment to let me know what you think about it! Share it to your friends and learn new things together.
Transcript
Analysis of Research Data
Statistical Analysis of Research Data
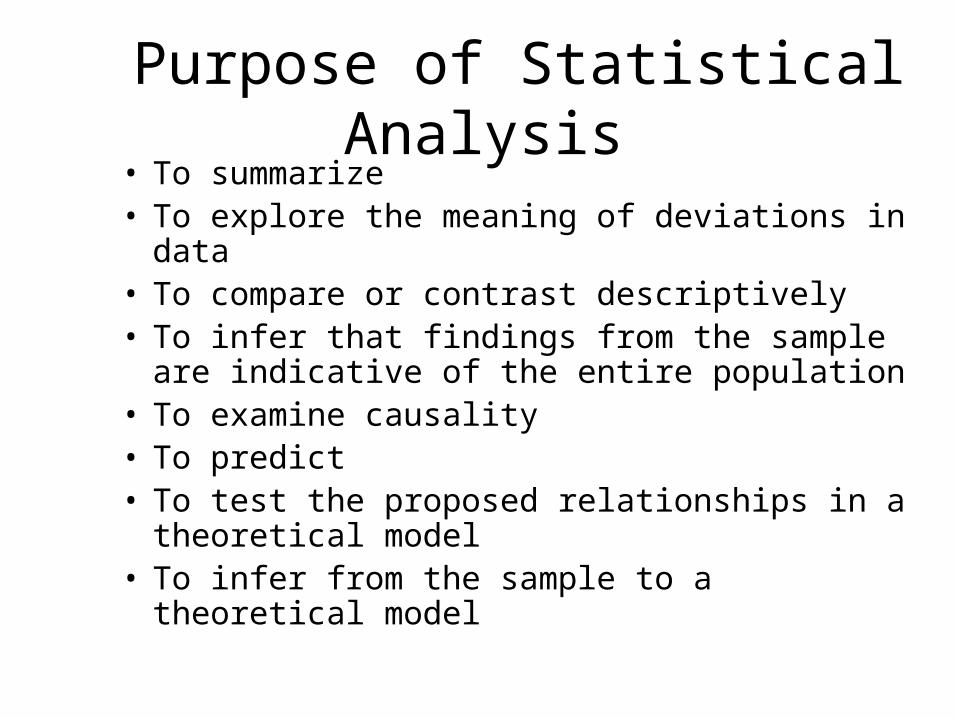
Purpose of Statistical Analysis
• To summarize• To explore the meaning of deviations in data• To compare or contrast descriptively• To infer that findings from the sample are
indicative of the entire population• To examine causality• To predict• To test the proposed relationships in a
theoretical model• To infer from the sample to a theoretical
model

Elementary Descriptive Statistics
• Univariate descriptive statistics – these describe and synthesize data from empirical observations– Averages and percentages– Frequency distributions
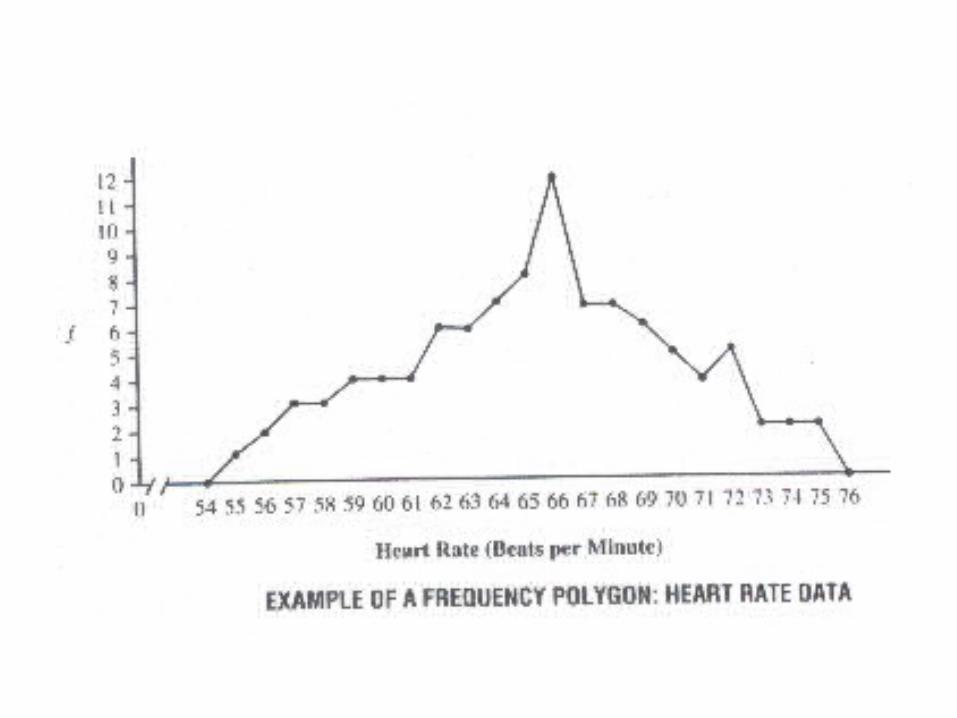
• Cumulative frequencies• Bar graph – nominal or qualitative• Frequency histograms – ordinal, interval or ratio• Frequency polygons – ordinal, interval or ratio


Elementary Descriptive Statistics
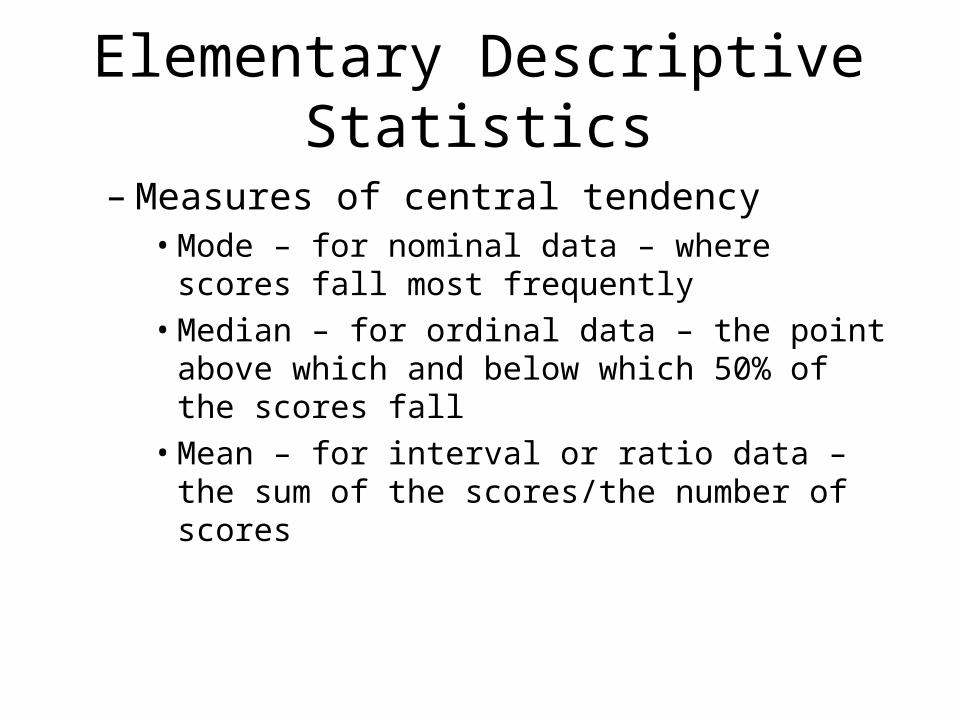
– Measures of central tendency• Mode – for nominal data – where scores fall most
frequently• Median – for ordinal data – the point above which
and below which 50% of the scores fall• Mean – for interval or ratio data – the sum of the
scores/the number of scores

Elementary Descriptive Statistics
– Measures of dispersion or variability – the degree to which subjects in the sample are similar to each other with respect to the critical aspect – the extent of inter-subject differences
• Range – for nominal data – the highest number minus the lowest number
• Inter-quartile range – for ordinal data - the range between the middle two quarters where 50% of scores lie
• Semi-interquartile range – for ordinal data – half of the range of scores in which the middle 50% of the scores lie
• Variance – for interval data - how much the score varies from the mean (the average of the sum of squares)
• Standard deviation – for interval data – the average of the deviations from the mean (the square root of the variance)

Standard Deviations in a Normal Distribution
Standard Deviations in a Normal Distribution
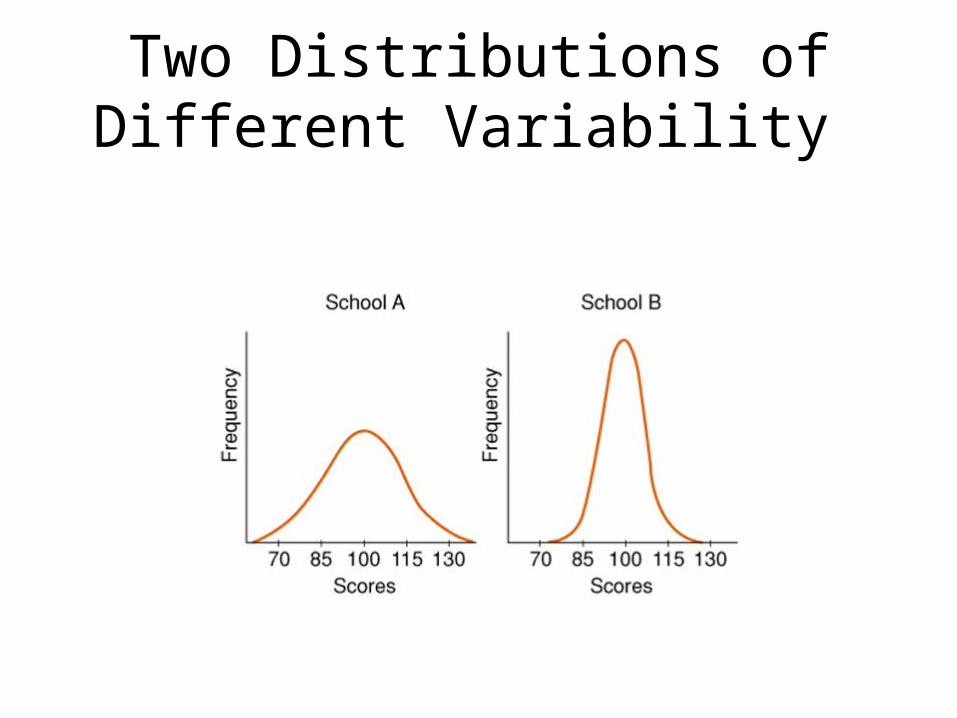
Two Distributions of Different Variability

Elementary Descriptive Statistics
• Shapes of distributions– Symmetrical – two halves fold over on themselves –
the normal curve. In order to compare the scores in one sample with the scores in another, mechanisms were developed to transform raw scores into standard scores
– Non-symmetrical – skewed• Positively – long tail to right (personal income)• Negatively –long tail to left (age at death)
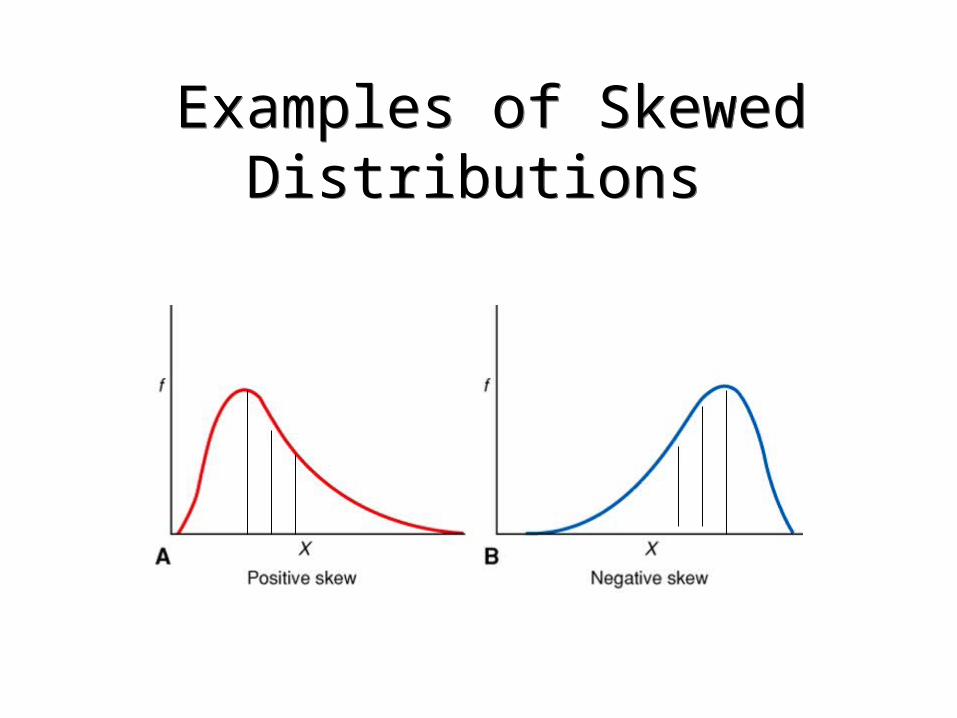
Examples of Skewed Distributions Examples of Skewed Distributions
Elementary Descriptive Statistics
– Shapes of distributions• Modality – most distributions are unimodal, but if
they have more than one mode, they are most often bimodal – having two peaks
• Kurtosis – the degree of peakedness of the curve– Platykurtic– Mesokurtic– Leptokurtic

Elementary Descriptive Statistics
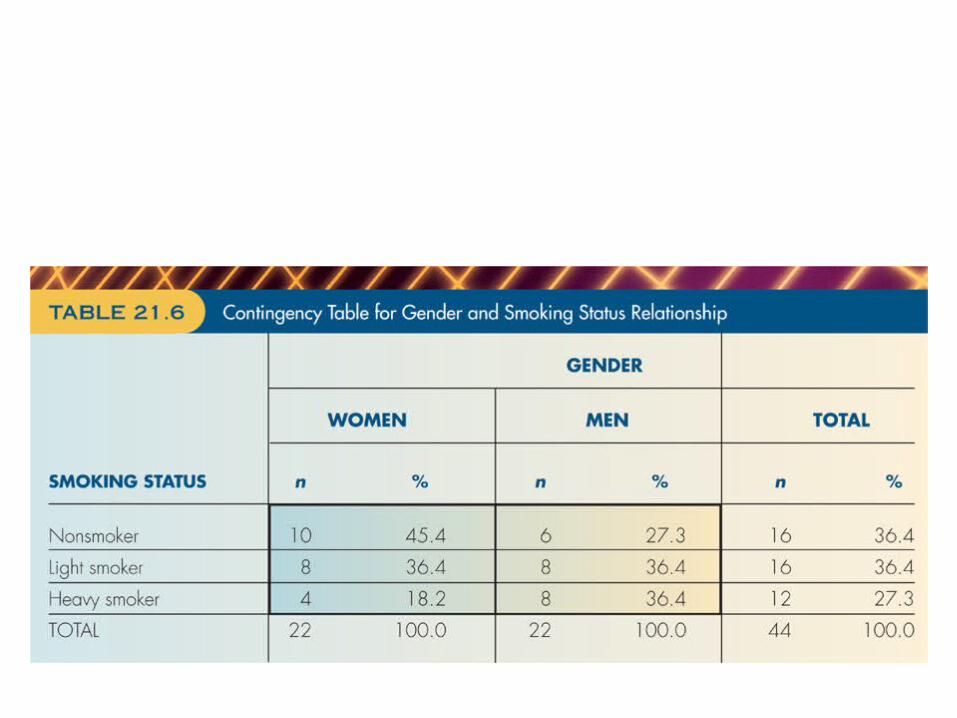
• Bivariate Descriptive Statistics – where there are two variables– Contingency tables – a two dimensional
frequency distribution – the frequency of two variables are cross tabulated
– Correlation – can determine the direction of a relationship between two variables – can display data graphically by use of the scatter diagram

BIVARIATE
GENDER OBAMA McCAIN TOTAL
Male 43 (33.6) 85 (66.4) 128 (100)
Female 215 (52.2) 197 (47.8) 412 (100)
TOTAL 258 (52.2) 282 (47.8) 540 (100)

Various Relationships Graphed on Scatter Plots
Various Relationships Graphed on Scatter Plots
Elementary Descriptive Statistics
• In a positive relationship, the scores vary together in the same direction and the slope of the line is from the 0 point of each variable to the upper right corner
• In a negative relationship, the scores vary inversely, in opposite directions with the 0 of the independent variable being at the upper left corner or high level of the dependent variable and dropping to the lower right corner of the graph
• The most common correlational statistical technique is Pearson’s Product Moment Correlation Coefficient. The outcome of the formula is an “r” value which indicates the degree of relationship between the two variables with +1 equaling perfect positive correlation and –1 equaling perfect inverse correlation
Related Documents