NUREG/CR-6756 ANL-01/32 Analysis of Potential for Jet-Impingement Erosion from Leaking Steam Generator Tubes during Severe Accidents Argonne National Laboratory U.S. Nuclear Regulatory Commission Office of Nuclear Regulatory Research Washington, DC 20555-0001

Welcome message from author
This document is posted to help you gain knowledge. Please leave a comment to let me know what you think about it! Share it to your friends and learn new things together.
Transcript
NUREG/CR-6756 ANL-01/32
Analysis of Potential for Jet-Impingement Erosion from Leaking Steam Generator Tubes during Severe Accidents
Argonne National Laboratory
U.S. Nuclear Regulatory Commission Office of Nuclear Regulatory Research Washington, DC 20555-0001
AVAILABILITY OF REFERENCE MATERIALS IN NRC PUBLICATIONS
NRC Reference Material
As of November 1999, you may electronically access NUREG-series publications and other NRC records at NRC's Public Electronic Reading Room at www.nrc.gov/NRC/ADAMS/index.html. Publicly released records include, to name a few, NUREG-series publications; Federal Register notices; applicant, licensee, and vendor documents and correspondence; NRC correspondence and internal memoranda; bulletins and information notices; inspection and investigative reports; licensee event reports; and Commission papers and their attachments.
NRC publications in the NUREG series, NRC regulations, and Title 10, Energy, in the Code of Federal Regulations may also be purchased from one of these two sources. 1. The Superintendent of Documents
U.S. Government Printing Office Mail Stop SSOP Washington, DC 20402-0001 Internet: bookstore.gpo.gov Telephone: 202-512-1800 Fax: 202-512-2250
2. The National Technical Information Service Springfield, VA 22161-0002 www.ntis.gov 1-800-553-6847 or, locally, 703-605-6000
A single copy of each NRC draft report for comment is available free, to the extent of supply, upon written request as follows: Address: Office of the Chief Information Officer,
Reproduction and Distribution Services Section
U.S. Nuclear Regulatory Commission Washington, DC 20555-0001
E-mail: [email protected] Facsimile: 301-415-2289
Some publications in the NUREG series that are posted at NRC's Web site address www.nrc.gov/NRC/NUREGS/indexnum.html are updated periodically and may differ from the last printed version. Although references to material found on a Web site bear the date the material was accessed, the material available on the date cited may subsequently be removed from the site.
Non-NRC Reference Material
Documents available from public and special technical libraries include all open literature items, such as books, journal articles, and transactions, Federal Register notices, Federal and State legislation, and congressional reports. Such documents as theses, dissertations, foreign reports and translations, and non-NRC conference proceedings may be purchased from their sponsoring organization.
Copies of industry codes and standards used in a substantive manner in the NRC regulatory process are maintained at
The NRC Technical Library Two White Flint North 11545 Rockville Pike Rockville, MD 20852-2738
These standards are available in the library for reference use by the public. Codes and standards are usually copyrighted and may be purchased from the originating organization or, if they are American National Standards, from
American National Standards Institute 11 West 4 2rd Street New York, NY 10036-8002 www.ansi.org 212-642-4900
Legally binding regulatory requirements are stated only in laws; NRC regulations; licenses, including technical specifications; or orders, not in NUREG-series publications. The views expressed in contractor-prepared publications in this series are not necessarily those of the NRC.
The NUREG series comprises (1) technical and administrative reports and books prepared by the staff (NUREG-XXXX) or agency contractors (NUREG/CR-XXXX), (2) proceedings of conferences (NUREG/CP-XXXX), (3) reports resulting from international agreements (NUREG/IA-XXXX), (4) brochures (NUREG/BR-XXXX), and (5) compilations of legal decisions and orders of the Commission and Atomic and Safety Licensing Boards and of Directors' decisions under Section 2.206 of NRC's regulations (NUREG-0750).
DISCLAIMER: This report was prepared as an account of work sponsored by an agency of the U.S. Government. Neither the U.S. Government nor any agency thereof, nor any employee, makes any warranty, expressed or implied, or assumes any legal liability or responsibility for any third party's use, or the results of such use, of any information, apparatus, product, or process disclosed in this publication, or represents that its use by such third party would not infringe privately owned rights.
NUREG/CR-6756 ANL-01/32
Analysis of Potential for Jet-Impingement Erosion from Leaking Steam Generator Tubes during Severe Accidents
Manuscript Completed: December 2001 Date Published: May 2002
Prepared by S. Majumdar, D. R. Diercks, W. J. Shack
Energy Technology Division Argonne National Laboratory 9700 South Cass Avenue Argonne, IL 60439
J. Muscara, NRC Project Manager
Prepared for Division of Engineering Technology Office of Nuclear Regulatory Research U.S. Nuclear Regulatory Commission
Washington, DC 20555-0001 NRC JCN W6487
Abstract
This report summarizes analytical evaluation of crack-opening areas and leak rates of superheated steam through flaws in steam generator tubes and erosion of neighboring tubes due to jet impingement of superheated steam with entrained particles from core debris created during severe accidents. An analytical model for calculating crack-opening area as a function of time and temperature was validated with tests on tubes with machined flaws. A threedimensional computational fluid dynamics code was used to calculate the jet velocity impinging on neighboring tubes as a function of tube spacing and crack-opening area. Erosion tests were conducted in a high-temperature, high-velocity erosion rig at the University of Cincinnati, using micrometer-sized nickel particles mixed in with high-temperature gas from a burner. The erosion results, together with analytical models, were used to estimate the erosive effects of superheated steam with entrained aerosols from the core during severe accidents.
iii
Contents
Abstract ................................................................... 11i
Executive Sum m ary ................................................................................................................. xi
A cknow ledgm ents .................................................................................................................... xii
List of A cronym s ...................................................................................................................... xiv
List of Sym b ols ........................................................................................................................ xv
1 Introduction ............................................................ 1
2 A Brief Review of Solid Particle Erosion ....................................... 3
2.1 Effect of Particle Loading .................................................................................... 3
2.2 Effect of Particle Size ................................................ 3
2.3 Effect of Particle Characteristics ....................................... 4
2.4 Effect of Particle Velocity ................................................................................... 5
2.5 Effect of Impingement Angle .............................................................................. 5
2.6 Effect of Tem perature ......................................................................................... 6
2.7 Effect of Target Material Properties ................................................................... 6
2.8 Erosion/Corrosion .................................................. 7
2.9 Erosion Behavior of Alloy 600 at High Temperatures ...................................... 7
3 High-Temperature Erosion Tests ............................................. 9
3.1 Test Conditions and Materials ......................................... 9
3.2 Test R esults ........................................................................................................ 10
4 Crack-Opening Areas at High Temperatures ................................................................. 19
4.1 A Model for Predicting Crack-Opening Area during Severe Accidents .............. 19
4.1.1 Creep Rate Equation ........................................................................... 20
4.1.2 Crack Opening Area for Axial Cracks ................................................. 20
4.2 Validation Tests on Specimens with Circumferential Notches at High Tem perature ....................................................................................................... 20
4.2.1 A pproach ............................................................................................. 20
4.2.2 Test Results ......................................................................................... 23
v

5 Jet Velocities and Flow Geom etry .................................................................................. 27
5.1 Jet Geom etry ....................................................................................................... 27
5.2 Summ ary of Computational Fluid Dynamics Results ....................................... 29
6 Erosion Rates Due to Jet Im pingem ent in Severe Accidents ......................................... 31
7 Summ ary of Results ....................................................................................................... 34
7.1 High-Temperature Erosion Tests on Alloy 600 .................................................. 34
7.2 Crack-Opening Area at High Temperatures ....................................................... 34
7.3 Jet Velocities and Flow Geom etry ...................................................................... 34
7.4 Erosion Rates Due to Jet Impingement in Severe Accidents ............................ 35
References ................................................................................................................................ 37
vi

Figures
1. Erosion rate vs. particle velocity at various temperatures ............................................... 8
2. Schematic diagram of erosion apparatus at University of Cincinnati ............................. 10
3. Erosion rates for Ni particles as a function of velocity ..................................................... 13
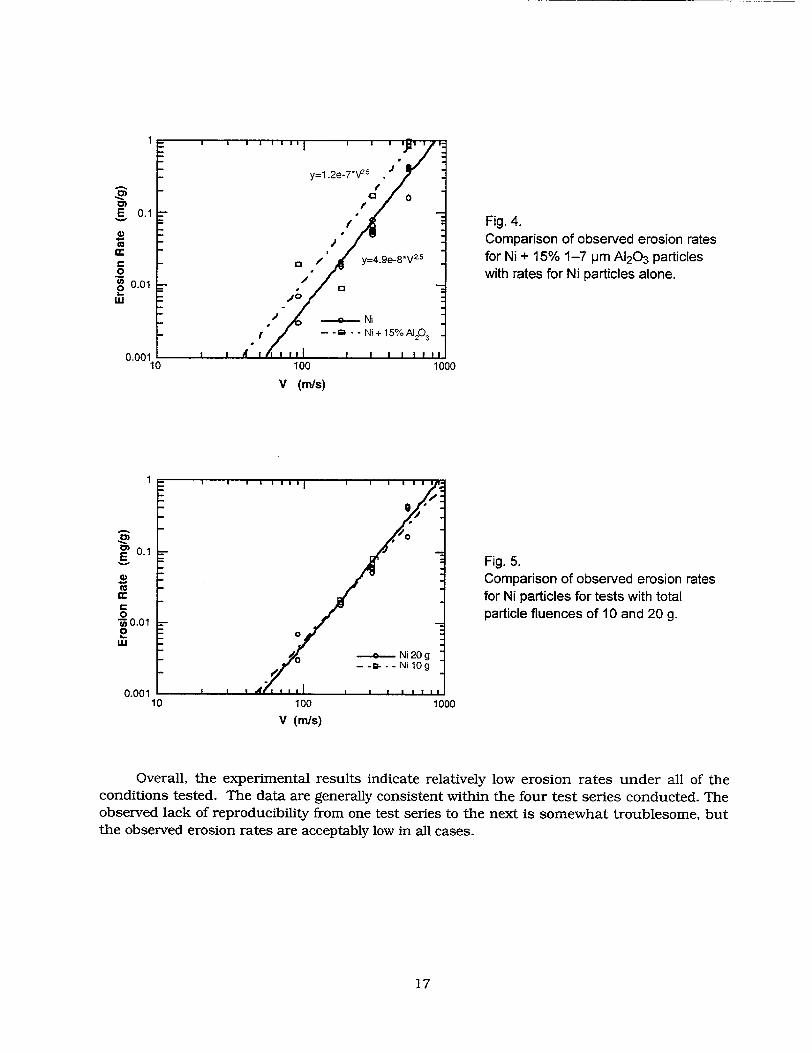
4. Comparison of observed erosion rates for Ni + 15% 1-7 Am A12 0 3 particles with rates for Ni particles alone ................................................................................................ 17
5. Comparison of observed erosion rates for Ni particles for tests with total particle fluences of 10 and 20 g ..................................................................................................... 17
6. INEEL creep rate on Alloy 600 vs. stress data plotted using activation energy of 65 kcal/mole and stress normalized by Young's modulus at temperature ..................... 21
7. Variation of h2 (c/b,n) with c/b for various values of n and variation of h2 (O,n) wi th n ................................................................................................................................. 2 1
8. Variations of crack-opening displacement rate with throughwall axial crack length for tube subjected to internal pressure of 16.2 MPa at 7000 C and crack-opening area with crack length at final temperatures 700 and 750°C for tube subjected to Case 6RU transient ........................................................................................................... 22
9. Tube with two symmetrical throughwall circumferential notches and axial loading on tube with two symmetrical 450 notches plotted after making an axial cut and unfolding tube circumference into a plane ....................................................................... 22
10. Variation of h2 with c/b for creep rate exponents n = 3.7 and 6.1 ................................. 24
11. Experimentally measured and predicted variation of total notch opening with time for specimens with two 450 circumferential notches loaded at 1107 kg and 1225 kg .... 24
12. Experimentally measured and predicted variation of total notch opening with time for specimens with two symmetrical circumferential notches loaded at 1107 kg for notch lengths 6.35 m m and 5.1 m m ................................................................................. 25
13. Time vs. temperature plot for tests CR 106 and CR 108 ................................................. 25
14. Comparison of predicted and experimentally measured notch opening displacements for two 6.4 mm circumferential notches and two 5.2 mm circumferential notches loaded at 1360 kg ....................................................................... 26
15. Schematic representation of portion of tube array in steam generator ........................... 28
16. Ratio of distance to adjacent tube to initial jet width, as a function of crack length in an MSLB and at temperatures of 700 and 750'C during severe-accident 6RU tran sient ............................................................................................................................. 28
17. Computational grid for CFD calculations ......................................................................... 30
18. Streamlines and velocities for jet directed along x axis .................................................... 30
vii
19. Density variations for jet directed along x axis ................................................................. 30
20. Comparison of Mach numbers for flows with lower stagnation temperature or lOx larger crack opening with baseline solution ..................................................................... 31
21. Comparison of velocities along jet axis for flows with lower stagnation temperature
or lOx larger crack opening with baseline solution .......................................................... 31
22. Comparison of velocity of small particles entrained in flow with fluid velocity ............... 32
viii

Tables
1. Comparison of properties of surrogate and expected reactor aerosol particles ............... 11
2. Results of particle erosion tests on Alloy 600 at 7000 C to determine most detrimental impingement angle for Ni particles ............................................................... 11
3 Results of particle erosion tests on Alloy 600 at 7000 C to determine erosion rate as a function of particle velocity for Ni particles at impingement angle of 30 .................. 12
4 Results of particle erosion tests on Alloy 600 at 9000 C to determine erosion rate as a function of particle velocity for Ni particles at impingement angle of 300 .................... 14
5. Results of particle erosion tests on Alloy 600 at 7000 C to determine erosion rate as a function of particle velocity for Ni plus NiO particles at impingement angle of 30. ..... 14
6. Results of particle erosion tests on Alloy 600 at 9000 C to determine erosion rate as a function of particle velocity for mixture of Ni and NiO particles at impingement an gle of 30 ......................................................................................................................... 15
7. Results of particle erosion tests on Alloy 600 at 700'C to determine erosion rate as a function of particle velocity for mixture of Ni and A1203 particles at impingement an gle of 300 ........................................................................................................................ 16
8. Results of particle erosion tests on Alloy 600 at 900°C (16520 F) to determine erosion rate as a function of particle velocity for mixture of Ni and Al2 0 3 particles at im pingem ent angle of 300 .............................................................................................. 18
9. Results of particle erosion tests on Alloy 600 at 7000 C (12920 F) in absence of erodent to determine baseline erosion rate in hot gas stream ......................................... 18
ix
Executive Summary
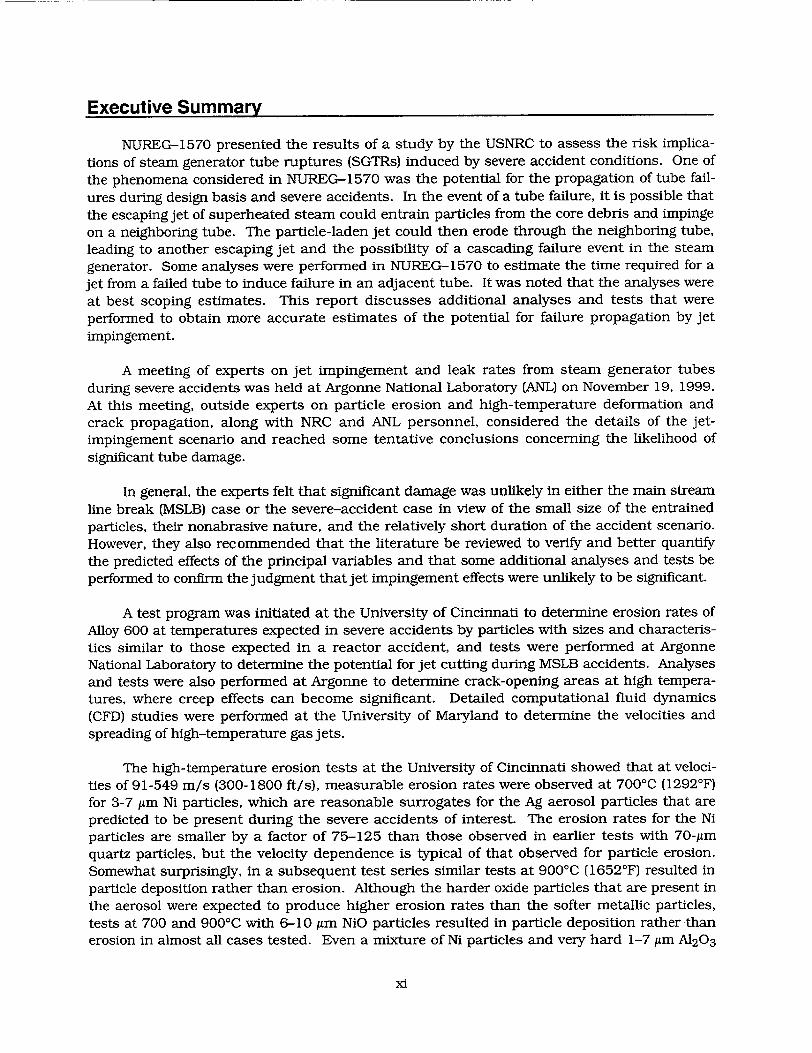
NUREG-1570 presented the results of a study by the USNRC to assess the risk implica
tions of steam generator tube ruptures (SGTRs) induced by severe accident conditions. One of
the phenomena considered in NUREG-1570 was the potential for the propagation of tube fail
ures during design basis and severe accidents. In the event of a tube failure, it is possible that
the escaping jet of superheated steam could entrain particles from the core debris and impinge
on a neighboring tube. The particle-laden jet could then erode through the neighboring tube,
leading to another escaping jet and the possibility of a cascading failure event in the steam
generator. Some analyses were performed in NUREG-1570 to estimate the time required for a
jet from a failed tube to induce failure in an adjacent tube. It was noted that the analyses were
at best scoping estimates. This report discusses additional analyses and tests that were performed to obtain more accurate estimates of the potential for failure propagation by jet
impingement.
A meeting of experts on jet impingement and leak rates from steam generator tubes
during severe accidents was held at Argonne National Laboratory (ANL) on November 19, 1999.
At this meeting, outside experts on particle erosion and high-temperature deformation and crack propagation, along with NRC and ANL personnel, considered the details of the jetimpingement scenario and reached some tentative conclusions concerning the likelihood of
significant tube damage.
In general, the experts felt that significant damage was unlikely in either the main stream
line break (MSLB) case or the severe-accident case in view of the small size of the entrained particles, their nonabrasive nature, and the relatively short duration of the accident scenario. However, they also recommended that the literature be reviewed to verify and better quantify
the predicted effects of the principal variables and that some additional analyses and tests be
performed to confirm the judgment that jet impingement effects were unlikely to be significant.
A test program was initiated at the University of Cincinnati to determine erosion rates of
Alloy 600 at temperatures expected in severe accidents by particles with sizes and characteristics similar to those expected in a reactor accident, and tests were performed at Argonne National Laboratory to determine the potential for jet cutting during MSLB accidents. Analyses
and tests were also performed at Argonne to determine crack-opening areas at high temperatures, where creep effects can become significant. Detailed computational fluid dynamics (CFD) studies were performed at the University of Maryland to determine the velocities and spreading of high-temperature gas jets.
The high-temperature erosion tests at the University of Cincinnati showed that at veloci
ties of 91-549 m/s (300-1800 ft/s), measurable erosion rates were observed at 7000 C (12920 F)
for 3-7 pm Ni particles, which are reasonable surrogates for the Ag aerosol particles that are predicted to be present during the severe accidents of interest. The erosion rates for the Ni
particles are smaller by a factor of 75-125 than those observed in earlier tests with 70-pm quartz particles, but the velocity dependence is typical of that observed for particle erosion.
Somewhat surprisingly, in a subsequent test series similar tests at 9000 C (16520 F) resulted in particle deposition rather than erosion. Although the harder oxide particles that are present in
the aerosol were expected to produce higher erosion rates than the softer metallic particles,
tests at 700 and 9000 C with 6-10 Am NiO particles resulted in particle deposition rather than erosion in almost all cases tested. Even a mixture of Ni particles and very hard 1-7 pm A12 0 3
xi

particles again resulted in deposition at higher particle velocities. At lower velocities, the rates were only slighter greater than those produced by the Ni particles alone at 7000C. Similar tests at 9000C resulted in no erosion even at the highest particle velocities. Very low erosion rates were observed in tests without intentionally introduced erosive particles. The rate of loss is about one order of magnitude less than the case when the Ni particles are present, and even these low rates may be associated with residual particles in the system rather than a true corrosion-erosion phenomenon.
A model for calculating crack-opening area at high temperature was developed. Prediction of time-dependent variation of crack-opening displacement was validated with four isothermal and two nonisothermal tests on tubes with two symmetrical circumferential notches under constant axial load. Based on these tests, we concluded that the proposed model gives reasonable estimates of variations of crack-opening displacement and crack-opening area with time at high temperature for both isothermal and nonisothermal loadings.
The crack-opening-area model was used to predict the variation of crack-opening area with time for tubes with axial cracks subjected to a severe-accident transient referred to in NUREG-1570 as Case 6RU. The analysis shows that crack-opening areas increase very rapidly once the temperature in the transient exceeds 6500C, and for temperatures _>750 0C, the crackopening areas of throughwall cracks >15 mim (0.6 in.) in length are greater than the tube crosssectional flow area of a 22.2 mm (0.94 in.) dia. tube.
Detailed computational fluid dynamics calculations were performed to determine the characteristics of the high-temperature steam jet from a tube leak under severe accident conditions. Because the pressure in the tube is much higher than on the secondary side of the steam generator, the jet expands rapidly and becomes supersonic. However, as the flow approaches the adjacent tube, it must decelerate, and a detached shock wave forms in front of the impacted tube. The analysis shows that the aerosol particles found in the primary system, which will have a mass <10-12 kg, track the fluid velocity very closely. Even for very conservative estimates of fluid drag forces, only the largest particles actually impinge on the adjacent tube, and the impact velocities are on the order -=2 m/s.
To determine the rate of thinning of tubes, the erosion data must be coupled with the results of the CFD analyses of the jet behavior. The CFD analyses show that only the largest aerosol particles would be expected to impact the tube, and the impact velocity would be =2 m/s. Even with the more conservative assumption that the impact velocity is =-200 m/s, the erosion data for Alloy 600, together with a conservative estimate of mass flux, suggest that the maximum wall thinning rate will be <2 mil/h.
Even after such a crack had opened by creep at high temperatures, failure of an adjacent tube by jet impingement would take >10 h. However, once the system has reached these high temperatures, failure of some primary system component, including unflawed steam generator tubes, by creep would be expected to occur in <1 h. Thus, jet impingement is very unlikely to play a significant role under high temperature, severe accident conditions.
xii

Acknowledgments
The authors thank Professor W. Tabakoff of the University of Cincinnati for conducting
the high-temperature erosion tests.
dii
List of Acronyms
ANL Argonne National Laboratory
CFD Computational fluid dynamics
COA Crack-opening area
COD Crack-opening displacement
EDM Electrodischarge machining
INEEL Idaho National Engineering and Environmental Laboratory
MSLB Main stream line break
NRC (U.S.) Nuclear Regulatory Commission
PWR Pressurized water reactor
RT Room temperature
SBO Station blackout
SG Steam generator
SGTR Steam generator tube rupture
IW Throughwall
VHN Vickers hardness number
xiv

List of Symbols
a crack depth A crack-opening area or coefficient for creep rate Ag silver Al aluminum b half plate width c half crack length Cu copper D initial width of round jet E volumetric erosion rate per unit mass of erodent
h wall thickness
h initial width of jet from a crack h 2 function for calculating COD k fitting constant for erosion rate L distance traveled by jet m bulging factor m. exponent for defining stress-strain curve n exponent for erosion rate or creep rate Ni nickel NiO nickel oxide p pressure P, P0 load and collapse load Q activation energy or thickness loss Q mass flow rate R Universal gas constant (1.987 cal/mole/0 C) R mean radius of tube t time T temperature V particle velocity V exit velocity of jet a coefficient for stress-strain curve Y ratio of specific heats Ap pressure differential 5, 8 crack-opening displacement and displacement rate 6, Eo strain and reference strain (D particle flux (mass per unit area per unit time) p density of particle a, C0 axial stress and reference stress 0 half circumferential crack angle
xv
1 Introduction
NUREG-1570 1 presented the results of a study by the USNRC to assess the risk implications of steam generator tube ruptures (SGTRs) induced by severe accident conditions. Severe accident sequences in which core damage occurs with the primary system at high pressure (i.e, at or near the power-operated or safety relief valve set point) and the secondary side dry and depressurized are a particular threat to the structural integrity of steam generator tubes. NUREG-15701 discussed a number of sequences that could lead to these conditions, but in pressurized water reactors (PWRs), station blackout (SBO) sequences account for the majority of events in which core damage occurs with the primary system at high pressure and the secondary system depressurized. The analyses in NUREG-15701 show that in such events the steam generator tubes may reach temperatures as high as 7001C (12921F) and pressures of up to 16.2 MPa (2350 psi) before the surge line fails and depressurizes the primary system. Even though the entire scenario is predicted to run its course in =2 h or less, these high temperatures and pressures can lead to failure of one or more of the primary system pressureboundary components, including steam generator tubes. If the steam generator tubes fail before a failure occurs elsewhere in the primary system that depressurizes the system (and thus prevents the tube failures), there is a high likelihood of containment bypass and a potential large release of radioactive materials to the public.
One of the phenomena considered in NUREG-15701 was the potential for the propagation of tube failures during design basis and severe accidents. In the event of tube failure, the escaping jet of superheated steam could entrain particles from the core debris and impinge on and erode through the neighboring tube, leading to another escaping jet and the possibility of a cascading failure event in the steam generator. Some analyses were performed in NUREG-15701 to estimate the time required for a jet from a failed tube to induce failure in an adjacent tube. The staff noted that the analyses were at best scoping estimates and that additional analyses and tests were required to obtain more accurate estimates of the potential for failure propagation by jet impingement.
As part of the effort to address the potential for tube failure propagation by jet cutting, a meeting of experts on jet impingement and leak rates from steam generator tubes during severe accidents was held at Argonne National Laboratory (ANL) on November 19, 1999.2 At this meeting, experts on particle erosion, high-temperature deformation and crack propagation, and severe-accident analyses, along with other NRC and ANL personnel, considered the important parameters that affect jet cutting and the implications for likelihood of jet cutting. In the case of the MSLB, a jet from a leaking tube would be at a maximum temperature of 3400 C (6440 F) and a maximum pressure gradient across the tube wall of 17.2 MPa (2500 psi). There is very little particulate matter in the reactor coolant, and unlike the fossil case in which leaks in tubes can entrain large, hard, ash particles, particulates in the secondary side of a steam generator tend to accumulate in sludge layers rather than to circulate through the generator. In the severe-accident case, typical conditions involve a maximum temperature of 700-9000 C (1292-1652°F), a maximum pressure gradient across the tube wall of 16.2 MPa (2350 psi), and an escaping jet consisting of superheated steam plus 10-20% H2 . The particulates in the gas jet arise from the volatilization of low-melting-temperature core materials. The volatiles agglomerate at the relatively low temperatures found in the reactor coolant piping system. Results from severe-accident analyses and tests were presented at the meeting and showed that the particles in the jet were primarily Ag (=100 g/m 3 ), with significantly lesser amounts of ln 2 0 3 , CsMoO 4 , Sn0 2 , CsI, and other species (these results are typical of Westinghouse
I
PWRs).2 The jet velocity at the point of impingement with the adjacent tube was estimated from preliminary calculations to be -=180-280 m/s (600-900 ft/s), but these values were recognized as uncertain.
In general, the experts felt that significant damage was unlikely in view of the small size of the entrained particles, their non-abrasive nature, and the relatively short duration of the accident scenario. However, they also recommended that the literature be reviewed to verify and better quantify the predicted effects of the principal variables. The results of that review with emphasis on the erosion of metallic materials are included in the next section. The variables considered are particle loading, size, characteristics, and velocity; impact angle; temperature; the characteristics of the target material; and erosion/corrosion interactions.
In addition to the literature review, a test program was initiated at the University of
Cincinnati to determine erosion rates of Alloy 600 at high temperatures by particles with sizes and characteristics similar to those expected in a reactor accident. Analyses and tests were performed at ANL to determine crack opening areas at high temperatures where creep effects can become significant. Detailed computational fluid dynamics (CFD) studies were performed at the University of Maryland to determine the velocities and spreading of high-temperature gas jets.
2
2 A Brief Review of Solid-Particle Erosion
2.1 Effect of Particle Loading
The rate of erosive wear is generally found to be directly proportional to particle loading or flux, at least for dilute-to-moderate particle loadings. In fact, wear rates are typically expressed in terms of the amount of material removed (measured in g or mm 3 ) per kg of impacting material, thus implying a linear proportionality between wear rate and the amount of erodent. At higher particle loadings, particles rebounding from the target surface can interfere with incoming particles, thereby shielding the target surface somewhat and resulting in a decreasing wear rate with increasing particle loading. Anand et al. 3 showed that for the case of 1018 steel eroded with 64 Am alumina particles at 900 and 50 m/s (165 ft/s), the erosion rate with a feed rate of 5 g/min through a 3.2 mm (0.125 in.)-diameter nozzle is reduced by =10% due to this effect. The effect increases with decreasing velocity and particle size and also depends on the rebound characteristics of the impacting particle and the target material. However, the effect is not expected to be significant for the dilute particle loadings of interest here.
2.2 Effect of Particle Size
Kosel4 found that the size of the erodent particles has little or no effect on erosion rate for particles larger than =100 Am, but that the erosion rate decreases rapidly with decreasing size for smaller particles. Majumdar et al. 5 summarized data on the erosive wear rate of Type 304 stainless steel at 200 C impacted by alumina and fly ash particles at 125-150 m/s and impact angles of 20-30' and 50-60'. For both ranges of angles, the erosion rate for particles >100 Am in size is 200 mm3 /kg. The erosion rate drops off rapidly for particles <20 Am in size, and the rate for = 5 Am particles is <5 mm3 /kg, or less than 3% of the rate for the 100 Am particles. Similarly, Tilly6 found that the room-temperature erosive wear rate for an 11% Cr steel impacted by quartz particles at 305 m/s (1000 ft/s) decreased by a factor of =8 when the particle size was decreased from 100 Am to 10 Am. The particle size effect was observed to decrease with decreasing particle velocity. Misra and Finnie7 also reported a significant dependence in copper of both erosive and abrasive wear rates on particle size when using SiC particles.
Wright and Nagarajan 8 studied the effect of particle size on the erosive wear of 10 hightemperature alloys tested in a simulated coal-gasifier flue gas environment at 7600 C (14000 F), using 12 and 74 Am alumina particles at a velocity of 30 m/s (100 ft/s). If one assumes that the erosion rate is proportional to the momentum or kinetic energy of the impacting particle, the wear rate per particle for the larger particles should be greater that that for the smaller particles by a factor of (74/12)3, or 235. The observed values were close to this factor only for materials that formed adherent oxide scales in the test environment. For alloys that formed very thin or nonadherent scales, the factor was typically =1000-2500, a much stronger dependence than would be expected strictly on momentum or kinetic energy considerations.
Misra and Finnie7 developed a theory attributing the observed strong dependence of wear rate on particle size to an increase in flow stress of the worn material with decreasing particle indentation size. Stringer, as quoted by Diercks, 2 also suggested that smaller particles, particularly those <5 Am in diameter, are less erosive because they tend to follow stream lines and are thus diverted as they approach the surface of the target material. CFD calculations
3

suggest that this is the case for the particle sizes and densities of interest in the jets from leaking steam generator tubes. 1
2.3 Effect of Particle Characteristics
It is widely observed that for metallic materials, the erosive wear rate depends rather strongly on the hardness of the erodent particles. Wellinger and Uetz9 reported that the erosion rate dropped dramatically when the particle hardness was significantly lower than that of the material being eroded. In their experiments, for which the particle velocity and impact angle were not specified, they impacted a C 60H (0.6% C) steel (Vickers hardness number [VHNI = 800 kg/mm2) with particles of limestone (VHN = 200 kg/mm2), glass (VHN = 500 kg/mm 2), flint (VHN = 900 kg/mm 2), garnet (VHN = 1300 kg/mm2), corundum (VHN = 1800 kg/mm2), and SiC (VHN = 2700 kg/mm2). The observed erosive wear rates were =75 mm3/kg for the latter four materials, all of which were harder than the steel target material. The wear rate for the somewhat softer impacting glass particles was =25 mm3 /kg, and that for the much softer limestone was negligible.
Majumdar et al. 5 discuss results from erosive wear experiments conducted on high-alloy steels and various Ni-base alloys. The low-alloy steels were tested at room temperature and at particle velocities of 30-200 m/s (100-660 ft/s), using SiC, quartz, A120 3 , SiO2 , iron powder, and fly ash as the erodent particles. The results of these experiments showed a clear correlation between particle hardness and wear rate. The dependence was strongest at the higher particle velocities; at 150 m/s (500 ft/s), the wear rate ranges from =200 mm3/kg for the hard alumina particles to =20 mm 3/kg for the softer fly ash particles and only =4 mm3/kg for the very soft iron particles.
For the Ni-base alloys, the particle velocities were 100-350 m/s (330-1150 ft/s), and the test temperature was 450-4820 C (842-9001F). The erodent particles used were quartz, A12 0 3 , SiO2 , and fly ash. The same dependence of wear rate on particle hardness was observed, except that the harder quartz particles were observed to produce lower erosive wear rates than the softer fly ash particles. This anomaly was attributed to the unusually high flow stress and low ductility of the alloy (Alloy 600) tested with quartz as compared to those (Inconel 718 and Rene 41) tested with fly ash.
Particle shape also influences erosive wear, with angular particles producing higher wear rates than spherical particles. For example, Maji and Sheldon 10 found that angular particles of hardened steel grit (=270 pm diameter and a velocity of 20 m/s [65 ft/si) produced wear rates greater by a factor of about 5 than similar-size spherical particles in 6061-T6 aluminum. Steady-state erosion by spherical particles is observed to typically produce a "hill and valley" surface topography, whereas angular particles result in additional loss of material by plowing deformation on the sides of the hills and by removal of flakes of material from the valleys. 11
"1 "Steam Generator Jet Impingement Calculations," Memorandum to Nilesh C. Chokshi, USNRC/RES from John H. Flack USNRC/RES, December 26, 2000.
4

2.4 Effect of Particle Velocity
Particle velocity exerts a very strong influence on erosion, and the dependence of the erosive wear rate E on the particle velocity V is typically expressed by a power law relation of the form
E = k.Vn, (1)
where k is a fitting constant, and n is the velocity exponent. Kosel 4 observes that the value of n typically falls in the range of 2.0 to 2.5 for metals and 2.5 to 3.0 for ceramics. Wright and Nagarajan 8 report an even stronger velocity dependence for 10 high-temperature alloys tested in a simulated coal-gasifier flue gas environment at 760'C (1400'F), using 12 and 74 Azm alumina particles at velocities of 19-52 m/s (63-170 ft/s). Their observed values of n ranged from 2.1 to 4.0 for nominal 30' impacts and 1.7 to 4.6 for nominal 90' impacts. For the 300 impacts, the lower values of n were associated with the dispersion-strengthened alloys or with those alloys that were relatively soft at the test temperature. The n values exhibited a transition to higher values at velocities of 24-38 m/s (80-125 ft/s). The authors suggest that the material loss rate is controlled by corrosion at the lower velocities and by erosion at the higher velocities.
Similarly, Majumdar et al. 5 reported the velocity exponents for several high-alloy steels and Ni-base alloys at temperatures of 20-649°C (68-1200'F) and at impact angles of 10-90° using various erodents. The values fell within the range of 1.7 to 3.8, but they were clustered in the narrower range from 2.0 to 3.0. The exponent values also appeared to increase somewhat with increasing impact angle for the Ni-base alloys, but the variation for the highalloy steels was not clear-cut.
2.5 Effect of Impingement Angle
There is general agreement in the literature that the angle of particle impingement strongly influences erosive wear rates, and that the angle at which maximum wear occurs is different for ductile metallic materials than for more brittle ceramic materials. 4 A widely referenced theoretical model of erosion developed by Finnie 12 predicts maximum erosive wear in ductile metallic materials for an incident angle of =15-200, and this is in general agreement with the commonly observed values of =15-30', although higher angles are occasionally seen for specific materials. The erosion mechanism for ductile materials is predominantly one of cutting or plowing of the target material. For more brittle materials, maximum erosion typically occurs at incident angles near 900, and the operative mechanism is one of microfracture of the target material surface.
An experimental verification of the above dependence is provided by the work of Finnie 13
on a 1055 steel. He tested this material in both the ductile ferrite-plus-pearlite microstructure and in the hardened martensitic condition by using 250 Am SiC particles at 107 m/s (350 ft/s). For the pearlitic microstructure, the maximum erosive wear rate was observed at an incident angle of 250, whereas the maximum wear rate for the more brittle martensitic structure occurred at 900.
5

2.6 Effect of Temperature
The effect of temperature on erosive wear rates is not as straightforward as one might
expect. Simple analyses based on the decrease on material hardness and flow stress with increasing temperature would predict an increase in wear rates with increasing temperature,
and this is observed, for example, in a number of high-alloy steels. 5 This same study indicates a less clear-cut temperature dependence for several Ni-base alloys. The erosion rate of Alloy
600, for example, is observed to decrease modestly with increasing temperature in the range
from 371 to 5770 C (700 to 10700 F). Similarly, an experimental study was conducted by
Hansen 14 on the erosive wear behavior of more than 200 materials at room temperature and
7001C (12920 F) by using 27 gm alumina particles at a velocity of 170 m/s and a 900 angle of
incidence. He found that most metallic alloys (including Alloy 600) showed a noticeable increase in wear rates at the higher temperature, but a few showed a decrease. Likewise, a
review by Sundararajan 1 5 indicates that for some materials, the wear rate increases with increasing temperature while for others it decreases.
2.7 Effect of Target Material Properties
Intuitively, one might expect an increase in the hardness of the target material to result
in an accompanying increase in erosion resistance. Indeed, Finnie's 12 theory predicts that the erosion rate should vary inversely with flow stress, which in turn correlates closely with
hardness. This behavior is borne out by a number of pure metals with hardnesses ranging from VHN = 10 to 500, as demonstrated in the data reported by Finnie et al. 1 6 These experiments were conducted at room temperature using 250 gm alumina particles at an angle of 200
and a velocity of 76 m/s (250 ft/s). Even in this case, however, work hardening of some of these metals (e.g., Cu, Ag, and Al) produced no perceptible increase in erosion resistance over that of the annealed condition.
The picture is more complicated for alloys, and the most extensive information on the
effect of hardness exists for the ferritic steels, the hardness of which can be altered signifi
cantly by heat treatment. Finnie et al. 16 found that for a 1045 steel and a tool steel, roomtemperature erosion resistance was almost independent of hardness over a range from VHN = 200 to 800 when eroded under the same conditions as for the pure metals described
above. Sargent et al.1 7 and Salik and Buckley18 similarly reported very little dependence of
erosion rate on hardness for steels, although the latter authors did see some increase in the erosion resistance for a hardened 1045 steel when eroded with 15 Jim glass beads, but not when eroded with crushed glass. Levy and Jahanmir 1 9 reported that a near-eutectoid 1075
steel heat treated to form fine pearlite, coarse pearlite, or spherical carbides exhibited ductile behavior (highest erosion rate at lower angles of impingement) and that a slight increase in erosion rate occurred with increasing hardness.
Majumdar et al.5 suggested that the ductility of the target material might also influence the erosion resistance, with more ductile materials being more resistant to erosive wear.
However, the room-temperature data for high-alloy steels and Ni-base alloys that they analyzed do not indicate a clear correlation. For the Ni-base alloy at elevated temperatures, erosion resistance did appear to increase with increasing ductility. However, the authors note that any thermomechanical treatment that increases the ductility almost always also decreases the flow stress and vice versa, so it is experimentally difficult to separate out the effects of these two variables.
6

2.8 Erosion/Corrosion
When erosive wear takes place in a corrosive environment, the two processes can interact in a synergistic fashion, and it is not always easy to determine their relative contributions to the observed loss of material. In simplest terms, erosion/corrosion can be separated into two regimes: (1) erosion rates are significantly greater than corrosion rates and erosion dominates, and (2) corrosion rates are substantially greater than erosion rates and corrosion dominates. Between these two bounding cases, the synergistic interaction of the two processes can lead to material loss rates much greater than one would expect from either alone. For example, if corrosion processes lead to the formation of a relatively non-adherent corrosion product that is much more easily eroded away than the underlying base metal, simultaneous erosion and corrosion can produce very high rates of material loss.
The key parameter in determining the relative contributions of the two processes to material loss is their relative rates. These rates are difficult to quantify without knowing the specific materials, environment, temperature, and erosion conditions that are present. However, Stringer, as quoted in Ref. 2, suggested that in the absence of extremely corrosive conditions, corrosion processes typically require days or more to significantly contribute to material loss. The entire subject of erosion/corrosion is discussed in detail by Rishel et al.20
2.9 Erosion Behavior of Alloy 600 at High Temperatures
An attempt was made to find literature data on the erosion rate of Alloy 600 under conditions similar to those postulated for a severe-accident scenario, namely, temperatures of up to 700'C (1292°F), particle velocities of up to 550 m/s (1800 ft/s), and small, relatively soft erodent particles (e.g., •5 Aim Ag) entrained in a mixed air/steam environment. Not surprisingly, data obtained under these precise conditions are not available.
However, Tabakoff2 l and Tabakoff and Vitta122 obtained data on the erosive wear of Alloy 600 at temperatures and velocities approximating those of interest. Specifically, their data were obtained at temperatures of 371, 493, and 599°C (700, 920, and 1070'F) and particle velocities ranging from =90 to 300 m/s (=300 to 1000 ft/s). The erodent particles used were silica quartz, and experiments were conducted with seven mean particle sizes ranging from 71.5 to 797.5 Am. The smallest mean particle diameter used in the experiment was --37 Jm. Data were obtained for incident angles ranging from 10 to 70'.
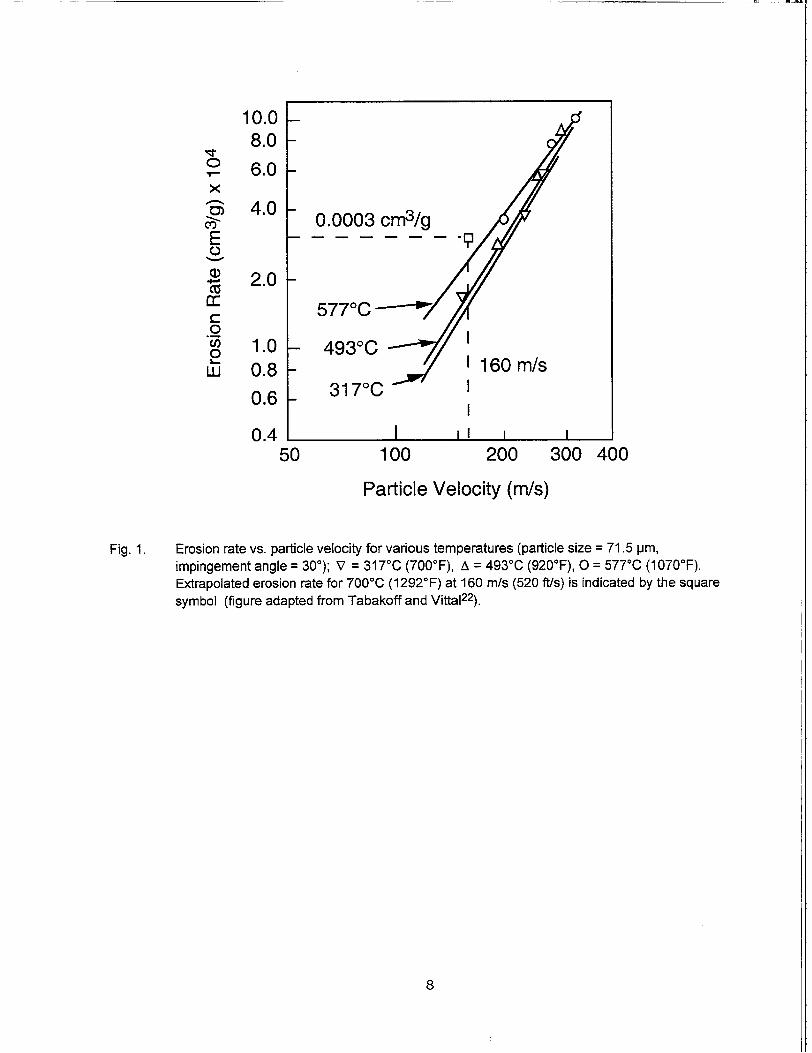
Tabakoff21 found that the erosion rate increased with increasing temperature in all experimental conditions studied and that the velocity exponent n generally decreased somewhat with increasing temperature. The effect of temperature on erosion rate typically decreased with increasing velocity. The maximum erosion rate was observed for an impingement angle of =30', and the velocity exponent varied with the impingement angle. The erosion rate for Alloy 600 remained almost constant for mean particle sizes of 70 to 230 Am and then increased moderately with increasing particle size. Figure 1, adapted from Tabakoff and Vittal, 22 shows the erosion rate of Alloy 600 vs. particle velocity at three temperatures for a mean particle size of 71 Am and the worst-case impingement angle of 30'.
7
10.0 8.0
o- 6.0 x
S4.0 03c g Cý- 0.0003 cm/
E .
. 2.0 5770C
0
0.8 1.I 160 m/s 0.6 3170C "
0.4 I ii i
50 100 200 300 400
Particle Velocity (m/s)
Fig. 1. Erosion rate vs. particle velocity for various temperatures (particle size = 71.5 pm, impingement angle = 30 '); V = 317'C (700TF), A = 4930C (920°F), 0 = 5770C (1070TF). Extrapolated erosion rate for 7000C (1292°F) at 160 m/s (520 ft/s) is indicated by the square
symbol (figure adapted from Tabakoff and Vitta12 2).
8
3 Higch-Temperature Erosion Tests
3.1 Test Conditions and Materials
The jets from leaking tubes in a severe accident would consist primarily of hightemperature steam. The stagnation temperature for the jet could range from 700-8500 C, and the stagnation pressure could be as high as 16 MPa (2350 psi). As noted previously, the particle loading is due to aerosol transport of low-melting materials from the molten core. Accident analyses with the VICTORIA Code suggest that the particulate consists primarily of Ag (2.7 g/kg) plus lesser amounts of In 2 0 3 (0.2 g/kg), CsMoO 4 (0.07 g/kg), Sn0 2 (0.06 g/kg), Csl (0.03 g/kg), and other species.2 The median particle diameter is =1.5 Atm, with the bulk of particles having diameters <3 jm. 2
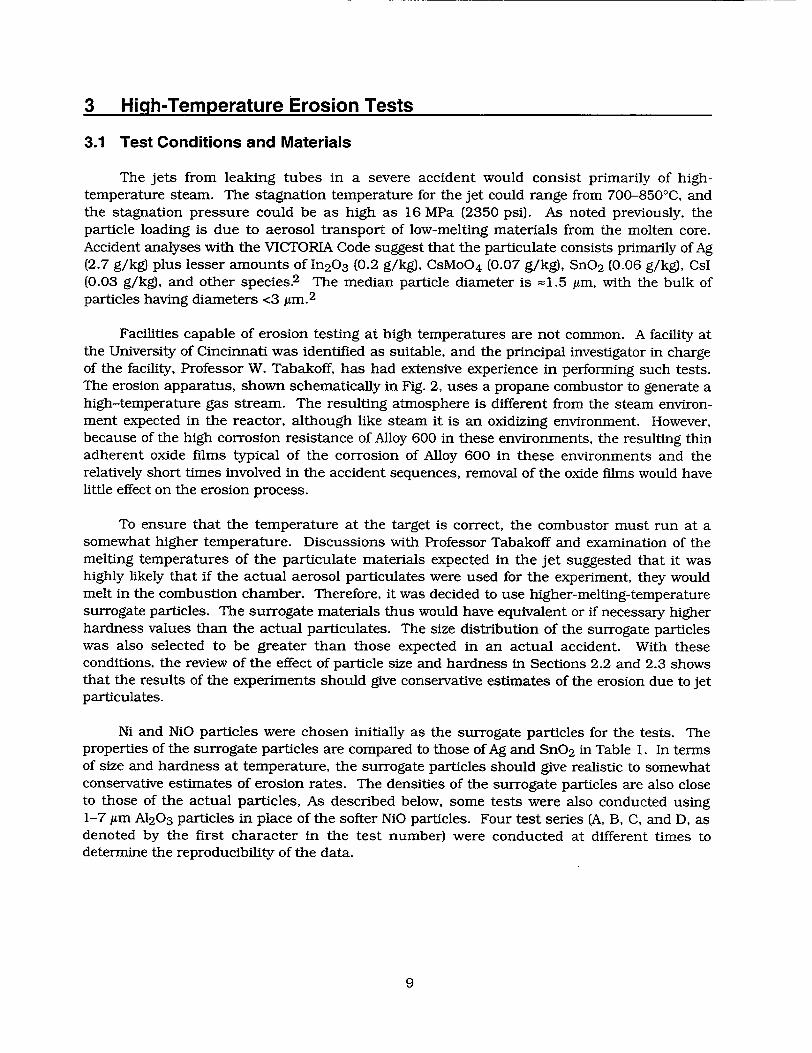
Facilities capable of erosion testing at high temperatures are not common. A facility at the University of Cincinnati was identified as suitable, and the principal investigator in charge of the facility, Professor W. Tabakoff, has had extensive experience in performing such tests. The erosion apparatus, shown schematically in Fig. 2, uses a propane combustor to generate a high-temperature gas stream. The resulting atmosphere is different from the steam environment expected in the reactor, although like steam it is an oxidizing environment. However, because of the high corrosion resistance of Alloy 600 in these environments, the resulting thin adherent oxide films typical of the corrosion of Alloy 600 in these environments and the relatively short times involved in the accident sequences, removal of the oxide films would have little effect on the erosion process.
To ensure that the temperature at the target is correct, the combustor must run at a somewhat higher temperature. Discussions with Professor Tabakoff and examination of the melting temperatures of the particulate materials expected in the jet suggested that it was highly likely that if the actual aerosol particulates were used for the experiment, they would melt in the combustion chamber. Therefore, it was decided to use higher-melting-temperature surrogate particles. The surrogate materials thus would have equivalent or if necessary higher hardness values than the actual particulates. The size distribution of the surrogate particles was also selected to be greater than those expected in an actual accident. With these conditions, the review of the effect of particle size and hardness in Sections 2.2 and 2.3 shows that the results of the experiments should give conservative estimates of the erosion due to jet particulates.
Ni and NiO particles were chosen initially as the surrogate particles for the tests. The properties of the surrogate particles are compared to those of Ag and SnO2 in Table 1. In terms of size and hardness at temperature, the surrogate particles should give realistic to somewhat conservative estimates of erosion rates. The densities of the surrogate particles are also close to those of the actual particles, As described below, some tests were also conducted using 1-7 Am A12 0 3 particles in place of the softer NiO particles. Four test series (A, B, C, and D, as denoted by the first character in the test number) were conducted at different times to determine the reproducibility of the data.
9

AIR , (B)
FUEL --PROPANE IGNITER
COMBUSTOR CC)
PARTICLE PARTICLE PREHEATER (D) INýE5TOR
STEAM Fig. 2.
ACCELERATION TUNNEL CF) Schematic diagram of erosion
STEAM apparatus at University of Cincinnati. JACKET STEAM Propane combustor is used to generate
the high-temperature gas stream (reproduced from the Journal of
.Engineering for Power, Vol. 102, 1980,
EXHAUST p. 148 with the permission of ASME TEST TANK International).
SECTION (H)
PARTI CLE (6) FEEDER (A)
COOLING WATER
3.2 Test Results
The results of the high-temperature erosion tests are summarized in Tables 2-9. Table 2
shows results of initial tests conducted at 7001C (12921F) and a particle velocity of 305 m/s (1000 ft/s) to determine the most detrimental impact angle. Erosion was most severe at an angle of 300, in agreement with previous literature data on the erosion of Alloy 600 (and other metals), and this angle was used in all of the subsequent tests.
Table 3 gives the results of a series of tests conducted at 7000 C (1292°F) and a 30' impact angle using 3-7 Am Ni erodent at velocities of 91-549 m/s (300-1800 ft/s). The results presented in this table indicate that the erosion rate increases markedly with increasing particle velocity, and that for a given velocity, the rate is independent of total particle loading (fluence). While test series A and B yielded consistent results, the data from test series C indicates no erosion at 91 and 183 m/s (300 and 600 ft/s) and a substantially lower erosion rate at 549 m/s (1800 ft/s). The reason for these discrepancies is not clear. Overall, however,
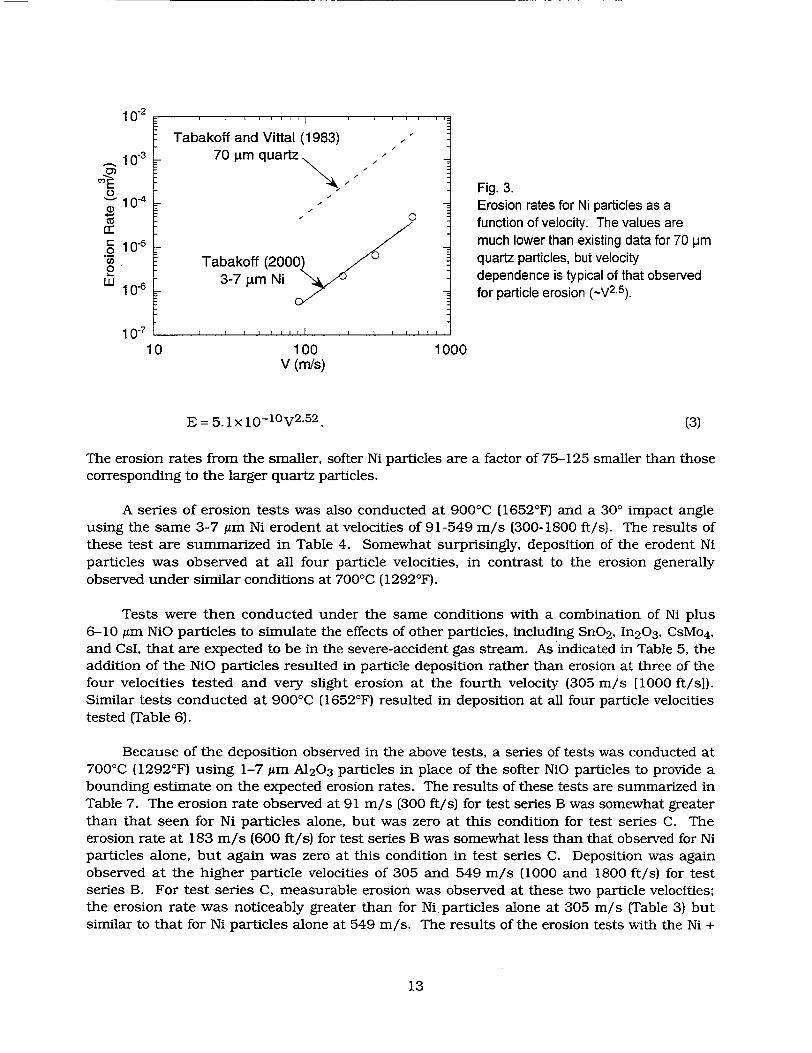
the erosion rates are relatively low in all cases. In Fig. 3, the results from test series A and B are compared with earlier results on erosion of Alloy 600 by larger-diameter quartz particles. 2 2
In this figure, the four data points plotted for the Ni particles represent the average of the erosion rate values from Table 3 for each of the four particle velocities. The erosion rates for 37 Am Ni particles are much lower than for 70 Am quartz particles, but the velocity dependence is typical of that observed for particle erosion.5 To determine the rate of thinning of the target,
10

Table 1. Comparison of properties of surrogate and expected reactor aerosol particles
Density, Hardness Melting Temp. Fraction of Particle Size Material (g/cm3 ) at RT (00) Melting Temp. (Am)
Ag 10.49 27 Vickers 962 0.8 =<3
Ni 8.91 64 Vickers 1453 0.6 3-7
NiO 6.67 5.5-6 Mohs 1985 0.4 6-10
SnO2 6.95 6-7 Mohs 1632 0.5 =<3 (=600 Vickers)
Table 2. Results of particle erosion tests on Alloy 600 at 7000C (1292°F) to determine most detrimental impingement angle for Ni particles. Erodent was Inco Type 123 Ni powder with particle diameters of 3-7 pm.
Particle Impinge- Total Initial Final Velocity ment Particle Specimen Specimen Weight Erosion
Test (m/s) Angle Fluence Weight Weight Loss Rate No. [ift/s] (0) (g) (g) (g) (g) (mg/g)
Al 305 20 10 3.97100 3.97057 0.00043 0.043 [10001
A2 305 20 10 4.12653 4.12612 0.00041 0.041 [1000]
A3 305 30 10 4.05670 4.05590 0.00080 0.080
[1000]
A4 305 30 10 4.04990 4.04932 0.00058 0.058 [10001
AS 305 45 10 3.95706 3.95650 0.00056 0.056 [10001
A6 305 45 10 3.96585 3.96525 0.00060 0.060 [1000]
it is convenient to convert the rate of mass loss into a rate of volume loss by dividing by the density of the target material, which in this case is Alloy 600, and to note that the erosion rate (based on the results from test series A and B) can be expressed in terms of a power law dependence on velocity:
E = 8.0 x 10⁻¹²V 2 -4 3 (2)
where the erosion rate E is in cm 3 /g and denotes the rate of loss of material per gram of
impinging particles, and V is the velocity of the impinging particles in m/s. Our results may be compared with earlier results of Tabakoff and Vittal2 2 on the erosion of Alloy 600 at high temperatures by 70 Am quartz particles, which have a power law dependence of the form
11

Table 3. Results of particle erosion tests on Alloy 600 at 700°C (12920F) to determine erosion rate as a function of particle velocity for Ni particles at impingement angle of 300. Erodent was Inco Type 123 Ni powder with particle diameters of 3-7 pm.
Particle Impinge- Total Initial Final Velocity ment Particle Specimen Specimen Weight Erosion
Test (m/s) Angle Fluence Weight Weight Loss Rate No. [ift/s] (0) (g) (g) (g) (g) (mg/g)
A9
A10
Cl
All
A12
B1
C2
A7
A8
B2
A16
C3
A13
A14
A15
C4
91 [3001
91 [3001
91 [3001 183
[600] 183
[600]
183 [600]
183 [600]
305 [1000]
305 [10001
305 110001
305 110001
305 [10001
549 1800]
549 [18001
549 [1800]
549 [18001
30
30
30
30
30
30
30
30
30
30
30
30
30
30
30
30
20
20
20
20
20
10
20
10
20
10
5
20
20
20
20
20
4.11250
4.03691
3.7682
4.02402
4.03380
3.89785
3.9437
4.08006
4.04177
3.73308
4.04352
3.9935
4.12430
4.04145
4.03436
3.9273
4.11236
4.03685
3.7682
4.02365
4.03340
3.89764
3.9437
4.07941
4.04075
3.73248
4.04324
3.9923
4.11595
4.03290
4.02634
3.9241
0.00014
0.00006
0.0000
0.00037
0.00040
0.00021
0.0000
0.00065
0.00102
0.00060
0.00028
0.0012
0.00835
0.00855
0.00802
0.0032
0.007
0.003
0.00
0.018
0.020
0.021
0.00
0.065
0.051
0.060
0.056
0.06
0.4175
0.4275
0.4010
0.16
12
10-2
.10"3 70 im quartz 7 F
/ Fig. 3.
Io10.4 -" Erosion rates for Ni particles as a 0 function of velocity. The values are
c" 10s- much lower than existing data for 70 pIm
2 Tabakoff (2000 quartz particles, but velocity
oU1 3-7 • Ni dependence is typical of that observed V s - for particle erosion (-V2 .5 ).
1 0 -7 , , , • , , , la , , , r , ,
1 0 100 1000 v (m/s)
E = 5.1 x 10⁻¹ 0 V 2 .5 2 . (3)
The erosion rates from the smaller, softer Ni particles are a factor of 75-125 smaller than those corresponding to the larger quartz particles.
A series of erosion tests was also conducted at 900'C (1652°F) and a 300 impact angle using the same 3-7 Am Ni erodent at velocities of 91-549 m/s (300-1800 ft/s). The results of these test are summarized in Table 4. Somewhat surprisingly, deposition of the erodent Ni particles was observed at all four particle velocities, in contrast to the erosion generally observed under similar conditions at 700'C (1292°F).
Tests were then conducted under the same conditions with a combination of Ni plus 6-10 Am NiO particles to simulate the effects of other particles, including Sn0 2 , In 2 0 3 , CsMo4 , and CsI, that are expected to be in the severe-accident gas stream. As indicated in Table 5, the addition of the NiO particles resulted in particle deposition rather than erosion at three of the four velocities tested and very slight erosion at the fourth velocity (305 m/s [1000 ft/s]). Similar tests conducted at 900'C (1652°F) resulted in deposition at all four particle velocities tested (Table 6).
Because of the deposition observed in the above tests, a series of tests was conducted at 7000 C (12920 F) using 1-7 Am A12 0 3 particles in place of the softer NiO particles to provide a bounding estimate on the expected erosion rates. The results of these tests are summarized in Table 7. The erosion rate observed at 91 m/s (300 ft/s) for test series B was somewhat greater than that seen for Ni particles alone, but was zero at this condition for test series C. The erosion rate at 183 m/s (600 ft/s) for test series B was somewhat less than that observed for Ni particles alone, but again was zero at this condition in test series C. Deposition was again observed at the higher particle velocities of 305 and 549 m/s (1000 and 1800 ft/s) for test series B. For test series C, measurable erosion was observed at these two particle velocities; the erosion rate was noticeably greater than for Ni. particles alone at 305 m/s (Table 3) but similar to that for Ni particles alone at 549 m/s. The results of the erosion tests with the Ni +
13
Tabakoff and Vittal (1983)
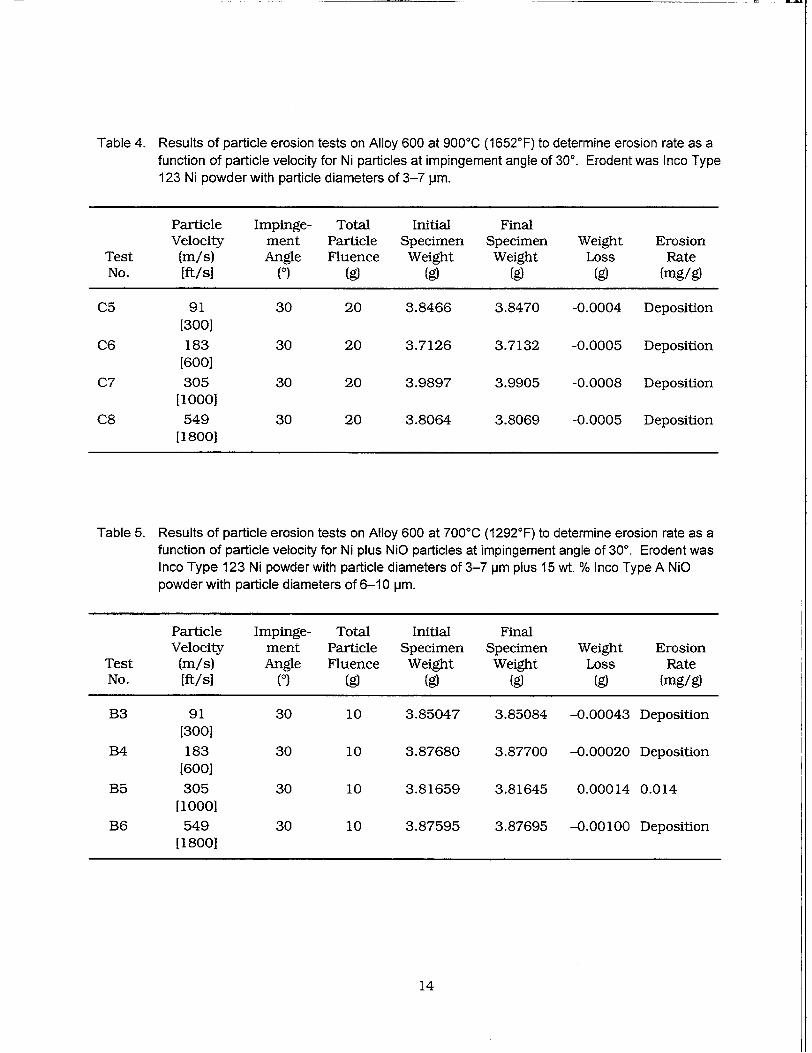
Table 4. Results of particle erosion tests on Alloy 600 at 900°C (1652°F) to determine erosion rate as a function of particle velocity for Ni particles at impingement angle of 300. Erodent was Inco Type 123 Ni powder with particle diameters of 3-7 pm.
Particle Impinge- Total Initial Final Velocity ment Particle Specimen Specimen Weight Erosion
Test (m/s) Angle Fluence Weight Weight Loss Rate No. [ft/s] (0) (g) (g) (g) (g) (mg/g)
C5 91 30 20 3.8466 3.8470 -0.0004 Deposition [300]
C6 183 30 20 3.7126 3.7132 -0.0005 Deposition [600]
C7 305 30 20 3.9897 3.9905 -0.0008 Deposition 11000]
C8 549 30 20 3.8064 3.8069 -0.0005 Deposition [18001
Table 5. Results of particle erosion tests on Alloy 600 at 7000C (12920F) to determine erosion rate as a function of particle velocity for Ni plus NiO particles at impingement angle of 300. Erodent was Inco Type 123 Ni powder with particle diameters of 3-7 pm plus 15 wt. % Inco Type A NiO powder with particle diameters of 6-10 pm.
Particle Impinge- Total Initial Final Velocity ment Particle Specimen Specimen Weight Erosion
Test (m/s) Angle Fluence Weight Weight Loss Rate No. [ift/s (0) (g) (g) (g) (g) (mg/g)
B3 91 30 10 3.85047 3.85084 -0.00043 Deposition [300]
B4 183 30 10 3.87680 3.87700 -0.00020 Deposition 1600]
B5 305 30 10 3.81659 3.81645 0.00014 0.014 [10001
B6 549 30 10 3.87595 3.87695 -0.00100 Deposition [1800]
14

Table 6. Results of particle erosion tests on Alloy 600 at 900'C (1652°F) to determine erosion rate as a function of particle velocity for mixture of Ni and NiO particles at impingement angle of 300. Erodent was Inco Type 123 Ni powder with particle diameters of 3-7 pm plus 15 wt. % Inco Type A NiO powder with particle diameters of 6-10 pm.
Particle Impinge- Total Initial Final Velocity ment Particle Specimen Specimen Weight Erosion
Test (m/s) Angle Fluence Weight Weight Loss Rate No. [ift/s (0) (g) (g) (g) (g) (mg/g)
B7 91 30 10 3.86590 3.86592 -0.00002 Deposition [3001
B8 183 30 10 3.84135 3.84174 -0.00039 Deposition [600]
B9 305 30 10 3.87040 3.87082 -0.00042 Deposition [10001
B10 549 30 10 3.77951 3.78058 -0.00107 Deposition [1800]
A12 0 3 particles (Table 7) are compared with those for the Ni particles alone (Table 3) in Fig. 4. In this plot, all of the erosion data for Ni particles alone from Table 3 are plotted individually, instead of average values as in Fig. 3. The addition of the A12 0 3 particles results in a modest increase in erosion rates for all particle velocities, ignoring those tests in which deposition was observed.
A test series D was subsequently conducted at 700'C (1292°F) using Ni plus 1-7 Jim A12 0 3 particles, and these results are also included in Table 7. The results for this test series (Tests Dl-D6) are consistent for the two particle fluences of 10 and 20 g used, as is seen in Fig. 5, indicating that a 10 g particle fluence is sufficient to give steady-state erosion rates. However, the observed erosion rates are greater than the rate observed under the same conditions in Test C12 by about a factor of two.
As part of test series C, tests were also conducted at 900'C (16521F) using Ni plus 1-7/tm A12 0 3 particles (Table 8). For these tests, no measurable erosion was observed at any of the four particle velocities. This contrasts with the results from test series C and D at 7000 C (12920 F), where erosion was clearly observed at the higher two particle velocities (Table 7). These results may also be compared with the previously discussed data obtained at 9000 C (1652°F) using Ni particles alone (Table 4), where deposition was observed at all four particle velocities.
Finally, a series of tests was conducted to determine the erosion rate in the gas stream in the absence of erosive particles. Test time was 15 min, which is of the same order of test times used in the tests with erosive particles. The results summarized in Table 9 indicate that a small but measurable specimen weight loss occurred in the absence of intentionally introduced erosive particles. This may be associated with residual particles in the system rather than with a true corrosion-erosion phenomenon. The rate of loss is about one order of magnitude less than the case when the Ni particles are present.
15
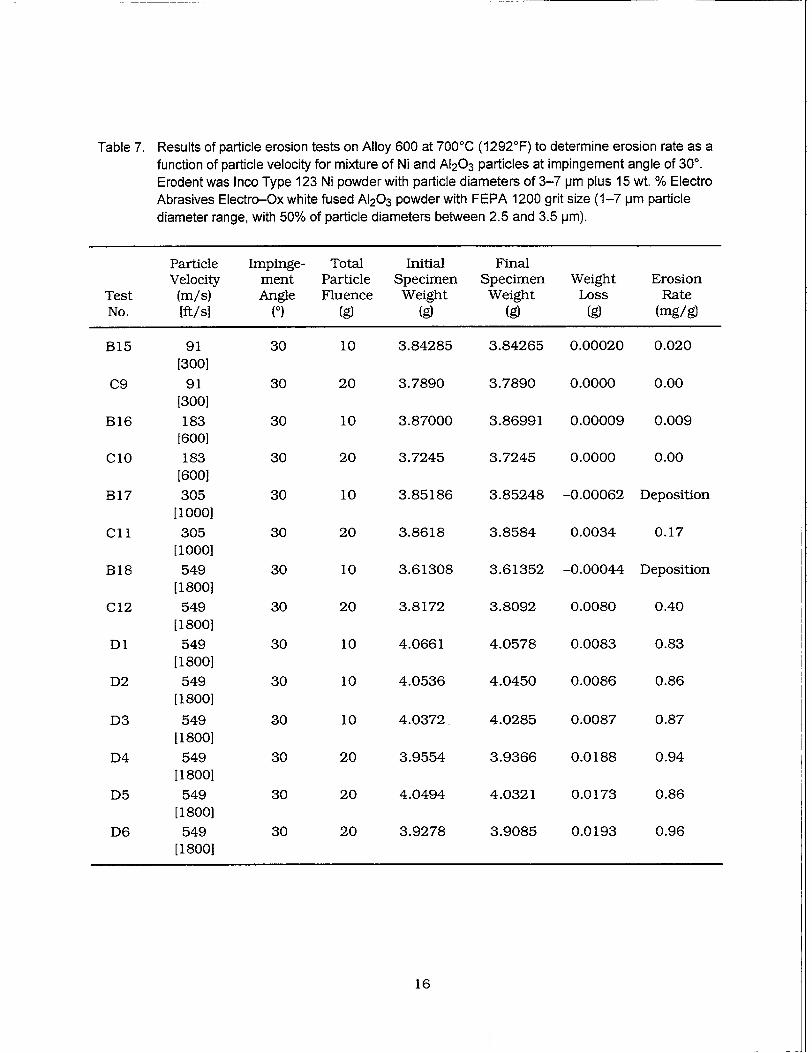
Table 7. Results of particle erosion tests on Alloy 600 at 7000C (12920 F) to determine erosion rate as a function of particle velocity for mixture of Ni and A120 3 particles at impingement angle of 300. Erodent was Inco Type 123 Ni powder with particle diameters of 3-7 pm plus 15 wt. % Electro Abrasives Electro-Ox white fused A12 0 3 powder with FEPA 1200 grit size (1-7 pm particle diameter range, with 50% of particle diameters between 2.5 and 3.5 pm).
Particle Impinge- Total Initial Final Velocity ment Particle Specimen Specimen Weight Erosion
Test (m/s) Angle Fluence Weight Weight Loss Rate No. [ift/s (0) (g) (g) (g) (g) (mg/g)
BI5 91 [3001
C9 91 [3001
B16 183 [6001
CIO 183 [600]
B17 305 [10001
C1l 305 [10001
B18 549 [18001
C12 549 [18001
D1 549 [18001
D2 549 [1800]
D3
D4
D5
D6
549 118001 549
[18001
549 [1800]
549 [18001
30 10 3.84285 3.84265 0.00020 0.020
30 20 3.7890 3.7890 0.0000 0.00
30 10 3.87000 3.86991 0.00009 0.009
30 20 3.7245 3.7245 0.0000 0.00
30 10 3.85186 3.85248 -0.00062 Deposition
30 20 3.8618 3.8584 0.0034 0.17
30 10 3.61308 3.61352 -0.00044 Deposition
30 20 3.8172
30 10 4.0661
30 10 4.0536
30 10 4.0372
30 20 3.9554
30 20 4.0494
30 20 3.9278
3.8092 0.0080 0.40
4.0578 0.0083 0.83
4.0450 0.0086 0.86
4.0285 0.0087 0.87
3.9366 0.0188 0.94
4.0321 0.0173
3.9085 0.0193
0.86
0.96
16
F- I 0) I C
Fig. 4. Comparison of observed erosion rates
"Y y=4.9e-8*VZS for Ni + 15% 1-7 pm A12 0 3 particles
0 .
i • Ni - ---- Ni + 15% Al203
0.00110 100 1000
V (m/s)
.- 0
0.1 "E =Fig. 5. Comparison of observed erosion rates "for Ni particles for tests with total
0 particle fluences of 10 and 20 g. ") 0.01 02.. 0
/--Ni 20Og 0 -m...Nl0
0.001 10 100 1000
V (m/s)
Overall, the experimental results indicate relatively low erosion rates under all of the conditions tested. The data are generally consistent within the four test series conducted. The observed lack of reproducibility from one test series to the next is somewhat troublesome, but the observed erosion rates are acceptably low in all cases.
17
1

Table 8. Results of particle erosion tests on Alloy 600 at 9000C (1652 0 F) to determine erosion rate as a
function of particle velocity for mixture of Ni and A12 0 3 particles at impingement angle of 300.
Erodent was Inco Type 123 Ni powder with particle diameters of 3-7 pm plus 15 wt. % Electro
Abrasives Electro-Ox white fused A12 0 3 powder with FEPA 1200 grit size (1-7 pm particle
diameter range, with 50% of particle diameters between 2.5 and 3.5 pm).
Particle Impinge- Total Initial Final Velocity ment Particle Specimen Specimen Weight Erosion
Test (m/s) Angle Fluence Weight Weight Loss Rate No. [ft/s] (0) (g) (g) (g) (g) (mg/g)
C13 91 30 20 3.8659 3.8659 0.0000 0.00
[3001 C14 183 30 20 3.8561 3.8561 0.0000 0.00
[6001
C15 305 30 20 3.7790 3.7790 0.0000 0.00 [1000]
C16 549 30 20 3.8335 3.8335 0.0000 0.00 [1800]
Table 9. Results of particle erosion tests on Alloy 600 at 700°C (12920F) in absence of erodent to
determine baseline erosion rate in hot gas stream. Test durations were =1 5 min, similar to
times used for erosion tests with particles at total particle loading of 10 g.
Particle Impinge- Total Initial Final Velocity ment Particle Specimen Specimen Weight Erosion
Test (m/s) Angle Fluence Weight Weight Loss Rate No. [ft/si (0) (g) (g) (g) (g) (mg/g)
B11 549 - - 3.84290 3.84284 0.00006
[1800]
B12 305 - - 3.96824 3.96820 0.00004
[10001
B13 183 - - 3.73809 3.73806 0.00003
[6001
B14 91 - - 4.02744 4.02742 0.00002
[3001
18

4 Crack-Opening Areas at High Temperatures
To determine the leak rate after throughwall penetration of axial cracks during severe accidents, it is necessary to estimate the crack-opening area as a function of time. 2 3 A simple model was developed to calculate the crack-opening area as a function of time and temperature during severe accidents. It is derived by analogy from a model that is applicable to cracks in a rectangular plate. The model was used to analyze crack opening areas in flawed tubes subjected to severe-accident transients.
4.1 A Model for Predicting Crack-Opening Area during Severe Accidents
Consider a throughwall central crack of length 2c in a rectangular plate of width 2b (b>>c) subjected to a remotely applied axial load P. For a material with stress-plastic strain law
S= a ,(4 )
the crack-opening displacement at the middle of the crack, ignoring elastic displacement, is given by2 4
8 = aeo0ch 2 (c / b, m' . (5)
In Eq. 5, Po = plastic collapse load, and the function h2 is tabulated in Ref. 24. Equation 5 was applied to the case of an axial crack in a relatively long steam generator tube by replacing
the remote stress with the nominal hoop stress a = APR (R and h are the mean radius and h
thickness of the tube, and Ap is the pressure differential), replacing the collapse stress with ao/m (m is the bulging factor), and putting c/b = 0:
5=ch 2 (0,m') OC)m (ma)"'. (6)
Equation 6 is expected to give reasonable estimates of crack-opening displacements as long as the pressure is small compared to the unstable burst pressure.
Equation 6 can be generalized for the high-temperature creep case as follows. If the material obeys a power law creep rate equation, i.e.,
S= Aan, (7)
then the crack opening rate is given by analogy with Eqs. 4 and 6 as follows:
8 = Ach 2 (0, n)(ma)n. (8)
19

4.1.1 Creep Rate Equation
Creep rate data obtained by INEEL are plotted in Fig. 6.25 The data at three temperatures can be collapsed onto a bilinear plot (log-log basis) by using an activation energy of 65 kcal/mole and plotting the stress normalized by the Young's modulus at temperature, as shown in Fig. 6.
4.1.2 Crack Opening Area for Axial Cracks
The function h2 (c/b, n) is plotted as a function of c/b for three values of n in Fig. 7a. Since our interest is in the value of h2 (0,n), the graphs were extrapolated to c/b = 0 by polynomial fits, and the results are plotted as a function of n in Fig. 7b.
The variation of crack opening rate with crack length calculated with Eq. 8 is shown in Fig. 8a for steam generator tubes at 700'C subjected to internal pressure of 16.2 MPa (2350 psi). Note that the crack opening rate increases very rapidly for crack lengths >10 mm (0.4 in.).
The crack opening area at temperatures of 700 and 750'C as a function of crack length for a SG tube subjected to a thermal transient characteristic of SBO "high-dry" accidentI (Case 6RU in NUREG-1570) is shown in Fig. 8b. Note that for temperatures >7500 C, cracks greater than 15 mm (0.6 in.) long will have crack opening areas that are greater than the tube crosssectional flow area (303 mm2 [0.47 in.21 for a 22.2 mm [0.875 in.]-dia. tube).
4.2 Validation Tests on Specimens with Circumferential Notches at High Temperature
4.2.1 Approach
Because in a tube under internal pressure, the crack opening area for a given crack length is much greater for an axial crack than it is for a circumferential crack, our primary interest is in axial cracks. It is extremely difficult, however, to carry out creep tests on tubular specimens with throughwall axial notches subjected to internal pressure. The validation tests were conducted instead on axially loaded tube specimens with two symmetrical throughwall circumferential notches (Fig. 9a) formed by electrodischarge machining (EDM). The symmetrical notches minimize bending and ensure a pure tensile loading on the notches similar to that experienced by axial cracks in an internally pressurized tube. By keeping the notch lengths short, we can minimize the effects of tube curvature. The small interaction between the two notches can be taken into account by using equations applicable to cracks in rectangular plates of finite width (Fig. 9b).
As mentioned earlier, the periodicity of the circumferential crack geometry requires that the corresponding rectangular plate be of finite width (Fig. 9b). The crack opening displacement (COD) of cracks in plates of finite width is given by Eq. 5 For the current geometry, the remotely applied axial load P = 27cRha, and the plastic collapse load Po = 2(n 20)Rho0, and Eq. 6 reduces to the following:
20

Fig. 6. INEEL creep rate on Alloy 600 vs. stress data plotted using activation energy of 65 kcal/mole and stress normalized by Young's modulus at temperature.
1010
S10 9
o ll o10
.- 106
~10o *
1 0
]u 10.5
o n=7 I "~ n=5 o n=3
0 0.1 0.2 c/b
2b
2c
"-.'-.
i . . .. t . . . 1 . - . .
7.5
7
"C 6.5
6
5.52 3 4 5
n6 7 8
0.3 0.4 0.5 0.6
(a) (b) Fig. 7. (a) Variation of h2 (c/b,n) with c/b for various values of n and (b) variation of h2 (0,n) with n.
Values of h2 (0,n) are 7.03 and 6.16 for n = 6.1 and 3.7, respectively.
(a0c2( )~ \C)M N-20 0), M E 7CyM, (9)
where a is the remotely applied axial stress, 20 is the angular length of each circumferential crack, R and h are the mean radius and thickness of the tube, and
c 20
b 7c
21
(10)
1011
1 0-3a/EM
8
7
6
5
-• 4
3
2
1 -0.1

Axial Crack Length (mm)
0 2 4 6 8 10 12
(D)
a) a,. 0 Ir"
C, 0
250
E 200 E
150
100 "E a) O. 0 50 (V
0 0
100
•.10-1
< 10-2
•,10-3 io
Axial Crack Length (in.) (a)
Axial Crack Length (mm) 5 100
Final T=
15
=7500C
Final T=7000C-
10
8
6
4
2
0 0 0.1 0.2 0.3 0.4 0.5 Axial Crack Length (in.)
0.6
100 ýE E
10 0
1 C
1)
0.1 0
0.01 0
(M)
Fig. 8. Variations of (a) crack-opening displacement rate with throughwall axial crack length for tube subjected to internal pressure of 16.2 MPa (2350 psi) at 700°C and (b) crack-opening area with crack length at final temperatures 700 and 750 0C for tube subjected to Case 6RU transient.
IP
IP (a) (b)
Fig. 9. (a) Tube with two symmetrical throughwall circumferential notches and (b) axial loading on tube with two symmetrical 450 notches plotted after making an axial cut and unfolding tube circumference into a plane.
22
,1 I , , , , I , , , , , , ,,1 - ,-
0.5
2.592"
0.324" 0.972" 0.324"
7E/4 3/47 7E/4
2ir
0.6
For example, c/b = 0.25 for 450 cracks. As before, under creep conditions, Eq. 8 by analogy gives an expression for the displacement rate,
nACh2( on) ( 7, )n.(1
The variation of the function h 2 (c/b, n) with c/b is shown in Fig. 10 for two values of n applicable to Alloy 600. Note that in contrast to axial cracks that were considered earlier, c/b # 0 for the circumferential notches.
4.2.2 Test Results
Six isothermal and nonisothermal tests were conducted to validate the approach. Two tests with 450 circumferential EDM notches were first conducted. The predicted notch opening with time for two symmetrical 450 circumferential cracks at two applied axial loads is compared with the experimentally observed notch opening in Figs. 1 la-b. The test under an axial load of 1107 kg (2440 Ib) (Fig. 1 la) was started initially at 695°C, but changed to 6850C after 1 h. The test under an applied axial load of 1225 kg (2700 lb) (Fig. 1 lb) was conducted at 6650C with less variation in temperature. Agreement between experimentally measured notch openings and predicted values is reasonably good.
Temperature control of the specimen was improved subsequently. The next series of tests involved 2 x 6.35 mm (0.25 in.) and 2 x 5.1 mm (0.20 in.) circumferential notches subjected to an axial load of 1107 kg (2440 lbs) at a constant temperature of 7001C. Figures 12a-b measured and predicted notch openings with time for these tests. As before, the predicted openings are close to the measured values.
All tests reported so far were conducted isothermally. To validate the model for nonisothermal loading, two tests were conducted in which the temperature was ramped following the Case 6RUI transient (Fig. 13). In the nonisothermal tests, displacements could be measured only at the end of the test. Both nonisothermal tests had a constant axial load of 1360 kg (3000 lb). Test CR 106 had 2 x 6.35 mm (0.25 in.) circumferential notches, and Test CR 108 had 2 x 5.1 mm (0.20 in.) circumferential notches. The predicted notch-opening displacement vs. temperature plots for the two tests are given in Figs. 14a-b, which also include the measured notch opening displacements at the end of the tests. One of the predicted notch openings is close to the measured value, and the other one is off by 20%.
23
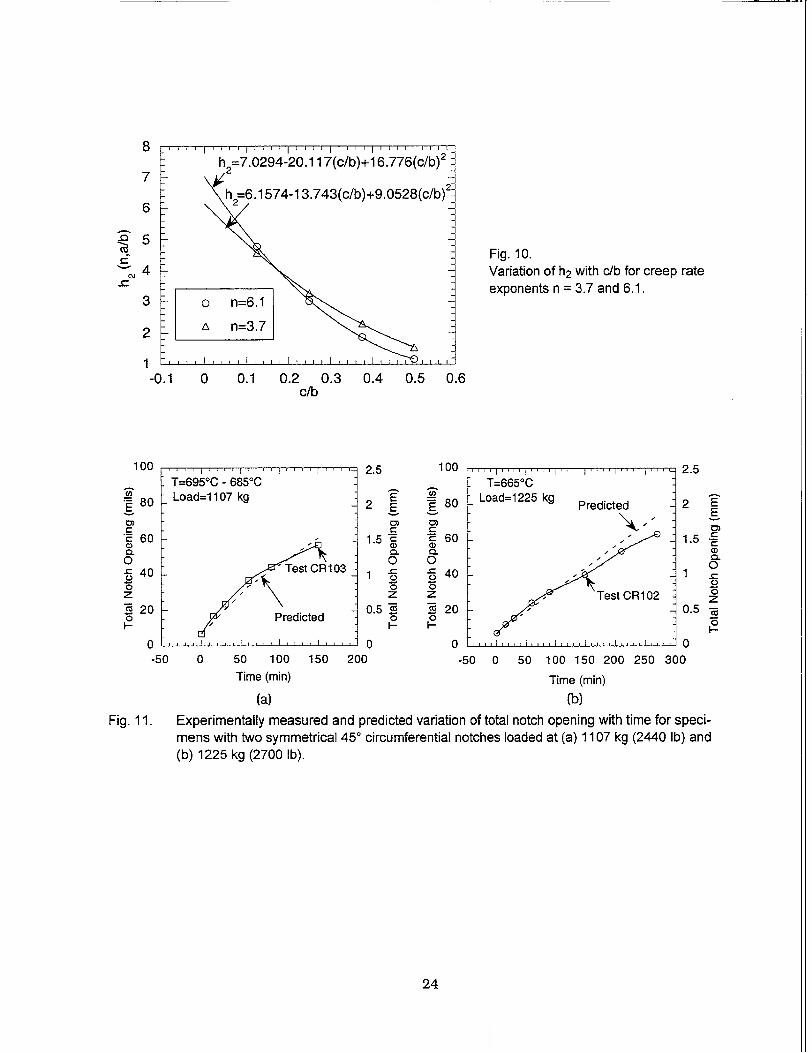
Fig. 10. Variation of h2 with c/b for creep rate exponents n = 3.7 and 6.1.
-0.1 0 0.1 0.2 0.3 0.4 0.5 0.6 c/b
ii=665'C Tdl9r
Predicted
...Test GR.102
r.
2.5
2 E E
1.5 .•
1 0
0 z
0.5 I.-
0 50 100 150
Time (min)
(a)
0 200-5 I05ll0Ill 100.150 200 250. 30
-50 0 50 100 150 200 250 300
Time (min)
(b)
Fig. 11. Experimentally measured and predicted variation of total notch opening with time for specimens with two symmetrical 450 circumferential notches loaded at (a) 1107 kg (2440 Ib) and (b) 1225 kg (2700 Ib).
24
8
7
6
5
"%4
3
2
1
100
S80
"E 60 a) 0 - 40 0 z @ 20 I
1A
_ -'' ................ 'I '' ' T=695°C - 685°C Load=1107 kg
'Test CR103
Predicted
2.5
E 2 E
1.5 •o 0
z 1.5 c
0
0
100
": 80
' 60 0
40
0 z S 20 0 I--
0 -50
..I K I K I I ..I I
Lo
, t30

0 50 100 150 200 Time (min)
2
E
1.5 E
(D SCI
U)
0.
0
0 0
70
_• 60
.- 50
0. 0
0
Z 20
0
(a)
-50 0 50 100 150 200 250 300 Time (min)
(b)
1.6
1.4
1.2
1
0.8
0.6
0.4
0.2
0
E E
0)
CL
0)
0
0
.5
z
".5 I-
Fig. 12. Experimentally measured and predicted variation of total notch opening with time for specimens with two symmetrical circumferential notches loaded at 1107 kg (2440 Ib) for notch lengths (a) 6.35 mm (0.25 in.) and (b) 5.1 mm (0.20 in.).
0 0.5 1 Time (min)
Fig. 13. Time vs. temperature plot for tests CR 106 and CR 108. Curve for CR 108 has been displaced in horizontal direction for clarity.
1.5 2
25
80
70
60
50
40
30
20
10
0
T=698°C Load=1107 kg Predicted
X-Test CR105
a) CL
0. 0 Z
Z t-7
0. z
I-
L--nnr
oad=1107 kg ,"
Test CRl17 ,
-,, Predicted:
,. I . I . . . .
800
700
600
o 500 I
400
300
200 -0.5
25
L
I I ý I I T ý . -. I I I I T j I ý 1 71,

-0.035 C
"- 0.03
E 0.025 0
*- 0.02 •5
,0.015
CLC 0.01 0 -5 0.005
0
500 550 600 650 700 750 800 T (-C)
(a)
S--0.06 0.8 E
C " 0.05 0.7C a) 0.6) E
0.6 o 0.04
0.5 . 'a
0.4 i"5 0.03 0.4
0.3 E 0.02
0.2 8L O
0.1 " 0.01 0 n
" [ , , 1 1 . . . . I . . . . I . . ... . . 0
00 550 600 650 700 750 800 T (-C)
(b)
Fig. 14. Comparison of predicted and experimentally measured (symbols) notch opening displacements for (a) two 6.4 mm (0.253 in.) circumferential notches (Test CR 106) and (b) two 5.2 mm (0.205 in.) circumferential notches (Test CR 108) loaded at 1360 kg (3000 Ib).
26
x Ia.... I.... I . . .
Axial oad=13 60kTT .. . I .. . . I ,es
kg ,
Test 1P,"
Pr-1e0 c
I Predicted
1.5 E E
1 15 E Ca
6
Cu
0._ C',
0
0.5 C CL 0.
0 C.,
o7
z5(

5 Jet Velocities and Flow Geometry
To determine the potential for degradation by jet impingement, the velocity of the jet, the velocities of the particles in the jet, and the mass loading of particles impinging on the adjacent tube must be estimated. In this section, the basic geometry of jets from cracks is discussed, some results drawn from analyses of jets in incompressible fluids are presented, and the results of detailed CFD analyses of high-temperature compressible jets are summarized.
5.1 Jet Geometry
The basic geometry of a jet from a leaking steam generator tube is shown schematically in Fig. 15. When the jet exits the leak, it begins to spread, entrain surrounding fluids, and eventually slow and dissipate. The spreading of the jet is dependent on the ratio of the distance the jet has traveled, L, to the initial width of the jet denoted by h for a twodimensional jet emanating from a slit or a crack or D for a round jet emanating from a pinhole.
For incompressible fluids, it can be shown 2 6 that the velocity of the two-dimensional jet is proportional to
(L -1/2
while for the round jet the velocity is proportional to
This is consistent with ordinary experience; fine jets dissipate over a much shorter distance than coarse jets.
The behavior of compressible jets is much more complex, but even in this case L/h is the critical parameter describing the jet geometry. For jets from cracks in steam generator tubes, L is determined by the distance to the adjacent tube, i.e., =6 mm (0.25 in.). The initial width of the jet h is determined by the crack-opening displacement and in the severe-accident case is a function of crack size, internal pressure, and temperature. The value of L/h as a function of crack length for the case of an MSLB and at temperatures of 700 and 750'C during a severeaccident 6RU transient is shown in Fig. 16. For cracks of<10 mm (0.4 in.) long, L/h is >100 in the case of an MSLB. For cracks of <6.35 mm (0.25 in.) long, L/h is >100 at 7000 C and >20 at 750'C during the "high dry" severe-accident sequence 6RU. 1
27
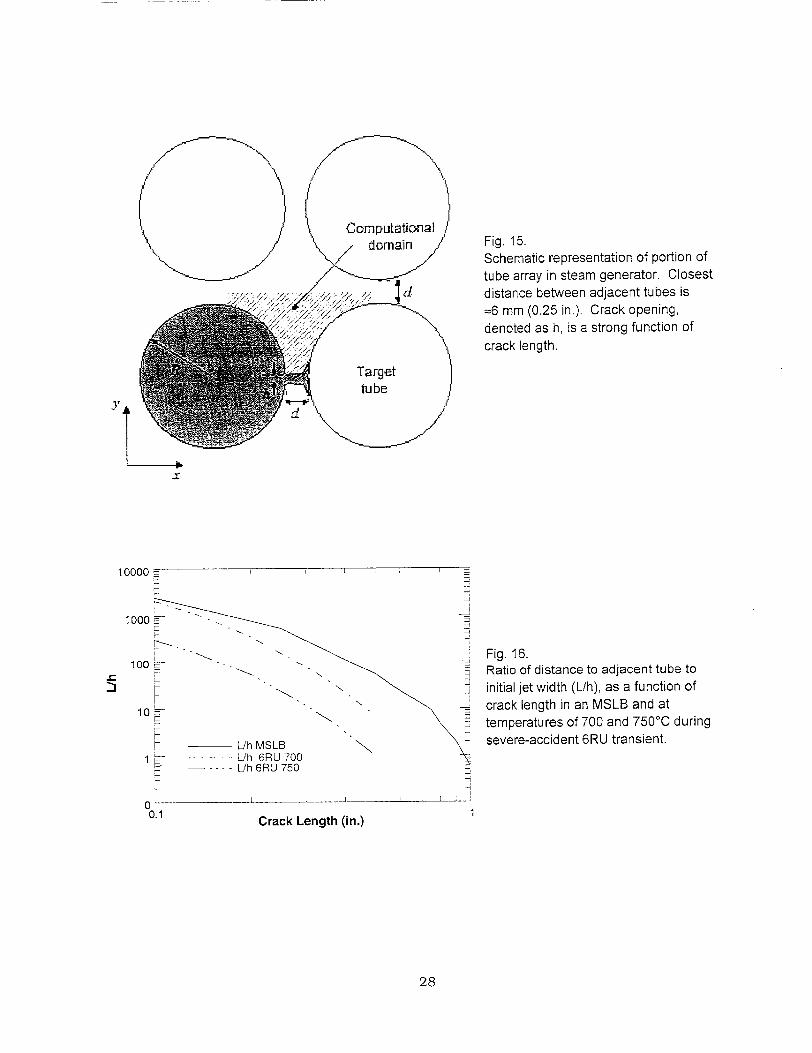
Fig. 15. Schematic representation of portion of
tube array in steam generator. Closest distance between adjacent tubes is =6 mm (0.25 in.). Crack opening,
denoted as h, is a strong function of
crack length.
y
N
10
S - L- h MSLB
1 -L/h 6RU 700 . h 6RU 750
0 0.1 ,
Fig. 16. Ratio of distance to adjacent tube to
j initial jet width (L/h), as a function of
crack length in an MSLB and at
temperatures of 700 and 7500C during severe-accident 6RU transient.
LracK Length (in.)
28
10000
1000
100
1im II

5.2 Summary of Computational Fluid Dynamics Results
A detailed description of the computational fluid dynamics calculations has been reported by Flack. 2 The basic geometry and computational grid used for the calculations are shown in Figs. 15 and 17. Some calculations were also performed with a triangular array of tubes. The jet is aligned along the x axis in Fig. 17. Because the pressure in the tube is much higher than on the secondary side of the steam generator, the jet expands rapidly and becomes supersonic. However, as the flow approaches the adjacent tube, it must decelerate, and a detached shock wave forms in front of the impacted tube. The position and strength of the detached shock wave depend on the stagnation pressure associated with the jet flow. The baseline calculations were performed for stagnation pressures of 8 and 16 MPa. (1160 and 2320 psi), a stagnation temperature of 1175 K (902'C), and a slit opening of 0.5 mm. The distance to the adjacent tube was taken as 8.23 mm (0.32 in.), which corresponds to an L/h value for the jet of =16. Comparison with the results in Fig. 16 shows that this is less than the predicted L/h ratio for cracks <6.35 mm (0.25 in.) in length for temperatures up to 7500C. The fluid properties were taken as those of air, and perfect gas behavior was assumed. The use of air rather than steam will lead to an underprediction of velocities by about 25%.
The predicted velocities in the direction of the jet axis and density are shown in Figs. 18 and 19. The standoff shock wave about 2 mm in front of the impacted tube is clearly evident, as is the spreading of the jet. Analyses were performed with a lower stagnation temperature (975 K [7020C]) and for a slit opening lOx as wide, which corresponds to an L/h value of =2. The change in stagnation temperature had relatively small effects on the flow, as can be seen from the distribution of Mach numbers shown in Fig. 20 and the velocities along the jet axis shown in Fig. 21. The change in jet geometry has a greater impact on the flow field. Jet expansion along the line of symmetry is inhibited, resulting in a lower Mach number and fluid velocity in the direction of the target tube. On the other hand, the sideways spreading rate is enhanced, and the fluid from the jet fills most of the gap between the two tubes.
The velocity shown in Fig. 18 is that of the fluid. The velocities of particles in the flow are primarily controlled by the drag of the fluid on the particle. Small, light particles tend to follow the fluid flow. Large heavy particles have trajectories that deviate significantly from the fluid flow. Particles of interest will have a mass <10-12 kg. The analysis reported by Flack3 shows that particles of this size track the fluid velocity very closely, as indicated in Fig. 22. The results in Fig. 22 are based on the assumption that the entrained particles are spherical. In reality, the particle shape is quite irregular, as well as rough. For the range of particle Reynolds numbers of interest, roughness effects would tend to decrease the drag coefficient (by a factor of 2, approximately) and thus increase the relative velocity between particles and fluid. Nonspherical shapes would also alter the drag coefficient, but would be quite unlikely to decrease it by more than a factor of 10. To estimate the effect that roughness and shape might have, a calculation was carried out in which the drag coefficient was decreased by a factor of 10 for particle Reynolds numbers >50. In this case, the largest particles struck the target tube, but with very low velocity (approximately 2 m/s).
2 "Steam Generator Jet Impingement Calculations," Memorandum to Nilesh C. Chokshi, USNRC/RES from John H. Flack USNRC/RES, December 26, 2000.
3 "Steam Generator Jet Impingement Calculations," Memorandum to Nilesh C. Chokshi, USNRC/RES from John H. Flack USNRC/RES, December 26, 2000.
29

x (mm)
10
12
-10 -6 -4 2 0 2 6 8 f 12 14 16 18
1200
300
Io
Fig. 17. Computational grid for CFD
calculations. Relationship of grid to overall tube geometry is indicated in
Fig. 15. Jet is emitted from tube on left
and is directed along x axis (b.c. =
boundary condition).
Fig. 18. Streamlines and velocities for jet directed along x axis. Because of symmetry, only half of jet is shown.
Fig. 19. Density variations for jet directed along
x axis. Because of symmetry, only half of jet is shown.
.K9
217
195
"-" 0.0 -06
-0,4
X (HM)}
30
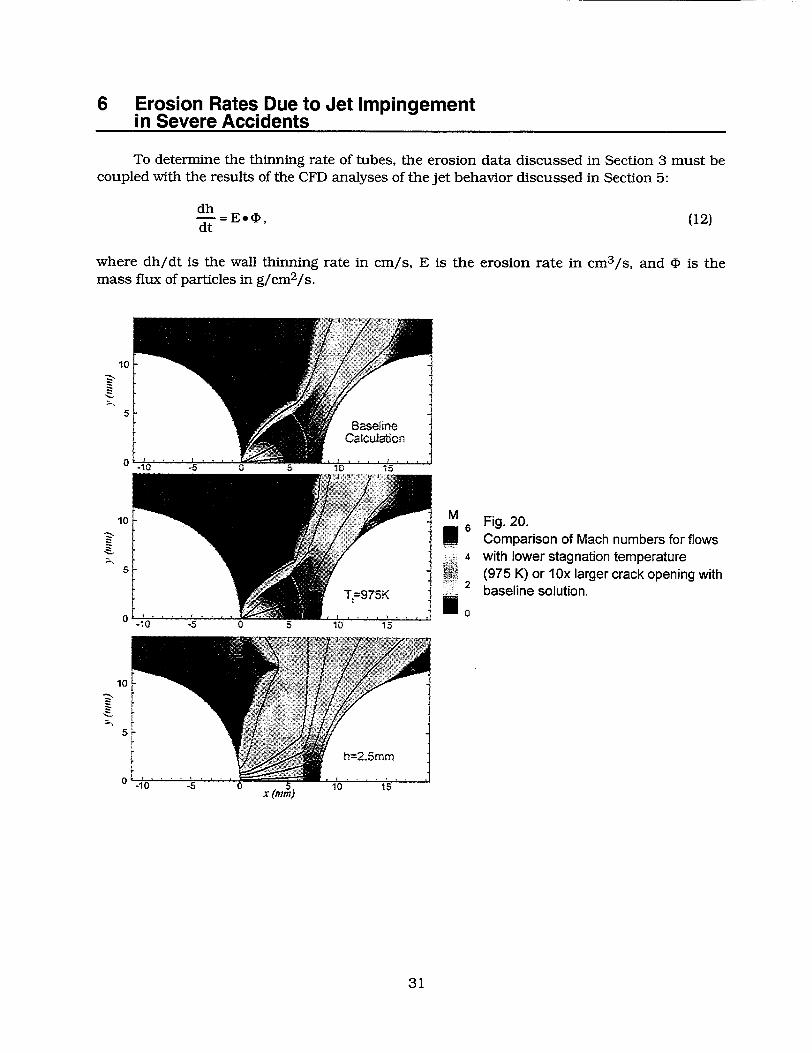
6 Erosion Rates Due to Jet Impingement in Severe Accidents
To determine the thinning rate of tubes, the erosion data discussed in Section 3 must be coupled with the results of the CFD analyses of the jet behavior discussed in Section 5:
dh dt (12)
where dh/dt is the wall thinning rate in cm/s, E is the erosion rate in cm 3 /s, and (D is the mass flux of particles in g/cm2/s.
Fig. 20. Comparison of Mach numbers for flows with lower stagnation temperature (975 K) or 1Ox larger crack opening with baseline solution.
M 6
4
2
x (in A)
31
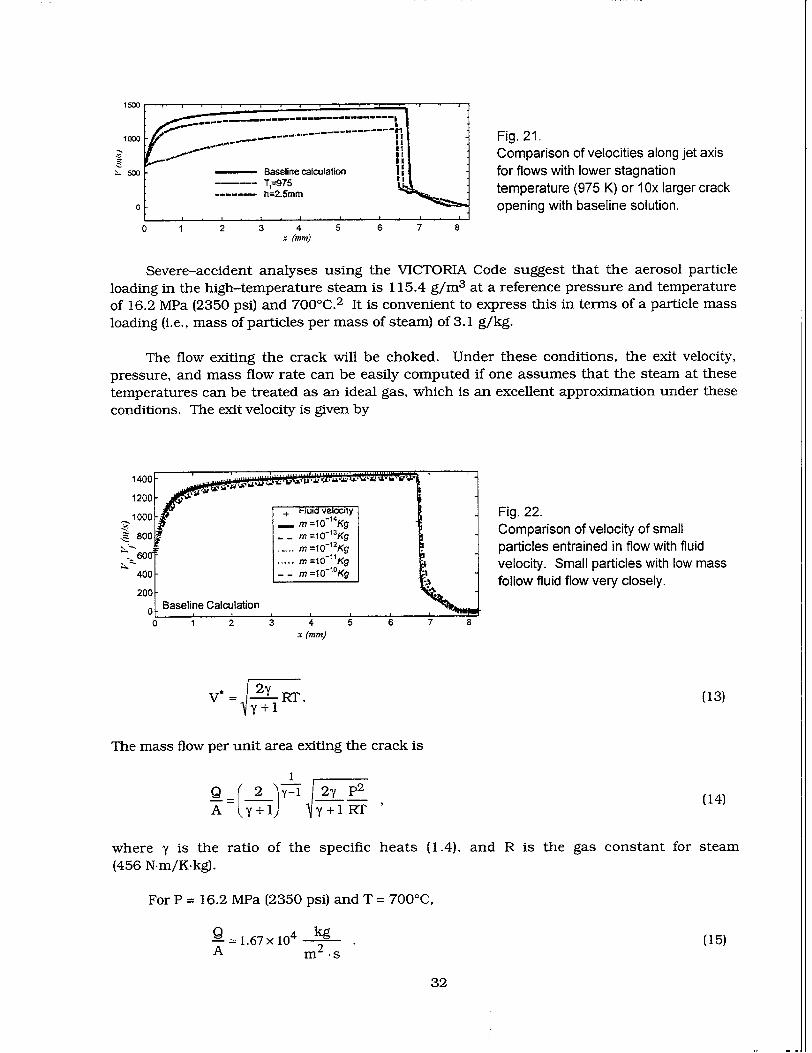
1500
1o0o•0 Fig. 21. I ,,Comparison of velocities along jet axis
-500 - Baseline calculation 1 for flows with lower stagnation T,--975 I
- -- 9 h=2.mm temperature (975 K) or 1 Ox larger crack 0 opening with baseline solution.
0 1 2 3 4 5 6 7 8 x (M m)
Severe-accident analyses using the VICTORIA Code suggest that the aerosol particle loading in the high-temperature steam is 115.4 g/m 3 at a reference pressure and temperature of 16.2 MPa (2350 psi) and 700'C.2 It is convenient to express this in terms of a particle mass loading (i.e., mass of particles per mass of steam) of 3.1 g/kg.
The flow exiting the crack will be choked. Under these conditions, the exit velocity, pressure, and mass flow rate can be easily computed if one assumes that the steam at these temperatures can be treated as an ideal gas, which is an excellent approximation under these conditions. The exit velocity is given by
1400 .. : .,.
1200
1000t + -ui veiociy Fig. 22. 800- m =10-'3Kg Comparison of velocity of small
• -0 -... m =10-1Kg
M =10-1 2Kg - particles entrained in flow with fluid ~6WO =-11q 400 m=10Kg velocity. Small particles with low mass
follow fluid flow very closely. 200°
_ Baseline Calculation 0 1 2 3 4 5 6 7 8
x (mm)
V* = RT. (13)
The mass flow per unit area exiting the crack is
1 Q(2 y-, 2y p2 (4
L=y+ 1) y"+1 RT'
where y is the ratio of the specific heats (1.4), and R is the gas constant for steam (456 N-m/K.kg).
For P = 16.2 MPa (2350 psi) and T = 7000C,
1=1.67x10⁴ kg (15) A m2 -s
32
The mass flux of particles exiting the crack is 5.2 g/cm2/s with the assumed particle loading. This calculation conservatively neglects any losses in passing through the crack.
From the CFD results for the velocity (Fig. 18) and density (Fig. 19) of the jet, it is seen that just in front of the shock the jet has expanded from ±0.25 mm in width to = +2.5 mm. The maximum fluid velocity along the centerline is 1400 m/s (4600 ft/s). The velocity across the shock is 300 m/s (985 ft/s), and the fluid velocity decreases rapidly as the jet approaches the impacted tube. For the aerosol particles of interest, which have masses <10-12 kg, the particle motions are expected to track the fluid motions very closely, as seen from the CFD results in Fig. 22.
To determine the erosion rate, we must determine the fraction of particles in the jet that strike the tube. The results of Fig. 22 suggest that the particles will follow the fluid and that very few will strike the tube. We make the more conservative assumption that because the density and velocity are fairly uniform across the jet just before the shock, the mass flux is also uniform across the jet and that all the particles do strike the tube. This gives a mass flux of 0.52 g/cm2 /s.
Sensitivity studies of the effect of shape and roughness discussed in Section 5.2 showed that even with conservative assumptions, the largest aerosol particles would be expected to strike the tube at velocities of 2 m/s. If we make the conservative assumptions that the impact velocity is =200 m/s and that the erodent particles are 3-7 gm diameter Ni particles, then the power law estimate of the erosion rate of Alloy 600 given by Eq. 1, together with the estimate of the mass flux (0.52 g/cm2 /s), suggests that the maximum wall thinning rate will be less than (8.0 X 10-12 x 2002.43 x 0.52 x 36000) = 0.06 mm/h (2 mil/h).
There is additional conservatism associated with the jet geometry. The CFD calculations discussed in Section 5.2 assumed a jet geometry of L/h = 16. These results are likely to be very conservative for cracks <6.3 mm (0.25 in.) in length for temperatures <7000C, for which L/h > 200 as shown in Fig. 16. Thus, the bounding rate of 2 mil/h should be applied only for that portion of the history for which the temperature is >7000C.
These results suggest that the scoping estimate in NUREG-1570 that the jet from a 6.3 mm (0.25 in.) crack would fail an adjacent tube in a relatively short time (between a few minutes and =1 h) is extremely conservative. Even after such a crack had opened by creep at high temperatures, failure of an adjacent tube would take >10 h. However, once the system has reached these high temperatures, failure of some primary system component, including unflawed steam generator tubes, by creep would be expected to occur in <1 h. Thus, jet impingement is very unlikely to play any significant role in the failures.
33
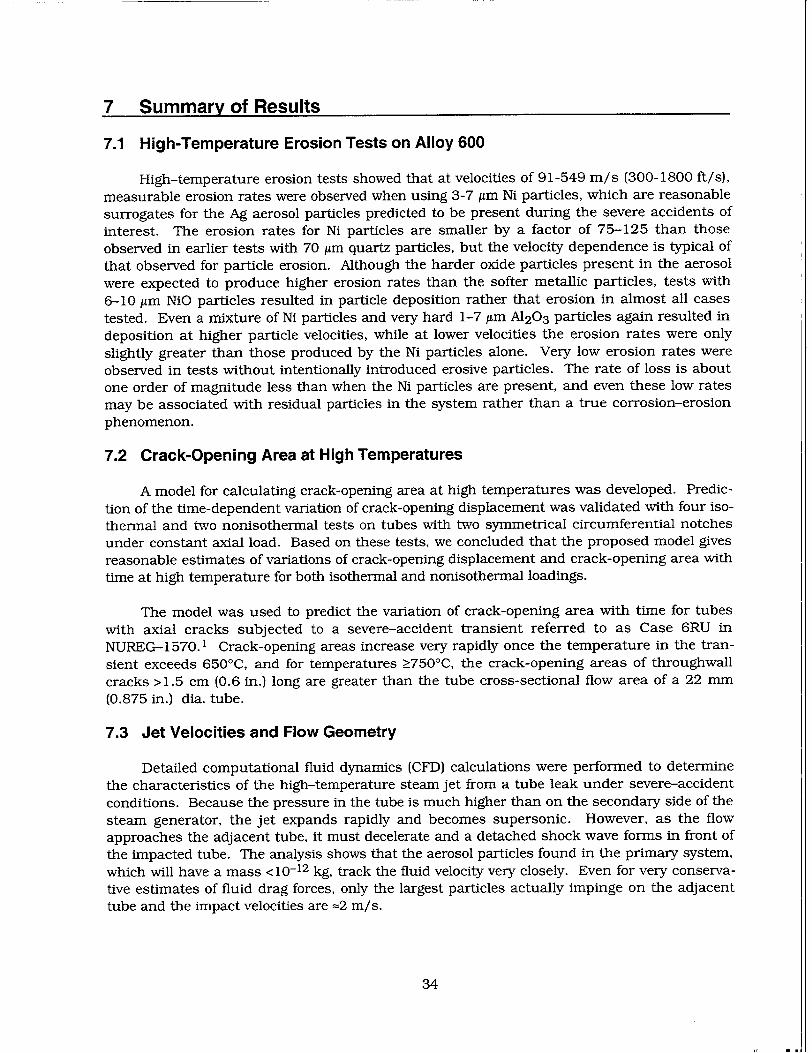
7 Summary of Results
7.1 High-Temperature Erosion Tests on Alloy 600
High-temperature erosion tests showed that at velocities of 91-549 m/s (300-1800 ft/s), measurable erosion rates were observed when using 3-7 Am Ni particles, which are reasonable surrogates for the Ag aerosol particles predicted to be present during the severe accidents of interest. The erosion rates for Ni particles are smaller by a factor of 75-125 than those observed in earlier tests with 70 Am quartz particles, but the velocity dependence is typical of that observed for particle erosion. Although the harder oxide particles present in the aerosol were expected to produce higher erosion rates than the softer metallic particles, tests with 6-10 Am NiO particles resulted in particle deposition rather that erosion in almost all cases tested. Even a mixture of Ni particles and very hard 1-7 uin A120 3 particles again resulted in deposition at higher particle velocities, while at lower velocities the erosion rates were only slightly greater than those produced by the Ni particles alone. Very low erosion rates were observed in tests without intentionally introduced erosive particles. The rate of loss is about one order of magnitude less than when the Ni particles are present, and even these low rates may be associated with residual particles in the system rather than a true corrosion-erosion phenomenon.
7.2 Crack-Opening Area at High Temperatures
A model for calculating crack-opening area at high temperatures was developed. Prediction of the time-dependent variation of crack-opening displacement was validated with four isothermal and two nonisothermal tests on tubes with two symmetrical circumferential notches under constant axial load. Based on these tests, we concluded that the proposed model gives reasonable estimates of variations of crack-opening displacement and crack-opening area with time at high temperature for both isothermal and nonisothermal loadings.
The model was used to predict the variation of crack-opening area with time for tubes with axial cracks subjected to a severe-accident transient referred to as Case 6RU in NUREG-1570.1 Crack-opening areas increase very rapidly once the temperature in the transient exceeds 6500C, and for temperatures Ž7500C, the crack-opening areas of throughwall cracks >1.5 cm (0.6 in.) long are greater than the tube cross-sectional flow area of a 22 mm (0.875 in.) dia. tube.
7.3 Jet Velocities and Flow Geometry
Detailed computational fluid dynamics (CFD) calculations were performed to determine the characteristics of the high-temperature steam jet from a tube leak under severe-accident conditions. Because the pressure in the tube is much higher than on the secondary side of the steam generator, the jet expands rapidly and becomes supersonic. However, as the flow approaches the adjacent tube, it must decelerate and a detached shock wave forms in front of the impacted tube. The analysis shows that the aerosol particles found in the primary system, which will have a mass <10-12 kg, track the fluid velocity very closely. Even for very conservative estimates of fluid drag forces, only the largest particles actually impinge on the adjacent tube and the impact velocities are =2 m/s.
34
7.4 Erosion Rates Due to Jet Impingement in Severe Accidents
To determine rate of thinning of tubes, the erosion data miist be coupled with the results of the CFD analyses of the jet behavior. The CFD analyses show that only the largest aerosol particles would be expected to strike the tube and that the impact velocity would be -2 m/s. Even with the more conservative assumption that the impact velocity is =200 m/s, the erosion data for Alloy 600, together with a conservative estimate of the mass flux, suggests that the maximum wall thinning rate will be <2 mil/h.
Even after such a crack had opened by creep at high temperatures, failure of an adjacent tube by jet impingement would take >10 h. However, once the system has reached these high temperatures, failure of some primary system component, including unflawed steam generator tubes, by creep would be expected to occur in <1 h. Thus, jet impingement is very unlikely to play a significant role.
35
References
1. SGTR Severe-Accident Working Group, "Risk Assessment of Severe-Accident-Induced Steam Generator Tube Rupture," NUREG-1570, U.S. Nuclear Regulatory Commission, Washington, DC, 1998, pp. 5-1 to 5-25.
2. D. R. Diercks, "Minutes of Expert's Meeting on Jet Impingement and Leak Rates from Steam Generator Tubes During Severe Accidents," held at Argonne National Laboratory (ANL) on Nov. 19, 1999, minutes published Dec. 6, 1999.
3. K. Anand, S. K. Hovis, H. Conrad, and R. 0. Scattergood, "Flux Effects on Solid Particle Erosion," Wear, Vol. 118 (1987), pp. 243-257.
4. T. H. Kosel, "Solid Particle Erosion," Metals Handbook, 10th Ed., Vol. 18 (Friction, Lubrication, and Wear Technology), ASM International, Materials Park, OH (1992), pp. 199213.
5. S. Majumdar, K. Natesan, and A. Sarajenidi, "A Review of Solid Particle Erosion of Engineering Materials," Argonne National Laboratory Report ANL/FE-88-1 (Dec. 1987), pp. 25-29.
6. G. P Tilly, "A Two-Stage Mechanism of Ductile Erosion," Wear, Vol. 23 (1973), pp. 87-96.
7. A. Misra and I. Finnie, "On the Size Effect in Abrasive and Erosive Wear," Wear, Vol. 65
(1981), pp. 359-373.
8. I. G. Wright and V. Nagarajan, "Design of Materials for Use under Erosion/Corrosion Conditions at High Temperature in Coal Gasification and Coal Combustion Systems," in Proceedings of the Fifth Annual Conference on Materials for Coal Conversion and Utilization, U.S. Department of Energy (1980), pp. 11-18 to 11-22.
9. K. Wellinger and H. Uetz, "Gleit-, Spill-, und Strahlverschleiss Prilfung," Wear, Vol. 1 (1957-58), pp. 225-231.
10. J. Maji and G. L. Sheldon, "Mechanisms of Erosion of a Ductile Material by Solid Particles," in Erosion: Prevention and Useful Applications, ASTM STP 664, American Society for Testing and Materials (1979), pp. 136-147.
11. R. Brown, E. Jin Jun, and J. W. Edington, "Mechanisms of Erosive Wear for 900 Impact on Copper and Iron Targets," in Proc. Int. Conf. on Wear of Materials, American Society of Mechanical Engineers (1981), pp. 583-591.
12. I. Finnie, "Erosion of Surfaces by Solid Particles," Wear, Vol. 3 (1960), pp. 87-103.
13. I. Finnie, "An Experimental Study of Erosion," Proc. Soc. Exper. Stress Anal., Vol. 17 (1960), pp. 65-70.
37
14. J. S. Hansen, "Relative Erosion Resistance of Several Materials," in Erosion: Prevention and Useful Applications, ASTM STP 664, American Society for Testing and Materials (1979), pp. 148-162.
15. G. Sundararajan, "The Solid Particle Erosion of Metallic Materials at Elevated Temperatures," Proc. Conf. on Corrosion-Erosion-Wear of Materials at Elevated Temperatures, A. V. Levy, ed., National Association of Corrosion Engineers (1991), paper 11.
16. I. Finnie, J. Wolak, and Y. Kabil, "Erosion of Metals by Solid Particles," J. Materials, Vol. 2 (1967), pp. 682-700.
17. G. A. Sargent, M. K. Keshavan, P. K. Mehrota, and H. Conrad, "The Erosion of Plain Carbon Steels by Ash Particles from a Gasifier," Proc. Int. Conf. on Wear of Materials, American Society of Mechanical Engineers (1981), pp. 613-618.
18. J. Salik and D. H Buckley, "Effects of Erodent Particle Shape and Various Heat Treatments on Erosion Resistance of Plain Carbon Steels," Technical Paper 1755, National Aeronautics and Space Administration (1981).
19. A. V. Levy and S. Jahanmir, "The Effects of the Microstructure of Ductile Alloys on Solid Particle Erosion Behavior," Corrosion-Erosion Behavior of Materials, TMS-AIME (1980), pp. 177-189.
20. D. M. Rishel, F. S. Petit, and N. Birks, "Some Principal Mechanisms in the Simultaneous Erosion and Corrosion Attack of Metals at High Temperature," Proc. Conf. on CorrosionErosion-Wear of Materials at Elevated Temperatures, A. V. Levy, ed., Natl. Assn. of Corrosion Engineers (1991), paper 16.
21. W. Tabakoff, in Proc. 6th Int. Conf. on Erosion by Liquid and Solid Inmpact, J. E. Field and N. S. Corney, eds., University of Cambridge (1983), p. 55-1.
22. W. Tabakoff and B. V. R. Vittal, "High Temperature Erosion Study of INCO 600 Metal," Wear, Vol. 86 (1983), pp. 89-99.
23. S. Majumdar, W. J. Shack, D.R. Diercks, K. Mruk, J. Franklin, and L. Knoblich, "Failure Behavior of Internally Pressurized Flawed and Unflawed Steam Generator Tubing at High Temperatures - Experiments and Comparison with Model Predictions," NUREG/CR-6575, Argonne National Laboratory Report ANL-97/17, 1998, pp. 26-27.
24. V. Kumar, M. D. German, and C. F. Shih, "An Engineering Approach for Elastic-Plastic Fracture Analysis," EPRI NP-1931, Electric Power Research Institute, 1981, pp. 3-12 to 335.
25. J. L. Rempe, S. A. Chavez, G. L. Thinnes, C. M. Allison, G. E. Korth, R. J. Witt, J. J. Sienicki, S. K. Wang, L. A. Stickler, C. H. Heath, and S. D. Snow, "Light Water Reactor Lower Head Failure Analysis," NUREG/CR-5642, EGG-2618, Idaho National Engineering Laboratory, Oct. 1993, pp. B-10 to B-18.
38
26. H. Schlichting, Boundary-Layer Theory, 4th Ed., McGraw Hill, New York, 1968, pp. 590609.
39
NRC FORM 335 U.S. NUCLEAR REGULATORY COMMISSION 1. REPORT NUMBER (2-89) (Assigned by NRC. Add Vol., Supp., Rev., NRCM 1102, and Addendum Numbers, if any.) 3201,2 BIBLIOGRAPHIC DATA SHEET NUREG/CR-6756
(See instructions on the reverse)
2. TITLE AND SUBTITLE
Analysis of Potential for Jet-Impingement Erosion From Leaking Steam Generator Tubes during Severe Accidents 3. DATE REPORT PUBLISHED
MONTH YEAR
May 2002 4. FIN OM GRANT NUMBER
W6487 5. AUTHOR(S) 6. TYPE OF REPORT
S. Majumdar, D. R. Diercks, and W. J. Shack 7. PERIOD COVERED (Inclusive Dates)
8. PERFORMING ORGANIZATION - NAME AND ADDRESS (If NRC, provide Division, Office or Region, U.S. Nuclear Regulatory Commission, and mailing address; iffcontractor, provide name and mailing address.)
Argonne National Laboratory 9700 South Cass Avenue Argonne, IL 60439
9. SPONSORING ORGANIZATION - NAME AND ADDRESS (If NRC, type "Same as above": if contractor, provide NRC Division, Office or Region, U.S. Nuclear Regulatory Commission, and mailing address.)
Division of Engineering Office of Nuclear Regulatory Research U. S. Nuclear Regulatory Commission Washington, DC 20555
10. SUPPLEMENTARY NOTES
J. Muscara, NRC Project Manager
11. ABSTRACT (200 words or less)
This report summarizes analytical evaluation of crack-opening areas and leak rates of superheated steam through flaws in steam generator tubes and erosion of neighboring tubes due to let impingement of superheated steam with entrained particles from core debris created during severe accidents. An analytical model for calculating crack-opening area as a function of time and temperature was validated with tests on tubes with machined flaws. A three-dimensional computational fluid dynamics code was used to calculate the jet velocity impinging on neighboring tubes as a function of tube spacing and crack-opening area. Erosion tests were conducted in a hightemperature, high-velocity erosion rig at the University of Cincinnati, using micrometer-sized nickel particles mixed in with high-temperature gas from a burner. The erosion results, together with analytical models, were used to estimate the erosive effects of superheated steam with entrained aerosols from the core during severe accidents.
12. KEY WORDS/DESCRIPTORS (List words or phrases that will assist researchers in locating this report.) 13. AVAILABILITY STATEMENT
Steam Generator Unlimited Tubes 14. SECURITY CLASSIFICATION
Erosion (This Page)
Impingement Unclassified Severe Accidents (This Report)
Unclassified 15. NUMBER OF PAGES
16. PRICE
INU FUOM 33 (2-89)

Federal Recycling Program
Related Documents