ii ANALYSIS OF PARTIAL LEAST SQUARE ESTIMATION PROCESS AND CONTROL OF DISTILLATION COLUMN PROCESS NURUL HAMIZAH BINTI BAHARAN A thesis submitted in fulfilment of the requirements for the award of the degree of Bachelor of Engineering (Chemical) Faculty of Chemical Engineering and Natural Resources University College of Engineering & Technology Malaysia NOVEMBER 2006

Welcome message from author
This document is posted to help you gain knowledge. Please leave a comment to let me know what you think about it! Share it to your friends and learn new things together.
Transcript
ii
ANALYSIS OF PARTIAL LEAST SQUARE ESTIMATION PROCESS AND
CONTROL OF DISTILLATION COLUMN PROCESS
NURUL HAMIZAH BINTI BAHARAN
A thesis submitted in fulfilment of the
requirements for the award of the degree of
Bachelor of Engineering (Chemical)
Faculty of Chemical Engineering and Natural Resources
University College of Engineering & Technology Malaysia
NOVEMBER 2006

iii
I declare that this thesis entitled “Analysis of Partial Least Square estimation process
and control of distillation column process” is the result of my own research except as
cited in the references. The thesis has not been accepted for any degree and is not
concurrently submitted in candidature of any other degree.
Signature :
Name : NURUL HAMIZAH BINTI BAHARAN
Date : 22 NOVEMBER, 2006
iv
To my beloved mother, father, younger brothers.
Thank you for your supporting.
v
ACKNOWLEDGEMENT
I feel grateful to Allah s.w.t because this thesis has successfully completed. I
would like to convey my appreciation and thankful to my supervisor, Encik Noor
Asma Fazli Abdul Samad for being my personal navigator who always guided me
back on track whenever I am lost. Also his kindness on delivering me his knowledge
on writing the thesis and lead me for encouragement, support, critics and advises.
Besides that, I also would like to dedicate my appropriation to all my
lecturers in the Faculty of Chemical Engineering and Natural Resources (FKKSA),
for their support and motivation during this project development.
I would like to thanks to my beloved friends Aizuddin (ajud), Faira, Linda,
Marcell and Dillot for your companionship and support. Also thanks for my fellow
friends that have support me a lot, help and advise me to be strongly and confident
for doing this thesis. Not forgotten, my parents, Baharan Abbas and Kamariah Abu
Bakar for their support and encouragement my younger brothers Zul Hakim and Zul
Zarif.
vi
ABSTRACT
Distillation columns are the most important separation process in unit
operation. The used of distillation column is widely in industries especially in
chemical and petroleum industries for separating the substances based on the
differences of substances volatility. To incentive economic and control the quantity
of the product in the industry, on-line handling the control system is needed and the
MATLAB programming is proposed. In this thesis, the distillation column
programme in MATLAB is used to analysis of Partial Least Square (PLS) Estimation
Process and Control of Distillation Column Process. The analysis worked by
generated the data for dynamic response and the base case control in nominal
condition. Based on the generated data the estimation product is predicted by using
the PLS estimator to maintain the desired product when the disturbance occurs. The
estimation result show that the prediction data is nearest to actual data. Based on the
result the distillation column control programme is proposed to be the best control
process.

vii
ABSTRAK
Kolum penyulingan adalah proses pemisahan yang terpenting di dalam unit
operasi. Penggunaan kolum penyulingan ini sangat meluas di dalam industri terutama
sekali dalam industri kimia dan petroleum dengan tujuan memisahkan bahan-bahan
di dalam campuran berdasarkan kepada perbezaan kebolehan meruap bahan tersebut.
Bagi meransangkan pembangunan ekonomi serta mengawal pengeluaran jumlah
produk di dalam industri, pengawal system control secara ‘on-line’ amatlah
diperlukan dan penggunaan program MATLAB disarankan. Di dalam tesis ini,
program kolum penyulingan di dalam MATLAB digunakan bagi menganalisa
“Partial Least Square (PLS) Estimation Process and Control of Distillation Column
Process”. Analisis dapat dijalankan dengan menghasilkan data untuk respon dinamik
dan kawalan kes dasar pada keadaan biasa. Berdasarkan daripada data yang
dihasilkan produk yang dihasilkan adalah anggaran daripada PLS estimator dengan
mengekalkan produk yang dikehendaki apabila gangguan wujud. Keputusan
anggaran menunjukkan bahawa anggaran produk adalah berhampiran dengan produk
yang sebenar. Berdasarkan keputusan ini, program pengawalan kolum penyulingan
menggunakan system ini adalah system pengawalan yang terbaik.

viii
TABLE OF CONTENT
CHAPTER
TITLE PAGE
TITLE PAGE i
DECLARATION ii
DEDICATION iv
ACKNOWLEDGEMENT v
ABSTRACT vi
ABSTRAK vii
TABLE OF CONTENTS viii
LIST OF FIGURES xi
LIST OF TABLES xiii
LIST OF APPENDICES xiv
LIST OF SYMBOLS
xv
1 Introduction 1
1.1 Introduction 1
1.2 Problem statement 3
1.3 Objectives 4
1.4 Scope of study
1.5 Work of Planning Schedule
4
5
2 Literature Review 6
2.1 Overview of distillation column 6
2.1.1 The theory of distillation column
2.1.1.1 Roult’s Law
2.1.1.2 Dalton’s Law
2.1.2 Types of Distillation column
7
7
8
10
ix
2.1.2.1.1 Equilibrium or flash distillation
column
2.1.2.1.2 Simple batch or differential
distillation column
2.1.2.2 Simple steam distillation column
2.1.3 Distillation column method
2.1.3.1 Distillation with reflux
10
11
11
12
12
2.2 PID Controller
2.2.1 The basics of control loop
2.2.2 The theory of PID controller
2.2.3 Tuning Method
14
15
15
18
2.3 MATLAB 18
2.3.1 The matlab system
2.3.1.1.1 Desktop tools and development
environment
2.3.1.1.2 The matlab mathematical function
library
2.3.1.2 The matlab language
2.3.1.3 Graphic
2.3.1.4 The matlab external interfaces/APL
19
21
21
21
22
22
2.3.2 Simulink 22
2.4 Methanol 24
2.4.1 Production of Methanol
2.4.2 Hazard identification of methanol
2.5 Introduction for development of process estimator
using partial least square
2.5.1 Partial Least Square
2.5.2 Structure of PLS model
2.5.3 Model development
2.5.4 Model input selection
2.5.5 Data generation
2.5.6 Data pre-processing
2.5.7 Model training and validation
24
26
27
28
28
31
32
32
32
33

x
3 Methodology 35
3.1 Introduction 35
3.2 Simulating base case control for the distillation
column
37
3.3 Simulating on dynamic response for distillation
column
40
3.4 Simulating the process with controller (PID) with
tuning included
44
3.5 Development of PLS method 46
3.6 PLS model testing
50
4 Result and discussion 51
4.1 Introduction 51
4.2 Result for simulating base case control for
distillation column
4.3 Analysis of dynamic response basedon case study
4.3.1 Vapor flow rate
4.3.2 Reflux ratio
4.3.3 Feed composition
4.3.4 Feed flow
4.4 Result for process of distillation column with
controller
4.5 Development PLS based estimator
4.6 PLS model testing
4.6.1 Model A
4.6.2 Model B
51
52
53
55
56
58
60
61
65
65
67
5 Conclusion
5.1 Conclusion
5.2 Recommendation for the future work
70
70
71
REFERENCE
72
APPENDICES A-D 74-85
xi
LIST OF FIGURES
FIGURE NO. TITLE PAGE
2.1
2.2
2.3
2.4
2.5
2.6
2.7
3.1
3.2
3.3-3.4
3.5
3.6
3.7-3.8
3.9
3.10
3.11
3.12
3.13
3.14
3.15
3.16
3.17
Alembic
Flash distillation
Reflux distillation column
MATLAB
Example of Simulink
Schematic of PLS model
Procedure for formulating PLS estimator
Methodology block diagram
Simulating base case control for distillation column
Main menu for distillation column
Simulink for distillation column with controller
Simulating on dynamic response for distillation
column
Main menu for distillation column
Simulink for the distillation column
Simulink graph for the distillation column
Simulating process with controller for distillation
column
Simulink for the distillation column with controller
Simulink graph for the distillation column with
controller
Simulating process with controller for distillation
column
The simulink and simulink graph for the distillation
column
The data of the PLS
PLS programme
6
10
13
20
23
29
31
36
37
38
39
40
41
42
42
43
44
44
45
46
46
47

xii
3.18
3.19
3.20
4.1
4.2-4.5
4.6-4.9
4.10-4.12
4.13-4.16
4.17
4.18
4.19
4.20
4.21
4.22
4.23
4.24
4.25
4.26
4.27
Data from the MATLAB
Simulink graph will appear as a result
Simulating for the PLS model testing
The result for base case control of distillation column
(nominal)
The result for dynamic response of distillation column
(vapor)
The result for dynamic response of distillation column
(reflux ratio)
The result for dynamic response of distillation column
(feed composition)
The result for dynamic response of distillation column
(feed flow)
The result for process control of distillation column
with controller
MSE of training and validation data
Data Percent Variance captured by PLS Model
Training using PLS model
Validation using PLS model
Data Percent Variance captured by PLS Model
Training using PLS model
Validation using PLS model
Data Percent Variance captured by PLS Model
Training using PLS model
Validation using PLS model
47
48
50
51
53
55
56
58
60
61
62
63
64
65
66
66
67
68
68
xiii
LIST OF TABLES
TABLE NO. TITLE PAGE
2.1
2.2
2.3
2.4
4.1
4.2
Effects of increasing parameters
Chemical and physical properties
Potential health effect
Algorithm of PLS model
Summary of PLS estimation results
Comparison of MSE for PLS model
19
24
26
30
61
67

xiv
LIST OF APPENDICES
APPENDIX TITLE PAGE
A
B
C
D
Data generation for base case control for distillation
column
Data generation for dynamic response for distillation
column process
Data generation for partial Least Square estimation
process
Data generation for partial Least Square estimation
process
71
76
79
82
xv
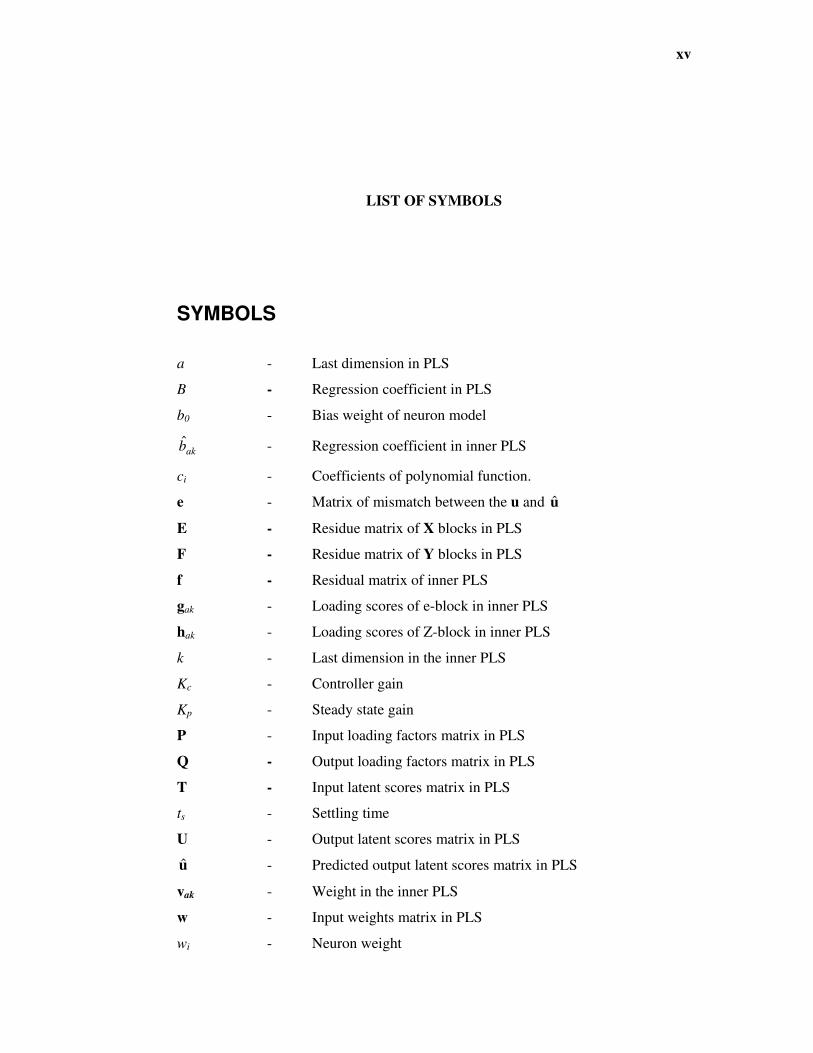
LIST OF SYMBOLS
SYMBOLS
a - Last dimension in PLS
B - Regression coefficient in PLS
b0 - Bias weight of neuron model
akb - Regression coefficient in inner PLS
ci - Coefficients of polynomial function.
e - Matrix of mismatch between the u and u
E - Residue matrix of X blocks in PLS
F - Residue matrix of Y blocks in PLS
f - Residual matrix of inner PLS
gak - Loading scores of e-block in inner PLS
hak - Loading scores of Z-block in inner PLS
k - Last dimension in the inner PLS
Kc - Controller gain
Kp - Steady state gain
P - Input loading factors matrix in PLS
Q - Output loading factors matrix in PLS
T - Input latent scores matrix in PLS
ts - Settling time
U - Output latent scores matrix in PLS
u - Predicted output latent scores matrix in PLS
vak - Weight in the inner PLS
w - Input weights matrix in PLS
wi - Neuron weight
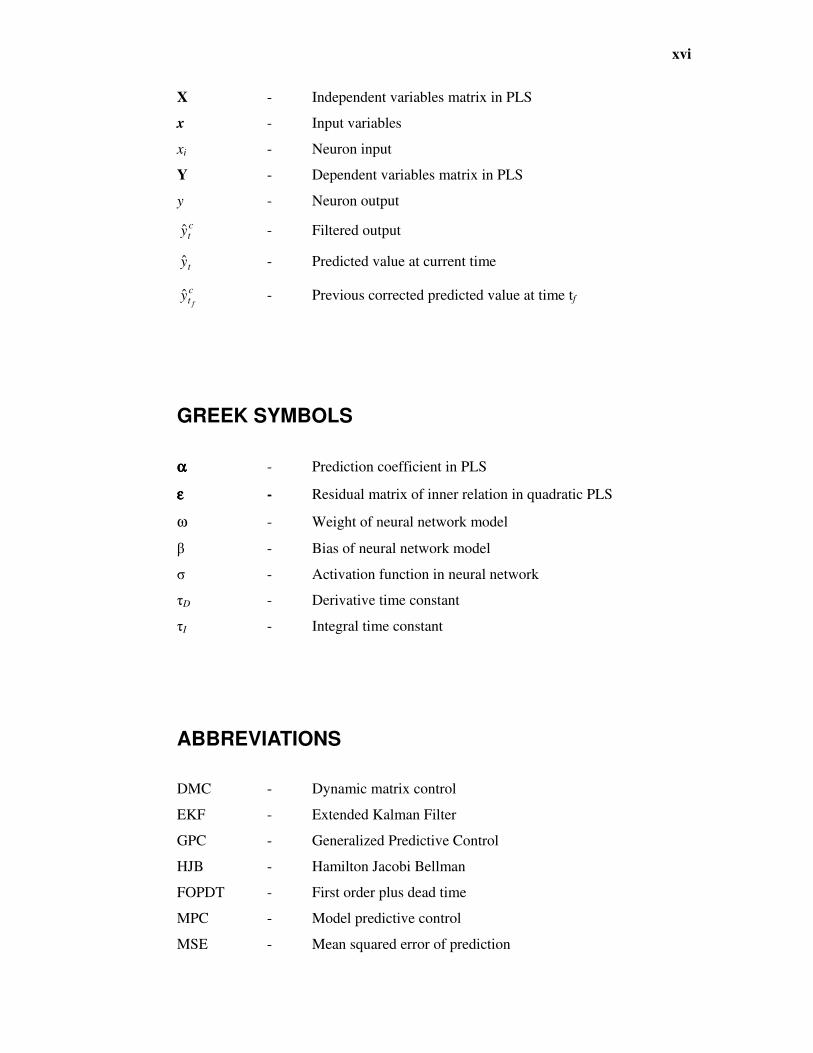
xvi
X - Independent variables matrix in PLS
x - Input variables
xi - Neuron input
Y - Dependent variables matrix in PLS
y - Neuron output
cty - Filtered output
ty - Predicted value at current time
ct f
y - Previous corrected predicted value at time tf
GREEK SYMBOLS
αααα - Prediction coefficient in PLS
εεεε - Residual matrix of inner relation in quadratic PLS
ω - Weight of neural network model
� - Bias of neural network model
� - Activation function in neural network
�D - Derivative time constant
�I - Integral time constant
ABBREVIATIONS
DMC - Dynamic matrix control
EKF - Extended Kalman Filter
GPC - Generalized Predictive Control
HJB - Hamilton Jacobi Bellman
FOPDT - First order plus dead time
MPC - Model predictive control
MSE - Mean squared error of prediction

xvii
NIPALS - Non-linear iterative partial least squares
NLP - Non-linear programming
NLMPC - Non-linear model predictive control
QDMC - Quadratic dynamic matrix control
OCP - Optimal control problem
PCA - Principal component analysis
PCR - Principal component regression
PID - Proportional-Integral-Derivative
PLS - Partial least squares regression
PMP - Pontryagin’s minimum principle
QP - Quadratic programming
SISO - Single input single output
SPC - Statistical process control
TPBVP - Two-point boundary value problem

CHAPTER 1
INTRODUCTION
1.1 Introduction
Distillation columns are important process unit operation in separation of
substances based on differences in their volatility especially in the chemical and
petroleum industries by R.A. Abou-Jeyab et al (2001). Therefore, they need to be
maintained close optimum operating conditions because of economic incentives.
These units have been considered for application of advanced control and
optimization. The optimal operating point usually lies at same constraints and the
operation of the distillation columns close to the optimum is an important objective.
Based on the market conditions, the real-time optimizer updates the optimum
periodically. At these updates, the objective of the control system of distillation
columns is to move the process to the new optimal operating point. At the same time,
the objective of the control system is to cancel the effect of the disturbances on the
controlled variables by making the minimal changes in the manipulated variables
from their optimal values. In addition, the constraints on the manipulated and other
process variables need to be satisfied. Thus, the control system needs to be handling
on-line and the using of MATLAB is purposed.
In this study, the used of distillation column is to separate the mixture of
methanol (MeOH) and ethanol. The particular column studied in this unit has 27
trays, a reboiler on the bottom tray, and a total condenser on the overhead stream. A
50%-50% mixture of methanol and ethanol is fed at the fourteenth tray (counted
from bottom). This column was originally modeled by K. Weischedel and T.J
2
McAvoy in 1980 by F.J Doyle et al (1995). It represents a benchmark that has been
studied by a number of researchers for the purpose of controlled design. The specific
control objective is to achieve an 85% methanol stream at top. Although there are
many variables that can be considered in this distillation column but in this study, the
variables that considered are reflux ration and vapor flow rate for manipulated
variables. Meanwhile for controlled variables is overhead MeOH composition.
Methanol also known as methyl alcohol or wood alcohol and the chemical
formula is CH3OH. It is simplest alcohol and is light, volatiles, colorless, flammable,
poisonous liquid with distinctive odor. Its boiling point is 64.70C.Methanol is
produced naturally in anaerobic metabolism of many varieties of bacteria. But
nowadays the synthesis of gas is most commonly produced from the methane
component in natural gas. The mixture of methane and steam at certain condition can
produce carbon monoxide and hydrogen. Basically the carbon monoxide then mix
with hydrogen then reacts on the second catalyst to produce methanol. Methanol is
used on a limited basis to fuel internal combustion engine. The methanol blends are
the fuel of choice in open wheel racing circuit. Besides, methanol is required with
supercharge engine in a top alcohol dragster and until the end of 2005 seasons, all the
vehicle in the Indianapolis 500 had to run methanol.

3
1.2 Problem Statement
In recent year, although we know the distillation column is needed to be
controlled on-line by using control system but most of the industry still using the
manual controller. It is because the cost of software for the control system is too
expensive. But using the Matlab software the cost is inexpensive if compared to the
other software such as Aspen. Besides this is new technology that have to make big
changes for the old company or industry which have develop their controlled
previously. Thus, for the new company or industry that in going to develop they have
been suggested to use the on-line controlled system so that the engineer can manage
the problem of the product or feed before it will affect the whole plan.
Besides, while using the control system it has the sensor in the system so that
the engineer can know the prediction of the controlled system before the outgoing
product ruin the whole plan. But the problem is most of the industry here still lack
off soft sensor in their plan because of using the manual controller. Meanwhile, there
are some factor the affecting of distillation column such as the feed condition, the
internal liquid and fluid flow condition, state of tray and the weather condition.
Because of this factor the controlling system by manually is not effective.
Because of this, in this study the using of Matlab software to estimate the
product of the methanol has been used so that it will apply in most of the industry
which using distillation column in their plan.
4
1.3 Objective
The aim of this study is to:
i. To estimate product composition in distillation column.
1.4 Scope of study
To achieve the objective of this research, there are two scopes that have been
identified:
i. To apply simulation studies of distillation column.
ii. Analysis of dynamic response of the process.
iii. To develop base-case control for distillation column.
iv. To study and analysis the simulation of dynamic response for distillation
column using Proportional Integral Derivative (PID).
v. Development of inferential estimator using Partial Least Square (PLS).

5
1.5 Work Planning Schedule
Month July August September October November
Planning/Week 1 2 3 4 5 6 7 8 9 10 11 12 13 14 15 16 17 18 19
Reviewing
Literature
Attend Matlab
cause
Learning and
exploring Matlab
Simulating
dynamic response
Simulating base
case control
Simulating PLS
Analysis
Report Writing
Final Viva
Submit Draft
Correction and
resubmission
Submit Thesis

CHAPTER 2
LITERATURE REVIEW
2.1 Overview of Distillation Column
Distillation is a method for separating the various components of a liquid
solution which depends upon the distribution of these components between a vapor
phase and a liquid phase. All components are present in both phases. The vapor
phase is created from the liquid phase by vaporization at the boiling point. The basic
requirement for the separation of components by distillation is that the composition
of the vapor be different from the composition of the liquid with which it is in
equilibrium at the boiling point of the liquid. Distillation is concerned with solutions
where all components are appreciably volatile.
Distillation was developed into its modern form with the invention of the
alembic by Islamic alchemist Jabir ibn Hayyan c. 800; he is also credited with the
invention of numerous other chemical apparatus and processes that are still in use
today. The design of the alembic has served as inspiration for some modern micro-
scale distillation apparatus such as the Hickman still head.
Figure 2.1: Alembic
7
2.1.1 The Theory of Distillation Column
It is a common misconception that in a solution, each component boils at its
normal boiling point - the vapors of each component will collect separately and
purely. This does not occur even in an idealized system. Idealized models of
distillation are essentially governed by Raoult's law and Dalton's law.
Raoult's law assumes that a component contributes to the total vapor pressure
of the mixture in proportion to its fraction of the mixture and its vapor pressure when
pure.
For component A,
PA = XAPA° (2.1)
Where:
XA denotes the mole fraction of A
PA° denotes the vapor pressure of pure A.
If a component changes another's vapor pressure, or the volatility of a
component is dependent on its fraction, the law will fail. Dalton's law states that the
total vapor pressure is the sum of the vapor pressures of each individual component
in the mixture.
P total = � Pi, for components i = A, B, C, ... (2.2)
2.1.1.1 Raoult’s Law
Raoult's law states that the vapor pressure of each component in an ideal
solution is dependent on the vapor pressure of the individual component and the
mole fraction of the component present in the solution. Once the components in the
solution have reached chemical equilibrium, the total vapor pressure of the solution
is:
(2.3)

8
and the individual vapor pressure for each component is
(2.4)
Where;
(Pi) pure is the vapor pressure of the pure component
Xi is the mole fraction of the component in solution
Consequently, as the number of components in a solution increases, the
individual vapor pressures decrease, since the mole fraction of each component
decreases with each additional component. If a pure solute which has zero vapor
pressure is dissolved in a solvent, the vapor pressure of the final solution will be
lower than that of the pure solvent.
This law is strictly valid only under the assumption that the chemical bond
between the two liquids is equal to the bonding within the liquids, the conditions of
an ideal solution. Therefore, comparing actual measured vapor pressures to predicted
values from Raoult's law allows information about the relative strength of bonding
between liquids to be obtained. If the measured value of vapor pressure is less than
the predicted value, fewer molecules have left the solution than expected. This is put
down to the strength of bonding between the liquids being greater than the bonding
within the individual liquids, so fewer molecules have enough energy to leave the
solution. Conversely, if the vapor pressure is greater than the predicted value more
molecules have left the solution than expected, due to the bonding between the
liquids being less strong than the bonding within each.
2.1.1.2 Dalton’s Law
In chemistry and physics, Dalton's law states that the total pressure exerted by
a gaseous mixture is equal to the sum of the partial pressures of each individual
component in a gas mixture. This empirical law was observed by John Dalton in
1801 and is related to the ideal gas laws. Mathematically, the pressure P of a mixture
of n gases can be defined as the summation

9
(2.5)
where represent the partial pressure of each component.
It is assumed that the gases do not react with each other. The combination of
Dalton’s Law, Boyle’s and Avogadro’s laws lead to the conclusion that a gas in an
ideal gas mixture exerts a partial pressure whose ratio to total pressure equals its
mole fraction.
(2.6)
Where
The mole fraction of the i component in the total mixture of m components
The relationship below provides a way to determine the volume based
concentration of any individual gaseous component.
(2.7)
where:
Is the concentration of the i component expressed in ppm.
Dalton's law is not exactly followed by real gases. Those deviations are
considerably large at high pressures. In such conditions, the volume occupied by the
molecules can become significant compared to the free space between them.
Moreover, the short average distances between molecules raise the intensity of
intermolecular forces between gas molecules enough to substantially change the
pressure exerted by them. Neither of those effects is considered by the ideal gas
model.
The theory of the distillation column is the combination of the Raoult’s and
Dalton’s law which is applied in any types of distillation column.
10
2.1.2 Types of Distillation Column
There are three important types of distillation that occur in a single stage or
still and that do not involve rectification. The first of these is equilibrium or flash
distillation, the second is simple batch or differential distillation, and the third is
simple steam distillation.
2.1.2.1 Equilibrium or Flash Distillation Column
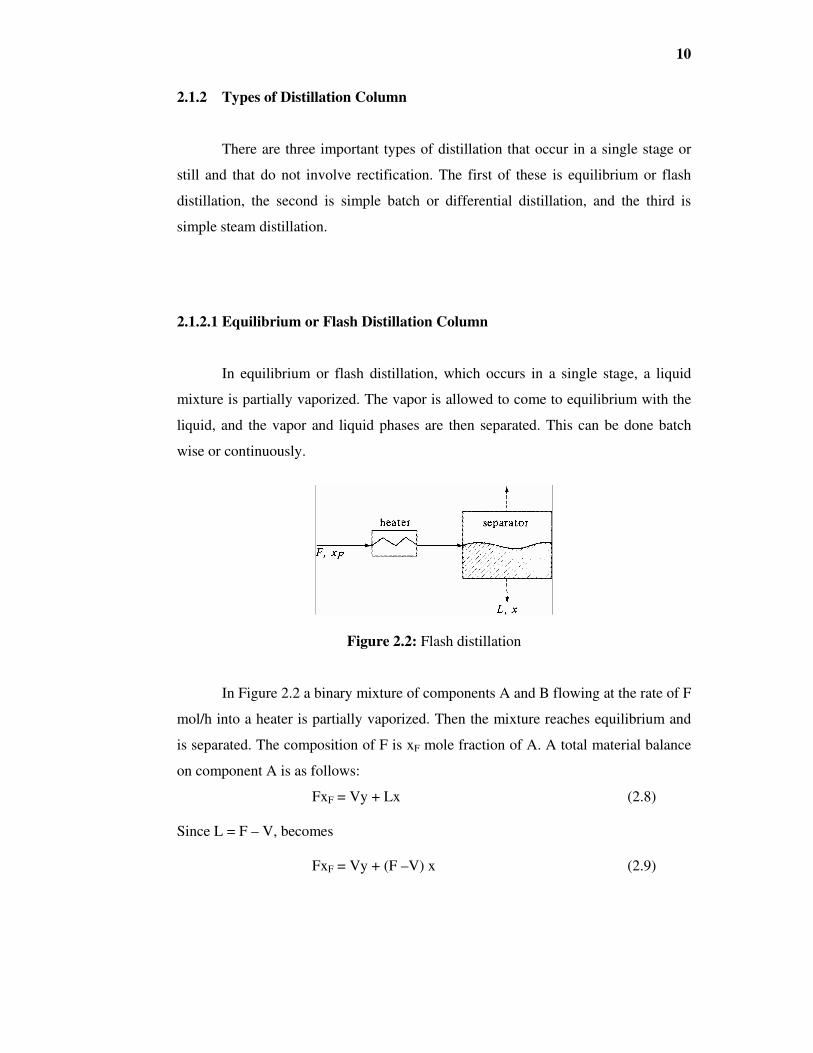
In equilibrium or flash distillation, which occurs in a single stage, a liquid
mixture is partially vaporized. The vapor is allowed to come to equilibrium with the
liquid, and the vapor and liquid phases are then separated. This can be done batch
wise or continuously.
Figure 2.2: Flash distillation
In Figure 2.2 a binary mixture of components A and B flowing at the rate of F
mol/h into a heater is partially vaporized. Then the mixture reaches equilibrium and
is separated. The composition of F is xF mole fraction of A. A total material balance
on component A is as follows:
FxF = Vy + Lx (2.8)
Since L = F – V, becomes
FxF = Vy + (F –V) x (2.9)
11
2.1.2.2 Simple Batch or Differential Distillation Column
In simple distillation, all the hot vapors produced are immediately channeled
into a condenser which cools and condenses the vapors. Thus, the distillate will not
be pure - its composition will be identical to the composition of the vapors at the
given temperature and pressure, and can be computed from Raoult's law.
As a result, simple distillation is usually used only to separate liquids whose
boiling points differ greatly (rule of thumb is 25 °C), or to separate liquids from
involatile solids. For these cases, the vapor pressures of the components are usually
sufficiently different that Raoult's law may be neglected due to the insignificant
contribution of the less volatile component. In this case, the distillate may be
sufficiently pure for its intended purpose.
2.1.2.3 Simple Steam Distillation Column
At atmospheric pressure high-boiling liquids cannot be purified by distillation,
since the components of the liquid may decompose at high temperatures required.
Often the high-boiling substances are essentially insoluble in water, so a separation at
lower temperatures can be obtained by simple steam distillation. This method is often
used to separate a high-boiling component from small amounts of nonvolatile
impurities.
If a layer of liquid water (A) and an immiscible high-boiling component (B)
the phase rule for three phase and two components,
F = 2-3+2 = degree of freedom (2.10)
Hence, if the total pressure is fixed, the system is fixed. Since there are two liquid
phases, each will exert its own vapor pressure at prevailing temperature and cannot
be influenced by the presence of the other. When the sum of the separate vapor
pressure equals the total pressure, the mixture boils and
PA + PB = P (2.11)
Related Documents