Analysis of organic pollutants during sewage treatment processes A tracing of Sulfomethoxazole, N-Acetylsulfamethoxazole, Ranitidine and Mefenamic acid Gattiker Etienne, Schälchli Jeremy & Zimmerli Roger Institute for biogeochemistry and pollutant dynamics, ETH Zurich Monday, May 21, 2012 Supervision: Aurea C. Chiaia-Hernandez, Rebekka Gulde, Juliane Hollender, Philipp Longree, Christoph Moschet, Heinz Singer, Marc Suter, Sara Pati, Jürgen Van der Voet & Reto Wijker Report for the Practical Course: Analysis of Organic Pollutants Spring Semester 2012

Welcome message from author
This document is posted to help you gain knowledge. Please leave a comment to let me know what you think about it! Share it to your friends and learn new things together.
Transcript
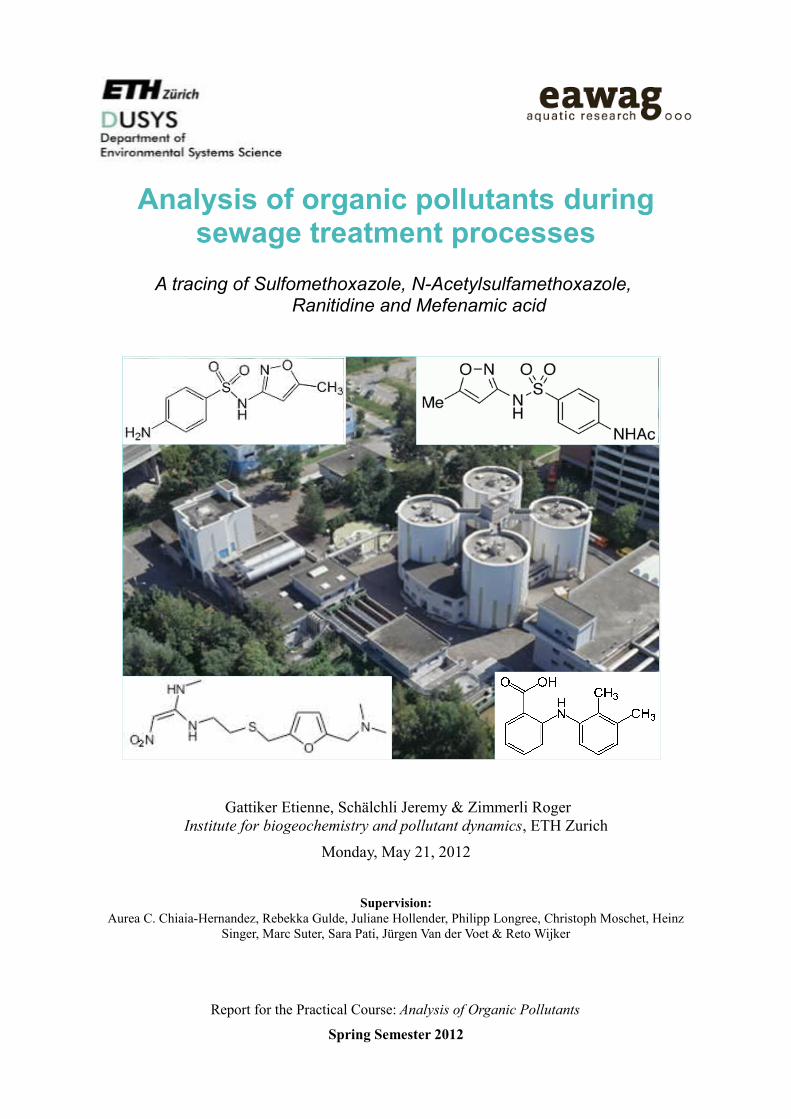
Analysis of organic pollutants during sewage treatment processes
A tracing of Sulfomethoxazole, N-Acetylsulfamethoxazole, Ranitidine and Mefenamic acid
Gattiker Etienne, Schälchli Jeremy & Zimmerli RogerInstitute for biogeochemistry and pollutant dynamics, ETH Zurich
Monday, May 21, 2012
Supervision:Aurea C. Chiaia-Hernandez, Rebekka Gulde, Juliane Hollender, Philipp Longree, Christoph Moschet, Heinz
Singer, Marc Suter, Sara Pati, Jürgen Van der Voet & Reto Wijker
Report for the Practical Course: Analysis of Organic Pollutants
Spring Semester 2012
Analysis of organic pollutants during sewage treatment processes
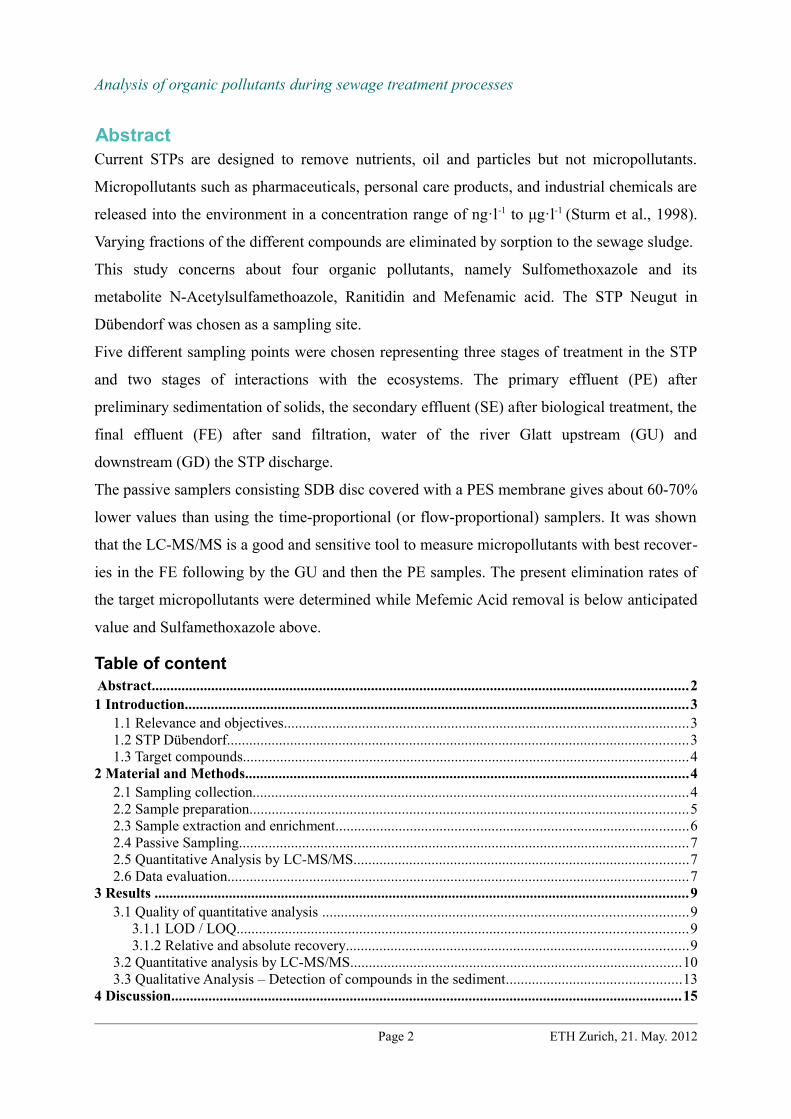
AbstractCurrent STPs are designed to remove nutrients, oil and particles but not micropollutants.
Micropollutants such as pharmaceuticals, personal care products, and industrial chemicals are
released into the environment in a concentration range of ng·l-1 to μg·l-1 (Sturm et al., 1998).
Varying fractions of the different compounds are eliminated by sorption to the sewage sludge.
This study concerns about four organic pollutants, namely Sulfomethoxazole and its
metabolite N-Acetylsulfamethoazole, Ranitidin and Mefenamic acid. The STP Neugut in
Dübendorf was chosen as a sampling site.
Five different sampling points were chosen representing three stages of treatment in the STP
and two stages of interactions with the ecosystems. The primary effluent (PE) after
preliminary sedimentation of solids, the secondary effluent (SE) after biological treatment, the
final effluent (FE) after sand filtration, water of the river Glatt upstream (GU) and
downstream (GD) the STP discharge.
The passive samplers consisting SDB disc covered with a PES membrane gives about 60-70%
lower values than using the time-proportional (or flow-proportional) samplers. It was shown
that the LC-MS/MS is a good and sensitive tool to measure micropollutants with best recover-
ies in the FE following by the GU and then the PE samples. The present elimination rates of
the target micropollutants were determined while Mefemic Acid removal is below anticipated
value and Sulfamethoxazole above.
Table of content Abstract................................................................................................................................................21 Introduction.......................................................................................................................................3
1.1 Relevance and objectives.............................................................................................................31.2 STP Dübendorf............................................................................................................................31.3 Target compounds........................................................................................................................4
2 Material and Methods.......................................................................................................................42.1 Sampling collection.....................................................................................................................42.2 Sample preparation......................................................................................................................52.3 Sample extraction and enrichment...............................................................................................62.4 Passive Sampling.........................................................................................................................72.5 Quantitative Analysis by LC-MS/MS..........................................................................................72.6 Data evaluation............................................................................................................................7
3 Results ...............................................................................................................................................93.1 Quality of quantitative analysis ..................................................................................................9
3.1.1 LOD / LOQ.........................................................................................................................93.1.2 Relative and absolute recovery............................................................................................9
3.2 Quantitative analysis by LC-MS/MS.........................................................................................103.3 Qualitative Analysis – Detection of compounds in the sediment...............................................13
4 Discussion.........................................................................................................................................15
Page 2 ETH Zurich, 21. May. 2012
Analysis of organic pollutants during sewage treatment processes
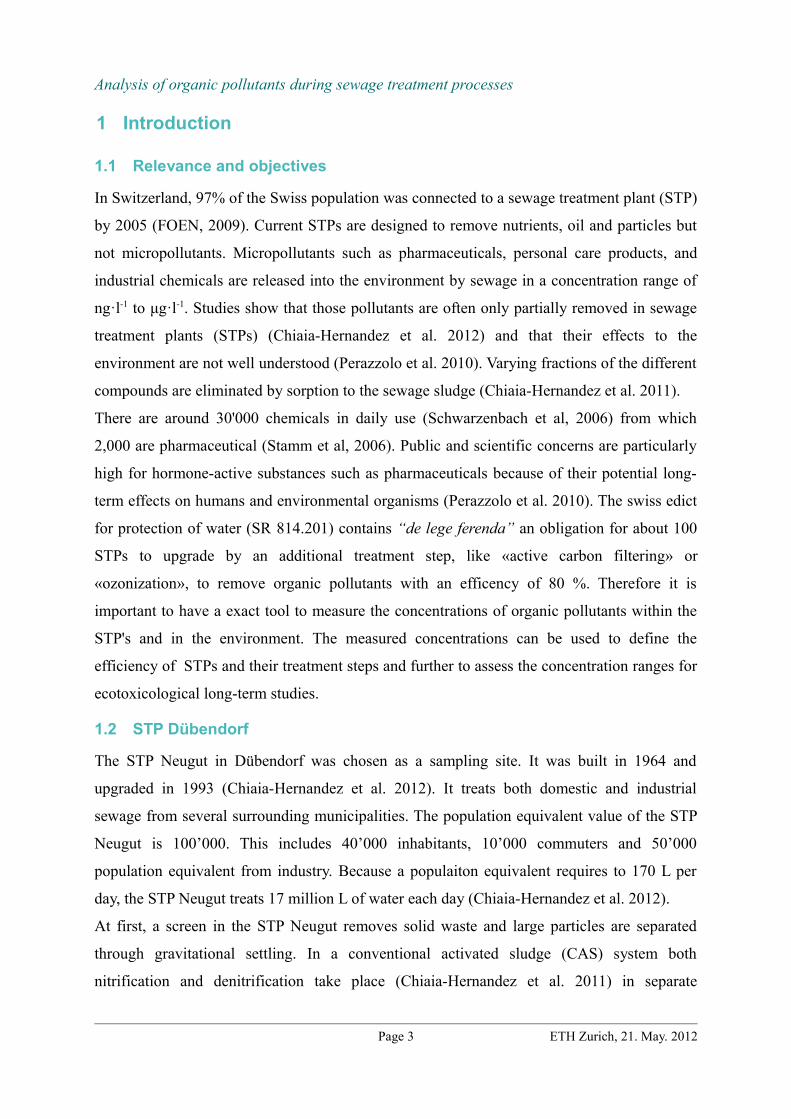
1 Introduction
1.1 Relevance and objectives
In Switzerland, 97% of the Swiss population was connected to a sewage treatment plant (STP)
by 2005 (FOEN, 2009). Current STPs are designed to remove nutrients, oil and particles but
not micropollutants. Micropollutants such as pharmaceuticals, personal care products, and
industrial chemicals are released into the environment by sewage in a concentration range of
ng·l-1 to μg·l-1. Studies show that those pollutants are often only partially removed in sewage
treatment plants (STPs) (Chiaia-Hernandez et al. 2012) and that their effects to the
environment are not well understood (Perazzolo et al. 2010). Varying fractions of the different
compounds are eliminated by sorption to the sewage sludge (Chiaia-Hernandez et al. 2011).
There are around 30'000 chemicals in daily use (Schwarzenbach et al, 2006) from which
2,000 are pharmaceutical (Stamm et al, 2006). Public and scientific concerns are particularly
high for hormone-active substances such as pharmaceuticals because of their potential long-
term effects on humans and environmental organisms (Perazzolo et al. 2010). The swiss edict
for protection of water (SR 814.201) contains “de lege ferenda” an obligation for about 100
STPs to upgrade by an additional treatment step, like «active carbon filtering» or
«ozonization», to remove organic pollutants with an efficency of 80 %. Therefore it is
important to have a exact tool to measure the concentrations of organic pollutants within the
STP's and in the environment. The measured concentrations can be used to define the
efficiency of STPs and their treatment steps and further to assess the concentration ranges for
ecotoxicological long-term studies.
1.2 STP Dübendorf
The STP Neugut in Dübendorf was chosen as a sampling site. It was built in 1964 and
upgraded in 1993 (Chiaia-Hernandez et al. 2012). It treats both domestic and industrial
sewage from several surrounding municipalities. The population equivalent value of the STP
Neugut is 100’000. This includes 40’000 inhabitants, 10’000 commuters and 50’000
population equivalent from industry. Because a populaiton equivalent requires to 170 L per
day, the STP Neugut treats 17 million L of water each day (Chiaia-Hernandez et al. 2012).
At first, a screen in the STP Neugut removes solid waste and large particles are separated
through gravitational settling. In a conventional activated sludge (CAS) system both
nitrification and denitrification take place (Chiaia-Hernandez et al. 2011) in separate
Page 3 ETH Zurich, 21. May. 2012
Analysis of organic pollutants during sewage treatment processes
compartments, under oxic and anoxic conditions respectively. In contrast to most STP, in
Neugut phosphorus is also removed biologically (Chiaia-Hernandez et al. 2011) rather than
through chemical co-precipitation with iron oxides. The last step consists of a sand filter to
remove remaining particles (Chiaia-Hernandez et al. 2011) and to further mineralise organic
compounds. The treated water is eventually released into the river Glatt.
During all processes, particles of diverse composition settle down to form sewage sludge. The
sludge consists mainly of organic material and thus is a potentially suitable sorbent for apolar
and therefore hydrophobic organic pollutants. It is usually decomposed under anaerobic
conditions resulting in biogas and residuals, which are incinerated with garbage in
Switzerland.
1.3 Target compounds
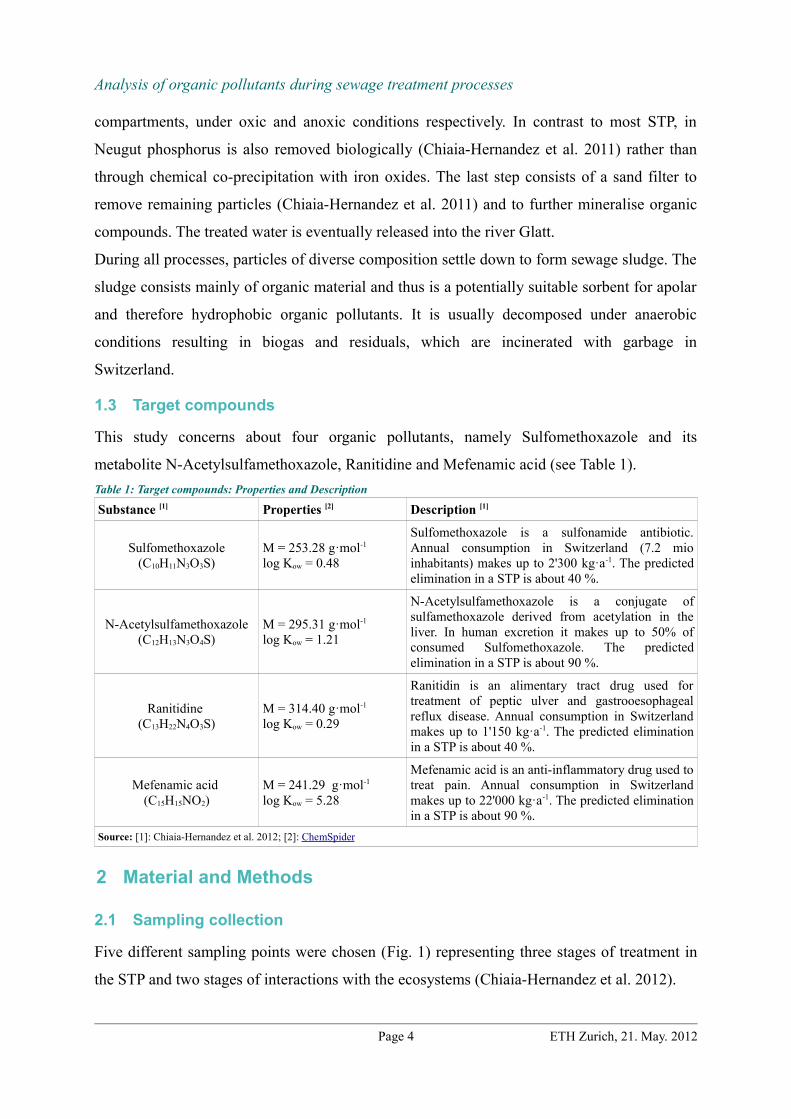
This study concerns about four organic pollutants, namely Sulfomethoxazole and its
metabolite N-Acetylsulfamethoxazole, Ranitidine and Mefenamic acid (see Table 1).Table 1: Target compounds: Properties and Description
Substance [1] Properties [2] Description [1]
Sulfomethoxazole (C10H11N3O3S)
M = 253.28 g·mol-1
log Kow = 0.48
Sulfomethoxazole is a sulfonamide antibiotic. Annual consumption in Switzerland (7.2 mio inhabitants) makes up to 2'300 kg·a-1. The predicted elimination in a STP is about 40 %.
N-Acetylsulfamethoxazole (C12H13N3O4S)
M = 295.31 g·mol-1
log Kow = 1.21
N-Acetylsulfamethoxazole is a conjugate of sulfamethoxazole derived from acetylation in the liver. In human excretion it makes up to 50% of consumed Sulfomethoxazole. The predicted elimination in a STP is about 90 %.
Ranitidine (C13H22N4O3S)
M = 314.40 g·mol-1
log Kow = 0.29
Ranitidin is an alimentary tract drug used for treatment of peptic ulver and gastrooesophageal reflux disease. Annual consumption in Switzerland makes up to 1'150 kg·a-1. The predicted elimination in a STP is about 40 %.
Mefenamic acid (C15H15NO2)
M = 241.29 g·mol-1
log Kow = 5.28
Mefenamic acid is an anti-inflammatory drug used to treat pain. Annual consumption in Switzerland makes up to 22'000 kg·a-1. The predicted elimination in a STP is about 90 %.
Source: [1]: Chiaia-Hernandez et al. 2012; [2]: ChemSpider
2 Material and Methods
2.1 Sampling collection
Five different sampling points were chosen (Fig. 1) representing three stages of treatment in
the STP and two stages of interactions with the ecosystems (Chiaia-Hernandez et al. 2012).
Page 4 ETH Zurich, 21. May. 2012
Analysis of organic pollutants during sewage treatment processes
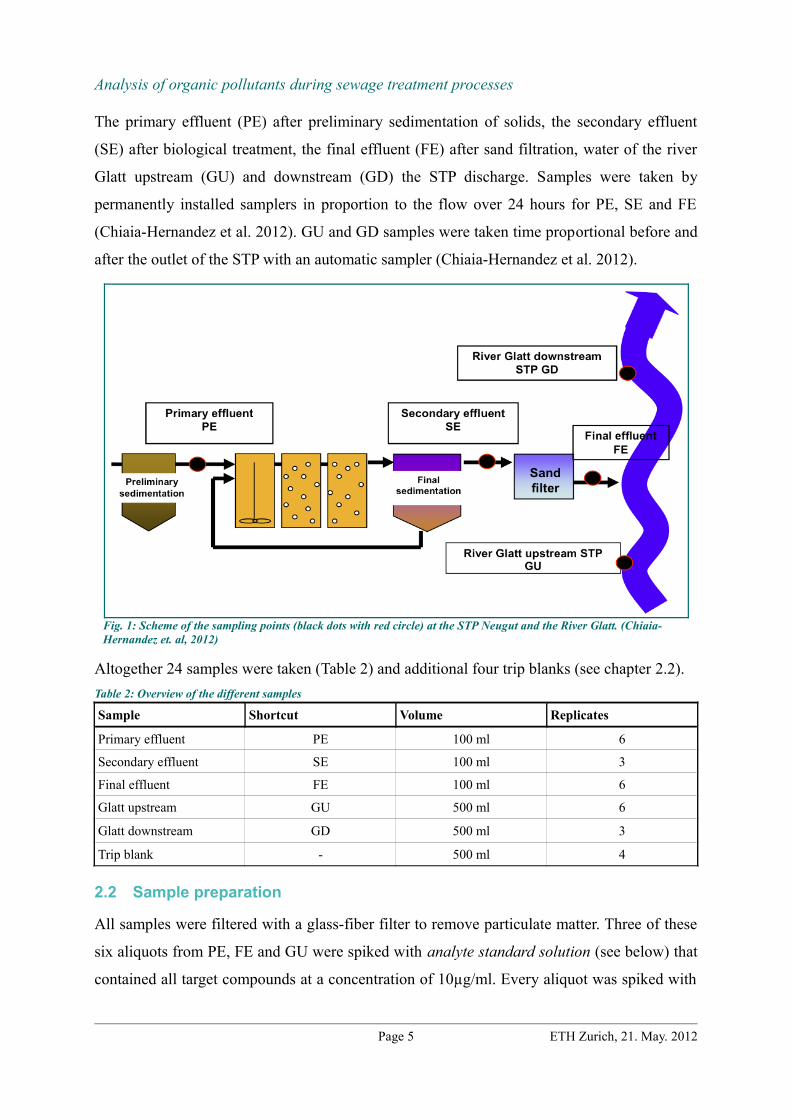
The primary effluent (PE) after preliminary sedimentation of solids, the secondary effluent
(SE) after biological treatment, the final effluent (FE) after sand filtration, water of the river
Glatt upstream (GU) and downstream (GD) the STP discharge. Samples were taken by
permanently installed samplers in proportion to the flow over 24 hours for PE, SE and FE
(Chiaia-Hernandez et al. 2012). GU and GD samples were taken time proportional before and
after the outlet of the STP with an automatic sampler (Chiaia-Hernandez et al. 2012).
Altogether 24 samples were taken (Table 2) and additional four trip blanks (see chapter 2.2).Table 2: Overview of the different samples
Sample Shortcut Volume Replicates
Primary effluent PE 100 ml 6
Secondary effluent SE 100 ml 3
Final effluent FE 100 ml 6
Glatt upstream GU 500 ml 6
Glatt downstream GD 500 ml 3
Trip blank - 500 ml 4
2.2 Sample preparation
All samples were filtered with a glass-fiber filter to remove particulate matter. Three of these
six aliquots from PE, FE and GU were spiked with analyte standard solution (see below) that
contained all target compounds at a concentration of 10µg/ml. Every aliquot was spiked with
Page 5 ETH Zurich, 21. May. 2012
Fig. 1: Scheme of the sampling points (black dots with red circle) at the STP Neugut and the River Glatt. (Chiaia-Hernandez et. al, 2012)
Analysis of organic pollutants during sewage treatment processes
an internal standard solution.
We therefore obtained three replicates of each sample and additionally three spiked replicates
from PE, FE and GU and four blank aliquots. The three replicates spiked with the analyte
standard were used to determinate accuracy and precision (see chapter 2.6 & 3.1). The
internal standard was used to over come losses of the analyte over the method (see Table 3).
A sludge sample was planned but was not available. Instead of the sludge we took a sediment
sample of lake Greifensee.
Every sample was stored at -20°C for one week until enrichment.
Internal standard solution are labelled compounds almost identical to the compounds of
interest. They are used as a baseline to track potential losses of target compounds during
analysis through signal drift, matrix effects or analyte loss (Chiaia-Hernandez et al. 2012).
Samples were spiked with 100 μl of a 1 mg·l-1 solution was used with the surrogates:
Sulfamethoxazole-D4, Acetyl-Sulfamethoxazole-D5, Mefenamic acid-D3 and Ranitidine-D6.
Analyte standard solutions were used to prepare calibration curves and to spike samples in
order to determine the recovery of the analysis. The solution contains all target compounds in
a defined concentration, which in our case was 10 mg l-1. Our calibration curves consisted of
nine data points with intended concentrations of 2, 5, 10, 20, 50, 100, 200, 500, and 1’000
μg·l-1 (Chiaia-Hernandez et al. 2012). Three triplicate samples were spiked with the standard
solution, the sample GU with 100 μg·l-1, PE and FE with 1000 μg·l-1 and 500 μg·l-1
respectively.
2.3 Sample extraction and enrichment
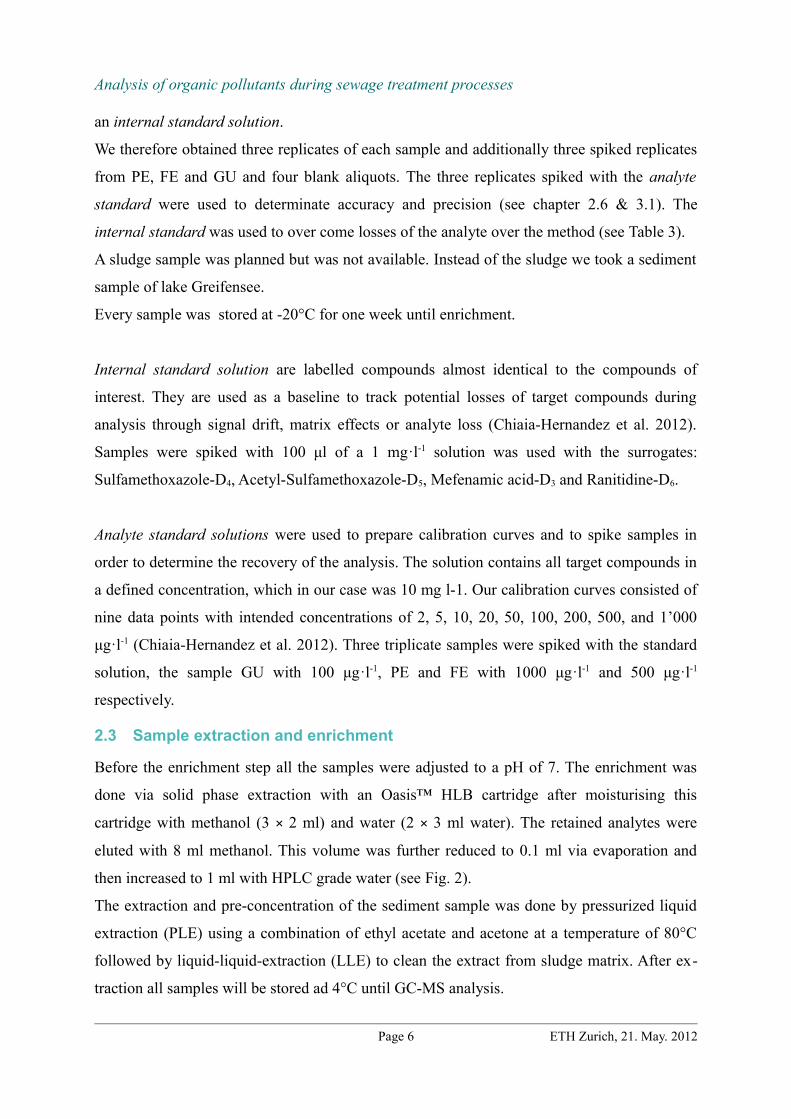
Before the enrichment step all the samples were adjusted to a pH of 7. The enrichment was
done via solid phase extraction with an Oasis™ HLB cartridge after moisturising this
cartridge with methanol (3 × 2 ml) and water (2 × 3 ml water). The retained analytes were
eluted with 8 ml methanol. This volume was further reduced to 0.1 ml via evaporation and
then increased to 1 ml with HPLC grade water (see Fig. 2).
The extraction and pre-concentration of the sediment sample was done by pressurized liquid
extraction (PLE) using a combination of ethyl acetate and acetone at a temperature of 80°C
followed by liquid-liquid-extraction (LLE) to clean the extract from sludge matrix. After ex-
traction all samples will be stored ad 4°C until GC-MS analysis.
Page 6 ETH Zurich, 21. May. 2012
Analysis of organic pollutants during sewage treatment processes
2.4 Passive Sampling
The passive sampler consisting of a Styrenedivinylbenzene (SDB) disc covered with a poly-
ethersulfone (PES) membrane. They were placed on the two sampling sites GU and GD for
14 days.
Directly after deployment, the six SDB discs were inlaid in 7ml acetone, internal standard was
added and the discs were extracted in a shaker for 30min. After bringing the samples to the
lab, the SDB discs were extracted with methanol likewise. The two obtained fractions were
combined, filtered, reduced to a volume of 0.1 ml via evaporation accelerated by heating and
ventilation with nitrogen gas. Finally the sample volume was re-increased with HPLC grade
water to a final volume of 1 ml.
2.5 Quantitative Analysis by LC-MS/MS
Quantification measurements were done by first separating the analytes with liquid
chromatography (LC), using a Rheos 2000 LC pump and an Atlantis T3 column (3 µm, 150 x
3.0 mm; Waters Corp.). 20 µl of the samples were injected. The mobile phase consisted of
water and methanol and both mobile phases had 0.1% by volume formic acid. For detection
and quantification, a triple quadrupole TSQ Quantum MS/MS from Thermo with electrospray
ionization interface (ESI) was used (Chiaia-Hernandez et al. 2012).
2.6 Data evaluation
The Predicted environmental concentrations (PEC) of the PE, FE and GD samples are calcu-
lated with the values given in chapter 1.2 & 1.3 and Table 1. The river Glatt and STP Neugut
were assumed to have an averaged discharge of 5000 l·s-1and 253 l·s-1 respectively. The PEC
Page 7 ETH Zurich, 21. May. 2012
Fig. 2: Schematic overview of the extraction and enrichment steps. (Chiaia-Hernandez et. al, 2012)
Analysis of organic pollutants during sewage treatment processes
are given in Table 7.
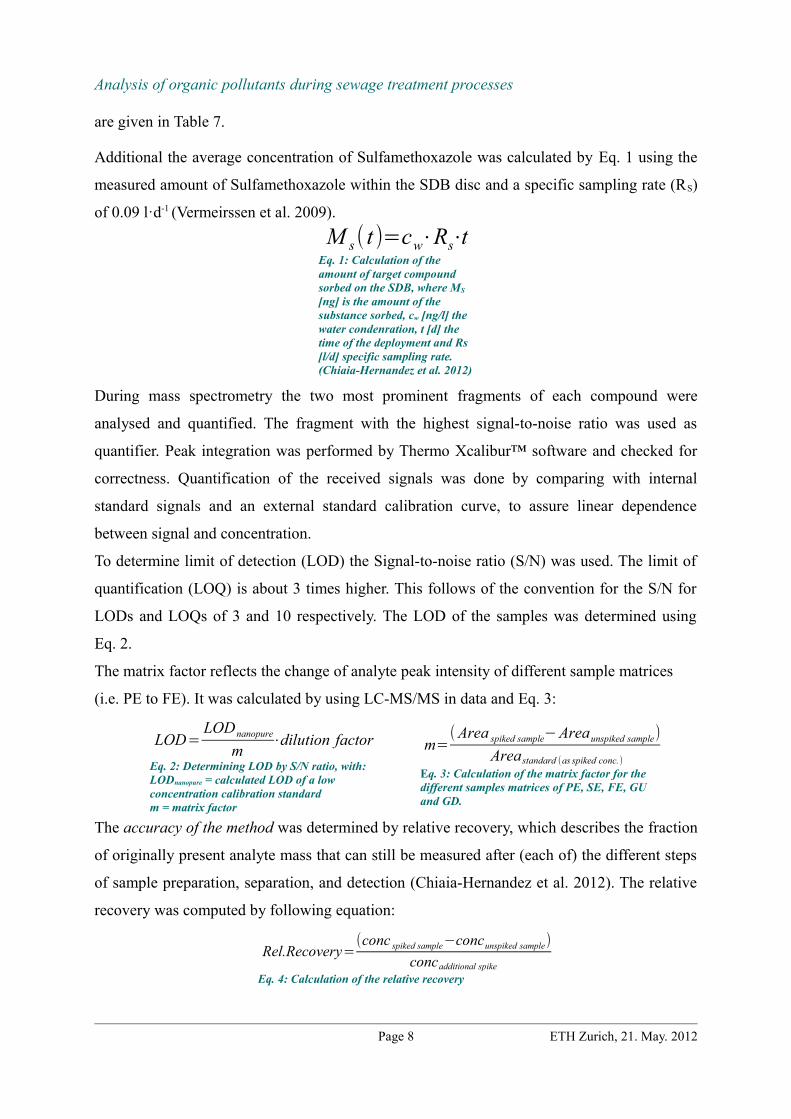
Additional the average concentration of Sulfamethoxazole was calculated by Eq. 1 using the
measured amount of Sulfamethoxazole within the SDB disc and a specific sampling rate (RS)
of 0.09 l·d-1 (Vermeirssen et al. 2009).
During mass spectrometry the two most prominent fragments of each compound were
analysed and quantified. The fragment with the highest signal-to-noise ratio was used as
quantifier. Peak integration was performed by Thermo Xcalibur™ software and checked for
correctness. Quantification of the received signals was done by comparing with internal
standard signals and an external standard calibration curve, to assure linear dependence
between signal and concentration.
To determine limit of detection (LOD) the Signal-to-noise ratio (S/N) was used. The limit of
quantification (LOQ) is about 3 times higher. This follows of the convention for the S/N for
LODs and LOQs of 3 and 10 respectively. The LOD of the samples was determined using
Eq. 2.
The matrix factor reflects the change of analyte peak intensity of different sample matrices
(i.e. PE to FE). It was calculated by using LC-MS/MS in data and Eq. 3:
The accuracy of the method was determined by relative recovery, which describes the fraction
of originally present analyte mass that can still be measured after (each of) the different steps
of sample preparation, separation, and detection (Chiaia-Hernandez et al. 2012). The relative
recovery was computed by following equation:
Page 8 ETH Zurich, 21. May. 2012
Eq. 1: Calculation of the amount of target compound sorbed on the SDB, where MS
[ng] is the amount of the substance sorbed, cw [ng/l] the water condenration, t [d] the time of the deployment and Rs [l/d] specific sampling rate. (Chiaia-Hernandez et al. 2012)
M s( t)=cw⋅Rs⋅t
Eq. 2: Determining LOD by S/N ratio, with:LODnanopure = calculated LOD of a low concentration calibration standardm = matrix factor
LOD=LODnanopure
m⋅dilution factor
Eq. 3: Calculation of the matrix factor for the different samples matrices of PE, SE, FE, GU and GD.
m=( Area spiked sample−Areaunspiked sample)
Areastandard (as spiked conc.)
Eq. 4: Calculation of the relative recovery
Rel.Recovery=(conc spiked sample−concunspiked sample)
concadditional spike
Analysis of organic pollutants during sewage treatment processes
3 Results 3.1 Quality of quantitative analysis
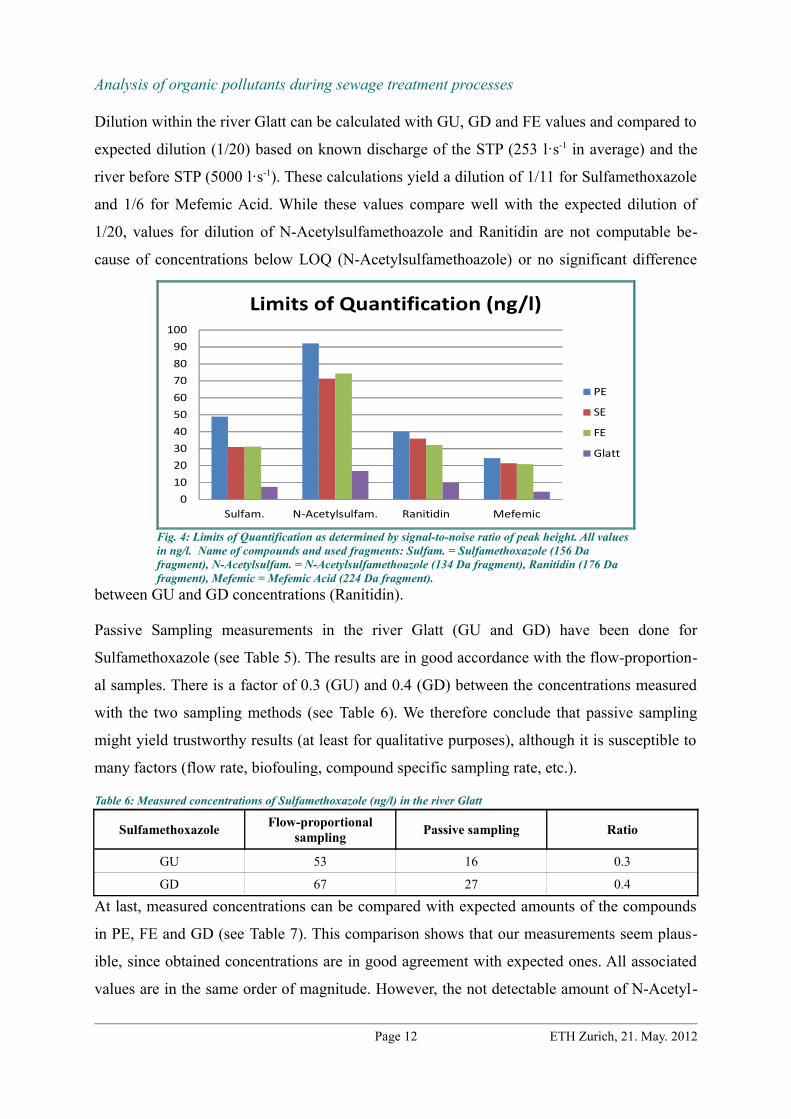
3.1.1 LOD / LOQ
The values are in a reasonable order of magnitude (see Fig. 4). One can easily see the influ-
ence of the matrix, as LOQs usually decrease from PE to Glatt samples. This behaviour is in
line with the expectation.
3.1.2 Relative and absolute recovery
To assess the precision and accuracy of our method, standard deviations (see Fig. 3 & Table 4)
and relative and absolute recoveries were taken into account. As already mentioned, one of
the three SE measurements yielded concentrations that were much too high for all compounds
(see chapter 10). This was probably due to a wrong amount of spiked internal standard in that
aliquot. We therefore discarded that measurement. After doing so, relative standard deviations
of the measured concentrations were 10% or lower. This shows that overall precision of our
measurements are okay.
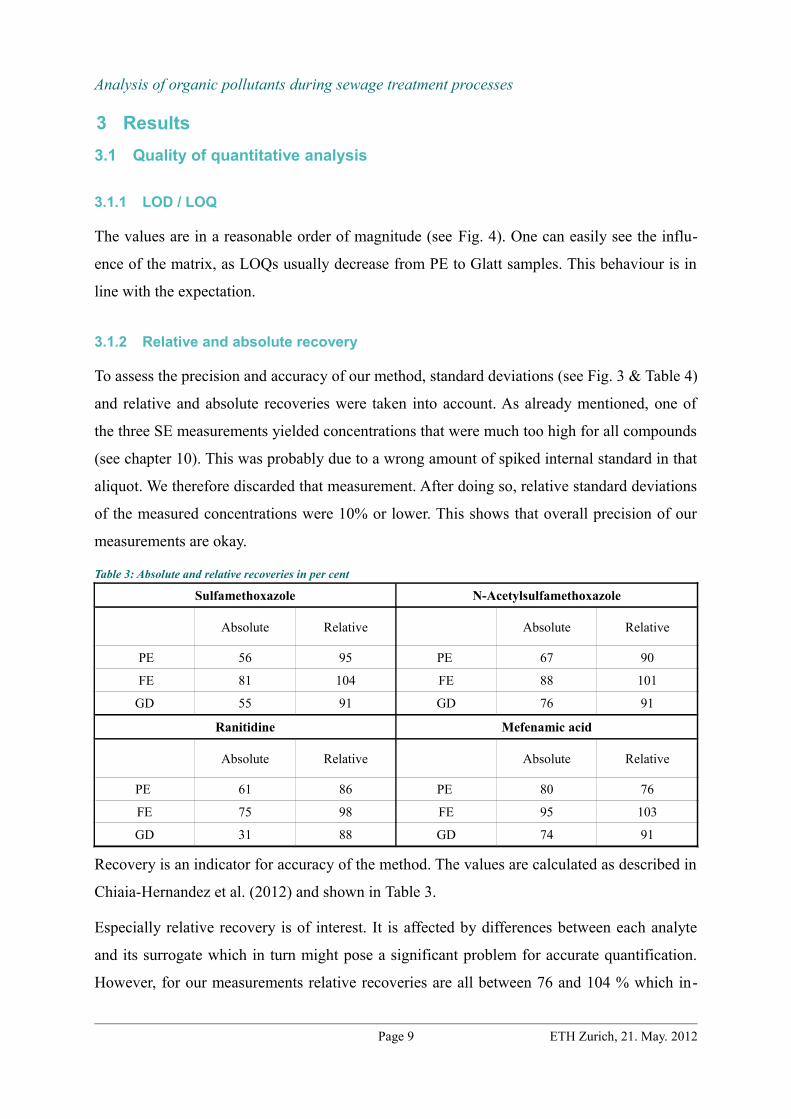
Table 3: Absolute and relative recoveries in per cent
Sulfamethoxazole N-Acetylsulfamethoxazole
Absolute Relative
Absolute Relative
PE 56 95 PE 67 90
FE 81 104 FE 88 101
GD 55 91 GD 76 91
Ranitidine Mefenamic acid
Absolute Relative
Absolute Relative
PE 61 86 PE 80 76
FE 75 98 FE 95 103
GD 31 88 GD 74 91
Recovery is an indicator for accuracy of the method. The values are calculated as described in
Chiaia-Hernandez et al. (2012) and shown in Table 3.
Especially relative recovery is of interest. It is affected by differences between each analyte
and its surrogate which in turn might pose a significant problem for accurate quantification.
However, for our measurements relative recoveries are all between 76 and 104 % which in-
Page 9 ETH Zurich, 21. May. 2012

Analysis of organic pollutants during sewage treatment processes
dicates an acceptable accuracy. Linearity of the external calibration curve within the measured
concentration range is also important for proper quantification. In our case, this was given
since linear regression coefficients were very close to 1, namely 0.97 (usually 0.98 to 0.99).
3.2 Quantitative analysis by LC-MS/MS
Measured concentrations of the four compounds in flow-proportional samples are given in
Fig. 3. Additionally, they are listed in Table 4 with some remarks about their quality. The val-
ues can be used to calculate removal efficiency of the STP and dilution within the river Glatt.
They can also be compared with expected concentrations based on consumption information
and river discharge (see Table 7 for PE, FE & GD) and concentration values obtained with
passive sampling (see Table 5 & 6 for GU & GD).
Page 10 ETH Zurich, 21. May. 2012
Fig. 3: Measured concentrations of all four compounds in flow-proportional samples. All values in ng/l. Standard deviations are given as black bars.
0
50
100
150
200
250
300
350
400
450
500
PE SE FE GU GD
Sulfomethoxazole
0
50
100
150
200
250
300
350
400
450
500
PE SE FE GU GD
N-Acetylsulfamethazole
0
20
40
60
80
100
120
140
PE SE FE GU GD
Ranitidin
0
200
400
600
800
1000
1200
1400
1600
1800
PE SE FE GU GD
Mefemic Acid
Analysis of organic pollutants during sewage treatment processes
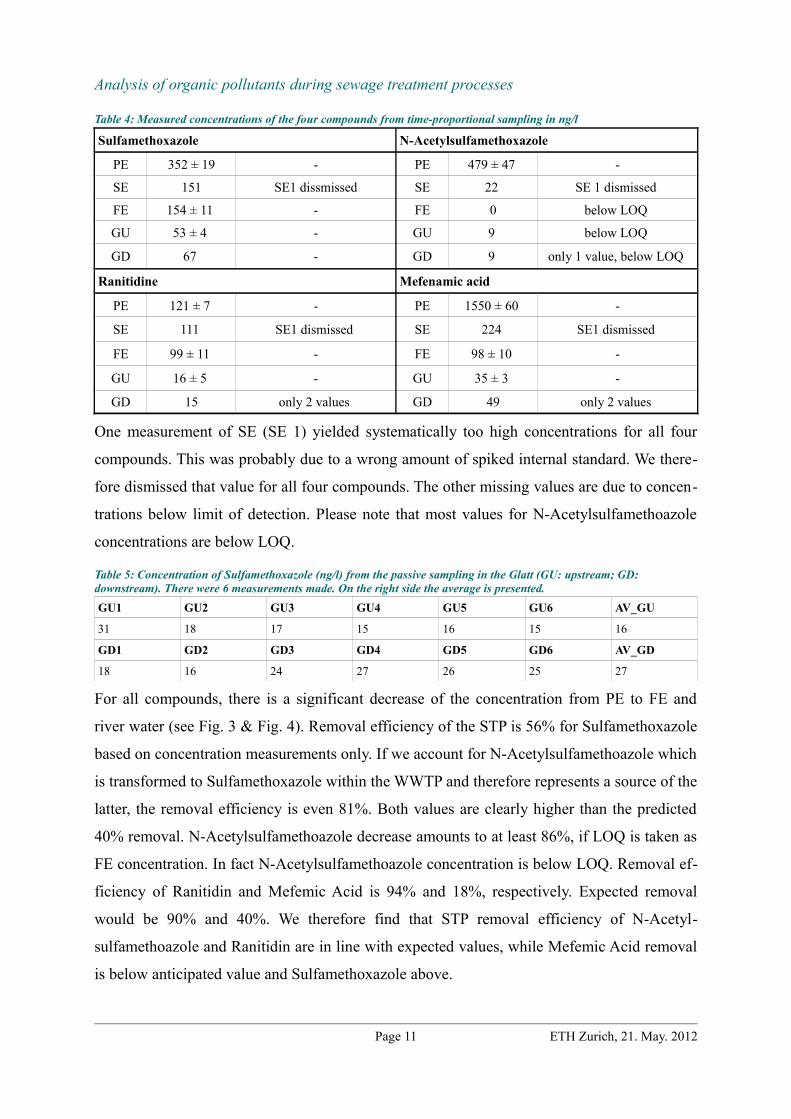
Table 4: Measured concentrations of the four compounds from time-proportional sampling in ng/l
Sulfamethoxazole N-Acetylsulfamethoxazole
PE 352 ± 19 - PE 479 ± 47 -
SE 151 SE1 dissmissed SE 22 SE 1 dismissed
FE 154 ± 11 - FE 0 below LOQ
GU 53 ± 4 - GU 9 below LOQ
GD 67 - GD 9 only 1 value, below LOQ
Ranitidine Mefenamic acid
PE 121 ± 7 - PE 1550 ± 60 -
SE 111 SE1 dismissed SE 224 SE1 dismissed
FE 99 ± 11 - FE 98 ± 10 -
GU 16 ± 5 - GU 35 ± 3 -
GD 15 only 2 values GD 49 only 2 values
One measurement of SE (SE 1) yielded systematically too high concentrations for all four
compounds. This was probably due to a wrong amount of spiked internal standard. We there-
fore dismissed that value for all four compounds. The other missing values are due to concen-
trations below limit of detection. Please note that most values for N-Acetylsulfamethoazole
concentrations are below LOQ.
Table 5: Concentration of Sulfamethoxazole (ng/l) from the passive sampling in the Glatt (GU: upstream; GD: downstream). There were 6 measurements made. On the right side the average is presented. GU1 GU2 GU3 GU4 GU5 GU6 AV_GU
31 18 17 15 16 15 16
GD1 GD2 GD3 GD4 GD5 GD6 AV_GD
18 16 24 27 26 25 27
For all compounds, there is a significant decrease of the concentration from PE to FE and
river water (see Fig. 3 & Fig. 4). Removal efficiency of the STP is 56% for Sulfamethoxazole
based on concentration measurements only. If we account for N-Acetylsulfamethoazole which
is transformed to Sulfamethoxazole within the WWTP and therefore represents a source of the
latter, the removal efficiency is even 81%. Both values are clearly higher than the predicted
40% removal. N-Acetylsulfamethoazole decrease amounts to at least 86%, if LOQ is taken as
FE concentration. In fact N-Acetylsulfamethoazole concentration is below LOQ. Removal ef-
ficiency of Ranitidin and Mefemic Acid is 94% and 18%, respectively. Expected removal
would be 90% and 40%. We therefore find that STP removal efficiency of N-Acetyl-
sulfamethoazole and Ranitidin are in line with expected values, while Mefemic Acid removal
is below anticipated value and Sulfamethoxazole above.
Page 11 ETH Zurich, 21. May. 2012
Analysis of organic pollutants during sewage treatment processes
Dilution within the river Glatt can be calculated with GU, GD and FE values and compared to
expected dilution (1/20) based on known discharge of the STP (253 l·s-1 in average) and the
river before STP (5000 l·s-1). These calculations yield a dilution of 1/11 for Sulfamethoxazole
and 1/6 for Mefemic Acid. While these values compare well with the expected dilution of
1/20, values for dilution of N-Acetylsulfamethoazole and Ranitidin are not computable be-
cause of concentrations below LOQ (N-Acetylsulfamethoazole) or no significant difference
between GU and GD concentrations (Ranitidin).
Passive Sampling measurements in the river Glatt (GU and GD) have been done for
Sulfamethoxazole (see Table 5). The results are in good accordance with the flow-proportion-
al samples. There is a factor of 0.3 (GU) and 0.4 (GD) between the concentrations measured
with the two sampling methods (see Table 6). We therefore conclude that passive sampling
might yield trustworthy results (at least for qualitative purposes), although it is susceptible to
many factors (flow rate, biofouling, compound specific sampling rate, etc.).
Table 6: Measured concentrations of Sulfamethoxazole (ng/l) in the river Glatt
Sulfamethoxazole Flow-proportional sampling Passive sampling Ratio
GU 53 16 0.3
GD 67 27 0.4
At last, measured concentrations can be compared with expected amounts of the compounds
in PE, FE and GD (see Table 7). This comparison shows that our measurements seem plaus-
ible, since obtained concentrations are in good agreement with expected ones. All associated
values are in the same order of magnitude. However, the not detectable amount of N-Acetyl-
Page 12 ETH Zurich, 21. May. 2012
Fig. 4: Limits of Quantification as determined by signal-to-noise ratio of peak height. All values in ng/l. Name of compounds and used fragments: Sulfam. = Sulfamethoxazole (156 Da fragment), N-Acetylsulfam. = N-Acetylsulfamethoazole (134 Da fragment), Ranitidin (176 Da fragment), Mefemic = Mefemic Acid (224 Da fragment).
0102030405060708090
100
Sulfam. N-Acetylsulfam. Ranitidin Mefemic
Limits of Quantification (ng/l)
PE
SE
FE
Glatt
Analysis of organic pollutants during sewage treatment processes
sulfamethoazole in FE is a remarkable deviation, but in line with the fact that for all four ana-
lytes measured concentrations in PE and FE are lower than estimated. On the other hand, con-
centrations in the river Glatt are higher than expected. This might be due to an already con-
taminated river upstream the STP.
Table 7: Measured vs. expected concentrations of all four compounds in PE, FE and GD in ng/l
Sulfamethoxazole N-Acetylsulfamethoazole
Measured Expected Ratio
Measured Expected Ratio
PE 352 515 0.68 PE 479 1287 0.37
FE 154 309 0.50 FE 0 129
GD 67 15 4.47 GD 9 6 1.5
Ranitidin Mefemic Acid
Measured Expected Ratio
Measured Expected Ratio
PE 121 386 0.31 PE 1550 2462 0.63
FE 99 232 0.43 FE 98 246 0.4
GD 15 12 1.25 GD 49 12 4.08
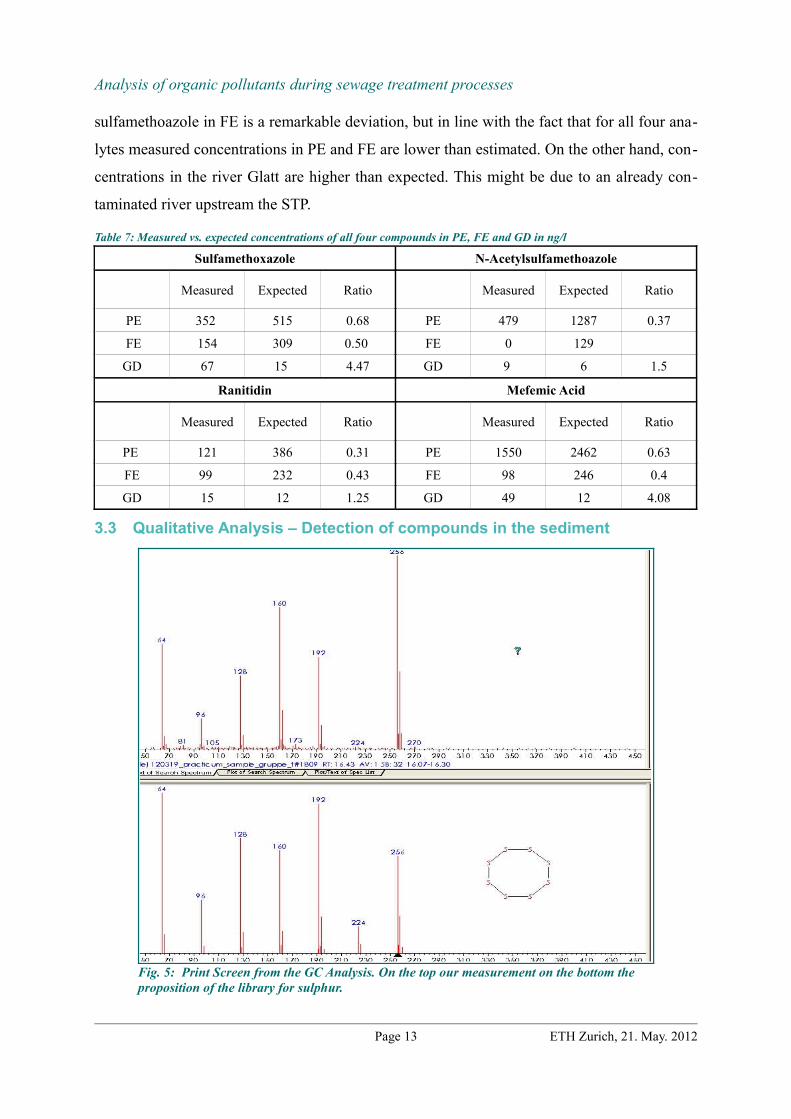
3.3 Qualitative Analysis – Detection of compounds in the sediment
Page 13 ETH Zurich, 21. May. 2012
Fig. 5: Print Screen from the GC Analysis. On the top our measurement on the bottom the proposition of the library for sulphur.
Analysis of organic pollutants during sewage treatment processes
Because the sludge sample of the sewage treatment plant was unusable we used sediment core
from lake Greifensee to assess the qualitative analysis using GC-MS. Fig. 5 shows a screen-
shot of the measurement and the library data. The high consistency between the two screens
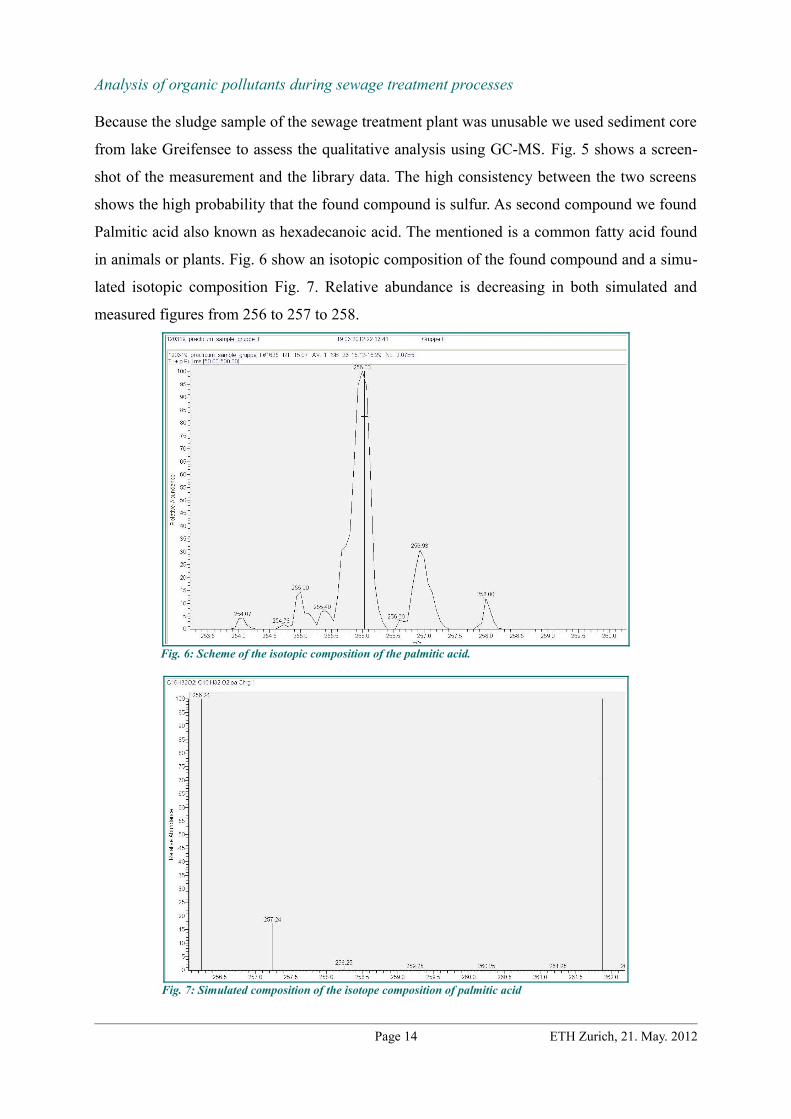
shows the high probability that the found compound is sulfur. As second compound we found
Palmitic acid also known as hexadecanoic acid. The mentioned is a common fatty acid found
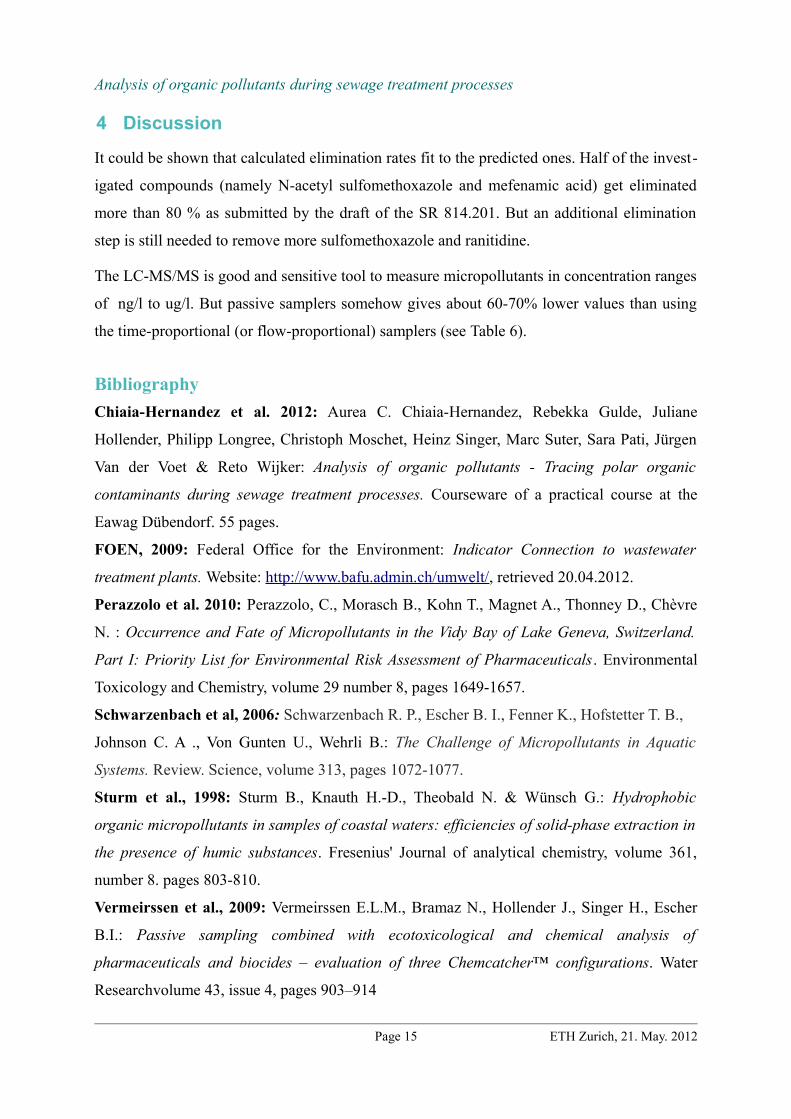
in animals or plants. Fig. 6 show an isotopic composition of the found compound and a simu-
lated isotopic composition Fig. 7. Relative abundance is decreasing in both simulated and
measured figures from 256 to 257 to 258.
Page 14 ETH Zurich, 21. May. 2012
Fig. 7: Simulated composition of the isotope composition of palmitic acid
Fig. 6: Scheme of the isotopic composition of the palmitic acid.
Analysis of organic pollutants during sewage treatment processes
4 Discussion
It could be shown that calculated elimination rates fit to the predicted ones. Half of the invest-
igated compounds (namely N-acetyl sulfomethoxazole and mefenamic acid) get eliminated
more than 80 % as submitted by the draft of the SR 814.201. But an additional elimination
step is still needed to remove more sulfomethoxazole and ranitidine.
The LC-MS/MS is good and sensitive tool to measure micropollutants in concentration ranges
of ng/l to ug/l. But passive samplers somehow gives about 60-70% lower values than using
the time-proportional (or flow-proportional) samplers (see Table 6).
BibliographyChiaia-Hernandez et al. 2012: Aurea C. Chiaia-Hernandez, Rebekka Gulde, Juliane
Hollender, Philipp Longree, Christoph Moschet, Heinz Singer, Marc Suter, Sara Pati, Jürgen
Van der Voet & Reto Wijker: Analysis of organic pollutants - Tracing polar organic
contaminants during sewage treatment processes. Courseware of a practical course at the
Eawag Dübendorf. 55 pages.
FOEN, 2009: Federal Office for the Environment: Indicator Connection to wastewater
treatment plants. Website: http://www.bafu.admin.ch/umwelt/, retrieved 20.04.2012.
Perazzolo et al. 2010: Perazzolo, C., Morasch B., Kohn T., Magnet A., Thonney D., Chèvre
N. : Occurrence and Fate of Micropollutants in the Vidy Bay of Lake Geneva, Switzerland.
Part I: Priority List for Environmental Risk Assessment of Pharmaceuticals. Environmental
Toxicology and Chemistry, volume 29 number 8, pages 1649-1657.
Schwarzenbach et al, 2006: Schwarzenbach R. P., Escher B. I., Fenner K., Hofstetter T. B.,
Johnson C. A ., Von Gunten U., Wehrli B.: The Challenge of Micropollutants in Aquatic
Systems. Review. Science, volume 313, pages 1072-1077.
Sturm et al., 1998: Sturm B., Knauth H.-D., Theobald N. & Wünsch G.: Hydrophobic
organic micropollutants in samples of coastal waters: efficiencies of solid-phase extraction in
the presence of humic substances. Fresenius' Journal of analytical chemistry, volume 361,
number 8. pages 803-810.
Vermeirssen et al., 2009: Vermeirssen E.L.M., Bramaz N., Hollender J., Singer H., Escher
B.I.: Passive sampling combined with ecotoxicological and chemical analysis of
pharmaceuticals and biocides – evaluation of three Chemcatcher™ configurations. Water
Researchvolume 43, issue 4, pages 903–914
Page 15 ETH Zurich, 21. May. 2012
Related Documents