Analysis of mesoscale convective systems in Catalonia using meteorological radar for the period 1996–2000 Tomeu Rigo ⁎ , Maria-Carmen Llasat 1 GAMATeam, Department of Astronomy and Meteorology, University of Barcelona, Avda. Diagonal, 647. 08028 Barcelona, Spain Accepted 3 October 2005 Abstract The aim of this paper is to show a climatology of Mesoscale Convective Systems (MCS) in the NE of the Iberian Peninsula, on the basis of meteorological radar observations. Special attention was paid to those cases that have produced heavy rainfalls during the period 1996–2000. Identification of the MCS was undertaken using two procedures. Firstly, the precipitation structures at the lowest level were recognised by means of a 2D algorithm that distinguishes between convective and non-convective contribution. Secondly, the convective cells were identified using a 3D procedure quite similar to the SCIT (Storm Cell Identification and Tracking) algorithm that looks for the reflectivity cores in each radar volume. Finally, the convective cells (3D) were associated with the 2D structures (convective rainfall areas), in order to characterize the complete MCS. Once this methodology was presented the paper offers a proposal for classifying the precipitation systems, and particularly the MCS. 57 MCS structures were classified: 49% of them were identified as linearly well-organised systems, called TS (39%), LS (18%) and NS (43%). In addition to the classification, the following items were analysed for each MCS found: duration, season, time of day, area affected and direction of movement, and main radar parameters related with convection. The average features of those MCS show an area of about 25000 km 2 , Z max values of 47 dBz, an echotop of 12 km, the maximum frequency at 12 UTC and early afternoon and a displacement towards E-NE. The study was completed by analysing the field at surface, the presence of a mesoscale low near the system and the quasi-stationary features of three cases related with heavy rainfalls. Maximum rainfall (more then 200 mm in 6 h) was related with the presence of a cyclone in combination with the production of a convective train effect. © 2006 Elsevier B.V. All rights reserved. Keywords: Mesoscale convective systems; Convective cells; Weather radar; Tracking; Catalonia 1. Introduction Mesoscale Convective Systems (MCS) are the most convective precipitation structures associated with floods that affect regions at mid-latitudes (Doswell et al., 1996; Gray and Marshall, 1998; Schiesser et al., 1995). There exist many definitions of MCS, depend- ing on the remote sensing system used to identify them or the region of study. For instance, MacGorman and Morgenstern (1998) propose the following definition: “A mesoscale convective system is a group of storms which interacts with and modifies the environment and subsequent storm evolution in such a way that it produces a long-lived storm system having dimensions much larger than individual storms.” Along the same Atmospheric Research 83 (2007) 458 – 472 www.elsevier.com/locate/atmos ⁎ Corresponding author. Tel.: +34 93 4021124; fax: +34 93 4021133. E-mail addresses: [email protected] (T. Rigo), [email protected] (M.-C. Llasat). 1 Tel.: +34 93 4021124; fax: +34 93 4021133. 0169-8095/$ - see front matter © 2006 Elsevier B.V. All rights reserved. doi:10.1016/j.atmosres.2005.10.016

Welcome message from author
This document is posted to help you gain knowledge. Please leave a comment to let me know what you think about it! Share it to your friends and learn new things together.
Transcript

3 (2007) 458–472www.elsevier.com/locate/atmos
Atmospheric Research 8
Analysis of mesoscale convective systems in Catalonia usingmeteorological radar for the period 1996–2000
Tomeu Rigo ⁎, Maria-Carmen Llasat 1
GAMA Team, Department of Astronomy and Meteorology, University of Barcelona, Avda. Diagonal, 647. 08028 Barcelona, Spain
Accepted 3 October 2005
Abstract
The aim of this paper is to show a climatology of Mesoscale Convective Systems (MCS) in the NE of the Iberian Peninsula, onthe basis of meteorological radar observations. Special attention was paid to those cases that have produced heavy rainfalls duringthe period 1996–2000. Identification of the MCS was undertaken using two procedures. Firstly, the precipitation structures at thelowest level were recognised by means of a 2D algorithm that distinguishes between convective and non-convective contribution.Secondly, the convective cells were identified using a 3D procedure quite similar to the SCIT (Storm Cell Identification andTracking) algorithm that looks for the reflectivity cores in each radar volume. Finally, the convective cells (3D) were associatedwith the 2D structures (convective rainfall areas), in order to characterize the complete MCS. Once this methodology was presentedthe paper offers a proposal for classifying the precipitation systems, and particularly the MCS. 57 MCS structures were classified:49% of them were identified as linearly well-organised systems, called TS (39%), LS (18%) and NS (43%). In addition to theclassification, the following items were analysed for each MCS found: duration, season, time of day, area affected and direction ofmovement, and main radar parameters related with convection. The average features of those MCS show an area of about25000 km2, Zmax values of 47 dBz, an echotop of 12 km, the maximum frequency at 12 UTC and early afternoon and adisplacement towards E-NE. The study was completed by analysing the field at surface, the presence of a mesoscale low near thesystem and the quasi-stationary features of three cases related with heavy rainfalls. Maximum rainfall (more then 200 mm in 6 h)was related with the presence of a cyclone in combination with the production of a convective train effect.© 2006 Elsevier B.V. All rights reserved.
Keywords: Mesoscale convective systems; Convective cells; Weather radar; Tracking; Catalonia
1. Introduction
Mesoscale Convective Systems (MCS) are the mostconvective precipitation structures associated withfloods that affect regions at mid-latitudes (Doswell et
⁎ Corresponding author. Tel.: +34 93 4021124; fax: +34 93 4021133.E-mail addresses: [email protected] (T. Rigo), [email protected]
(M.-C. Llasat).1 Tel.: +34 93 4021124; fax: +34 93 4021133.
0169-8095/$ - see front matter © 2006 Elsevier B.V. All rights reserved.doi:10.1016/j.atmosres.2005.10.016
al., 1996; Gray and Marshall, 1998; Schiesser et al.,1995). There exist many definitions of MCS, depend-ing on the remote sensing system used to identify themor the region of study. For instance, MacGorman andMorgenstern (1998) propose the following definition:“A mesoscale convective system is a group of stormswhich interacts with and modifies the environment andsubsequent storm evolution in such a way that itproduces a long-lived storm system having dimensionsmuch larger than individual storms.” Along the same
459T. Rigo, M.-C. Llasat / Atmospheric Research 83 (2007) 458–472
line, Houze (1993) considers an MCS as a cloudystructure that includes convective nuclei forming acommon region of precipitation with a longitudeexceeding 100 km in one direction. Within thespectrum of convective structures, MCS can beconsidered as large multicellular structures with lifecycles that can exceed 24 h. In general, most of theauthors agree with the following definition: an MCS isan extended structure that includes within a phase of itslife a certain degree of convection, which may or maynot be linearly organised, producing high amounts ofrainfall. Their dynamics characteristics can be sum-marised as follows:
• The existence of two clearly differentiated parts, oneassociated with convective process and the otherassociated with stratiform and weak precipitation.
• The circulations associated with MCSs can affect notonly their microscale and mesoscale background, butalso the macroscale.
• The existence of a gust front associated with the coldpool created by the downdrafts that favour theapparition of new convective cells is usual.
The most interesting MCSs are probably thoseknown as quasi-stationaries (Martín et al., 2001;Chappell, 1986; Doswell et al., 1996). These MCSsare the more usual cause of heavy rainfall and flash-floods. This type of systems is composed of differentsingle cells that can be in different stages of their lifecycles. These cells often move over a single region,producing in a brief time period more than one rainfallepisode with high intensities. In those cases, precipita-tions above 200 mm can be accumulated in less than 3 h(Ramis et al., 1995; Riosalido et al., 1997; Llasat et al.,2003; Legrand et al., 2003). The conditions ofquasistationarity are caused by simultaneity of effectsat different meteorological scales within a few hours,and the necessary processes are dynamics, thermody-namics and microphysics. The most important factorsare
• The characteristics of the synoptic background: itdetermines the type and intensity of the single cellsthat belong to the MCS.
• The type of forcing, also synoptic: it resolves the typeof mesoscale configuration the convection willadopt.
• The position and intensity of development anddissipation of the cells, as well as their movementin relation with the general movement of the MCS asa whole.
There exist some climatologies of MCS in differentregions of the planet, such as the Western Mediterra-nean, the United States, Africa and others, especiallyusing satellite imagery (Gray and Marshall, 1998;Purdom, 1999; Maddox et al., 1986; Laing and Fritsch,1993; Miller and Fritsch, 1991; Augustine and Howard,1991). In this case, the thresholds imposed for a mid-latitude MCS merge the minimum values for the cloudtop temperature, Tbb, with their extension. For theMesoscale Convective Complexes, the clouds with Tbbless than −32 °C should have an extension equal to orabove 100,000 km2, while values of Tbb lower than−52 °C should cover an area of 50,000 km2 (Maddox etal., 1979; Fritsch et al., 1986). Due to the fact that inEurope and in Mediterranean countries it is not usual tofind such broad systems, the criterion for identifyingMCS by satellite imagery maintains the temperaturethresholds, but diminishes the imposed extension, whichis usually less than 10,000 km2 (Riosalido et al., 1998).In the case of the Iberian Peninsula and the closest areaof the Mediterranean Sea, intensive research was doneby the Group for Development of Techniques forForecasting (STAP, INM) of the Spanish WeatherService (Riosalido, 1997; Martín et al., 1998; Riosalidoet al., 1998, 1999; San Ambrosio et al., 2000), as well asby Cana et al. (1999), Jansà et al. (1996), Sánchez et al.(2001) and Llasat et al. (1999). Besides those works, aspecific climatology of mesoscale convective systemswith hail precipitation was developed by Sánchez et al.(2003).
When the MCS is analysed on the basis ofmeteorological radar, it could be classified welldepending on the position of its stratiform region inrelation to the convective area or on the organization ofthe convective region over the different stages of itslife cycle. Loehrer and Johnson (1995), within theframework of the Oklahoma PRE-STORM experiment,showed that the organization of the convection into thesystem during the initial phase can be of four types:linear, back-building, disorganized, and intersectingconvective bands. A similar classification for MCS inSwitzerland was presented by Schiesser et al. (1995),although they do not include the last kind. Regardingthe mature stage, the first classification of the MCSconcerns the degree of symmetry of the squall line(Houze et al., 1990), considering two types: symmet-ric, which presents a flank line that is well-defined, andslightly curved in the central part, where the mostactive convection develops, and the asymmetric type,which shows a more active wind, in which the cellsincluded are affected by great atmospheric instability.Rigo and Llasat (2004), considering their own results
460 T. Rigo, M.-C. Llasat / Atmospheric Research 83 (2007) 458–472
and previous studies (Parker and Johnson, 2000;Schiesser et al., 1995), propose that an MCS can beclassified in terms of the position of its stratiformregion in relation to the convective area, and theorganization of the convective region, as shown in thefollowing sections.
This study analyses the Mesoscale ConvectiveSystems that occurred in Catalonia from the weatherradar observations for the period 1996–2000. To thisend, firstly, the data used and the methodology wereintroduced. The following section shows a climatologyof MCSs identified for the period 1996–2000. Afterthis, three cases of MCS that have produced catastrophicrainfalls were selected for a more detailed analysis.Finally, the conclusions show a synthesis of the resultsand comparisons with other works, undertaken in thecourse of the paper.
2. Data used
The analysis comprises 43 heavy rainfall eventsrecorded in Catalonia between 1996 and 2000. Table 1
Table 1Data used in this research and some information relative to them
Type of data Main features
Rainfall (1) 126 rain gauges(2) 5-min rain rate(3) Internal basins of Catalonia(4) Water Management Agency ofCatalonia (ACA)
Cyclones (1) MEDEX database(2) 6-hourly information (position,size and intensity)(3) Iberian Peninsula and WesternMediterranean Sea(4) MEDEX project
Thermodynamic (1) 5 soundings+wind profile overthe radar(2) 12-hourly data (soundings)/6-hourlydata (profile)(3) Barcelona, Palma, Zaragoza, Murcia(4) Spanish Weather Service (INM)and Catalan Weather Service (SMC)
Weather stations (1) 90 automatic stations(2) Hourly maximum/average values(temperature, moisture and windinformation)(3) Catalonia(4) Catalan Weather Service (SMC)
Radar data (1) Barcelona(2) 10 min radar volume(3) Catalonia(4) Spanish Weather Service
(1) Localisation or network; (2) kind of data; (3) region covered; (4)project or organization responsible of these data.
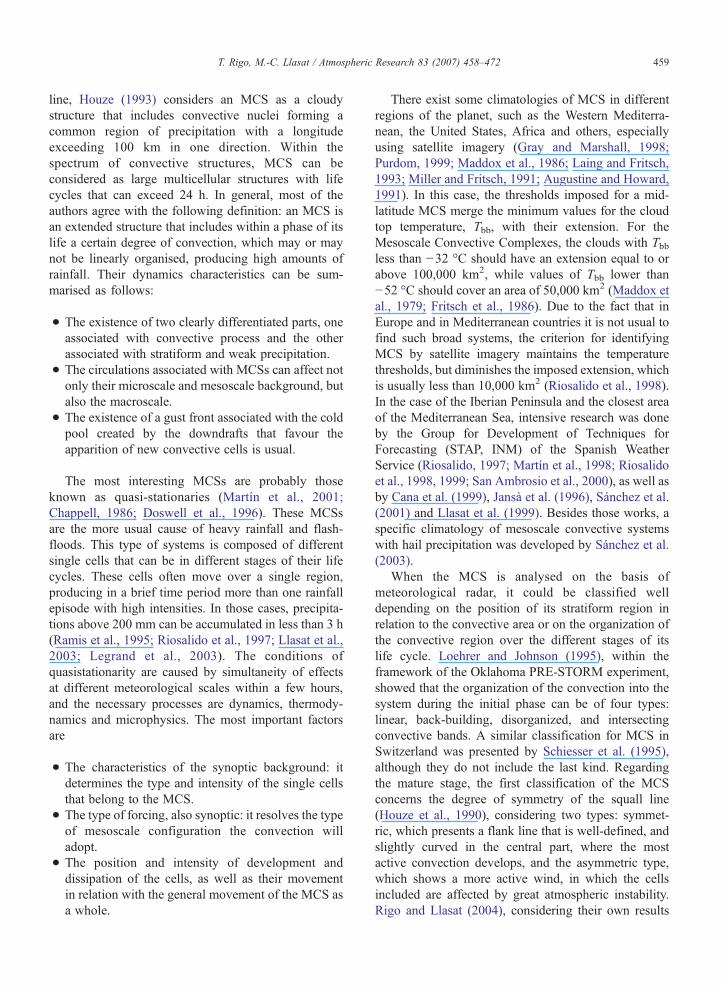
shows the available data used to do this research, andFig. 1 shows the domain covered for each type of data.Rainfall data at ground level were used to identify theheavy rainfall following the criteria shown in Rigo andLlasat (2004).
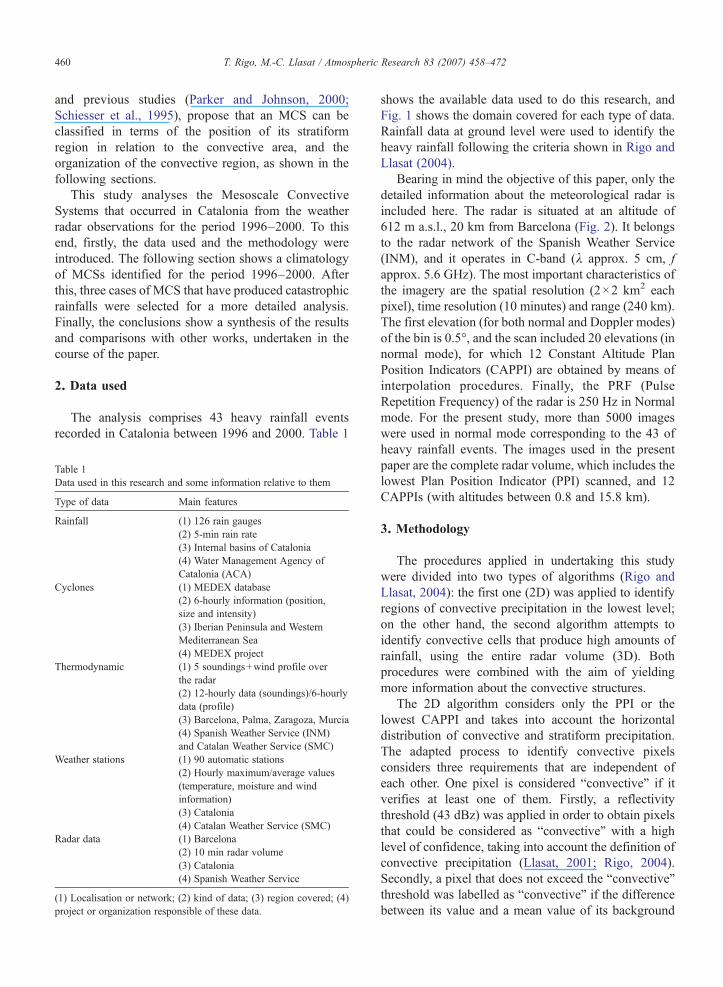
Bearing in mind the objective of this paper, only thedetailed information about the meteorological radar isincluded here. The radar is situated at an altitude of612 m a.s.l., 20 km from Barcelona (Fig. 2). It belongsto the radar network of the Spanish Weather Service(INM), and it operates in C-band (λ approx. 5 cm, fapprox. 5.6 GHz). The most important characteristics ofthe imagery are the spatial resolution (2×2 km2 eachpixel), time resolution (10 minutes) and range (240 km).The first elevation (for both normal and Doppler modes)of the bin is 0.5°, and the scan included 20 elevations (innormal mode), for which 12 Constant Altitude PlanPosition Indicators (CAPPI) are obtained by means ofinterpolation procedures. Finally, the PRF (PulseRepetition Frequency) of the radar is 250 Hz in Normalmode. For the present study, more than 5000 imageswere used in normal mode corresponding to the 43 ofheavy rainfall events. The images used in the presentpaper are the complete radar volume, which includes thelowest Plan Position Indicator (PPI) scanned, and 12CAPPIs (with altitudes between 0.8 and 15.8 km).
3. Methodology
The procedures applied in undertaking this studywere divided into two types of algorithms (Rigo andLlasat, 2004): the first one (2D) was applied to identifyregions of convective precipitation in the lowest level;on the other hand, the second algorithm attempts toidentify convective cells that produce high amounts ofrainfall, using the entire radar volume (3D). Bothprocedures were combined with the aim of yieldingmore information about the convective structures.
The 2D algorithm considers only the PPI or thelowest CAPPI and takes into account the horizontaldistribution of convective and stratiform precipitation.The adapted process to identify convective pixelsconsiders three requirements that are independent ofeach other. One pixel is considered “convective” if itverifies at least one of them. Firstly, a reflectivitythreshold (43 dBz) was applied in order to obtain pixelsthat could be considered as “convective” with a highlevel of confidence, taking into account the definition ofconvective precipitation (Llasat, 2001; Rigo, 2004).Secondly, a pixel that does not exceed the “convective”threshold was labelled as “convective” if the differencebetween its value and a mean value of its background
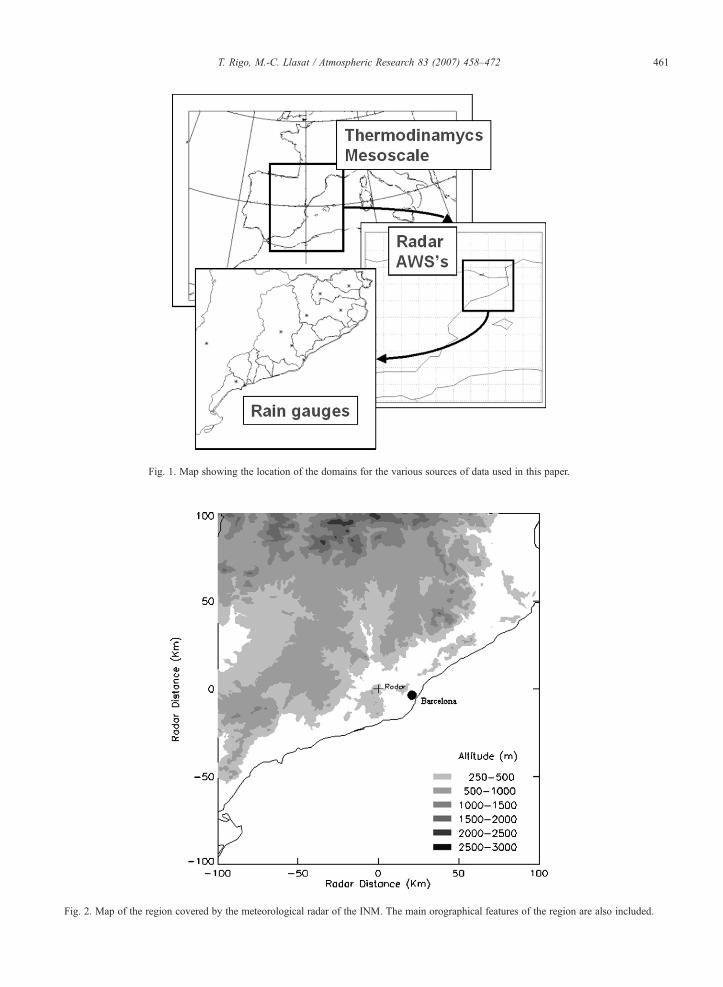
Fig. 2. Map of the region covered by the meteorological radar of the INM. The main orographical features of the region are also included.
Fig. 1. Map showing the location of the domains for the various sources of data used in this paper.
461T. Rigo, M.-C. Llasat / Atmospheric Research 83 (2007) 458–472
462 T. Rigo, M.-C. Llasat / Atmospheric Research 83 (2007) 458–472
exceeds a considered function (Sánchez-Diezma, 2001),which depends on the background reflectivity and theradar characteristics. This second point considers thestrong gradient observed in areas where convectiveprecipitation occurs. The third requirement considersthat if there is at least one “convective” pixel adjacent tothe analysed pixel, this last could be considered as“convective.” This requirement was applied in order toconsider as convective those pixels located on theborder of the convective area that do not fulfil theprevious criteria but that are part of the convectivesystem. Once the three requirements were applied to allthe pixels, those that do not verify any of them wereclassified as “stratiform”. Those pixels with reflectivitybelow 18 dBz were considered to be “drizzle” or “no-precipitation”.
The 3D procedure was applied taking account of thefollowing aspects. Firstly, it aims to select in each levelthose pixels (labelled as ‘convective’) that exceed one ofthe various reflectivity thresholds (30, 35, 40, 45, 50, 55and 60 dBz), in order to find the cell's core. Thesedifferent thresholds were considered in order to look forall the cells (although they could be at different stages ofevolution) in all the levels. Then, for each region with‘convective cores’, the method selects the zones thathave the same reflectivity value as the core for 6 pixelsor more, i.e., 24 km2. This size threshold was imposedin order to eliminate regions of anomalous echoes(small size) and to select the most important cells. Ifthere were fewer than 6 pixels for one reflectivitythreshold, the method automatically selects the nextreflectivity value. The pixels that do not reach the corethreshold cannot be considered as forming part of the‘convective core.’ Finally, if the cell was detected inmore than one level, the algorithm takes it as a valid
Fig. 3. Cloud classification by low-level radar structure. Convective are
convective cell. If a gap of one level exists, thealgorithm considers the two nearest cells in the verticalas being the same.
It is important to notice here that a convective cell isconsidered as the main core (or one where thereflectivity has the strongest values) in the radar volume,while in the 2D algorithm the idea is to detect thoseareas where convection develops at low levels,producing heavy rainfall. In order to classify thedifferent kind of precipitation structures, the first workundertaken was to determine the degree of organizationthat predominated in each radar image. Then, once allthe precipitation structures had been identified, theirdistribution, size, duration and relative position betweenthe stratiform and convective zones were analysed foreach radar image, using the 2D method. The nextclassification was proposed in Rigo and Llasat (2004),taking into account those parameters and some previousworks (MacGorman and Morgenstern, 1998; Houze,1993; Parker and Johnson, 2000) (Fig. 3):
• Mesoscale convective system (MCS): a precipitationstructure could be identified as MCS when its majoraxis has a length equal or above 100 km for 3 h ormore, and a minimum of 30% of the area covered byit in each image can be associated with convectiverainfall, during its mature stage. An MCS wasclassified depending on the position of its stratiformregion in relation to the convective area, anddepending on the organization of the convectiveregion. Then, they could be divided into well-organised systems, usually lineally, and poorlyorganised systems, or clusters of convective struc-tures (CLU). The first type could be divided into TS(with trailing stratiform area), LS (leading stratiform
as are shown by light grey shading, stratiform areas are in white.
463T. Rigo, M.-C. Llasat / Atmospheric Research 83 (2007) 458–472
region), and NS (with practically no stratiformprecipitation). A specific case of the NS classwould be when the stratiform region is situated in aflank of the convective line and its movement isparallel to that of the convective region.
• Multicell systems (MUL): if the rainfall structure hasa convective area exceeding 30% of the total echoregion, but does not meet the condition about timeand size for being an MCS.
• Isolated convection (IND): when small-scale, inde-pendent, and separate convective structures areidentified.
• Convection embedded in stratiform rainfall (EST-EMB): a stratiform region with some convectivenucleus. The area covered by the convectiveprecipitation does not exceed 30% of the total echoregion.
• Stratiform (EST): when convective precipitationdoes not exist or does not exceed 3% of the totalecho area.
4. Climatology of mesoscale convective systems inCatalonia between 1996 and 2000
The first part of this work was to determine thedegree of organization that predominated in each radarimage. Then, once all the precipitation structures hadbeen identified, their distribution, size, duration andrelative position between the stratiform and convectivezones were analysed for each radar image, using the 2Dmethod and the classification explained previously. TheMCS sub-classification into clusters (CLU), trailingstratiform linear systems (TS), leading stratiform linearsystems (LS) and NS has also been considered.Supercell structures have not been considered herebecause their main feature is the detection of amesocyclone (Doswell and Burgess, 1993), a featureonly detectable using Doppler wind information (in thisstudy only reflectivity volumes were analysed). Eachimage was labelled on the basis of the most importantkind of structure identified in it. When two or morestructures were identified in the same radar image, onlyone of them was recorded. The selection criterion wasthe following: (1) MCS, (2) EMB-EST, (3) MUL, (4)IND, (5) EST. Then, for instance, if there is an MULstructure and an EST region, only the former isconsidered. Special priority was given to the MCSand, for this reason, when in one image there appear twoor more MCSs, then all of them were considered. Insome cases, an MCS can change its characteristicsduring its life cycle (i.e., MCS-TS to MCS-NS, or, at theend of its life, to EST-EMB).
A total of 167 main precipitation structures wereidentified. MCSs and Multicells are the most commonstructures, with a frequency of 57 cases in both types(35%), followed by Individual cells that were found asmainly responsible for heavy rainfall events on 32occasions. The less usual structures were EST (3%),which were only observed in winter and summer.Linear and non-linear MCSs were registered in similarpercentages (49% of linear MCSs), while in relation tothe types of linear MCSs, the most common was theNS one (43%), ahead of the TS (39%) and the LS(18%). Although it is possible to record the MCSstructures in any season of the year, they mainly occurduring the autumn season. This seasonal feature isobserved in all the precipitation structures with theexception of those stratiform ones that have theirmaximum frequency in winter. However, the contri-bution of both structures dominated by the stratiformfield is low (only 21 cases) due to the fact that highrainfall intensities are usually related with convectiverainfall.
Regarding the season in which more MCSs weredetected, a correlation was observed between thenumber of heavy rainfall events and the number ofMCSs identified, September–November being theperiod of the year with the largest number of cases(more than 50% of the total number of MCSs). Although45 non-MCS structures in front of 30 MCS structureswere found in the heavy rainfall events recorded inautumn, flood events are usually associated with MCSstructures in which high rainfall rates can last somehours. The mean of the maximum daily rainfall recordedwhen an MCS was detected was about 90 mm, themaximum registered during the analysed period being223 mm.
The results obtained here show some differencesfrom similar works like that of Parker and Johnson(2000) that show MCS-TS as the dominant ones (60%).This disparity is due to the different samples consideredby the authors. While in this work all the structuresassociated with heavy rainfall events throughout theyear were considered, the work by Parker and Johnson(2000) focused on all the MCS recorded during May foryears 1996–1997.
One of the most notable aspects observed is thatmany events (especially in summer and autumn)recorded two or more MCSs. These phenomena canbe particularly associated with favourable environmentsmaintained for long periods, and the generation of newMCSs over the remains of previous ones. The mean timeof MCSs in the region is more or less 10 h, but when twoMCS are merging they can last 24 h.
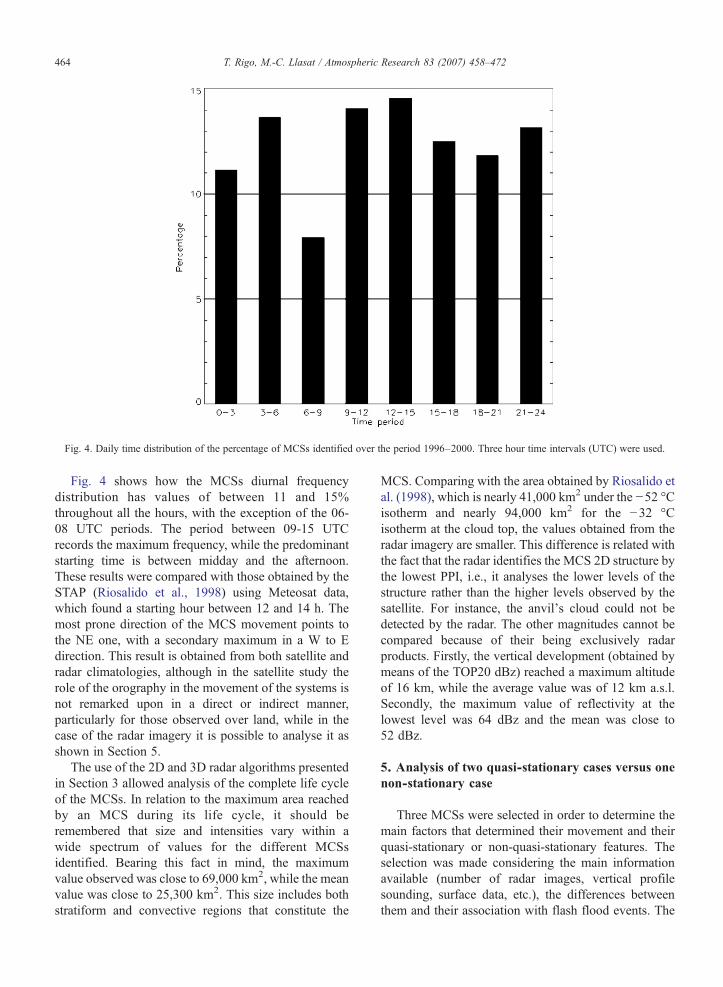
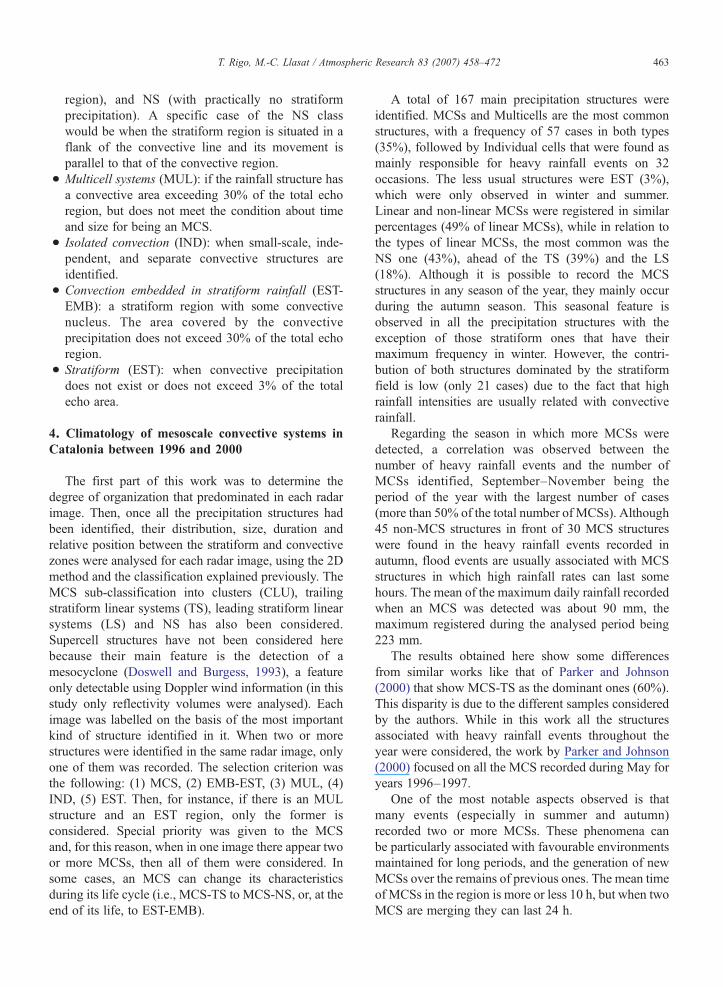
Fig. 4. Daily time distribution of the percentage of MCSs identified over the period 1996–2000. Three hour time intervals (UTC) were used.
464 T. Rigo, M.-C. Llasat / Atmospheric Research 83 (2007) 458–472
Fig. 4 shows how the MCSs diurnal frequencydistribution has values of between 11 and 15%throughout all the hours, with the exception of the 06-08 UTC periods. The period between 09-15 UTCrecords the maximum frequency, while the predominantstarting time is between midday and the afternoon.These results were compared with those obtained by theSTAP (Riosalido et al., 1998) using Meteosat data,which found a starting hour between 12 and 14 h. Themost prone direction of the MCS movement points tothe NE one, with a secondary maximum in a W to Edirection. This result is obtained from both satellite andradar climatologies, although in the satellite study therole of the orography in the movement of the systems isnot remarked upon in a direct or indirect manner,particularly for those observed over land, while in thecase of the radar imagery it is possible to analyse it asshown in Section 5.
The use of the 2D and 3D radar algorithms presentedin Section 3 allowed analysis of the complete life cycleof the MCSs. In relation to the maximum area reachedby an MCS during its life cycle, it should beremembered that size and intensities vary within awide spectrum of values for the different MCSsidentified. Bearing this fact in mind, the maximumvalue observed was close to 69,000 km2, while the meanvalue was close to 25,300 km2. This size includes bothstratiform and convective regions that constitute the
MCS. Comparing with the area obtained by Riosalido etal. (1998), which is nearly 41,000 km2 under the −52 °Cisotherm and nearly 94,000 km2 for the −32 °Cisotherm at the cloud top, the values obtained from theradar imagery are smaller. This difference is related withthe fact that the radar identifies the MCS 2D structure bythe lowest PPI, i.e., it analyses the lower levels of thestructure rather than the higher levels observed by thesatellite. For instance, the anvil's cloud could not bedetected by the radar. The other magnitudes cannot becompared because of their being exclusively radarproducts. Firstly, the vertical development (obtained bymeans of the TOP20 dBz) reached a maximum altitudeof 16 km, while the average value was of 12 km a.s.l.Secondly, the maximum value of reflectivity at thelowest level was 64 dBz and the mean was close to52 dBz.
5. Analysis of two quasi-stationary cases versus onenon-stationary case
Three MCSs were selected in order to determine themain factors that determined their movement and theirquasi-stationary or non-quasi-stationary features. Theselection was made considering the main informationavailable (number of radar images, vertical profilesounding, surface data, etc.), the differences betweenthem and their association with flash flood events. The

Fig. 5. Maximum rainfall values registered in the events of 10th June 2000, 15th September 1999, and 8th August 1996. Maximum accumulatedrainfall over the entire event and maximum hourly precipitation at the same rain gauge station are shown.
465T. Rigo, M.-C. Llasat / Atmospheric Research 83 (2007) 458–472
selected cases were: 10th June 2000 (with two largequasi-stationary periods), 15th September 1999 (withone quasi-stationary system), and 8th August 1996 (witha non-stationary MCS). Fig. 5 presents some character-istics of the precipitation for each event in the placewhere the maximum accumulated rainfall was recorded.Due to its quasi-stationary character, the event of June10th recorded the maximum precipitation (more than the90% of the total was recorded in less than 6 h). Fig. 6shows the trajectories of the centres of the MCSs foreach case. There is a clear relationship between theposition of the maximum and the movement of thesystems: the more stationary the MCS, the moreaccumulated rainfall. Another characteristic, cited inthe previous section, is the influence of the orography inthe movement of the MCS over land. The threeexamples shown in Fig. 6 are clearly representative ofthis fact: the two systems with a centre over an inlandarea (the other one is near the coastline and the influenceof the sea is greater than for the other cases) havetrajectories (during the period of slow movement) thatare quite correlated with the orography isolines.
In the following paragraphs, some surface aspects areanalysed. Figs. 7, 8, and 9 show the evolution of the
moisture, temperature and wind at the surface comparedwith the precipitation for the three points where themaximum values were recorded. Due to the similarityfound for the ground features between the three cases,only one of them was selected to illustrate each analysis.At the same time, interpolated charts of those magni-tudes are compared with radar images for the differentcases. In relation with the moisture characteristics, themost important and common ones are, firstly, theexistence of a minimum preceding the MCS spatiallyand temporally; secondly, the presence of a maximumover the area below the squall line; and finally, the highvalues remain after the passage of the MCS over theregion (Fig. 7).
The main features observed in the surface tempera-ture (Fig. 8) are a strong gradient over the area where thesquall line is situated, with the maximum values in theleading part of the system, and a maximum temperaturepreceding the MCS, as proposed in other works donefrom a synoptic point of view (Llasat and Puigcerver,1994) that undergoes a sudden decrease when precip-itation starts and is maintained after the passing of theMCS, as a consequence both of the evaporation and colddowndraft from the cloud.

Fig. 6. Trajectories of the MCSs cores identified in the three events: 10th June 2000 (cross over solid lines), 15th September 1999 (diamonds overdashed lines), and 8th August 1996 (asterisks over dotted lines).
Fig. 7. Evolution of the relative humidity (solid line) and precipitation (dashed line) for the 10th June 2000 event.
466 T. Rigo, M.-C. Llasat / Atmospheric Research 83 (2007) 458–472
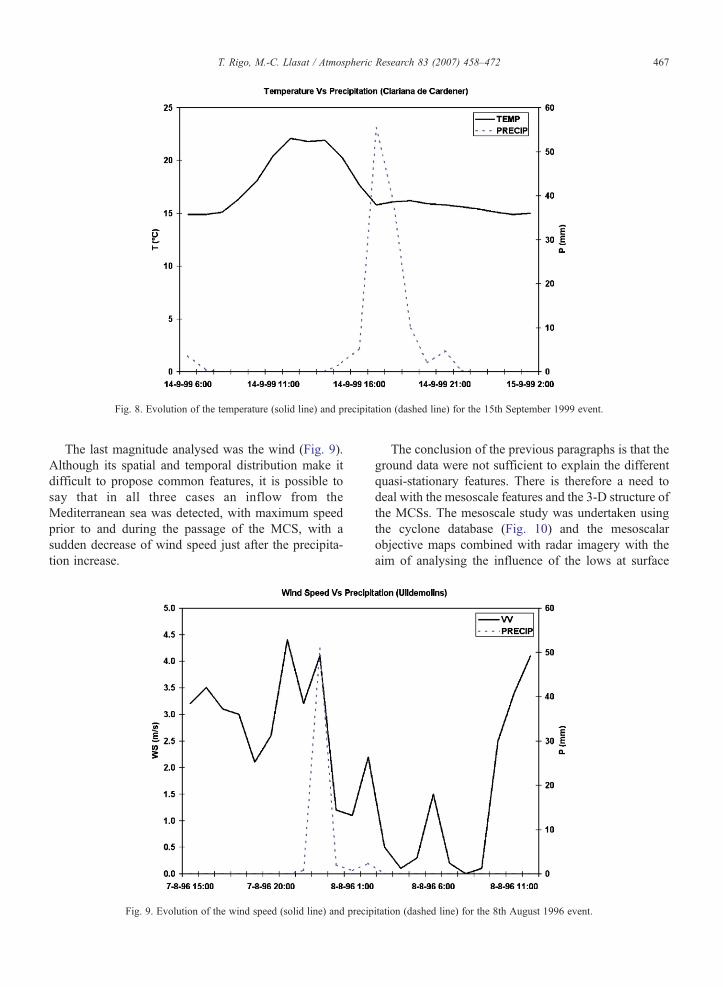
Fig. 8. Evolution of the temperature (solid line) and precipitation (dashed line) for the 15th September 1999 event.
467T. Rigo, M.-C. Llasat / Atmospheric Research 83 (2007) 458–472
The last magnitude analysed was the wind (Fig. 9).Although its spatial and temporal distribution make itdifficult to propose common features, it is possible tosay that in all three cases an inflow from theMediterranean sea was detected, with maximum speedprior to and during the passage of the MCS, with asudden decrease of wind speed just after the precipita-tion increase.
Fig. 9. Evolution of the wind speed (solid line) and precip
The conclusion of the previous paragraphs is that theground data were not sufficient to explain the differentquasi-stationary features. There is therefore a need todeal with the mesoscale features and the 3-D structure ofthe MCSs. The mesoscale study was undertaken usingthe cyclone database (Fig. 10) and the mesoscalarobjective maps combined with radar imagery with theaim of analysing the influence of the lows at surface
itation (dashed line) for the 8th August 1996 event.
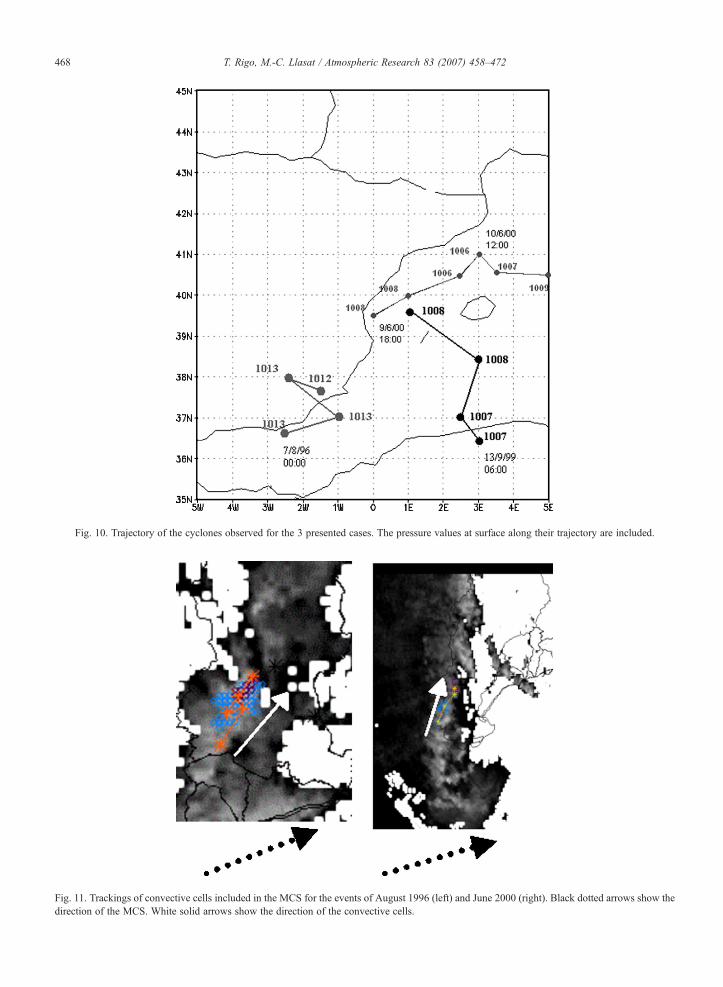
Fig. 10. Trajectory of the cyclones observed for the 3 presented cases. The pressure values at surface along their trajectory are included.
Fig. 11. Trackings of convective cells included in the MCS for the events of August 1996 (left) and June 2000 (right). Black dotted arrows show thedirection of the MCS. White solid arrows show the direction of the convective cells.
468 T. Rigo, M.-C. Llasat / Atmospheric Research 83 (2007) 458–472
469T. Rigo, M.-C. Llasat / Atmospheric Research 83 (2007) 458–472
over the movement of the MCSs. The first aspectobserved is that the only case where a mesoscalecyclone passed close to the region was the event of June2000, while for the other events the influence of the
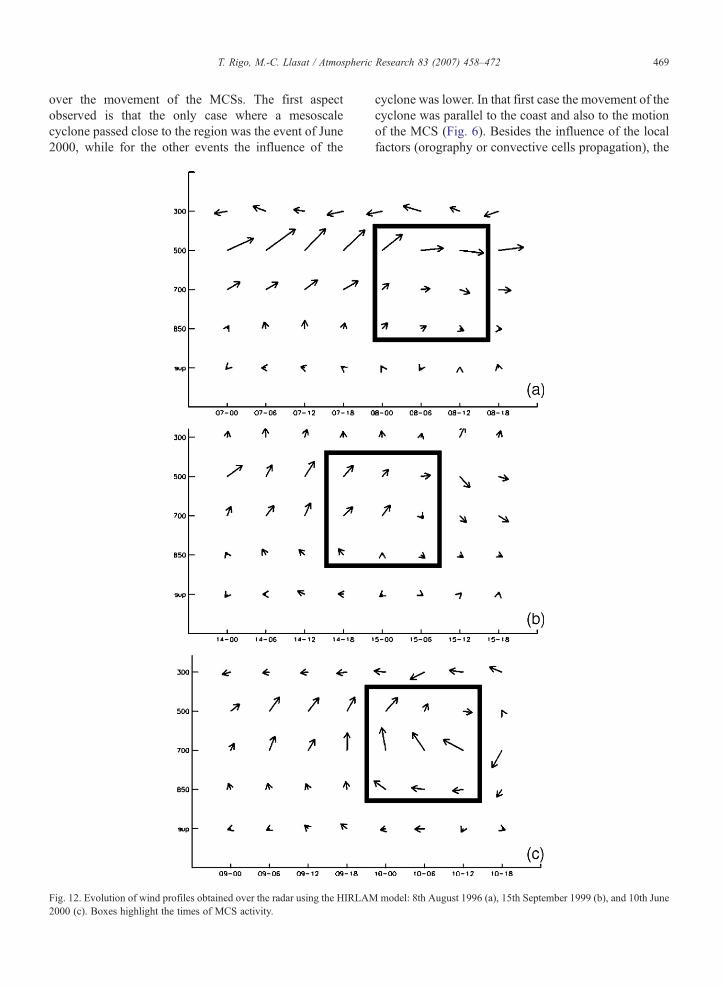
Fig. 12. Evolution of wind profiles obtained over the radar using the HIRLAM2000 (c). Boxes highlight the times of MCS activity.
cyclone was lower. In that first case the movement of thecyclone was parallel to the coast and also to the motionof the MCS (Fig. 6). Besides the influence of the localfactors (orography or convective cells propagation), the
model: 8th August 1996 (a), 15th September 1999 (b), and 10th June
470 T. Rigo, M.-C. Llasat / Atmospheric Research 83 (2007) 458–472
displacement of the MCS was mainly due to themovement of the mesocyclone, in both cases in June2000 and September 1999. During the August 1996case, the main mesoscale factor that produced thedisplacement of the MCS was a cold front.
The tracking algorithms (Rigo and Llasat, 2004)were applied over each MCS but also over eachconvective cell (3-D algorithm) included in the MCS(Fig. 11). The objective is to determine the trajectoriesof the structures, distinguishing the displacement andthe propagation movements of the integrated system. Inthe August 1996 and September 1999 events, the cellsthat belonged to the MCS were moving practically in thesame direction as in the 2-D systems. Then, thedisplacement and propagation movements were quasi-parallel and the total movement vector was, especially inthe first case and in much of the second one, the sum ofthe two components. The models of expected precipi-tation (Doswell et al., 1996) present a peak and somerear stratiform precipitation, a fact that is confirmed inFig. 9 (August 1996) and Fig. 8 (September 1999)which show the intermediate case. In these figures therainfall evolution corresponds to the station where themaximum of precipitation was recorded over the entireevent.
Throughout much of the June 2000 event, the cellsforming the MCS were moving in a perpendiculardirection to the 2-D system (Fig. 11), and consequentlythe vectors of propagation and displacement produced afinal vector in which the two components were partiallycancelling each other out. This effect is known asconvective train (Doswell et al., 1996). The model ofexpected precipitation presents some peaks (producedby different, and consecutive, cells precipitating over thesame area) and more or less abundant rear stratiformprecipitation (depending on the stage of the MCS). Thiseffect can be observed in the rainfall evolution for theJune 2000 case (Fig. 7), with five consecutive values of30-min rainfall that exceeded the 30 mm (then 2 h and30 min with high rain rates) appearing, and more than8 h with slightly (stratiform like) precipitation.
The profiles evolution of horizontal wind compo-nents over the radar was obtained using the HIRLAMmodel (INM). For the August 1996 and September 1999events, the wind direction in different levels waspractically parallel (or the angle did not exceed 45°),while for the June 2000 case the angle was over 120°(Fig. 12). This fact explains this quasi-stationary MCS,and it is linked with the movements of the system. Themid-level flow tends to contribute to the displacementvector, while the low-level wind is associated withconvective cell propagation. The reason for the great
differences in the last case was due to the presence of themeso-low close to the region (forcing the wind at lowlevels). This showed how the contribution of thecyclone was not only in the displacement vector, butalso in the propagation movement.
6. Conclusions
The main goal of this work was to carry out aclassification and characterization of the MesoscaleConvective Systems, from the weather radar point ofview, and taking into account the 2D and 3D precipita-tion structures. With this aim, data from 126 automatictipping buckets located at the NE part of the IberianPeninsula and from the meteorological radar of Barce-lona were obtained for the heavy rainfall events recordedover the period 1996–2000. Approximately 70% ofthese heavy rainfall events occurred in autumn andsummer. More than 3000 2D precipitation structures andmore than 13,000 3D cells, corresponding to 43 events,were recorded. Mesoscale information such as temper-ature, humidity and wind near the ground, wind profilesand mesoscale surface lows were also considered.
57 MCS structures were classified depending on therelative position of their stratiform region and depend-ing on the organization of the convective region. 49% ofthem were identified as well-organised linearly arrangedsystems, called TS (39%), LS (18%), and NS (43%).MCS composed of clusters of convective structures(CLU) constituted 51%. The average features of thoseMCS show an area about 25,000 km2, Zmax values of47 dBz, an ecotop of 12 km, a maximum frequency at12 UTC and early afternoon and a displacement towardsE-NE.
The use of surface data can complete radar informa-tion in operational forecasting tasks, because it allowsunderstanding the evolution of MCS and can help toknow the stage it has reached in its life cycle. Mesoscalefactors are very important in the evolution of the MCS.The presence of a cyclone at low levels helps to producethe quasi-stationarity of the structure, increasing theprobability of large amounts of precipitation. Displace-ment of convective cells in relation to the MCS canproduce the convective train effect. It is quite common incases where the cells are displaced perpendicular to theMCS movement. This effect also increases the proba-bility of large amounts of precipitation.
Acknowledgements
The authors thank the Agencia Catalana de l'Aiguaand the Meteorological Regional Center of the INM in
471T. Rigo, M.-C. Llasat / Atmospheric Research 83 (2007) 458–472
Catalonia for the data provided. Our thanks also to theSTAP of INM for their kind collaboration. This studywas carried out within the MONEGRO (REN 2003-09617-C02-02) Spanish project, and the AMPHORE(Interreg IIIB Medocc 2003-03-4.3-I-079) Europeanproject. Our thanks to M. Ceperuelo for his kindcollaboration.
References
Augustine, J., Howard, K.W., 1991. Mesoscale convective complexesover the United States during 1986 and 1987. Mon. Weather Rev.119, 1575–1589.
Cana, L., Hernández, E., García, R., Grisolía-Santos, G., 1999.Mesoscale convective systems during 1990–94: characteristicsand synoptic environment. Mediterranean Storms Plinius Confer-ence'99. Maratea, Italy, pp. 67–75.
Chappell, C.F., 1986. Quasi-stationary convective events. In: Ray, P.S.(Ed.), Mesoscale Meteorology and Forecasting. Amer. Meteor.Soc., pp. 289–310.
Doswell III, Ch.A., Burgess, D.W., 1993. Tornadoes and tornadicstorms: A review of conceptual models. Published in: TheTornado: Its Structure, Dynamics, Prediction, and Hazards (1993—C. Church et al., Eds.), Geophysical Monograph 79, Amer.Geophys. Union, 161–172.
Doswell III, Ch.A., Brooks, H.E., Maddox, R.A., 1996. Flash floodforecasting: an ingredients-based methodology. Weather Forecast.11, 560–581.
Fritsch, J.M., Kane, R.J., Chelius, C.R., 1986. The contribution ofmesoscale convective weather systems to the warm-seasonprecipitation in the United States. J. Clim. Appl. Meteorol. 25,1333–1345.
Gray, M.E.B., Marshall, C., 1998. Mesoscale convective systems overthe UK, 1981–97. Weather 53 (11).
Houze, R., 1993. Cloud dynamics. International Geophysic Series, vol.53. Academic Press.
Houze Jr., R.A., Smull, B.F., Dodge, P., 1990. Mesoscale organizationof springtime rainstorms in Oklahoma. Mon. Weather Rev. 118,613–654.
Jansà, A., Genovés, A., Riosalido, R., Carretero, O., 1996. Mesoscalecyclones vs heavy rain and MCS in the Western Mediterranean.MAP Newsl. 5, 24–25.
Laing, A.G., Fritsch, J.M., 1993. Mesoscale convective complexes inAfrica. Mon. Weather Rev. 121, 2254–2263.
Legrand, P., Brugnot, G., Baumont, G., 2003. Rétour d'experience desinondations de septembre de 2002 dans les départaments du Gard,de l'Hérault, du Vaucluse, des Bouches de Rhône, de l'Ardèche etde la Drôme Contribution du Groupe d'Appui et d'expertissescientifique. CD-ROM.
Llasat, M.C., Puigcerver, M., 1994. Meteorological factors associatedwith floods in the north-eastern part of the Iberian Peninsula. Nat.Hazards 9, 81–93.
Llasat, M.C., Ramis, C., Lanza, L., 1999. Storm tracking andmonitoring using objective synoptic diagnosis and clusteridentification from infrared meteosat imagery: a case study.Meteorol. Atmos. Phys. 71, 139–155.
Llasat, M.C., 2001. An objective classification of rainfall events on thebasis of their convective features. Application to rainfall intensityin the North-East of Spain. International Journal of Climatology21, 1385–1400.
Llasat, M.C., Rigo, T., Barriendos, M., 2003. The ‘Montserrat-2000’flash-flood event: a comparison with the floods in the NortheasternIberian Peninsula since the 14th century. Int. J. Climatol. 23,453–469.
Loehrer, S.M., Johnson, R.H., 1995. Surface pressure and precipitationlife cycle characteristics of PRE-STORM mesoscale convectivesystems. Mon. Weather Rev. 123, 600–621.
MacGorman, D.R., Morgenstern, C.D., 1998. Some characteristicsof cloud-to-ground lightning in mesoscale convective systems.J. Geophys. Res. 103D12, 14011–14023.
Maddox, R.A., Chapell, C.H., Hoxit, L.R., 1979. Synoptic and meso-ascale aspects of flashflood events. Bull. Am. Meteorol. Soc. 60 (2),115–123.
Maddox, R.A., Howard, K.W., Bartels, D.L., Rodgers, D.M., 1986.Mesoscale convective complexes in the middle latitudes. In: Ray,P.S. (Ed.), Mesoscale Meteorology and Forecasting. AmericanMeteorological Society, pp. 390–413.
Martín, F., Carretero, O., Castro, P., Riosalido, R. (1998). SistemasConvectivos de Mesoescala 97. Caracterización a partir de lasimágenes de satélite. Technical Note of STAP 28, Spanish WeatherService. May 1998.
Martín, F., Elizaga, F., Carretero, O., San Ambrosio, I., 2001.Diagnóstico y Predicción de la Convección Profunda. TechnicalNote of STAP 35, Spanish Weather Service.
Miller, D., Fritsch, J.M., 1991. Mesoscale convective complexes in theWestern Pacific region. Mon. Weather Rev. 119, 2978–2992.
Parker, M.D., Johnson, R.H., 2000. Organizational modes ofmidlatitude mesoscale convective systems. Mon. Weather Rev.128, 3413–3436.
Purdom, J.F.W., 1999. Use of Satellite Remote Sensing Data forNowcasting and Short Range Forecasting. Proceedins from SAFTraining Workshop: Nowcasting and Very Short Range Forecast-ing. EUTMETSAT. EUM p 25. ISBN 92-9110-030-7, 44-63.
Ramis, C., Alonso, S., Llasat, M.C., 1995. A comparative studybetween two cases of extreme rainfall events in Catalonia. Surv.Geophys. 16, 141–161.
Rigo, T., 2004. Estudio de Sistemas Convectivos Mesoscalares en lazona Mediterránea Occidental Mediante el uso del RadarMeteorológico. Ph. thesis, Universitat de Barcelona.
Rigo, T., Llasat, M.C., 2004. A Methodology for the Classification ofConvective Structures using Meteorological Radar: Application toHeavy Rainfall Events on the Mediterranean Coast of the IberianPeninsula. Natural Hazards and Earth System Sciences, Ed.European Geosciences Union, 4, no. 1, 59–68.
Riosalido, R., 1997. Mesoscale convective systems in western Mediter-ranean area: a satellite view. Proceedings of the Simposio InternacionalINM/OMM sobre Ciclones y Tiempo Adverso en el Mediterráneo,Palma de Mallorca, Spain, 14–17 April 1997, pp. 353–359.
Riosalido, R., Ferraz, J., Alvarez, E., Cansado, A., Martín, F., Elízaga,F., Camacho, J.L., Martín, A., 1997. A flash flood event in theSpanish Pyrenees: the Biescas case. INM/WMO InternationalSymposium on Cyclones and Hazardous Weather in the Mediter-ranean, Palma de Mallorca, April 1997, pp. 151–158.
Riosalido, R., Elizaga, F., Carretero, O., Martín, F., 1998. Climatologíade Sistemas Convectivos de Mesoescala en las proximidades de laPenínsula Ibérica: Aplicaciones a la predicción de lluviastorrenciales. Proyecto CICYT CLI95-1776. Technical Note ofSTAP, 29. Spanish Weather Service. May 1998.
Riosalido, R., Carretero, O., Elizaga, F., Martín, F., 1999. PredicciónInmediata de Sistemas Convectivos de Mesoescala. CampañaExperimental Otoño 1998. Technical Note of STAP, 32. SpanishWeather Service. March 1999.

472 T. Rigo, M.-C. Llasat / Atmospheric Research 83 (2007) 458–472
San Ambrosio, I., Elizaga, F., Martín, F., 2000. Predicción Inmediatade Sistemas Convectivos de Mesoescala. Campaña 1999.Technical Note of STAP, 34. Spanish Weather Service. May 2000.
Sánchez, J.L., Fernández, M., Pastor, F., Estrela, M.J., 2001. Analysisof heavy precipitation in the region of Valencia (Spain) by meansof IR images from the Meteosat. Proceedings of “Symposium onPrecipitation Extremes: Prediction, Impacts and Responses”.Alburquerque, AMS, New Mexico, pp. 166–169.
Sánchez, J.L., Fernández, M.V., Fernández, J.T., Tudurí, E., Ramis, C.,2003. Analysis of mesoscale convective systems with hailprecipitation. Atmos. Res. 67–68, 573–588.
Sánchez-Diezma, R., 2001. Optimización de la medida de lluvia porradar meteorológico para su aplicación hidrológica. Ph. thesis,Universitat Politècnica de Catalunya, Barcelona. 313 pp.
Schiesser, H.H., Houze Jr., R.A., Huntrieser, H., 1995. The mesoscalestructure of severe precipitation systems in Switzerland. Mon.Weather Rev. 123, 2070–2097.
Related Documents