Analysis of Medium Access Control Protocols for Home Networks Aurelio Amodei Junior a Miguel Elias M. Campista a Daniel de Oliveira Cunha a,b Pedro Braconnot Velloso b Lu´ ıs Henrique M. K. Costa a Marcelo Gon¸ calves Rubinstein c,* Otto Carlos M. B. Duarte a a GTA/COPPE/Poli – Universidade Federal do Rio de Janeiro P.O. Box 68504 - 21945-970 - Rio de Janeiro - RJ - Brazil 1 b LIP6/CNRS – Universit´ e Pierre et Marie Curie 8, rue do Capitaine Scott - 75015 - Paris - France c DETEL/FEN – Universidade do Estado do Rio de Janeiro R. S˜ ao Fco. Xavier, 524 - 20550-013 - Rio de Janeiro - RJ - Brazil Abstract Nowadays, there are many different home networking solutions: wired, wireless, and the so called “no new wires”; all competing for their share of the market. The most widely used metric to compare these technologies is the transmission, or line, rate. Nevertheless, this metric does not reflect the peculiarities of each MAC protocol, which limit the bandwidth actually available to users. In this article, we analyze different home networking technologies taking the main features of their MAC pro- tocol into account. We choose the saturation throughput as the basic metric and provide analytical results. Then, through simulations, we vary the number of nodes in the network to see how each protocol deals with contention and analyze their ef- ficiency. The results show that, generally, collision-avoidance protocols have lower efficiency than collision-detection protocols. Nevertheless, there may be exceptions. HomePNA 3.0 has a relatively low efficiency because it uses the same basic rate as HomePNA 2.0, to keep compatibility. The same happens within a protocol family, IEEE 802.11g at 54 Mbps is less efficient than IEEE 802.11b at 11 Mbps. Key words: home networks, medium access control, throughput analysis. * Corresponding author. Email addresses: [email protected] (Aurelio Amodei Junior), [email protected] (Miguel Elias M. Campista), [email protected] (Daniel de Oliveira Cunha), [email protected] (Pedro Braconnot Velloso), [email protected] (Lu´ ıs Henrique M. K. Costa), [email protected] (Marcelo Gonc ¸alves Rubinstein), [email protected] (Otto Carlos M. B. Duarte). 1 Sponsored by CAPES, CNPq, FAPERJ, FINEP, FUNTTEL, and RNP. Preprint submitted to Elsevier Science 10th October 2005

Welcome message from author
This document is posted to help you gain knowledge. Please leave a comment to let me know what you think about it! Share it to your friends and learn new things together.
Transcript
Analysis of Medium Access Control Protocols
for Home Networks
Aurelio Amodei Junior a Miguel Elias M. Campista a
Daniel de Oliveira Cunha a,b Pedro Braconnot Velloso b
Luıs Henrique M. K. Costa a Marcelo Goncalves Rubinstein c,∗
Otto Carlos M. B. Duarte a
aGTA/COPPE/Poli – Universidade Federal do Rio de JaneiroP.O. Box 68504 - 21945-970 - Rio de Janeiro - RJ - Brazil 1
bLIP6/CNRS – Universite Pierre et Marie Curie8, rue do Capitaine Scott - 75015 - Paris - France
cDETEL/FEN – Universidade do Estado do Rio de JaneiroR. Sao Fco. Xavier, 524 - 20550-013 - Rio de Janeiro - RJ - Brazil
Abstract
Nowadays, there are many different home networking solutions: wired, wireless, andthe so called “no new wires”; all competing for their share of the market. The mostwidely used metric to compare these technologies is the transmission, or line, rate.Nevertheless, this metric does not reflect the peculiarities of each MAC protocol,which limit the bandwidth actually available to users. In this article, we analyzedifferent home networking technologies taking the main features of their MAC pro-tocol into account. We choose the saturation throughput as the basic metric andprovide analytical results. Then, through simulations, we vary the number of nodesin the network to see how each protocol deals with contention and analyze their ef-ficiency. The results show that, generally, collision-avoidance protocols have lowerefficiency than collision-detection protocols. Nevertheless, there may be exceptions.HomePNA 3.0 has a relatively low efficiency because it uses the same basic rate asHomePNA 2.0, to keep compatibility. The same happens within a protocol family,IEEE 802.11g at 54 Mbps is less efficient than IEEE 802.11b at 11 Mbps.
Key words: home networks, medium access control, throughput analysis.
∗ Corresponding author.Email addresses: [email protected] (Aurelio Amodei Junior),
[email protected] (Miguel Elias M. Campista), [email protected] (Daniel deOliveira Cunha), [email protected] (Pedro Braconnot Velloso),[email protected] (Luıs Henrique M. K. Costa), [email protected] (MarceloGoncalves Rubinstein), [email protected] (Otto Carlos M. B. Duarte).1 Sponsored by CAPES, CNPq, FAPERJ, FINEP, FUNTTEL, and RNP.
Preprint submitted to Elsevier Science 10th October 2005
1 Introduction
Home networks aim to interconnect computers, network devices, and house-hold appliances inside the houses, sharing Internet access and resources. Dif-ferent technologies provide these home networking services. Home networkscan be classified as wired, wireless, and “no new wires” [1]. Wired networksuse special cables, which are not available in most homes. Wireless networksmainly use radio frequency to transmit data and do not use cables. Phone orpower lines already deployed in the house can be used to create no new wiresnetworks. As these networks do not require any new cabling infrastructure,costs may be reduced.
Concerning wired networks, Ethernet is a conventional solution, but mosthomes do not have the infrastructure needed. Additionally, the installationcost of new wires can be high. Fast Ethernet is presently being used wherethe required infrastructure is available, but Gigabit Ethernet may reach thisniche as price goes down.
On the other hand, wireless networks are now a success with different productsand technologies available. Even if the wireless technology is the best whendealing with mobility, there are problems related to performance, coverage,and quality of service guarantee, besides the classic security problem. IEEE802.11 is the most widespread wireless technology. The 802.11 family includesseveral standards, which differ in the physical layer. IEEE 802.11b operatesin the 2.4 GHz band and provides a maximum physical data rate of 11 Mbps.IEEE 802.11a supports physical data rates of up to 54 Mbps in the 5 GHzband. The most recent specification is IEEE 802.11g, which can reach up to54 Mbps in the 2.4 GHz band.
In the last few years, the no new wires technologies received special attentiondue to their ubiquity and low cost infrastructure. Thus, there is a great effort,especially from the industry, to standardize home phoneline networks andhome powerline networks.
The Home Phoneline Network Alliance (HomePNA) defined a standard fordata transmission over home phonelines [2]. The HomePNA 2.0 standard sup-ports physical data rates of up to 32 Mbps. Based on the second version, anew one called HomePNA 3.0 was specified. HomePNA 3.0 can use two kindsof Medium Access Control (MAC) protocols: an asynchronous (AMAC) anda synchronous (SMAC). HomePNA 3.0 can reach up to 128 Mbps, with anoptional extension to 240 Mbps.
The Home Powerline Network Alliance (HomePlug) defined a standard fordata transmission over home powerlines [3]. The HomePlug 1.0 standard sup-ports physical data rates of 14 Mbps. A new standard called HomePlug AV is
2
also being developed.
Home network applications range from the distribution of information (audio,video, and data) to the sharing of an Internet link. The main quality of servicemetric for many applications is the bandwidth. As a consequence, the market-ing of a technology is frequently based on its transmission rate at the physicallayer. Nevertheless, the physical layer rate may not be the most appropri-ate parameter to be taken into account since the link layer often limits themaximum throughput achievable. Considering shared medium technologies,different MAC protocols have different network efficiencies. Therefore, we aimto analyze the maximum throughput provided by the MAC sub-layer of differ-ent home network technologies that have in common the use of a contentionprotocol over a shared medium.
Several researchers investigate the performance of MAC sub-layer protocolsfor home networks.
The saturation throughput of the Ethernet was analyzed by several researchers.For instance, Wang and Keshav [4] present performance results through sim-ulation while Boggs et al. [5] perform measurements on an Ethernet network.
Chung et al. [6] and Kangude et al. [7] present mathematical analyses of thesaturation throughput of HomePNA 2.0. Kim et al. [8] performs a similaranalysis for the HomePNA 3.0 AMAC.
Jun et al. [9], Xiao et al. [10], Anastasi et al. [11], and Wijesinha et al. [12] an-alyze the theoretical saturation throughput of IEEE 802.11, 802.11b, 802.11a,and 802.11g. Doufexi et al. [13] present a throughput performance evaluationfor 802.11a and 802.11g through simulation in different conditions of radiowavepropagation. The results are specific to the scenario, which includes an accesspoint and other few nodes. Wijesinha et al. [12] present experimental resultson a network of four nodes.
Lin et al. [1] and Jung et al. [14] present the theoretical saturation throughputof HomePlug 1.0. Lee et al. [15] analyze the throughput for HomePlug 1.0through simulation on a network of only three nodes. Experimental resultsare presented by [1] and [15], but they only consider networks of a few nodes.
To the best of our knowledge, there is no work that makes a throughoutcomparison of the medium access control techniques used by the differenthome network technologies. Thus, the main objective of this paper is to analyzethe peculiarities of the different techniques. We use mathematical analysis toevaluate the one-node maximum throughput of Ethernet, HomePNA 2.0 and3.0 AMAC, IEEE 802.11b and g, and HomePlug 1.0. We verify our analysesby simulation. Then, we also evaluate the saturation throughput on scenarioswith higher number of nodes.
3
The results show that, as expected, most collision-avoidance protocols havelower efficiency than the collision-detection protocols. Nevertheless, there maybe exceptions, due to compatibility issues, which may force a part of the bitsto be transmitted using a basic rate lower than the line transmission rate.
This paper is organized as follows. Section 2 describes the basic operation ofthe home network protocols. Section 3 presents mathematical analyses for thehome network protocols. Section 4 reports simulation results. Finally, conclud-ing remarks and future directions are presented in Section 5.
2 Home Network Protocols
In the following subsections, we give a brief overview of the MAC sub-layer andsome physical layer characteristics of Ethernet, HomePNA, IEEE 802.11, andHomePlug. Detailed information can be found in [16,17,18,19,2,20,21,22,3].
2.1 The Ethernet Protocol
The Ethernet network uses Carrier Sense Multiple Access with Collision De-tection (CSMA/CD) to control medium access. A station willing to transmitfirst senses the medium. If the medium is idle, after an inter-frame gap the sta-tion transmits the frame. If the medium is busy, the station continues to listento the medium until it is idle and then, after an inter-frame gap, starts theframe transmission. During the transmission, the station senses the mediumto detect collisions. If there is no collision, the frame is considered transmit-ted. If a collision is detected, the station stops the transmission and sends ajam signal. After the jam transmission, the station enters a binary exponen-tial backoff phase. In this phase, after the nth collision, the station waits fora random number of slot times, ranging from 0 to 2n−1, and then senses themedium again.
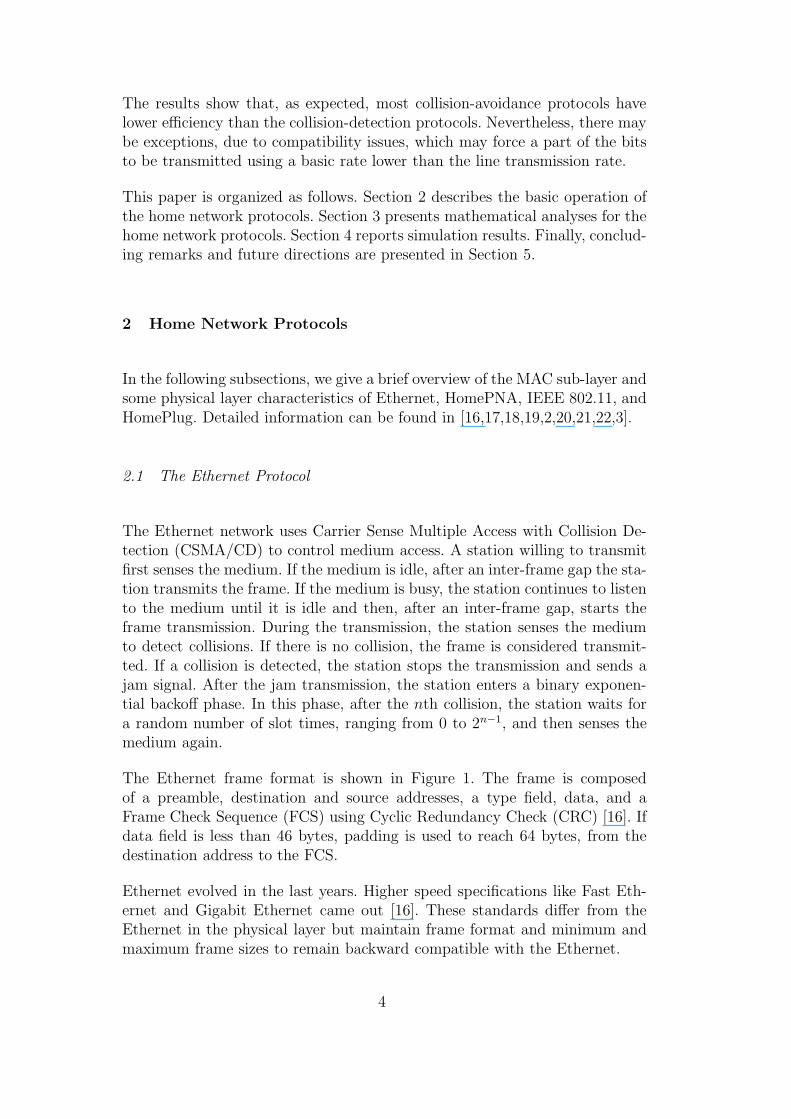
The Ethernet frame format is shown in Figure 1. The frame is composedof a preamble, destination and source addresses, a type field, data, and aFrame Check Sequence (FCS) using Cyclic Redundancy Check (CRC) [16]. Ifdata field is less than 46 bytes, padding is used to reach 64 bytes, from thedestination address to the FCS.
Ethernet evolved in the last years. Higher speed specifications like Fast Eth-ernet and Gigabit Ethernet came out [16]. These standards differ from theEthernet in the physical layer but maintain frame format and minimum andmaximum frame sizes to remain backward compatible with the Ethernet.
4
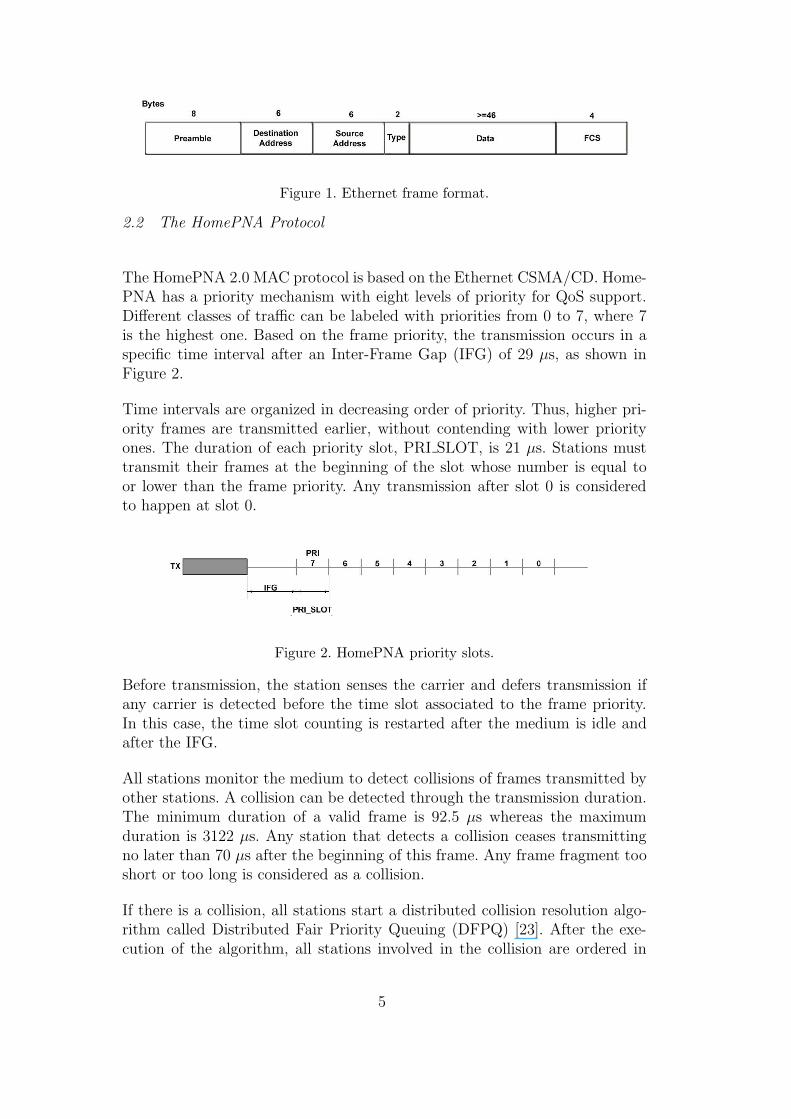
Figure 1. Ethernet frame format.
2.2 The HomePNA Protocol
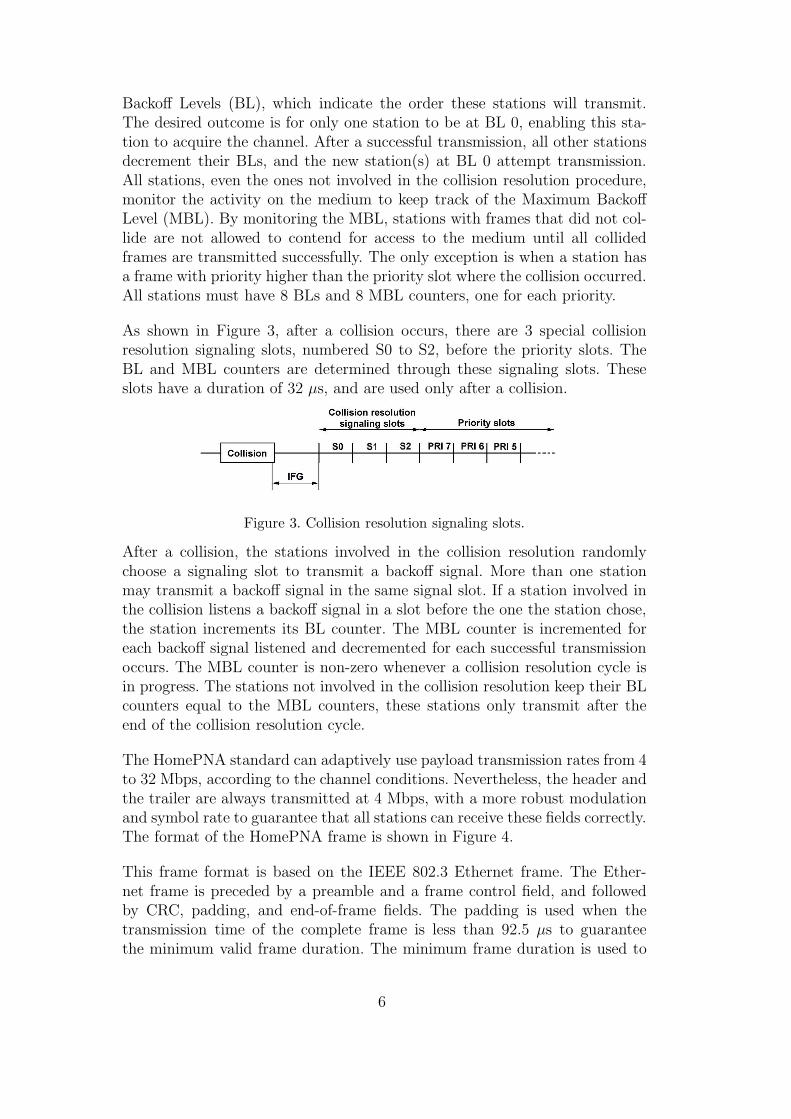
The HomePNA 2.0 MAC protocol is based on the Ethernet CSMA/CD. Home-PNA has a priority mechanism with eight levels of priority for QoS support.Different classes of traffic can be labeled with priorities from 0 to 7, where 7is the highest one. Based on the frame priority, the transmission occurs in aspecific time interval after an Inter-Frame Gap (IFG) of 29 µs, as shown inFigure 2.
Time intervals are organized in decreasing order of priority. Thus, higher pri-ority frames are transmitted earlier, without contending with lower priorityones. The duration of each priority slot, PRI SLOT, is 21 µs. Stations musttransmit their frames at the beginning of the slot whose number is equal toor lower than the frame priority. Any transmission after slot 0 is consideredto happen at slot 0.
Figure 2. HomePNA priority slots.
Before transmission, the station senses the carrier and defers transmission ifany carrier is detected before the time slot associated to the frame priority.In this case, the time slot counting is restarted after the medium is idle andafter the IFG.
All stations monitor the medium to detect collisions of frames transmitted byother stations. A collision can be detected through the transmission duration.The minimum duration of a valid frame is 92.5 µs whereas the maximumduration is 3122 µs. Any station that detects a collision ceases transmittingno later than 70 µs after the beginning of this frame. Any frame fragment tooshort or too long is considered as a collision.
If there is a collision, all stations start a distributed collision resolution algo-rithm called Distributed Fair Priority Queuing (DFPQ) [23]. After the exe-cution of the algorithm, all stations involved in the collision are ordered in
5
Backoff Levels (BL), which indicate the order these stations will transmit.The desired outcome is for only one station to be at BL 0, enabling this sta-tion to acquire the channel. After a successful transmission, all other stationsdecrement their BLs, and the new station(s) at BL 0 attempt transmission.All stations, even the ones not involved in the collision resolution procedure,monitor the activity on the medium to keep track of the Maximum BackoffLevel (MBL). By monitoring the MBL, stations with frames that did not col-lide are not allowed to contend for access to the medium until all collidedframes are transmitted successfully. The only exception is when a station hasa frame with priority higher than the priority slot where the collision occurred.All stations must have 8 BLs and 8 MBL counters, one for each priority.
As shown in Figure 3, after a collision occurs, there are 3 special collisionresolution signaling slots, numbered S0 to S2, before the priority slots. TheBL and MBL counters are determined through these signaling slots. Theseslots have a duration of 32 µs, and are used only after a collision.
Figure 3. Collision resolution signaling slots.
After a collision, the stations involved in the collision resolution randomlychoose a signaling slot to transmit a backoff signal. More than one stationmay transmit a backoff signal in the same signal slot. If a station involved inthe collision listens a backoff signal in a slot before the one the station chose,the station increments its BL counter. The MBL counter is incremented foreach backoff signal listened and decremented for each successful transmissionoccurs. The MBL counter is non-zero whenever a collision resolution cycle isin progress. The stations not involved in the collision resolution keep their BLcounters equal to the MBL counters, these stations only transmit after theend of the collision resolution cycle.
The HomePNA standard can adaptively use payload transmission rates from 4to 32 Mbps, according to the channel conditions. Nevertheless, the header andthe trailer are always transmitted at 4 Mbps, with a more robust modulationand symbol rate to guarantee that all stations can receive these fields correctly.The format of the HomePNA frame is shown in Figure 4.
This frame format is based on the IEEE 802.3 Ethernet frame. The Ether-net frame is preceded by a preamble and a frame control field, and followedby CRC, padding, and end-of-frame fields. The padding is used when thetransmission time of the complete frame is less than 92.5 µs to guaranteethe minimum valid frame duration. The minimum frame duration is used to
6
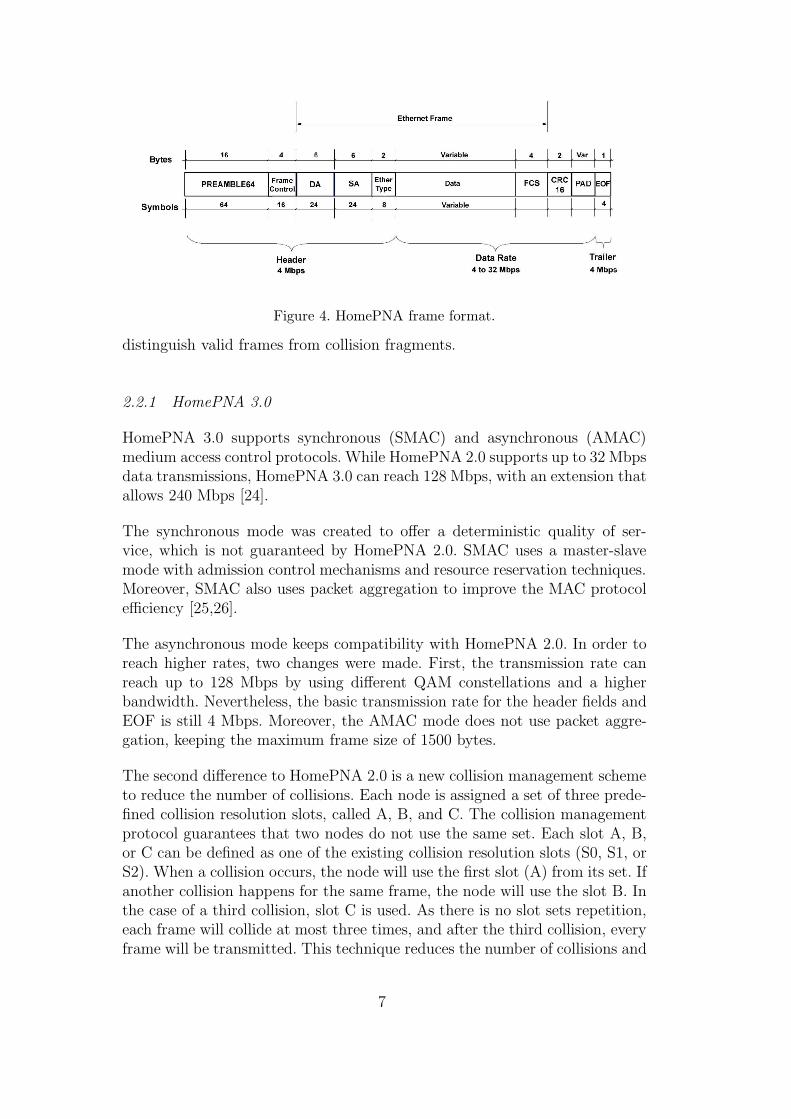
Figure 4. HomePNA frame format.
distinguish valid frames from collision fragments.
2.2.1 HomePNA 3.0
HomePNA 3.0 supports synchronous (SMAC) and asynchronous (AMAC)medium access control protocols. While HomePNA 2.0 supports up to 32 Mbpsdata transmissions, HomePNA 3.0 can reach 128 Mbps, with an extension thatallows 240 Mbps [24].
The synchronous mode was created to offer a deterministic quality of ser-vice, which is not guaranteed by HomePNA 2.0. SMAC uses a master-slavemode with admission control mechanisms and resource reservation techniques.Moreover, SMAC also uses packet aggregation to improve the MAC protocolefficiency [25,26].
The asynchronous mode keeps compatibility with HomePNA 2.0. In order toreach higher rates, two changes were made. First, the transmission rate canreach up to 128 Mbps by using different QAM constellations and a higherbandwidth. Nevertheless, the basic transmission rate for the header fields andEOF is still 4 Mbps. Moreover, the AMAC mode does not use packet aggre-gation, keeping the maximum frame size of 1500 bytes.
The second difference to HomePNA 2.0 is a new collision management schemeto reduce the number of collisions. Each node is assigned a set of three prede-fined collision resolution slots, called A, B, and C. The collision managementprotocol guarantees that two nodes do not use the same set. Each slot A, B,or C can be defined as one of the existing collision resolution slots (S0, S1, orS2). When a collision occurs, the node will use the first slot (A) from its set. Ifanother collision happens for the same frame, the node will use the slot B. Inthe case of a third collision, slot C is used. As there is no slot sets repetition,each frame will collide at most three times, and after the third collision, everyframe will be transmitted. This technique reduces the number of collisions and
7
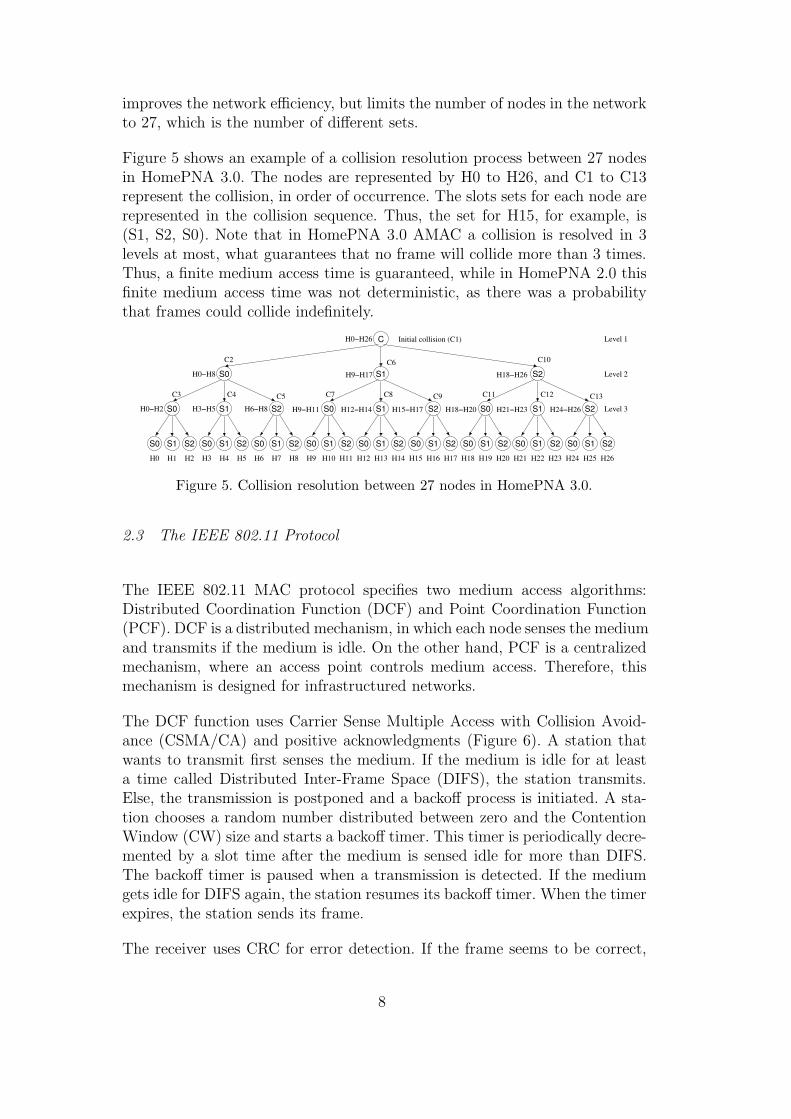
improves the network efficiency, but limits the number of nodes in the networkto 27, which is the number of different sets.
Figure 5 shows an example of a collision resolution process between 27 nodesin HomePNA 3.0. The nodes are represented by H0 to H26, and C1 to C13represent the collision, in order of occurrence. The slots sets for each node arerepresented in the collision sequence. Thus, the set for H15, for example, is(S1, S2, S0). Note that in HomePNA 3.0 AMAC a collision is resolved in 3levels at most, what guarantees that no frame will collide more than 3 times.Thus, a finite medium access time is guaranteed, while in HomePNA 2.0 thisfinite medium access time was not deterministic, as there was a probabilitythat frames could collide indefinitely.
S2
H5
S0
H3
S1
H4
S0
H6
S2
H8
S1 S0
H9
S2
H11
S1 S2
H14
S1
H13
S0 S0
H15
S2
H17
S1 S0
H21
S1
H22
S0
H24
S2
H26
S1
H25
S2
H23
S0
H18
S2
H20
S1
H19
S0
H0
S2
H2
S1
S0 S0S2 S1 S2 S1 S2S0S1
S0 S2S1
C Level 1
Level 2
Level 3H6−H8H0−H2 H3−H5
H7 H10 H12 H16H1
H0−H26
C7 C8
C6
C4
C2
C3 C12
C10
H0−H8
C5 C9 C13C11
Initial collision (C1)
H9−H11 H12−H14 H15−H17 H18−H20 H21−H23 H24−H26
H18−H26H9−H17
Figure 5. Collision resolution between 27 nodes in HomePNA 3.0.
2.3 The IEEE 802.11 Protocol
The IEEE 802.11 MAC protocol specifies two medium access algorithms:Distributed Coordination Function (DCF) and Point Coordination Function(PCF). DCF is a distributed mechanism, in which each node senses the mediumand transmits if the medium is idle. On the other hand, PCF is a centralizedmechanism, where an access point controls medium access. Therefore, thismechanism is designed for infrastructured networks.
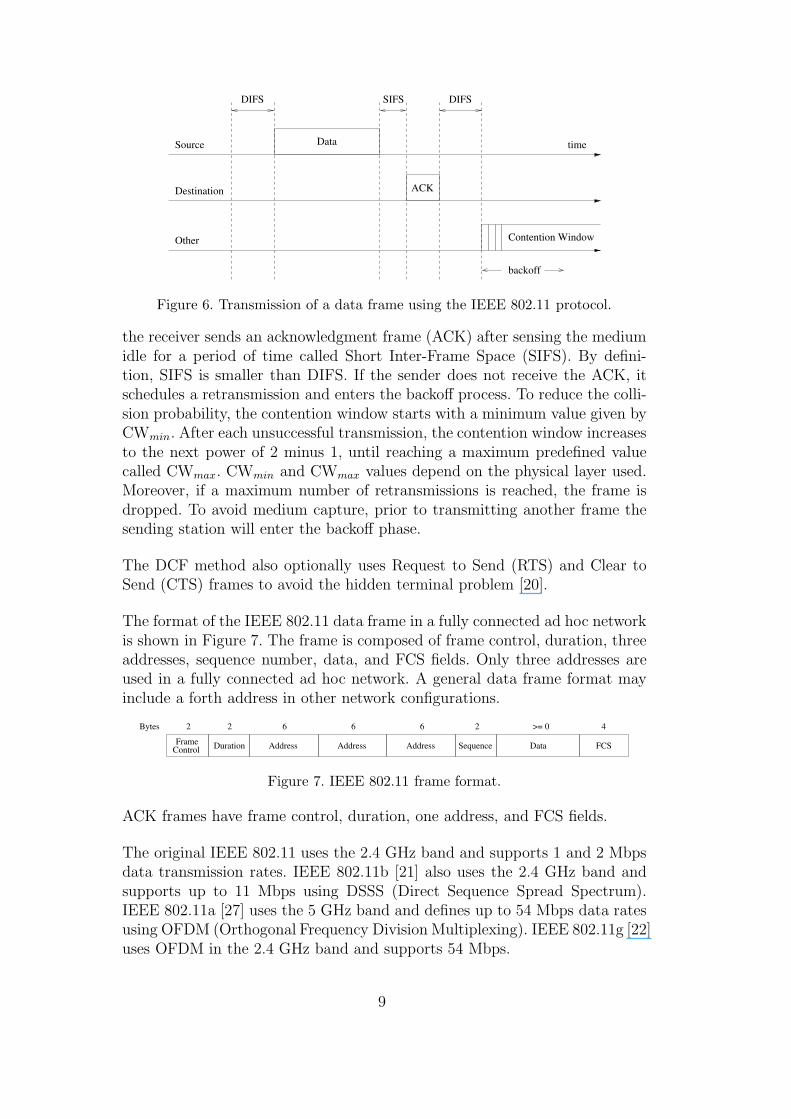
The DCF function uses Carrier Sense Multiple Access with Collision Avoid-ance (CSMA/CA) and positive acknowledgments (Figure 6). A station thatwants to transmit first senses the medium. If the medium is idle for at leasta time called Distributed Inter-Frame Space (DIFS), the station transmits.Else, the transmission is postponed and a backoff process is initiated. A sta-tion chooses a random number distributed between zero and the ContentionWindow (CW) size and starts a backoff timer. This timer is periodically decre-mented by a slot time after the medium is sensed idle for more than DIFS.The backoff timer is paused when a transmission is detected. If the mediumgets idle for DIFS again, the station resumes its backoff timer. When the timerexpires, the station sends its frame.
The receiver uses CRC for error detection. If the frame seems to be correct,
8
Data
ACK
DIFS SIFS DIFS
Source
Destination
Other
time
backoff
Contention Window
Figure 6. Transmission of a data frame using the IEEE 802.11 protocol.
the receiver sends an acknowledgment frame (ACK) after sensing the mediumidle for a period of time called Short Inter-Frame Space (SIFS). By defini-tion, SIFS is smaller than DIFS. If the sender does not receive the ACK, itschedules a retransmission and enters the backoff process. To reduce the colli-sion probability, the contention window starts with a minimum value given byCWmin. After each unsuccessful transmission, the contention window increasesto the next power of 2 minus 1, until reaching a maximum predefined valuecalled CWmax. CWmin and CWmax values depend on the physical layer used.Moreover, if a maximum number of retransmissions is reached, the frame isdropped. To avoid medium capture, prior to transmitting another frame thesending station will enter the backoff phase.
The DCF method also optionally uses Request to Send (RTS) and Clear toSend (CTS) frames to avoid the hidden terminal problem [20].
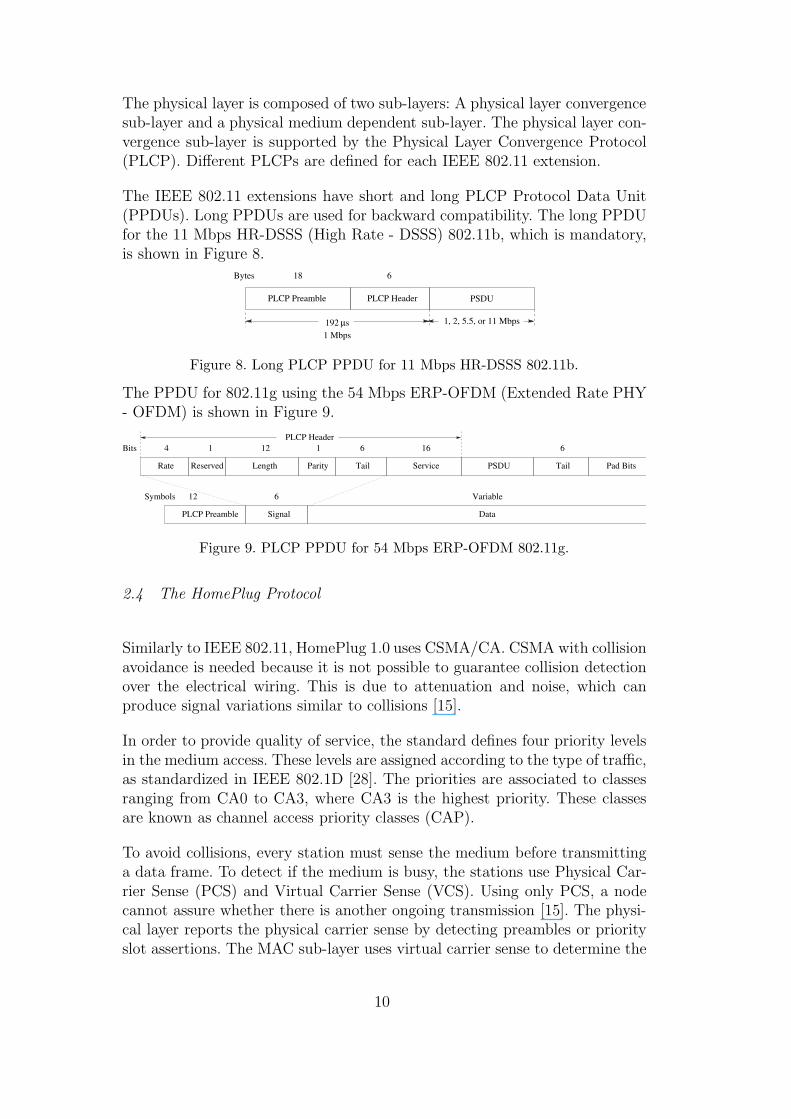
The format of the IEEE 802.11 data frame in a fully connected ad hoc networkis shown in Figure 7. The frame is composed of frame control, duration, threeaddresses, sequence number, data, and FCS fields. Only three addresses areused in a fully connected ad hoc network. A general data frame format mayinclude a forth address in other network configurations.
FrameControl
Bytes 2 2
Duration Sequence
2
FCSData
>= 0 4
Address
6
Address
6
Address
6
Figure 7. IEEE 802.11 frame format.
ACK frames have frame control, duration, one address, and FCS fields.
The original IEEE 802.11 uses the 2.4 GHz band and supports 1 and 2 Mbpsdata transmission rates. IEEE 802.11b [21] also uses the 2.4 GHz band andsupports up to 11 Mbps using DSSS (Direct Sequence Spread Spectrum).IEEE 802.11a [27] uses the 5 GHz band and defines up to 54 Mbps data ratesusing OFDM (Orthogonal Frequency Division Multiplexing). IEEE 802.11g [22]uses OFDM in the 2.4 GHz band and supports 54 Mbps.
9
The physical layer is composed of two sub-layers: A physical layer convergencesub-layer and a physical medium dependent sub-layer. The physical layer con-vergence sub-layer is supported by the Physical Layer Convergence Protocol(PLCP). Different PLCPs are defined for each IEEE 802.11 extension.
The IEEE 802.11 extensions have short and long PLCP Protocol Data Unit(PPDUs). Long PPDUs are used for backward compatibility. The long PPDUfor the 11 Mbps HR-DSSS (High Rate - DSSS) 802.11b, which is mandatory,is shown in Figure 8.
PSDU
192 sµ1 Mbps
1, 2, 5.5, or 11 Mbps
18 6
PLCP Preamble PLCP Header
Bytes
Figure 8. Long PLCP PPDU for 11 Mbps HR-DSSS 802.11b.
The PPDU for 802.11g using the 54 Mbps ERP-OFDM (Extended Rate PHY- OFDM) is shown in Figure 9.
Signal
6
4Bits
Symbols 12
PLCP Preamble
Rate Length
1 12
Parity
1
Tail
6
Service
16PLCP Header
PSDU Tail Pad Bits
6
Reserved
Data
Variable
Figure 9. PLCP PPDU for 54 Mbps ERP-OFDM 802.11g.
2.4 The HomePlug Protocol
Similarly to IEEE 802.11, HomePlug 1.0 uses CSMA/CA. CSMA with collisionavoidance is needed because it is not possible to guarantee collision detectionover the electrical wiring. This is due to attenuation and noise, which canproduce signal variations similar to collisions [15].
In order to provide quality of service, the standard defines four priority levelsin the medium access. These levels are assigned according to the type of traffic,as standardized in IEEE 802.1D [28]. The priorities are associated to classesranging from CA0 to CA3, where CA3 is the highest priority. These classesare known as channel access priority classes (CAP).
To avoid collisions, every station must sense the medium before transmittinga data frame. To detect if the medium is busy, the stations use Physical Car-rier Sense (PCS) and Virtual Carrier Sense (VCS). Using only PCS, a nodecannot assure whether there is another ongoing transmission [15]. The physi-cal layer reports the physical carrier sense by detecting preambles or priorityslot assertions. The MAC sub-layer uses virtual carrier sense to determine the
10
transmission duration of the frame “listened” in order to establish an alloca-tion vector. Stations only contend for the medium after the expiration of theirallocation vectors.
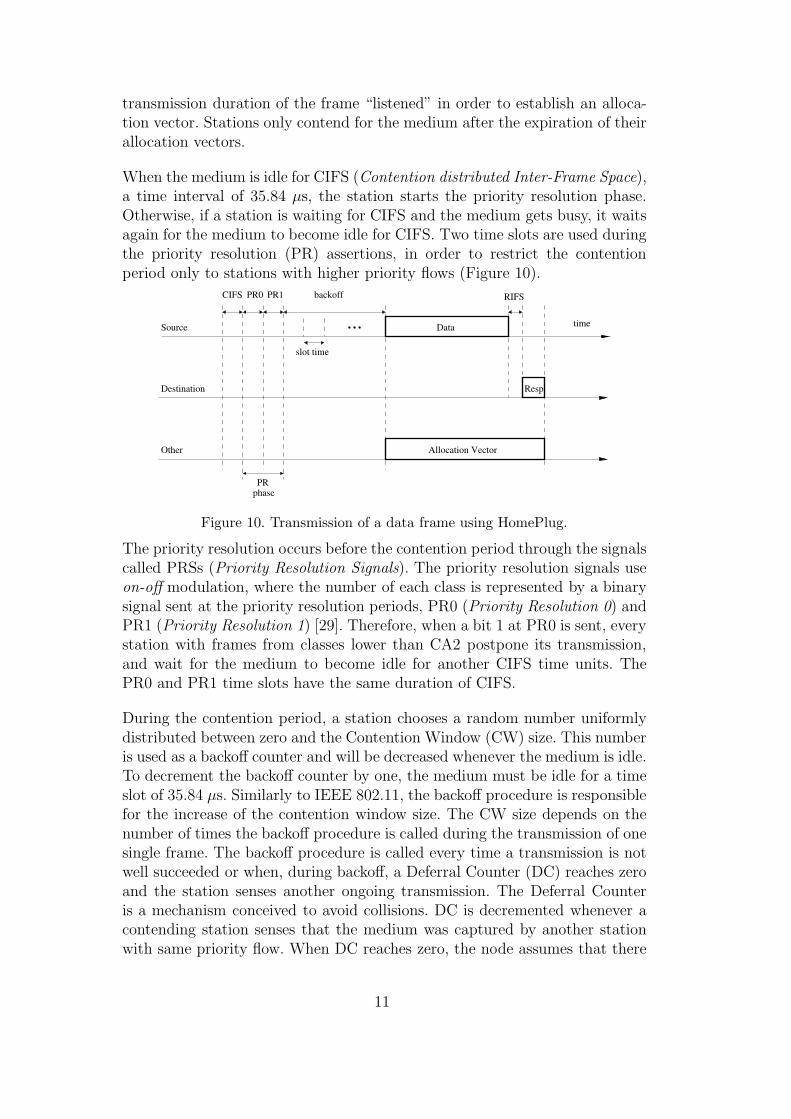
When the medium is idle for CIFS (Contention distributed Inter-Frame Space),a time interval of 35.84 µs, the station starts the priority resolution phase.Otherwise, if a station is waiting for CIFS and the medium gets busy, it waitsagain for the medium to become idle for CIFS. Two time slots are used duringthe priority resolution (PR) assertions, in order to restrict the contentionperiod only to stations with higher priority flows (Figure 10).
...PR1
slot time
RIFS
PRphase
backoff
timeSource
Destination
Other
Data
Resp.
CIFS PR0
Allocation Vector
Figure 10. Transmission of a data frame using HomePlug.
The priority resolution occurs before the contention period through the signalscalled PRSs (Priority Resolution Signals). The priority resolution signals useon-off modulation, where the number of each class is represented by a binarysignal sent at the priority resolution periods, PR0 (Priority Resolution 0) andPR1 (Priority Resolution 1) [29]. Therefore, when a bit 1 at PR0 is sent, everystation with frames from classes lower than CA2 postpone its transmission,and wait for the medium to become idle for another CIFS time units. ThePR0 and PR1 time slots have the same duration of CIFS.
During the contention period, a station chooses a random number uniformlydistributed between zero and the Contention Window (CW) size. This numberis used as a backoff counter and will be decreased whenever the medium is idle.To decrement the backoff counter by one, the medium must be idle for a timeslot of 35.84 µs. Similarly to IEEE 802.11, the backoff procedure is responsiblefor the increase of the contention window size. The CW size depends on thenumber of times the backoff procedure is called during the transmission of onesingle frame. The backoff procedure is called every time a transmission is notwell succeeded or when, during backoff, a Deferral Counter (DC) reaches zeroand the station senses another ongoing transmission. The Deferral Counteris a mechanism conceived to avoid collisions. DC is decremented whenever acontending station senses that the medium was captured by another stationwith same priority flow. When DC reaches zero, the node assumes that there
11
is a considerable number of stations trying to transmit, which increases thecollision probability. Thus, a station must call the backoff procedure when itsenses that the medium was captured again.
Upon the reception of a frame, the receiver verifies whether the transmitterwants a response. If it does, the receiver waits for RIFS (Response Inter-Frame
Space) before sending a response. The response can be an ACK (Acknowledg-
ment), when a well-succeeded reception occurs; a NACK (Negative Acknowl-
edgment), when an error was detected but could not be corrected; or a FAIL,if a frame could not be stored due to lack of space in the buffer.
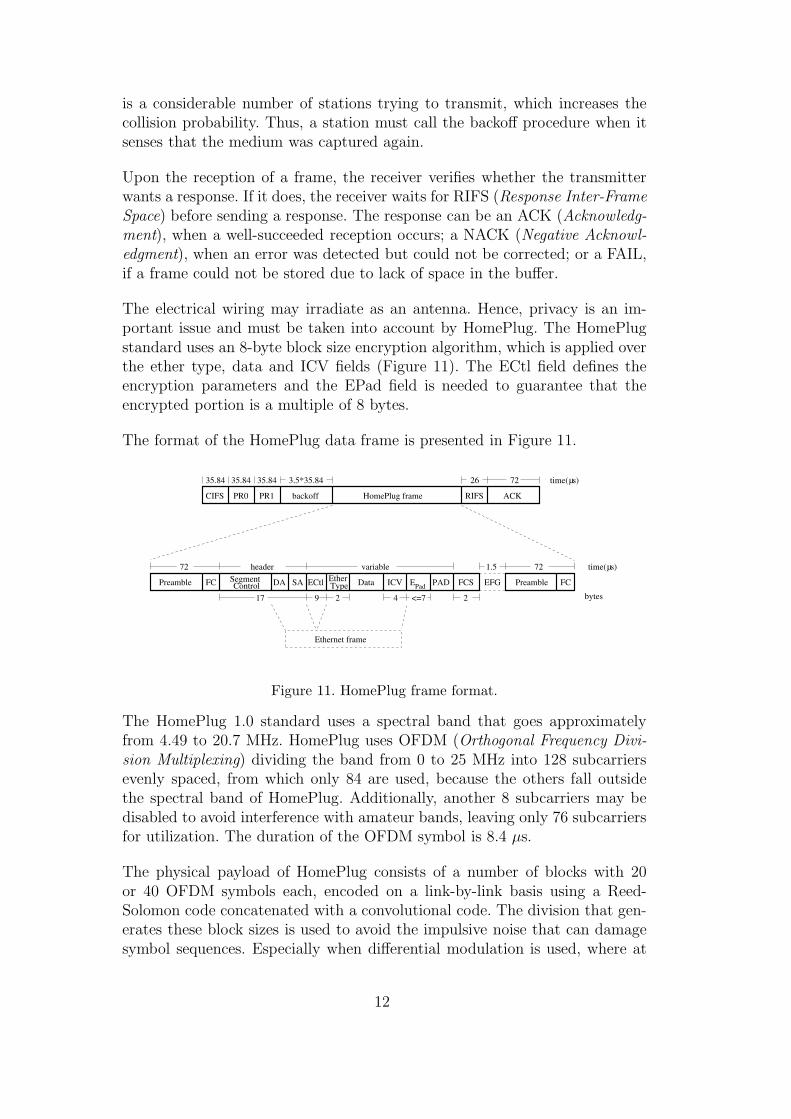
The electrical wiring may irradiate as an antenna. Hence, privacy is an im-portant issue and must be taken into account by HomePlug. The HomePlugstandard uses an 8-byte block size encryption algorithm, which is applied overthe ether type, data and ICV fields (Figure 11). The ECtl field defines theencryption parameters and the EPad field is needed to guarantee that theencrypted portion is a multiple of 8 bytes.
The format of the HomePlug data frame is presented in Figure 11.
FCPAD FCS
PR0 RIFSCIFS backoff
72
PR1
EFGFC SA
bytes
ECtl
9
ACK
1.5
HomePlug frame
3.5*35.84 2635.84 35.84 35.84 µ
variable
Ethernet frame
µ
2
ICV
4
time( s)
time( s)
header 7272
<=7217
DA EPadPreamble SegmentControl
EtherType Data Preamble
Figure 11. HomePlug frame format.
The HomePlug 1.0 standard uses a spectral band that goes approximatelyfrom 4.49 to 20.7 MHz. HomePlug uses OFDM (Orthogonal Frequency Divi-
sion Multiplexing) dividing the band from 0 to 25 MHz into 128 subcarriersevenly spaced, from which only 84 are used, because the others fall outsidethe spectral band of HomePlug. Additionally, another 8 subcarriers may bedisabled to avoid interference with amateur bands, leaving only 76 subcarriersfor utilization. The duration of the OFDM symbol is 8.4 µs.
The physical payload of HomePlug consists of a number of blocks with 20or 40 OFDM symbols each, encoded on a link-by-link basis using a Reed-Solomon code concatenated with a convolutional code. The division that gen-erates these block sizes is used to avoid the impulsive noise that can damagesymbol sequences. Especially when differential modulation is used, where at
12
least 2 symbols are lost at a time, the damage can be more severe. The con-volutional encoder has constraint length 7 and code rates of 1
2or 3
4, selected
during the channel adaptation. The Reed-Solomon code, which is used afterthe convolutional code, has coding rates ranging from 23
39to 238
254.
Taking the transmission parameters described above into account, the phys-ical layer can offer up to 139 different rate combinations, ranging from 1 to14 Mbps.
Besides the mentioned transmission modes, there is a special mode calledROBO (ROBust OFDM). This mode has greater redundancy to operate un-der noisy situations. The ROBO mode uses a DBPSK (Differential Binary
Phase Shift Keying) modulation, with a redundancy level that reduces thesymbol rate to 1
4bit/symbol/subcarrier. It also uses a Reed-Solomon code
with different code rates that ranges from 3139
to 4351
. These parameters reducethe maximum transmission rate to 0.9 Mbps.
3 Mathematical Analysis
Home network applications, like video, demand high transmission rates, butphysical layer rate is not the most appropriate parameter when analyzing net-work suitability for these applications. The efficiency provided by the MACprotocols must be used for these analyses. This section provides the math-ematical analysis of the maximum throughput that can be obtained usingthe four different home network technologies considered in this article. In theanalysis, the following assumptions were made:
• A single active session (i.e., a sender-receiver couple active) is used.• Bit error rate is zero.• Propagation delay is not considered.• Sending node always has a frame ready to be sent.• The MAC sub-layer does not use fragmentation.• Management frames are not taken into account.
In the rest of the analysis, we use the notations given in Table 1.
The throughput (Th) is calculated by dividing the size of the MAC SDU byits transmission time (T ). Depending on the size of the MAC SDU, padding
13
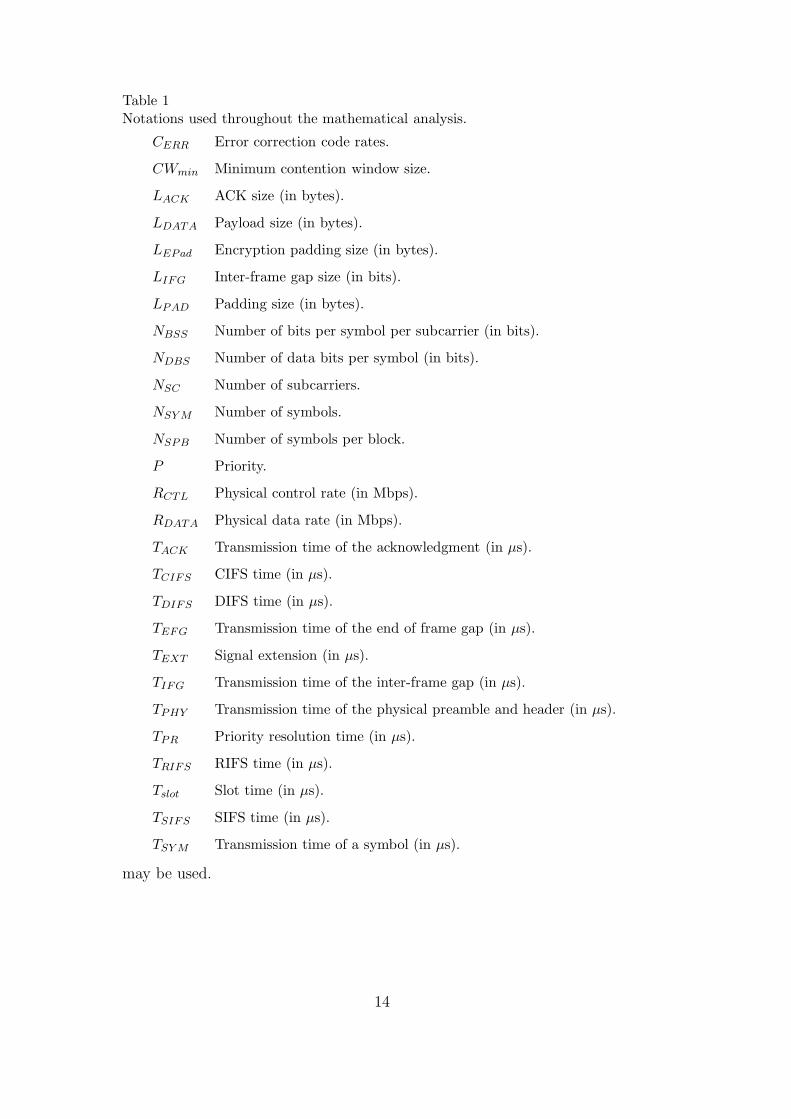
Table 1Notations used throughout the mathematical analysis.
CERR Error correction code rates.
CWmin Minimum contention window size.
LACK ACK size (in bytes).
LDATA Payload size (in bytes).
LEPad Encryption padding size (in bytes).
LIFG Inter-frame gap size (in bits).
LPAD Padding size (in bytes).
NBSS Number of bits per symbol per subcarrier (in bits).
NDBS Number of data bits per symbol (in bits).
NSC Number of subcarriers.
NSY M Number of symbols.
NSPB Number of symbols per block.
P Priority.
RCTL Physical control rate (in Mbps).
RDATA Physical data rate (in Mbps).
TACK Transmission time of the acknowledgment (in µs).
TCIFS CIFS time (in µs).
TDIFS DIFS time (in µs).
TEFG Transmission time of the end of frame gap (in µs).
TEXT Signal extension (in µs).
TIFG Transmission time of the inter-frame gap (in µs).
TPHY Transmission time of the physical preamble and header (in µs).
TPR Priority resolution time (in µs).
TRIFS RIFS time (in µs).
Tslot Slot time (in µs).
TSIFS SIFS time (in µs).
TSY M Transmission time of a symbol (in µs).
may be used.
14
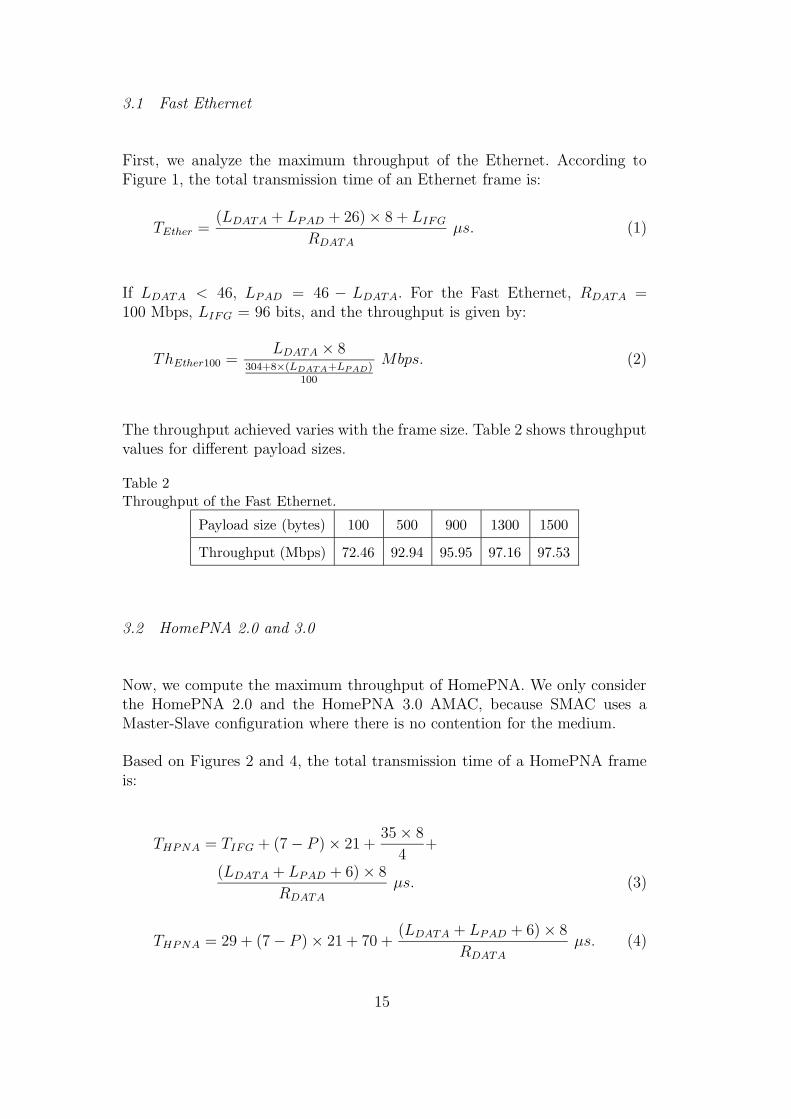
3.1 Fast Ethernet
First, we analyze the maximum throughput of the Ethernet. According toFigure 1, the total transmission time of an Ethernet frame is:
TEther =(LDATA + LPAD + 26) × 8 + LIFG
RDATA
µs. (1)
If LDATA < 46, LPAD = 46 − LDATA. For the Fast Ethernet, RDATA =100 Mbps, LIFG = 96 bits, and the throughput is given by:
ThEther100 =LDATA × 8
304+8×(LDATA+LPAD)100
Mbps. (2)
The throughput achieved varies with the frame size. Table 2 shows throughputvalues for different payload sizes.
Table 2Throughput of the Fast Ethernet.
Payload size (bytes) 100 500 900 1300 1500
Throughput (Mbps) 72.46 92.94 95.95 97.16 97.53
3.2 HomePNA 2.0 and 3.0
Now, we compute the maximum throughput of HomePNA. We only considerthe HomePNA 2.0 and the HomePNA 3.0 AMAC, because SMAC uses aMaster-Slave configuration where there is no contention for the medium.
Based on Figures 2 and 4, the total transmission time of a HomePNA frameis:
THPNA = TIFG + (7 − P ) × 21 +35 × 8
4+
(LDATA + LPAD + 6) × 8
RDATA
µs. (3)
THPNA = 29 + (7 − P ) × 21 + 70 +(LDATA + LPAD + 6) × 8
RDATA
µs. (4)
15
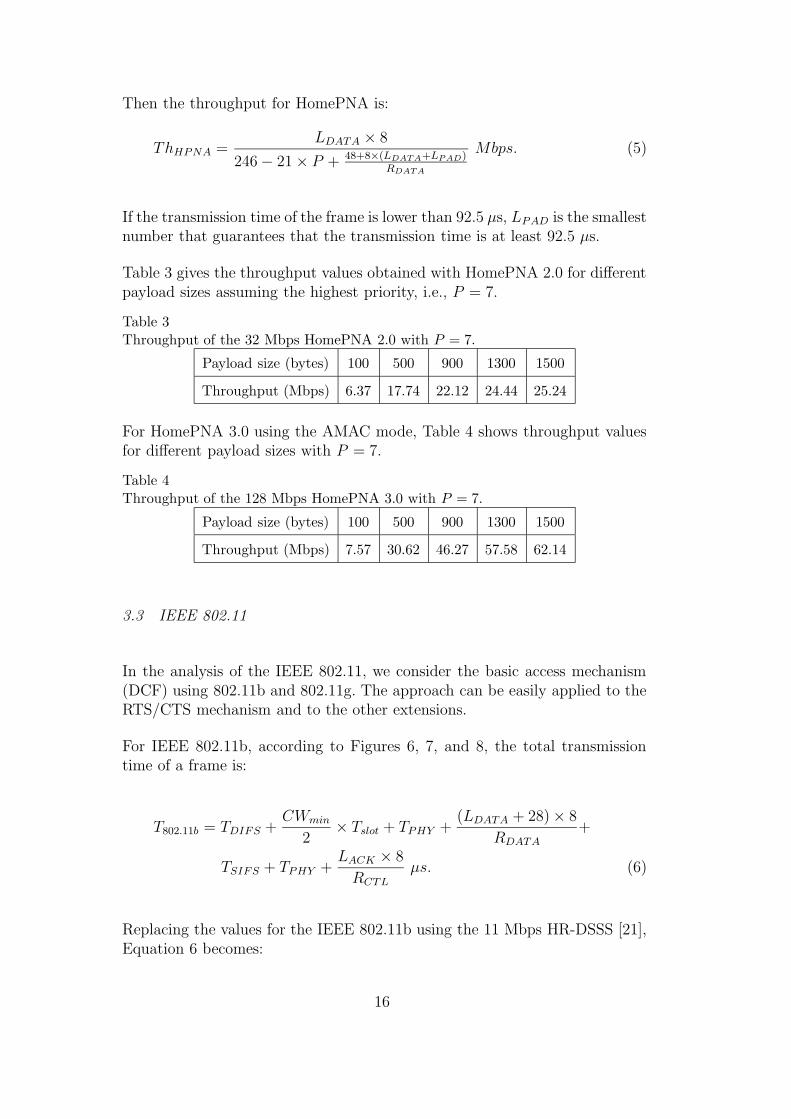
Then the throughput for HomePNA is:
ThHPNA =LDATA × 8
246 − 21 × P + 48+8×(LDATA+LPAD)RDATA
Mbps. (5)
If the transmission time of the frame is lower than 92.5 µs, LPAD is the smallestnumber that guarantees that the transmission time is at least 92.5 µs.
Table 3 gives the throughput values obtained with HomePNA 2.0 for differentpayload sizes assuming the highest priority, i.e., P = 7.
Table 3Throughput of the 32 Mbps HomePNA 2.0 with P = 7.
Payload size (bytes) 100 500 900 1300 1500
Throughput (Mbps) 6.37 17.74 22.12 24.44 25.24
For HomePNA 3.0 using the AMAC mode, Table 4 shows throughput valuesfor different payload sizes with P = 7.
Table 4Throughput of the 128 Mbps HomePNA 3.0 with P = 7.
Payload size (bytes) 100 500 900 1300 1500
Throughput (Mbps) 7.57 30.62 46.27 57.58 62.14
3.3 IEEE 802.11
In the analysis of the IEEE 802.11, we consider the basic access mechanism(DCF) using 802.11b and 802.11g. The approach can be easily applied to theRTS/CTS mechanism and to the other extensions.
For IEEE 802.11b, according to Figures 6, 7, and 8, the total transmissiontime of a frame is:
T802.11b = TDIFS +CWmin
2× Tslot + TPHY +
(LDATA + 28) × 8
RDATA
+
TSIFS + TPHY +LACK × 8
RCTL
µs. (6)
Replacing the values for the IEEE 802.11b using the 11 Mbps HR-DSSS [21],Equation 6 becomes:
16
T802.11b = 50 + (31
2× 20) + 192 +
(LDATA + 28) × 8
11+ 10 + 192+
14 × 8
1µs. (7)
Then the throughput for IEEE 802.11b is:
Th802.11b =LDATA × 8
866 + 224+8×LDATA
11
Mbps. (8)
Table 5 shows throughput values for different payload sizes.
Table 5Throughput of the 11 Mbps HR-DSSS 802.11b.
Payload size (bytes) 100 500 900 1300 1500
Throughput (Mbps) 0.83 3.20 4.67 5.68 6.07
For the ERP-OFDM 802.11g, according to Figures 6, 7 and 9, and using aceiling function to handle the padding bits, the total frame transmission timeis:
T802.11g = TDIFS +CWmin
2× Tslot + TPHY + NSY M × TSY M + TEXT +
TSIFS + TPHY +⌈
16 + 8 × LACK + 6
NDBS
⌉
× TSY M + TEXT µs. (9)
The number of symbols, NSY M , depends on the number of data bits per sym-bol, NDBS , as shown in Equation 10.
NSY M802.11g=
⌈
16 + 8 × (LDATA + 28) + 6
NDBS
⌉
. (10)
Substituting the values for the 54 Mbps 802.11g [22], Equation 9 can be rewrit-ten as:
T802.11g = 50 +15
2× 20 + 20+
⌈
16 + 8 × (LDATA + 28) + 6
216
⌉
× 4 + 6 + 10 +
20 +⌈
16 + 8 × 14 + 6
24
⌉
× 4 + 6 µs. (11)
17
Then the throughput for IEEE 802.11g is given by:
Th802.11g =LDATA × 8
286 +⌈
246+8×LDATA
216
⌉
× 4Mbps. (12)
Table 6 shows throughput values obtained with IEEE 802.11g for differentpayload sizes.
Table 6Throughput of the 54 Mbps ERP-OFDM 802.11g.
Payload size (bytes) 100 500 900 1300 1500
Throughput (Mbps) 2.61 10.93 16.90 21.40 23.35
3.4 HomePlug 1.0
Finally, in this section the throughput of HomePlug 1.0 is analyzed. Accordingto Figures 10 and 11, the time needed to transmit a HomePlug frame is:
THplug = TCIFS + TPR +CWmin
2× Tslot + TPHY + NSY M × TSY M+ (13)
TEFG + TPHY + TRIFS + TACK µs.
All stations must receive the delimiters as well as the priority resolution sig-nals correctly, therefore they are sent using all the subcarriers, with the samemodulation and codification.
The number of symbols, NSY M , depends on the number of bits per symbol persubcarrier NBSS , on the number of subcarriers NSC , on the error correctioncodes CERR, and on the number of symbols per block NSPB, as shown inEquation 14. Data are transmitted into 20 or 40 OFDM symbol transmissionblocks. Thus, the number of blocks must be rounded up.
The number of symbols is given by:
NSY MHplug=
⌈
1
NSPB
×
(LDATA + 34 + LEPad) × 8
NBSS×NSC×CERR
⌉
×NSPB. (14)
The encryption padding size is calculated as shown in Equation 15.
LEPad =⌈
LDATA
8 × 8
⌉
× 8 −
LDATA
8bytes. (15)
18
For the maximum throughput, we have NBSS = 2 bits/symbol/subcarrier, NSC
= 84 subcarriers, CERR = 34×
238254
, and NSPB = 20 symbols per block [30].Then, Equation 13 can be rewritten as:
THplug = 35.84 + 2 × 35.84 +7
2× 35.84 + 72+
⌈
1
20×
(LDATA + 34 + LEPad) × 8
118.06299
⌉
×20 × 8.4 +
1.5 + 72 + 26 + 72 µs. (16)
The throughput for HomePlug is given by:
ThHplug =LDATA × 8
476.46 +⌈
272+8×(LDATA+LEPad)2361.2598
⌉
×168Mbps. (17)
Table 7 shows throughput values for different payload sizes.
Table 7Throughput of the HomePlug.
Payload size (bytes) 100 500 900 1300 1500
Throughput (Mbps) 1.24 4.92 6.27 7.90 8.08
These mathematical analyses considered two-node networks where there is onesender and one receiver. In order to evaluate the throughput on more realisticscenarios using networks with a higher number of nodes, we used simulationmodels.
4 Simulation Results
The network simulator (ns-2) version 2.26 [31] was used in the simulations.The simulation modules implemented for HomePNA and HomePlug were de-veloped in C++ and oTcl.
The simulations of the different protocols are divided into two sets. The firstsimulations compare the throughput expected from the mathematical analysisto the results obtained with the simulator modules. The second simulation setanalyzes the protocol throughput for varying numbers of nodes in the network.
The network offered load is produced by one node, which sends frames con-tinuously, i.e., the node always has a frame to send as soon as the mediumgets idle. In the graphs, the theoretical results are represented by continuous
19
lines whereas the simulation results are plotted with points. The payload ofthe frames ranges from 160 to 1500 bytes. Each simulation run lasts for 100seconds.
For the second simulation set, number of senders in the network ranges from1 to 30. The payload size used is 1500 bytes. Again, each simulation runlasts for 100 seconds. To obtain the maximum occupation of the network, allsender nodes try to transmit frames without interruption. Thus, whenever themedium is idle, all stations will try to transmit causing collisions and triggeringthe collision resolution process. These simulations investigate the behavior ofthe different MAC protocols when collisions happen.
The graphs have vertical error bars corresponding to a confidence interval of98% relative to the average samples.
We evaluated the maximum throughput for Fast Ethernet, HomePNA 2.0and 3.0, IEEE 802.11b and 802.11g, and HomePlug 1.0. We also obtained theefficiency of each protocol dividing its throughput by its respective physicaldata rate.
4.1 Fast Ethernet
The Ethernet module provided by ns-2 had to be modified in order to takethe Ethernet preamble and CRC into account.
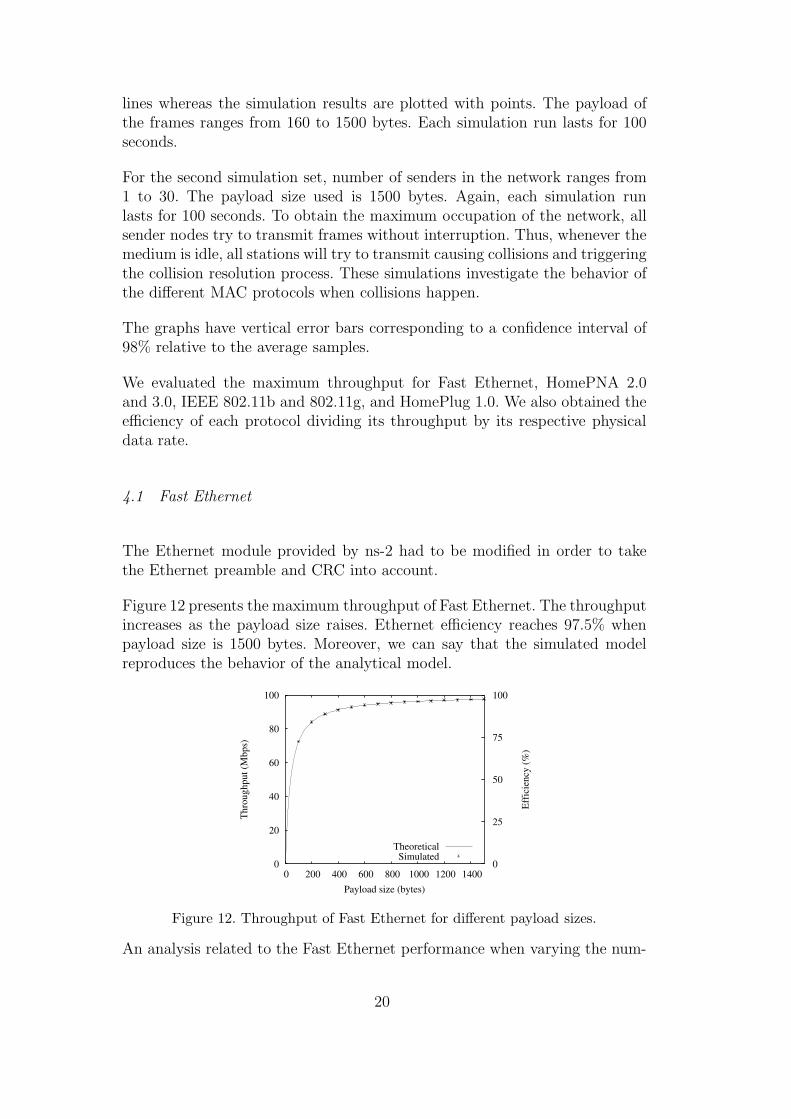
Figure 12 presents the maximum throughput of Fast Ethernet. The throughputincreases as the payload size raises. Ethernet efficiency reaches 97.5% whenpayload size is 1500 bytes. Moreover, we can say that the simulated modelreproduces the behavior of the analytical model.
0
20
40
60
80
100
0 200 400 600 800 1000 1200 1400
100
75
50
25
0
Thr
ough
put (
Mbp
s)
Eff
icie
ncy
(%)
Payload size (bytes)
TheoreticalSimulated
Figure 12. Throughput of Fast Ethernet for different payload sizes.
An analysis related to the Fast Ethernet performance when varying the num-
20
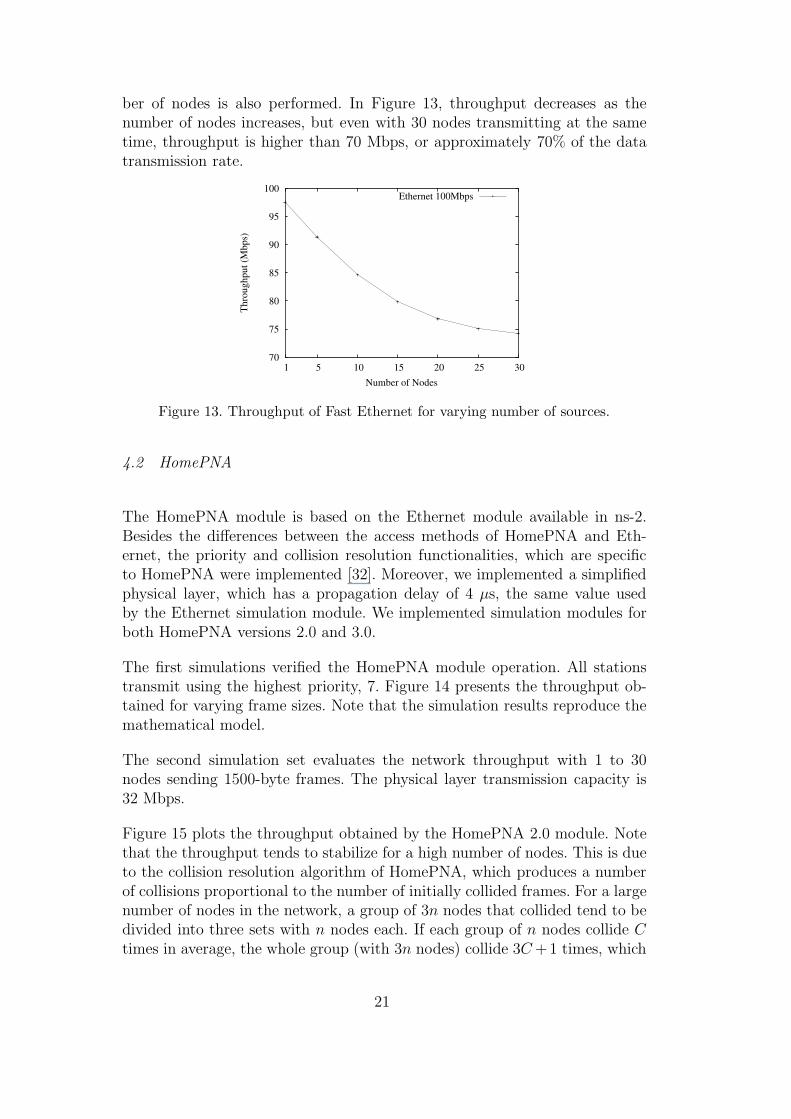
ber of nodes is also performed. In Figure 13, throughput decreases as thenumber of nodes increases, but even with 30 nodes transmitting at the sametime, throughput is higher than 70 Mbps, or approximately 70% of the datatransmission rate.
70
75
80
85
90
95
100
30 25 20 15 10 5 1
Thr
ough
put (
Mbp
s)
Number of Nodes
Ethernet 100Mbps
Figure 13. Throughput of Fast Ethernet for varying number of sources.
4.2 HomePNA
The HomePNA module is based on the Ethernet module available in ns-2.Besides the differences between the access methods of HomePNA and Eth-ernet, the priority and collision resolution functionalities, which are specificto HomePNA were implemented [32]. Moreover, we implemented a simplifiedphysical layer, which has a propagation delay of 4 µs, the same value usedby the Ethernet simulation module. We implemented simulation modules forboth HomePNA versions 2.0 and 3.0.
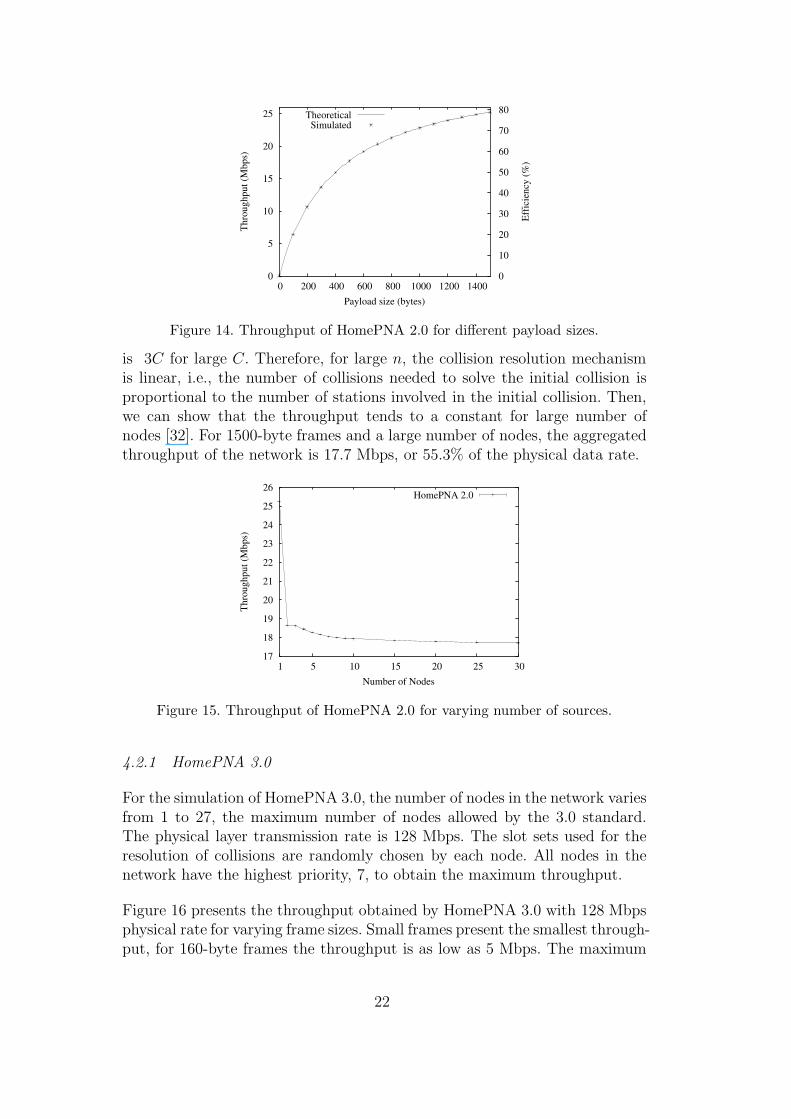
The first simulations verified the HomePNA module operation. All stationstransmit using the highest priority, 7. Figure 14 presents the throughput ob-tained for varying frame sizes. Note that the simulation results reproduce themathematical model.
The second simulation set evaluates the network throughput with 1 to 30nodes sending 1500-byte frames. The physical layer transmission capacity is32 Mbps.
Figure 15 plots the throughput obtained by the HomePNA 2.0 module. Notethat the throughput tends to stabilize for a high number of nodes. This is dueto the collision resolution algorithm of HomePNA, which produces a numberof collisions proportional to the number of initially collided frames. For a largenumber of nodes in the network, a group of 3n nodes that collided tend to bedivided into three sets with n nodes each. If each group of n nodes collide C
times in average, the whole group (with 3n nodes) collide 3C +1 times, which
21
0
5
10
15
20
25
0 200 400 600 800 1000 1200 1400
80
70
60
50
40
30
20
10
0
Thr
ough
put (
Mbp
s)
Eff
icie
ncy
(%)
Payload size (bytes)
TheoreticalSimulated
Figure 14. Throughput of HomePNA 2.0 for different payload sizes.
is 3C for large C. Therefore, for large n, the collision resolution mechanismis linear, i.e., the number of collisions needed to solve the initial collision isproportional to the number of stations involved in the initial collision. Then,we can show that the throughput tends to a constant for large number ofnodes [32]. For 1500-byte frames and a large number of nodes, the aggregatedthroughput of the network is 17.7 Mbps, or 55.3% of the physical data rate.
17
18
19
20
21
22
23
24
25
26
30 25 20 15 10 5 1
Thr
ough
put (
Mbp
s)
Number of Nodes
HomePNA 2.0
Figure 15. Throughput of HomePNA 2.0 for varying number of sources.
4.2.1 HomePNA 3.0
For the simulation of HomePNA 3.0, the number of nodes in the network variesfrom 1 to 27, the maximum number of nodes allowed by the 3.0 standard.The physical layer transmission rate is 128 Mbps. The slot sets used for theresolution of collisions are randomly chosen by each node. All nodes in thenetwork have the highest priority, 7, to obtain the maximum throughput.
Figure 16 presents the throughput obtained by HomePNA 3.0 with 128 Mbpsphysical rate for varying frame sizes. Small frames present the smallest through-put, for 160-byte frames the throughput is as low as 5 Mbps. The maximum
22
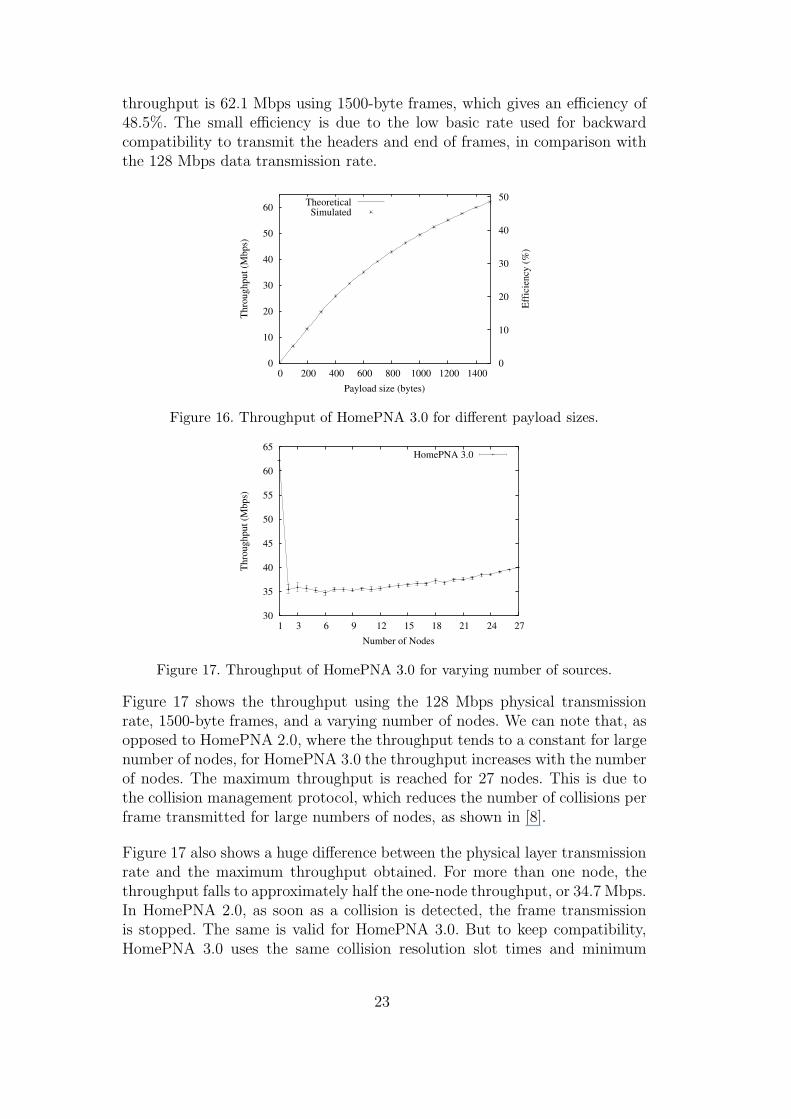
throughput is 62.1 Mbps using 1500-byte frames, which gives an efficiency of48.5%. The small efficiency is due to the low basic rate used for backwardcompatibility to transmit the headers and end of frames, in comparison withthe 128 Mbps data transmission rate.
0
10
20
30
40
50
60
0 200 400 600 800 1000 1200 1400
50
40
30
20
10
0
Thr
ough
put (
Mbp
s)
Eff
icie
ncy
(%)
Payload size (bytes)
TheoreticalSimulated
Figure 16. Throughput of HomePNA 3.0 for different payload sizes.
30
35
40
45
50
55
60
65
27 24 21 18 15 12 9 6 3 1
Thr
ough
put (
Mbp
s)
Number of Nodes
HomePNA 3.0
Figure 17. Throughput of HomePNA 3.0 for varying number of sources.
Figure 17 shows the throughput using the 128 Mbps physical transmissionrate, 1500-byte frames, and a varying number of nodes. We can note that, asopposed to HomePNA 2.0, where the throughput tends to a constant for largenumber of nodes, for HomePNA 3.0 the throughput increases with the numberof nodes. The maximum throughput is reached for 27 nodes. This is due tothe collision management protocol, which reduces the number of collisions perframe transmitted for large numbers of nodes, as shown in [8].
Figure 17 also shows a huge difference between the physical layer transmissionrate and the maximum throughput obtained. For more than one node, thethroughput falls to approximately half the one-node throughput, or 34.7 Mbps.In HomePNA 2.0, as soon as a collision is detected, the frame transmissionis stopped. The same is valid for HomePNA 3.0. But to keep compatibility,HomePNA 3.0 uses the same collision resolution slot times and minimum
23
frame duration as HomePNA 2.0. Thus, the time spent with one collision islonger than the time spent with the transmission of one frame at 128 Mbpsin HomePNA 3.0, reducing its efficiency.
4.3 IEEE 802.11
We modified ns-2 to implement IEEE 802.11g and used the 802.11b moduleavailable in ns-2. The simulation scenarios are composed of stations inside thesame transmission range resulting in a fully connected ad hoc network. Weused the free space model to calculate attenuation and we considered a nullchannel error probability.
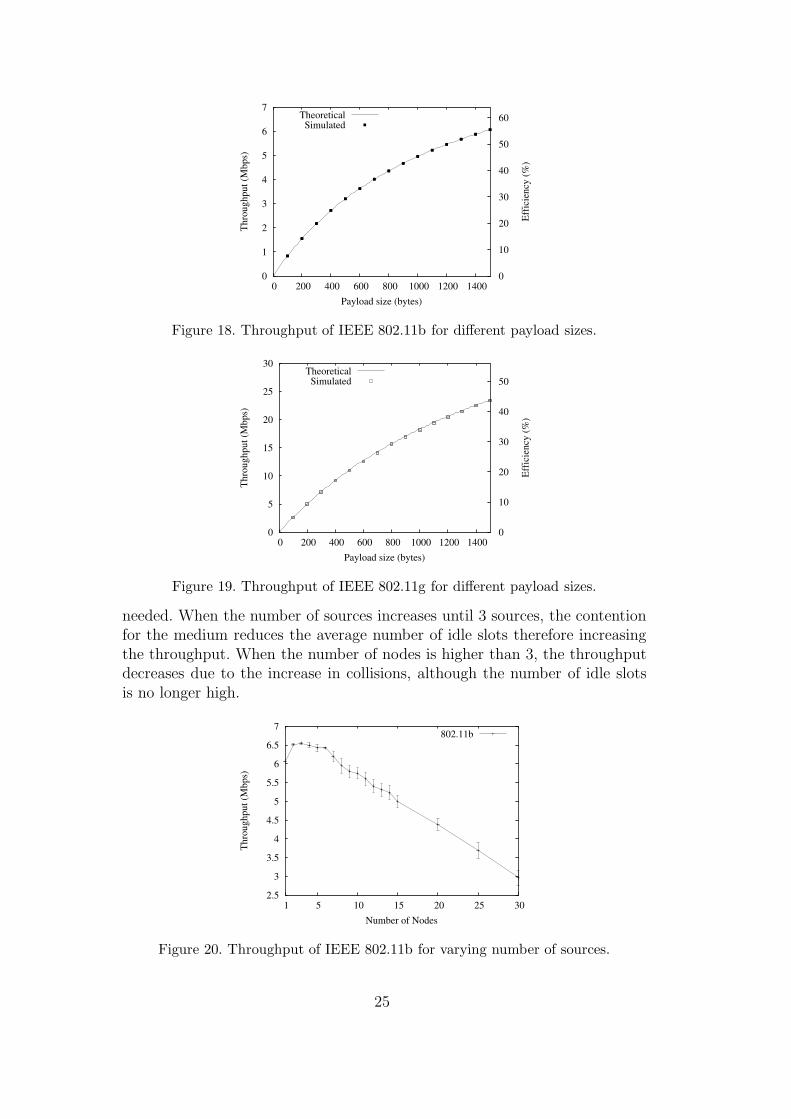
First, we run simulations to evaluate the maximum throughput obtained byIEEE 802.11 for different payload sizes. The simulation scenarios have onlyone kind of node, either 802.11b nodes or 802.11g nodes. The scenario iscomposed of one source and one destination. The IEEE 802.11b station usesthe 11 Mbps HR-DSSS and IEEE 802.11g station uses the 54 Mbps ERP-OFDM. Figures 18 and 19 plot the maximum throughput for varying payloadsizes using IEEE 802.11b and 802.11g, respectively. The results obtained bythe IEEE 802.11b module agree with the mathematical analysis. Besides, theresults of IEEE 802.11g confirm the computed throughput.
The efficiency of IEEE 802.11b is higher than IEEE 802.11g because the over-head of 802.11b is proportionally smaller. Using 1500-byte frames, 802.11b hasan efficiency around 55% whereas 802.11g efficiency is below 45%. IEEE 802.11gtransmits data at 54 Mbps with a basic rate of 6 Mbps where 802.11b uses11 Mbps and 1 Mbps, respectively. On the other hand, 802.11g uses the sameSIFS time, the same slot time, and maximum CW. Only the minimum CWvalue is reduced from 31 to 15. Therefore, to have the same efficiency as802.11b, 802.11g should have reduced the medium access times correspond-ingly, which is not the case. Nevertheless, the standard defines an optionalversion of 802.11g, called 802.11g Short Slot Time, which provides higherthroughput by reducing the slot time from 20 to 9 µs.
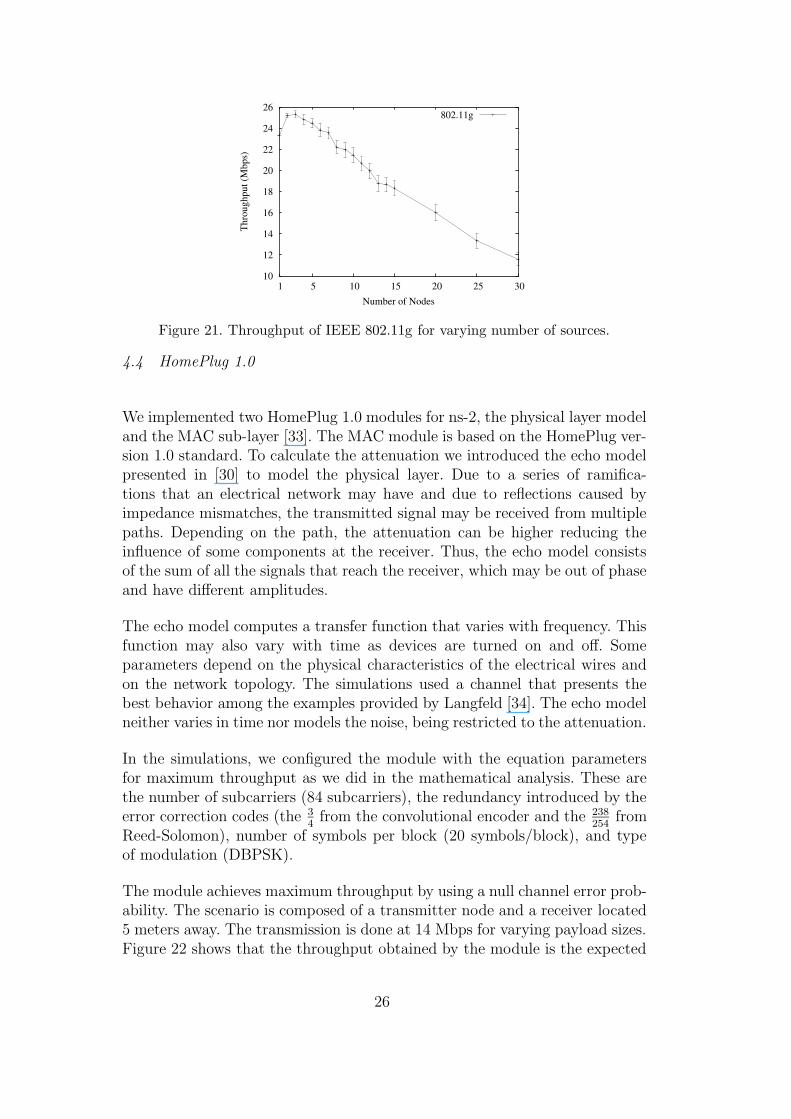
In the next simulations, the number of nodes in the network is varied. Again,the networks have only 802.11b or only 802.11g nodes. Figures 20 and 21show the throughput obtained by IEEE 802.11b and 802.11g, respectively.The frame size is 1500 bytes and the transmission rates are 11 Mbps forIEEE 802.11b stations and 54 Mbps for IEEE 802.11g stations. As the num-ber of stations increases, the throughput decreases due to a higher numberof collisions. It is worth noting that the throughput gets higher when thenumber of sources varies from one to 3 nodes. This happens because the ini-tial contention window (CWmin) size is too large adding more idle slots than
24
0
1
2
3
4
5
6
7
0 200 400 600 800 1000 1200 1400
60
50
40
30
20
10
0
Thr
ough
put (
Mbp
s)
Eff
icie
ncy
(%)
Payload size (bytes)
TheoreticalSimulated
Figure 18. Throughput of IEEE 802.11b for different payload sizes.
0
5
10
15
20
25
30
0 200 400 600 800 1000 1200 1400
50
40
30
20
10
0
Thr
ough
put (
Mbp
s)
Eff
icie
ncy
(%)
Payload size (bytes)
TheoreticalSimulated
Figure 19. Throughput of IEEE 802.11g for different payload sizes.
needed. When the number of sources increases until 3 sources, the contentionfor the medium reduces the average number of idle slots therefore increasingthe throughput. When the number of nodes is higher than 3, the throughputdecreases due to the increase in collisions, although the number of idle slotsis no longer high.
2.5
3
3.5
4
4.5
5
5.5
6
6.5
7
30 25 20 15 10 5 1
Thr
ough
put (
Mbp
s)
Number of Nodes
802.11b
Figure 20. Throughput of IEEE 802.11b for varying number of sources.
25
10
12
14
16
18
20
22
24
26
30 25 20 15 10 5 1
Thr
ough
put (
Mbp
s)
Number of Nodes
802.11g
Figure 21. Throughput of IEEE 802.11g for varying number of sources.
4.4 HomePlug 1.0
We implemented two HomePlug 1.0 modules for ns-2, the physical layer modeland the MAC sub-layer [33]. The MAC module is based on the HomePlug ver-sion 1.0 standard. To calculate the attenuation we introduced the echo modelpresented in [30] to model the physical layer. Due to a series of ramifica-tions that an electrical network may have and due to reflections caused byimpedance mismatches, the transmitted signal may be received from multiplepaths. Depending on the path, the attenuation can be higher reducing theinfluence of some components at the receiver. Thus, the echo model consistsof the sum of all the signals that reach the receiver, which may be out of phaseand have different amplitudes.
The echo model computes a transfer function that varies with frequency. Thisfunction may also vary with time as devices are turned on and off. Someparameters depend on the physical characteristics of the electrical wires andon the network topology. The simulations used a channel that presents thebest behavior among the examples provided by Langfeld [34]. The echo modelneither varies in time nor models the noise, being restricted to the attenuation.
In the simulations, we configured the module with the equation parametersfor maximum throughput as we did in the mathematical analysis. These arethe number of subcarriers (84 subcarriers), the redundancy introduced by theerror correction codes (the 3
4from the convolutional encoder and the 238
254from
Reed-Solomon), number of symbols per block (20 symbols/block), and typeof modulation (DBPSK).
The module achieves maximum throughput by using a null channel error prob-ability. The scenario is composed of a transmitter node and a receiver located5 meters away. The transmission is done at 14 Mbps for varying payload sizes.Figure 22 shows that the throughput obtained by the module is the expected
26
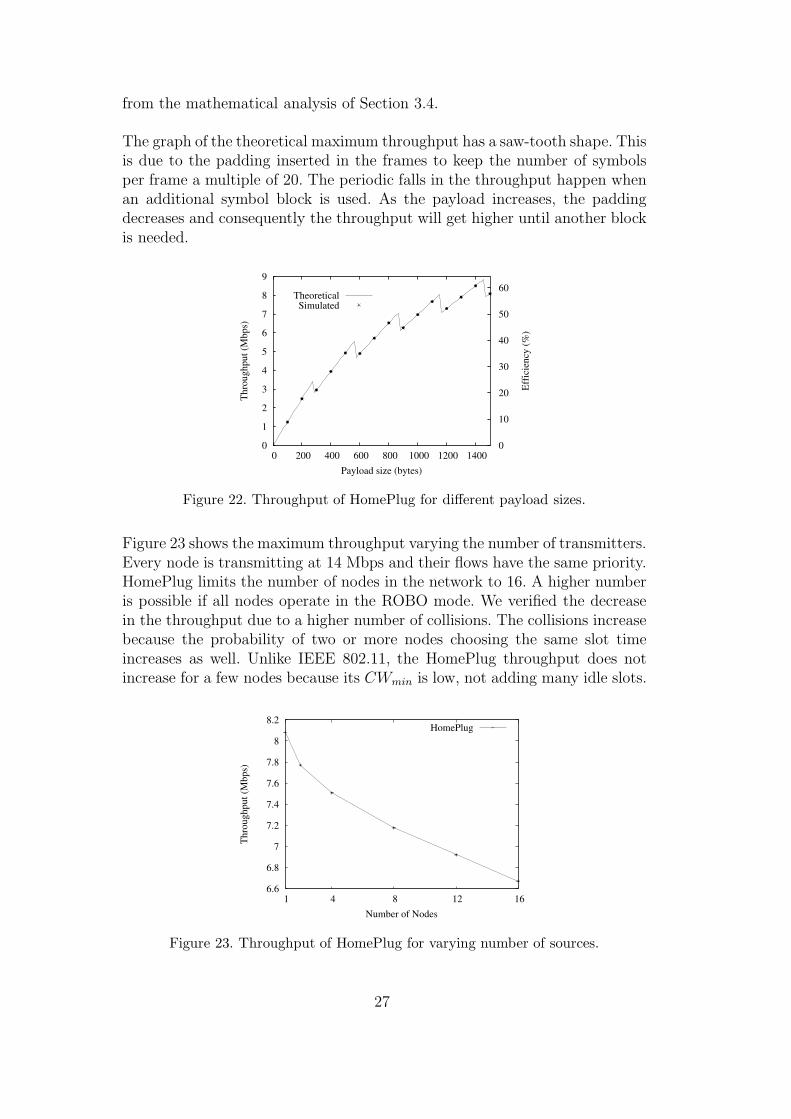
from the mathematical analysis of Section 3.4.
The graph of the theoretical maximum throughput has a saw-tooth shape. Thisis due to the padding inserted in the frames to keep the number of symbolsper frame a multiple of 20. The periodic falls in the throughput happen whenan additional symbol block is used. As the payload increases, the paddingdecreases and consequently the throughput will get higher until another blockis needed.
0
1
2
3
4
5
6
7
8
9
0 200 400 600 800 1000 1200 1400
60
50
40
30
20
10
0
Thr
ough
put (
Mbp
s)
Eff
icie
ncy
(%)
Payload size (bytes)
TheoreticalSimulated
Figure 22. Throughput of HomePlug for different payload sizes.
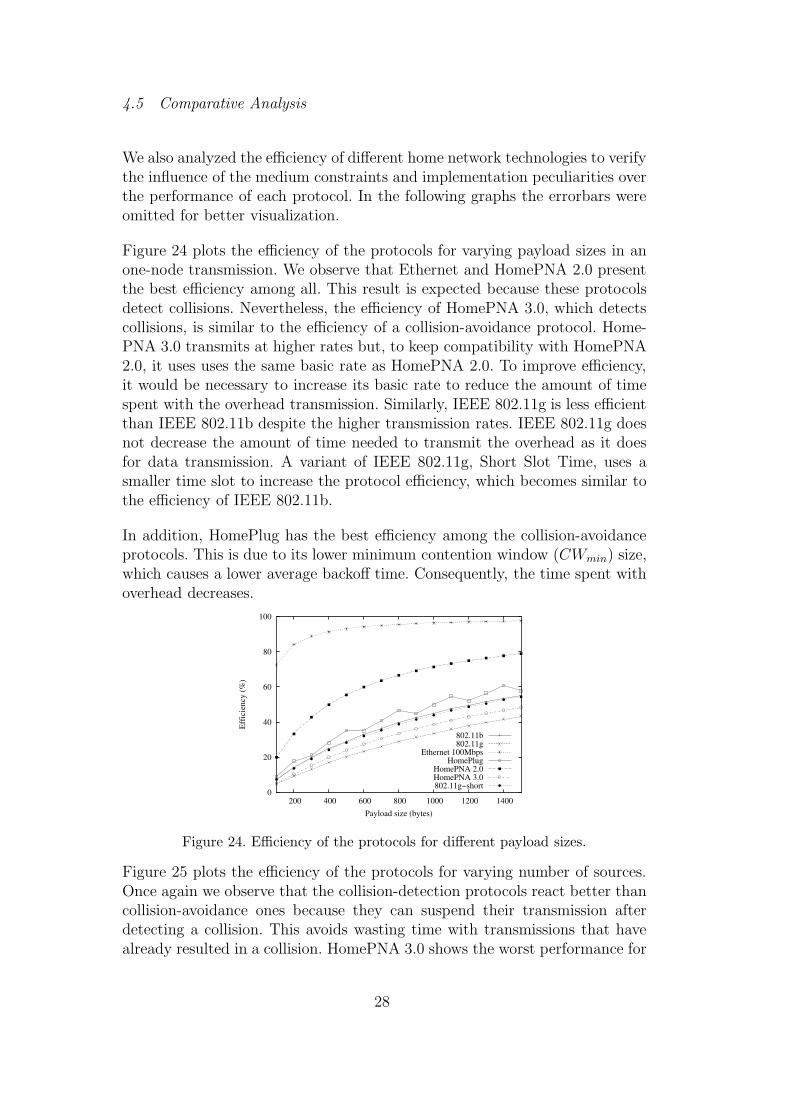
Figure 23 shows the maximum throughput varying the number of transmitters.Every node is transmitting at 14 Mbps and their flows have the same priority.HomePlug limits the number of nodes in the network to 16. A higher numberis possible if all nodes operate in the ROBO mode. We verified the decreasein the throughput due to a higher number of collisions. The collisions increasebecause the probability of two or more nodes choosing the same slot timeincreases as well. Unlike IEEE 802.11, the HomePlug throughput does notincrease for a few nodes because its CWmin is low, not adding many idle slots.
6.6
6.8
7
7.2
7.4
7.6
7.8
8
8.2
16 12 8 4 1
Thr
ough
put (
Mbp
s)
Number of Nodes
HomePlug
Figure 23. Throughput of HomePlug for varying number of sources.
27
4.5 Comparative Analysis
We also analyzed the efficiency of different home network technologies to verifythe influence of the medium constraints and implementation peculiarities overthe performance of each protocol. In the following graphs the errorbars wereomitted for better visualization.
Figure 24 plots the efficiency of the protocols for varying payload sizes in anone-node transmission. We observe that Ethernet and HomePNA 2.0 presentthe best efficiency among all. This result is expected because these protocolsdetect collisions. Nevertheless, the efficiency of HomePNA 3.0, which detectscollisions, is similar to the efficiency of a collision-avoidance protocol. Home-PNA 3.0 transmits at higher rates but, to keep compatibility with HomePNA2.0, it uses uses the same basic rate as HomePNA 2.0. To improve efficiency,it would be necessary to increase its basic rate to reduce the amount of timespent with the overhead transmission. Similarly, IEEE 802.11g is less efficientthan IEEE 802.11b despite the higher transmission rates. IEEE 802.11g doesnot decrease the amount of time needed to transmit the overhead as it doesfor data transmission. A variant of IEEE 802.11g, Short Slot Time, uses asmaller time slot to increase the protocol efficiency, which becomes similar tothe efficiency of IEEE 802.11b.
In addition, HomePlug has the best efficiency among the collision-avoidanceprotocols. This is due to its lower minimum contention window (CWmin) size,which causes a lower average backoff time. Consequently, the time spent withoverhead decreases.
0
20
40
60
80
100
200 400 600 800 1000 1200 1400
Eff
icie
ncy
(%)
Payload size (bytes)
802.11b802.11g
Ethernet 100MbpsHomePlug
HomePNA 2.0HomePNA 3.0802.11g−short
Figure 24. Efficiency of the protocols for different payload sizes.
Figure 25 plots the efficiency of the protocols for varying number of sources.Once again we observe that the collision-detection protocols react better thancollision-avoidance ones because they can suspend their transmission afterdetecting a collision. This avoids wasting time with transmissions that havealready resulted in a collision. HomePNA 3.0 shows the worst performance for
28
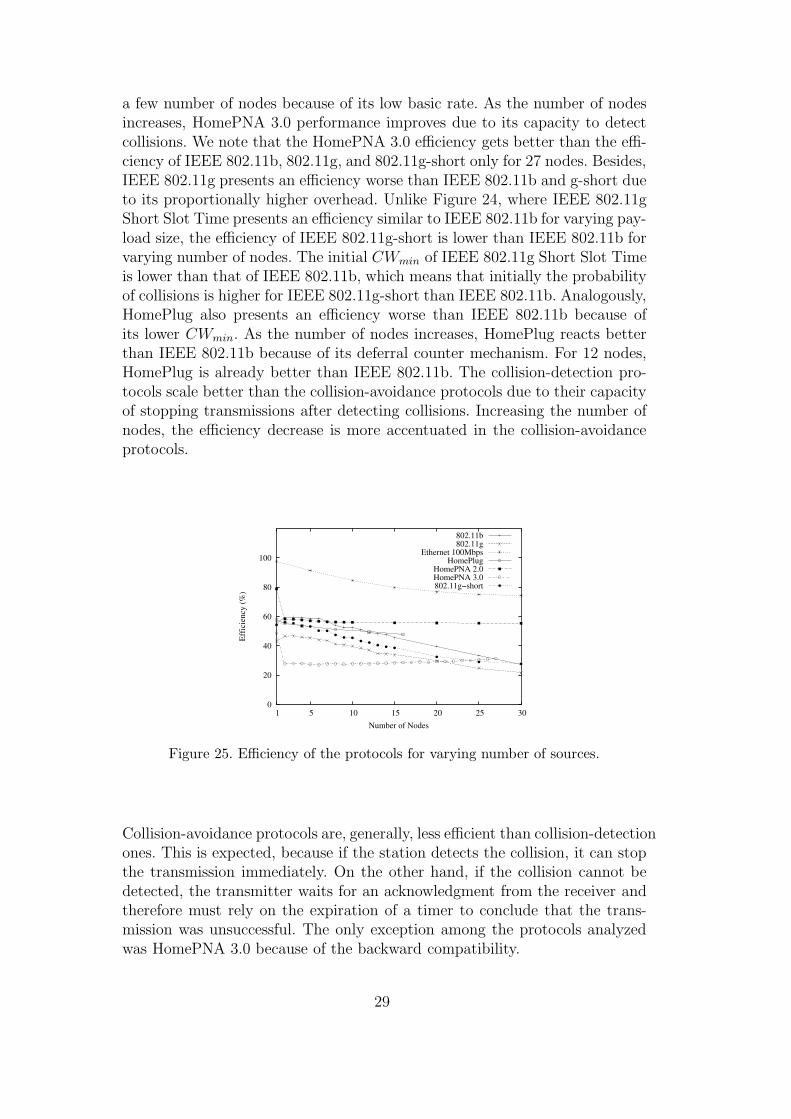
a few number of nodes because of its low basic rate. As the number of nodesincreases, HomePNA 3.0 performance improves due to its capacity to detectcollisions. We note that the HomePNA 3.0 efficiency gets better than the effi-ciency of IEEE 802.11b, 802.11g, and 802.11g-short only for 27 nodes. Besides,IEEE 802.11g presents an efficiency worse than IEEE 802.11b and g-short dueto its proportionally higher overhead. Unlike Figure 24, where IEEE 802.11gShort Slot Time presents an efficiency similar to IEEE 802.11b for varying pay-load size, the efficiency of IEEE 802.11g-short is lower than IEEE 802.11b forvarying number of nodes. The initial CWmin of IEEE 802.11g Short Slot Timeis lower than that of IEEE 802.11b, which means that initially the probabilityof collisions is higher for IEEE 802.11g-short than IEEE 802.11b. Analogously,HomePlug also presents an efficiency worse than IEEE 802.11b because ofits lower CWmin. As the number of nodes increases, HomePlug reacts betterthan IEEE 802.11b because of its deferral counter mechanism. For 12 nodes,HomePlug is already better than IEEE 802.11b. The collision-detection pro-tocols scale better than the collision-avoidance protocols due to their capacityof stopping transmissions after detecting collisions. Increasing the number ofnodes, the efficiency decrease is more accentuated in the collision-avoidanceprotocols.
100
80
60
40
20
0 30 25 20 15 10 5 1
Eff
icie
ncy
(%)
Number of Nodes
802.11b802.11g
Ethernet 100MbpsHomePlug
HomePNA 2.0HomePNA 3.0802.11g−short
Figure 25. Efficiency of the protocols for varying number of sources.
Collision-avoidance protocols are, generally, less efficient than collision-detectionones. This is expected, because if the station detects the collision, it can stopthe transmission immediately. On the other hand, if the collision cannot bedetected, the transmitter waits for an acknowledgment from the receiver andtherefore must rely on the expiration of a timer to conclude that the trans-mission was unsuccessful. The only exception among the protocols analyzedwas HomePNA 3.0 because of the backward compatibility.
29
5 Conclusion
Currently, there is a great effort to provide communication networks to inter-connect home devices. Different technologies based on wired, wireless, and “nonew wires” solutions exist. Our work analyzed the efficiency of the most suc-cessful home-network technologies emphasizing on the different access meth-ods and MAC sub-layer protocols.
First, we derived mathematical expressions for the maximum throughput ob-tained in a one-node transmission by the different protocols. We also per-formed similar evaluation using simulation. This analysis has shown the con-trol overhead of each protocol for variable frame sizes. As expected, collision-detection protocols performed better than protocols that cannot detect butonly avoid collisions. The exception is HomePNA 3.0, a collision-detectionprotocol, due to the basic rates used to keep backward compatibility. For1500-byte frames, Ethernet, HomePNA 2.0, and HomePNA 3.0 achieved an ef-ficiency of 97.5, 78.8, and 48.5%, respectively. On the other hand, the collision-avoidance protocols HomePlug, IEEE 802.11b, and IEEE 802.11g reached57.7, 55.2, and 43.2% efficiency, respectively. HomePNA 3.0 performs simi-lar to collision-avoidance protocols, showing that implementation peculiaritiesimpact the protocol efficiency. A similar unexpected result was obtained in theIEEE 802.11 analysis. We showed that IEEE 802.11b is more efficient thanIEEE 802.11g, even though IEEE 802.11g achieves higher transmission rates.
Then, the collision resolution mechanisms of the protocols were evaluatedthrough simulations. We analyzed the behavior of the protocols when thestations start contending for the medium. The contention can result in col-lisions since we only considered transmissions over shared mediums. Again,the collision-detection protocols performed better than the collision-avoidanceprotocols, and once again HomePNA 3.0 was the exception. HomePNA 3.0showed the worst efficiency for a few number of nodes due to compatibilityrelated constraints. Our results also showed that the efficiency of the collision-avoidance protocols depends on the minimum contention window (CWmin)size as seen with HomePlug and IEEE 802.11. Higher CWmin values meanshigher performance when increasing the number of nodes in the medium.
This work made a thorough review of the access methods used by differentshared-medium home-network protocols. The maximum throughput resultsobtained with mathematical analysis and simulation results showed how ef-ficiently each protocol shares the medium and treat collisions. Based on theanalyses made, one can identify where the medium access methods may beimproved and, possibly, combine the techniques used in the different technolo-gies.
30
References
[1] Y.-J. Lin, H. A. Latchman, R. E. Newman, S. Katar, A comparativeperformance study of wireless and power line networks, IEEE CommunicationsMagazine 41 (4) (2003) 54–63.
[2] http://www.homepna.org (2003).
[3] http://www.homeplug.org (2004).
[4] J. Wang, S. Keshav, Efficient and accurate ethernet simulation, in: Proc. of the24th Conference on Local Computer Networks (LCN’99), 1999, pp. 182–191.
[5] D. R. Boggs, J. C. Mogul, C. A. Kent, Measured capacity of an ethernet:Myths and reality, in: Proc. SIGCOMM ’88 Symposium on CommunicationsArchitectures and Protocols, 1988, pp. 222–34.
[6] M. Y. Chung, H. C. Kim, T.-J. Lee, HomePNA 2.0 - saturation throughputanalysis, IEEE Communications Letters 7 (11) (2003) 558–560.
[7] S. Kangude, J. Copeland, M. Sherman, An analysis of the Home PNA collisionresolution mechanism, in: 28th IEEE Conference on Local Computer Networks- LCN’2003, Bonn/Konigswinter, Germany, 2003.
[8] H. C. Kim, M. Y. Chung, T.-J. Lee, J. Park, Saturation throughput analysis ofcollision management protocol in the HomePNA 3.0 asynchronous MAC mode,IEEE Communications Letters 8 (7) (2004) 476–478.
[9] J. Jun, P. Peddabachagari, M. L. Sichitiu, Theoretical maximum throughputof IEEE 802.11 and its applications, in: Proc. of the 2nd IEEE InternationalSymposium on Network Computing and Applications (NCA’03), Cambridge,USA, 2003.
[10] Y. Xiao, J. Rosdahl, Throughput and delay limits of IEEE 802.11, IEEECommunications Letters 6 (8) (2002) 355–357.
[11] G. Anastasi, E. Borgia, M. Conti, E. Gregori, IEEE 802.11 ad hoc networks:Performance measurements, in: Proc. of the 23rd International Conference onDistributed Computing Systems Workshops (ICDCSW’03), 2003.
[12] A. Wijesinha, Y. T. Song, M. Krishnan, V. Mathur, J. Ahn, V. Shyamasundar,Throughput measurement for UDP traffic in an IEEE 802.11g WLAN, in:Proceedings of the Sixth International Conference on Software Engineering,Artificial Intelligence, Networking and Parallel/Distributed Computing (SNPD05), 2005, pp. 220–225.
[13] A. Doufexi, S. Armour, B.-S. Lee, A. Nix, D. Bull, An evaluation of theperformance of IEEE 802.11a and 802.11g wireless local area networks in acorporate office environment, in: Proc. of the IEEE International Conferenceon Communications (ICC’03), 2003, pp. 1196–1200.
31
[14] M.-H. Jung, M. Y. Chung, T.-J. Lee, MAC throughput analysis of HomePlug1.0, IEEE Communications Letters 9 (2) (2005) 184–186.
[15] M. K. Lee, R. E. Newman, H. A. Latchman, S. Katar, L. Yonge, Homeplug 1.0powerline communications LANs - protocol description and performance results,International Journal of Communication Systems 16 (5) (2003) 447–473.
[16] IEEE, Carrier sense multiple access with collision detection (CSMA/CD) accessmethod and physical layer specifications, IEEE Standard 802.3 (2002).
[17] ITU-T, G.989.1: Phoneline networking transceivers - foundation (Feb. 2001).
[18] ITU-T, G.989.2: Phoneline networking transceivers - payload format and linklayer requirements (Nov. 2001).
[19] ITU-T, G.989.3: Phoneline networking transceivers - isolation function (Mar.2003).
[20] IEEE, Wireless LAN medium access control (MAC) and physical layer (PHY)specifications, IEEE Standard 802.11 (1999).
[21] IEEE, Wireless LAN medium access control (MAC) and physical layer (PHY)specifications: Higher-speed physical layer extension in the 2.4 GHz band, IEEEStandard 802.11b (1999).
[22] IEEE, Wireless LAN medium access control (MAC) and physical layer (PHY)specifications: High-speed physical layer in the 2.4 GHz band, IEEE Standard802.11g (2003).
[23] E. H. Frank, J. Holloway, Connecting the home with a phone line network chipset, IEEE Micro 20 (2) (2000) 27–38.
[24] ITU-T, G.PNT: PNT3 proposal overview, temporary document MC-107R1(Aug. 2003).
[25] R. Sterenson, Guaranteed QoS in the home network environment, Tech. rep.,CopperGate Communications (2003).
[26] ITU-T, The proposed MAC for PNT3, temporary document PF-042 (Aug.2003).
[27] IEEE, Wireless LAN medium access control (MAC) and physical layer (PHY)specifications: High-speed physical layer in the 5 GHz band, IEEE Standard802.11a (1999).
[28] IEEE, Media access control (MAC) bridges, IEEE Standard 802.1D (1998).
[29] S. Gardner, B. Markwalter, L. Yonge, Homeplug standard brings networking tothe home, Communication Systems Design Magazine 6 (12).
[30] K. Dostert, Powerline Communications, 1st Edition, Prentice-Hall, 2001, ISBN0130293423.
[31] K. Fall, K. Varadhan, The ns Manual, UC Berkeley, LBL, USC/ISI, and XeroxPARC, http://www.isi.edu/nsnam/ns/ns-documentation.html (Jul. 2005).
32
[32] A. Amodei Jr., L. H. M. K. Costa, O. C. M. B. Duarte, Increasing thethroughput of the HomePNA MAC protocol, in: 29th IEEE Conference onLocal Computer Networks - LCN’2004, Tampa, USA, 2004.
[33] M. E. M. Campista, L. H. M. K. Costa, O. C. M. B. Duarte, Improving theData Transmission Throughput over the Home Electrical Wiring, in: 30th IEEEConference on Local Computer Networks (LCN’05), Sydney, Australia, 2005.
[34] P. Langfeld, The capacity of typical powerline reference channels and strategiesfor system design, in: International Symposium on Power-Line Communicationsand its Applications (ISPLC), Malmo, Sweden, 2001.
33
Related Documents


