This article appeared in a journal published by Elsevier. The attached copy is furnished to the author for internal non-commercial research and education use, including for instruction at the authors institution and sharing with colleagues. Other uses, including reproduction and distribution, or selling or licensing copies, or posting to personal, institutional or third party websites are prohibited. In most cases authors are permitted to post their version of the article (e.g. in Word or Tex form) to their personal website or institutional repository. Authors requiring further information regarding Elsevier’s archiving and manuscript policies are encouraged to visit: http://www.elsevier.com/copyright

Welcome message from author
This document is posted to help you gain knowledge. Please leave a comment to let me know what you think about it! Share it to your friends and learn new things together.
Transcript
This article appeared in a journal published by Elsevier. The attachedcopy is furnished to the author for internal non-commercial researchand education use, including for instruction at the authors institution
and sharing with colleagues.
Other uses, including reproduction and distribution, or selling orlicensing copies, or posting to personal, institutional or third party
websites are prohibited.
In most cases authors are permitted to post their version of thearticle (e.g. in Word or Tex form) to their personal website orinstitutional repository. Authors requiring further information
regarding Elsevier’s archiving and manuscript policies areencouraged to visit:
http://www.elsevier.com/copyright
Author's personal copy
Analysis of inter-transcriber consistency in the Cat_ToBI prosodiclabeling system
David Escudero a,⇑, Lourdes Aguilar b, Maria del Mar Vanrell c,e, Pilar Prieto d
a Dpt. of Computer Sciences, Universidad de Valladolid, Spainb Dpt. of Spanish Philology, Universitat Autonoma de Barcelona, Spainc Dpt. of Catalan Philology, Universitat Autonoma de Barcelona, Spain
d Dpt. of Translation and Language Sciences, ICREA-Universitat Pompeu Fabra, Spaine Dpt. of Translation and Language Sciences, Universitat Pompeu Fabra, Spain
Received 24 June 2011; received in revised form 16 November 2011; accepted 5 December 2011Available online 13 December 2011
Abstract
A set of tools to analyze inconsistencies observed in a Cat_ToBI labeling experiment are presented. We formalize and use the metricsthat are commonly used in inconsistency tests. The metrics are systematically applied to analyze the robustness of every symbol and everypair of transcribers. The results reveal agreement rates for this study that are comparable to previous ToBI inter-reliability tests. Theinter-transcriber confusion rates are transformed into distance matrices to use multidimensional scaling for visualizing the confusionbetween the different ToBI symbols and the disagreement between the raters. Potential different labeling criteria are identified and subsetsof symbols that are candidates to be fused are proposed.� 2011 Elsevier B.V. All rights reserved.
Keywords: Prosody; Prosodic labeling; Inter-transcriber consistency; ToBI
1. Introduction
The framework of intonational phonology, also knownas the Autosegmental-Metrical (AM) model of intonation,has been applied to many languages, to thoroughlydescribe prosodic systems and develop methods of collect-ing intonation data. This framework has also been appliedin automatic speech processing and database annotation toyield ToBI (TOnes and Break Indices) a prosodic labelingstandard for speech databases that is based on Pierrehum-bert’s thesis (Pierrehumbert, 1980). ToBI-based systemshave been developed to label oral databases for many lan-guages such as English (Beckman et al., 2005), Spanish(Beckman et al., 2000; Beckman, 2002; Estebas and Prieto,2009), German (Grice and Benzmuller, 1995), Japanese(Venditti, 2005), Greek (Arvaniti and Baltazani, 2005),
Korean (Beckman and Jun, 2000) and Catalan (Prieto,2012; Estebas Vilaplana and Prieto, 2010) among others.
It is important to make clear that, as the developers ofToBI explicitly state, ToBI is not an International PhoneticAlphabet for prosody. Because intonation and prosodicorganization differ from language to language, and oftenfrom dialect to dialect within a language, there are manydifferent ToBI systems, each one specific to a language vari-ety and the community of researchers working on that lan-guage variety (Ohio-State-University, 2006). From thispoint of view, a full intonational and prosodic descriptionof a given language is needed before a ToBI-based tran-scription system is accepted as a community-wide standard.
The ToBI system consists of annotations at several time-linked levels of analysis. The three obligatory tiers are: anorthographic tier of time-aligned words; a break index tierwhich indicates the degree of junction between words; anda tonal tier, where pitch accents, phrase accents and bound-ary tones define intonational events. A fourth tier, the
0167-6393/$ - see front matter � 2011 Elsevier B.V. All rights reserved.
doi:10.1016/j.specom.2011.12.002
⇑ Corresponding author.E-mail address: [email protected] (D. Escudero).
www.elsevier.com/locate/specom
Available online at www.sciencedirect.com
Speech Communication 54 (2012) 566–582
Author's personal copy
miscellaneous tier, is provided to annotate any additionalphenomena, such as disfluencies.
One of the advantages of using the ToBI systems forprosodic annotation is its reliable inter-transcriber consis-tency (see the favorable inter-transcriber reliability scoresfor the different systems in Section 5.1) due to the relativelysimple labeling procedure proposed. Moreover, the ToBIsystems presented for each language are generally basedon and directly linked to fundamental research on prosodyfor each language. Yet despite the widespread use of theToBI system, it also has its detractors (Prom-on et al.,2009; Hirst, 2005; Wightman, 2002; Herman and McGory,2002), in particular, because of the confusions that havearisen either in the tagging process, when more thanone transcriber must label the same utterances, or whenlabeling is done automatically, since in the automatic label-ing process, some of the points where ToBI markers needto be placed are not easily identifiable from the acousticsignal (Gonzalez et al., 2010; Rosenberg, 2009; Rosenberg,2010).
In phonologically-oriented prosodic transcribing sys-tems, like ToBI, intercoder inconsistencies appear becausethe labeling process depends on perceptual criteria that aremainly dependent on the subjective human judges. Ourpoint of view is that inconsistencies are due to the non-uni-form acoustic expression of prosody and are inevitable.However, they represent a challenge for the developmentof prosodic speech synthesis and recognition systemsacross languages, as well as automatic prosodic labelingsystems.
This paper has two goals. First, to run an inter-tran-scriber consistency test for Catalan speech data annotatedwith the Catalan-adapted version of ToBI. Catalan hasbeen intensively analyzed from a prosodic point of viewand a full-fledged ToBI annotation proposal (Cat_ToBI)has been in place for some time now (Prieto, 2012; Prietoet al., 2009; Aguilar et al., 2009–2011). It is therefore ofconsiderable interest to subject Cat_ToBI to an inter-raterconsistency test at this point. To this end, ten transcriberslabeled prosodic events independently on a Catalan corpusof twenty sentences from four different speech styles usingthe most recent version of the Cat_ToBI system. Thetwenty sentences were extracts from recordings of a varietyof discourse types, including spontaneous speech. Thoughfavorable inter-transcriber reliability results have beenreported for ToBI-labeled corpora of mainly read speechproduced in a laboratory setting, fewer inter-transcriberreliability studies have been carried out for spontaneousspeech (e.g., Yoon et al., 2004).
The second goal of this paper is to propose a low-costprocedure to automatically obtain three types of importantinformation from an inter-transcriber consistency experi-mental test: (a) the most confusable symbols from experi-mental data; (b) the types of errors most commonlyproduced by labelers; (c) signs of insufficient pre-trainingin individual labelers. As is well known, the selection ofskilled, experienced transcribers is crucial for producing a
large database that is consistently and thus usefully labeled.The aim of the Glissando Project, which is one of the spon-sors of this research (see Section 8) is to do precisely that,i.e. to compile a Spanish/Catalan prosodic corpus enrichedwith ToBI labels, and it was regarded as essential to be ableto carry out these three tests before starting such a large-scale labeling process. It was assumed that the labels intro-duced by an unskilled labeler would differ significantlyfrom the labels introduced by a proficient labeler, and con-sequently the consistency of the final corpus would bepoor. In this paper, we review and formalize the commonlyused metrics for measuring inter-transcriber consistency,and we use multidimensional scaling to easily discriminateproficient transcribers from those that are not. Further-more, we propose a procedure to diagnose the commonmistakes of the inexpert labeler in order to advise him/her in a potential retraining process.
That said, when a transcribing system is still undergoingdevelopment, the withdrawal of unskilled labelers may notbe enough to increase consistency rates. This is because, aswe will see in this paper, even taggers who are regarded asexperts can exhibit low inter-labeler consistency rates whenthey label the same set of sentences. The reason for this isthat they apparently use different tagging criteria for someof the ToBI symbols. We will present a procedure for ana-lyzing inconsistencies that permits these situations to bepinpointed by identifying the problematic symbols thatcause these conflicts. This analysis will have an impact onthe evaluation of the ToBI system in itself.
Another source of inconsistencies is the existence ofpairs of tags, or sequences of tags that are commonly con-fused by the labelers because of their high perceptual oracoustic similarity. In (Herman and McGory, 2002) a setof transcribers are questioned about the inter-similarityof the various ToBI labels. Their answers show that, forexample, they find the pair H* and L + H* the most diffi-cult pair of symbols to separate. The identification of othereasily confused labels suggest that it might be advisable tobuild alternative reduced versions of the prosodic set oflabels. In fact, a reduction in the number of ToBI symbolshas already been shown to be effective for not only speed-ing up the manual labeling process (Syrdal et al., 2001) butalso increasing the automatic classification rates (Anantha-krishnan and Narayanan, 2008; Rangarajan Sridhar et al.,2008; Hasegawa-Johnson et al., 2005).
Thus, the overarching aim of this article is to present alanguage-independent procedure that will allow the inter-transcriber inconsistency to be computed and visualizedwhile a prosodic corpus is being labeled in order to easilyidentify, on the one hand, misuses of the conventions bytaggers, and on the other hand, the most confusablesymbols.
The paper is organized as follows: the database is pre-sented in Section 2 including a review of the Cat_ToBI sys-tem; next the experimental procedure is described with thereport of the metrics (Section 3) and the visualization tech-niques (Section 4) that have been used to present the results
D. Escudero et al. / Speech Communication 54 (2012) 566–582 567
Author's personal copy
that are reported in Section 5. We conclude with a discus-sion of the results and suggestions for future work in Sec-tions 6 and 7.
2. Methods
This section consists of a description of the speech data-base to which the analysis tools were applied. The prosodicevents were annotated within the Cat_ToBI framework.
2.1. Corpus
Twenty Central Catalan target utterances were selectedfrom different corpora so that they represented the follow-ing four different discourse types:
1. Spontaneous speech excerpted from the guided inter-view subcorpus of the Atles interactiu de l’entonacio delcatala (Prieto and Cabre, 2007),
2. Spontaneous speech excerpted from the Map Task sub-corpus of the Atles interactiu de l’entonacio del catala
(Prieto and Cabre, 2007),3. Radio news,4. Text reading (from the Festcat database Bonafonte
et al., 2008).
The full set of sentences in Catalan, together with theirEnglish translation can be found in the Appendix A. Nineout of the twenty utterances are yes-no questions or wh-questions, four are narrow focus statements and the restare broad focus statements. In total, the sentences con-tained 264 words. The duration of the 20 files is 89.8 sec-onds. The speech sources were 12 native speakers ofCentral Catalan (5 males and 7 females).
2.2. Labelers
A total of ten labelers participated in the labeling. Theywere asked to independently label audio files of the sametwenty utterances. In terms of degree of prior experiencewith prosody and Cat_ToBI some of the labelers wereabsolute beginners while others had actually contributedto the development of Cat_ToBI and were fully comfort-able with it. The labelers were divided into three groups:Group 1 (Experts), Group 2 (Familiar with the Cat_ToBIannotation system), and Group 3 (Beginners, completelynew to any model of intonation or prosodic transcription).Group 1 comprised four labelers and Groups 2 and 3 hadthree labelers each. All labelers were native speakers ofCatalan, with two dialects represented (Central Catalanand Balearic Catalan).
2.3. Transcription procedure
Following general ToBI conventions, transcribers hadto perform the following tasks:
1. Mark any syllables which carry a clear prominence, thatis, decide if there is a pitch accent.
2. If there is a pitch accent, decide the pitch accent type.3. Mark different degrees of the strength of the boundary
between two orthographic words, that is, decide thebreak index.
4. Decide the boundary tone type, according to the degreeof prosodic breaking (intermediate phrase-ip vs. intona-tional phrase-IP).
Each transcriber was provided with a document describ-ing the Cat_ToBI system (Prieto, 2012) as well as Cat_-ToBI training materials (Aguilar et al., 2009–2011). Thetraining materials contain a tutorial explaining each ofthe labels used in Cat_ToBI, along with recorded examplesof transcribed utterances. There are also exercises to prac-tice assigning the labels described in the text. These materi-als are designed to be self-explanatory. Moreover, absolutebeginners attended a course (three sessions of three hourseach) on the basics of the AM model and the ToBI labelingsystems taught by the last author of the article.
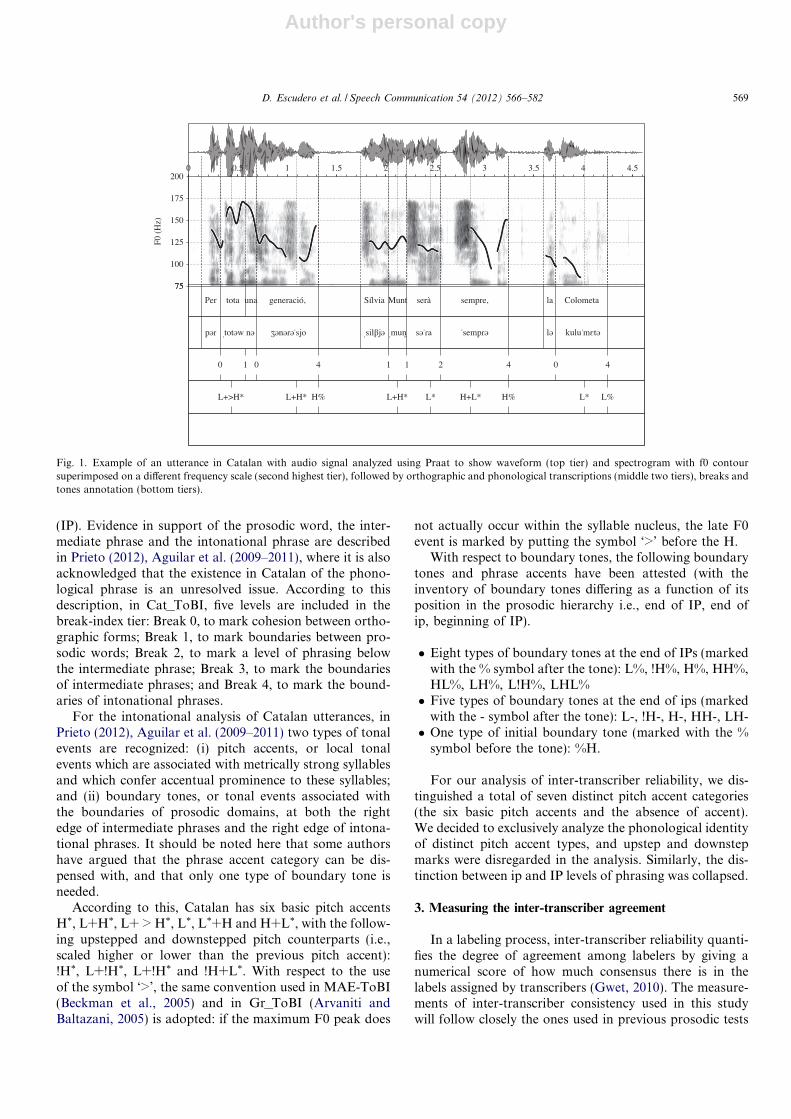
Manual annotation was performed using the Praat tool(Boersma and Weenink, 2011). The starting point was aTextGrid file (Boersma and Weenink, 2011) for each sen-tence with its orthographic and phonetic transcription,which had been performed manually on the original setof sentences. Transcribers used both the audio informationas well as the visual information (waveform, spectrogram,and F0 curve) to make labeling decisions about prosodicfeatures. The key elements to be labeled were prominence,prosodic boundary strength and pitch accent and boundarytone types. The labelers had ample time to perform the taskand could go back to revise their initial labeling. Fig. 1shows an example of the labeling procedure used, showingthe orthographic, phonetic, and Cat_ToBI prosodic tran-scription of the target sentence.
2.4. The Cat_ToBI system
The description of Catalan prosodic organization andintonation presented here is based on early work on Cata-lan within the framework of intonational phonology (Pri-eto, 2012; Prieto et al., 2009). The most updateddescription of the Cat_ToBI proposal may be found in(Prieto, 2012) and on the Cat_ToBI Training Materials
website (Aguilar et al., 2009–2011). As in other languagesanalyzed within the ToBI framework, Catalan intonationalevents are of two types, namely pitch accents (or pitchmovements that are associated with metrically strong posi-tions), and boundary tones (or tones that are anchored tophrase edges). The phrases that are marked by the place-ment of these boundary tones are an important componentof the metrical structure in the language.
As far as prosodic organization is concerned, Cat_ToBIproposes to analyze the Catalan data as having four levelsof phrasing: the prosodic word, the phonological phrase,the intermediate phrase (ip) and the intonational phrase
568 D. Escudero et al. / Speech Communication 54 (2012) 566–582
Author's personal copy
(IP). Evidence in support of the prosodic word, the inter-mediate phrase and the intonational phrase are describedin Prieto (2012), Aguilar et al. (2009–2011), where it is alsoacknowledged that the existence in Catalan of the phono-logical phrase is an unresolved issue. According to thisdescription, in Cat_ToBI, five levels are included in thebreak-index tier: Break 0, to mark cohesion between ortho-graphic forms; Break 1, to mark boundaries between pro-sodic words; Break 2, to mark a level of phrasing belowthe intermediate phrase; Break 3, to mark the boundariesof intermediate phrases; and Break 4, to mark the bound-aries of intonational phrases.
For the intonational analysis of Catalan utterances, inPrieto (2012), Aguilar et al. (2009–2011) two types of tonalevents are recognized: (i) pitch accents, or local tonalevents which are associated with metrically strong syllablesand which confer accentual prominence to these syllables;and (ii) boundary tones, or tonal events associated withthe boundaries of prosodic domains, at both the rightedge of intermediate phrases and the right edge of intona-tional phrases. It should be noted here that some authorshave argued that the phrase accent category can be dis-pensed with, and that only one type of boundary tone isneeded.
According to this, Catalan has six basic pitch accentsH*, L+H*, L+ > H*, L*, L*+H and H+L*, with the follow-ing upstepped and downstepped pitch counterparts (i.e.,scaled higher or lower than the previous pitch accent):!H*, L+!H*, L+!H* and !H+L*. With respect to the useof the symbol ‘>’, the same convention used in MAE-ToBI(Beckman et al., 2005) and in Gr_ToBI (Arvaniti andBaltazani, 2005) is adopted: if the maximum F0 peak does
not actually occur within the syllable nucleus, the late F0event is marked by putting the symbol ‘>’ before the H.
With respect to boundary tones, the following boundarytones and phrase accents have been attested (with theinventory of boundary tones differing as a function of itsposition in the prosodic hierarchy i.e., end of IP, end ofip, beginning of IP).
� Eight types of boundary tones at the end of IPs (markedwith the % symbol after the tone): L%, !H%, H%, HH%,HL%, LH%, L!H%, LHL%� Five types of boundary tones at the end of ips (marked
with the - symbol after the tone): L-, !H-, H-, HH-, LH-� One type of initial boundary tone (marked with the %
symbol before the tone): %H.
For our analysis of inter-transcriber reliability, we dis-tinguished a total of seven distinct pitch accent categories(the six basic pitch accents and the absence of accent).We decided to exclusively analyze the phonological identityof distinct pitch accent types, and upstep and downstepmarks were disregarded in the analysis. Similarly, the dis-tinction between ip and IP levels of phrasing was collapsed.
3. Measuring the inter-transcriber agreement
In a labeling process, inter-transcriber reliability quanti-fies the degree of agreement among labelers by giving anumerical score of how much consensus there is in thelabels assigned by transcribers (Gwet, 2010). The measure-ments of inter-transcriber consistency used in this studywill follow closely the ones used in previous prosodic tests
Fig. 1. Example of an utterance in Catalan with audio signal analyzed using Praat to show waveform (top tier) and spectrogram with f0 contoursuperimposed on a different frequency scale (second highest tier), followed by orthographic and phonological transcriptions (middle two tiers), breaks andtones annotation (bottom tiers).
D. Escudero et al. / Speech Communication 54 (2012) 566–582 569
Author's personal copy
to facilitate comparisons between studies. The ToBI labelsare treated as categorical data so that the most commonlyused metrics are joint agreement, kappa statistics and pair-wise transcriber agreement, which are presented in the fol-lowing sections.
3.1. Formulation
Let us refer to the prosodic events to be labeled by Ei,with i = 1, . . . ,e. Likewise, let us refer to the transcribersor labelers that participate in the tagging process by Tj,with j = 1, . . . , t. Finally, let us refer to the categories intowhich assignments are placed by Ck, with k = 1, . . . ,c ,i.e.the number of tags that can potentially be used. Ci,j 2 Ck
will be the category assigned by the labeler j to any event i.
3.2. Joint agreement
The joint agreement is the number of times each rating(i.e. the label Ck) is assigned by each labeler, divided bythe total number of ratings (Uebersax, 1987). Let nik repre-sent the number of raters who assigned the ith item to thekth category. By computing the nik values for every i anddisplaying this information for a given k the distributionof the quantity of agreement associated with each symbol,f(nk), can be visualized.
For a given k, the distribution of frequency f(nk) has adomain of values that goes from 1 to t (the 0 value isignored as it represents events where none of the t ratersassigned the symbol k). In the extreme case in which thet raters agree every time the symbol k appears, the modeof f(nk) would be t. Thus, a right mono-lobed distributionindicates a high agreement as most raters agree when theylabel the category k. Thus the closer the mode of the distri-bution is to t, the greater the consensus.
On the other hand the closer the mode of the distribu-tion f(nk) is to 1, the more problematic the symbol. In anextreme case, every time the symbol k appears, only oneof the t raters would mark it. Thus a left mono-lobed dis-tribution is evidence of low agreement, since the labelershave used this symbol rarely and without consistency. Fur-thermore, bi-lobed distributions and flat distributions indi-cate a high confusion with potential wrong tagging criteria.
We have found no reference to ToBI labeling consis-tency tests in which this metric had been used. Results inthis paper show the usefulness of this joint frequency testto evaluate differing degrees of consensus in the assignationof different labels.
3.3. Kappa statistics
Fleiss’ kappa (Fleiss, 1971) is a generalization of Scott’spi statistic (Scott, 1955), a statistical measure of inter-raterreliability. It is also related to Cohen’s kappa statistic(Cohen, 1960). Whereas Scott’s pi and Cohen’s kappawork for only two raters, Fleiss’ kappa works for any num-ber of raters, giving categorical ratings to a fixed number of
items. The kappa indices are referenced with the greek let-ter j.
The j index expresses the extent to which the observedamount of agreement among raters exceeds what wouldbe expected if all raters made their ratings completely ran-domly. The j index is computed by means of the formula:
j ¼ P o � P c
1� P c; ð1Þ
where Po is the relative observed agreement among raters,and Pc is the hypothetical probability of chance agreement,using the observed data to calculate the probabilities ofeach observer randomly saying each category. If the ratersare in complete agreement then j = 1. If there is no agree-ment among the raters (other than what would be expectedby chance) then j 6 0. The factor 1 � Pc gives the degree ofagreement that is attainable above chance, and P � Pc
gives the degree of agreement actually achieved abovechance. If the raters are in complete agreement thenj = 1. If there is no agreement among the raters (otherthan what would be expected by chance) then j 6 0.
Let nik represent the number of raters who assigned theith item to the kth category. First calculate pk as the pro-portion of all assignments which were to the kth category:
pk ¼1
e � tXe
i¼1
nik; ð2Þ
The probability of change is then computed as:P c ¼
Pck¼1pk.
Now calculate Pi, the extent to which raters agree aboutthe ith event:
P i ¼1
tðt � 1ÞXc
k¼1
nikðnik � 1Þ: ð3Þ
Now compute Po,to be entered into the formula for j:
P o ¼1
e
Xe
i¼1
P i: ð4Þ
In this paper, the function kappam.fleiss of the pack-age irr of the software R (Ihaka and Gentleman, 1996)has been used to compute the kappa index j in the differentscenarios.
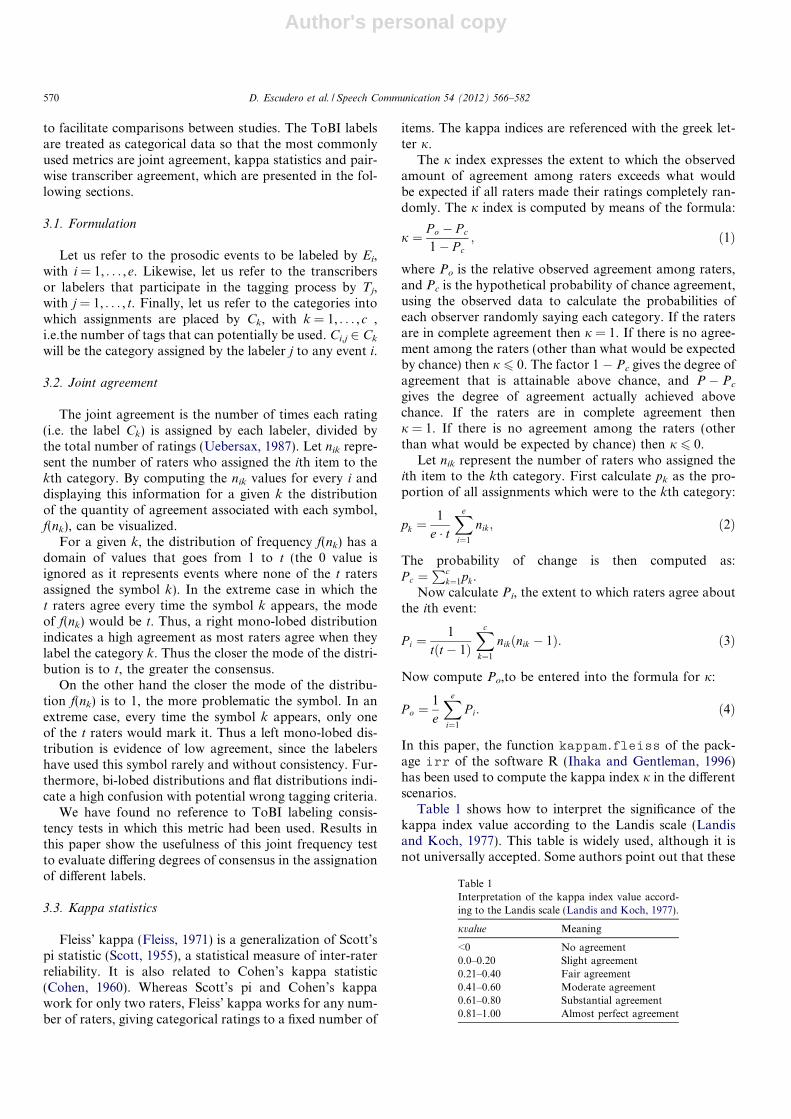
Table 1 shows how to interpret the significance of thekappa index value according to the Landis scale (Landisand Koch, 1977). This table is widely used, although it isnot universally accepted. Some authors point out that these
Table 1Interpretation of the kappa index value accord-ing to the Landis scale (Landis and Koch, 1977).
jvalue Meaning
<0 No agreement0.0–0.20 Slight agreement0.21–0.40 Fair agreement0.41–0.60 Moderate agreement0.61–0.80 Substantial agreement0.81–1.00 Almost perfect agreement
570 D. Escudero et al. / Speech Communication 54 (2012) 566–582

Author's personal copy
guidelines may be more harmful than helpful (Gwet, 2008),as the number of categories and events will affect the mag-nitude of the value: the kappa will be higher when there arefewer categories (Sim and Wright, 2005). In the context ofprosodic labeling consistency tests, this is especially impor-tant since some of the labels occur very infrequently whileother labels (or one of the labels) are very frequent.
This metric has been used in (Yoon et al., 2004) to con-trast the inter-transcriber reliability of prosodic events on asubset of the Switchboard (Godfrey et al., 1992) corpususing adapted ToBI for English. Cohen’s kappa is also pro-posed in (Syrdal and McGory, 2000) to evaluate the reli-ability among transcribers using ToBI for AmericanEnglish under relatively optimal conditions.
3.4. Pairwise transcriber agreement
Another common procedure to measure interreliabilityin prosodic labeling experiments is to count the numberof labeling agreements for all pairs of transcribers. Insteadof comparing the labels assigned by individual transcribersagainst the group, this pairwise analysis compares thelabels of each transcriber against the labels of every othertranscriber for the particular event to be analyzed. Thatis, 4 transcribers (T1, T2, T3, T4) would produce 6 possibletranscriber pairs (T1T2, T1T3, T1T4, T2T3, T2T4, T3T4),and the criterion is conservative: if 3 of 4 transcribers agree,only 3 of 6 pairs will match, making the agreement rate50% (agreement = agree/(disagree + agree)). For example,if a particular pitch accent was labeled by the first tran-scriber as H*, by the second transcriber as LH*, and bytranscribers 3 and 4, as H*, the number of transcriber pairswho agree with each other is three (T1T3, T1T4, T3T4) andthe number of transcriber pairs who disagree with eachother is also three (T1T2, T2T3, T2T4).
More formally, the set of pairs can be defined as:
Pairs ¼ fðCi;j1;Ci;j2
Þ; i ¼ 1; . . . ; e; j1; j2 ¼ 1 . . . t; j1
< j2g ð5Þ
Ci;j1and Ci;j2
being the categories assigned by the labelers j1and j2 respectively to prosodic event i. Let us call np
m;n (thesuperscript p refers to Pair) the number of times a labelertagged a given subject i with the category m and anotherdifferent labeler judged the same event to be n, formally
npm;n ¼ CardfPairsjðCi;j1
;Ci;j2¼ m; nÞ _ ðCi;j1
;Ci;j2
¼ n;mÞg: ð6Þ
The number of pairs in agreement is npA ¼
Pck¼1np
k;k and thedisagreement is np
D ¼Pc
k¼1
Pcm¼kþ1np
k;m. The pairwise tran-scriber agreement index can be computed as:
pta ¼ npA
npA þ np
D
: ð7Þ
This index has been used to assess ToBI since the seminalToBI papers (Silverman et al., 1992 and Pitrelli et al.,1994), and it is considered a reference to test the consis-
tency of other annotation systems before they can be con-sidered standard (G_ToBI in (Grice et al., 1996), Gla_ToBIin Mayo et al. (1997), K_ToBI in (Jun et al., 2000), J_ToBIin Venditti (2005)). Benefits obtained from the use of alter-native tiers for ToBI have also been evaluated with this in-dex (Brugos et al., 2008).
The pairwise transcriber agreement index has the advan-tage of permitting the consistency of every class to be ana-lyzed separately: np
m;m represents the agreement of labelerswhen the class Cm is identified. np
m;n, or npn;m represents
degree of the confusion of the symbol Cm with respect tothe symbol Cn. This information can be displayed as asquared, triangular c � c contingency table or confusionmatrix. To relate these indicators to the frequency of thesymbol, we compute:
ptam;n ¼np
m;nPck¼1np
k;m þPc
k¼1npk;n
m ¼ 1 . . . c n ¼ 1 . . . c:
ð8Þ
Confusion matrices have been used by Herman and McGo-ry (2002) and Yoon et al. (2004) to analyze the conceptualsimilarity of ToBI tones. Yoon et al. (2004) uses the confu-sion matrix in absolute terms while (Herman and McGory,2002) introduces the equations above to compare tagassignments. Herman and McGory (2002) also presentsseparate tables for each pair of labelers.
4. Visualizing the inter-transcriber confusion with
multidimensional scaling
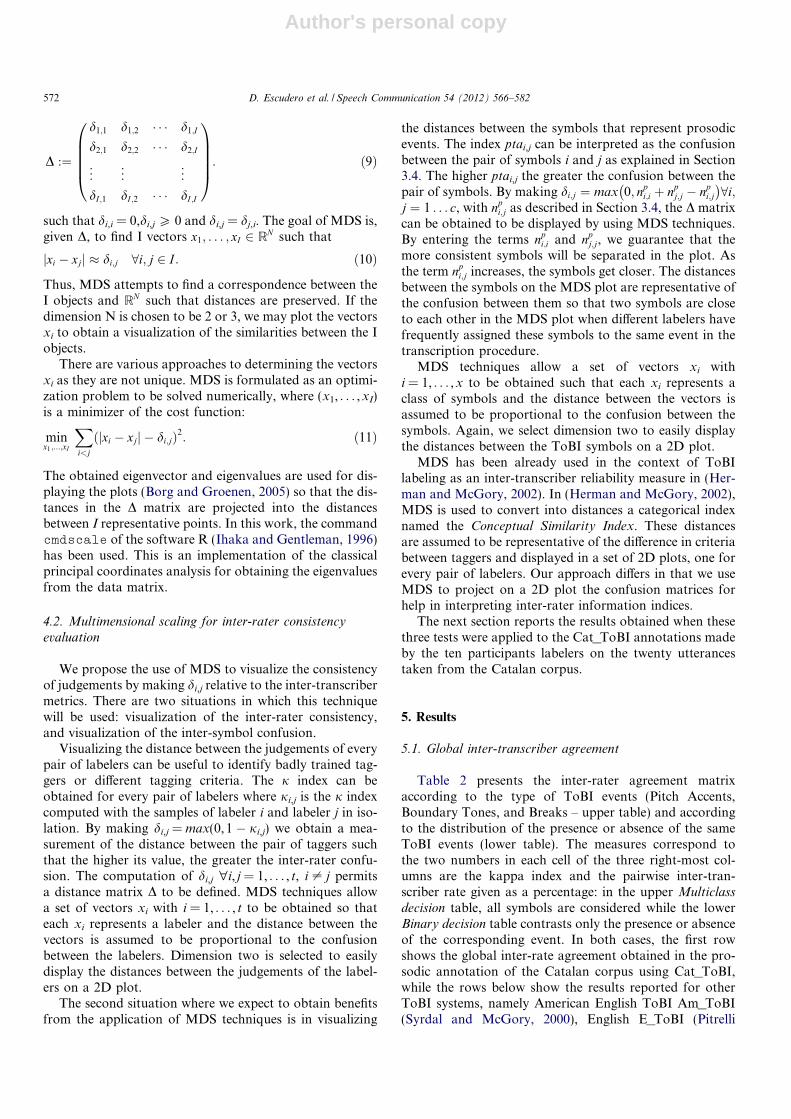
The statistics described above have been commonly usedto assess the degree of consistency in ToBI-framework sys-tems, since high consistency is a requirement of the systembefore it can be considered a standard (Ohio-State-Univer-sity, 2006). Nevertheless, the goal of this work is not to cer-tify that Cat_ToBI has achieved the needed degree ofconsensus to be accepted as a standard system of prosodicannotation. As noted above, the speech database with pro-sodic annotations described in Section 2 will be taken as asource of data to which a new procedure is applied in orderto visualize intercoder agreement and identify those sym-bols that can introduce important biases in the annotationsof projects like Glissando that involve working with largecorpora. In this section we explain how MultidimensionalScaling can be useful in this regard.
4.1. Multimensional Scaling the basis
Multidimensional scaling (MDS) is a set of related sta-tistical techniques often used in information visualizationfor exploring similarities or dissimilarities in data (Kruskaland Wish, 1978). Generally, the data to be analyzed is acollection of I objects on which a distance function isdefined, di,j = the distance between ith and jth objects.
These distances constitute the entries in the dissimilaritymatrix
D. Escudero et al. / Speech Communication 54 (2012) 566–582 571
Author's personal copy
D :¼
d1;1 d1;2 � � � d1;I
d2;1 d2;2 � � � d2;I
..
. ... ..
.
dI ;1 dI ;2 � � � dI ;I
0BBBB@
1CCCCA: ð9Þ
such that di,i = 0,di,j P 0 and di,j = dj,i. The goal of MDS is,given D, to find I vectors x1; . . . ; xI 2 RN such that
jxi � xjj � di;j 8i; j 2 I : ð10Þ
Thus, MDS attempts to find a correspondence between theI objects and RN such that distances are preserved. If thedimension N is chosen to be 2 or 3, we may plot the vectorsxi to obtain a visualization of the similarities between the Iobjects.
There are various approaches to determining the vectorsxi as they are not unique. MDS is formulated as an optimi-zation problem to be solved numerically, where (x1, . . . ,xI)is a minimizer of the cost function:
minx1;...;xI
Xi<j
ðjxi � xjj � di;jÞ2: ð11Þ
The obtained eigenvector and eigenvalues are used for dis-playing the plots (Borg and Groenen, 2005) so that the dis-tances in the D matrix are projected into the distancesbetween I representative points. In this work, the commandcmdscale of the software R (Ihaka and Gentleman, 1996)has been used. This is an implementation of the classicalprincipal coordinates analysis for obtaining the eigenvaluesfrom the data matrix.
4.2. Multimensional scaling for inter-rater consistency
evaluation
We propose the use of MDS to visualize the consistencyof judgements by making di,j relative to the inter-transcribermetrics. There are two situations in which this techniquewill be used: visualization of the inter-rater consistency,and visualization of the inter-symbol confusion.
Visualizing the distance between the judgements of everypair of labelers can be useful to identify badly trained tag-gers or different tagging criteria. The j index can beobtained for every pair of labelers where ji,j is the j indexcomputed with the samples of labeler i and labeler j in iso-lation. By making di,j = max(0, 1 � ji,j) we obtain a mea-surement of the distance between the pair of taggers suchthat the higher its value, the greater the inter-rater confu-sion. The computation of di,j "i, j = 1, . . . , t, i – j permitsa distance matrix D to be defined. MDS techniques allowa set of vectors xi with i = 1, . . . , t to be obtained so thateach xi represents a labeler and the distance between thevectors is assumed to be proportional to the confusionbetween the labelers. Dimension two is selected to easilydisplay the distances between the judgements of the label-ers on a 2D plot.
The second situation where we expect to obtain benefitsfrom the application of MDS techniques is in visualizing
the distances between the symbols that represent prosodicevents. The index ptai,j can be interpreted as the confusionbetween the pair of symbols i and j as explained in Section3.4. The higher ptai,j the greater the confusion between thepair of symbols. By making di;j ¼ max 0; np
i;i þ npj;j � np
i;j
� �8i;
j ¼ 1 . . . c, with npi;j as described in Section 3.4, the D matrix
can be obtained to be displayed by using MDS techniques.By entering the terms np
i;i and npj;j, we guarantee that the
more consistent symbols will be separated in the plot. Asthe term np
i;j increases, the symbols get closer. The distancesbetween the symbols on the MDS plot are representative ofthe confusion between them so that two symbols are closeto each other in the MDS plot when different labelers havefrequently assigned these symbols to the same event in thetranscription procedure.
MDS techniques allow a set of vectors xi withi = 1, . . . ,x to be obtained such that each xi represents aclass of symbols and the distance between the vectors isassumed to be proportional to the confusion between thesymbols. Again, we select dimension two to easily displaythe distances between the ToBI symbols on a 2D plot.
MDS has been already used in the context of ToBIlabeling as an inter-transcriber reliability measure in (Her-man and McGory, 2002). In (Herman and McGory, 2002),MDS is used to convert into distances a categorical indexnamed the Conceptual Similarity Index. These distancesare assumed to be representative of the difference in criteriabetween taggers and displayed in a set of 2D plots, one forevery pair of labelers. Our approach differs in that we useMDS to project on a 2D plot the confusion matrices forhelp in interpreting inter-rater information indices.
The next section reports the results obtained when thesethree tests were applied to the Cat_ToBI annotations madeby the ten participants labelers on the twenty utterancestaken from the Catalan corpus.
5. Results
5.1. Global inter-transcriber agreement
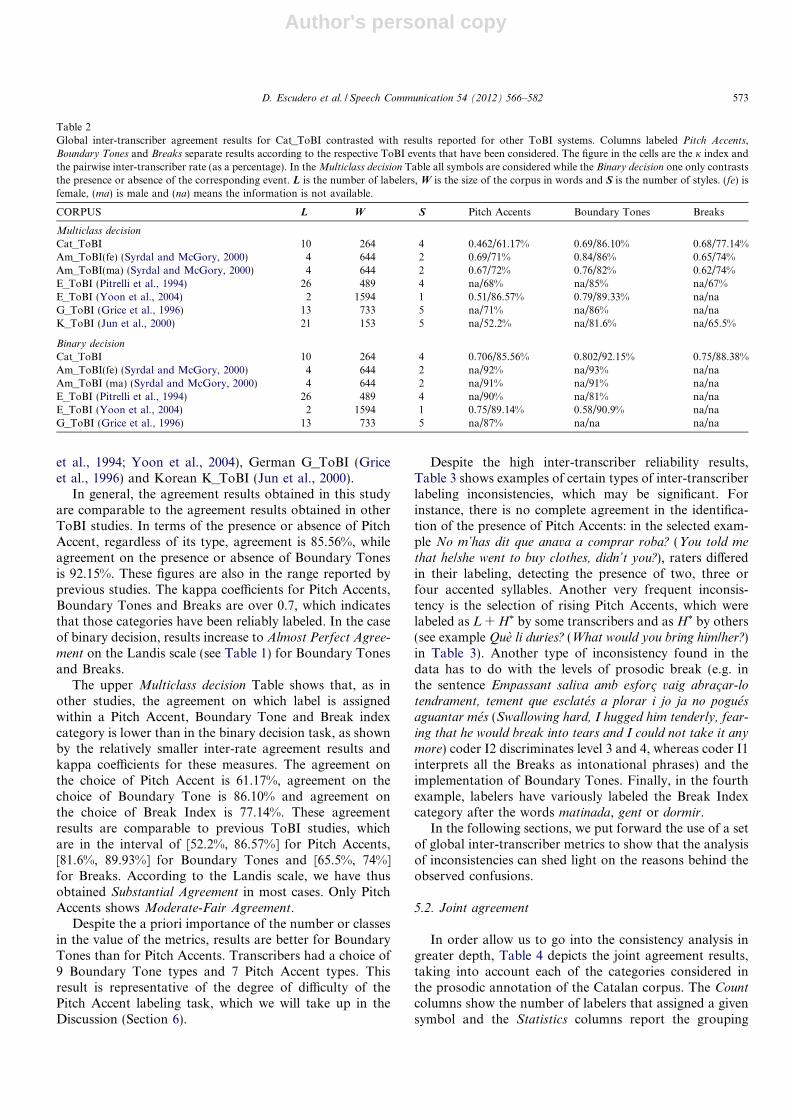
Table 2 presents the inter-rater agreement matrixaccording to the type of ToBI events (Pitch Accents,Boundary Tones, and Breaks – upper table) and accordingto the distribution of the presence or absence of the sameToBI events (lower table). The measures correspond tothe two numbers in each cell of the three right-most col-umns are the kappa index and the pairwise inter-tran-scriber rate given as a percentage: in the upper Multiclass
decision table, all symbols are considered while the lowerBinary decision table contrasts only the presence or absenceof the corresponding event. In both cases, the first rowshows the global inter-rate agreement obtained in the pro-sodic annotation of the Catalan corpus using Cat_ToBI,while the rows below show the results reported for otherToBI systems, namely American English ToBI Am_ToBI(Syrdal and McGory, 2000), English E_ToBI (Pitrelli
572 D. Escudero et al. / Speech Communication 54 (2012) 566–582
Author's personal copy
et al., 1994; Yoon et al., 2004), German G_ToBI (Griceet al., 1996) and Korean K_ToBI (Jun et al., 2000).
In general, the agreement results obtained in this studyare comparable to the agreement results obtained in otherToBI studies. In terms of the presence or absence of PitchAccent, regardless of its type, agreement is 85.56%, whileagreement on the presence or absence of Boundary Tonesis 92.15%. These figures are also in the range reported byprevious studies. The kappa coefficients for Pitch Accents,Boundary Tones and Breaks are over 0.7, which indicatesthat those categories have been reliably labeled. In the caseof binary decision, results increase to Almost Perfect Agree-
ment on the Landis scale (see Table 1) for Boundary Tonesand Breaks.
The upper Multiclass decision Table shows that, as inother studies, the agreement on which label is assignedwithin a Pitch Accent, Boundary Tone and Break indexcategory is lower than in the binary decision task, as shownby the relatively smaller inter-rate agreement results andkappa coefficients for these measures. The agreement onthe choice of Pitch Accent is 61.17%, agreement on thechoice of Boundary Tone is 86.10% and agreement onthe choice of Break Index is 77.14%. These agreementresults are comparable to previous ToBI studies, whichare in the interval of [52.2%, 86.57%] for Pitch Accents,[81.6%, 89.93%] for Boundary Tones and [65.5%, 74%]for Breaks. According to the Landis scale, we have thusobtained Substantial Agreement in most cases. Only PitchAccents shows Moderate-Fair Agreement.
Despite the a priori importance of the number or classesin the value of the metrics, results are better for BoundaryTones than for Pitch Accents. Transcribers had a choice of9 Boundary Tone types and 7 Pitch Accent types. Thisresult is representative of the degree of difficulty of thePitch Accent labeling task, which we will take up in theDiscussion (Section 6).
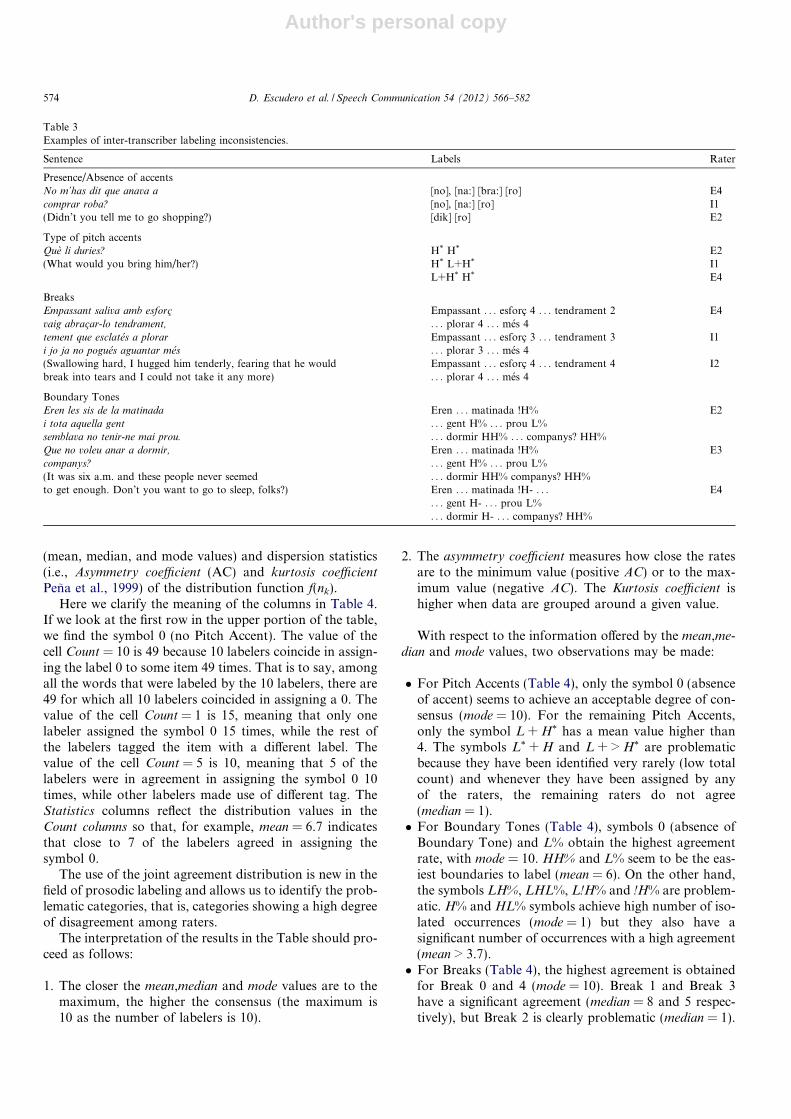
Despite the high inter-transcriber reliability results,Table 3 shows examples of certain types of inter-transcriberlabeling inconsistencies, which may be significant. Forinstance, there is no complete agreement in the identifica-tion of the presence of Pitch Accents: in the selected exam-ple No m’has dit que anava a comprar roba? (You told me
that he/she went to buy clothes, didn’t you?), raters differedin their labeling, detecting the presence of two, three orfour accented syllables. Another very frequent inconsis-tency is the selection of rising Pitch Accents, which werelabeled as L + H* by some transcribers and as H* by others(see example Que li duries? (What would you bring him/her?)in Table 3). Another type of inconsistency found in thedata has to do with the levels of prosodic break (e.g. inthe sentence Empassant saliva amb esforc� vaig abrac�ar-lo
tendrament, tement que esclates a plorar i jo ja no pogues
aguantar mes (Swallowing hard, I hugged him tenderly, fear-
ing that he would break into tears and I could not take it anymore) coder I2 discriminates level 3 and 4, whereas coder I1interprets all the Breaks as intonational phrases) and theimplementation of Boundary Tones. Finally, in the fourthexample, labelers have variously labeled the Break Indexcategory after the words matinada, gent or dormir.
In the following sections, we put forward the use of a setof global inter-transcriber metrics to show that the analysisof inconsistencies can shed light on the reasons behind theobserved confusions.
5.2. Joint agreement
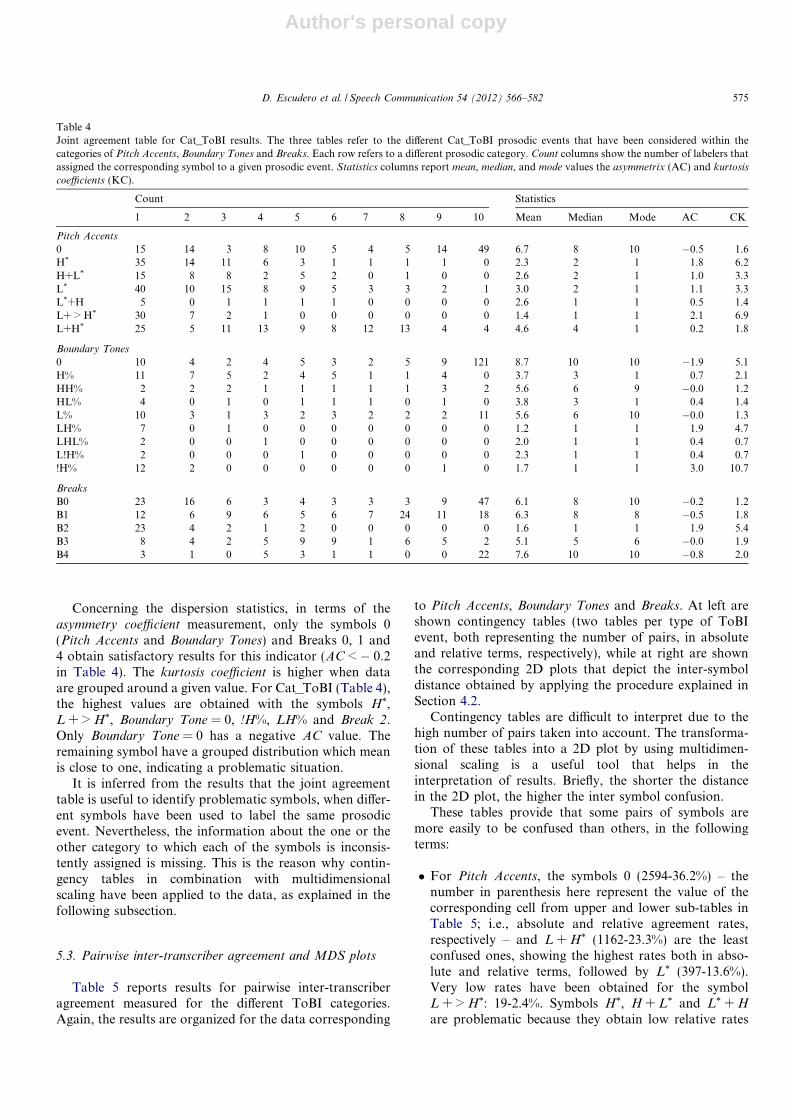
In order allow us to go into the consistency analysis ingreater depth, Table 4 depicts the joint agreement results,taking into account each of the categories considered inthe prosodic annotation of the Catalan corpus. The Countcolumns show the number of labelers that assigned a givensymbol and the Statistics columns report the grouping
Table 2Global inter-transcriber agreement results for Cat_ToBI contrasted with results reported for other ToBI systems. Columns labeled Pitch Accents,Boundary Tones and Breaks separate results according to the respective ToBI events that have been considered. The figure in the cells are the j index andthe pairwise inter-transcriber rate (as a percentage). In the Multiclass decision Table all symbols are considered while the Binary decision one only contraststhe presence or absence of the corresponding event. L is the number of labelers, W is the size of the corpus in words and S is the number of styles. (fe) isfemale, (ma) is male and (na) means the information is not available.
CORPUS L W S Pitch Accents Boundary Tones Breaks
Multiclass decision
Cat_ToBI 10 264 4 0.462/61.17% 0.69/86.10% 0.68/77.14%Am_ToBI(fe) (Syrdal and McGory, 2000) 4 644 2 0.69/71% 0.84/86% 0.65/74%Am_ToBI(ma) (Syrdal and McGory, 2000) 4 644 2 0.67/72% 0.76/82% 0.62/74%E_ToBI (Pitrelli et al., 1994) 26 489 4 na/68% na/85% na/67%E_ToBI (Yoon et al., 2004) 2 1594 1 0.51/86.57% 0.79/89.33% na/naG_ToBI (Grice et al., 1996) 13 733 5 na/71% na/86% na/naK_ToBI (Jun et al., 2000) 21 153 5 na/52.2% na/81.6% na/65.5%
Binary decision
Cat_ToBI 10 264 4 0.706/85.56% 0.802/92.15% 0.75/88.38%Am_ToBI(fe) (Syrdal and McGory, 2000) 4 644 2 na/92% na/93% na/naAm_ToBI (ma) (Syrdal and McGory, 2000) 4 644 2 na/91% na/91% na/naE_ToBI (Pitrelli et al., 1994) 26 489 4 na/90% na/81% na/naE_ToBI (Yoon et al., 2004) 2 1594 1 0.75/89.14% 0.58/90.9% na/naG_ToBI (Grice et al., 1996) 13 733 5 na/87% na/na na/na
D. Escudero et al. / Speech Communication 54 (2012) 566–582 573
Author's personal copy
(mean, median, and mode values) and dispersion statistics(i.e., Asymmetry coefficient (AC) and kurtosis coefficient
Pena et al., 1999) of the distribution function f(nk).Here we clarify the meaning of the columns in Table 4.
If we look at the first row in the upper portion of the table,we find the symbol 0 (no Pitch Accent). The value of thecell Count = 10 is 49 because 10 labelers coincide in assign-ing the label 0 to some item 49 times. That is to say, amongall the words that were labeled by the 10 labelers, there are49 for which all 10 labelers coincided in assigning a 0. Thevalue of the cell Count = 1 is 15, meaning that only onelabeler assigned the symbol 0 15 times, while the rest ofthe labelers tagged the item with a different label. Thevalue of the cell Count = 5 is 10, meaning that 5 of thelabelers were in agreement in assigning the symbol 0 10times, while other labelers made use of different tag. TheStatistics columns reflect the distribution values in theCount columns so that, for example, mean = 6.7 indicatesthat close to 7 of the labelers agreed in assigning thesymbol 0.
The use of the joint agreement distribution is new in thefield of prosodic labeling and allows us to identify the prob-lematic categories, that is, categories showing a high degreeof disagreement among raters.
The interpretation of the results in the Table should pro-ceed as follows:
1. The closer the mean,median and mode values are to themaximum, the higher the consensus (the maximum is10 as the number of labelers is 10).
2. The asymmetry coefficient measures how close the ratesare to the minimum value (positive AC) or to the max-imum value (negative AC). The Kurtosis coefficient ishigher when data are grouped around a given value.
With respect to the information offered by the mean,me-
dian and mode values, two observations may be made:
� For Pitch Accents (Table 4), only the symbol 0 (absenceof accent) seems to achieve an acceptable degree of con-sensus (mode = 10). For the remaining Pitch Accents,only the symbol L + H* has a mean value higher than4. The symbols L* + H and L + > H* are problematicbecause they have been identified very rarely (low totalcount) and whenever they have been assigned by anyof the raters, the remaining raters do not agree(median = 1).� For Boundary Tones (Table 4), symbols 0 (absence of
Boundary Tone) and L% obtain the highest agreementrate, with mode = 10. HH% and L% seem to be the eas-iest boundaries to label (mean = 6). On the other hand,the symbols LH%, LHL%, L!H% and !H% are problem-atic. H% and HL% symbols achieve high number of iso-lated occurrences (mode = 1) but they also have asignificant number of occurrences with a high agreement(mean > 3.7).� For Breaks (Table 4), the highest agreement is obtained
for Break 0 and 4 (mode = 10). Break 1 and Break 3have a significant agreement (median = 8 and 5 respec-tively), but Break 2 is clearly problematic (median = 1).
Table 3Examples of inter-transcriber labeling inconsistencies.
Sentence Labels Rater
Presence/Absence of accentsNo m’has dit que anava a [no], [na:] [bra:] [ro] E4comprar roba? [no], [na:] [ro] I1(Didn’t you tell me to go shopping?) [dik] [ro] E2
Type of pitch accentsQue li duries? H* H* E2(What would you bring him/her?) H* L+H* I1
L+H* H* E4
BreaksEmpassant saliva amb esforc� Empassant . . . esforc� 4 . . . tendrament 2 E4vaig abrac�ar-lo tendrament, . . . plorar 4 . . . mes 4tement que esclates a plorar Empassant . . . esforc� 3 . . . tendrament 3 I1i jo ja no pogues aguantar mes . . . plorar 3 . . . mes 4(Swallowing hard, I hugged him tenderly, fearing that he would Empassant . . . esforc� 4 . . . tendrament 4 I2break into tears and I could not take it any more) . . . plorar 4 . . . mes 4
Boundary TonesEren les sis de la matinada Eren . . . matinada !H% E2i tota aquella gent . . . gent H% . . . prou L%semblava no tenir-ne mai prou. . . . dormir HH% . . . companys? HH%Que no voleu anar a dormir, Eren . . . matinada !H% E3companys? . . . gent H% . . . prou L%(It was six a.m. and these people never seemed . . . dormir HH% companys? HH%to get enough. Don’t you want to go to sleep, folks?) Eren . . . matinada !H- . . . E4
. . . gent H- . . . prou L%
. . . dormir H- . . . companys? HH%
574 D. Escudero et al. / Speech Communication 54 (2012) 566–582
Author's personal copy
Concerning the dispersion statistics, in terms of theasymmetry coefficient measurement, only the symbols 0(Pitch Accents and Boundary Tones) and Breaks 0, 1 and4 obtain satisfactory results for this indicator (AC < � 0.2in Table 4). The kurtosis coefficient is higher when dataare grouped around a given value. For Cat_ToBI (Table 4),the highest values are obtained with the symbols H*,L + > H*, Boundary Tone = 0, !H%, LH% and Break 2.Only Boundary Tone = 0 has a negative AC value. Theremaining symbol have a grouped distribution which meanis close to one, indicating a problematic situation.
It is inferred from the results that the joint agreementtable is useful to identify problematic symbols, when differ-ent symbols have been used to label the same prosodicevent. Nevertheless, the information about the one or theother category to which each of the symbols is inconsis-tently assigned is missing. This is the reason why contin-gency tables in combination with multidimensionalscaling have been applied to the data, as explained in thefollowing subsection.
5.3. Pairwise inter-transcriber agreement and MDS plots
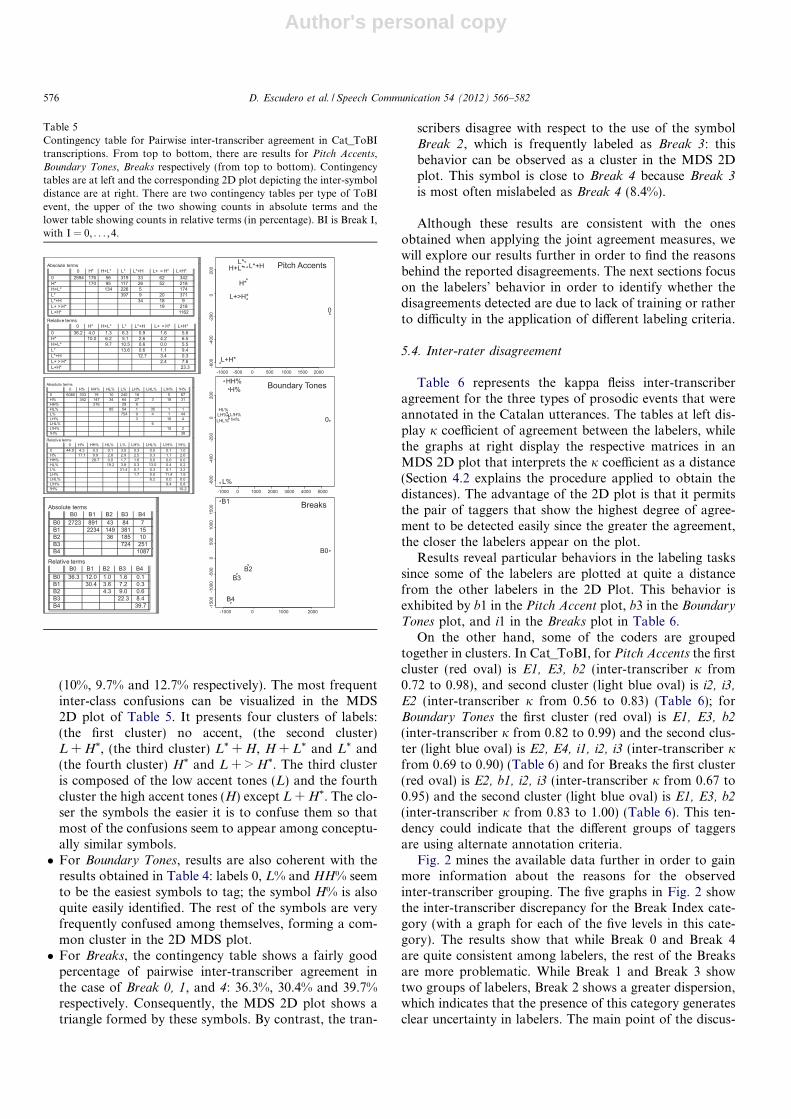
Table 5 reports results for pairwise inter-transcriberagreement measured for the different ToBI categories.Again, the results are organized for the data corresponding
to Pitch Accents, Boundary Tones and Breaks. At left areshown contingency tables (two tables per type of ToBIevent, both representing the number of pairs, in absoluteand relative terms, respectively), while at right are shownthe corresponding 2D plots that depict the inter-symboldistance obtained by applying the procedure explained inSection 4.2.
Contingency tables are difficult to interpret due to thehigh number of pairs taken into account. The transforma-tion of these tables into a 2D plot by using multidimen-sional scaling is a useful tool that helps in theinterpretation of results. Briefly, the shorter the distancein the 2D plot, the higher the inter symbol confusion.
These tables provide that some pairs of symbols aremore easily to be confused than others, in the followingterms:
� For Pitch Accents, the symbols 0 (2594-36.2%) – thenumber in parenthesis here represent the value of thecorresponding cell from upper and lower sub-tables inTable 5; i.e., absolute and relative agreement rates,respectively – and L + H* (1162-23.3%) are the leastconfused ones, showing the highest rates both in abso-lute and relative terms, followed by L* (397-13.6%).Very low rates have been obtained for the symbolL + > H*: 19-2.4%. Symbols H*, H + L* and L* + H
are problematic because they obtain low relative rates
Table 4Joint agreement table for Cat_ToBI results. The three tables refer to the different Cat_ToBI prosodic events that have been considered within thecategories of Pitch Accents, Boundary Tones and Breaks. Each row refers to a different prosodic category. Count columns show the number of labelers thatassigned the corresponding symbol to a given prosodic event. Statistics columns report mean, median, and mode values the asymmetrix (AC) and kurtosis
coefficients (KC).
Count Statistics
1 2 3 4 5 6 7 8 9 10 Mean Median Mode AC CK
Pitch Accents
0 15 14 3 8 10 5 4 5 14 49 6.7 8 10 �0.5 1.6H* 35 14 11 6 3 1 1 1 1 0 2.3 2 1 1.8 6.2H+L* 15 8 8 2 5 2 0 1 0 0 2.6 2 1 1.0 3.3L* 40 10 15 8 9 5 3 3 2 1 3.0 2 1 1.1 3.3L*+H 5 0 1 1 1 1 0 0 0 0 2.6 1 1 0.5 1.4L+ > H* 30 7 2 1 0 0 0 0 0 0 1.4 1 1 2.1 6.9L+H* 25 5 11 13 9 8 12 13 4 4 4.6 4 1 0.2 1.8
Boundary Tones
0 10 4 2 4 5 3 2 5 9 121 8.7 10 10 �1.9 5.1H% 11 7 5 2 4 5 1 1 4 0 3.7 3 1 0.7 2.1HH% 2 2 2 1 1 1 1 1 3 2 5.6 6 9 �0.0 1.2HL% 4 0 1 0 1 1 1 0 1 0 3.8 3 1 0.4 1.4L% 10 3 1 3 2 3 2 2 2 11 5.6 6 10 �0.0 1.3LH% 7 0 1 0 0 0 0 0 0 0 1.2 1 1 1.9 4.7LHL% 2 0 0 1 0 0 0 0 0 0 2.0 1 1 0.4 0.7L!H% 2 0 0 0 1 0 0 0 0 0 2.3 1 1 0.4 0.7!H% 12 2 0 0 0 0 0 0 1 0 1.7 1 1 3.0 10.7
Breaks
B0 23 16 6 3 4 3 3 3 9 47 6.1 8 10 �0.2 1.2B1 12 6 9 6 5 6 7 24 11 18 6.3 8 8 �0.5 1.8B2 23 4 2 1 2 0 0 0 0 0 1.6 1 1 1.9 5.4B3 8 4 2 5 9 9 1 6 5 2 5.1 5 6 �0.0 1.9B4 3 1 0 5 3 1 1 0 0 22 7.6 10 10 �0.8 2.0
D. Escudero et al. / Speech Communication 54 (2012) 566–582 575
Author's personal copy
(10%, 9.7% and 12.7% respectively). The most frequentinter-class confusions can be visualized in the MDS2D plot of Table 5. It presents four clusters of labels:(the first cluster) no accent, (the second cluster)L + H*, (the third cluster) L* + H, H + L* and L* and(the fourth cluster) H* and L + > H*. The third clusteris composed of the low accent tones (L) and the fourthcluster the high accent tones (H) except L + H*. The clo-ser the symbols the easier it is to confuse them so thatmost of the confusions seem to appear among conceptu-ally similar symbols.� For Boundary Tones, results are also coherent with the
results obtained in Table 4: labels 0, L% and HH% seemto be the easiest symbols to tag; the symbol H% is alsoquite easily identified. The rest of the symbols are veryfrequently confused among themselves, forming a com-mon cluster in the 2D MDS plot.� For Breaks, the contingency table shows a fairly good
percentage of pairwise inter-transcriber agreement inthe case of Break 0, 1, and 4: 36.3%, 30.4% and 39.7%respectively. Consequently, the MDS 2D plot shows atriangle formed by these symbols. By contrast, the tran-
scribers disagree with respect to the use of the symbolBreak 2, which is frequently labeled as Break 3: thisbehavior can be observed as a cluster in the MDS 2Dplot. This symbol is close to Break 4 because Break 3
is most often mislabeled as Break 4 (8.4%).
Although these results are consistent with the onesobtained when applying the joint agreement measures, wewill explore our results further in order to find the reasonsbehind the reported disagreements. The next sections focuson the labelers’ behavior in order to identify whether thedisagreements detected are due to lack of training or ratherto difficulty in the application of different labeling criteria.
5.4. Inter-rater disagreement
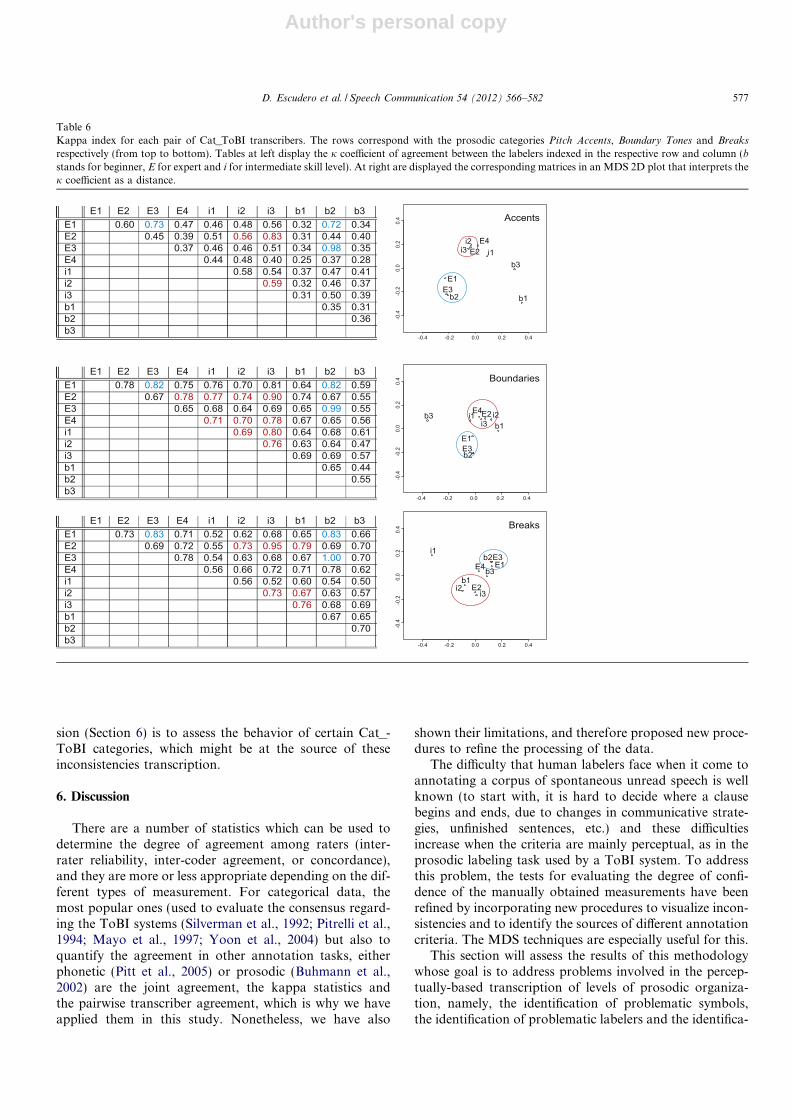
Table 6 represents the kappa fleiss inter-transcriberagreement for the three types of prosodic events that wereannotated in the Catalan utterances. The tables at left dis-play j coefficient of agreement between the labelers, whilethe graphs at right display the respective matrices in anMDS 2D plot that interprets the j coefficient as a distance(Section 4.2 explains the procedure applied to obtain thedistances). The advantage of the 2D plot is that it permitsthe pair of taggers that show the highest degree of agree-ment to be detected easily since the greater the agreement,the closer the labelers appear on the plot.
Results reveal particular behaviors in the labeling taskssince some of the labelers are plotted at quite a distancefrom the other labelers in the 2D Plot. This behavior isexhibited by b1 in the Pitch Accent plot, b3 in the BoundaryTones plot, and i1 in the Breaks plot in Table 6.
On the other hand, some of the coders are groupedtogether in clusters. In Cat_ToBI, for Pitch Accents the firstcluster (red oval) is E1, E3, b2 (inter-transcriber j from0.72 to 0.98), and second cluster (light blue oval) is i2, i3,
E2 (inter-transcriber j from 0.56 to 0.83) (Table 6); forBoundary Tones the first cluster (red oval) is E1, E3, b2
(inter-transcriber j from 0.82 to 0.99) and the second clus-ter (light blue oval) is E2, E4, i1, i2, i3 (inter-transcriber jfrom 0.69 to 0.90) (Table 6) and for Breaks the first cluster(red oval) is E2, b1, i2, i3 (inter-transcriber j from 0.67 to0.95) and the second cluster (light blue oval) is E1, E3, b2
(inter-transcriber j from 0.83 to 1.00) (Table 6). This ten-dency could indicate that the different groups of taggersare using alternate annotation criteria.
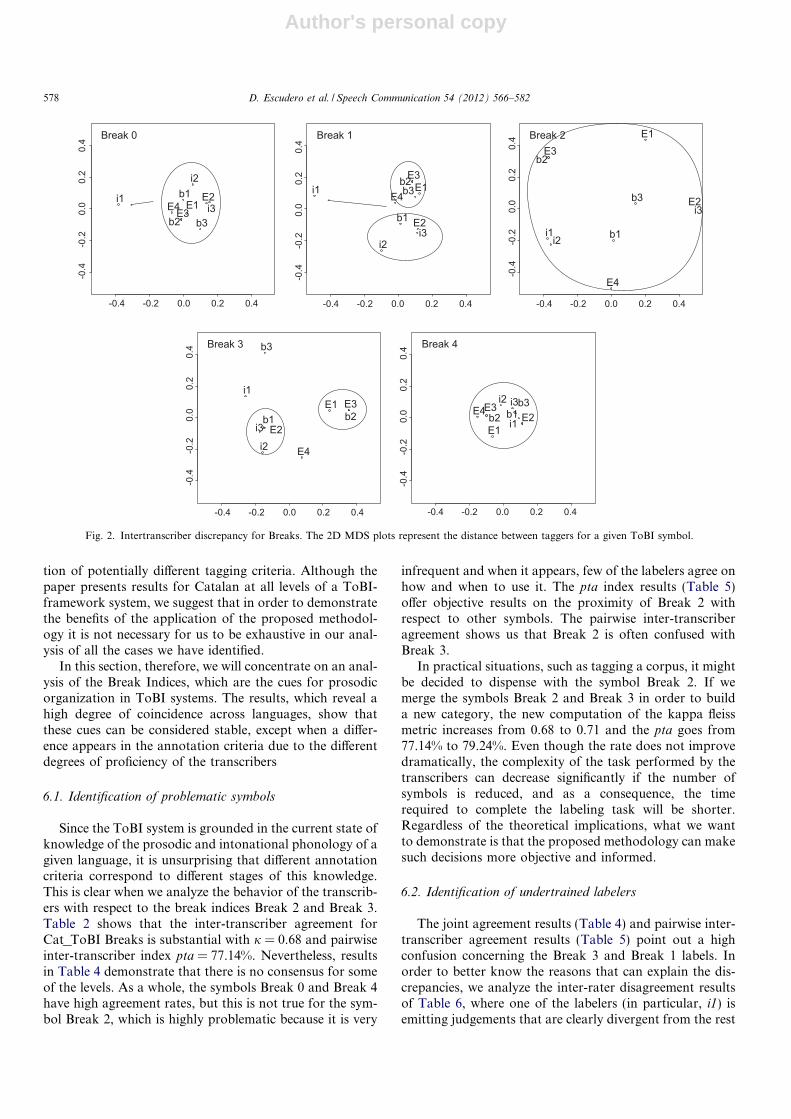
Fig. 2 mines the available data further in order to gainmore information about the reasons for the observedinter-transcriber grouping. The five graphs in Fig. 2 showthe inter-transcriber discrepancy for the Break Index cate-gory (with a graph for each of the five levels in this cate-gory). The results show that while Break 0 and Break 4are quite consistent among labelers, the rest of the Breaksare more problematic. While Break 1 and Break 3 showtwo groups of labelers, Break 2 shows a greater dispersion,which indicates that the presence of this category generatesclear uncertainty in labelers. The main point of the discus-
Table 5Contingency table for Pairwise inter-transcriber agreement in Cat_ToBItranscriptions. From top to bottom, there are results for Pitch Accents,Boundary Tones, Breaks respectively (from top to bottom). Contingencytables are at left and the corresponding 2D plot depicting the inter-symboldistance are at right. There are two contingency tables per type of ToBIevent, the upper of the two showing counts in absolute terms and thelower table showing counts in relative terms (in percentage). BI is Break I,with I = 0, . . . ,4.
Absolute terms0 H* H+L* L* L*+H L+ > H* L+H*
0 2594 176 56 319 33 62 342H* 170 95 117 26 52 218H+L* 134 226 5 174L* 397 9 20 371L*+H 34 18 9L+ > H* 19 218L+H* 1162
Relative terms0 H* H+L* L* L*+H L+ > H* L+H*
0 36.2 4.0 1.3 6.3 0.9 1.6 5.6H* 10.0 6.2 5.1 2.6 4.2 6.5H+L* 9.7 10.5 0.6 0.0 5.5L* 13.6 0.6 1.1 9.4L*+H 12.7 3.4 0.3L+ > H* 2.4 7.6L+H* 23.3
-1000 -500 0 500 1000 1500 2000
-600
-400
-200
0200
0
H*
H+L*L* L*+H
L+>H*
L+H*
Pitch Accents
Absolute terms0 H% HH% HL% L% LH% LHL% L!H% !H%
0 6080 333 19 10 240 18 5 67H% 342 147 34 64 27 3 18 31HH% 276 29 9HL% 85 54 1 35 1 1L% 754 9 4 1 44LH% 3 16 4LHL% 6L!H% 10 2!H% 38
Relative terms0 H% HH% HL% L% LH% LHL% L!H% !H%
0 44.9 4.3 0.3 0.1 3.0 0.3 0.0 0.1 1.0H% 17.1 9.9 2.8 2.9 2.5 0.3 1.7 2.6HH% 28.7 0.0 1.7 1.6 0.0 0.0 0.0HL% 19.2 3.8 0.3 13.0 0.4 0.2L% 31.4 0.7 0.3 0.1 3.2LH% 1.7 0.0 11.4 1.5LHL% 6.2 0.0 0.0L!H% 9.4 0.8!H% 10.2 -1000 0 1000 2000 3000 4000 5000
-600
-400
-200
0200
0
H%HH%
HL%
L%
LH%LHL%
L!H%!H%
Boundary Tones
Absolute termsB0 B1 B2 B3 B4
B0 2723 891 43 84 7B1 2234 149 381 15B2 36 185 10B3 724 251B4 1087
Relative termsB0 B1 B2 B3 B4
B0 36.3 12.0 1.0 1.6 0.1B1 30.4 3.6 7.2 0.3B2 4.3 9.0 0.6B3 22.3 8.4B4 39.7
-1000 0 1000 2000
-1500-1000
-500
0500
1000
1500
B0
B1
B2B3
B4
Breaks
576 D. Escudero et al. / Speech Communication 54 (2012) 566–582
Author's personal copy
sion (Section 6) is to assess the behavior of certain Cat_-ToBI categories, which might be at the source of theseinconsistencies transcription.
6. Discussion
There are a number of statistics which can be used todetermine the degree of agreement among raters (inter-rater reliability, inter-coder agreement, or concordance),and they are more or less appropriate depending on the dif-ferent types of measurement. For categorical data, themost popular ones (used to evaluate the consensus regard-ing the ToBI systems (Silverman et al., 1992; Pitrelli et al.,1994; Mayo et al., 1997; Yoon et al., 2004) but also toquantify the agreement in other annotation tasks, eitherphonetic (Pitt et al., 2005) or prosodic (Buhmann et al.,2002) are the joint agreement, the kappa statistics andthe pairwise transcriber agreement, which is why we haveapplied them in this study. Nonetheless, we have also
shown their limitations, and therefore proposed new proce-dures to refine the processing of the data.
The difficulty that human labelers face when it come toannotating a corpus of spontaneous unread speech is wellknown (to start with, it is hard to decide where a clausebegins and ends, due to changes in communicative strate-gies, unfinished sentences, etc.) and these difficultiesincrease when the criteria are mainly perceptual, as in theprosodic labeling task used by a ToBI system. To addressthis problem, the tests for evaluating the degree of confi-dence of the manually obtained measurements have beenrefined by incorporating new procedures to visualize incon-sistencies and to identify the sources of different annotationcriteria. The MDS techniques are especially useful for this.
This section will assess the results of this methodologywhose goal is to address problems involved in the percep-tually-based transcription of levels of prosodic organiza-tion, namely, the identification of problematic symbols,the identification of problematic labelers and the identifica-
Table 6Kappa index for each pair of Cat_ToBI transcribers. The rows correspond with the prosodic categories Pitch Accents, Boundary Tones and Breaks
respectively (from top to bottom). Tables at left display the j coefficient of agreement between the labelers indexed in the respective row and column (bstands for beginner, E for expert and i for intermediate skill level). At right are displayed the corresponding matrices in an MDS 2D plot that interprets thej coefficient as a distance.
D. Escudero et al. / Speech Communication 54 (2012) 566–582 577
Author's personal copy
tion of potentially different tagging criteria. Although thepaper presents results for Catalan at all levels of a ToBI-framework system, we suggest that in order to demonstratethe benefits of the application of the proposed methodol-ogy it is not necessary for us to be exhaustive in our anal-ysis of all the cases we have identified.
In this section, therefore, we will concentrate on an anal-ysis of the Break Indices, which are the cues for prosodicorganization in ToBI systems. The results, which reveal ahigh degree of coincidence across languages, show thatthese cues can be considered stable, except when a differ-ence appears in the annotation criteria due to the differentdegrees of proficiency of the transcribers
6.1. Identification of problematic symbols
Since the ToBI system is grounded in the current state ofknowledge of the prosodic and intonational phonology of agiven language, it is unsurprising that different annotationcriteria correspond to different stages of this knowledge.This is clear when we analyze the behavior of the transcrib-ers with respect to the break indices Break 2 and Break 3.Table 2 shows that the inter-transcriber agreement forCat_ToBI Breaks is substantial with j = 0.68 and pairwiseinter-transcriber index pta = 77.14%. Nevertheless, resultsin Table 4 demonstrate that there is no consensus for someof the levels. As a whole, the symbols Break 0 and Break 4have high agreement rates, but this is not true for the sym-bol Break 2, which is highly problematic because it is very
infrequent and when it appears, few of the labelers agree onhow and when to use it. The pta index results (Table 5)offer objective results on the proximity of Break 2 withrespect to other symbols. The pairwise inter-transcriberagreement shows us that Break 2 is often confused withBreak 3.
In practical situations, such as tagging a corpus, it mightbe decided to dispense with the symbol Break 2. If wemerge the symbols Break 2 and Break 3 in order to builda new category, the new computation of the kappa fleissmetric increases from 0.68 to 0.71 and the pta goes from77.14% to 79.24%. Even though the rate does not improvedramatically, the complexity of the task performed by thetranscribers can decrease significantly if the number ofsymbols is reduced, and as a consequence, the timerequired to complete the labeling task will be shorter.Regardless of the theoretical implications, what we wantto demonstrate is that the proposed methodology can makesuch decisions more objective and informed.
6.2. Identification of undertrained labelers
The joint agreement results (Table 4) and pairwise inter-transcriber agreement results (Table 5) point out a highconfusion concerning the Break 3 and Break 1 labels. Inorder to better know the reasons that can explain the dis-crepancies, we analyze the inter-rater disagreement resultsof Table 6, where one of the labelers (in particular, i1) isemitting judgements that are clearly divergent from the rest
-0.4 -0.2 0.0 0.2 0.4
-0.4
-0.2
0.0
0.2
0.4
E1E2
E3E4i1
i2
i3b1
b2 b3
-0.4 -0.2 0.0 0.2 0.4 -0.4 -0.2 0.0 0.2 0.4
-0.4 -0.2 0.0 0.2 0.4-0.4 -0.2 0.0 0.2 0.4-0.4
-0.2
0.0
0.2
0.4
-0.4
-0.2
0.0
0.2
0.4
-0.4
-0.2
0.0
0.2
0.4
-0.4
-0.2
0.0
0.2
0.4
E1
E2
E3
E4i1
i2i3
b1
b2b3
E1
E2
E3
E4
i1i2
i3
b1
b2
b3
E1E2
E3E4i1
i2 i3b1b2b3E1
E2
E3
E4
i1
i2
i3b1 b2
b3
Fig. 2. Intertranscriber discrepancy for Breaks. The 2D MDS plots represent the distance between taggers for a given ToBI symbol.
578 D. Escudero et al. / Speech Communication 54 (2012) 566–582
Author's personal copy
of the labelers. Since the Break 1 label is well defined in theconventions of the Cat_ToBI system (to mark boundariesbetween prosodic words), the interpretation of this behav-ior is that the transcriber is mis-assigning both Break 3 andBreak 1.
In practical applications, such as the selection of thetranscribers to work in the processing of the Glissando cor-pus mentioned in Section 1, Table 6 and the respectiveMDS plot could be used to identify badly trained transcrib-ers taking into account objective criteria. In particular, thelabeler i1, should be discarded due to his/her divergenceswith respect to the rest of the labelers.
Thus, we offer a tool that can be used to select and eval-uate the potential subjects that will participate in a givenlabeling task particularly any research project in which ahigh degree of consistency among labelers is needed inorder to build a reliable prosodic corpus.
Moreover, this tool can have applications in the field ofteaching the system to new transcribers. In our set of tran-scribers, if is seen as desirable to improve the proficiency ofthe labeler i1, the precise visualization of the prosodicjudgements of the rest of the labelers is a valuable sourceof information about how to correct the labeler’smisjudgements.
Plots in Fig. 2 have been obtained by computing thekappa fleiss index for each pair of labelers, as in Table 6,but isolating the subjects that have assigned the given sym-bol at least once. The j index has been obtained for everypair of taggers and this index has been transformed into adistance by applying the procedure described in Section 4.2.As a consequence of the procedure, we have obtained oneplot per symbol where the distances between the points onthe graph representing raters are proportional to the inter-rater agreement. In our particular case, we have evidencethat the dispersion of labeler i1 is due to faulty interpreta-tion of Breaks 1 and 0. A more detailed explanation of thedifferences between the levels of prosodic organizationshould be enough to improve the proficiency of this labeler.
6.3. Identification of differences among labeling criteria
Inter-rater disagreement results depicted in Table 6 allowtwo different groups of labelers to be identified as far as theprosodic transcription of break levels is concerned: group 1consists of labelers E1, E3 and b2 and group 2 is made up ofthe labelers E2, i3 and b1. The clustering cannot beexplained by the training or proficiency of the transcribers,since in both groups experts and beginners are found.Another possible explanation for these discrepancies is theannotation criteria. If the kappa fleiss index is computedwith the cluster of labelers E1 E3 b2, the kappa fleiss goesfrom 0.68 to 0.89 . If additionally, as suggested in the previ-ous section, we merge Break 2 and Break 3, the kappa fleissgoes up to 0.90 which constitutes Almost Perfect Agreement
according to the Landis scale (see Table 1).When the MDS plot of Table 6 referring to Breaks is
split into the plots corresponding to the different breaks
in Fig. 2, we observe that the grouping is evident in theplots corresponding to Break 1 and Break 3 but the group-ing disappears when the symbols Break 0, Break 2 andBreak 4 are taken into account. We can conclude that thesetwo groups seem to use different criteria with regard to thesymbols Break 1 and Break 3 and that these different crite-ria are responsible for the problematic results observed interms of joint agreement (see Table 4) for Break 1 andBreak 3.
The lack of consensus or the use of alternate criteria inthe detection of Break 3 and Break 4 is clear from the dataobtained in the different reliability scores. As can beobserved in the Boundary Tone example in Table 3 (andin many other similar examples in the corpus), the differentlabeling obtained for Break 3 and Break 4 can be explainedby the use of two different criteria in the identification ofthe two breaks. In the Cat_ToBI documents, includingthe Cat_ToBI Training Materials which the labelers usedas an online reference, there is a description of the two cri-teria that must be used to identify the intermediate phraseboundaries, or Break 3, namely (1) the presence of aweaker disjuncture from a perceptual point of view, whichis instantiated generally by the absence of pauses; and (2)the idea that the intermediate phrase is typically markedby the presence of H- boundary tones, also called “contin-uation rises”. The fact is, however, that these two identify-ing criteria are partially non-overlapping, and one can findcontinuation rises that are followed by clear pauses.Depending on whether specific labelers attach more impor-tance to one or the other of these two criteria, they willtranscribe the boundary as either Break 3 or Break 4. Itis clear that the revised version of the Cat_ToBI Training
Materials must establish a priority ranking in the criteriafor identifying intermediate phrase boundaries.
In this discussion, we have shown that the tools pre-sented here represent a useful starting point for an inter-expert discussion about the points of discrepancy observedin the sentences of the corpus, a process which will be takenup shortly by the Cat_ToBI developers’ group.
7. Conclusions
For the preparation of an oral corpus for research pur-poses, the availability of tools that can help human subjectsin the sometimes difficult task of prosodic annotation isundoubtedly of great interest. Thus, the development ofthis tool constitutes an important step towards achievingboth homogeneity and consistency in the prosodic tran-scription of spontaneous speech. Further, the tool is ableto estimate the attainable degree of agreement betweentranscribers by using objective measures.
In this paper we have systematically compared the per-formance of several transcribers carrying out Cat_ToBIprosodic labeling experience on various examples of Cata-lan utterances and evaluated inter-rater consistency of theirtranscriptions. In general, the results demonstrate thatthere is a high degree of coincidence in the transcriptions,
D. Escudero et al. / Speech Communication 54 (2012) 566–582 579
Author's personal copy
and therefore that the audio and visual cues to prosodicand intonational organization can be considered relativelystable. Comparison of the present results with those of pre-vious ToBI reliability studies for other languages (namelyG_ToBI in (Grice et al., 1996), Gla_ToBI in Mayo et al.(1997), K_ToBI in (Jun et al., 2000) and J_ToBI in (Vend-itti, 2005) reveals comparable agreement rates for thisstudy. The global inter-transcriber results are 86.10% forBoundary Tone choices, 77.14% for Break Index choices,and 61.17% for Pitch Accent choices. These results lie inthe range of previous interreliability results in the citedToBI studies, which are in the interval [81.6%, 89.93%]for Boundary Tones, [65.5%, 74%] for Breaks and[52.2%, 86.57%] for Pitch Accents (see Table 2). Based onthe results of the present inter-transcriber consistency tests,we feel that there is ample evidence to regard the Cat_ToBIsystem as a standard reference for prosodic labeling.
Although our reliability results for Catalan are of thesame order of magnitude as previous studies, the slightlylower scores we obtained in the choice of Pitch Accent,Boundary Tone and Break Index types have deserved fur-ther investigation. While it is possible that the inconsisten-cies detected might be related to the type of speechtranscribed (given that the Catalan speech corpus con-tained four different speech styles) or the relatively brieftraining given to some participants, the tools presentedhere have allowed us to identify a set of issues related tothe difficulties involved in transcribing some specificcategories.
In this paper, inter-rate reliability has been assessed bymeans of a set of metrics (joint agreement, pairwise agree-ment and kappa coefficient) and a visualizing tool (multidi-mensional scaling) under a common framework. The use ofthe joint agreement distribution is innovative in the field ofprosodic labeling and has been demostrated to be useful foridentifying categories with a high disagreement among rat-ers. The combined use of the pairwise inter-transcriberagreement with multidimensional scaling has permitted usto visualize the pairs of symbols that are frequently con-fused and those pairs that tend to yield greater consensus.The kappa index has allowed us to visualize the existingcoincidence among every pair of labelers with the goal ofidentifying under-trained raters and differences in taggingcriteria among different groups of labelers.
On the one hand, our analysis of the confusion clustershas revealed a number of issues that lead to the presence ofproblematic categories. For example, in Section 6, the com-mon confusion between Break 3 or Break 4 has been tracedback to partially overlapping identification criteria, whichwill need to be clarified in a revised version Cat_ToBI
Training Materials through a more precise descriptionand more clearly contrasting examples.
On the other hand, the high number of categories avail-able to the transcribers for both Pitch Accent and theBoundary Tone categories has proven to be one of the seri-ous sources of transcription confusions. Careful evaluationof the data has revealed that, for example, the inventory of
rising pitch accents (L + H*, H* and L + > H*) is highlyconfusable. In the next periodic review of the Cat_ToBIsystem, this issue will have to be taken up. As noted above,the Cat_ToBI Training Materials are a web-based manualfor teaching the system to new transcribers, with manyrecorded examples of transcribed utterances. The conven-tions are used, maintained and updated consistently fromthis site, and periodic rechecks are being performed onthe data. As a result of the analysis offered in this paper,a simplified Cat_ToBI proposal is going to be put forwardas a possible improvement of the system.
In sum, we have presented a low cost procedure that hasproved useful for assessing two aspects of a consistency testin particular. First, the identification of the most frequentlyconfused symbols provides evidence that their definitionsdeserve fresh consideration, and their fusion with moreagreed symbols might be a one plausible option. In the spe-cific case of Cat_ToBI, a set of suggestions have been putforward for fewer labeling distinctions both for the tran-scription of pitch accent events and for boundary toneevents. Second, the results of this analysis can help guaran-tee the necessary level of proficiency of labelers prior totheir undertaking the labeling of bigger corpora. Likewise,labelers whose output is seen to deviate from the generalconsensus must be retrained.
Finally, the proposed procedure can contribute to anefficient and reliable method for evaluating prosodic tran-scription of speech across languages, something which isneeded for linguistic research on prosody in general, andfor the development of prosody-dependent labeling andspeech recognition systems in particular.
Acknowledgements
The authors are indebted to other researchers of theGrup d’Estudis de Prosodia GrEP (Departament de Tra-duccio i Ciencies del Llenguatge, Universitat Pompeu Fa-bra) who contributed constructively to the discussion ofthis work while it was underway. Particular thanks aredue to the subjects who performed the annotations of Cat-alan utterances (J. Borras-Comes, V. Crespo-Sendra, R. Si-chel-Bazin, E. Estebas-Vilaplana and the postgraduatestudents CA, CR, EP and GV) for their valuable commentsand information.
This research has been funded by six research grantsawarded by the Spanish Ministerio de Ciencia e Innova-cion, namely the Glissando project FFI2008-04982-C003-02, FFI2008-04982-C003-03, FFI2011-29559-C02-01,FFI2011-29559-C02-02, FFI2009-07648/FILO and CON-SOLIDER-INGENIO 2010 Programme CSD2007-00012,and by a grant awarded by the Generalitat de Catalunyato the Grup d’Estudis de Prosodia (2009SGR-701)
Appendix A. Contents of the corpus
Spontaneous speech extracted from the Map Task sub-corpus of the Map Task dialogue corpus Atles interactiu de
580 D. Escudero et al. / Speech Communication 54 (2012) 566–582
Author's personal copy
l’entonacio del catala (Prieto and Cabre, 2007). Sentences inthe database comprise broad-focus statements, i.e., new-information statements, as well as information-seeking,confirmation-seeking and echo questions.
1. Un cop deixes la paret lateral a la teva dreta, la hi dei-xes? Once you have left the wall on your right . . . Have
you left it?
2. No, o sigui, es com si anessis cap al jardı Menor, peroabans d’arribar-hi tires cap amunt i cap al jardı Major.No, in other words, it’s like going to the Small Garden
but before you get there, go up and towards the Main
Garden.
3. Hi ha un arbre, no?, suposo, a l’esquerra de l’academia?There is a tree, right?, to the left of the academy?
4. O sigui que tu vas en direccio cap al final de la paraulaBarbara? In other words, you go towards the end of the
word Barbara?
5. No m’has dit que anava a comprar roba? Didn’t you tell
me to go shopping?
Radio news subset from the Festcat database (Bona-fonte et al., 2008):
1. Pero no es molt esclau, aixo? But isn’t it a very slave
occupation?
2. Per tota una generacio, Sılvia Munt sera SEMPRE, laColometa. For an entire generation, Sılvia Munt will
ALWAYS be the Colometa (nickname, ’little pigeon’).
3. El Bernabeu esta completament desesperat! The wholeBernabeu stadium is utter despair!
4. Pero aixo no es res! But it’s nothing!
5. Que hi fa, als camps de refugiats? What is he/she doing in
the refugee camp?
Read text subset from the Festcat database (Bonafonteet al., 2008):
1. Des de sempre Hollywood ha produıt pel � lıcules desa-consellables per a homes sensibles amb serps, llops,aranyes o, fins i tot, extraterrestres. As long as I can
remember Hollywood has produced inadvisable movies
for sensitive men with snakes, wolves, spiders or even
aliens.
2. He pensat que l’olor havia de ser una de les primeres dif-erencies notables. I thought that the smell should be oneof the first noticeable differences.
3. Empassant saliva amb esforc� vaig abrac�ar-lo tendra-ment tement que esclates a plorar i jo ja no pogues agu-antar mes. Swallowing hard, I hugged him tenderly,
fearing that he would break into tears and I could not take
it any more.
4. Anem a Eivissa? A Eivissa? A la platja d’Eivissa. Shall
we go to Ibiza? To Ibiza? To the Ibiza beach!5. Eren les sis de la matinada i tota aquella gent semblava
no tenir-ne mai prou. Que no voleu anar a dormir, com-panys? It was six in the morning and these people never
seemed to get enough. Don’t you want to go to sleep,
folks?
Spontaneous speech extracted from the guided interviewsubcorpus of the Atles interactiu de l’entonacio del catala
(Prieto and Cabre, 2007):
1. Que li duries? What would you bring him/her?
2. Teniu mandarines? Do you have tangerines?
3. Home, es d’en Jaume! Dude, it’s Jaume’s.
4. Va vine . . . ! Aw, come on . . .!5. Es la MARIA la que vol venir? Is it MARIA, who wants
to come?
References
Aguilar, L., de la Mota, C., Prieto, P. (coords.), 2009–2011. Cat_ToBITraining Materials URL <http://prosodia.upf.edu/cat_tobi/>.
Ananthakrishnan, S., Narayanan, S., 2008. Automatic Prosodic EventDetection Using Acoustic, Lexical, and Syntactic Evidence. IEEETrans. Audio, Speech, Lang. Process. 16 (1), 216–228.
Arvaniti, A., Baltazani, M., 2005. Intonational analysis and prosodicannotation of Greek spoken corpora. In: Jun, S.-A. (Ed.), ProsodicTypology: The Phonology of Intonation and Phrasing. OxfordUniversity Press, Oxford, pp. 84–117.
Beckman, M., 2002. Intonation across Spanish in the tones and breakindices framework. Probus 14, 9–36.
Beckman, M., Jun, S., 2000. K-ToBI (Korean ToBI) labeling conventions:version 3. The Korean J. Speech Sci. 7 (1), 143–169.
Beckman, M.E., Campos, M.D., McGregory, J.T., Morgan, T.A. 2000.Intonation across Spanish, in the tones and break indices framework.Technical Report, University of Ohio, http://www.ling.ohio-state.edu/tobi/sp-tobi/.
Beckman, M., Hirschberg, J., Shattuck-Hufnagel, S., 2005. The originalToBI system and the evolution of the ToBI framework. In: Jun, S.-A.(Ed.), Prosodic Typology: The Phonology of Intonation and Phrasing.Oxford University Press, New York, pp. 9–54.
Boersma, P., Weenink, D. 2011. Praat, doing phonetics by computer[Computer program]. Version 5.2.26, <http://www.praat.org> (accessed24.05.11).
Bonafonte, A., Adell, J., Esquerra, I., Gallego, S., Moreno, A., Perez, J.2008. Corpus and Voices for Catalan Speech Synthesis. In: Proceed-ings of LREC, Marrakech, pp. 3325–3329.
Borg, I., Groenen, P., 2005. Modern Multimensional Scaling: theory andapplications. Springer-Verlag, New York.
Brugos, A., Veilleux, N., Breen, M., Shattuck-Hufnagel, S. 2008. TheAlternatives (Alt) Tier for ToBI: Advantages of Capturing ProsodicAmbiguity, in: Proceedings of Speech Prosody 2008, pp. 273–276.
Buhmann, J., Caspers, J., van Heuven, V., Hoekstra, H., Martens, J.,Swerts, M. 2002. Annotation of prominent words, prosodic bound-aries and segmental lengthening by non-expert transcribers in thespoken Dutch corpus. In: Proceedings of LREC, pp. 779–785.
Cohen, J., 1960. A coefficient for agreement for nominal scales. Edu.Psychol. Measure. 20, 37–46.
Estebas, E., Prieto, P., 2009. La notacion prosodica del espanol. Unarevision del Sp_ToBI. Estud. de Fonetica Experiment. XVIII, 263–283.
Estebas Vilaplana, E., Prieto, P. 2010. Castilian Spanish Intonation. In: P.Prieto, P. Roseano (Eds.), Transcription of Intonation of the SpanishLanguage, Lincom Europa, Munchen, pp. 17–48.
Fleiss, J., 1971. Measuring nominal scale agreement among many raters.Psychol. Bull. 76 (5), 378–382.
Godfrey, J.J., Holliman, E.C., McDaniel, J. 1992. SWITCHBOARD:telephone speech corpus for research and development. In: Proceed-ings of ICASSP, Vol. 1, pp. 517–520.
D. Escudero et al. / Speech Communication 54 (2012) 566–582 581
Author's personal copy
Gonzalez, C., Vivaracho, C., Escudero, D., Cardenoso, V. 2010. On theautomatic ToBI accent type identification from data. In: Proceedingsof Interspeech 2010, pp. 142–145.
Grice, M., Benzmuller, R., 1995. Transcription of German using ToBITones- The Saarbrucken System. Phonus 1, 33–51.
Grice, M., Reyelt, M., Benzmuller, R., Mayer, J., Batliner, A. 1996.Consistency in Transcription and Labelling of German Intonationwith GToBI. In: Proceedings ICSLP, pp. 1716–1719.
Gwet, K.L., 2008. Computing inter-rater reliability and its variance in thepresence of high agreement. British J. Math. Stat. Psychol. 61, 26–48.
Gwet, K.L., 2010. Handbook of Inter-Rater Reliability, second ed. In:Advanced Analytics LLC.
Hasegawa-Johnson, M., Chen, K., Cole, J., Borys, S., Kim, S.-S., Cohen,A., Zhang, T., Choi, J.-Y., Kim, H., Yoon, T., Chavarrıa, S., 2005.Simultaneous recognition of words and prosody in the Bostonuniversity radio speech corpus. Speech Commun. 46, 418–439.
Herman, R., McGory, J., 2002. The conceptual similarity of intonationaltones and its effects on intertranscriber reliability. Lang. Speech 45, 1–36.
Hirst, D., 2005. Form and function in the representation of speechprosody. Speech Commun. 46, 334–347.
Ihaka, R., Gentleman, R., 1996. R: A language for data analysis andgraphics. J. Comput. Graph. Stat. 5 (3), 299–314.
Jun, S., Lee, S., Kim, K., Lee, Y. 2000. Labeler agreement in transcribingKorean intonation with K-ToBI. In: Proceedings of ICSLP, Vol. 3, pp.211–214.
Kruskal, J., Wish, M. 1978. Multidimensonal Scaling. Sage UniversityPaper series on Quantitative Application in the Social Sciences,Beverly Hills.
Landis, J., Koch, G., 1977. The measurement of observer agreement forcategorical data. Biometrics 33, 159–174.
Mayo, C., Aylett, M., Ladd, D. 1997. Prosodic Transcription of GlasgowEnglish: An Evaluation Study of GlaToBI. In: Botinis, A., Kouroupe-troglou, G., Carayiannis G. (Eds.), Proceedings of ESCA Workshop:Theory, Models and Applications, pp. 231–234.
Ohio-State-University, 2006. What is ToBI? URL http://www.ling.ohio-state.edu/tobi/.
Pena, D. 1999. Estadıstica. Modelos y Metodos, Alianza, Madrid.Pierrehumbert, J.B. 1980. The phonology and phonetics of English
intonation, Ph.D. thesis, MIT.Pitrelli, J.F., Beckman, M.E., Hirschberg, J. 1994. Evaluation of prosodic
transcription labeling reliability in the ToBI framework. In: Proceed-ings of ICSLP, pp. 123–126.
Pitt, M., Johnson, K., Hume, E., Kiesling, S., Raymon, W., 2005. TheBuckeye corpus of conversational speech: labeling conventions and atest of transcriber reliability. Speech Commun. 45, 89–95.
Prieto, P., Cabre, T. (coords.), 2007–2010. The Interactive Atlas ofCatalan Intonation, URL <http://prosodia.upf.edu/atlesentonacio/index-english.html/>.
Prieto, P., Aguilar, L., Mascaro, I., Torres-Tamarit, F.J., Vanrell, M.M.,2009. L’etiquetatge prosodic Cat_ToBI. Estud. de Fonetica Experi-ment. XVIII, 287–309.
Prieto, P., 2012. The intonational phonology of Catalan. In: Jun, S. (Ed.),Prosodic Typology 2, The Phonology of Intonation and Phrasing.Oxford University Press, Oxford, in press.
Prom-on, S., Xu, Y., Thipakorn, B., 2009. Modeling tone and intonationin Mandarin and English as a process of target approximation. J.Acoust. Soc. Amer. 125, 405–424.
Rangarajan Sridhar, V.K., Bangalore, S., Narayanan, S.S., 2008. Exploit-ing acoustic and syntactic features for automatic prosody labeling in amaximum entropy framework. IEEE Trans. Audio, Speech, Lang.Process. 16 (4), 797–811.
Rosenberg, A. 2009. Automatic Detection and Classification of ProsodicEvents, Ph.D. thesis, Columbia University, USA.
Rosenberg, A. 2010. Classification of Prosodic Events using QuantizedContour Modeling. In: HLT-NAACL, pp. 721–724.
Scott, W., 1955. Reliability of content analysis: The case of nominal scalecoding. Public Opinion Quart. 17, 321–325.
Silverman, K., Beckman, M., Pitrelli, J., Ostendorf, M., Wightman, C.,Price, P., Pierrehumbert, J., Hirschberg, J. 1992. ToBI: A standard forlabelling English prosody. In: Proceedings of ICSLP, pp. 867–870.
Sim, J., Wright, C., 2005. The kappa statistic in reliability studies: use,interpretation, and sample size requirements. Phys. Therapy 85 (3),257–268.
Syrdal, A., McGory, J. 2000. Inter-transcriber reliability of ToBI prosodiclabeling. In: Proceedings of ICSLP, Vol. 3, pp. 235–238.
Syrdal, A.K., Hirshberg, J., McGory, J., Beckman, M., 2001. AutomaticToBI prediction and alignment to speech manual labeling of prosody.Speech Commun. 33, 135–151.
Uebersax, J., 1987. Diversity of decision making models and themeasurement of interrater agreement. Psychol. Bull. 101, 140–146.
Venditti, J.J., 2005. The J_ToBI model of Japanese intonation. In: Jun, S.-A. (Ed.), Prosodic Typology: The Phonology of Intonation andPhrasing. Oxford University Press, New York, pp. 172–200.
Wightman, C.W. 2002. ToBI or not ToBI. In: B. Bel, I. Marlien (Eds.),Proceedings of Speech Prosody.
Yoon, T., Chavarrıa, S., Cole, J., Hasegawa-Johnson, M. 2004. Inter-transcriber reliability of prosodic labeling on telephone conversationusing ToBI, in: Proceedings of Speech Interspeech, Jeju, pp. 2729–2732.
582 D. Escudero et al. / Speech Communication 54 (2012) 566–582
Related Documents