Clemson University TigerPrints All eses eses 12-2008 ANALYSIS OF IN-FLIGHT VIBTION FOR A TURBO PROPELLER AIRCFT Kyle Dunno Clemson University, [email protected] Follow this and additional works at: hps://tigerprints.clemson.edu/all_theses Part of the Engineering Commons is esis is brought to you for free and open access by the eses at TigerPrints. It has been accepted for inclusion in All eses by an authorized administrator of TigerPrints. For more information, please contact [email protected]. Recommended Citation Dunno, Kyle, "ANALYSIS OF IN-FLIGHT VIBTION FOR A TURBO PROPELLER AIRCFT" (2008). All eses. 484. hps://tigerprints.clemson.edu/all_theses/484

Welcome message from author
This document is posted to help you gain knowledge. Please leave a comment to let me know what you think about it! Share it to your friends and learn new things together.
Transcript

Clemson UniversityTigerPrints
All Theses Theses
12-2008
ANALYSIS OF IN-FLIGHT VIBRATION FORA TURBO PROPELLER AIRCRAFTKyle DunnoClemson University, [email protected]
Follow this and additional works at: https://tigerprints.clemson.edu/all_theses
Part of the Engineering Commons
This Thesis is brought to you for free and open access by the Theses at TigerPrints. It has been accepted for inclusion in All Theses by an authorizedadministrator of TigerPrints. For more information, please contact [email protected].
Recommended CitationDunno, Kyle, "ANALYSIS OF IN-FLIGHT VIBRATION FOR A TURBO PROPELLER AIRCRAFT" (2008). All Theses. 484.https://tigerprints.clemson.edu/all_theses/484

ANALYSIS OF IN-FLIGHT VIBRATION FOR A TURBO PROPELLER AIRCRAFT
A Thesis Presented to
the Graduate School of Clemson University
In Partial Fulfillment of the Requirements for the Degree
Master of Science Packaging Science
by Kyle David Dunno
December 2008
Accepted by: Dr. Kay Cooksey, Committee Chair
Dr. Robert Cooksey Dr. Patrick Gerard Mr. Gregory Batt

ii
ABSTRACT
A data recorder was utilized to record in-flight vibration of a turbo propeller
aircraft. The data recorded produced power spectral density (PSD) profiles which are
currently used in laboratory settings to drive vibration tables in order to simulate a
particular vehicle type. Overall Grms values from the averaged data were then
statistically compared to published standards and other studies to determine if there were
differences in overall Grms values.
The data recorder was rigidly mounted to the cargo area of the turbo propeller
aircraft. Thirty flights were recorded which varied in flight time from less than one hour
to greater than four hours.
When compared to published standards and other standards there was significant
evidence to conclude that the overall Grms levels of all studies were different. The
general shape of the profile had similarities at given frequencies when compared to the
published standards, but all had different overall Grms levels.
The data collected from this research study could be utilized for packaging
research when developing products and packages that will pass through a distribution
cycle which includes transportation via a turbo propeller aircraft. The PSD profiles which
were analyzed from this research could be utilized to simulate in-flight aircraft vibration
of the aircraft chassis in a laboratory environment. This will enable further research in the
air transport environment and aid in the optimization of package design and testing.

iii
DEDICATION
I dedicate this work to my wife Kristen Dunno, and to the rest of my family.
Without their patience, love and devotion none of this would have been possible.

iv
ACKNOWLEDGMENTS
I would like to thank my advisor, Dr. Kay Cooksey, for her guidance throughout
this entire process. Her willingness to facilitate learning is truly amazing.
I would also like to the other members of my committee, Dr. Bob Cooksey, Dr.
Patrick Gerard, and Greg Batt for their support and willingness to assist in every way
possible.

v
TABLE OF CONTENTS
Page
TITLE PAGE .................................................................................................................... i ABSTRACT ..................................................................................................................... ii DEDICATION ................................................................................................................ iii ACKNOWLEDGMENTS .............................................................................................. iv LIST OF TABLES ......................................................................................................... vii LIST OF FIGURES ...................................................................................................... viii CHAPTER I. INTRODUCTION ......................................................................................... 1 II. REVIEW OF LITERATURE ........................................................................ 4 Evaluation of Aircraft Types and Usage .................................................. 4 Example of Conventional Data Acquisition for Random Vibration ......................................................................... 6 Previous Research in Aircraft Vibration .................................................. 9 Method for Determining Statistical Difference of Two Means ................................................................. 13 III. MATERIALS AND METHODS ................................................................. 18 Objectives .............................................................................................. 18 Aircraft ................................................................................................... 18 Test Equipment ...................................................................................... 19 SAVER™ 9X30 Setup .......................................................................... 21 Project Design ........................................................................................ 21 IV. RESULTS AND DISCUSSIONS ................................................................ 26 In-Flight Results..................................................................................... 26 Statistical Analysis for Timer Data ........................................................ 35 Statistical Analysis for Signal Data ....................................................... 37
vi
Table of Contents (Continued)
Page V. CONCLUSIONS.......................................................................................... 39 VI. RECOMMENDATIONS ............................................................................. 41 APPENDICES ............................................................................................................... 42 A: Timer Trigger Data Trends – Thirty Flights ................................................ 43 B: Signal Trigger Data Trends – Thirty Flights ................................................ 44 C: SAS Program for Timer Data ...................................................................... 45 D: SAS Output for Timer Data ......................................................................... 47 E: SAS Program for Signal Data ...................................................................... 53 F: SAS Output for Signal Data ......................................................................... 55 REFERENCES .............................................................................................................. 61

vii
LIST OF TABLES
Table Page 1 Frequency and PSD Breakpoints for ASTM D 4169 Air Assurance Level II ................................................................................. 11 2 Frequency and PSD Breakpoints for ISTA 4AB ......................................... 12 3 Conclusion and Consequences for a Test of Hypothesis ............................. 15 4 Recording parameters for Timer Trigger Data ............................................ 22 5 Recording parameters for Signal Trigger Data ............................................ 22 6 Individual Flight Recordings ....................................................................... 28 7 Hypothesis test results from Timer Trigger Data for a difference in means ........................................................................ 36 8 Hypothesis test results from Signal Trigger Data for a difference in means ........................................................................ 38

viii
LIST OF FIGURES
Figure Page 1 UPS 767 Jet Engine Aircraft .......................................................................... 4 2 FedEx Cessna Caravan Turbo Propeller Aircraft .......................................... 5 3 Acceleration vs. Time Plot ............................................................................. 7 4 Data Recorder Mounted to Truck .................................................................. 8 5 Comparison of Air Vibration PSD Profiles ................................................. 10 6 Rejection region of a two-tailed hypothesis test .......................................... 17 7 Rockwell Turbocommander Twin Engine 690B AC90............................... 19 8 SAVER ™ 9X30 .......................................................................................... 21 9 Advanced Instrument Setup for the SAVER™ 9X30 ................................. 22 10 Location of the data recorder (represented by star) ..................................... 23 11 SAVER™ securely mounted in the cargo area ............................................ 24 12 PSD profile of the X, Y and Z Axes ............................................................ 29 13 PSD profile of the Average Timer Trigger Data ......................................... 31 14 PSD profile of the Average Signal Trigger Data ......................................... 31 15 PSD profile of the Average Timer Data and the maximum PSD value at that frequency ................................................................... 32 16 PSD profile of the Average Signal Data and the maximum PSD value at that frequency ................................................................... 32 17 PSD profiles for the Average Timer and Signal Trigger Data ..................... 33 18 Timer Trigger Data, ASTM D 4169, ISTA 4AB, and Amgen Profiles ................................................................................................... 34

ix
19 Signal Trigger Data, ASTM D 4169, ISTA 4AB, and Amgen Profiles ................................................................................................... 35

CHAPTER ONE
INTRODUCTION
Every day millions of packaged products are transported between multiple
distribution channels to reach specified destinations. Common transportation channels
that a packaged product would pass through are over-the-road truck transportation, rail
transportation, and aircraft transportation. Throughout the various distribution channels
the packaged products are subjected to three major categories of dynamic hazards: shock,
vibration, and compression (Brandenburg and Lee, 2001). While shock and compression
hazards cannot be overlooked when designing packages or packaging materials the nature
of this project focused on vibration. The intensity of vibration experienced by a packaged
product depends on the type of transportation used. Different modes of transport will
produce different vibration inputs to the packaged product system.
There are several reasons for the increasing importance of air transportation. For
example, in recent years using logistics to manage a supply chain has become more
common because companies need to reduce costs of tied up capital investments (Trost,
1988). The logistical way of thinking becomes more and more common, where
companies aim to reduce the costs of tied-up capital. The time factor has become more
important and faster transport combined with an efficient materials flow means that
excess supplies are reduced along with storage costs. Trost states, “this development can
be traced to the fact that the amount of highly processed products has increased; e.g.
sophisticated electronic products with high price per [pound] have to reach their
customers fast” (Trost, 1988). An additional fact is the increasingly intense competition

2
which demands manufacturers to be alert to market changes quicker – which means being
able to forecast the flow of goods properly (Akerman, 2003).
Another area which is experiencing an increase in air transportation is the small
parcel delivery segment. Companies such as the United Parcel Services (UPS) and
Federal Express (FedEx) are some of the major companies specializing in small parcel
delivery. With companies like UPS and FedEx offering overnight and next day delivery
services to their customers, the only way to move packages vast amounts of miles in one
night is through air transportation.
Prior to this research project only two published testing standards were utilized to
simulate aircraft vibration. These standards are the American Society for Testing and
Materials (ASTM) D 4169 – 08 and the International Safe Transit Association (ISTA)
4AB. The latest research which was published was conducted by Lansmont Corporation
and Amgen which produced a vibration profile, but not a standard for testing. These
standards and previous research were analyzed against the data obtained from this study
to determine if there were statistical differences.
This study examined the air transportation mode of turbo propeller, or feeder,
aircraft which move goods to non-major metropolitan areas of the United States of
America. Since feeder aircraft have not been studied extensively, the purpose of this
study was to develop a vibration profile in order to simulate the transportation of
packaged products which would be shipped via aircraft to its final destination. The profile
which is produced from this aircraft can be used to operate package testing equipment,
which in turn can aid in the optimal package design for a given product. The importance

3
of analyzing and profiling different vehicle types in the small parcel environment, such as
a turbo propeller aircraft, allows engineers to develop packages that can properly protect
the product throughout a particular distribution segment.
The air vibration profile which was developed from this study was also
statistically compared to prior published vibration profiles to determine if there was a
significant difference in the overall vibration intensities. The profile was compared using
a hypothesis test in order to determine a difference of means.

4
CHAPTER TWO
REVIEW OF LITERATURE
Evaluation of Aircraft Types and Usage
Multiple types of aircraft are used to transport materials and packages throughout
the world. Collectively, these types of aircraft can be summarized into two main
categories – jet engine and turbo propeller. Some jet engine aircraft commonly used by
the United Parcel Services (UPS) in transporting materials and packages are Boeing 757-
200 Freighter and the DC8-70 Freighter (UPS, 2007). While these larger aircraft can
transport thousands to millions of packages to major metropolitan cities, the turbo
propeller aircraft is utilized to transport small amounts of packages to more remote
locations. Examples of turbo propeller aircraft commonly used in transporting materials
and packages by Federal Express (FedEx) are the Cessna 208 Caravan and the Beech
A100 King Air FedEx (FedEx, 2007). Figures 1 and 2 illustrate a general example of a jet
engine and a turbo propeller aircraft.
Figure 1. UPS 767 Jet Engine Aircraft

5
Figure 2. FedEx Cessna Caravan Turbo Propeller Aircraft (Goleta, 2008)
Multiple aircraft are used to deliver products from the origin of shipment to
destination. Large jet aircrafts are used to move packaged products from one major
metropolitan city to the next, but some states and regions do not have this option. So,
turbo propeller, or feeder, aircraft are utilized in the small parcel delivery industries to
delivery overnight and next-day packages to remote locations both in the United States of
America and other foreign countries.
In most cases the small parcel delivery companies operate on a lease program
where a contractor will lease the aircraft and supply the crew and insurance while a small
parcel company like FedEx will supply the aircraft, registration, landing fees, and ground
crews (FedEx, 2007). This allows the various delivery companies to utilize different
contractors in different regions of the United States of America in order to service the
different markets.

6
Example of Conventional Data Acquisition for Random Vibration
Securing the raw data necessary to quantify the small parcel vibration
environment requires using one of the many sophisticated, computer-compatible field
data recorders. Offered by several manufacturers, these devices are battery powered for
taking data over several weeks, and typically include internal or external accelerometers
as dynamic sensors. They may also include temperature and relative humidity sensors for
recording these non-dynamic parameters. These recorders are capable of recording
vibration, drops, and impacts with high speed analog-to-digital conversion.
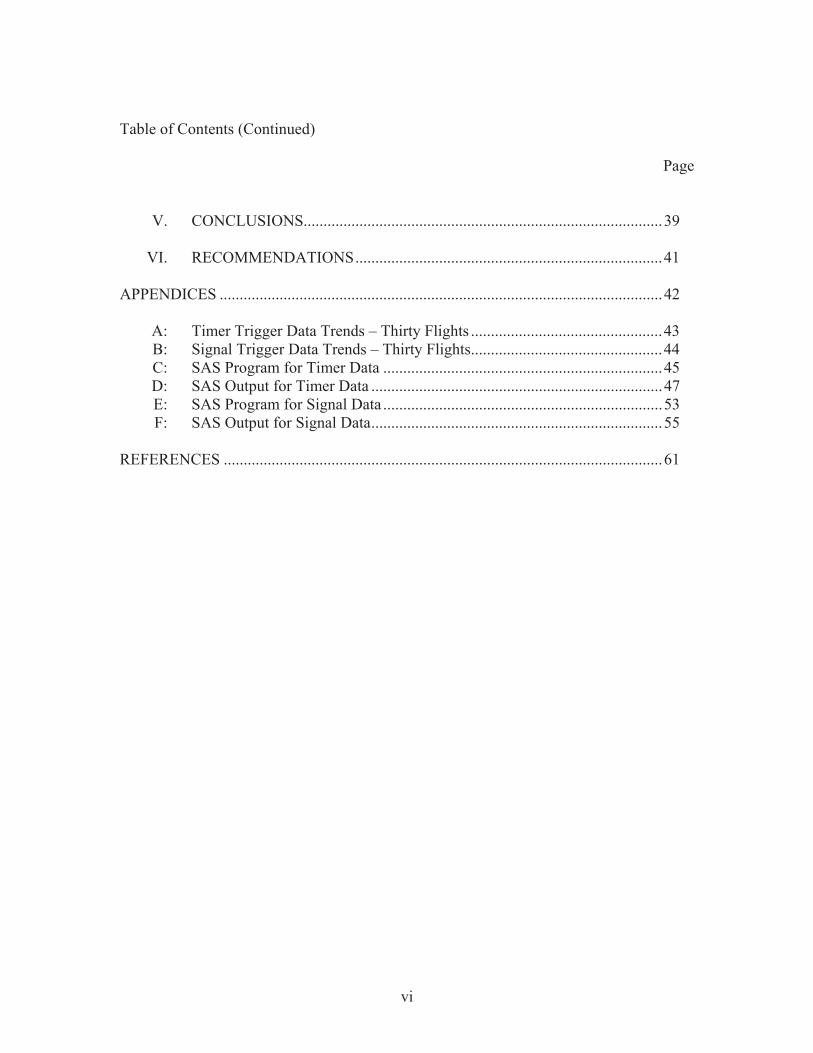
Vibration input from vehicles in motion produces continuous random vibrations.
Figure 3 shows a representative sample of vehicle vibration from an aircraft, displayed as
acceleration vs. time. To characterize this type of vibration with a field data recorder
requires a sampling technique. For example to record all the vibration time in a twenty
hour trip, more than 150 megabytes (MB) of on-board computer memory would be
required. Since this is such a large amount of memory storage, these environments are
sampled instead of continuously recorded. This technique is appropriate when the event
being measured changes slowly and sampled data will be representative of un-sampled
periods. Timer trigger data periods are usually taken in response to an on-board timer, so
that a sample is taken every ten seconds or five minutes depending on the various
applications. The interval timer is set to fill the available memory during the intended
duration of the measurement trip. For example, during the acquisition of data from a
truck, the instrument can be set for an interval of ten minutes. After each data sample is
taken, the instrument repeatedly records data every ten minutes. Each time data is taken,
7
the record is called an event. Data may also be recorded based on the vibration signal
exceeding a pre-set threshold, which is commonly referred to as signal trigger data. This
technique is used to record the highest intensity events in a particular trip. From each
individual event collected for a given frequency, a power spectral density (PSD) profile is
created which is a representation of the actual shipping environment.
Figure 3. Acceleration vs. Time Plot
In order to accurately represent the input vibration to a package, the data recorder
must be secured to a location that would produce the input accelerations. The location
used for most truck transit studies is the rear axle of the trailer. This accurately represents
the vibration due to the rear axle being the connection between the tires and the trailer.
The data recorder must be securely fastened to the truck and this can be accomplished
through bolting the unit directly to the truck or by using a magnetized base. The purpose
is to not allow any decay of the accelerations from the input source to the data recorder.
Figure 4 displays a data recorder mounted to a semi-truck.
‐0.6
‐0.4
‐0.2
0
0.2
0.4
0.6
0 0.5 1 1.5 2 2.5
Acceleration (g)
Time (sec.)
Vehicle Vibration ‐ Vertical Axis

8
Figure 4. Data Recorder Mounted to Truck (Singh et. al, 2007)
Many of the published vibration profiles are time compressed in order to decrease
the overall test time required for laboratory testing. As a general rule of thumb, the
profile should not exceed a compression of more than 5:1; where five is the number of
actual truck hours and one is the number of laboratory test hours. The commonly used
equation (equation 1), displays the method for accelerating, or time compressing a
vibration test. When time compressing a profile the shape of the given profile remains
unchanged; it simply gets increased in overall intensity (Grms) to permit compression of
the testing time (Kipp, 2002).
Equation 1: IT I0T0TT
Where IT = overall intensity of the test lab profile (expressed in Grms)
I0 = field-measured intensity of transport profile (in Grms)
T0 = time duration of the transport vibration
TT = the test time

9
Previous Research in Aircraft Vibration
While numerous research studies have been conducted to measure an aircraft’s
acceleration, the majority of this research has involved service and fatigue data for the
aircraft (Trost, 1988) as well as wing flutter during takeoff and landing (Berman, 1979).
During the past twenty years numerous research studies have been conducted for the
truck and rail environment in order to better characterize the profile for each mode of
transportation, but the same cannot be said for aircraft vibration. These research studies
have led to the development of updated and vehicle specific profiles that are currently
accepted for use of package testing. Due to the lack of research in the air vibration
environment, the most widely used and accepted air vibration test power spectral density
profiles are located within the American Society for Testing and Materials (ASTM) D
4169 – 08 Standard Practice for Performance Testing of Shipping Containers. The data
used for the ASTM D 4169 – 08 are undefined, which confirms why research should be
conducted to better understand and characterize this environment. Figure 5 depicts the
following three PSD profiles: ASTM D 4169 – 08 Air Assurance Level II and data
collected from the Young/UPS study and the Lansmont/Amgen study. In Figure 6 all of
the profiles are different from each other, but there are similarities between the Young
and Amgen profiles when the comparing the frequency domain signature (Joneson,
2008). From this, there is a definite need for future research studies of the air
transportation environment to better characterize each aircraft’s profile.

10
Figure 5. Comparison of Air Vibration Profiles
Major in-flight and ground aircraft studies which have been performed over the
past 30 years include the following published studies: the General Technical Report FPL
22, Dennis Young and UPS study, and the Lansmont/Amgen study.
The Forest Products Laboratory’s (FPL) General Technical Report 22 was an
assessment of the common carrier shipping environment. The assessment included all
major shipping hazards including vibration. The FPL 22 Report was one of the early
studies of aircraft vibration reporting taxi, takeoff/landing, and cruise mode. The
vibration environment on cargo aircraft can be broadly classified due to internal or
external sources. “The excitation frequencies are highly dependent on the type of aircraft
engine (turbojet, turboprop, reciprocating engine, or helicopter) while the amplitudes
depend more on the flight mode (takeoff, climb, cruise, and landing)” (General, 1979).
1.0E‐08
1.0E‐07
1.0E‐06
1.0E‐05
1.0E‐04
1.0E‐03
1.0E‐02
1.0E‐01
1 10 100
PSD (g
2 /Hz)
Frequency (Hz)
Air Profile ComparisonsASTM D4169 ‐ 1.05 Grms
ISTA 4AB ‐ 0.117 Grms
Amgen Study ‐ 0.017 Grms

11
For a particular aircraft, many of the acceleration peaks can usually be associated with
internal sources. The internal sources are a result of periodic excitation from rotating
shafts such as propeller blades or rotating engines. The external sources for acceleration
can occur from air turbulence, air pockets, and weather patterns.
The turbo propeller aircraft environment is different from the jet aircraft in that it
has a characteristic single-frequency, high amplitude excitation (General, 1979). The FPL
22 Report stated that “for a given turboprop aircraft, the engine normally operates at a
relatively narrow speed range with the propellers producing a sinusoidal-type input”
(General, 1979). These frequencies therefore will be fixed relative to the other excitations
which will vary in frequency and magnitude. Another difference is the different airframes
which are used to construct a turbo propeller aircraft versus a jet aircraft. Turbo propeller
airframes are generally smaller than those of jet aircraft.
While the FPL 22 Report was ground breaking in being one of the first research
studies to publish data from an aircraft, the data included all aspects of a flight, and no
overall Grms level was reported for this particular study. Some of the data published was
used to develop the ASTM Air Vibration Profile, but the FPL 22 Report itself did not
produce a Grms level which was used for lab simulation. The ASTM Air Assurance
Level II breakpoints are displayed in Table 1.
Table 1. Frequency and PSD Breakpoints for ASTM D 4169 Air Assurance Level II
Frequency (Hz) PSD (g2/Hz) 2 0.002 12 0.01 100 0.01 300 0.00001

12
The International Safe Transit Association (ISTA) 4AB PSD profile was
developed from the study presented at TransPack 1997 (Young, 1997). This study
mounted the data recorder to the floor of an unit load device (ULD), and recorded three
shipments aboard a UPS 757 jet engine aircraft. The initial vibration data from the
Young/UPS study was time compressed in order to lower laboratory test time. The ISTA
4AB data when compared to the ASTM D 4169 Air Assurance Level II, has a lower
overall vibration intensity. While the study does show lower levels of vibration intensity
than the ASTM D 4169 Air Assurance Level II, it does not accurately show the
characteristic of the aircraft because it shows the response of the ULD to the aircraft
vibration, not the input vibration. The resulting vibration profile which was published
from this study had an overall intensity level of 0.117 Grms. Table 2 states the break
points used to generate the ISTA 4AB PSD.
Table 2. Frequency and PSD Breakpoints for ISTA 4AB
Frequency (Hz) PSD (g2/Hz) 1 0.0002 2 0.002 4 0.0002 6 0.0005 40 0.00001 60 0.0001 110 0.0001 200 0.000005
The Amgen Air PSD profile was developed from the study conducted by
Lansmont and Amgen and was presented at the ISTA and IOPP International Forum on
Transport Packaging. This study mounted the data recorder to the floor of a ULD,

13
container type LD3, and recorded eight shipments aboard a jet engine aircraft. Again, this
study revealed even lower vibration intensity when compared to the ASTM D 4169 Air
Assurance Level II and the ISTA 4AB profiles, but this data was recorded from a LD3
container that was being shipped between California and Switzerland. This was due to the
vibration profile only including in-flight air vibration from each flight. While this is the
purpose for the current research study, the location of the LD3 container inside of the
aircraft as well as how it was secured to the aircraft were unknown during the test
shipments. The resulting PSD which was published from this study had an overall
intensity level of 0.017 Grms.
The ISTA 4AB profile as well as the Amgen profile was conducted with a
package placed inside of the cargo area. The package in both instances was a ULD. Both
of these studies measure the packages response to the vehicle vibration, not the input to
vehicle. Current data collection techniques for obtaining vibration data on an over-the-
road truck require the attachment of the recorder to the chassis, and using that profile to
drive a vibration table. The current research study accomplishes that by measuring the
vehicles vibration input into the cargo area of a turbo propeller aircraft, which to date has
not been conducted in the turbo propeller aircraft environment.
Method for Determining Statistical Difference of Two Means
Statistics are used widely for verifying information and research conducted in the
area of engineering and science. A common procedure which is used to determine a
statistical difference is a hypothesis test. A statistical hypothesis is a claim either about
the value of a single population characteristic or about the values of several population

14
characteristics. In any hypothesis testing problem, there are two contradictory hypotheses
under consideration. The objective is to decide, based on sample information, which of
the two hypotheses is correct.
The problem will be formulated so that one of the claims (hypotheses) is initially
favored. This initially favored claim will not be rejected in favor of the alternative claim
unless sample evidence contradicts it and provides strong support for the alternative
assertion. The claim initially favored or believed to be true is called the null hypothesis
and is denoted by Ho. The other claim in a hypothesis test is called the alternative
hypothesis and is denoted by Ha.
Scientific research often involves trying to decide whether a current theory should
be replaced by a more plausible and satisfactory explanation of the phenomenon under
investigation. A conservative approach is to identify the current theory with Ho and the
researcher’s alternative explanation with Ha. Rejection of the current theory will then
occur only when evidence is much more consistent with the new theory. In many
situations Ha is referred to as the researcher’s hypothesis since it is the claim that the
researcher would like to validate (Devore, 1991). Ho should be identified with the
hypothesis of no change (from current opinion), no difference, no improvement, and so
on (Devore, 1991).
Before satisfactory test procedures can be obtained, the results of using one
rejection region as opposed to another must be understood. The basis for choosing a
particular region lies in an understanding of the errors that one might be faced with in
drawing the conclusion. The two types of error utilized most for hypothesis testing are

15
Type I error and Type II error. A Type I error is committed when one rejects the null
hypothesis when it is true (Ott and Longnecker, 2001). The probability of a Type 1 error
is denoted by the symbol α. A Type II error is committed when one accepts the null
hypothesis when it is false and the alternative hypothesis is true (Ott and Longnecker,
2001). The probability of a Type II error is denoted by the symbol β. Table 1 displays the
conclusions and consequences for a test of hypothesis.
Table 3. Conclusion and Consequences for a Test of Hypothesis
Conclusion True State of Nature
Ho True Ha True
Ho True Correct Decision Type II Error
Ha True Type I Error Correct Decision
A test procedure is specified by a test statistic, in this case, t observed (tobs) and a
rejection region. A test statistic is a function of the sample data on which the decision to
either reject or not reject Ho is based. The following equation is used to compute the tobs
for a hypothesis test for a single mean (equation 2).
Equation 2 √
A rejection region is the set of all test statistic values for which Ho will be rejected, and is
based on a value of α (for a significance level of 5%, α=0.05). For sample sizes smaller
than 30, the Student’s t-distribution table (found in most statistics textbooks) is
recommended to identify the critical t value of the statistic that would determine the
borders of the rejection region, for the hypothesis test, based on the chosen value of α

16
(Freund and Wilson, 1997). The following equation is used to properly compute the
critical t value for a two-tailed test (equation 3).
Equation 3 , 1
The t-observed is compared to the t-critical from the Student’s t-distribution table
and a decision to either reject or not reject Ho is made depending on whether the observed
value falls in the rejection region of the t-distribution curve. An assumption is made that
the values for the parameter in question are normally distributed, and have equal
variance. When interested in finding whether an observed value is statistically different
than that of another, the hypothesis testing is set up so the null hypothesis says it is a
certain value, and the alternative hypothesis is not equal to that value. This creates a two-
tailed test, where the rejection region, which has an area of α, is made up of two regions
each with area equal to α/2 at each tail end of the t-distributed curve. Figure 6 illustrates
this concept. If the numerical value of the test statistic falls in the rejection region, one
rejects the null hypothesis and concludes that the alternative hypothesis is true. If the test
statistic does not fall in the rejection region, one does not reject Ho, but fails to reject.
One other way to reach a conclusion for the test is to compare the p-value of the test to
the alpha set in the beginning of the experiment. For example, if one would like to have a
significance level of 5% for a test, one would set the alpha, α, for the experiment to be
0.05, and would compare the p-value from the results to the 0.05. If the p-value is less
than alpha one rejects the null hypothesis, and if the p-value is greater than alpha one
fails to reject the null hypothesis.

17
Through statistics it is possible to compare different means along with multiple
other styles of test procedures. The statistics used in this study allow for different
vibration levels to be compared to one another and determine if the mean vibration levels
were different.
Figure 6. Rejection region of a two-tailed hypothesis test
, 1 , 1

18
CHAPTER THREE
MATERIALS AND METHODS
Objectives
Research was conducted for in-flight aircraft vibration which occurs during the
shipment of packaged products. With the advent of more powerful and versatile data
recorders the study better characterized in-flight and ground data for feeder aircraft. By
utilizing updated and improved technology, it was possible to separate ground data from
air data to create separate vibration profiles. This data will enable further research in the
air transport environment and aid in the optimization of package design.
The purpose of the research was to capture and characterize the aircraft’s input
vibration in hopes of better understanding this distribution channel which is currently
becoming used more frequently due to the abundance of overnight and next day
shipments. From the findings reported from the data acquired, a PSD profile would be
provided to simulate the actual shipping environment of packaged products being
transported via aircraft. The PSD profile would be used by vibration test apparatuses in
order test products and packages in a laboratory environment. Although the study was
limited to only one type of aircraft, the goal was that it would provide a sufficient amount
of data to pursue further studies capturing multiple types of aircraft as well as different
engine types.
Aircraft
The aircraft used for this project was a Rockwell Turbocommander Twin Engine
690B AC90. It was built in 1976 in Oklahoma City, OK at the Rockwell Manufacturing

19
Plant. Each engine was a single shaft with an operating rotational speed of 1900 ± 5%
RPM throughout the duration of all flights. This means that the engines rotated at
approximately 31.6 ± 5% Hz. The aircraft had an unpressurized cargo area where the data
recorder was mounted. The unpressurized cargo area allowed for the internal atmospheric
pressure gauge to record actual altitude during the flights. Figure 7 represents the actual
aircraft used for the project. The aircraft was stationed at the Oconee County Regional
Airport (ICAO ID: CEU) located in Seneca, SC.
Figure 7. Rockwell Turbocommander Twin Engine 690B AC90
Test Equipment
A field data recorder was utilized for this project. The type of data recorder which
was used for this research had to be able to record vibration and altitude in order to
separate in-flight data from ground data. The recorder utilized was the Shock and
Vibration Environment Recorder (SAVER™) manufactured by Lansmont Corporation

20
(Monterey, CA). The model of data recorder chosen for this was the SAVER™ 9X30
with SaverXware software package. A front view of the SAVER™ 9X30 is depicted in
Figure 8. This instrument provides users with the ability to capture up to nine dynamic
channels of data (three internal and six external), while also recording temperature,
humidity and atmospheric pressure. The SAVER™ 9X30 continuously measures up to
thirty days of shock (impact/drop), vibration, temperature, humidity, and atmospheric
pressure conditions. SaverXware is the companion software package for the SAVER™
9X30. It was used for programming the instrument, transferring information between the
instrument and host computer, and analyzing and exporting all recorded data. This
software package included features such as:
• Event Classification
o Automatically categorize each event as shock, drop, vibration or general
and concentrate the summary events into a pertinent subset.
• Event Processing
o Process and provide a full analysis for all recorded shock, drop, and
vibration events.
• Simultaneous Trip Analysis
o Create an event database to concurrently analyze multiple instruments and
trips.
• Enhanced Summary Selection
o Build event selection criteria to quickly search the database and find
desired information.

21
Figure 8. SAVER™ 9X30
SAVER™ 9X30 Setup
SaverXware was used to program the SAVER™ 9X30 for all data acquisition.
The data recorder was setup to record and analyze vibration. It recorded both signal and
timer triggered data. Signal triggered data refers to the data recorded during an event in
which the intensity exceeded a preset threshold. In this case, the trigger threshold was
0.50 g. At any time during the project, if the data recorder experienced higher than 0.50 g
it would record that data point. Timer trigger data refers to the data recorder waking up at
a preset frequency and recording a preset duration. For this project, the timer trigger was
set at 30 second intervals. The record time for both the signal and timer triggered data
was set at 2.048 seconds. This would allow for the recorder to capture points below a
frequency of 1 Hz. Tables 4 and 5 display the recording parameters used for this research.

22
Table 4. Recording parameters for Timer Trigger Data
Parameter Setup Wakeup Interval Every 30 s Sampling Rate 1000 samples/sec Record Time 2.048 s Data Retention Mode Fill/Stop Memory Allocation 80%
Table 5. Recording parameters for Signal Trigger Data
Parameter Setup Trigger Threshold 0.50 G Signal Pre-trigger 20% Sampling Rate 1000 samples/sec Record Time 2.048 s Data Retention Mode Max Overwrite Memory Allocation 20%
The remaining advanced setup details can be obtained from Figure 9.
Figure 9. Advanced Instrument Setup for the SAVER™ 9X30
23
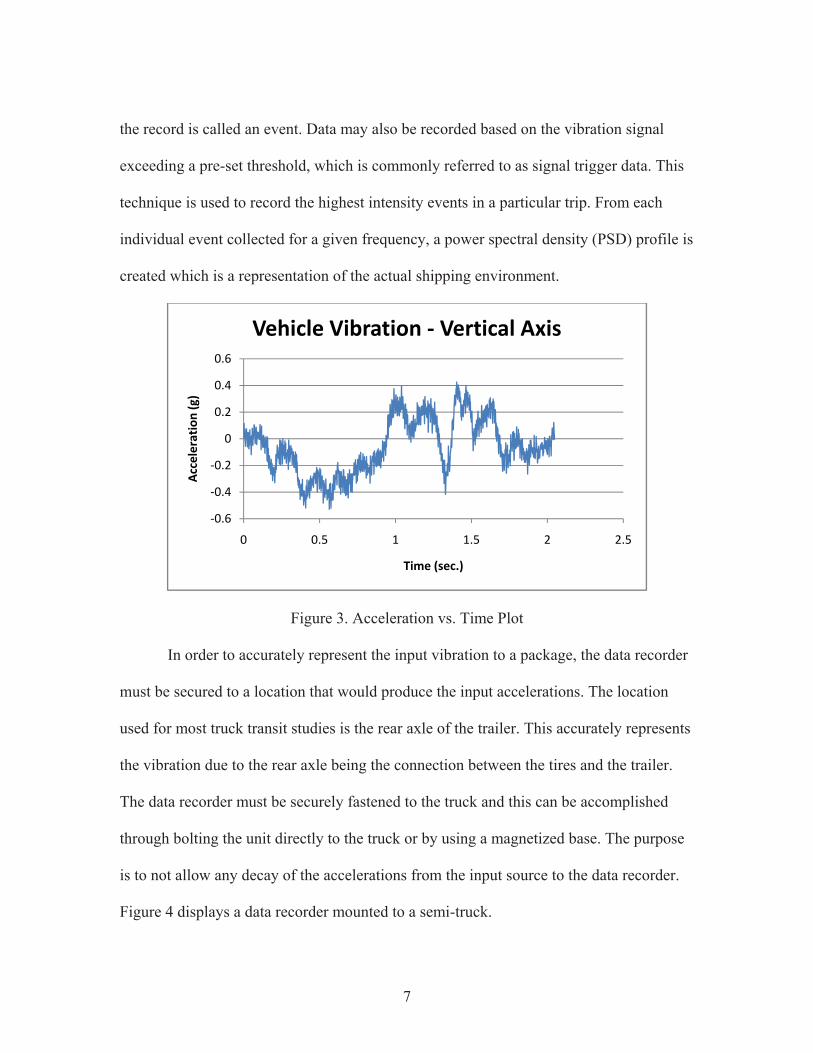
Once the data recorder was setup, the unit was rigidly mounted to the cargo area
of the Rockwell Turbocommander Twin Engine. The data recorder was mounted to the
frame of the cargo area with a specialized fixture that was designed for this application.
The fixture containing the data recorder was held in place with 3 – 2 inch steel C-Clamps.
The fully mounted recorder was located in the cargo area next to the left wing of the
aircraft. Figure 10 represents the location of the data recorder from the top and side views
of the aircraft. Figure 11 displays the fully mounted data recorder in the cargo area of the
aircraft.
Figure 10. Location of the data recorder (represented by star)

24
Figure 11. SAVER™ 9X30 securely mounted in the cargo area
Project Design
The project was designed to properly record and analyze data from thirty
individual flights. Throughout the thirty flights, the aircraft ranged in travel distances
from less than one hour to greater than four hours with the majority of flights ranging in
between. Also, with thirty flights it was possible to look at external sources of vibration
such as air pockets, turbulence, and how weather affected the flights. The thirty flights
allowed for a wider sample size in hopes of making the data statistically valid.
Once the data was recorded it was analyzed using the SaverXware programming
software. The resulting PSD profile from this research would be statistically analyzed
against the previous studies published PSD profiles to determine if there was a significant

25
difference. If the data recorded from this research was statistically different, the different
vibration profiles would be analyzed to determine if the overall intensity (Grms) was
lower or higher. Also, individual flight summaries would be provided as well as a
cumulative flight summary for a traditional PSD profile.
With the cumulative PSD, the goal would be met that the data could be utilized in
operating test equipment for product and package testing for in-flight aircraft shipments.
This would allow for optimum package design for packaged products shipped via
aircraft.

26
CHAPTER FOUR
RESULTS AND DISCUSSION
In-Flight Results
A total of thirty individual flights were recorded and analyzed for this project. Having
thirty sets of aircraft vibration was thought to provide the statistical validity needed to
properly characterize the environment. Once the data was obtained and analyzed it was
statistically compared to the ASTM D 4169, ISTA 4AB and the Amgen vibration
profiles. A hypothesis test was performed to determine if the means of the overall Grms
values were different.
While the data reported in the ASTM D 4169 and ISTA 4AB data was time
compressed, the data obtained from the Amgen study was not time compressed. When
the data collected from this study was compared to the ASTM D 4169 profile, the shape
and overall intensity levels are extremely different. The data collected from this study
(turbo propeller aircraft) had approximately the same general shape and intensity levels
as the ISTA 4AB data (jet aircraft). This was an interesting phenomenon. While, when
the data from this study is compared to the Lansmont/Amgen data (jet aircraft) the two
have very different shapes and different levels of overall intensity.
The flights recorded in this study varied in length from one to four hours. Most of
the flights were recorded in the Southeast U.S., but some flights were recorded as far as
New York and Tennessee. Some flights also experienced the external excitations
mentioned earlier, which were, air turbulence, air pockets, and weather patterns.
Interestingly, the internal excitations due to the propellers rotating at 31.6 ± 5% Hz are

27
not visible. This was possibly due to vibration absorbers built into the engine that
absorbed the energy at the operating frequency. Table 6 shows the individual flights
(from city to city), the corresponding overall Grms values from that particular flight, and
the maximum acceleration from each flight. While the maximum accelerations recorded
were as high as 2.11g, these levels represented discrete events occurring during takeoffs
and landing; whereas the typical steady state vibration did not exceed 0.2g. Note in Table
6 that not all flights recorded a signal triggered overall Grms value. This was due to the
aircraft not experiencing any acceleration over 0.50 G during that particular flight.

28
Table 6. Individual Flight Recordings
Flights Overall Grms Maximum Acceleration
(g) Origin Destination Timer Trigger Signal Trigger Oconee, SC Columbia, SC 0.065 0.170 1.13 Columbia, SC Oconee, SC 0.050 No Data* 0.32 Oconee, SC Charleston, SC 0.054 0.190 1.27 Charleston, SC Oconee, SC 0.054 0.119 -0.63 Oconee, SC Saluda, SC 0.047 No Data* -0.33 Saluda, SC Charleston, SC 0.068 0.184 0.86 Charleston, SC Oconee, SC 0.058 0.173 0.74 Oconee, SC Memphis, TN 0.063 0.139 0.82 Memphis, TN Oconee, SC 0.059 No Data* 0.31 Oconee, SC New York, NY 0.060 0.153 -1.48 New York, NY Oconee, SC 0.068 0.168 -0.77 Oconee, SC Knoxville, TN 0.079 0.192 -2.11 Knoxville, TN Charleston, SC 0.082 0.166 0.93 Charleston, SC Columbia, SC 0.067 0.173 -0.67 Columbia, SC Oconee, SC 0.060 0.166 0.98 Oconee, SC Jacksonville, FL 0.088 0.174 -0.61 Jacksonville, FL Atlanta, GA 0.063 0.161 -0.94 Atlanta, GA Oconee, SC 0.079 0.156 1.38 Oconee, SC Atlanta, GA 0.070 0.156 -0.91 Atlanta, GA Oconee, SC 0.061 0.153 0.74 Oconee, SC Saluda, SC 0.054 No Data* 0.47 Saluda, SC Oconee, SC 0.049 0.111 0.51 Oconee, SC Atlanta, GA 0.060 0.116 0.73 Oconee, SC Charleston, SC 0.053 No Data* -0.24 Charleston, SC Oconee, SC 0.052 No Data* -0.41 Oconee, SC Atlanta, GA 0.086 0.169 0.79 Oconee, SC Columbia, SC 0.054 No Data* -0.43 Columbia, SC Oconee, SC 0.046 0.167 0.81 Oconee, SC Charleston, SC 0.055 0.061 0.51 Charleston, SC Oconee, SC 0.057 0.156 0.68
Average 0.062 0.155 N/A
Std. Dev. 0.011 0.030 N/A *No Signal Trigger Data Recorded

29
While data from the X, Y and Z axes were recorded and analyzed, only the
vertical (Z axis) data was reported due to the vertical acceleration being more intense
than the other two axes – lateral and longitudinal (X,Y respectively). Both the lateral and
longitudinal accelerations were minimal in comparison to the vertical response. Figure 12
illustrates the averaged vertical intensity level with the lateral and longitudinal levels
from one flight. The accelerations of the measured vibration levels in the vertical axis
was analyzed and reported in the form of a power spectral density profile. The PSD
profiles represent the vibration intensity measured in the cargo area.
Figure 12. PSD profile of the X, Y and Z Axes
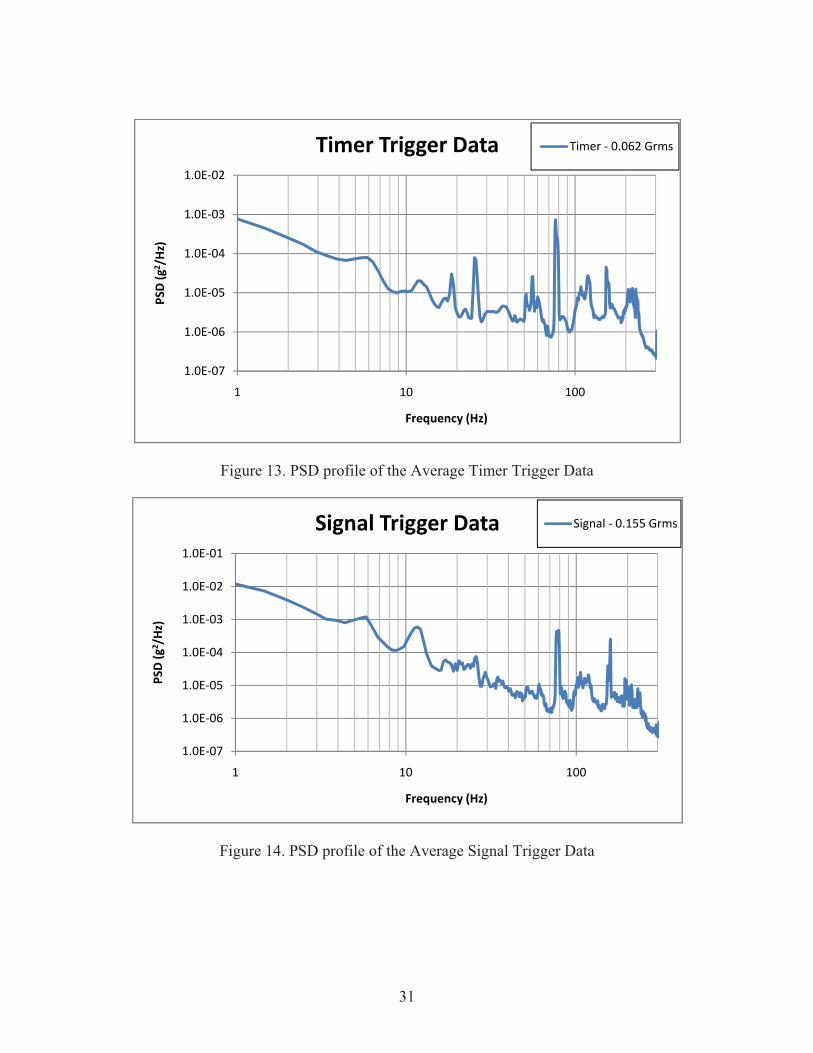
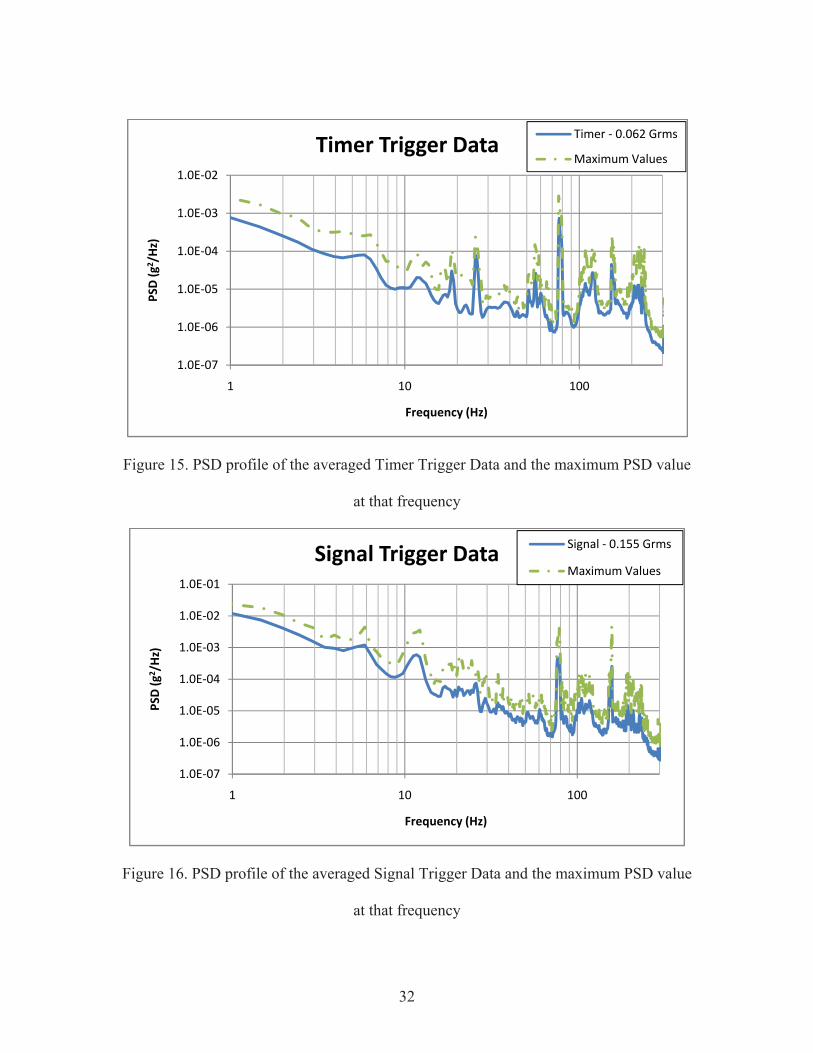
Figures 13 and 14 represent the average of the timer triggered data and the signal
triggered data, displaying a cumulative overall Grms. The overall Grms level of the thirty
flights for the timer trigger data was 0.062, while the overall Grms level of the thirty
1.0E‐07
1.0E‐06
1.0E‐05
1.0E‐04
1.0E‐03
1.0E‐02
1 10 100
PSD (g
2 /Hz)
Frequency (Hz)
Timer Trigger X, Y, and Z Axes DataX Axis ‐ 0.044 Grms
Y Axis ‐ 0.049 Grms
Avg. Z Axis ‐ 0.062 Grms

30
flights was 0.155 for the signal trigger data. The overall Grms values represent the
averaged vibration data from all thirty flights.
Figures 15 and 16 represent the average of the timer triggered data and the signal
triggered data respectively. The figures also illustrate the maximum PSD value at each
individual frequency which displays the most severe accelerations recorded over the
thirty flights.
Figure 17 represents the timer and signal triggered data overlaid to show the
difference in the two intensities. Although the two PSD profiles have a similarly shaped
curve the intensity of the signal triggered data was greater than that of the timer triggered
data.
Figures 18 and 19 display the averaged signal and timer triggered data overlaid
with the data collected from the ASTM D 4169, ISTA 4AB, and the Amgen study. This
was to depict the similarities in the shape of the curves for the data collected in this study
with that of the ISTA 4AB and Amgen study. It also shows the vast difference not only in
the shape of the curve from the data collected in this study to the ASTM D 4169 – 08
PSD profile, but also the tremendous difference in Grms levels.
31
Figure 13. PSD profile of the Average Timer Trigger Data
Figure 14. PSD profile of the Average Signal Trigger Data
1.0E‐07
1.0E‐06
1.0E‐05
1.0E‐04
1.0E‐03
1.0E‐02
1 10 100
PSD (g
2 /Hz)
Frequency (Hz)
Timer Trigger Data Timer ‐ 0.062 Grms
1.0E‐07
1.0E‐06
1.0E‐05
1.0E‐04
1.0E‐03
1.0E‐02
1.0E‐01
1 10 100
PSD (g
2 /Hz)
Frequency (Hz)
Signal Trigger Data Signal ‐ 0.155 Grms
32
Figure 15. PSD profile of the averaged Timer Trigger Data and the maximum PSD value
at that frequency
Figure 16. PSD profile of the averaged Signal Trigger Data and the maximum PSD value
at that frequency
1.0E‐07
1.0E‐06
1.0E‐05
1.0E‐04
1.0E‐03
1.0E‐02
1 10 100
PSD (g
2 /Hz)
Frequency (Hz)
Timer Trigger DataTimer ‐ 0.062 Grms
Maximum Values
1.0E‐07
1.0E‐06
1.0E‐05
1.0E‐04
1.0E‐03
1.0E‐02
1.0E‐01
1 10 100
PSD (g
2 /Hz)
Frequency (Hz)
Signal Trigger Data Signal ‐ 0.155 Grms
Maximum Values

33
Figure 17. PSD profiles for Average Timer and Signal Trigger Data
1.0E‐07
1.0E‐06
1.0E‐05
1.0E‐04
1.0E‐03
1.0E‐02
1.0E‐01
1 10 100
PSD (g
2 /Hz)
Frequency (Hz)
Timer and Signal Trigger DataTimer Trigger ‐ 0.062 Grms
Signal Trigger ‐ 0.155 Grms

34
Figure 18. Timer Trigger Data, ASTM D 4169, ISTA 4AB, and Amgen Profiles
1.0E‐08
1.0E‐07
1.0E‐06
1.0E‐05
1.0E‐04
1.0E‐03
1.0E‐02
1.0E‐01
1 10 100
PSD (g
2 /Hz)
Frequency (Hz)
Air Profile ComparisonsASTM D4169 ‐ 1.05 Grms
ISTA 4AB ‐ 0.117 Grms
Amgen Study ‐ 0.017 Grms
Timer Data ‐ 0.062 Grms

35
Figure 19. Signal Trigger Data, ASTM D 4169, ISTA 4AB, and Amgen Profiles
Statistical Analysis for Timer Data
The statistical analysis software, SAS, was used to perform hypothesis tests on the
overall mean from all thirty flights, using timer data, and compare each Grms level with
previous studies to determine if the research performed, produced a different Grms value
than those of previous studies. The SAS code used to perform these separate calculations
can be found in Appendix A. The SAS output from the code can be found in Appendix B.
The timer triggered data was statistically compared with the published ASTM D
4169 – 08 standard for Air Assurance Level II. The overall Grms levels were analyzed to
decide if the research performed here had a statistically lower Grms than that of the Air
Assurance Level II which is the most commonly used air vibration simulation profile.
1.0E‐08
1.0E‐07
1.0E‐06
1.0E‐05
1.0E‐04
1.0E‐03
1.0E‐02
1.0E‐01
1 10 100
PSD (g
2 /Hz)
Frequency (Hz)
Air Profile ComparisonsASTM D4169 ‐ 1.05 GrmsISTA 4AB ‐ 0.117 GrmsAmgen Study ‐ 0.017 GrmsSignal Data ‐ 0.115 Grms

36
The test statistic for the hypothesis test was -476.19. The decision was to reject the null
hypothesis since the p-value of <0.0001 is less than an alpha of 0.05. So, in conclusion, at
a significance level of 5%, there was sufficient evidence to conclude that the mean Grms
level was statistically different and less than 1.05 (p-value <0.0001).
The timer triggered data was statistically compared with the published ISTA 4AB
data. The overall Grms levels were analyzed to decide if the research performed here had
a statistically different Grms than that of the ISTA 4AB study. The test statistic for the
hypothesis test was -26.49. The decision was to reject the null hypothesis since the p-
value of <0.0001 is less than an alpha of 0.05. So, in conclusion, at a significance level of
5%, there was sufficient evidence to conclude that the mean Grms level was statistically
different than 0.117 (p-value <0.0001).
The timer triggered data was statistically compared with the published Amgen
study. The overall Grms levels were analyzed to decide if the research performed here
had a statistically different Grms than that of the Amgen study. The test statistic for the
hypothesis test was 21.71. The decision was to reject the null hypothesis since the p-value
of <0.0001 is less than an alpha of 0.05. So, in conclusion, at a significance level of 5%,
there was sufficient evidence to conclude that the mean Grms level was statistically
different than 0.017 (p-value <0.0001).
Table 7. Hypothesis test results from Timer Trigger Data for a difference in means
Previous Study Test Statistic P-Value Decision ASTM D 4169 -476.19 <0.0001 Reject H0
ISTA 4AB -26.49 <0.0001 Reject H0 Amgen 21.71 <0.0001 Reject H0
37
Statistical Analysis for Signal Data
The statistical analysis software, SAS, was used to perform hypothesis tests on the
overall mean from all thirty flights, using signal data, and compare each Grms level with
previous studies to determine if the research performed here in this study produced a
lower Grms value than those of previous studies. The SAS code used to perform these
separate calculations can be found in Appendix C. The SAS output from the code can be
found in Appendix D.
The signal triggered data was statistically compared with the published ASTM D
4169 – 08 standard for Air Assurance Level II. The overall Grms levels were analyzed to
decide if the research performed here had a statistically different Grms than that of the
Air Assurance Level II. The test statistic for the hypothesis test was -144.83. The
decision was to reject the null hypothesis since the p-value of <0.0001 is less than an
alpha of 0.05. So, in conclusion, at a significance level of 5%, there was sufficient
evidence to conclude that the mean Grms level was statistically different and less than
1.05 (p-value <0.0001).
The signal triggered data was then statistically compared with the published ISTA
4AB data. The overall Grms levels were analyzed to decide if the research performed
here had a statistically lower Grms than that of the ISTA 4AB. The test statistic for the
hypothesis test was 6.21. The decision was to reject the null hypothesis since the p-value
of < 0.0001 is less than an alpha of 0.05. So, in conclusion, at a significance level of 5%,
there was sufficient evidence to conclude that the mean Grms level was statistically
different than 0.117 (p-value <0.0001).

38
The signal triggered data was statistically compared with the published Amgen
study. The overall Grms levels were analyzed to decide if the research performed here
had a statistically lower Grms than that of the Amgen study. The test statistic for the
hypothesis test was 22.40. The decision was to reject the null hypothesis since the p-value
of <0.0001 is less than an alpha of 0.05. So, in conclusion, at a significance level of 5%,
there was sufficient evidence to conclude that the mean Grms level was statistically
different than 0.017 (p-value <0.0001).
Table 8. Hypothesis test results from Signal Trigger Data for a difference in means
Previous Study Test Statistic P-Value Decision ASTM D 4169 -144.83 <0.0001 Reject H0
ISTA 4AB 6.21 <0.0001 Reject H0 Amgen 22.40 <0.0001 Reject H0

39
CHAPTER FIVE
CONCLUSIONS
Recent technological advances in data recording have made it possible to record
more data faster and separate different segments of an aircraft’s flight using pressure
change. Being able to separate these segments makes it possible to individually
characterize and analyze a particular aircraft’s environment.
The analyzed data from the environment and aircraft shows that the current test
methods for aircraft vibration simulations exceed the actual environment for which the
simulations are meant to represent. When data from previous studies was compared with
that which was collected from this study, the results showed that the ASTM D 4169 air
profile exceeds the actual environment. The time compressed ISTA 4AB profile which
was meant to represent jet aircraft has a similar shape, but has a higher overall vibration
intensity. Also, the Amgen profile was much lower in overall intensity when compared
with this study.
The excitation from the engines rotating at 31.6 ± 5% Hz was not visible on the
PSD spectrums. This was believed to be due to vibration absorbers built into the engine
which produce a smoother, more comfortable ride for the passengers and cargo at typical
operating engine speeds.
The maximum accelerations recorded in Table 6 occurred predominantly during
the ascent and descent of the aircraft. The maximum accelerations recorded were as high
as 2.11g. These levels represented discrete events occurring during takeoffs and landing;
whereas the typical steady state vibration did not exceed an intensity of 0.2g. Only three

40
maximum accelerations were recorded while the aircraft was at its cruising altitude. This
was the result of the aircraft experiencing sudden changes during the ascent and descent,
and few abrupt changes during the cruising altitude.
This method of collecting data could be used to understand the vibration in
different aircraft in order to generate vehicle specific vibration profiles. By having
multiple vibration profiles which exhibit the random vibrations experienced on an
aircraft, the goal of a more optimized package and product system could be met.
The data collected from this research study could be utilized for packaging
research when developing products and packages that will pass through a distribution
cycle which includes transportation via a feeder turbo propeller aircraft. The PSD profiles
which were analyzed from this research could be utilized to simulate in-flight aircraft
vibration of the aircraft chassis in a laboratory environment. This will enable further
research in the air transport environment and aid in the optimization of package design
and testing.

41
CHAPTER FIVE
RECOMMENDATIONS
Future research in the area of aircraft vibration could be conducted using similar
research methods on multiple types of aircraft and engine types. Different styles of
aircrafts could be analyzed which will produce vehicle specific vibration data, much like
are available for truck vibration. The same methods used for this study will be
implemented to obtain the vibration data from the different aircraft chassis’s. Along with
different styles of aircrafts and engine types, the location of the data recorder in the
aircraft will be studied to determine how location affects the data.
One could also look at the shocks which take place during takeoff and landing as
these were not analyzed during this research. Through evaluating the different shocks
which occur during takeoff and landing a procedure could be developed to simulate the
various shocks in a laboratory environment.
The different temperature and relative humidity environments could be evaluated
in order to understand an aircraft’s cargo environment for shipments. With this research,
it would be possible to generate an environmental conditioning requirement for
shipments via an aircraft.

42
APPENDICES

43
Appendix A
Timer Trigger Data Trends – Thirty Flights
1.00E‐08
1.00E‐07
1.00E‐06
1.00E‐05
1.00E‐04
1.00E‐03
1.00E‐02
1.00E‐01
1.00E+00
1 10 100
PSD (G
2 /Hz)
Frequency (Hz)
Timer Trigger Data Trends

44
Appendix B
Signal Trigger Data Trends – Thirty Flights
1.00E‐12
1.00E‐11
1.00E‐10
1.00E‐09
1.00E‐08
1.00E‐07
1.00E‐06
1.00E‐05
1.00E‐04
1.00E‐03
1.00E‐02
1.00E‐01
1.00E+00
1 10 100
PSD (g
2 /Hz)
Frequency (Hz)
Signal Trigger Data Trends
45
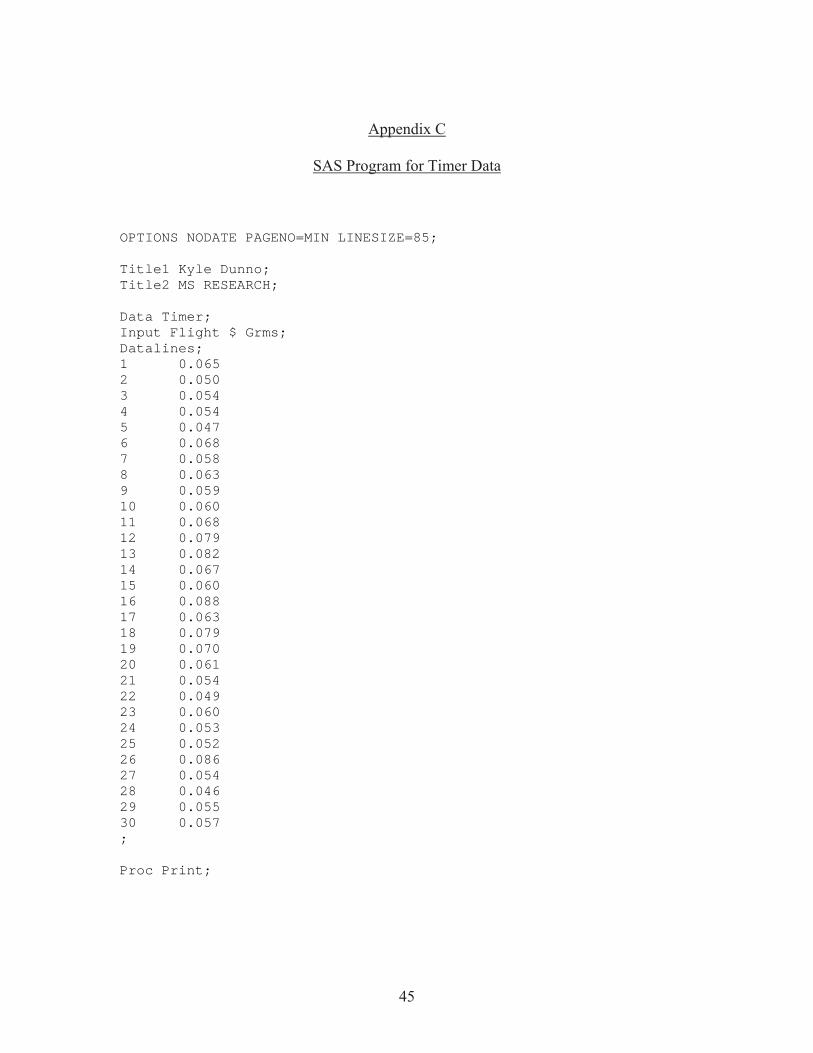
Appendix C
SAS Program for Timer Data
OPTIONS NODATE PAGENO=MIN LINESIZE=85; Title1 Kyle Dunno; Title2 MS RESEARCH; Data Timer; Input Flight $ Grms; Datalines; 1 0.065 2 0.050 3 0.054 4 0.054 5 0.047 6 0.068 7 0.058 8 0.063 9 0.059 10 0.060 11 0.068 12 0.079 13 0.082 14 0.067 15 0.060 16 0.088 17 0.063 18 0.079 19 0.070 20 0.061 21 0.054 22 0.049 23 0.060 24 0.053 25 0.052 26 0.086 27 0.054 28 0.046 29 0.055 30 0.057 ; Proc Print;

46
Proc Univariate Plot; Var Grms; Proc ttest h0=1.05; Var Grms; Title3 Hypothesis Test for ASTM Level II; Proc ttest h0=.117; Var Grms; Title3 Hypothesis Test for Young UPS (ISTA 4AB); Proc ttest h0=.017; Var Grms; Title3 Hypothesis Test for Lansmont/Amgen Study; Run; Quit;

47
Appendix D
SAS Output for Timer Data
Kyle Dunno MS RESEARCH
Obs Flight Grms
1 1 0.065 2 2 0.050 3 3 0.054 4 4 0.054 5 5 0.047 6 6 0.068 7 7 0.058 8 8 0.063 9 9 0.059 10 10 0.060 11 11 0.068 12 12 0.079 13 13 0.082 14 14 0.067 15 15 0.060 16 16 0.088 17 17 0.063 18 18 0.079 19 19 0.070 20 20 0.061 21 21 0.054 22 22 0.049 23 23 0.060 24 24 0.053 25 25 0.052 26 26 0.086 27 27 0.054 28 28 0.046 29 29 0.055 30 30 0.057

48
Kyle Dunno MS RESEARCH
The UNIVARIATE Procedure
Variable: Grms
Moments
N 30 Sum Weights 30 Mean 0.06203333 Sum Observations 1.861 Std Deviation 0.01136384 Variance 0.00012914 Skewness 0.86083749 Kurtosis 0.02143289 Uncorrected SS 0.119189 Corrected SS 0.00374497 Coeff Variation 18.3189198 Std Error Mean 0.00207474
Basic Statistical Measures
Location Variability
Mean 0.062033 Std Deviation 0.01136 Median 0.060000 Variance 0.0001291 Mode 0.054000 Range 0.04200
Interquartile Range 0.01400
Tests for Location: Mu0=0
Test -Statistic- -----p Value------
Student's t t 29.89928 Pr > |t| <.0001 Sign M 15 Pr >= |M| <.0001 Signed Rank S 232.5 Pr >= |S| <.0001
Quantiles (Definition 5)
Quantile Estimate
100% Max 0.0880 99% 0.0880 95% 0.0860 90% 0.0805 75% Q3 0.0680 50% Median 0.0600 25% Q1 0.0540 10% 0.0495 5% 0.0470 1% 0.0460 0% Min 0.0460

49
Kyle Dunno MS RESEARCH
The UNIVARIATE Procedure
Variable: Grms
Extreme Observations
-----Lowest---- ----Highest----
Value Obs Value Obs
0.046 28 0.079 12 0.047 5 0.079 18 0.049 22 0.082 13 0.050 2 0.086 26 0.052 25 0.088 16
Stem Leaf # Boxplot 8 68 2 | 8 2 1 | 7 99 2 | 7 0 1 | 6 5788 4 +-----+ 6 000133 6 *--+--* 5 5789 4 | | 5 0234444 7 +-----+ 4 679 3 | ----+----+----+----+ Multiply Stem.Leaf by 10**-2 Normal Probability Plot 0.0875+ * *++++ | * +++++ | * *+++ | +*++ 0.0675+ ++*** | +**** | ++**** | * ***+* 0.0475+ * * *+++ +----+----+----+----+----+----+----+----+----+----+ -2 -1 0 +1 +2

50
Kyle Dunno MS RESEARCH
Hypothesis Test for ASTM Level II
The TTEST Procedure
Statistics Lower CL Upper CL Lower CL Upper CL Variable N Mean Mean Mean Std Dev Std Dev Std Dev Std Err
Grms 30 0.0578 0.062 0.0663 0.0091 0.0114 0.0153 0.0021
T-Tests
Variable DF t Value Pr > |t|
Grms 29 -476.19 <.0001

51
Kyle Dunno MS RESEARCH
Hypothesis Test for Young UPS (ISTA 4AB)
The TTEST Procedure
Statistics Lower CL Upper CL Lower CL Upper CL Variable N Mean Mean Mean Std Dev Std Dev Std Dev Std Err Grms 30 0.0578 0.062 0.0663 0.0091 0.0114 0.0153 0.0021
T-Tests
Variable DF t Value Pr > |t|
Grms 29 -26.49 <.0001

52
Kyle Dunno MS RESEARCH
Hypothesis Test for Lansmont/Amgen Study
The TTEST Procedure
Statistics Lower CL Upper CL Lower CL Upper CL Variable N Mean Mean Mean Std Dev Std Dev Std Dev Std Err Grms 30 0.0578 0.062 0.0663 0.0091 0.0114 0.0153 0.0021
T-Tests
Variable DF t Value Pr > |t|
Grms 29 21.71 <.0001

53
Appendix E
SAS Program for Signal Data
OPTIONS NODATE PAGENO=MIN LINESIZE=90; Title1 Kyle Dunno; Title2 MS RESEARCH; Data Signal; Input Flight $ Grms; Datalines; 1 0.170 2 0.190 3 0.119 4 0.184 5 0.173 6 0.139 7 0.153 8 0.168 9 0.192 10 0.166 11 0.173 12 0.166 13 0.174 14 0.161 15 0.156 16 0.156 17 0.153 18 0.111 19 0.116 20 0.169 21 0.167 22 0.061 23 0.156 ; Proc Print; Proc Univariate Plot; Var Grms; Proc ttest h0=1.05; Var Grms; Title3 Hypothesis Test for ASTM Level II;

54
Proc ttest h0=.117; Var Grms; Title3 Hypothesis Test for Young UPS (ISTA 4AB); Proc ttest h0=.017; Var Grms; Title3 Hypothesis Test for Lansmont/Amgen Study; Run; Quit;

55
Appendix F
SAS Output for Signal Data
Kyle Dunno MS RESEARCH
Obs Flight Grms
1 1 0.170 2 2 0.190 3 3 0.119 4 4 0.184 5 5 0.173 6 6 0.139 7 7 0.153 8 8 0.168 9 9 0.192 10 10 0.166 11 11 0.173 12 12 0.166 13 13 0.174 14 14 0.161 15 15 0.156 16 16 0.156 17 17 0.153 18 18 0.111 19 19 0.116 20 20 0.169 21 21 0.167 22 22 0.061 23 23 0.156

56
Kyle Dunno MS RESEARCH
The UNIVARIATE Procedure
Variable: Grms
Moments
N 23 Sum Weights 23 Mean 0.15534783 Sum Observations 3.573 Std Deviation 0.02962586 Variance 0.00087769 Skewness -1.7166859 Kurtosis 3.65470684 Uncorrected SS 0.574367 Corrected SS 0.01930922 Coeff Variation 19.070664 Std Error Mean 0.00617742
Basic Statistical Measures
Location Variability
Mean 0.155348 Std Deviation 0.02963 Median 0.166000 Variance 0.0008777 Mode 0.156000 Range 0.13100
Interquartile Range 0.02000
Tests for Location: Mu0=0
Test -Statistic- -----p Value------
Student's t t 25.14769 Pr > |t| <.0001 Sign M 11.5 Pr >= |M| <.0001 Signed Rank S 138 Pr >= |S| <.0001
Quantiles (Definition 5)
Quantile Estimate
100% Max 0.192 99% 0.192 95% 0.190 90% 0.184 75% Q3 0.173 50% Median 0.166 25% Q1 0.153 10% 0.116 5% 0.111 1% 0.061 0% Min 0.061

57
Kyle Dunno MS RESEARCH
The UNIVARIATE Procedure
Variable: Grms
Extreme Observations
-----Lowest---- ----Highest----
Value Obs Value Obs
0.061 22 0.173 11 0.111 18 0.174 13 0.116 19 0.184 4 0.119 3 0.190 2 0.139 6 0.192 9
Stem Leaf # Boxplot 18 402 3 | 16 1667890334 10 +----+ 14 33666 5 +--+-+ 12 9 1 | 10 169 3 0 8 6 1 1 * ----+----+----+----+ Multiply Stem.Leaf by 10**-2 Normal Probability Plot 0.19+ +++*++* * | ** ***+**+ * | **+*+*+++ 0.13+ +++*++ | +++*++* * |+++++++ 0.07+ * +----+----+----+----+----+----+----+----+----+----+ -2 -1 0 +1 +2

58
Kyle Dunno MS RESEARCH
Hypothesis Test for ASTM Level II
The TTEST Procedure
Statistics Lower CL Upper CL Lower CL Upper CL Variable N Mean Mean Mean Std Dev Std Dev Std Dev Std Err Grms 23 0.1425 0.1553 0.1682 0.0229 0.0296 0.0419 0.0062
T-Tests
Variable DF t Value Pr > |t|
Grms 22 -144.83 <.0001

59
Kyle Dunno MS RESEARCH
Hypothesis Test for Young UPS (ISTA 4AB)
The TTEST Procedure
Statistics Lower CL Upper CL Lower CL Upper CL Variable N Mean Mean Mean Std Dev Std Dev Std Dev Std Err Grms 23 0.1425 0.1553 0.1682 0.0229 0.0296 0.0419 0.0062
T-Tests
Variable DF t Value Pr > |t|
Grms 22 6.21 <.0001

60
Kyle Dunno MS RESEARCH
Hypothesis Test for Lansmont/Amgen Study
The TTEST Procedure
Statistics Lower CL Upper CL Lower CL Upper CL Variable N Mean Mean Mean Std Dev Std Dev Std Dev Std Err Grms 23 0.1425 0.1553 0.1682 0.0229 0.0296 0.0419 0.0062
T-Tests
Variable DF t Value Pr > |t|
Grms 22 22.40 <.0001

61
REFERENCES
ASTM International. (2008) Selected ASTM Standards on Packaging. Philadelphia Berman, A and Hannibal, A. (1979) “Passenger Vibration in Transportation Vehicles”,
The American Society of Mechanical Engineers. Brandenburg, Richard and Lee, Julian June-Ling. (2001) Fundamentals of Packaging
Dynamics. L.A.B. Equipment, Inc. Devore, Jay. (1991) Probability and Statistics for Engineering and the Sciences. Pacific
Grove, CA. FedEx Air Cargo Services. (2007) Air Cargo Services. Accessed from http://www.fedex.com/us/services/expressfreight/intl/aircargo.html
on July 25, 2008. Freund, Rudolf and Wilson, William. (1997) Statistical Methods Revised Edition. San
Diego, CA General Technical Report FPL 22. (1979) Forest Products Laboratory, U.S. Department
of Agriculture. Madison, WI. Goleta Air and Space Museum. (2008) Santa Barbara Airport. Accessed from
http://www.air-and-space.com on August 12, 2008. ISTA Resource Book. (2008) “ISTA Preshipment Test Procedure 4AB.” ISTA. Joneson, Eric. (2008) Conversation concerning Air Vibration Study. Conducted on April
14, 2008. Joneson, Eric. (2006) Development of Testing Standard for Vibration Simulation.
Procedings of Dimensions 06. International Safe Transit Association: San Antonio, TX.
Kipp, William I. (2002) “Accelerated Vibration Testing of Packaged-Products”, TEST
Engineering & Management Magazine. Ott, R.L. & Longnecker, M. (2001). An introduction to statistical methods and data
analysis (5th ed.). Pacific Grove, CA: Duxbury.

62
Singh, P., Joneson, E., Singh, J., Grewal, G. (2007) Dynamic Analysis of Less-than-truckload Shipments and Test Method to Simulate This Environment. Packaging Technology and Science,
Soroka, Walter (2002). Fundamentals of Packaging Technology. Institute of Packaging Professionals. Trost, T. Stresses in Air Cargo Transportation. Packaging Technology and Science,
1988; Vol. 1: 137-155. U.S. Department of Transportation Federal Aviation Administration Type Certification
Data Sheet P15BO. (2007) Young, D.E., Cook B.J., and Gordon, R.D. (1997) Quantifying the Vibration
Environment of a Small Parcel System. Proceedings from Transpack 1997, Orlando, FL.
UPS Air Cargo (2007). Aircraft. Accessed from http://www.ups.com/aircargo/using/services/services/domestic/svc-aircraft.html
on July 25, 2008.
Related Documents