Int. J. Electrochem. Sci., 9 (2014) 3398 - 3408 International Journal of ELECTROCHEMICAL SCIENCE www.electrochemsci.org Analysis of H7N7 Equine Influenza Virus by Spectrometric and Electrochemical Methods Marie Konecna 1,2 , Karel Novotny 1 , Sona Krizkova 1,2 , Iva Blazkova 1,2 , Pavel Kopel 1,2 , Renata Kensova 1,2 , Dana Fialová 1,2 , Kateřina Tmejová 1,2 , Ludmila Krejcova 1,2 , David Hynek 1,2 , David Prochazka 1,3 , Jozef Kaiser 1,3 , Vojtech Adam 1,2 , Jaromir Hubalek 1,2 , Jindrich Kynicky 4 , Petr Lany 5 , Rene Kizek *1,2 1 Central European Institute of Technology, Brno University of Technology, Technicka 3058/10, CZ- 616 00 Brno, Czech Republic, European Union 2 Department of Chemistry and Biochemistry, Faculty of Agronomy, Mendel University in Brno, Zemedelska 1, CZ-613 00 Brno, Czech Republic, European Union 3 Institute of Physical Engineering, Brno University of Technology, Brno, Czech Republic 4 Karel Englis College, Sujanovo nam. 356/1, CZ-602 00, Brno, Czech Republic, European Union 5 Department of Infectious Diseases and Epidemiology, Faculty of Veterinary Medicine, University of Veterinary and Pharmaceutical Science, Palackeho nam. 2, 620 00, Brno, Czech Republic, European Union * E-mail: [email protected] Received: 18 January 2014 / Accepted: 17 March 2014 / Published: 14 April 2014 The spectroscopic and electrochemical methods are tested for influenza detection in this study. Cadmium containing quantum dots (QDs) solutions were investigated. Total Cd content is determined by electrochemistry. Utilization of Laser-induced breakdown spectroscopy (LIBS) for QDs analysis in liquid solution deposited on the surface of carrier medium was studied. For comparison of the results the fluorescence measurement were provided. It was confirmed that LIBS technique is advantageous for detection of metal-containing nanoparticles. Keywords: Voltammetry, LIBS; Influenza Virus; Quantum Dots; Cadmium Detection 1. INTRODUCTION Influenza viruses belong to the family Orthomyxoviridae with a segmented genome made of eight single-stranded negative RNA segments, most of which encode only one viral protein (e.g. hemagglutinin, neuraminidase, matrix protein, and/or nucleoprotein). Fifteen HA subtypes (H1–H15) and nine NA subtypes (N1–N9) have been identified. H1N1, H1N2 and H3N2 subtypes are only currently circulating in the human population [1,2]. Influenza A viruses are characterized by subtype

Welcome message from author
This document is posted to help you gain knowledge. Please leave a comment to let me know what you think about it! Share it to your friends and learn new things together.
Transcript

Int. J. Electrochem. Sci., 9 (2014) 3398 - 3408
International Journal of
ELECTROCHEMICAL
SCIENCE
www.electrochemsci.org
Analysis of H7N7 Equine Influenza Virus by Spectrometric and
Electrochemical Methods
Marie Konecna
1,2, Karel Novotny
1, Sona Krizkova
1,2, Iva Blazkova
1,2, Pavel Kopel
1,2, Renata
Kensova1,2
, Dana Fialová1,2
, Kateřina Tmejová1,2
, Ludmila Krejcova1,2
, David Hynek1,2
, David
Prochazka1,3
, Jozef Kaiser1,3
, Vojtech Adam1,2
, Jaromir Hubalek1,2
, Jindrich Kynicky4, Petr Lany
5,
Rene Kizek*1,2
1 Central European Institute of Technology, Brno University of Technology, Technicka 3058/10, CZ-
616 00 Brno, Czech Republic, European Union 2 Department of Chemistry and Biochemistry, Faculty of Agronomy, Mendel University in Brno,
Zemedelska 1, CZ-613 00 Brno, Czech Republic, European Union 3Institute of Physical Engineering, Brno University of Technology, Brno, Czech Republic
4Karel Englis College, Sujanovo nam. 356/1, CZ-602 00, Brno, Czech Republic, European Union
5Department of Infectious Diseases and Epidemiology, Faculty of Veterinary Medicine, University of
Veterinary and Pharmaceutical Science, Palackeho nam. 2, 620 00, Brno, Czech Republic, European
Union *E-mail: [email protected]
Received: 18 January 2014 / Accepted: 17 March 2014 / Published: 14 April 2014
The spectroscopic and electrochemical methods are tested for influenza detection in this study.
Cadmium containing quantum dots (QDs) solutions were investigated. Total Cd content is determined
by electrochemistry. Utilization of Laser-induced breakdown spectroscopy (LIBS) for QDs analysis in
liquid solution deposited on the surface of carrier medium was studied. For comparison of the results
the fluorescence measurement were provided. It was confirmed that LIBS technique is advantageous
for detection of metal-containing nanoparticles.
Keywords: Voltammetry, LIBS; Influenza Virus; Quantum Dots; Cadmium Detection
1. INTRODUCTION
Influenza viruses belong to the family Orthomyxoviridae with a segmented genome made of
eight single-stranded negative RNA segments, most of which encode only one viral protein (e.g.
hemagglutinin, neuraminidase, matrix protein, and/or nucleoprotein). Fifteen HA subtypes (H1–H15)
and nine NA subtypes (N1–N9) have been identified. H1N1, H1N2 and H3N2 subtypes are only
currently circulating in the human population [1,2]. Influenza A viruses are characterized by subtype
Int. J. Electrochem. Sci., Vol. 9, 2014
3399
by the two major surface glycoproteins, hemagglutinin and neuraminidase. Influenza A viruses infect
poultry, aquatic birds, pigs, horses and sea mammals. The influenza virus is highly contagious and
infects as much as 15% of the human population every year and it has a significant impact on today's
society with over 500,000 deaths worldwide and 5 million annual hospitalizations attributed to
influenza every year. Due to the fact that there is a threat of future pandemics, the development of
methods for early influenza detection is very important.
The influenza virus, vaccine and antiviral drugs that target the virus can be characterized by
different genetic and proteomic approaches. One of the most important and advantageous is mass
spectrometry (MS), especially high resolution mass spectrometry or mass mapping. By this manner
primary structure of the surface protein antigens was investigated and described as it was described by
Downard et al., whose mass spectrometric immunoassay was developed and applied to assess the
structure and antigenicity of the virus in terms of the hemagglutinin antigen. The characterization and
quantitation of antiviral drugs against the virus, and their metabolites, were monitored in blood, serum,
and urine [3]. A matrix-assisted laser desorption ionization (MALDI) mass spectrometry was used for
theidentification of inhibitor binding to active site residues of influenza neuraminidase [4]. It enables
us to screen new inhibitor drug candidates and also to identify strains resistant to antiviral inhibitors.
MALDI and tandem mass spectrometry (MS/MS) were used to the antigenic characterization of three
H3N2 type A influenza strains [5]. Parainfluenza viruses (PIVs) are one of the most common causes of
respiratory tract infections in children and can be life-threatening when the airway becomes obstructed.
Matrix-assisted laser desorption ionization fourier transform−ion cyclotron resonance (maldi ft-icr)
Mass Spectrometry was shown as a new proteotyping approach to be able to distinguish common
human serotypes of the PIV from the perspective of all surface and internal viral proteins [6]. The
principle of MALDI is based on the dispersion of the sample in a large excess of matrix. Matrix
contains chromophore and heavily absorbs UV laser light and in the presence in a large molar excess it
absorbs essentially all of the laser radiation. Matrix material isolates sample molecules in a chemical
environment, which enhances the probability of ionization without fragmentation. MALDI as a soft
ionization technique used in mass spectrometry is the one of the most frequently applied for both,
characterization the structure and antigenicity of the influenza virus in terms of its component antigens.
In developing this MALDI-based approach, it is possible to both preserve and ionize solution-specific
antigen–antibody complexes on MALDI targets without the immobilization, pretreatment or affinity
capture of either component [7-9]. Another technique enables large, highly polar biopolymers to be
introduced directly into a mass spectrometer is electrospray ionization (ESI) [9].
In some cases of detection it is necessary to connect mass spectrometry with various separation
methods. Chromatographic methods, especially capillary electrophoresis (CE), are applied. Capillary
electrophoresis mass spectrometry was used for the characterization of glycans from fish serum [10].
In this work highly sialylated negatively charged O-acetylated N-glycans are CE-separated and MS-
detected in negative electrospray ionization (ESI) mode without the need for derivatization. The
method of capillary isoelectric focusing (CIEF) with UV detection for influenza viruses was used to
test the purification of the virus from the biological samples of equine and swine influenza viruses
present in infected allantoic fluid of specific pathogen free embryonated chicken eggs [11]. CIEF was
found to be a suitable method for the rapid testing of the efficiency of the virus purification.
Int. J. Electrochem. Sci., Vol. 9, 2014
3400
Influenza detection is often realized by fluorescence measurement, especially fluorescence
immunoassay. Indirect fluorescence immunoassay provides a novel method for the detection of avian
influenza virus (AIV) [12]. The method was based on label-free quantum dot probe and lateral flow
test strip. By the sandwich immunoreaction performed on lateral flow test strip, the gold nanoparticle
labels were captured in the test zone and further dissolved to release a large number of gold ions as a
signal transduction bridge that was detected by the QDs-based fluorescence quenching method. The
limit of detection was estimated to be 0.09 ng mL−1 AIV, which was 100-fold greater than enzyme-
linked immunosorbent assay (ELISA). Different kinds of dynamic fluorescence microscopy methods,
such as fluorescence photoactivation localization microscopy (FPALM), Förster’s (or fluorescence)
resonance energy transfer (FRET) or fluorescence recovery after photobleaching (FRAP) were used
for lipid domain association of influenza virus proteins detection [13]. Fluorescence imaging was
applied for detection of whole viruses and viral proteins with a new label-free platform based on
spectral reflectance imaging. The interferometric reflectance imaging sensor (IRIS) was shown to be
capable of sensitive protein and DNA detection in a real time and high-throughput format [14]. For the
fluorescence measurement it is necessary to prepare molecules exhibiting fluorescence properties. For
this purpose organic dyes and nanoparticles including quantum dots can be used.
Quantum dots (QDs) are nanometer-scale semiconductor crystals, typically of size range 2–6
nm [15]. They compose of groups II–VI or III–V elements and they have unique optical and electronic
properties in comparison with organic dyes and fluorescent proteins. They belong to new class of
fluorescent probes for biomolecular and cellular imaging, especially in vivo imaging [16]. CdSe or
CdTe QDs can be also applied as chemiluminescent probes for the detection of trace metal ions. Metal
ions including Sb, Se, Ag and Cu were investigated due to the inhibition of the chemiluminescence
when QDs are oxidized by H2O2. For better selectivity and sensitivity of the chemiluminescent assay,
liquid–liquid–liquid microextraction was implemented [17,18]. Biomolecules labeled with
nanoparticles or quantum dots including proteins, nucleic acids, lipids and biologically active small
molecules. Thus formed conjugates can be observed by different analytical procedures. One of the
advantageous techniques is metal detection or determination by application of various spectroscopic
techniques. Metal included in quantum dot can be advantageously determined by laser-induced
breakdown spectroscopy (LIBS). This sensitive optical technique is capable of fast multi-elemental
analysis of solid, gaseous and liquid samples [19], and is based on spectroscopic analysis of radiation,
which is emitted by a micro-plasma induced on the analyte surface by a laser pulse. Different kinds of
samples have been analyzed by this method as minerals, bricks, soil pellets, biominerals, bones, dried
or fried plant leaves or algal biomass [19-24].
Besides to spectrometric methods electrochemical methods can be used advantageously to
detect influenza viruses or proteins. Differential pulse voltammetry at hanging mercury drop electrode
(HMDE) and/or glassy carbon electrode (GCE) was applied for detection of cadmium sulfide quantum
dots – influenza viral protein complexes isolated using paramagnetic microparticles [25].
Hybridization design probes consisting of paramagnetic particles and quantum dots with targeted DNA
and their application for detection of avian influenza virus (H5N1) were investigated by Krejcova et al.
[26]. Differential pulse voltammetry was also used for detection of cadmium(II) ions and square wave
voltammetry for detection of cytosine-adenine peak in ODN-SH-Cd complex. Multi target bar code
Int. J. Electrochem. Sci., Vol. 9, 2014
3401
assay based on the electrochemical analysis of isolated target molecules labeled with quantum dots
was introduced also in our previous work [27].
The aim of this study is the studying of quantum dots containing cadmium detection. For QDs
detection, fluorescence based and LIBS were used as well as above mentioned electrochemical ones.
2. EXPERIMENTAL PART
2.1. Chemicals
Working solutions like buffers and standard solutions were prepared daily by diluting the stock
solutions. Standards and other chemicals were purchased from Sigma-Aldrich (St. Louis, MO, USA)
meets the specification of American Chemical Society (ACS), unless noted otherwise. Methyl
cellosolve as well as tin chloride were purchased from Ingos (Prague, Czech Republic). Deionised
water underwent demineralization by reverse osmosis using the instruments Aqua Osmotic 02 (Aqua
Osmotic, Tisnov, Czech Republic) and then it was subsequently purified using Millipore RG
(Millipore Corp., USA, 18 MΏ) – MiliQ water.
2.2. Preparation of stock solution of CdS QDs
CdS QDs stabilized with mercaptopropionic acid (MPA) were prepared using a slightly
modified method published by Li et al. [28]. Cadmium nitrate tetrahydrate Cd(NO3)2·4H2O was
dissolved in ACS water (25 ml). 3-mercaptopropionic acid (35 µl, 0.4 mM) was slowly added to
stirred solution. Afterwards, pH was adjusted to 9.1 with 1 M NH3 (1.5 ml). Sodium sulfide
nanohydrate Na2S·9H2O in 23 ml of ACS water was poured into the first solution under vigorous
stirring. The obtained yellow solution was stirred for 1 h. CdS QDs stabilized with glutathione were
prepared similarly to CdS MPA QDs. Glutathione (0.25 mM) was added to the solution of
Cd(NO3)2·4H2O (0.1 mM) in ACS water (25 ml). pH was adjusted to 9.0 with 1M NH3 (1.5 ml).
Na2S·9H2O (0.1 mM) in ACS water (23 ml) was poured into the first solution under vigorous stirring.
Colorless solution turned to light yellow after 3 h. CdS QDs were stored in dark at 4 ºC.
2.3. Fluorescence measurement
Monitoring of fluorescence was performed using an In vivo Xtreme system by Carestream
(Rochester, NY, USA). This instrument was equipped with a 400 W xenon light source and 28
excitation filters (410–760 nm). The emitted light was captured by a 4MP CCD camera. The excitation
and emission wavelengths were set in accordance with absorption and fluorescence spectra.
2.4. Double pulse LIBS spectrometer with Echelle configuration
Geometric configuration of laser pulses was orthogonal and the setup was composed of two Q-
switched Nd:YAG lasers both operating at 10 Hz. LQ 529a (SOLAR, BY) operated at the second
Int. J. Electrochem. Sci., Vol. 9, 2014
3402
harmonic (532 nm) with pulse width ~ 10 ns was used as an ablation source and Brilliant B (Quantel,
FR) at first harmonic (1064 nm) with pulse width ~ 6 ns was used for reheating the plasma. The energy
of primary/ablation laser pulse was 12 mJ per pulse and the energy of secondary/re-excitation laser
pulse was 110 mJ per pulse. Sample was mounted on a stage with precision movements (2 µm
resolution) inside an ablation chamber (Tescan, CZ). The ablation spot was targeted and controlled by
a CCD camera placed outside of the ablation chamber. The LIBS plasma radiation was collected with
an UV-NIR achromatic collimating mirror system, the CC52 (ANDOR, UK), and transported onto the
entrance of a spectrometer in Echelle configuration (ME5000, Mechelle, ANDOR, UK) by a fiber
optic system (25 µm in diameter). ICCD camera (iStar 734i, ANDOR, UK) was employed as a
detector. Laser and detection timing was optimized to obtain the best signal to noise ratio and adjusted
to delay of the signal detection to 1.5 µs, integration time to 16 µs, and interpulse delay to 1.5 µs.
2.5. Double pulse LIBS - spectrometer with Czerny-Turner configuration
The first ablation laser, which irradiates the surface of a sample, was a Nd:YAG laser operating
at fourth harmonic frequency 266 nm (New Wave, UP-266 MACRO) with the energy of 10 mJ per
pulse. The laser system UP-266 MACRO was equipped with a sample holder with software-controlled
movement in x,y direction and hand-controlled z direction movement. The plate with the sample was
firmly fixed on the holder and measured in the air at atmospheric pressure. As the second laser, re-
heating laser that propagates beam parallel to the sample surface was used (Quantel, Brilliant Nd:YAG
laser at fundamental wavelength 1064 nm with energy 100 mJ per pulse and interpulse delay 500 ns) to
create a coincident spark about 0.5 mm above the surface of the sample. The plasma emission was
collected and transported by means of 3 m long optical fiber into the entrance of a monochromator
(Jobin Yvon, TRIAX 320) and detected with the an ICCD detector (Jobin Yvon, Horiba). The delay of
detection of the signal after reheating laser pulse was 1 µs and the integration time was 10 µs.
2.6. Electrochemical analysis
Cd in QDs itself and Cd from HA-QDs complexes were detected by differential pulse anodic
stripping voltammetry (DPASV). All of measurements were performed using a 663 VA Stand
(Metrohm), equipped with a standard cell with three electrodes. The three electrode system was
consists of a hanging mercury drop electrode (HMDE) with a drop area of 0.4 mm2
as the working
electrode, an Ag/AgCl/3M KCl reference electrode and a glassy carbon acting as the auxiliary
electrode. GPES 4.9 software was employed for data processing. The analyzed samples were
deoxygenated prior to measurements by purging with argon (99.999%). Acetate buffer (0.2 M
CH3COONa and 0.2 M CH3COOH, pH 5) was used as a supporting electrolyte. The supporting
electrolyte was replaced after each analysis. The parameters of the measurement were as follows:
purging time 100 s; deposition potential -0.85 V; equilibration time 2 s; modulation time 0.057 s;
interval time 0.2 s; initial potential -0.85 V; end potential -0.4 V; step potential 0.005 V; modulation
Int. J. Electrochem. Sci., Vol. 9, 2014
3403
amplitude 0.025 V; sample volume: 5 µl; volume of measurement cell: 1000 μl (5 μl of sample; 995 μl
acetate buffer). Optimized parameter was time of accumulation.
2.7. Descriptive statistics
Data were processed using MICROSOFT EXCELs (USA) and STATISTICA.CZ Version 8.0
(Czech Republic). The results are expressed as mean ± SD unless noted otherwise. The detection limits
(3 signal/noise, S/N) were calculated according to Long and Winefordner [29], whereas N was
expressed as a standard deviation of noise determined in the signal domain unless stated otherwise.
3. RESULTS AND DISCUSSION
3.1. Electrochemical characterization
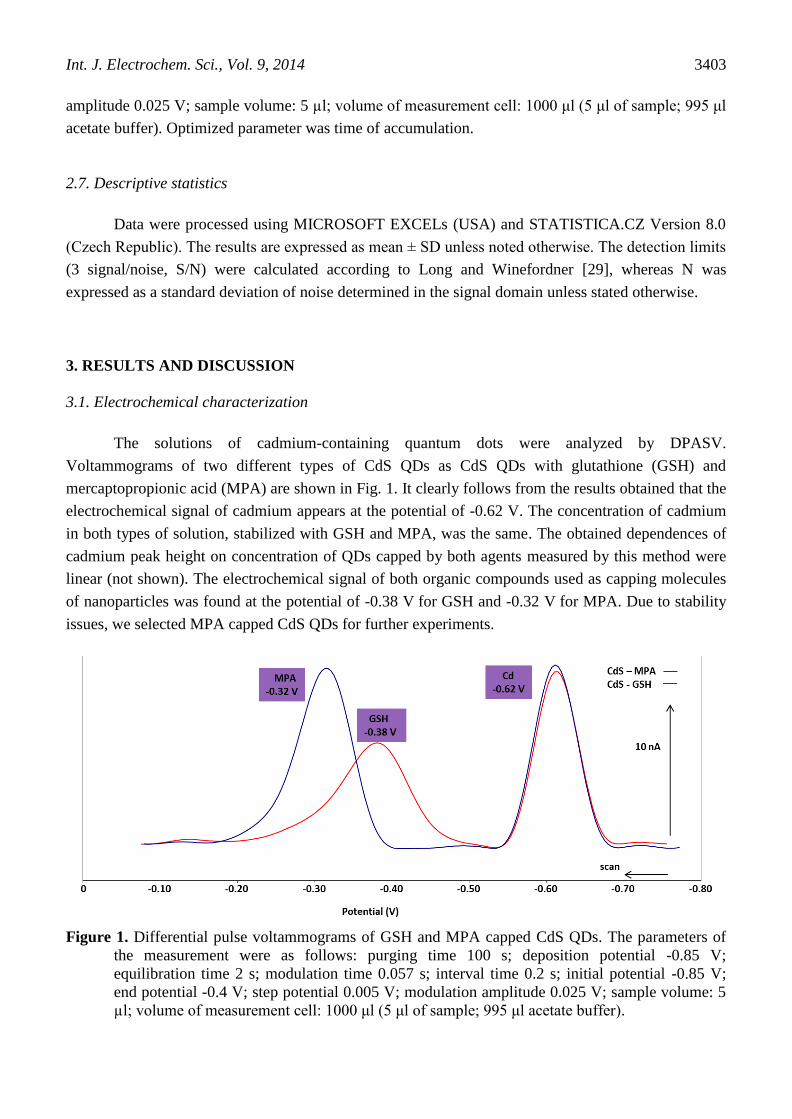
The solutions of cadmium-containing quantum dots were analyzed by DPASV.
Voltammograms of two different types of CdS QDs as CdS QDs with glutathione (GSH) and
mercaptopropionic acid (MPA) are shown in Fig. 1. It clearly follows from the results obtained that the
electrochemical signal of cadmium appears at the potential of -0.62 V. The concentration of cadmium
in both types of solution, stabilized with GSH and MPA, was the same. The obtained dependences of
cadmium peak height on concentration of QDs capped by both agents measured by this method were
linear (not shown). The electrochemical signal of both organic compounds used as capping molecules
of nanoparticles was found at the potential of -0.38 V for GSH and -0.32 V for MPA. Due to stability
issues, we selected MPA capped CdS QDs for further experiments.
Figure 1. Differential pulse voltammograms of GSH and MPA capped CdS QDs. The parameters of
the measurement were as follows: purging time 100 s; deposition potential -0.85 V;
equilibration time 2 s; modulation time 0.057 s; interval time 0.2 s; initial potential -0.85 V;
end potential -0.4 V; step potential 0.005 V; modulation amplitude 0.025 V; sample volume: 5
µl; volume of measurement cell: 1000 μl (5 μl of sample; 995 μl acetate buffer).
Int. J. Electrochem. Sci., Vol. 9, 2014
3404
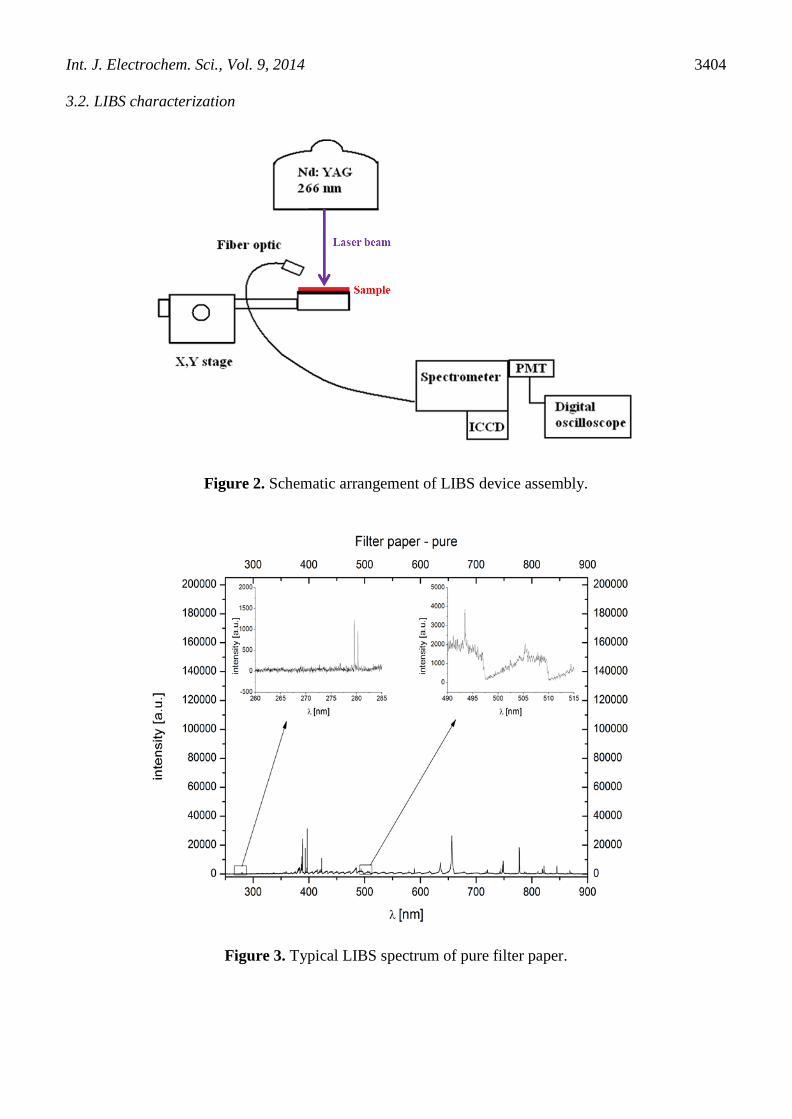
3.2. LIBS characterization
Figure 2. Schematic arrangement of LIBS device assembly.
Figure 3. Typical LIBS spectrum of pure filter paper.
Int. J. Electrochem. Sci., Vol. 9, 2014
3405
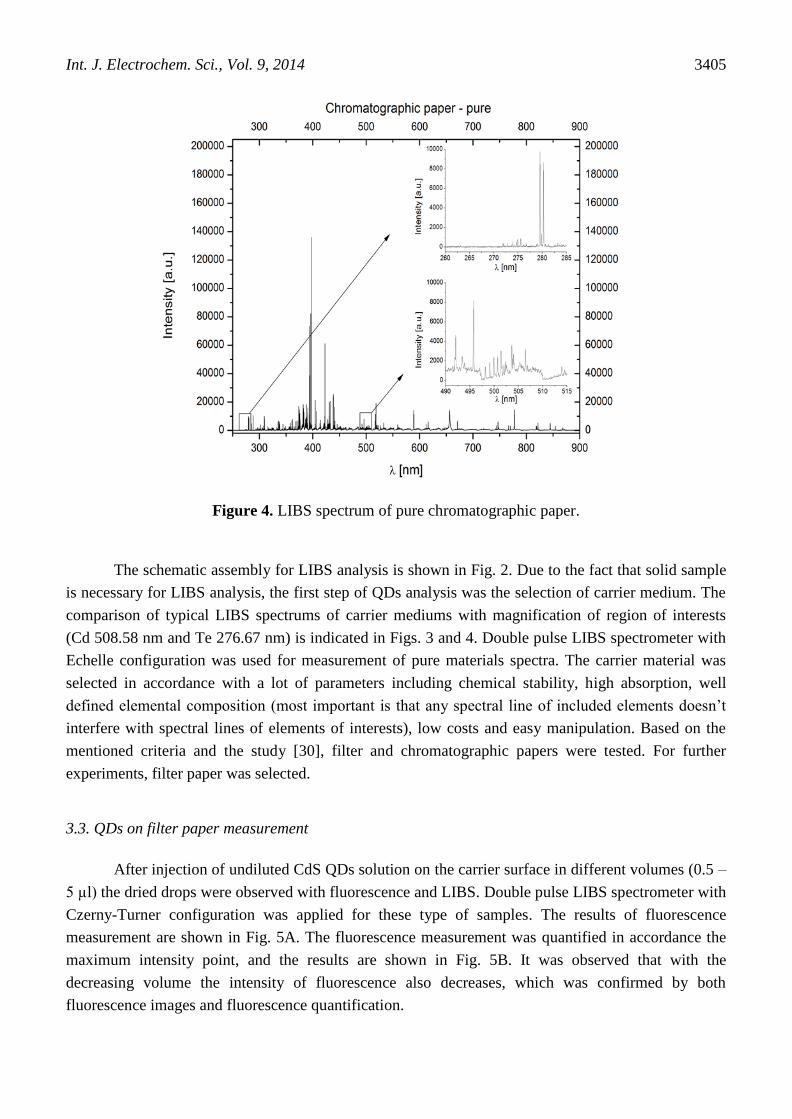
Figure 4. LIBS spectrum of pure chromatographic paper.
The schematic assembly for LIBS analysis is shown in Fig. 2. Due to the fact that solid sample
is necessary for LIBS analysis, the first step of QDs analysis was the selection of carrier medium. The
comparison of typical LIBS spectrums of carrier mediums with magnification of region of interests
(Cd 508.58 nm and Te 276.67 nm) is indicated in Figs. 3 and 4. Double pulse LIBS spectrometer with
Echelle configuration was used for measurement of pure materials spectra. The carrier material was
selected in accordance with a lot of parameters including chemical stability, high absorption, well
defined elemental composition (most important is that any spectral line of included elements doesn’t
interfere with spectral lines of elements of interests), low costs and easy manipulation. Based on the
mentioned criteria and the study [30], filter and chromatographic papers were tested. For further
experiments, filter paper was selected.
3.3. QDs on filter paper measurement
After injection of undiluted CdS QDs solution on the carrier surface in different volumes (0.5 –
5 µl) the dried drops were observed with fluorescence and LIBS. Double pulse LIBS spectrometer with
Czerny-Turner configuration was applied for these type of samples. The results of fluorescence
measurement are shown in Fig. 5A. The fluorescence measurement was quantified in accordance the
maximum intensity point, and the results are shown in Fig. 5B. It was observed that with the
decreasing volume the intensity of fluorescence also decreases, which was confirmed by both
fluorescence images and fluorescence quantification.
Int. J. Electrochem. Sci., Vol. 9, 2014
3406
Figure 5. (A) CdS QDs fluorescence measurements after injection of different volumes (0.5, 1 and 5
µl) on the surface of carrier material (excitation wavelength 460 nm, emission wavelength 700
nm). (B) The dependence of fluorescence intensity on the injected volume (0.5, 1 and 5 µl) of
the sample of QDs.
After injection of the quantum dots solution onto the surface of carrier material, the dried drops
were analyzed by LIBS. Cadmium was measured on its emission line Cd (I) 508.58 nm. From the each
point intensity of the raster, the Cd maps were constructed. The maps for different QDs CdS samples
volumes are shown in Fig. 6.
Figure 6. LIBS intensity measured on emission line Cd (I) 508.58 nm. The square, zoomed with Cd
LIBS distribution map, defines the area of raster 3600 x 3600 µm. The number in each map
means the range of the maximum intensity.
Int. J. Electrochem. Sci., Vol. 9, 2014
3407
4. CONCLUSIONS
In this study we described method for rapid detection of nanoparticles. The total metal content
was determined electrochemically and the method of LIBS was confirmed as the suitable for
nanoparticles detection. As the example quantum dots containing cadmium was investigated.
Cadmium LIBS maps were constructed and the distribution on the carrier material was observed.
ACKNOWLEDGEMENTS
The financial support from NanoBioMetalNet CZ.1.07/2.4.00/31.0023 is highly acknowledged. The
authors wish to express their thanks to Michal Zurek and Simona Dostalova for perfect technical
assistance.
CONFLICT OF INTEREST:
The authors have declared no conflict of interest.
References
1. M. P. Girard, U. Fruth and M. P. Kieny, Vaccine, 23 (2005) 5725.
2. K. M. Neuzil, B. G. Mellen, P. F. Wright, E. F. Mitchel and M. R. Griffin, N. Engl. J. Med., 342
(2000) 225.
3. K. M. Downard, B. Morrissey and A. B. Schwahn, Mass Spectrom. Rev., 28 (2009) 35.
4. K. Swaminathan and K. M. Downard, Anal. Chem., 84 (2012) 3725.
5. B. Morrissey, M. Streamer and K. M. Downard, J. Virol. Methods, 145 (2007) 106.
6. A. P. Nguyen and K. M. Downard, Anal. Chem., 85 (2013) 1097.
7. B. Morrissey and K. M. Downard, Proteomics, 6 (2006) 2034.
8. J. G. Kiselar and K. M. Downard, Anal. Chem., 71 (1999) 1792.
9. K. M. Downard, J. Mass Spectrom., 35 (2000) 493.
10. R. G. Jayo, J. J. Li and D. D. Y. Chen, Anal. Chem., 84 (2012) 8756.
11. M. Horka, O. Kubicek, A. Kubesova, Z. Kubickova, K. Rosenbergova and K. Slais,
Electrophoresis, 31 (2010) 331.
12. X. P. Li, D. L. Lu, Z. H. Sheng, K. Chen, X. B. Guo, M. L. Jin and H. Y. Han, Talanta, 100 (2012)
1.
13. M. Veit, S. Engel, B. Thaa, S. Scolari and A. Herrmann, Cell Microbiol., 15 (2013) 179.
14. C. A. Lopez, G. G. Daaboul, R. S. Vedula, E. Ozkumur, D. A. Bergstein, T. W. Geisbert, H. E.
Fawcett, B. B. Goldberg, J. H. Connor and M. S. Unlu, Biosens. Bioelectron., 26 (2011) 3432.
15. T. Jamieson, R. Bakhshi, D. Petrova, R. Pocock, M. Imani and A. M. Seifalian, Biomaterials, 28
(2007) 4717.
16. M. Ryvolova, J. Chomoucka, J. Drbohlavova, P. Kopel, P. Babula, D. Hynek, V. Adam, T.
Eckschlager, J. Hubalek, M. Stiborova, J. Kaiser and R. Kizek, Sensors, 12 (2012) 14792.
17. I. Costas-Mora, V. Romero, I. Lavilla and C. Bendicho, Anal. Chim. Acta, 788 (2013) 114.
18. Z. H. Sheng, H. Y. Han and J. G. Liang, Luminescence, 24 (2009) 271.
19. G. Vitkova, K. Novotny, L. Prokes, A. Hrdlicka, J. Kaiser, J. Novotny, R. Malina and D.
Prochazka, Spectroc. Acta Pt. B-Atom. Spectr., 73 (2012) 1.
20. L. Krajcarova, K. Novotny, P. Babula, I. Provaznik, P. Kucerova, V. Adam, M. Z. Martin, R.
Kizek and J. Kaiser, Int. J. Electrochem. Sci., 8 (2013) 4485.

Int. J. Electrochem. Sci., Vol. 9, 2014
3408
21. K. Stepankova, K. Novotny, M. V. Galiova, V. Kanicky, J. Kaiser and D. W. Hahn, Spectroc. Acta
Pt. B-Atom. Spectr., 81 (2013) 43.
22. P. Porizka, D. Prochazka, Z. Pilat, L. Krajcarova, J. Kaiser, R. Malina, J. Novotny, P. Zemanek, J.
Jezek, M. Sery, S. Bernatova, V. Krzyzanek, K. Dobranska, K. Novotny, M. Trtilek and O. Samek,
Spectroc. Acta Pt. B-Atom. Spectr., 74-75 (2012) 169.
23. M. Galiova, J. Kaiser, K. Novotny, M. Ivanov, M. N. Fisakova, L. Mancini, G. Tromba, T.
Vaculovic, M. Liska and V. Kanicky, Anal. Bioanal. Chem., 398 (2010) 1095.
24. O. Krystofova, P. Babula, J. Kaiser, K. Novotny, J. Zehnalek, V. Adam and R. Kizek, Lis. Cukrov.
Repar., 126 (2010) 402.
25. L. Krejcova, D. Dospivova, M. Ryvolova, P. Kopel, D. Hynek, S. Krizkova, J. Hubalek, V. Adam
and R. Kizek, Electrophoresis, 33 (2012) 3195.
26. L. Krejcova, D. Hynek, P. Kopel, V. Adam, J. Hubalek, L. Trnkova and R. Kizek,
Chromatographia, 76 (2013) 355.
27. L. Krejcova, D. Hynek, P. Kopel, M. A. M. Rodrigo, V. Adam, J. Hubalek, P. Babula, L. Trnkova
and R. Kizek, Viruses-Basel, 5 (2013) 1719.
28. H. Li, W. Y. Shih and W. H. Shih, Ind. Eng. Chem. Res., 46 (2007) 2013.
29. G. L. Long and J. D. Winefordner, Anal. Chem., 55 (1983) A712.
30. M. Konecna, K. Novotny, S. Krizkova, I. Blazkova, P. Kopel, J. Kaiser, V. Adam and R. Kizek,
Anal. Chem., in press (2014).
© 2014 The Authors. Published by ESG (www.electrochemsci.org). This article is an open access
article distributed under the terms and conditions of the Creative Commons Attribution license
(http://creativecommons.org/licenses/by/4.0/).
Related Documents