Molecular Plant • Volume 4 • Number 6 • Pages 1074–1091 • November 2011 RESEARCH ARTICLE Analysis of Gene Expression Patterns during Seed Coat Development in Arabidopsis Gillian Dean a , YongGuo Cao b , DaoQuan Xiang b , Nicholas J. Provart c , Larissa Ramsay b , Abdul Ahad a , Rick White d , Gopalan Selvaraj b , Raju Datla b and George Haughn a,1 a Department of Botany, University of British Columbia, 6270 University Blvd, Vancouver, BC, V6T 1Z4, Canada b National Research Council of Canada Plant Biotechnology Institute, 110 Gymnasium Place, Saskatoon, SK, S7N 0W9, Canada c Department of Cell and Systems Biology/Centre for the Analysis of Genome Evolution and Function, University of Toronto, 25 Willcocks St, Toronto, ON, M5S 3B2, Canada d Department of Statistics, University of British Columbia, 6356 Agricultural Road, Vancouver, BC, V6T 1Z2, Canada ABSTRACT The seed coat is important for embryo protection, seed hydration, and dispersal. Seed coat composition is also of interest to the agricultural sector, since it impacts the nutritional value for humans and livestock alike. Although some seed coat genes have been identified, the developmental pathways controlling seed coat development are not completely elucidated, and a global genetic program associated with seed coat development has not been reported. This study uses a combination of genetic and genomic approaches in Arabidopsis thaliana to begin to address these knowledge gaps. Seed coat development is a complex process whereby the integuments of the ovule differentiate into specialized cell types. In Arabidopsis, the outermost layer of cells secretes mucilage into the apoplast and develops a secondary cell wall known as a columella. The layer beneath the epidermis, the palisade, synthesizes a secondary cell wall on its inner tangential side. The innermost layer (the pigmented layer or endothelium) produces proanthocyanidins that condense into tannins and oxidize, giving a brown color to mature seeds. Genetic separation of these cell layers was achieved using the ap2-7 and tt16-1 mutants, where the epidermis/palisade and the endothelium do not develop respectively. This genetic ablation was exploited to examine the developmental programs of these cell types by isolating and collecting seed coats at key tran- sitions during development and performing global gene expression analysis. The data indicate that the developmental programs of the epidermis and the pigmented layer proceed relatively independently. Global expression datasets that can be used for identification of new gene candidates for seed coat development were generated. These dataset provide a comprehensive expression profile for developing seed coats in Arabidopsis, and should provide a useful resource and reference for other seed systems. Key words: Seed coat; microarray; APETALA2; TRANSPARENT TESTA16; mucilage; pectin; secondary cell wall; pigmented layer; proanthocyanidin. INTRODUCTION In angiosperms, the mature seed consists of an embryo, a seed coat, and, in many cases, an endosperm. The embryo and the endosperm are products of the fusion of sperm cells with the egg cell and central cell, respectively. In addition, these fertiliza- tion events induce the integuments of the ovule to differentiate into a seed coat (testa; Beeckman et al., 2000; Western et al., 2000). The structure of the seed coat varies between species, but fulfills similar roles, including protection of the embryo, lim- itation of desiccation during dormancy and germination, and promotion of seed dispersal. Differentiation of the Arabidopsis seed coat has been well studied and comprises several layers of specialized cell types (reviewed in Haughn and Chaudhury, 2005). At the time of fer- tilization, the embryo sac of the ovule is surrounded by an inner integument with two to three cell layers and an outer integument with two cell layers. These integument cells un- dergo a period of significant growth comprising both cell ex- pansion and division. Next, each cell layer follows a distinct developmental program. The innermost layer of the inner in- tegument, the endothelium, synthesizes proanthocyanidin (PA) flavonoid compounds that condense to form tannins. 1 To whom correspondence should be addressed. E-mail george.haughn@ ubc.ca, tel. +1 604 822-9089, fax +1 604 822-6089. ª The Author 2011. Published by the Molecular Plant Shanghai Editorial Office in association with Oxford University Press on behalf of CSPB and IPPE, SIBS, CAS. doi: 10.1093/mp/ssr040, Advance Access publication 7 June 2011 Received 11 February 2011; accepted 18 April 2011 at The University of British Colombia Library on November 21, 2011 http://mplant.oxfordjournals.org/ Downloaded from

Welcome message from author
This document is posted to help you gain knowledge. Please leave a comment to let me know what you think about it! Share it to your friends and learn new things together.
Transcript
Molecular Plant • Volume 4 • Number 6 • Pages 1074–1091 • November 2011 RESEARCH ARTICLE
Analysis of Gene Expression Patterns during SeedCoat Development in Arabidopsis
Gillian Deana, YongGuo Caob, DaoQuan Xiangb, Nicholas J. Provartc, Larissa Ramsayb, Abdul Ahada,Rick Whited, Gopalan Selvarajb, Raju Datlab and George Haughna,1
a Department of Botany, University of British Columbia, 6270 University Blvd, Vancouver, BC, V6T 1Z4, Canadab National Research Council of Canada Plant Biotechnology Institute, 110 Gymnasium Place, Saskatoon, SK, S7N 0W9, Canadac Department of Cell and Systems Biology/Centre for the Analysis of Genome Evolution and Function, University of Toronto, 25 Willcocks St, Toronto, ON, M5S3B2, Canadad Department of Statistics, University of British Columbia, 6356 Agricultural Road, Vancouver, BC, V6T 1Z2, Canada
ABSTRACT The seed coat is important for embryo protection, seed hydration, and dispersal. Seed coat composition is also
of interest to the agricultural sector, since it impacts the nutritional value for humans and livestock alike. Although some
seed coat genes have been identified, the developmental pathways controlling seed coat development are not completely
elucidated, and a global genetic program associated with seed coat development has not been reported. This study uses
a combination of genetic and genomic approaches inArabidopsis thaliana to begin to address these knowledge gaps. Seed
coat development is a complex process whereby the integuments of the ovule differentiate into specialized cell types. In
Arabidopsis, the outermost layer of cells secretes mucilage into the apoplast and develops a secondary cell wall known as
a columella. The layer beneath the epidermis, the palisade, synthesizes a secondary cell wall on its inner tangential side.
The innermost layer (the pigmented layer or endothelium) produces proanthocyanidins that condense into tannins and
oxidize, giving a brown color to mature seeds. Genetic separation of these cell layers was achieved using the ap2-7 and
tt16-1mutants, where the epidermis/palisade and the endothelium do not develop respectively. This genetic ablationwas
exploited to examine the developmental programs of these cell types by isolating and collecting seed coats at key tran-
sitions during development and performing global gene expression analysis. The data indicate that the developmental
programs of the epidermis and the pigmented layer proceed relatively independently. Global expression datasets that can
be used for identification of new gene candidates for seed coat development were generated. These dataset provide
a comprehensive expression profile for developing seed coats in Arabidopsis, and should provide a useful resource
and reference for other seed systems.
Key words: Seed coat; microarray; APETALA2; TRANSPARENT TESTA16; mucilage; pectin; secondary cell wall; pigmented
layer; proanthocyanidin.
INTRODUCTION
In angiosperms, the mature seed consists of an embryo, a seed
coat, and, in many cases, an endosperm. The embryo and the
endosperm are products of the fusion of sperm cells with the
egg cell and central cell, respectively. In addition, these fertiliza-
tion events induce the integuments of the ovule to differentiate
into a seed coat (testa; Beeckman et al., 2000; Western et al.,
2000). The structure of the seed coat varies between species,
but fulfills similar roles, including protection of the embryo, lim-
itation of desiccation during dormancy and germination, and
promotion of seed dispersal.
Differentiation of the Arabidopsis seed coat has been well
studied and comprises several layers of specialized cell types
(reviewed in Haughn and Chaudhury, 2005). At the time of fer-
tilization, the embryo sac of the ovule is surrounded by an
inner integument with two to three cell layers and an outer
integument with two cell layers. These integument cells un-
dergo a period of significant growth comprising both cell ex-
pansion and division. Next, each cell layer follows a distinct
developmental program. The innermost layer of the inner in-
tegument, the endothelium, synthesizes proanthocyanidin
(PA) flavonoid compounds that condense to form tannins.
1 To whom correspondence should be addressed. E-mail george.haughn@
ubc.ca, tel. +1 604 822-9089, fax +1 604 822-6089.
ª The Author 2011. Published by the Molecular Plant Shanghai Editorial
Office in association with Oxford University Press on behalf of CSPB and
IPPE, SIBS, CAS.
doi: 10.1093/mp/ssr040, Advance Access publication 7 June 2011
Received 11 February 2011; accepted 18 April 2011
at The U
niversity of British C
olombia L
ibrary on Novem
ber 21, 2011http://m
plant.oxfordjournals.org/D
ownloaded from
The other two inner integument cell layers do not appear to
differentiate and apparently undergo programmed cell death
(Nakaune et al., 2005). The subepidermal cells of the outer in-
tegument form a thickened cell wall on the inner tangential
side known as the palisade. The epidermal cells of the outer
integument secrete a large amount of pectinaceous mucilage
into the apoplast before forming a volcano-shaped cellulosic
secondary cell wall known as the columella. By maturity, all
seed coat cells have died and all cell layers apart from the epi-
dermal cells, which are preserved by the columella, are crushed
together (Haughn and Chaudhury, 2005). Therefore, the seed
coat provides an interesting developmental system for study,
and represents an excellent model system for cellular processes
including PA production (Lepiniec et al., 2006), aspects of cell
wall synthesis and modification such as pectin biosynthesis and
secretion, and secondary cell wall formation (Arsovski et al.,
2010). Practically, the Arabidopsis seed coat is an appealing
model system for genetic analysis of such processes, as it is
not essential for seed viability; therefore, mutants defective
in seed coat development germinate and grow normally under
laboratory conditions (Koornneef, 1981; Penfield et al., 2001;
Western et al., 2001).
Some of the key genes that are involved in seed coat differ-
entiation have been identified and characterized. The genetic
pathway for production of PAs, which give Arabidopsis seeds
their brown color following polymerization into tannins and
oxidation, has been relatively well elucidated, at least partly
because of the ease of identifying mutants based on altered
coloration of the seeds; both PA-producing enzymes and tran-
scription factors have been identified in this way (for review,
see Lepiniec et al., 2006). Genes involved in the differentiation
of the epidermal cells have also been uncovered using screens
for mutants where mucilage production is defective (Western
et al., 2001). Further, the TTG1-dependent pathway that con-
trols root hair and trichome differentiation has also been
found to control seed coat differentiation (for review, see
Arsovski et al., 2010).
Although much is known about seed coat development in
Arabidopsis, many gaps remain in our understanding. Most of
the genes currently known to be involved in seed coat devel-
opment have been identified using forward-genetic mutant
screens. However, such screens have limitations caused by re-
dundancy and difficulties in identifying subtle phenotypes.
Analysis of global gene expression offers an alternate ap-
proach to finding additional genes that are expressed and in-
volved in seed coat development.
Gene expression during seed development has been exam-
ined in Arabidopsis (Le et al., 2010) and gene expression spe-
cifically in seed coats has been investigated in other species
(Pang et al., 2004; Gallardo et al., 2007; Pang et al., 2008; Jiang
and Deyholos, 2010). Although these experiments have pro-
vided some insights into broader aspects of seed coat develop-
ment, a global picture of gene expression specifically during
seed coat development in Arabidopsis, the best-studied model
system, has not yet been reported, highlighting the need for
a comprehensive gene expression analysis of this tissue. In ad-
dition, because Arabidopsis thaliana is closely related to Bras-
sica species, many of which are important crops, Arabidopsis
seed coat microarray data will be useful for identifying gene
targets for genetic manipulation. For example, in Brassica
napus (Canola/Oil seed rape), a major oilseed crop, the seed
coat is an important component of the meal used for animal
feed. Breeding objectives include reducing a variety of anti-
nutritional factors such as fiber (lignin), tannins, and mucilage
from the seed coat.
This study reports the findings of comprehensive global
gene expression analysis in the developing Arabidopsis seed
coat, with a view to identifying novel genes involved in this
process. In order to maximize the number of differentially reg-
ulated candidate genes that could be identified, the microar-
ray experiment was designed to allow comparison of gene
expression in three key stages of development for both
wild-type and mutant lines defective in the differentiation
of specific seed coat cell types. We show that our microarray
results are consistent with publically available microarray data,
as well as with expression data for previously characterized
genes that are expressed in the seed coat. This global study
identified gene expression programs associated with inner
and outer integuments. Additionally, comparative analysis
of tt16 and ap2 with wild-type seed coats revealed the expres-
sion programs controlled by these regulatory factors. Finally,
this study developed new comprehensive global gene expres-
sion datasets for Arabidopsis seed coat development.
RESULTS
Mutants and Time Points Used for Expression Profiling
In order to obtain precise expression information on candidate
genes for specific processes during seed coat differentiation,
seed coats were separated from developing embryos at three
different developmental stages for two wild-type and two mu-
tant lines. Three developmental time points—3, 7, and 11 d
post anthesis (DPA)—were chosen for the expression profiling,
as they represent key developmental transitions (Haughn and
Chaudhury, 2005). At 3 DPA, PA synthesis is underway in the
endothelial cells, while the epidermal cells have begun to ac-
cumulate starch grains. At 7 DPA, PA synthesis is coming to an
end, but the epidermal cells are now producing and secreting
into the apoplast a large amount of pectinaceous mucilage. At
11 DPA, mucilage production is complete and the epidermal
cells are producing a secondary cell wall (columella). Because
the aleurone (endosperm) adheres tightly to the seed coat in
later stages examined (7 and 11 DPA) and some contamination
with endosperm nuclei at the earliest stage (prior to differen-
tiation of the aleurone) is likely, we assume our samples in-
clude some endosperm mRNA. Therefore, these tissue
samples contain four cell types—epidermis, palisade, endothe-
lium, and endosperm—plus cells of the inner integument
which undergo cell death. Examination of the changes in
Dean et al. d Arabidopsis Seed Coat Microarray | 1075
at The U
niversity of British C
olombia L
ibrary on Novem
ber 21, 2011http://m
plant.oxfordjournals.org/D
ownloaded from

mRNA abundance at these time points should allow identifi-
cation of genes associated with PA, mucilage, and secondary
cell wall biosynthesis.
A genetic approach was used to dissect the epidermis, pal-
isade, and endothelium by exploiting mutants that specifically
disrupt development of these layers. Mutants of transcription
factors implicated in seed coat development were selected, as
it was expected that such mutations would have regulatory
roles and therefore the greatest global effect on gene expres-
sion in the affected cell layers, thereby increasing the proba-
bility of identifying differentially expressed genes associated
with those tissues.
AP2 encodes an AP2-domain transcription factor, which is
required for differentiation of both layers of the outer integ-
ument; strong ap2 mutants lack differentiation of the epider-
mal and palisade layers, suggesting that AP2 is an early
regulator of seed coat differentiation in the outer ovule integ-
ument (Jofuku et al., 1994; Western et al., 2001). A strong ap2
allele in the Col background (ap2-7) was isolated from an EMS-
mutagenized population (Kunst et al., 1989). Although the ex-
act molecular lesion in this allele is not known, it displays a phe-
notype similar to other strong alleles while still being relatively
fertile. Mature ap2-7 seeds are brown, indicating the presence
of PA in the endothelium (Figure 1B). However, when mature,
ap2-7 seeds are imbibed with Ruthenium Red, both with and
without shaking during the staining protocol, they do not re-
lease mucilage (Figure 1F and 1J). In addition, mature ap2-7
seeds appear heart-shaped, as the seed coat collapses to the
shape of the embryo in the absence of secondary cell walls
in the outer two layers (Figure 1B, 1F, and 1J).
TT16 encodes an ARABIDOPSIS BSISTER (ABS) MADS domain
proteinthatisanearlyregulatorofendotheliumdifferentiation
(Nesi et al., 2002; Debeaujon et al., 2003). Although it would
have been preferable to use a tt16 allele in a Col background,
no such allele was available; therefore, the tt16-1 mutant, a T-
DNA insertion in the Ws-2 background, was selected (Nesi
et al., 2002). Mature tt16-1 seeds release mucilage in a manner
similar to wild-type when imbibed with Ruthenium Red both
withandwithoutshakingduringthestainingprotocol(Figure 1
H and 1L). Although the chalazal/micropylar region does de-
velop normally, tt16-1 seeds produce little PA in the main body
of the seed, giving pale seeds at maturity (Figure 1D).
In order to confirm the developmental programs of the
ap2-7 and tt16-1 mutants in comparison to both Ws-2 and
Col-2 wild-type (WT), newly opened flowers (0 DPA) were
marked using non-toxic paint, then harvested 3, 7, and
11 DPA. The developing seeds were resin embedded, sec-
tioned, stained with Toluidine Blue, and examined by light mi-
croscopy (Figure 2). The ap2-7 flowers were hand fertilized
with Col-2 pollen, as ap2-7 produces very little pollen of its
own and is semi-sterile. This does not affect the phenotype
of the developing seed coat, which is maternally inherited.
The sectioning showed that the cells of the outer seed coat
layers in the ap2-7 mutant do not differentiate (Figure 2D–2F)
and that tt16-1 does not undergo development of the
endothelium in the main body of the seed (Figure 2J–2L).
Therefore, these data confirm the suitability of these two
mutants for use in this study, and also indicate that other
aspects of seed development in these mutants are normal.
Tissue Preparation for Expression Profiling
Underourgrowthconditions,Ws-2andtt16-1flowerslightlyear-
lier than Col-2 and ap2-7 and are generally ready for marking
5–7 dbefore Col-2andap2-7. Therefore,plantingwas staggered
slightly to allow all tissues to be harvested on the same day.
To prepare tissue for the expression profiling, newly opened
flowers (0 DPA) from all four genotypes (ap2-7, tt16-1, Col-2,
and Ws-2) were marked in the same way as for resin embed-
ding. Again, ap2-7 flowers were hand pollinated using Col-2
pollen so that the seed set was higher and the developmental
stage could be more accurately determined.
As well as using mutants to genetically separate the inner and
outer integuments, seed coat tissues for expression profiling
were physically separated from the embryo; this approach fur-
ther enriched for transcripts that specifically act in seed coat de-
velopment. Although we carefully separated seed coat tissues
from embryo, the single layer of endosperm adhering to the
seed coat that is present at late stages (7 and 11 DPA) was likely
included in the preparation. The removal of the embryo also
allowed the stage of seed coat development to be double-
checked by comparison to the stage of embryo development.
Previous work has indicated that, at 3 DPA under our growth
conditions the embryo is late globular, at 7 DPA it is at the bent
cotyledon stage, and at 11 DPA it is at the upturned U stage
(Western et al., 2000). In the case of the tt16-1 mutant, embryo
development appeared to be slightly slower than expected;
therefore, seed coats corresponding to late globular, bent cot-
yledon, and upturned U embryo stage seeds were isolated.
These modifications ensured harvesting of seed coat tissues
from comparable developmental stages in different genotypes.
The seed coat was separated from the embryo using forceps
and washed with 5% sucrose in 0.1% RNAlater solution. For
each genotype at each developmental stage, four biological
replicates were harvested and processed separately.
Genome-Wide Expression Profiling
The microarray design was developed to allow a number of
direct comparisons between three developmental time points
and genotypes (Figure 3A). The design was chosen so that the
key comparisons could be made directly and so that other com-
parisons could be made with as few degrees of separation as
possible. Figure 3A also shows the embryo stages at each de-
velopmental time point.
The Qiagen-Operon Arabidopsis Genome Array Ready Oligo
Set (AROS) Version 3.0 (http://cals.arizona.edu/microarray;
Zhang et al., 2008) was used for expression profiling, and four
biological replicates were hybridized as detailed in the Meth-
ods section. A dye swap was performed by labeling two bio-
logical replicates with Cy3 and two with Cy5 to normalize
for any bias caused by dye labeling.
1076 | Dean et al. d Arabidopsis Seed Coat Microarray
at The U
niversity of British C
olombia L
ibrary on Novem
ber 21, 2011http://m
plant.oxfordjournals.org/D
ownloaded from

The microarray data were normalized and effects of time
and genotype on gene expression were estimated. These ef-
fect estimates were used to examine the relationships over
time within each genotype, and also between genotypes at
a fixed time point.
Figure 3 shows pair-wise comparisons of microarray data-
sets, and includes all microarray probes with greater than two-
fold changes in gene expression. All comparisons were made
experimentally (Figure 3A) or were determined in silico from
the array data (Figure 3B).
In order to identify trends in gene expression patterns during
seed coat development, five key comparisons were examined in
more detail using the Classification Superviewer tools (Provart
and Zhu, 2003) available at the Bio-Array Resource for Plant
Functional Genomics (BAR) website. The two-fold changed
gene lists were used for this analysis and five key comparisons
were examined. To try and gain more insights into the develop-
mental processes of wild-type seed coat development, the
genes that were more highly expressed at 7 DPA compared with
3 DPA and more highly expressed at 11 DPA compared with
7 DPA were examined in the Col-2 background. We focused
on the Col-2 background rather than Ws-2, as it is more similar
to the published Col-0 genome, and because more work on in-
dividual genes has been done in the Col background than in Ws-
2. Next, because two major processes in epidermal development
are mucilage synthesis and columella development, the differ-
ences in gene expression between ap2-7 and Col-2 at 7 DPA
(during the peak of mucilage synthesis) and 11 DPA (during
the peak of columella development) were examined. Finally,
in order to examine the processes involved in endothelium
differentiation, which is completed by 7 DPA, the differences
between tt16-1 and Ws-2 at 3 DPA were examined.
The Classification Superviewer has two different output
modes, and will return either the absolute number of genes
in each GO functional classification or the number of genes
in each GO category normalized to number of genes actually
found on the chip. It is preferable to use the normalized data
output option, as it gives a more accurate representation of
the types of genes that are differentially regulated, because
bias caused by number of genes in each GO category on the
array is removed. Although the database uses the gene iden-
tities on the GeneChip arrays (Provart and Zhu, 2003) for these
calculations, AROS chips have a comparable number of genes
(25 460 genes for GeneChip and 26 173 for AROS). Therefore,
trends can be accurately identified using the normalized out-
put despite the use of a different microarray platform.
The normalized data for these five key comparisons, for GO
classification of cellular components, is shown in Figure 4.
In Col-2, genes with products associated with DNA or RNA
metabolism, Protein Metabolism, and Cell Organization and
Biogenesis, are underrepresented between 3 and 7 DPA,
and 7 and 11 DPA, as are proteins with the molecular function
Nucleic Acid Binding, as might be expected for cell types that
are no longer growing and dividing (Figure 4A and 4B).
The genes encoding proteins associated with the Plastid are
overrepresented in Col-2 between 3 and 7 DPA and, at 7 DPA,
between Col-2 and ap2-7, but are underrepresented in Col-2
between 7 and 11 DPA, in line with the presence of amylo-
plasts in the early stages of epidermal cell development and
their disappearance in the later stages (Figure 4A–4C).
Figure 1. Seed Morphology of Mature Seeds.
Mature dry seeds (A–D), mature seeds stained with Ruthenium Red without shaking (E–H), and mature seeds stained with Ruthenium Redwith shaking (I–L) for Col-2 (A,E,I), ap2-7 (B,F,J), Ws-2 (C,G,K), and tt16-1 (D,H,L). Mature tt16-1 seeds are pale, as they do not accumulate PA,whereas mature Ws-2, Col-2, and ap2-7 seeds accumulate PA normally and are brown at maturity. Mature ap2-7 seeds do not release mu-cilage when hydrated and stained with Ruthenium Red both with and without shaking whereas mature Col-2, Ws-2, and tt16-1 seeds dorelease mucilage with these treatments. Scale bars = 100 lm.
Dean et al. d Arabidopsis Seed Coat Microarray | 1077
at The U
niversity of British C
olombia L
ibrary on Novem
ber 21, 2011http://m
plant.oxfordjournals.org/D
ownloaded from

The genes encoding proteins associated with the Golgi, Extra-
cellulardomain,CellWall,PlasmaMembrane,andERareallover-
represented in Col-2 between 3 and 7 DPA and, at 7 DPA,
betweenap2-7andCol-7,whenthesynthesisofpectin,asecreted
carbohydrate, isatamaximuminCol-2but isabsentinap2-7 (Fig-
ure 4A and 4C). By 11 DPA in Col-2, the genes that are primarily
associated with pectin synthesis (Golgi, Plasma Membrane, and
ER) are no longer overrepresented, as pectin synthesis has fin-
ished. However, Cell Wall and Extracellular genes are even more
overrepresented,ascolumella (secondary cellwall) synthesis isat
its peak (Figure 4B). This overrepresentation is even more pro-
nounced between ap2-7 and Col-2 at 11 DPA, as columella syn-
thesis is absent in the ap2-7 mutant (Figure 4D).
In the case of Ws-2 and tt16-1, there is underrepresentation
of genes associated with the biological processes of DNA or
RNA metabolism and Protein Metabolism, again as might be
expected for cells that are not growing or dividing (Figure 4E).
Validation of Microarray Results Using Publicly Available
Expression Data
For initial validation of the microarray data, three genes
known to be involved in epidermal development and four
genes known to be involved in endothelial development were
selected. GL2 (Koornneef et al., 1982), MUM4 (Western et al.,
2001; Usadel et al., 2004; Western et al., 2004), and MUM2
(Western et al., 2001; Dean et al., 2007; Macquet et al.,
2007) are involved in production and modification of seed coat
mucilage in the epidermal layer, and BAN (Albert et al., 1997),
LDOX/TDS4 (Abrahams et al., 2003), TT2 (Nesi et al., 2001), and
TT3/DFR (Shirley et al., 1995) are involved in PA production in
the endothelial layer.
Expression data from the microarray for these genes in both
Col-2 and Ws-2 were compared with expression data from Col-
0 (Schmid et al., 2005) available via the Arabidopsis eFP
browser at BAR (Winter et al., 2007). The eFP browser was
Figure 2. Seed Coat Sections from Developing Seeds.
Col-2 (A–C), ap2-7 (D–F), Ws-2 (G–I), tt16-1 (J–L), at 3 DPA (A,D,G,J), 7 DPA (B,E,H,K), and 11 DPA (C,F,I,L). Stars indicate epidermal cells tocompare: note that epidermal cells do not develop in ap2-7, but develop normally in tt16-1. Arrows indicate endothelial cells to compare:note that endothelial cells do not accumulate PA in tt16-1 but develop normally in ap2-7. Scale bar = 10 lm.
1078 | Dean et al. d Arabidopsis Seed Coat Microarray
at The U
niversity of British C
olombia L
ibrary on Novem
ber 21, 2011http://m
plant.oxfordjournals.org/D
ownloaded from

set to the Developmental map, with absolute values for gene
expression. This allowed fold changes to be calculated for each
comparison of interest, and seed stages 3, 7, and 10 were used as
equivalent to 3, 7, and 11 DPA, respectively. In addition, pub-
lished expression data from the following studies were used
to validate data: MUM4 and GL2 (Western et al., 2004),
MUM2 (Dean et al., 2007), BAN and LDOX (Devic et al.,
1999), TT2 (Nesi et al., 2001), and TT3/DFR (Nesi et al., 2000). This
data analysis is presented in Table 1.
Generally, the comparisons between Col-2 and Ws-2 from
the microarray data are in good agreement, as would be
expected from the similar developmental programs of Col-2
and Ws-2 seeds, as shown in Figure 2. The data from the avail-
able literature are also similar to the microarray data.
Although the data used for the eFP Developmental map are
from the Col-0 ecotype, there is still good overall agreement
between these data and the trends in expression in Col-2 and
Ws-2 (Table 1). However, there are some instances where data
from the microarray and the eFP browser do not match per-
fectly. In contrast to the microarray data and literature, data
from the eFP browser for the epidermal genes MUM2 and
MUM4 do not show a large increase in expression between
3 and 7 DPA, whereas GL2 expression does increase signifi-
cantly. Between 7 and 11 DPA, MUM2 and MUM4 expression
decreases, similar to data from the microarray and the litera-
ture. However, there is also a large decrease in expression of
GL2 that is not seen in other datasets. If the expression patterns
from the eFP browser are examined, it can be seen that the
trends in expression over time are similar, with a peak in ex-
pression during seed development, but that the timing is
slightly different (Supplemental Figure 1A). For all three of
these genes, peak expression appears earlier in development
at the late heart/early torpedo stage rather than at the late
torpedo/bent cotyledon stage, as indicated in the literature.
This may be because the tissue used for the eFP browser is dif-
ferent (siliques for the earlier stages, and whole seeds for all
stages rather than seed coat specifically), or perhaps because
of differences in growth conditions that affect some aspects of
seed development. In addition, the samples collected in previ-
ous studies are likely to represent mixed developmental stages
because the ovule development in a given silique is not syn-
chronized, whereas, in this study, each seed coat was isolated
and staged separately with reference to the embryo.
There is good agreement between all three datasets for the
endothelial genes. Data from the eFP browser show that these
genes are highly expressed early in seed development and that
expression decreases with time (Supplemental Figure 1B
shows TT2 as an example). In the case of TT2 (At5g35550), ex-
pression appears to go up very slightly between 7 and 11 DPA.
However, because this fold change is so low, it is likely best
interpreted as ‘no change’.
Generally, the trends in gene expression from these three
data sources are in good agreement, indicating that the
microarray data in the present study give an accurate repre-
sentation of changes in gene expression during seed coat
development.
Differential Expression between Wild-Types
Asalreadydiscussed,expressionofknowngenes is similar inboth
Col-2 and Ws-2. As Col-2 and Ws-2 follow the same developmen-
tal program, it was also expected that the numbers of differen-
tially expressedgenes betweeneachtime point would besimilar.
While this is true for some comparisons, there are more genes
down-regulatedbetween 3 and 7 DPA in Ws-2 than in Col-2 (Fig-
ure 3A),andmanymoregenesaredifferentiallyexpressedinCol-
2 compared to Ws-2 between 7 and 11 DPA (Figure 3A).
Initially, the lists of significantly changed genes were used to
extract genes that were common to both ecotypes and distinct
to each ecotype, at 3 versus 7 DPA and 7 versus 11 DPA
(Table 2). Interestingly, and perhaps unexpectedly, the number
of genes common to both lists for all comparisons examined
was smaller than expected.
Figure 3. Pair-Wise Comparisons of Gene Expression in DevelopingSeed Coats.
Dotted lines indicate comparisons examined directly using themicroarray (A) or indirectly from the microarray data (B). Arrow-heads on the dotted lines indicate the direction of comparison,e.g. if relative expression in the stage/genotype at the tail of thearrow is lower than that at the head of the arrow, then the expres-sion is considered to increase. Numbers represent the number ofprobes with more than two-fold change, either increased (redarrows) or decreased (black arrows) expression between differentdevelopmental stages or genetic backgrounds. The stage of seedcoat was determined by days post anthesis and checked using em-bryo morphology expected for that time under our growth condi-tions. A typical seed for each stage is shown to the right of panel(A). Comparisons within genotypes at key developmental transi-tions, between wild-types and mutants, and between mutants,as well as between wild-types at the same developmental stage,are shown. Scale bar = 50 lm.
Dean et al. d Arabidopsis Seed Coat Microarray | 1079
at The U
niversity of British C
olombia L
ibrary on Novem
ber 21, 2011http://m
plant.oxfordjournals.org/D
ownloaded from
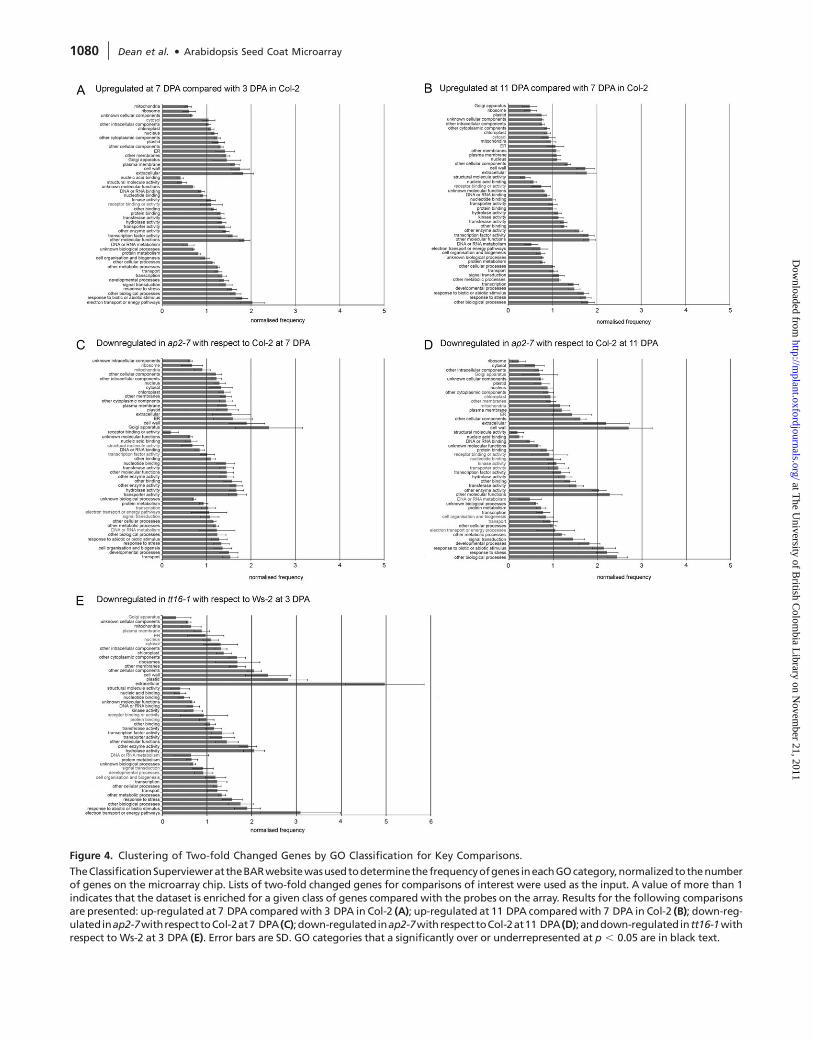
Figure 4. Clustering of Two-fold Changed Genes by GO Classification for Key Comparisons.
TheClassificationSuperviewerat theBARwebsitewasusedtodeterminethefrequencyofgenes ineachGOcategory,normalizedtothenumberof genes on the microarray chip. Lists of two-fold changed genes for comparisons of interest were used as the input. A value of more than 1indicates that the dataset is enriched for a given class of genes compared with the probes on the array. Results for the following comparisonsare presented: up-regulated at 7 DPA compared with 3 DPA in Col-2 (A); up-regulated at 11 DPA compared with 7 DPA in Col-2 (B); down-reg-ulatedinap2-7withrespecttoCol-2at7 DPA (C);down-regulatedinap2-7withrespecttoCol-2at11 DPA (D);anddown-regulatedintt16-1withrespect to Ws-2 at 3 DPA (E). Error bars are SD. GO categories that a significantly over or underrepresented at p , 0.05 are in black text.
1080 | Dean et al. d Arabidopsis Seed Coat Microarray
at The U
niversity of British C
olombia L
ibrary on Novem
ber 21, 2011http://m
plant.oxfordjournals.org/D
ownloaded from

In addition, gene expression in Col-2 and Ws-2 was compared
at each time point (Figure 3B) and there were large differences
in the numbers of significantly expressed genes between these
two wild-types. However, when the complete set of array data
was analyzed using GeneSpring software (using all spots with
an intensity value of 200 or more), the total number of genes
expressed in both ecotypes across all time points was similar,
with 14-284 genes expressed in Col-2 and 14-457 genes in
Ws-2. Given that there are 26,173 genes on the array, 54% of
the genes in Col-2 and 55% of the genes in Ws-2 are expressed
during seed coat development, indicating that the develop-
mental processes occurring in seed coats are complex and use
a large percentage of the genome. Furthermore, the overlap
in expressed genes between these ecotypes is very high, with
12,246, or approximately 85%, of these genes expressed in both
ecotypes. This indicates that, although there are some differen-
ces in relative expression levels, the overall expression programs
between these two ecotypes are very similar.
Effect of the ap2-7 Mutation on Endothelial Expression
and the tt16-1 Mutation on Epidermal Expression
As described previously, ap2-7 and tt16-1 were chosen to help
identifygenes thatare important indevelopmentof theepider-
mis and endothelium, respectively. In order to determine more
specificallywhetherdisruptionoftheepidermishadaneffecton
endothelial development and vice versa, the expression of key
genes involved in the development of these tissue types was
examined.
Table 3 shows expression of three key genes in epidermal
development (AP2, MUM2, and MUM4) and three key genes
in endothelial development (TT16, BAN, and TT3/DFR) in
Col-2, ap2-7, Ws-2 and tt16-1.
As expected, AP2 is expressed normally in the tt16-1 back-
ground (compare AP2 expression in Ws-2 and tt16-1 at 3 versus
7 DPA and 7 versus 11 DPA), and TT16 is expressed similarly in
the Col-2 and ap2-7 backgrounds (compare TT16 expression in
Col-2 and ap2-7 at 3 versus 7 DPA and 7 versus 11 DPA), indi-
cating that the two transcription factors do not regulate each
other. Further, transcript can be detected for AP2 in the ap2-7
background and for TT16 in the tt16-1 background, demon-
strating that these mutants are not transcript nulls. Interest-
ingly, AP2 transcript is up-regulated between 3 and 7 DPA
in the ap2-7 background.
In the case of both BAN and TT3/DFR, similar patterns of reg-
ulation are seen in Ws-2, Col-2, and ap2-7, where expression of
these genes decreases between 3 and 7 DPA, and again be-
tween 7 and 11 DPA. As expected from previous studies, the
decrease in expression of these genes in the tt16-1 background
is not so pronounced between 3 and 7 DPA, presumably
Table 1. Fold Changes in Gene Expression in Wild-Type; Microarray Data versus Literature and eFP Browser.
Gene name (At ID)
3 versus 7 DPA
Array Col-2 Array Ws-2 eFP Literature*
MUM4 (At1g53500) Up 4.6-fold at 7 DPA Up 4.1-fold at 7 DPA Up 1.7-fold at 7 DPA Up at 7 DPA
MUM2 (At5g63800) Up 4.1-fold at 7 DPA Up 2.1-fold at 7 DPA Up 1.3-fold at 7 DPA Up at 7 DPA
GL2 (At1g79840) Up 1.2-fold at 7 DPA Up 1.2-fold at 7 DPA Up 6.0-fold at 7 DPA NC
BAN (At1g61720) Down 2.0-fold at 7 DPA Down 2.8-fold at 7 DPA Down 4.1-fold at 7 DPA Down at 7 DPA
TT2 (At5g35550) Down 4.5-fold at 7 DPA Down 4.1-fold at 7 DPA Down 12.6-fold at 7 DPA Down at 7 DPA
TT3/DFR (At5g42800) Down 7.2-fold at 7 DPA Down 4.6-fold at 7 DPA Down 3.2-fold at 7 DPA Down at 7 DPA
LDOX/TDS4 (At4g22880) Down 3.5-fold at 7 DPA Down 4.6-fold at 7 DPA Down 12.2-fold at 7 DPA Down at 7 DPA
Gene name (At ID)
7 versus 11 DPA
Array Col-2 Array Ws-2 eFP Literature*
MUM4 (At1g53500) Down 4.9-fold at 11 DPA Down 1.8-fold at 11 DPA Down 4.0-fold at 11 DPA Down at 11 DPA
MUM2 (At5g63800) Down 2.6-fold at 11 DPA Down 2.7-fold at 11 DPA Down 2.0-fold at 11 DPA Down at 11 DPA
GL2 (At1g79840) Down 1.4-fold at 11 DPA Down 1.1-fold at 11 DPA Down 3.5-fold at 11 DPA ND
BAN (At1g61720) Down 7.8-fold at 11 DPA Down 5.2-fold at 11 DPA Down 14.8-fold at 11 DPA Down at 11 DPA
TT2 (At5g35550) Down 2.0-fold at 11 DPA Down 1.9-fold at 11 DPA Up 1.2-fold at 11 DPA Down at 11 DPA
TT3/DFR (At5g42800) Down 2.8-fold at 11 DPA Down 4.0-fold at 11 DPA Down 3.2-fold at 11 DPA Down at 11 DPA
LDOX/TDS4 (At4g22880) Down 4.1-fold at 11 DPA Down 4.1-fold at 11 DPA Down 2.6-fold at 11 DPA Down at 11 DPA
NC, no change in expression; ND, no data available; * references cited in text.
Table 2. Numbers of Two-fold Changed Genes Common to Col-2and Ws-2.
Timepoint
TotalinWs-2
TotalinCol-2
Commonto Ws-2and Col-2
OnlyinWs-2
OnlyinCol-2
Down 7 versus 3 DPA 1 883 1 470 916 967 554
Up 7 versus 3 DPA 2 132 2 161 1 403 729 758
Down 11 versus 7 DPA 990 3 074 668 322 2 406
Up 11 versus 7 DPA 1 098 2 064 561 537 1 503
Dean et al. d Arabidopsis Seed Coat Microarray | 1081
at The U
niversity of British C
olombia L
ibrary on Novem
ber 21, 2011http://m
plant.oxfordjournals.org/D
ownloaded from

because the lack of functional TT16 meant that these genes
were not highly expressed at 3 DPA.
In the case of MUM4 and MUM2, similar patterns of regu-
lation are seen in Col-2, Ws-2, and tt16-1, where expression
increases between 3 and 7 DPA and then decreases again from
7 to 11 DPA. However, MUM4 expression does not increase be-
tween 3 and 7 DPA as much as would be expected considering
the results from the other backgrounds, and that tt16-1 seeds
produce mucilage in comparable amounts to wild-type. Con-
versely, and in agreement with previous studies, in the ap2-7
background, these genes are not significantly changed in ex-
pression, presumably because there is no functional AP2 tran-
script that is needed for their activation.
Therefore, this analysis indicates that the developmental
pathways and the associated gene expression programs
in the epidermis and the endothelium function relatively
independently.
Expression of Mucilage and PA Biosynthesis-Associated
Genes in ap-2 and tt16-1 Mutant Backgrounds
In order to examine the effect of the different mutant back-
grounds on gene expression, the expression of genes known
to be involved in epidermal pathways were compared in ap2-
7 and Col-2, and the expression of genes known to be involved
in endothelial pathways were compared in tt16-1 and Ws-2.
Microarray data were validated using qPCR analysis using
RNA prepared from isolated seed coats as before. These results
were then compared with published expression patterns where
available in the literature. All data are shown in Table 4.
MUM4, GL2, and TTG1 were selected as markers for expres-
sion in ap2-7 versus Col-2 at 7 DPA, as these genes are known
to be required for epidermal development. In the case of
MUM4, the decrease in expression in the ap2-7 background
is confirmed by the qPCR results and this is supported by
published data (Western et al., 2004). For GL2, the microarray
data do not show a significant decrease in expression in the
ap2-7 background, as has been reported in the literature
(Western et al., 2004) and was shown by qPCR. Although
TTG1 is involved in mucilage synthesis, it does not appear to
be significantly down-regulated in the ap2-7 background
(Western et al., 2004), and this is also reflected in the microar-
ray data and by the qPCR analysis. Overall, the microarray data
are broadly in line with both the literature and qPCR analysis.
BAN and TT3/DFR were selected as markers for expression in
tt16-1 versus Ws-2 at 3 DPA, as these genes are known to be re-
quired for PA synthesis. There is good agreement between the
microarray and qPCR data in the case of TT3/DFR, where a large
decrease in expression was seen in the tt16-1 background. No
data in the literature regarding expression of TT3/DFR in tt16-1
are available for comparison. In the case of BAN, the microarray
datadonotshowalargedecreaseinexpressioninthett16-1back-
ground,whichisunexpected,asBANhasbeenshowntobedown-
regulated in tt16-1 using a BAN promoter fused to the GUS
marker (Nesi et al., 2002; Debeaujon et al., 2003). However, more
sensitive qPCR analysis of BAN expression showed significant
down-regulationinthe tt16-1backgroundthat isconsistentwith
theearlier study(Nesietal.,2002).This result indicatesthe impor-
tance of independently validating microarray results with qPCR.
In addition, GeneSpring software was used to analyze the
microarray data in order to illustrate that groups of other
genes follow the same trends in expression pattern as genes
known to act in development of seed coat tissues. Figure 5A
shows the expression pattern of significantly changed genes
at 7 DPA in ap2-7 versus Col-2. It can be seen thatMUM4, along
with a number of other genes, are down-regulated in the ap2-
7 background at 7 DPA. Similarly, Figure 5B shows the expres-
sion pattern of significantly changed genes at 3 DPA in tt16-1
Table 3. Expression Level of Epidermal Genes in tt16-1 and Endothelial Genes in ap2-7.
Gene name (At ID)
3 versus 7 DPA 7 versus 11 DPA
Col-2 ap2-7 Col-2 ap2-7
TT16 (At5g23260) Down 1.3-fold at 7 DPA Down 1.8-fold at 7 DPA Down 2.0-fold at 11 DPA Down 1.3-fold at 11 DPA
AP2 (At4g36920) Down 1.8-fold at 7 DPA Up 3.1-fold at 7 DPA Up 1.2-fold at 11 DPA Down 1.2-fold at 11 DPA
BAN (At1g61720) Down 2.0-fold at 7 DPA Down 1.7-fold at 7 DPA Down 7.8-fold at 11 DPA Down 2.7-fold at 11 DPA
TT3/DFR (At5g42800) Down 7.2-fold at 7 DPA Down 3.0-fold at 7 DPA Down 2.8-fold at 11 DPA Down 4.4-fold at 11 DPA
MUM4 (At1g53500) Up 4.6-fold at 7 DPA Down 1.1-fold at 7 DPA Down 4.9-fold at 11 DPA Fold change 1.0
MUM2 (At5g63800) Up 4.1-fold at 7 DPA Up 1.1-fold at 7 DPA Down 2.6-fold at 11 DPA Down 1.5-fold at 11 DPA
Gene name (At ID)
3 versus 7 DPA 7 versus 11 DPA
Ws-2 tt16-1 Ws-2 tt16-1
TT16 (At5g23260) Down 2.8-fold at 7 DPA Down 1.8-fold at 7 DPA Down 1.6-fold at 11 DPA Up 1.1-fold at 11 DPA
AP2 (At4g36920) Down 1.2-fold at 7 DPA Down 1.5-fold at 7 DPA fold change 1.0 Down 1.5-fold at 11 DPA
BAN (At1g61720) Down 2.8-fold at 7 DPA Down 1.2-fold at 7 DPA Down 5.2-fold at 11 DPA Down 3.1-fold at 11 DPA
TT3/DFR (At5g42800) Down 4.6-fold at 7 DPA Up 1.2-fold at 7 DPA Down 4.0-fold at 11 DPA Down 2.3-fold at 11 DPA
MUM4 (At1g53500) Up 4.1-fold at 7 DPA Up 1.4-fold at 7 DPA Down 1.8-fold at 11 DPA Down 1.1-fold at 11 DPA
MUM2 (At5g63800) Up 2.1-fold at 7 DPA Up 2.9-fold at 7 DPA Down 2.7-fold at 11 DPA Down 2.0-fold at 11 DPA
1082 | Dean et al. d Arabidopsis Seed Coat Microarray
at The U
niversity of British C
olombia L
ibrary on Novem
ber 21, 2011http://m
plant.oxfordjournals.org/D
ownloaded from

versus Ws-2. Here, TT3/DFR is down-regulated in the tt16-1
background at 3 DPA along with a number of other genes that
follow a similar trend in expression pattern. This indicates that
MUM4 and TT3/DFR are representatives of groups of genes
that respond similarly to AP2 and TT16. Based on their similar
co-expression patterns, these genes are considered likely to be
involved in seed coat development.
Confirmation of Microarray Data Using qPCR
A number of gene targets were selected from the gene lists for
independent validation using qPCR to confirm that the
changes in expression as indicated by the microarray data were
authentic and reliable. Candidates for qPCR were not chosen
on the basis of expression level per se. Some were selected
based on a known involvement in seed coat development,
such as At1g53500 (MUM4), At1g61720 (BAN), At5g23260
(TT16), and At5g42800 (TT3/DFR), while others were selected
at random from among putative carbohydrate-active enzymes
and regulatory factors identified in the microarray data. In
addition, several genes of unknown function were also
included. Genes were selected in these ways so that a broad
range of genes was examined for confirmation of the micro-
array datasets with independent qPCR analysis.
qPCR analysis of 20 genes selected from comparisons relat-
ing to epidermal processes was carried out so that relative
transcript abundance in Col-2 from 3 to 7 DPA (Figure 6A)
and in ap2-7 with respect to Col-2 at 7 DPA (Figure 6B) could
be investigated. The microarray data and the qPCR data are in
very good agreement for Col-2 in terms of whether gene ex-
pression increased, decreased, or remained the same between
3 and 7 DPA. Typically, the fold change determined by PCR was
higher than that determined by the microarray. Similarly, in
the case of the ap2-7 with respect to Col-2 at 7 DPA, compar-
isons between the microarray and the qPCR are in close agree-
ment, with the exception of At2g41070 and At4g18425.
However, it is worth noting that, in these two exceptions,
the overall changes in gene expression were very small.
Twenty genes from key comparisons related to endothelium
processes lists were also selected and, again, qPCR was carried
out so that relative transcript abundance in Ws-2 from 3 to
7 DPA (Figure 6C) and in tt16-1 with respect to Ws-2 at
3 DPA (Figure 6D) could be investigated. There is very good
agreement between the microarray data and the qPCR data
in all cases.
Next, 10 genes from each of these sets of 20 were analyzed
in more detail. For the 10 epidermal genes, microarray data
were compared to qPCR data for all comparisons between
Col-2 and ap2-7 that were determined experimentally in the
microarray (Figure 3A). There is good agreement across all
comparisons for all of these gene candidates. Figure 7A and
7B shows this analysis for two genes, At1g53500 (MUM4)
and At4g17695 (encoding the KANADI 3 transcription factor,
and selected from the two-fold changed gene lists). In the case
of MUM4, the increase in gene expression at 7 DPA followed
by the decrease in expression at 11 DPA can be clearly seen,
and the lack of MUM4 expression in the ap2-7 background
is also confirmed. In the case of At4g17695, gene expression
follows a similar pattern to MUM4 in wild-type, and also
appears to be down-regulated in ap2-7 compared with Col-
2 at both 3 and 7 DPA. In the ap2-7 background, At4g17695
expression increases between 3 and 7 DPA, indicating that
AP2 is not the only regulator that influences its expression.
The detailed expression data for the other eight genes exam-
ined are shown in Supplemental Figure 2.
For the 10 endothelial genes, microarray data were compared
to qPCR data for all comparisons between Ws-2 and tt16-1 that
were determined experimentally in the microarray (Figure 3A).
There is good agreement across all comparisons for all of these
gene candidates. Figure 7C and 7D shows this analysis for two
genes, At1g61720 (BAN) and At4g22870 (a leucoanthocyanidin
dioxygenase selected from the two-fold changed lists). In the
case of BAN, decreased expression can be seen between 3 and
7 DPA, and between 7 and 11 DPA in Ws-2, and the lack of
BANexpression in tt16-1 in comparison with Ws-2 at 3 DPA is also
confirmed. At4g22870 shows a similar expression pattern to
BAN. The detailed expression data for the other eight genes ex-
amined are shown in Supplemental Figure 2.
These data indicate that results from qPCR are comparable
to the microarray data across all comparisons in the microarray.
Table 4. Fold Changes in Gene Expression in Mutants versus Wild-Types; Microarray Data versus Literature and qPCR.
Gene name (At ID)
ap2-7 versus Col-2 at 7 DPA
Microarray qPCR Literature*
MUM4 (At1g53500) Down 4.4-fold in ap2-7 Down 15.0-fold in ap2-7 Down in ap2-7
GL2 (At1g79840) Down 1.4-fold in ap2-7 Down 2.5-fold in ap2-7 Down in ap2-7
TTG1 (At5g24520) Down 1.8-fold in ap2-7 Down 1.5-fold in ap2-7 NC
Gene name (At ID)
tt16-1 vs. Ws-2 at 3 DPA
Microarray qPCR Literature*
TT3/DFR (At5g42800) Down 9.0-fold in tt16-1 Down 20.6-fold in tt16-1 ND
BAN (At1g61720) Down 1.8-fold in tt16-1 Down 4.3-fold in tt16-1 Down in tt16-1
NC, no change in expression; * references cited in text.
Dean et al. d Arabidopsis Seed Coat Microarray | 1083
at The U
niversity of British C
olombia L
ibrary on Novem
ber 21, 2011http://m
plant.oxfordjournals.org/D
ownloaded from

Incorporation of the Seed Coat Array Data into the BAR
Expression Browser
In order to allow these data to be accessed by the research
community, the datasets have been processed to allow them
to be incorporated into the BAR expression browser, which
can be accessed at www.dotm.ca/efp/cgi-bin/efpWeb.cgi
or by following the link from the BAR website (http://bar.utor
onto.ca).
IdentificationofNewGeneTargetsBasedonMicroarrayData
Candidates for reverse genetic studies were targeted to com-
parisons that were directly relevant to identifying genes
involved in certain processes. Gene lists with transcripts show-
ing at least two-fold change in expression were used to iden-
tify candidates involved in the key processes of epidermal and
endothelial development (Supplemental Table 1).
Fortheidentificationofcandidateepidermalgenes,twomajor
groups of genes were considered: those expressed early in
development (3–7 DPA) at a time when mucilage synthesis/mod-
ification and PA biosynthesis occur, and genes expressed later
(7–11 DPA) during secondary cell wall formation/modification.
To identify early-stage candidate genes involved in epider-
mal development, genes that were up-regulated in Col-2 be-
tween 3 and 7 DPA were identified. Genes that were also
found to be down-regulated in ap2-7 with respect to Col-2
at 7 DPA were considered likely to be involved in early-stage
epidermal development. Venn analysis was then used to deter-
mine candidates that were present in both groups. This ap-
proach was also useful, as the global analysis showed that
GO categories alone cannot be used to select for groups of
likely candidates that are involved in key seed coat develop-
mental processes, as there are a large number of genes in each
ontology that are expressed in seed coats.
Similarly, genes whose expression increased between 7 and
11 DPA in Col-2, and were also down-regulated in theap2-7back-
groundat11 DPA,wereconsideredaslikely late-stagecandidates.
When selecting candidates for phenotype screens, prefer-
ence was given to genes putatively involved in carbohydrate
synthesis and signaling, as well as transcription factors. Next,
the eFP browser at BAR was used to manually assess time and
place of expression and those predicted to be expressed during
the relevant phase of seed development were selected. T-DNA
lines available from TAIR with insertions in the selected genes
are currently being screened for phenotypes but no heritable
phenotypes have been detected to date.
Genes that were down-regulated in Ws-2 between 3 and
7 DPA, and in tt16-1 with respect to Ws-2 at 3 DPA, were con-
sidered likely to be involved in endothelium development,
since tannin biosynthesis in the endothelium occurs in the
wild-type at 3 DPA but not in the tt16-1 mutant. Fifty-three
loci were selected (Supplemental Table 2) and screened for
changes in seed coat coloration, but no new transparent testa
mutants have been identified to date.
DISCUSSION
This work presents the first comprehensive gene expression
profiling study specifically for seed coat development in the
model plant Arabidopsis thaliana. A genetic approach using
mutants defective in seed coat development, in combination
with physical removal of the embryo from the seed coat, was
used to identify genes expressed in specific seed coat cell types
at specific times in development. The selected mutants were
Figure 5. Expression Pattern of Significantly Changed Genes.
Gene expression is shown as Normalized Intensity (log scale) wherea value of more than 1 indicates an increase in expression anda value of less than 1 indicates a decrease in expression. Genesup-regulated (orange) or down-regulated (blue) are represented.,(A) Expression patterns of significantly changed genes at 7 DPA inap2-7 with respect to Col-2. MUM4 (At1g53500, white line,arrowed) is regulated by AP2 and is down-regulated in ap2-7 com-pared with Col-2 at 7 DPA., (B) Expression pattern of significantlychanged genes at 3 DPA in tt16-1 with respect to Ws-2. TT3/DFR(At5g42800, white line, arrowed) is down-regulated in tt16-1 com-pared with Ws-2 at 3 DPA.
1084 | Dean et al. d Arabidopsis Seed Coat Microarray
at The U
niversity of British C
olombia L
ibrary on Novem
ber 21, 2011http://m
plant.oxfordjournals.org/D
ownloaded from

ap2-7 (defective in epidermal and palisade cell development)
and tt16-1 (defective in endothelial development). The sec-
tioning of developing seeds from these genotypes confirmed
that other seed coat cell layers develop normally (Figure 2),
confirming the specificity of the effects of ap2-7 and tt16-1
within the seed coat.
Genome-Wide Expression Profiling
Figure 3A shows all of the comparisons that were made exper-
imentally, along with the numbers of differentially regulated
genes with a change in expression of more than two-fold.
Figure 3B shows several additional comparisons that were
inferred from the direct comparisons shown in Figure 3A.
Although the numbers of differentially regulated genes may
seem high on first inspection, the tissue used for these microar-
rays contains three distinct cell types from the seedcoat (epider-
mis, palisade, and endothelium), cells of the inner integument
that undergo cell death, and endosperm. These five cell types
are all undergoing distinct and complex developmental transi-
tions. In support of this hypothesis, it is important to note that
there are approximately three to four times the number of dif-
ferentially expressed genes between different stages in the
same genotype compared to the same stages in different gen-
otypes. Such differences in the number of differentially
expressed genes is expected because, when comparing stages
of development, changes in gene expression for four to five cell
types are detected whereas, when comparing mutant versus
wild-type, only changes in the small number of cell types
affected by the mutation (endothelium or epidermis/palisade)
are detected. The exception is the comparison between Col-2
andWs-2at11 DPA(Figure 3B),wheretherearealsomanymore
genesdifferentiallyregulated.Thismayreflectdifferentialtran-
scriptional regulation in thesediverseecotypes,ashasbeenpre-
viously observed (Chen et al., 2005). Although slight differences
Figure 6. Validation of Microarray Data Using qPCR.
A comparison of the relative transcript abundance as determined using both microarray and qPCR data for 20 epidermal genes (for two keyepidermal comparisons) and 20 endothelial genes (for two key endothelial comparisons) is shown.(A) Col-2 from 3 to 7 DPA.(B) ap2-7 with respect to Col-2 at 7 DPA.(C) Ws-2 from 3 to 7 DPA.(D) tt16-1 with respect to Ws-2 at 3 DPA.
Dean et al. d Arabidopsis Seed Coat Microarray | 1085
at The U
niversity of British C
olombia L
ibrary on Novem
ber 21, 2011http://m
plant.oxfordjournals.org/D
ownloaded from

in growth rate were observed between these two ecotypes, if
this variation is dueto differences in staging andsampling, then
variation between biological samples should also be evident,
butthis isnot thecase.Therefore, it seemsplausible that thema-
jor contributing factor could be natural variation associated
with regulatory factors between these ecotypes.
In addition, although comparisons between mutants and
the corresponding wild-type represent changes caused by
a mutation in a single gene, that gene product controls differ-
entiation of at least one cell type and thus must affect several
developmental and biochemical processes. The numbers of dif-
ferentially regulated genes between each time point in wild-
type are broadly in line with other studies, including those that
examined gene expression in ovules in wild-type versus ovule
defective mutants (Skinner and Gasser, 2009) and during leaf
senescence (Buchanan-Wollaston et al., 2005). Overall, the
data show that seed coat development uses expression of over
50% of the genes in the genome to regulate and coordinate
developmental processes that operate in this complex tissue,
as mentioned in the Results section on differential expression
between wild-types.
The clustering of two-fold changed genes using GO classifi-
cations (Figure 4) showed that several major developmental
processes such as mucilage synthesis and columella synthesis
could be identified using this analysis. However, as large num-
bers of genes are present in each GO category, further selec-
tion as described here may be useful in selecting candidates for
reverse-genetic analyses.
Differential Expression between Wild-Types
One interesting finding of the microarray experiments was
the difference in the number of differentially expressed
seed coat genes between the two wild-types. As both geno-
types follow the same developmental program, it had been
expected that similar numbers of genes would be expressed
in each, and that the gene identities would be the same.
Figure 7. Detailed Validation of Microarray Data Using qPCR.
A comparison of the relative transcript abundance as determined using both microarray data and qPCR data for two epidermal and twoendothelial genes for all comparisons between mutant and wild-type determined experimentally in the microarray is shown, w.r.t., withrespect to.(A) At1g53500 (MUM4).(B) At4g17695.(C) At1g61720 (BAN).(D) At4g22870.
1086 | Dean et al. d Arabidopsis Seed Coat Microarray
at The U
niversity of British C
olombia L
ibrary on Novem
ber 21, 2011http://m
plant.oxfordjournals.org/D
ownloaded from

However, this was not the case, as there were large differen-
ces in the number of genes expressed (Figure 3B), with only
approximately 50–60% of the genes from any two compara-
ble Col-2 and Ws-2 lists overlapping at any of the three se-
lected developmental points (Table 2). However, when all
the expressed genes at these three stages are considered,
the overlap is much higher, in accordance with the fact that
both ecotypes develop a normal seed coat. These data sug-
gest that the observed differences in gene expression be-
tween the two ecotypes relate to differences in the
relative timing of seed coat differentiation due to differential
growth/differentiation rates and not to major differences in
the differentiation process itself.
Expression of BAN in the tt16-1 Background
For the analysis of the microarray data, BAN was selected as
a marker gene for comparing expression data between the
microarray, the literature, and independent qPCR data in
tt16-1 with respect to Ws-2 at 3 DPA (Table 4). Unexpectedly,
microarray data did not show a large decrease in expression in
the tt16-1 background, despite promoter studies that have
shown the BAN promoter to be down-regulated in tt16-1 (Nesi
et al., 2002; Debeaujon et al., 2003) and qPCR data from this
study that did indicate a significant down-regulation in the
tt16-1 background. Although the reason for this anomaly in
the data is unclear, several possible explanations can be ruled
out. First, the probe chosen for the array appears to function
correctly because BAN expression levels are as expected in Ws-
2, that is, expression is highest at 3 DPA, with significant down-
regulation between 3 and 11 DPA (Table 1). Second, the prob-
lem is unlikely to lie with the staging of the biological sample
or isolation of the mRNA, since qPCR results using the same
RNA showed a large reduction in BAN expression in the
tt16-1 background and the expression of other endothelial-
expressed genes examined was reduced as expected. However,
we cannot rule out the possibility that the probe designed for
BAN in the AROS oligo array is not optimal for detecting
hybridization signal.
Validation of Array Data Using qPCR
Overall, there is good agreement between the microarray and
the qPCR, indicating that the microarray data are an authentic
representation of gene expression in the RNA samples and
should be a valuable resource for researchers interested in
seed coat and endosperm development.
In the case of the genes where there is poor correlation (e.g.
At2g41070 and At4g18425, Figure 6B), these genes do not
show significant changes in expression between the stages ex-
amined, and therefore the observed variability likely illustrates
that the array data are not accurate below the two-fold cut-
off, as would be expected. This highlights the importance of
independent validation of expression levels, especially when
nearing the cut-off limits for significance. In addition, changes
in expression as determined by more sensitive qPCR methods
were generally higher than those from the microarray but this
is a common phenomena (Jiang and Deyholos, 2010).
Identification of Candidate Genes for Seed Coat
Development
Screening for transparent testa mutants based on seed color or
seed mucilage mutants based on the extrusion of seed muci-
lage upon imbibition did not yield any potential novel candi-
dates. This may indicate the previous screens mutants
have identified most of the genes that could be identified
in this manner and that other mutants could be found only
with more sensitive screening, namely biochemical assays.
Mutations in individual genes involved in these processed
may not show phenotypes due to redundancy. This hypothesis
could be tested by making double or triple mutants using
mutations in homologous genes that are both expressed in
the target tissue. Finally, some genes with differential expres-
sion in the seed coat may not have been detected by our anal-
ysis because the peak of expression lies between the time
points sampled. For example, one gene we have identified
as having differential expression during seed coat develop-
ment was not detected in the microarray because its peak ex-
pression was at 5 DPA, with low levels of expression at both 3
and 7 DPA (E. Esfandiari, G. Levesque-Tremblay, and G.
Haughn, unpublished results).
New Insights into Seed Coat Development and
Implications for Other Seed Systems
The data presented in this paper indicate that the develop-
mental programs in the inner and outer integuments
function relatively independently. This is supported both
by morphological and histological analysis (Figures 1 and
2) and by examination of the expression of different genes
in the two mutant backgrounds (Table 3). Although the
expression of the genes examined indicates that epidermal/
palisade and endothelial processes are independent, the pos-
sibility that expression of some epidermal/palisade genes is
affected by loss of endothelial differentiation, or vice versa,
cannot be ruled out. Important implications of these findings
include the possibility of targeted genetic manipulation of
individual cell layers in the seed coat to engineer desirable
phenotypes, such as in crops, without affecting the other
layers of the seed coat.
During this analysis, it was confirmed that neither ap2-7 nor
tt16-1 are transcriptional null alleles because transcript of each
gene was detected in its own mutant background (Table 3). It
was also revealed that AP2 expression is up-regulated in the
ap2-7 background between 3 and 7 DPA, suggesting that AP2
either directly or indirectly autoregulates its own expression.
Conversely, it does not seem that TT16 autoregulates its own
expression, as analogous increases in TT16 transcript were not
seen in the tt16-1 background. This finding was supported by
qPCR results that also indicate that TT16 does not appear
to be involved in regulating its own expression (Figure 6C and
Supplemental Figure 2B).
Dean et al. d Arabidopsis Seed Coat Microarray | 1087
at The U
niversity of British C
olombia L
ibrary on Novem
ber 21, 2011http://m
plant.oxfordjournals.org/D
ownloaded from
These datasets are also valuable tools for other researchers and
have been made publically available via a custom eFP interface
(www.dotm.ca/efp/cgi-bin/efpWeb.cgi) and at the NCBI GEO
depository (www.ncbi.nlm.nih.gov/geo/query/acc.cgi?acc
=GSE27857). In addition, the microarray data should be useful for
identifying seed coat-specific promoters. Indeed, we have re-
cently identified one such promoter using the data (Z. Jin, A.
Abdeen, E. Esfandiari, T. Western, and G. Haughn, unpublished
results).
Therefore, this work provides seed coat gene expression
datasets, and provides a starting point for identification of
putative candidate genes involved in seed coat development
and promoter identification. Finally, as Arabidopsis is closely
related to the economically important crop Canola (Brassica
napus) and is a model plant species, the data generated here
should also provide useful information for discovery of
new gene targets with potential for improving seed coat
characteristics in this and related crops.
METHODS
Plant Materials
ap2-7 was isolated from an EMS-mutagenized population in
the Col-2 background (Kunst et al., 1989). tt16-1 is a T-DNA
insertion line in the Ws-2 background (Nesi et al., 2002) that
were received as a gift from Loıc Lepiniec, Seed Biology
Laboratory, IJPB, INRA, France.
Seeds were germinated on AT minimal medium (Haughn
and Somerville, 1986) in growth chambers at 20�C under
continuous light (90–120 lmol m�2 s�1 photosynthetically
active radiation (PAR)) and then transferred at 7–10 d after
germination to prepared soil mix (Sunshine Mix 5, Sun Gro
Horticulture Ltd, Seba Beach, Alberta, Canada) watered
once with liquid AT medium, then grown under the same
conditions as above.
For staging of siliques, open flowers (0 d post anthesis, DPA)
were marked with non-toxic, water-soluble paint to allow the
selection of developing siliques at precise ages. In the case of
ap2-7, flowers were also hand pollinated using WT pollen
at 0 DPA, as they produce little pollen and are somewhat
infertile.
Tissue Preparation and RNA Extraction
Seed coat isolations were performed using a dissecting micro-
scope and forceps. Gentle manipulation with fine forceps
allowed the release of embryos from the micropylar end of
the seed coat. Although flowers were staged to determine
the developmental stage of the seed, the released embryo
was also used to check that the correct stage was harvested.
Isolated seed coats were cut into two pieces and, while holding
the seed coat with forceps, the endosperm of early stages was
washed away with a solution of 5% sucrose in 0.1% RNAlater
solution (Ambion, Cat# AM7021). Replicates of dissected seed
coats for each stage were collected in separate Eppendorf
tubes in dry ice and stored at –80�C before extraction. For
3-DPA samples, 40 seed coats were collected and, for 7 and
11-DPA samples, 20 seed coats were collected.
Total RNA was extracted from each seed coat sample using
the RNAqueous Micro kit (Ambion, Catalog# 1927) with a mi-
nor modification as follows. The seed coat tissues were crushed
completely with a plastic pestle in Eppendorf tubes in 250 ll
lysis buffer, then centrifuged at 13 200 rpm for 2 min. 200 ll
of supernatant was removed to a new Eppendorf tube and
the extraction was completed according to the kit protocol.
The resulting RNA was used both for microarray hybridization
and qPCR.
RNA Amplification, RNA Labeling and Microarray
Hybridization, Array Scanning, and Data Processing
mRNA amplification was carried out using the MessageAmp
aRNA kit (Ambion, Catalog# 1750) according to the supplied
protocol. During the second round of in vitro transcription,
aminoallyl-UTP was incorporated into the newly synthesized
aRNA by including 3 ll of aminoallyl-UTP (50 mM) plus 2 ll of
UTP (75 mM) in the reaction instead of 4 ll of UTP.
The aRNA was purified before NHS ester Cy3 and Cy5 dyes
were chemically coupled with the modified aRNA base. aRNA
labeling and array hybridization were performed using the
protocol of Wellmer et al. (2004).
Hybridized arrays were scanned with a Genepix 4000B
microarray scanner (Axon Instruments, CA, USA) at 10-lm res-
olution and 100% laser power using a dual laser scanning sys-
tem that acquires and displays both wavelength channels as
a ratio image in real time. The scanner was set to scan each
line twice and to average the value obtained. PMT values were
automatically balanced by scanning the slides three times and
calculating PMT values so that similar red and green overall
intensities were obtained. The percentage of spots with satu-
rated pixels was set to ,0.25%. The image analysis was per-
formed using GenePix Pro version 6.0 software (Axon
Instruments, CA, USA). After automatic alignment, feature
indicators were manually moved, resized, and fine-tuned.
Features that failed the background threshold criteria were
flagged using a quality control filter so they could be removed
from the analysis. The local background corrected spot fluores-
cence intensities for the Cy5 and Cy3 channels were saved as
.gpr files. These .gpr files were used as the starting point for
statistical analysis and were also analyzed using GeneSpring
GX 7.3.1 (Agilent Technologies, Inc.) to produce Figure 5.
Details of the microarray design and the complete set
of .gpr files are available at www.dotm.ca/microarray/datla-
haughn.html. Data have also been submitted to the NCBI’s Gene
Expression Omnibus (Edgar et al., 2002; Barrett et al., 2011) and
are accessible through GEO Series accession number GSE27857
(www.ncbi.nlm.nih.gov/geo/query/acc.cgi?acc=GSE27857).
Statistical Methods and Microarray Data Analysis
The Cy3 and Cy5 channels within each array were calibrated
using Huber’s variance stabilization normalization algorithm
1088 | Dean et al. d Arabidopsis Seed Coat Microarray
at The U
niversity of British C
olombia L
ibrary on Novem
ber 21, 2011http://m
plant.oxfordjournals.org/D
ownloaded from

and a difference statistic was calculated for each gene for each
array hybridization (Huber et al., 2002). As all intensities were
high, this difference statistic corresponded to the log-ratio. For
each gene, a linear regression model was then applied to the
data across all 68 arrays in the experiment to estimate the
expected expression and variance in expression for each geno-
type (ap2-7, Col-2, tt16-1, Ws-2) at each time point (3, 7,
11 DPA), and the covariance between expressions for each mu-
tant/time point pair was also estimated (Chambers, 1992).
These three estimates (expected expression, variance in
expression, and covariance) were then used to compute the
expression difference and its standard error, both between
genotypes at the same time point and between time points
within a genotype. A t-test was performed to calculate the
p-value (the probability that the observed difference occurred
by chance alone) for each comparison of interest for each
gene. The false discovery rate (q-value) was calculated and
used to correct for significant differences in gene expression
that occur due to chance alone when performing multiple
comparisons (Storey, 2002). As well as computing the differ-
ence in gene expression with standard error, p-value, and q-
value for each gene, the estimated fold change with a 95%
CI was also calculated. Graphics showing degree of differential
expression were also produced.
Those genes for which at least one comparison of interest had
a q-value less than 0.05 and a fold change greater than 2.0 in
magnitude either up or down were selected for clustering. This
set of 8714 genes was clustered using the divisive hierarchical
clustering method DIANA (Kaufman and Rousseeuw, 1990). Data
were presented as a heatmap as well as a text file detailing gene
order. In addition, lists of significantly up or down-regulated
genes (defined as more than two-fold change in expression)
for comparisons of interest were generated.
Further manipulation of these gene lists was carried out us-
ing the Classification Superviewer to identify trends in gene
expression patterns (Provart and Zhu, 2003), and SmartDraw
software to perform Venn analysis (www.smartdraw.com).
The normalized values were also formatted for insertion into
a MySQL database behind the eFP browser interface using
a custom perl script.
Quantitative PCR Methods and Analysis
Quantitative PCR (qPCR) was performed in optical 48-well
plates using the StepOne� Real-Time PCR System (Applied Bio-
systems, Foster City, CA, USA). SYBR� Green used to monitor
dsDNA synthesis. Reactions contained 5 ll 2xSYBR� Green
Master Mix reagent (Applied Biosystems), 1 ng cDNA and
200 mM of each gene-specific primer in a final volume of
10 ll. The following standard thermal profile was used for
all PCR: 50�C for 2 min; 95�C for 10 min; 40 cycles of 95�Cfor 15 s; and 60�C for 1 min. b-6-tubulin (AT5G12250F, 5’-
ACCACTCCTAGCTTTGGTGATCTG-3’; AT5G12250R, 5’-AGGTT-
CACTGCGAGCTTCCTCA-3’) was used as an endogenous refer-
ence. Data were analyzed using the StepOne� Real-Time PCR
System version 1.0 (Applied Biosystems).
Seed Coat Morphology
Mature, dry seeds were immobilized on glass microscope slides
using double-sided sticky tape before being viewed and pho-
tographed using a dissecting microscope.
Developing seeds were fixed with 3% (v/v) glutaraldehyde
(Canemco, Lachine, Quebec, Canada) in 0.5 M sodium phos-
phate, pH 7. Post-fixation with 1% (v/v) osmium tetroxide, de-
hydration, embedding, and sectioning were as described by
Western et al. (2000). Thick sections (0.2–0.5 lm) were stained
with 1% (w/v) Toluidine Blue O in 1% (w/v) sodium borate,
pH 11, and photographed using a Zeiss AxioScop light micro-
scope (Carl Zeiss, Oberkochen, Germany).
Digital photographs were manipulated with Adobe Photo-
shop (Adobe Photosystems, Mountain View, CA) to prepare
figures.
Mucilage Mutant Screens
Mucilage release from mature seeds was investigated using
Ruthenium Red (Sigma-Aldrich) staining. For staining without
shaking, seeds were hydrated for 1 h in water, then the water
was carefully removed without disturbing the seeds, and the
seeds stained for 1 h in 0.01% (w/v) Ruthenium Red before be-
ing viewed. Both steps were performed without shaking. For
staining with shaking, the same procedure was followed ex-
cept that seeds were shaken during hydration with water
and during staining with Ruthenium Red. All samples were
mounted in water and viewed using a dissecting microscope.
DigitalphotographsweremanipulatedwithAdobePhotoshop
(Adobe Photosystems, Mountain View, CA) to prepare figures.
SUPPLEMENTARY DATA
Supplementary Data are available at Molecular Plant Online.
FUNDING
ThisworkwasfundedbytheGenomeCanadaandGenomeAlbertapro-
ject‘DesigningOilseedsforTomorrow’sMarket’toG.W.H.,G.S.andR.D.
ACKNOWLEDGMENTS
WethankLoıcLepiniecforthegiftoftt16-1seeds,andMathieuCloutier
andEdwinWangfor helpwithprocessing themicroarraydata.Wealso
thank the staff at the University of British Columbia BioImaging facility
for invaluable help with microscopy. No conflict of interest declared.
REFERENCES
Abrahams, S., Lee, E., Walker, A.R., Tanner, G.J., Larkin, P.J., and
Ashton, A.R. (2003). The Arabidopsis TDS4 gene encodes
leucoanthocyanidin dioxygenase (LDOX) and is essential for
proanthocyanidin synthesis and vacuole development. Plant J.
35, 624–636.
Dean et al. d Arabidopsis Seed Coat Microarray | 1089
at The U
niversity of British C
olombia L
ibrary on Novem
ber 21, 2011http://m
plant.oxfordjournals.org/D
ownloaded from

Albert, S., Delseny,M., andDevic,M. (1997). BANYULS, a novel neg-
ative regulator of flavonoid biosynthesis in the Arabidopsis seed
coat. Plant J. 11, 289–299.
Arsovski, A.A., Haughn, G.W., and Western, T.L. (2010). Seed coat
mucilage cells of Arabidopsis thaliana as a model for plant cell
wall research. Plant Signalling Behaviour. 5, 796–801.
Barrett, T., et al. (2011). NCBI GEO: archive for functional data
sets—10 years on. Nucl. Acids Res. 39, D1005–D1010.
Beeckman, T., De Rycke, R., Viane, R., and Inze, D. (2000). Histolog-
ical study of seed coat development in Arabidopsis thaliana. J.
Plant Res. 113, 139–148.
Buchanan-Wollaston, V., et al. (2005). Comparative transcriptome
analysis reveals significant differences in gene expression and
signalling pathways between developmental and dark/
starvation-induced senescence inArabidopsis. Plant J.42,567–585.
Chambers, J.M. (1992). Linear models. In Statistical Models,
Chambers, J.M., Hastie, T.J., eds (Pacific Grove: S. Wadsworth
& Brooks/Cole), pp. 144–195.
Chen, W.J., Chang, S.H., Hudson, M.E., Kwan, W.-K., Li, J., Estes, B.,
Knoll, D., Shi, L., and Zhu, T. (2005). Contribution of transcrip-
tional regulation to natural variations in. Arabidopsis. Genome
Biol. 6, R32.
Dean, G.H., et al. (2007). The Arabidopsis MUM2 gene encodes a b-
Galactosidase required for the production of seed coat mucilage
with correct hydration properties. Plant Cell. 19, 4007–4021.
Debeaujon, I., Nesi, N., Perez, P., Devic, M., Grandjean, O.,
Caboche, M., and Lepiniec, L. (2003). Proanthocyanidin-
accumulating cells in Arabidopsis testa: regulation of differenti-
ation and role in seed development. Plant Cell. 15, 2514–2531.
Devic, M., Guilleminot, J., Debeaujon, I., Bechtold, N., Bensaude, E.,
Koornneef, M., Pelletier, G., and Delseny, M. (1999). The
BANYULS gene encodes a DFR-like protein and is a marker of
early seed coat development. Plant J. 19, 387–398.
Edgar, R., Domrachev, M., and Lash, A.E. (2002). Gene Expression
Omnibus: NCBI gene expression and hybridisation array data
repository. Nucl. Acids Res. 30, 207–210.
Gallardo, K., Firnhaber, C., Zubert, H., Hericher, D., Belghazi, M.,
Henry, C., Kuster, H., and Thompson, R. (2007). A combined
proteome and transcriptome analysis of developing Medicago
truncatula seeds. Mol. Cell. Proteomics. 6, 2165–2179.
Haughn, G.W., and Chaudhury, A. (2005). Genetic analysis of seed
coat development in Arabidopsis. Trends Plant Sci. 10, 472–477.
Haughn, G.W., and Somerville, C. (1986). Sulfonylurea-resistant
mutants of Arabidopsis thaliana. Molecular General Genetics.
204, 430–434.
Huber, H., von Heydebreck, A., Sueltman, H., Pouska, A., and
Vingron, M. (2002). Variance stabilization applied to microarray
data calibration and to the quantification of differential expres-
sion. Bioinformatics. 18, S96–S104.
Jiang, Y., and Deyholos, M. (2010). Transcriptome analysis of
secondary-wall-enriched seed coat tissues of canola (Brassica
napus L.). Plant Cell Rep. 29, 327–342.
Jofuku, K.D., Denboer, B.G.W., Montague, M.V., and Okamuro, J.K.
(1994). Control of Arabidopsis flower and seed development by
the homeotic gene APETALA2. Plant Cell. 6, 1211–1225.
Kaufman, L., and Rousseeuw, P.J. (1990). Finding Groups in Data:
An Introduction to Cluster Analysis (New York: Wiley).
Koornneef, M. (1981). The complex syndrome of TTG mutants.
Arabidopsis Information Service. 18, 45–51.
Koornneef, M., Dellaert, L.W.M., and Vanderveen, J.H. (1982).
EMS-induced and radiation-induced mutation frequencies at
individual loci in Arabidopsis thaliana (L) Heynh. Mutation Res.
93, 109–123.
Kunst, L., Klenz, J.E., Martinez-Zapater, J., and Haughn, G.W.
(1989). AP2 gene determines the identity of perianth organs
in flowers of Arabidopsis thaliana. Plant Cell. 1, 1195–1208.
Le, B.H., et al. (2010). Global analysis of gene activity during
Arabidopsis seed development and identification of seed-
specific transcription factors. PNAS. 107, 8063–8070.
Lepiniec, L., Debeaujon, I., Routaboul, J.M., Baudry, A., Pourcel, L.,
Nesi, N., and Caboche, M. (2006). Genetics and biochemistry of
seed flavonoids. Ann. Rev. Plant Biol. 57, 405–430.
Macquet, A., Ralet, M.-C., Loudet, O., Kronenberger, J.,
Mouille, G., Marion-Poll, A., and North, H.M. (2007). A naturally
occurring mutation in an Arabidopsis accession affects
a b-D-galactosidase that increases the hydrophilic potential
of rhamnogalacturonan I in seed mucilage. Plant Cell. 19,
3990–4006.
Nakaune, S., Yamada, K., Kondo, M., Kato, T., Tabata, S.,
Nishimura,M., andHara-Nishimura, I. (2005). A vacuolar process-
ing enzyme, dVPE, is involved in seed coat formation at the early
stage of seed development. Plant Cell. 17, 876–887.
Nesi, N., Debeaujon, I., Jond, C., Pelletier, G., Caboche, M., and
Lepiniec, L. (2000). The TT8 gene encodes a basic helix-loop-helix
domain protein required for expression ofDFR andBANGenes in
Arabidopsis siliques. Plant Cell. 12, 1863–1878.
Nesi, N., Debeaujon, I., Jond, C., Stewart, A., Jenkins, G.I.,
Caboche,M., and Lepiniec, L. (2002). The TRANSPARENT TESTA16
locus encodes the ARABIDOPSIS BSISTER MADS domain protein
and is required for proper development and pigmentation of
the seed coat. Plant Cell. 14, 2463–2479.
Nesi, N., Jond, C., Debeaujon, I., Caboche, M., and Lepiniec, L.
(2001). The Arabidopsis TT2 gene encodes an R2R3 MYB
domain protein that acts as a key determinant for proanthocya-
nidin accumulation in developing seed. Plant Cell. 13,
2099–2114.
Pang, J.-S., He, M.-Y., and Liu, B. (2004). Construction of the
seed-coat cDNA microarray and screening of differentially
expressed genes in Barley. Acta Biochimica Biophysica Sinica.
36, 695–700.
Pang, Y., Peel, G.J., Sharma, S.B., Tang, Y., and Dixon, R.A. (2008). A
transcript profiling approach reveals an epicatechin-specific glu-
cosyltransferase expressed in the seed coat of Medicago trunca-
tula. PNAS. 105, 14210–14215.
Penfield, S., Meissner, R.C., Shoue, D.A., Carpita, N.C., and
Bevan, M.W. (2001). MYB61 is required for mucilage deposition
and extrusion in the Arabidopsis seed coat. Plant Cell. 13,
2777–2791.
Provart, N.J., and Zhu, T. (2003). A browser-based functional classi-
fication SuperViewer for Arabidopsis genomics. Curr. Computa-
tional Mol. Biol. 2003, 271–272.
1090 | Dean et al. d Arabidopsis Seed Coat Microarray
at The U
niversity of British C
olombia L
ibrary on Novem
ber 21, 2011http://m
plant.oxfordjournals.org/D
ownloaded from

Schmid, M., Davison, T.S., Henz, S.R., Pape, U.J., Demar, M.,
Vingron, M., Scholkopf, B., Weigel, D., and Lohmann, J.U.
(2005). A gene expression map of Arabidopsis thaliana develop-
ment. Nature Genetics. 37, 501–506.
Shirley, B.W., Kubasek, W.L., Storz, G., Bruggemann, E.,
Koornneef, M., Ausubel, F.M., and Goodman, H.M. (1995). Anal-
ysis of Arabidopsis mutants deficient in flavonoid biosynthesis.
Plant J. 8, 659–671.
Skinner, D.J., and Gasser, C. (2009). Expression-based discovery of
candidate ovule development regulators through transcrip-
tional profiling of ovule mutants. BMC Plant Biol. 9, 29.
Storey, J.D. (2002). A direct approach to false discovery rates. J.
Royal Statistical Society, Series B. 64, 479–498.
Usadel, B., Kuschinsky, A.M., Rosso, M.G., Eckermann, N., and
Pauly, M. (2004). RHM2 is involved in mucilage pectin synthesis
and is required for the development of the seed coat in Arabi-
dopsis. Plant Physiol. 134, 286–295.
Wellmer,F.,Riechmann, J.L.,Alves-Ferreira,M.,andMeyerowitz,E.M.
(2004). Genome-wide analysis of spatial gene expression in Arabi-
dopsis flowers. Plant Cell. 116, 1314–1326.
Western, T.L., Burn, J., Tan,W.L., Skinner, D.J., Martin-McCaffrey, L.,
Moffatt, B.A., and Haughn, G.W. (2001). Isolation and character-
ization of mutants defective in seed coat mucilage secretory cell
development in Arabidopsis. Plant Physiol. 127, 998–1011.
Western, T.L., Skinner, D.J., and Haughn, G.W. (2000). Differentia-
tion of mucilage secretory cells of the Arabidopsis seed coat.
Plant Physiol. 122, 345–356.
Western, T.L., Young, D.S., Dean, G.H., Tan, W.L., Samuels, A.L., and
Haughn, G.W. (2004). MUCILAGE-MODIFIED4 encodes a putative
pectin biosynthetic enzyme developmentally regulated by APE-
TALA2, TRANSPARENT TESTA GLABRA1, and GLABRA2 in the
Arabidopsis seed coat. Plant Physiol. 134, 296–306.
Winter, D., Vinegar, B., Nahal, H., Ammar, R., Wilson, G.V., and
Provart, N.J. (2007). An ‘Electronic Fluorescent Pictograph’
browser for exploring and analyzing large-scale biological data
sets. PLoS ONE. 2, e718.
Zhang, C., Barthelson, R.A., Lambert, G.A., and Galbraith, D.W.
(2008). Global characterization of cell-specific gene expres-
sion through fluorescence-activated sorting of nuclei. Plant
Physiol. 147, 30–40.
Dean et al. d Arabidopsis Seed Coat Microarray | 1091
at The U
niversity of British C
olombia L
ibrary on Novem
ber 21, 2011http://m
plant.oxfordjournals.org/D
ownloaded from
Related Documents