November 2007 Analysis of Food Safety Performance in Meat and Poultry Establishments Revised Final Report Contract No. 53-3A94-03-12, Task Order 18 Prepared for Flora Tsui James Wilkus U.S. Department of Agriculture Food Safety and Inspection Service 1400 Independence Avenue SW Washington, DC 20250 Prepared by Mary K. Muth Mansour Fahimi Shawn A. Karns Yan Li RTI International Health, Social, and Economics Research Research Triangle Park, NC 27709 RTI Project Number 0208893.018

Welcome message from author
This document is posted to help you gain knowledge. Please leave a comment to let me know what you think about it! Share it to your friends and learn new things together.
Transcript

November 2007
Analysis of Food Safety Performance in Meat and Poultry
Establishments
Revised Final Report Contract No. 53-3A94-03-12, Task Order 18
Prepared for
Flora Tsui James Wilkus
U.S. Department of Agriculture Food Safety and Inspection Service
1400 Independence Avenue SW Washington, DC 20250
Prepared by
Mary K. Muth Mansour Fahimi Shawn A. Karns
Yan Li RTI International
Health, Social, and Economics Research Research Triangle Park, NC 27709
RTI Project Number 0208893.018

RTI Project Number 0208893.018
Analysis of Food Safety Performance in Meat and Poultry
Establishments
Revised Final Report Contract No. 53-3A94-03-12, Task Order 18
November 2007
Prepared for
Flora Tsui James Wilkus
U.S. Department of Agriculture Food Safety and Inspection Service
1400 Independence Avenue SW Washington, DC 20205
Prepared by
Mary K. Muth Mansour Fahimi Shawn A. Karns
Yan Li RTI International
Health, Social, and Economics Research Research Triangle Park, NC 27709
RTI International is a trade name of Research Triangle Institute

1
Preface
In September 2005, the U.S. Department of Agriculture’s Food Safety and Inspection Service (USDA, FSIS) contracted with RTI International to conduct an analysis of food safety performance in meat and poultry slaughter establishments using available FSIS data sets.1 RTI developed a work plan for the project that incorporated comments and input from FSIS on the needs for the analysis. Based on the tasks outlined in the work plan, we conducted the analyses described in this report.
In this preface, we discuss the background for the study and the objective of the analysis and provide an overview of the remainder of the report.
1. BACKGROUND Recent research based on 2000 data has shown that an establishment’s Hazard Analysis and Critical Control Points (HACCP) plan compliance, certain establishment characteristics, and its use of particular slaughter processing practices and technologies can be reasonably reliable indicators of that establishment’s performance in pathogen control. Pathogen control is a major determinant of the food safety performance and the level of food safety risk associated with the establishment. This research provides an empirical basis for and general insights into the level of inspection resources that FSIS may allocate to various types of establishments under a risk-based system of inspection.
1 RTI will conduct additional analyses under a modification to the task
order that will consider more recent data for young chicken slaughter establishments and help contribute to the development of a risk-based sampling process.
Data from recent industry surveys conducted by FSIS were combined with existing FSIS databases to conduct a unique analysis of the factors affecting food safety performance in meat and poultry slaughter establishments.
Analysis of Food Safety Performance in Meat and Poultry Establishments
2
FSIS conducted surveys of meat and poultry slaughter and processing establishments in 2004 and of processing-only establishments in 2005. These more recent data may provide better estimates of current establishment food safety performance. The databases from these surveys and agency databases (e.g., Performance-Based Inspection System [PBIS], Enhanced Facilities Database [EFD], and Microbiological and Residue Contamination Information System [MARCIS]) can be used to provide improved estimates of establishments’ food safety performance and an empirical basis for measures the agency may consider in the transition to risk-based systems.
The agency places a high priority on developing information from the 2004 and 2005 surveys and agency databases that can be used to inform regular and frequent agency decisions concerning inspection and testing activities. Survey data provide one source of external information available to the agency on which to make these decisions. FSIS anticipates that guidance for these decisions may be developed based on the analysis of these data.
As outlined in the project work plan, RTI constructed analysis data sets for the following four categories:
young chicken carcasses
pork carcasses
beef carcasses
ground beef produced in cattle slaughter establishments
RTI used a number of statistical methods to identify which relationships are most significant and which factors are strong predictors of food safety performance as indicated by Salmonella test results. Detailed analyses were conducted for young chicken carcasses and market hog carcasses; the results of these detailed analyses are the primary focus of this report. We also conducted limited analyses for beef carcasses and ground beef produced in cattle slaughter establishments because products tend to have very few positive Salmonella test results; thus, detailed analyses are less informative; the results of these limited analyses are provided in Appendix C.
The analysis methods included
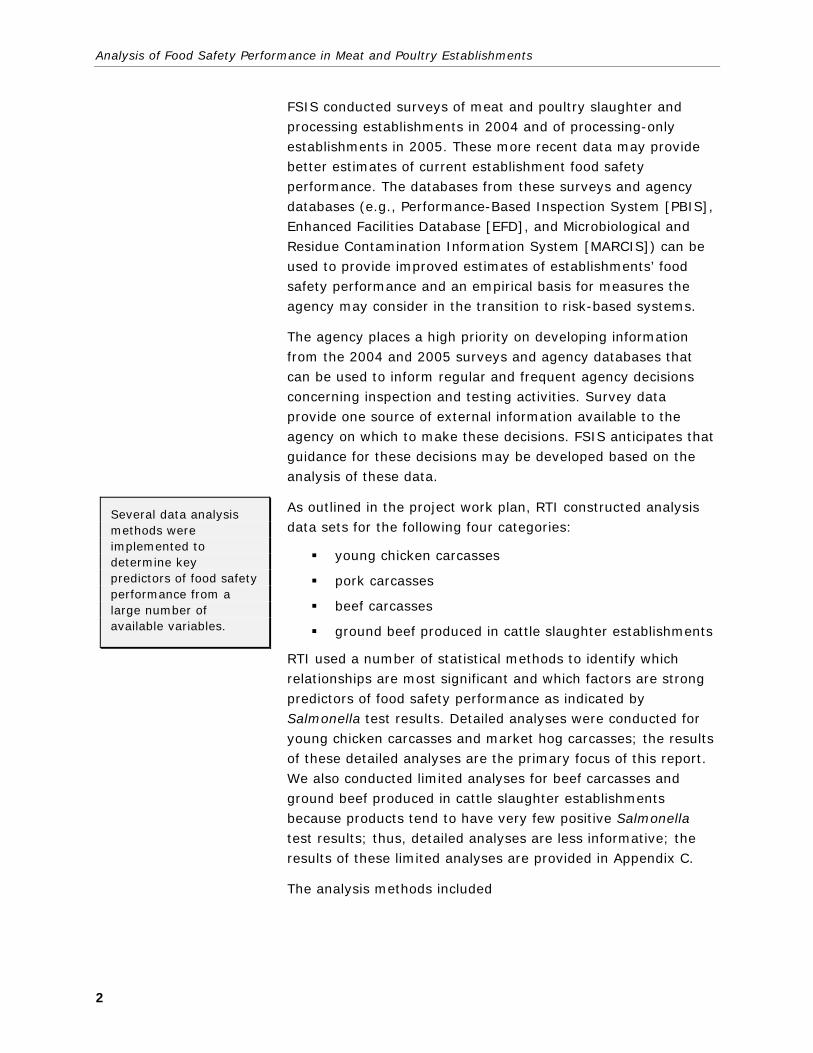
Several data analysis methods were implemented to determine key predictors of food safety performance from a large number of available variables.
Preface
3
development of a classification tree, including identification of the relative importance of the potential predictors of food safety performance;
factor analysis to identify underlying themes or factors (i.e., combinations of predictors) associated with food safety performance; and
logistic regression analysis to determine the relative contributions of the predictors to food safety performance.
These analytical methods provide actionable results on which informed policy decisions can be made and provide information for allocating inspection program resources, including personnel.
The approach developed for this task could also be applied to analyze food safety performance in processing-only establishments. FSIS also fielded a survey of processing-only establishments, and results of the survey could be used to construct a similar data set. Performance measures for processing-only establishments could include both Listeria test results and Salmonella test results.
2. OBJECTIVE The objective of this task order is to conduct statistical analyses of food safety performance in meat and poultry slaughter establishments. Detailed analyses were conducted for young chicken and pork slaughter establishments, and limited analyses were conducted for beef carcasses and ground beef produced in cattle slaughter establishments.
3. ORGANIZATION OF THE REPORT The body of this report contains the manuscript prepared under this task order. It includes an introduction, description of the data sets, overview of the methods, results of the analysis, and a discussion of the results. The manuscript is formatted for submission for publication. By submitting the manuscript for publication, it will be peer reviewed and the analysis can be improved based on the feedback received.
In addition to the manuscript, Appendix A includes the data dictionary for meat establishments, and Appendix B includes the data dictionary for poultry establishments. Exploratory analyses conducted for beef carcasses and for ground beef

Analysis of Food Safety Performance in Meat and Poultry Establishments
4
produced in cattle slaughter establishments are included in Appendix C. Finally, the presentation of the results of the analysis at FSIS is provided in Appendix D.

1
Running Head: Meat and Poultry Pathogen Control Performance 1
2 Analysis of Pathogen Control Performance in 3
U.S. Young Chicken Slaughter and Pork Slaughter Establishments 4
5
Mary K. Muth,* Mansour Fahimi, Shawn A. Karns 6
RTI International 7
3040 Cornwallis Road 8
P.O. Box 12194 9
Research Triangle Park, NC 27709 10
11
October 2007 12
13
Key words: Salmonella, young chicken slaughter, pork slaughter, establishment performance, 14
risk-based inspection 15
16
17
* Mary K. Muth, RTI International, 3040 Cornwallis Road, P.O. Box 12194, Research Triangle Park, NC 27709;
Voice: (919) 541-7289; Fax: (919) 541-6683; E-mail: [email protected]

2
Analysis of Pathogen Control Performance in 18
U.S. Young Chicken Slaughter and Pork Slaughter Establishments 19
ABSTRACT 20
In the 1996 U.S. Department of Agriculture, Food Safety and Inspection Service’s 21
(FSIS’s) “Pathogen Reduction; Hazard Analysis and Critical Control Point (PR/HACCP) 22
Systems, Final Rule,” Salmonella was selected for microbiological testing and monitoring. Using 23
data from an FSIS-sponsored survey of meat and poultry slaughter establishments, inspection 24
results, and other establishment characteristics, potential variables affecting pathogen control, as 25
measured by Salmonella test results, were investigated. The analysis data sets included 153 26
federally inspected young chicken slaughter establishments, of which 111 failed half the 27
Salmonella performance standard at least once from 2003 through 2005, and 121 federally 28
inspected pork slaughter establishments, of which 28 failed half the Salmonella performance 29
standard. Logistic regression results for young chicken slaughter establishments seem to indicate 30
they were more likely to fail if they had higher inspection noncompliance rates (p = .10) and 31
older production space (p = .10) and were less likely to fail if they used a higher percentage of 32
raw poultry inputs purchased from outside sources (p = .10). Results for pork slaughter 33
establishments indicate they were more likely to fail if they had a higher rate of voluntary 34
microbiological testing (p = .08) and were less likely to fail if they were larger (p = .08) and used 35
a higher percentage of raw pork inputs purchased from outside sources (p = .02). In general, 36
indicators of plant characteristics, food safety practices, and management philosophy are 37
associated with different levels of pathogen control performance that vary by species 38
slaughtered. 39

3
The 1996 U.S. Department of Agriculture, Food Safety and Inspection Service (FSIS) 40
“Pathogen Reduction; Hazard Analysis and Critical Control Point (PR/HACCP) Systems, Final 41
Rule” sets Salmonella performance standards for establishments slaughtering selected classes of 42
food animals or those producing selected classes of raw ground products (Federal Register, 43
2006). FSIS selected Salmonella for microbiological testing because it is a common bacterial 44
cause of foodborne illness, it occurs often enough to be detected and monitored, methods are 45
available for recovering Salmonella from a variety of meat and poultry products, and 46
intervention strategies aimed at reducing Salmonella should be effective at reducing other 47
foodborne pathogens (17). Testing began under the PR/HACCP rule in January 1998 for large 48
establishments (500 or more employees), in January 1999 for small establishments (from 10 to 49
499 employees), and in January 2000 for very small establishments (9 or fewer employees or less 50
than $2.5 in annual sales) (17). 51
The performance standards for Salmonella testing vary by type of product, as indicated in 52
Table 1. The sample set size varies from 51 to 82 samples, and the maximum positives varied 53
from 1 to 29 depending on product type (18). Establishments that slaughter young chickens fail 54
the performance standards with 13 positives out of 51 samples, and establishments that slaughter 55
hogs fail the performance standard with 7 positives out of 55 samples. Recently, FSIS developed 56
scheduling criteria such that establishments that fail half the performance standard (i.e., are at 57
51% of the performance standard or higher) during a sample set are tested more frequently than 58
establishments that are at 50% of the performance standard or less (19). Thus, young chicken 59
slaughter establishments that have 7 or more positives and hog slaughter establishments that 60
have 4 or more positives are subsequently tested more frequently. 61

4
Table 1. Salmonella Sample Set Size and Performance Standard for Each Meat and Poultry 62
Product Type 63
Product Type Sample Set Size Maximum Positives
Steer and heifer carcasses 82 1
Cow and bull carcasses 58 2
Ground beef 53 5
Market hog carcasses 55 6
Chicken carcasses 51 12
Ground chicken 53 26
Ground turkey 53 29
64
Salmonella test results provide a measure of pathogen control in meat and poultry 65
produced at slaughter and processing establishments and thus can be used to verify that industry 66
systems are effective in controlling the contamination of raw meat and poultry products with 67
disease-causing bacteria. Whether an establishment typically passes the Salmonella performance 68
standard may depend on a variety of factors, including the characteristics of the establishment, 69
use of food safety technologies, and management practices in the establishment. Recent surveys 70
of food safety technologies and practices were conducted for FSIS to determine the prevalence of 71
various food safety technologies and practices used in the U.S. poultry and meat slaughter 72
industries, to characterize the use and types of microbiological testing, and to determine the 73
prevalence of different types of employee food safety training (5, 6). The results of the survey 74

5
combined with other data sources were used to determine which factors are typically associated 75
with better pathogen control performance as measured by Salmonella test results. 76
The use of different types of food safety technologies and characteristics of slaughter 77
establishments has been shown to affect pathogen levels on carcasses. In particular, the use of 78
different types of carcass rinse solutions, carcass decontamination methods, and skin removal 79
methods has been shown to reduce microbial carcass counts (3, 4, 8, 10, 12, 20). Line speeds 80
within the establishment also affect pathogen levels on carcasses as shown for E. coli 81
populations on beef carcasses (2). The use of online versus off-line reprocessing of poultry 82
carcasses to meet zero fecal tolerance standards affects Campylobacter and Salmonella levels on 83
poultry carcasses (11). Furthermore, the use of different carcass chilling methods (immersion 84
versus air) affects Salmonella and Campylobacter incidence on broiler carcasses (15). In addition 85
to using specific food safety technologies, other factors shown to affect pathogen levels on 86
carcasses include location and size of the establishment (1). 87
The purpose of this study was to identify young chicken and hog slaughter establishment 88
characteristics, including the use of specific food safety technologies, associated with better 89
pathogen control performance as measured by Salmonella test results. The analysis was 90
conducted using data from the FSIS surveys of meat and poultry slaughter establishments, data 91
on establishment characteristics from FSIS’s databases and a private vendor, and data on 92
inspection procedure results from FSIS. This study’s results provide information useful for 93
informing the development of a risk-based inspection system and for identifying establishments 94
most likely to be in need of technical assistance for controlling pathogens. 95

6
MATERIALS AND METHODS 96
Data Sets. The data sets used for the analyses were constructed from the following 97
sources: 98
• FSIS’s Enhanced Facilities Database, which contains production and economic data 99
for fiscal year 2004 on establishment characteristics for all meat and poultry 100
establishments under federal inspection from FSIS’s Performance-Based Inspection 101
System (PBIS) database, FSIS’s Animal Disposition Reporting System (ADRS), and 102
a private data vendor, infoUSA (13); 103
• results of FSIS’s meat and poultry slaughter establishment survey, which was 104
conducted using nationally representative sampling procedures and includes data on 105
food safety technologies and practices for all meat and poultry establishments that 106
completed the survey in late 2004 and early 2005 (5, 6); 107
• FSIS’s Salmonella test results for all establishments that were tested in FY 2003, FY 108
2004, and FY 2005; and 109
• FSIS’s noncompliance report data from the PBIS database for facility, sanitation, and 110
HACCP inspection procedures conducted in 2004. 111
Data from each of the databases were matched based on FSIS establishment number to construct 112
a complete record for each establishment. The variables in the data set include Salmonella test 113
results for each product produced in the establishment; self-reported establishment responses to 114
survey questions on food safety practices during slaughter and further processing, voluntary 115
microbiological testing practices, employee food safety training, and other characteristics of the 116
establishment; economic variables such as number of employees, annual sales, number of other 117
establishments owned by the company, and slaughter volumes by species; and results of 118

7
inspection procedures conducted by FSIS inspectors. All of the data pertain primarily to 119
performance and activities in 2004 with the exception of the Salmonella test results, which 120
pertain to FY 2003, FY 2004, and FY 2005. 121
We constructed the outcome measures (dependent variables) for the analyses based on 122
the results of Salmonella testing for the first sample set for each establishment. Results from the 123
second and third sample sets, if they were conducted, were not included because most 124
establishments pass the first set and thus only have data for the first set and because subsequent 125
sample sets are not representative of typical operating practices of the establishment since 126
establishments make adjustments after failing the first set. We included test results for 2003 127
through 2005 to allow for a greater number of test sets to be represented in the data. However, by 128
including multiple years of test results, we assumed that establishment characteristics over 3 129
years’ time are relatively constant. To correspond to FSIS’s new scheduling criteria for 130
Salmonella testing, we classified establishments as “failures” for the purposes of the analysis if 131
they failed half the performance standard at least once during the 2003 through 2005 time period. 132
We constructed the set of predictors (independent variables) in the analysis data sets 133
using the remaining variables contained in the data sets. All variables that could be potential 134
predictors of pathogen control performance were retained. Data preparation steps were 135
conducted to logically impute missing values from the survey responses and eliminate redundant 136
variables from multiple data sources. In addition, regulatory compliance variables were 137
constructed from inspection procedure data from PBIS. Specifically, we defined facility, 138
sanitation, and HACCP compliance variables by dividing the number of inspection procedures 139

8
that resulted in a noncompliance report by the total number of inspection procedures performed 140
under each category of procedures.† 141
As indicated in Table 2, the resulting data set for young chicken slaughter establishments 142
included 153 establishments, of which 111 failed half the Salmonella performance standard at 143
least once from 2003 through 2005. The resulting data set for pork slaughter establishments 144
included 121 establishments, of which 28 failed half the Salmonella performance standard. The 145
young chicken slaughter data set represents a random sample of approximately 70% of the 146
population of federally inspected establishments that slaughter young chickens; these 147
establishments slaughtered 82% of the volume of young chickens slaughtered in 2004. The pork 148
slaughter data set represents a random sample of approximately 20% of the population of 149
federally inspected establishments that slaughter hogs; these establishments slaughtered 81% of 150
the volume of market hogs slaughtered in 2004.‡ Establishments not included in the data sets are 151
those that were not surveyed or were not subject to Salmonella testing during the time period of 152
the data. 153
† We used all inspection task results, including those identified as a review of a single critical control point (CCPs)
or a review of all CCPs and those that were scheduled and unscheduled. We defined facility compliance using
inspection code 06D01, which addresses whether establishment facilities (e.g., lighting, ventilation, and
plumbing), equipment, and premises meet regulatory requirements; sanitation compliance using inspection codes
01B01, 01B02, 01C01, and 01C02, which address whether establishments conduct procedures before and during
operations to prevent direct product contamination or alteration; and HACCP compliance using inspection codes
03B01, 03B02, 03C01, 03C02, 03J01, and 03J02, which address whether establishments are monitoring and
recording CCPs to ensure compliance with critical limits and are performing verification activities.
‡ The establishments that slaughter market hogs also slaughter a small percentage of culled sows. On average, about
5% of their slaughter volumes comprise culled sows.

9
Table 2. Total Numbers of Establishments in the Analysis Data Sets and Number of 154
Establishments that Failed Half the Performance Standard for Salmonella 155
Analysis Category
Number of Slaughter
Establishments in
Each Category
Number of
Establishments in
Analysis Data Seta
Number that Failed
Half the Performance
Standard
Young chicken slaughter
establishments
221 153 111
Pork slaughter
establishments
603 121 28
a Establishments were excluded from the analysis data set if they were not subject to Salmonella testing in 2003 156
through 2005 or were not surveyed. 157
Analysis Methods. Before conducting the analysis, we took two steps to further prepare 158
the data sets. First, some variables, particularly those related to sales and slaughter volume, 159
exhibited a great deal of variability across establishments. Thus, continuous variables with a 160
large degree of variability were stabilized using a natural log transformation. Second, a few 161
measures that depend on (i.e., increase with) the size of the establishment were normalized with 162
respect to their corresponding establishment size. For example, the number of production 163
employees who have completed HACCP training should be compared relative to the size of the 164
establishment. Thus, these types of variables were expressed as a proportion to the total number 165
of employees. 166
The data sets contained a large number of potential predictor variables (66 variables for 167
young chicken slaughter establishments and 89 variables for pork slaughter establishments). 168
Thus, the classification and regression tree (CART) procedure was used to identify potential 169

10
predictors of the Salmonella outcome measure (Salford Systems, Inc.). Specifically, for each data 170
set, a classification tree was constructed to show the partitioning of establishments based on 171
variables that had an effect on Salmonella control performance. Using this exploratory 172
investigation, the relative importance of the highest ranking predictors was established based on 173
their cumulative contribution in classifying establishments. The relative importance of the 174
variables was used to identify a smaller set of key predictors used in the subsequent analyses. 175
Multicollinearity is a common problem in statistical modeling and arises when predictor 176
variables are correlated. Because most statistical techniques, particularly regression-based 177
procedures, rely on the assumption that all predictor variables are independent, inclusion of 178
correlated data can result in highly unstable results. To address this problem in the analyses, we 179
used factor analysis to develop predictors of Salmonella control performance that are orthogonal 180
(independent) to one another. Furthermore, factor analysis enabled us to identify sets of 181
underlying factors, or themes, among the predictor variables. Factor analysis can be conducted 182
using continuous variables but does not incorporate binary variables; however, binary variables 183
were incorporated in the final analysis step. 184
Using the resulting themes and key binary variables identified in the CART analyses, we 185
estimated logistic regressions to determine the magnitude and direction of the effects of the key 186
variables on Salmonella control performance. The logistic regressions were first applied using 187
only the factors obtained in the factor analysis for young chicken slaughter and pork slaughter 188
establishments. Then, the logistic regressions were reapplied, including not only the factors but 189
also the key binary predictor variables that were identified in the CART analysis to determine 190
whether these variables might provide additional explanatory power not already captured by the 191
factors. 192

11
For young chicken slaughter establishments, we also included a binary variable indicating 193
whether the establishment operates under a HACCP-based inspection models project (HIMP) 194
because FSIS was interested in knowing whether HIMP establishments performed better or 195
worse on Salmonella performance when controlling for other variables that might affect 196
establishment performance. Under HIMP inspection, establishment employees carry out the 197
sorting activities previously conducted by FSIS inspectors to determine which carcasses and 198
parts are unacceptable because they are diseased or unwholesome (7). A total of 17 199
establishments operating under HIMP inspection were included in the young chicken slaughter 200
data set. 201
In summary, the analyses for each data set were conducted in the following steps: 202
• Step 1. Transformed variables and prepared data sets for the analysis 203
• Step 2. Identified important predictor variables of Salmonella control performance 204
using CART classification trees 205
• Step 3. Identified key themes, or clusters of variables, for Salmonella control 206
performance using factor analysis 207
• Step 4. Estimated the magnitude and direction of effects of the key themes and binary 208
variables on Salmonella control performance using logistic regression 209
RESULTS 210
The results of the series of analyses for young chicken slaughter and pork slaughter 211
establishments are described below. 212
Young Chicken Slaughter Establishments. Figure 1 shows the top nodes of the CART 213
classification tree for young chicken slaughter establishments. The strongest single predictor was 214
the percentage of production space that is 20 years old or older. Establishments with less than 215

12
Figure 1. Classification Tree for the Salmonella Outcome Variable for Young 216
Chicken Slaughter Establishments 217
218 ND = not defined (cannot be calculated for 100% failure rates). 219
56% of their production space that is 20 years old or older were more likely to pass half the 220
Salmonella performance standard (odds ratio = 3.1).§ Of establishments with younger production 221
space on the left branch of the tree, establishments with a sanitation noncompliance rate below 222
5% were more likely to pass (odds ratio = 3.5). Of establishments along the far left branch of the 223
tree, age of the establishment production space again emerged as an important predictor. 224
Establishments with less than 28% of their production space that is 20 years old or older were 225
less likely to pass (odds ratio = 0.2), perhaps indicating an effect of less experienced 226
establishment management. Establishments that have a sanitation noncompliance rate above 5% 227
and do not use chemical sanitizers on hand tools all failed. 228
On the right branch of the tree, which includes establishments with more than 56% of 229
their production space 20 years old or older, establishments were less likely to pass if they are 230
owned by a company that owns three or fewer other establishments (odds ratio = 0.1). Of 231 § The breakpoint of 56% was determined by the CART procedure through a search algorithm that identifies the
value of the variable that splits the parent node into the most homogenous child nodes.

13
establishments owned by a company that owns three or fewer other establishments, 232
establishments were subsequently more likely to pass if their sanitation inspection 233
noncompliance rate was less than 11% (odds ratio = 5.3). On the far right branches of the tree, 234
establishments owned by a company with four or more establishments and with sales exceeding 235
$178 million (natural log of 19) all failed half the Salmonella performance standard. Thus, 236
although on average establishments owned by larger companies performed better, the largest 237
establishments owned by larger companies performed worse. 238
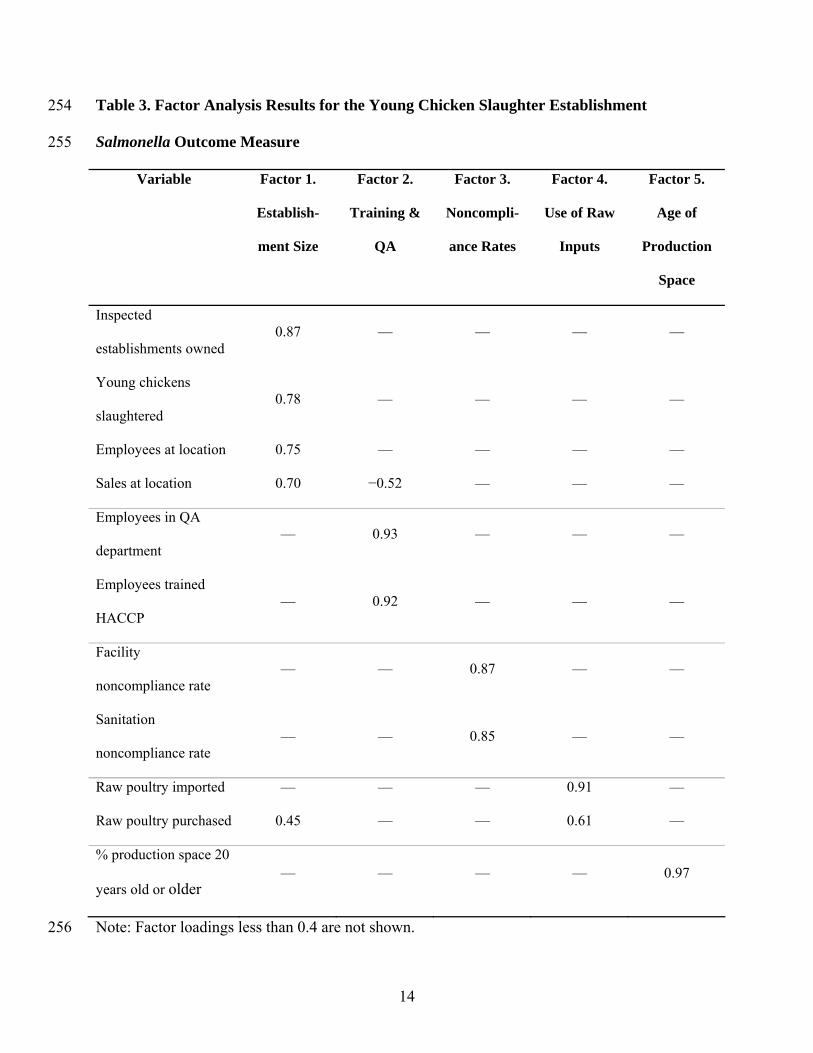
Table 3 provides the results of the factor analysis, including all continuous predictor 239
variables with a nonzero relative importance level as indicated by the CART analysis. The set of 240
underlying themes, which comprise subgroups of the predictor variables, emerged in the factor 241
analysis based on the factor loadings for each set of variables. These themes included measures 242
of establishment size (number of establishments owned by the company, slaughter volume, 243
number of employees, and dollar sales volume), employee training and quality assurance, 244
inspection noncompliance rates (facility and sanitation inspection procedures), percentage of 245
poultry processed using raw poultry received or purchased from another establishment (owned 246
by the same or a different company), and age of the production space in the establishment. These 247
five factors were then used as regressors in the logistic regression analysis. 248
Table 4 presents two sets of logistic regression results for young chicken slaughter 249
establishments. In the first set on the left, only the factors identified in the factor analysis were 250
included in the regression. In the second set on the right, the same set of factors was included 251
along with binary variables that had high relative importance levels in the CART analysis results. 252
253
14
Table 3. Factor Analysis Results for the Young Chicken Slaughter Establishment 254
Salmonella Outcome Measure 255
Variable Factor 1.
Establish-
ment Size
Factor 2.
Training &
QA
Factor 3.
Noncompli-
ance Rates
Factor 4.
Use of Raw
Inputs
Factor 5.
Age of
Production
Space
Inspected
establishments owned 0.87 — — — —
Young chickens
slaughtered 0.78 — — — —
Employees at location 0.75 — — — —
Sales at location 0.70 −0.52 — — —
Employees in QA
department — 0.93 — — —
Employees trained
HACCP — 0.92 — — —
Facility
noncompliance rate — — 0.87 — —
Sanitation
noncompliance rate — — 0.85 — —
Raw poultry imported — — — 0.91 —
Raw poultry purchased 0.45 — — 0.61 —
% production space 20
years old or older — — — — 0.97
Note: Factor loadings less than 0.4 are not shown. 256

15
Table 4. Results of Logistic Regression for the Young Chicken Slaughter Salmonella 257
Outcome Measure 258
Estimates with Factors Only Estimates with Factors and Key
Binary Variables
Variable Estimate
(Standard Error)
P Value Estimate
(Standard Error)
P Value
Intercept 1.0332
(0.1919)
<0.0001 1.4762
(0.7951)
0.0622
Factor 1: Establishment
size
−0.0911
(0.1821)
0.6168 −0.2515
(0.2270)
0.2680
Factor 2: Training & QA −0.0773
(0.1711)
0.6516 −0.1030
(0.1770)
0.5607
Factor 3: Noncompliance
rates
0.3288
(0.1994)
0.0993 0.2938
(0.2062)
0.1543
Factor 4: Use of raw
inputs
−0.3531
(0.2184)
0.1059 −0.3568
(0.2300)
0.1208
Factor 5: Age of
production space
0.3212
(0.1936)
0.0971 0.2906
(0.2049)
0.1560
Chemical sanitizers on
hand tools (binary)
0.6495
(0.4788)
0.1750
NELS inspection (binary) −0.7365
(0.4992)
0.1401
HIMP inspection (binary) 0.1635
(0.6333)
0.7963

16
Tracks products forward
(binary)
−1.2070
(0.6374)
0.0583
Likelihood ratio χ2 9.4744 0.0916 17.2814 0.0445
Note: NELS is the New Line Speed inspection system and HIMP is the HACCP-based Models Project inspection 259
system. 260
Based on the results of the logistic regression including only the factors, higher inspection 261
noncompliance rates increased the likelihood that an establishment failed half the Salmonella 262
performance standard (p = .10), a higher percentage of raw poultry inputs purchased from 263
outside sources decreased the likelihood (p = .10), and use of older production space increased 264
the likelihood (p = .10). The effects of establishment size and employee training were not 265
significant, and their estimated coefficients indicated a much smaller magnitude of effect 266
compared with the three significant factors. 267
When the binary variables were also included in the regression, the p-values for some of 268
the factors increased compared to the previous specification. Under this specification, only the 269
variable indicating whether the establishment tracks products forward was significant at the 10% 270
level. These results indicate that establishments that track their products forward are less likely to 271
fail half the Salmonella performance standard (p = .06). Whether the establishment operated 272
under HIMP did not have a statistically significant effect when controlling for other variables 273
affecting Salmonella performance (p = .80). The coefficient for whether the establishment uses 274
chemical sanitizers on hand tools had a large magnitude and indicated that use of chemical 275
sanitizers increased the likelihood of failure, but the effect was not significant (p = .18). In 276
addition, the coefficient for whether the establishment operates under New Line Speed (NELS) 277
inspection had a large magnitude and indicated that establishments under NELS inspection were 278

17
less likely to fail compared with establishments under other types of inspection, but the effect 279
was not significant (p = .14). 280
Pork Slaughter Establishments. Figure 2 shows the top nodes of the CART 281
classification tree for pork slaughter establishments. The strongest single predictor was whether 282
the establishment produces ready-to-eat (RTE) products in addition to conducting slaughter 283
activities. This initial result suggests that management philosophy of the establishment, as 284
reflected in the complexity of the products produced, could affect Salmonella control 285
performance. Establishments that do not produce RTE products were less likely to pass half the 286
Salmonella performance standard (odds ratio = 0.2). Of the establishments that do not produce 287
RTE products, establishments with a facility inspection noncompliance rate of less than 9% were 288
more likely to pass (odds ratio = 8.5). Of the establishments on the far left branch of the tree that 289
do not produce RTE products but have a low facility noncompliance rate, no establishments 290
failed if they also produce processed not ready-to-eat (NRTE) products.** For establishments that 291
do not produce RTE products and have a facility noncompliance rate of 9% or more, none of the 292
establishments that use bioluminescent testing on carcasses failed. This result may indicate these 293
establishments increased voluntary testing in response to inspection results in the past. On the 294
right branch of the tree, which indicates establishments that produce RTE products, there was 295
essentially no effect of the facility noncompliance rate on the likelihood of passing (odds ratio < 296
0.1). 297
** Note that some establishments produce only products for further processing and thus produce neither RTE or
NRTE products as defined in the survey.

18
Figure 2. Classification Tree for the Salmonella Outcome Variable for Pork Slaughter 298
Establishments 299
300 ND = not defined (cannot be calculated for 0% failure rates). 301
302
Table 5 provides the results of the factor analysis including all continuous predictor 303
variables with a nonzero relative importance level as indicated by the CART analysis. The set of 304
underlying themes, which comprise subgroups of the predictor variables, emerged in the factor 305
analysis based on the factor loadings for each set of variables. These themes included measures 306
of establishment size (number of employees, dollar sales volume, square footage, HACCP size 307
category, and number of QC/QA employees), inspection noncompliance rates (facility, HACCP, 308
and sanitation inspection procedures), frequency of microbiological testing before and after 309
fabrication of carcasses, and percentage of raw pork processed using raw pork inputs received or 310
purchased from another establishment (owned by the same or a different company). These four 311
factors were then used as regressors in the logistic regression analysis. 312
Table 6 presents two sets of logistic regression results for pork slaughter establishments. 313
In the first set on the left, only the factors identified in the factor analysis were included in the 314
regression. In the second set on the right, the same set of factors was included along with binary 315

19
Table 5. Results of Factors Analysis for the Pork Slaughter Salmonella Outcome Measure 316
Variable Factor 1.
Establishment
Size
Factor 2.
Noncompli-
ance Rates
Factor 3.
Microtesting
Frequency
Factor 4.
Use of Raw
Inputs
Employees at location 0.91 — — —
Sales at location 0.90 — — —
Square footage of production
space 0.89 — — —
HACCP size 0.88 — — —
Employees in QC/QA dept. 0.88 — — —
Facility noncompliance rate — 0.80 — —
HACCP noncompliance rate — 0.74 — —
Sanitation noncompliance rate 0.52 0.70 — —
Microbiological testing prior to
fabrication — — 0.85 —
Microbiological testing after
fabrication — — 0.84 —
Raw meat purchased — — — 0.84
Raw meat imported — — — 0.74
Note: Factor loadings less than 0.4 are not shown. 317
variables that had high relative importance levels in the CART analysis results. These additional 318
binary variables included whether the establishment dehairs carcasses, produces RTE product, 319
and produces NRTE processed product. 320
Based on the results of the logistic regression including only the factors, larger 321
establishments were less likely to fail half the Salmonella performance standard (p = .04), 322

20
Table 6. Results of Logistic Regression for the Pork Slaughter Salmonella Outcome 323
Measure 324
Estimates with Factors Only Estimates with Factors and Key
Binary Variables
Variable Estimate
(Standard Error)
P Value Estimate
(Standard Error)
P Value
Intercept −1.4531
(0.2665)
<0.0001 −4.3813
(0.9517)
<0.0001
Factor 1: Establishment
size
−0.6382
(0.3172)
0.0442 −0.8624
(0.3498)
0.0137
Factor 2: Noncompliance
rates
0.2404
(0.2377)
0.3120 0.1897
(0.2866)
0.5081
Factor 3: Microbiological
testing frequency
0.3960
(0.2248)
0.0781 0.3959
(0.2398)
0.0988
Factor 4: Use of raw inputs −0.6808
(0.2839)
0.0165 −0.1660
(0.3448)
0.6302
Does not dehair carcasses
(binary)
1.9431
(0.7152)
0.0066
Produces RTE product
(binary)
1.1745
(0.7299)
0.1076
Produces NRTE processed
product (binary)
1.3276
(0.6169)
0.0314
Likelihood ratio χ2 15.8711 0.0032 34.2226 <0.0001
325

21
establishments with a higher frequency of microbiological testing were more likely to fail (p = 326
.08), and establishments having a higher use of raw inputs were less likely to fail (p = .02). The 327
result for frequency of microbiological testing may indicate that establishments conduct more 328
testing if they have had problems with Salmonella control in the past. The effect of inspection 329
noncompliance rates was not significant (p = .31), and the magnitude of the coefficient was 330
smaller than for the significant factors. In terms of the relative magnitude of significant variables, 331
the frequency of use of raw pork inputs from outside sources and establishment size had similar 332
magnitudes, and the frequency of microbiological testing had a smaller but still relatively large 333
effect. 334
When the binary variables were also included in the regression, the p-values for some of 335
the factors increased compared to the previous specification. Under this specification, 336
establishment size (p = .01) and microbiological testing frequency (p = .10) were significant at 337
the 10% level in addition to all three of the included binary variables. The results for the binary 338
variables indicate that establishments that do not dehair carcasses were more likely to fail (p = 339
.01). In contrast to the CART analysis results, establishments that produce NRTE processed 340
products were more likely to fail (p = .03) as were establishments that produce RTE product (p = 341
.11). The results for whether the establishment produces RTE or NRTE processed product 342
indicate that controlling for other variables affecting establishment performance is important. 343
That is, when conducting multivariate analysis that accounts for the effects of establishment size, 344
frequency of microbiological testing, and frequency of use of raw inputs from outside the 345
establishment, the effect of whether the establishment produces further processed products 346
switched signs. 347

22
DISCUSSION 348
The results of the analyses presented above indicate that characteristics of meat and 349
poultry establishments and results of inspection procedures may be useful indicators of pathogen 350
control performance under a more risk-based inspection system. However, the variables that are 351
potential indicators are likely to vary across species in slaughter establishments. Among the large 352
number of potential predictors of pathogen control performance, only one set of variables—the 353
proportions of raw inputs purchased from outside sources—appeared to have a statistically 354
significant association with better Salmonella control in both young chicken slaughter and pork 355
slaughter establishments. Although the use of raw inputs is not directly associated with 356
Salmonella test results on raw carcasses, a higher use of raw inputs may be a reflection of the use 357
of more sophisticated production processes or management philosophy that results in better 358
pathogen control. For young chicken slaughter establishments, another significant variable 359
reflecting differences in management practices and philosophy was whether the establishment 360
tracks products forward in distribution. Young chicken slaughter establishments that track 361
products forward had better Salmonella control performance. For pork slaughter establishments, 362
whether the establishment produces RTE or processed NRTE product was associated with a 363
higher likelihood of failure, thus possibly reflecting differences in management philosophy 364
regarding pathogen control on carcasses. 365
Some of the variables that had a statistically significant effect on Salmonella control 366
performance are indirect or direct indicators of the types of production technologies used in the 367
establishment. For young chicken slaughter establishments, older production space, which likely 368
also indicates older production technologies, was associated with a higher likelihood of failure. 369
For pork slaughter establishments, larger establishments, which are likely to use more 370

23
sophisticated production technologies, were less likely to fail. Furthermore, pork slaughter 371
establishments that do not dehair carcasses were substantially more likely to fail. However, use 372
of voluntary microbiological testing in pork slaughter establishments was associated with a 373
higher likelihood of failure; this result may indicate that establishments implemented testing to 374
monitor performance in response to Salmonella test results in the past. 375
Finally, inspection results appear to be associated with Salmonella control performance in 376
young chicken slaughter establishments, but type of inspection system does not. Establishments 377
under HIMP inspection appeared to be no more or less likely to fail; the result for this variable is 378
similar to Cates et al. (7). However, young chicken slaughter establishments with a higher rate of 379
noncompliance with inspection procedures were more likely to fail. 380
The analyses presented in this paper are limited to some extent by the use of self-reported 381
survey data and the fact that food safety technologies and practices used by establishments might 382
have changed over the 3-year time period of the Salmonella test results data. In the future, more 383
objective information on the use of food safety technologies and practices (e.g., if observed by a 384
third party) might provide additional confidence in the results. Furthermore, although the pork 385
slaughter data set represents a large percentage of the total industry slaughter volume, many 386
establishments are not represented in the data set. Inclusion of a higher percentage of pork 387
slaughter establishments might provide additional insights not captured by the establishments 388
represented in the data. A larger data set for both poultry and pork slaughter establishments 389
would also likely increase the statistical significance level of important variables in the models. 390
Lastly, as establishments implement additional food safety technologies and practices and FSIS 391
further refines its testing procedures and databases, a similar analysis approach could be 392

24
implemented with new data sets to provide the most current information for risk-based 393
inspection initiatives. 394

25
ACKNOWLEDGEMENTS 395
This study was conducted under U.S. Department of Agriculture, Food Safety and 396
Inspection Service, Contract No. 53-3A94-03-12, Task Order 18. The authors gratefully 397
acknowledge comments and suggestions provided by FSIS staff. All remaining errors and views 398
expressed are those of the authors and not of the U.S. Department of Agriculture. 399

26
REFERENCES 400
1. Altekruse, S. F., N. Bauer, A. Chanlongbutra, R. DeSagun, A. Naugle, W. Schlosser, R. 401
Umholtz, and P. White. 2006. Salmonella enteritidis in broiler chickens, United States, 402
2000-2005. Emerg. Infect. Dis. 12(12):1848–1852. 403
2. Bacon, R. T., K. E. Belk, J. N. Sofos, R. P. Clayton, J. O. Reagan, and G. C. Smith. 2000. 404
Microbial populations on animal hides and beef carcasses at different stages of slaughter 405
in plants employing multiple-sequential interventions for decontamination. J. Food Prot. 406
63(8):1080–1086. 407
3. Barboza de Martinez, Y., K. Ferrer, and E. Marquez Salas. 2002. Combined effects of 408
lactic acid and nisin solution in reducing levels of microbiological contamination in red 409
meat carcasses. J. Food Prot. 65(11):1780–1783. 410
4. Berends, B. R., F. Van Knapen, J. M. A. Snijders, and D. A. A. Mossel. 1997. 411
Identification and quantification of risk factors regarding Salmonella spp. on pork 412
carcasses. Int. J. Food Microbiol. 36:199–206. 413
5. Cates, S. C., C. L. Viator, S. A. Karns, and M. K. Muth. Forthcoming. Food safety 414
practices of meat slaughter plants: findings from a national survey. Food Prot. Trends. 415
6. Cates, S. C., C. L. Viator, S. A. Karns, and M. K. Muth. Forthcoming. Food safety 416
practices of poultry slaughter: findings from a national survey. Food Prot. Trends. 417
7. Cates, S. C., D. W. Anderson, S. A. Karns, and P. A. Brown. 2001. Traditional versus 418
hazard analysis and critical control point-based inspection: results from a poultry 419
slaughter project. J. Food Prot. 64(6):826–832. 420

27
8. Duffy, E. A., K. E. Belk, J. N. Sofos, S. B. LeValley, M. L. Kain, J. D. Tatum, G. C. 421
Smith, and C. V. Kimberling. 2001. Microbial contamination occurring on lamb 422
carcasses processed in the U.S. J. Food Prot. 64(4):503–508. 423
9. Federal Register. Pathogen Reduction: Hazard Analysis and Critical Control Point 424
(HACCP) Systems; Final Rule. 61(144) (1996):38806–38815. 425
10. Gill, C. O., and C. Landers. 2003. Microbiological effects of carcass decontaminating 426
treatments at four beef packing plants. Meat Science. 65:1005–1011. 427
11. Kemp, G. K., M. L. Aldrich, M. L. Guerra, and K. R. Schneider. 2001. Continuous online 428
processing of fecal- and ingesta-contaminated poultry carcasses using an acidified 429
sodium chlorite antimicrobial intervention. J. Food Prot. 64(6):807–812. 430
12. Rivera-Betancourt, M. et al. 2004. Prevalence of Escherichia coli O157:H7, Listeria 431
monocytogenes, and Salmonella in two geographically distant commercial beef 432
processing plants in the United States. J. Food Prot. 67(2):295–302. 433
13. RTI International. 2005. Enhanced facilities database. Prepared for the U.S. Department 434
of Agriculture, Food Safety and Inspection Service. RTI International, Research Triangle 435
Park, NC. 436
14. Salford Systems, Inc. CART®. Available at: http://www.salfordsystems.com/cart.php. 437
San Diego, CA. 438
15. Sanchez, M. X., W. M. Fluckey, M. M. Brashears, and S. R. McKee. 2002. Microbial 439
profile and antibiotic susceptibility of Campylobacter spp and Salmonella spp in broilers 440
processed in air-chilled and immersion chilled environments. J. Food Prot. 65(6):948–441
956. 442
28
16. U.S. Department of Agriculture, Food Safety and Inspection Service. 2006. [Docket No. 443
04-026N] Salmonella verification sample result reporting: agency policy and use in 444
public health protection: notice and response to comments. Federal Register. 445
71(38):9772–9777. 446
17. U.S. Department of Agriculture, Food Safety and Inspection Service. 1997. Issue paper: 447
strategy for Salmonella testing. Available at: http://www.fsis.usda.gov/OA/haccp/ 448
issue02.htm. 449
18. U.S. Department of Agriculture, Food Safety and Inspection Service. 1998. Enforcement 450
instructions for the Salmonella performance standard. FSIS Directive 10,011.1. Available 451
at: http://www.fsis.usda.gov/OPPDE/rdad/FSISDirectives/10011-1.pdf. 452
19. U.S. Department of Agriculture, Food Safety and Inspection Service. 2006. FSIS 453
scheduling criteria for Salmonella sets in raw classes of product. Available at: 454
http://www.fsis.usda.gov/PDF/scheduling_criteria_salmonella_sets.pdf. 455
20. Whyte, P., J. D. Collins, K. McGill, C. Monahan, and H. O’Mahony. 2001. Quantitative 456
investigation of the effects of chemical decontamination procedures on the 457
microbiological status of broiler carcasses during processing. J. Food Prot. 64(2):179–458
183. 459
460
461
462

A-1
Appendix A: Meat Slaughter— Data Dictionary
This appendix provides the complete list of available variables for meat slaughter establishments (plants), including the variable name, label, format, and explanations for coding. The variables include Salmonella test results for pork carcasses, beef carcasses, and ground beef produced in slaughter establishments; industry survey results; establishment characteristics from the EFD; and noncompliance report data from PBIS. The analysis data sets for pork slaughter and beef slaughter establishments were derived from this list of variables.
Analysis o
f Food S
afety Perform
ance in
Meat an
d Po
ultry E
stablish
men
ts
A-2
Table A-1. Food Safety Performance Analysis: Meat Slaughter—Data Dictionary
Variable Label Format Format
Description Notes
Salmonella Data
HogOutcome Market hogs—Pass/Fail indicator (1/2 perf standard).
Dummy 1,0 0=Pass, 1=Fail
CattleOutcome Steers & Heifers, Cows & Bulls—Pass/Fail indicator (1/2 perf standard).
Dummy 1,0 0=Pass, 1=Fail
GrdBeefOutcome Ground Beef—Pass/Fail indicator (1/2 perf standard).
Dummy 1,0 0=Pass, 1=Fail
Survey Questions
Q1_1_1 Plant does not dehair carcasses Dummy 1,0 Missing coded as 0
Q1_1_2 Plant uses scald and rinse to dehair carcasses
Dummy 1,0 Missing coded as 0
Q1_2_2 Plant uses skinning knife to dehide carcasses
Dummy 1,0 Missing coded as 0
Q1_2_3 Plant uses air knife to dehide carcasses
Dummy 1,0 Missing coded as 0
Q1_2_4 Plant uses mechanical side puller to dehide carcasses
Dummy 1,0 Missing coded as 0
Q1_2_5 Plant uses mechanical down puller to dehide carcasses
Dummy 1,0 Missing coded as 0
Q1_2_6 Plant uses mechanical up puller to dehide carcasses
Dummy 1,0 Missing coded as 0
q1_3 Independent, third-party auditors conduct audits of slaughter operations
Dummy 1,0 Missing coded as 0
Q1_4 Percentage of live animals slaughtered at plant during the past year were imported
Ordinal 1–5 1) None 2) 1% to 9% 3) 10% to 24% 4) 25% to 49% 5) 50% or more *Missing coded as 1
(continued)

Appen
dix A
— M
eat Slau
ghter—
Data D
ictionary
A-3
Table A-1. Food Safety Performance Analysis: Meat Slaughter—Data Dictionary (continued)
Variable Label Format Format
Description Notes
Q1_5n Total amount of raw product, not ground, primal cuts produced during the past year
Continuous 0–1,980,000,000
Q1_6r Routine frequency for sanitizing hands or gloves that contact raw product in the slaughter area of the plant
Ordinal 1–5 1) No specific routine frequency 2) One or more times per shift, but less
than once per hour 3) Once per hour 4) More than once per hour 5) Always before handling the next unit
of product *Missing coded as 1
Q1_7r Routine frequency for sanitizing hands or gloves that contact raw product in the fabrication area of the plant
Ordinal 1–5 1) No specific routine frequency 2) One or more times per shift, but less
than once per hour 3) Once per hour 4) More than once per hour 5) Always before handling the next unit
of product *Missing coded as 1
Q1_8a1 Technologies slaughter—Company-owned lab for microbiological testing
Dummy 1,0 Missing coded as 0
Q1_8b1 Technologies slaughter—Bioluminescent testing system
Dummy 1,0 Missing coded as 0
Q1_8c1 Technologies slaughter—Conveyor belts made from materials designed to prevent bacterial growth
Dummy 1,0 Missing coded as 0
Q1_8d1 Technologies slaughter—Steam pasteurization systems
Dummy 1,0 Missing coded as 0
Q1_8e1 Technologies slaughter—Steam vacuum units
Dummy 1,0 Missing coded as 0
Q1_8f1 Technologies slaughter—Organic acid rinse
Dummy 1,0 Missing coded as 0
(continued)

Analysis o
f Food S
afety Perform
ance in
Meat an
d Po
ultry E
stablish
men
ts
A-4
Table A-1. Food Safety Performance Analysis: Meat Slaughter—Data Dictionary (continued)
Variable Label Format Format
Description Notes
Q1_8g1 Technologies slaughter—Positive air pressure from clean side to dirty side
Dummy 1,0 Missing coded as 0
Q1_8i1 Technologies slaughter—Tempered carcass rinse/wash
Dummy 1,0 Missing coded as 0
Q1_9a1 Requires and documents that its animal growers use stipulated production practices to control pathogens
Dummy 1,0 Missing coded as 0
Q1_9c1 Rotates sanitizing chemicals it uses in the slaughter area on an annual basis or more frequently
Dummy 1,0 Missing coded as 0
Q1_9d1 Uses chemical sanitizers for food contact hand tools used in the slaughter area during operations
Dummy 1,0 Missing coded as 0
Q1_9e1 Uses sterilizer pots for heat sterilization of hand tools used in the slaughter area during operations
Dummy 1,0 Missing coded as 0
Q1_9j1 Identifies and tracks its products, by production lot, backward to specific animal growers
Dummy 1,0 Missing coded as 0
Section 2 of Survey: 67 plants do not further process. Did not answer Section 2.
Q2_2_1 Plant produces ready-to-eat (RTE) products
Dummy 1,0 Missing coded as 0
Q2_2_2 Plant produces not-ready-to-eat (NRTE) products
Dummy 1,0 Missing coded as 0
Q2_2_3 Plant produces products that are inputs to further processing
Dummy 1,0 Missing coded as 0
Q2_6 Percentage of raw meat processed during the past year that was received or purchased from another plant
Ordinal 1–5 1) None 2) 1% to 9% 3) 10% to 24% 4) 25% to 49% 5) 50% or more *Missing coded as 1
(continued)

Appen
dix A
— M
eat Slau
ghter—
Data D
ictionary
A-5
Table A-1. Food Safety Performance Analysis: Meat Slaughter—Data Dictionary (continued)
Variable Label Format Format
Description Notes
Q2_7 Percentage of raw meat processed during the past year that was imported as raw meat
Ordinal 1–5 1) None 2) 1% to 9% 3) 10% to 24% 4) 25% to 49% 5) 50% or more *Missing coded as 1
Q2_12An Estimate total pounds during the past year. [Raw, ground meat (03B)]
Continuous 0–257,745,000
Q2_12Bn Estimate total pounds during the past year. [Thermally processed, commercially sterile (03D)]
Continuous 0–40,291,574
Q2_12Cn Estimate total pounds during the past year. [Not heat treated, shelf stable (03E)]
Continuous 0–2,848,254
Q2_12Dn Estimate total pounds during the past year. [Heat treated, shelf stable (03F)]
Continuous 0–11,459,424
Q2_12En Estimate total pounds during the past year. [Fully cooked, not shelf stable (03G)]
Continuous 0–166,000,000
Q2_12Fn Estimate total pounds during the past year. [Heat treated, but not fully cooked, not shelf stable (03H)]
Continuous 0–84,000,000
Q2_12Gn Estimate total pounds during the past year. [Secondary inhibitors, not shelf stable (03I)]
Continuous 0–500,000
Section 3 of Survey: 40 plants do not conduct additional micro testing. Did not answer Section 3.
Q3_4G Organisms by frequency of microbial testing on carcasses prior to fabrication [Salmonella species]
Ordinal 1–9 41 plants that do not test coded as 1
Q3_6G Organisms by frequency of microbial testing on raw meat after fabrication [Salmonella species]
Ordinal 1–9 67 plants that do not test coded as 1
(continued)

Analysis o
f Food S
afety Perform
ance in
Meat an
d Po
ultry E
stablish
men
ts
A-6
Table A-1. Food Safety Performance Analysis: Meat Slaughter—Data Dictionary (continued)
Variable Label Format Format
Description Notes
Q4_1 Plant provides formal food safety course for newly hired production employees
Dummy 1,0 Missing coded as 0
Q4_3 Approximate number of production employees currently working have completed formal HACCP training
Ordinal 1–5 1) None 2) 1 to 3 employees 3) 4 to 9 employees 4) 10 to 20 employees 5) More than 20 employees *Missing coded as 1
Q5_1 Calendar year the plant was built or renovated
Continuous 1906–2004 Used grant date from EFD for 17 plants
Q5_2 Approximate total square footage of the production space for plant
Continuous 200–1,053,175 Used production area from EFD for 23 plants
q5_3_1r Approximate percentage of the square footage of the production space of this plant that is [Under 5 years old]
Continuous 0–100 Missing coded as 0
q5_3_2r Approximate percentage of the square footage of the production space of this plant that is [5 years to just under 20 years old]
Continuous 0–100 Missing coded as 0
q5_3_3r Approximate percentage of the square footage of the production space of this plant that is [20 years old or more]
Continuous 0–100 Missing coded as 0
Q5_4 How many slaughter and fabrication shifts does this plant operate daily?
Ordinal 1–4 1) This plant does not operate on a daily basis
2) One 3) Two 4) Three
(continued)

Appen
dix A
— M
eat Slau
ghter—
Data D
ictionary
A-7
Table A-1. Food Safety Performance Analysis: Meat Slaughter—Data Dictionary (continued)
Variable Label Format Format
Description Notes
Q5_5 How many further processing shifts does this plant operate daily?
Ordinal 1–5 1) None 2) Further processing shift does not
operate on a daily basis 3) One 4) Two 5) Three
Q5_6 How many clean up shifts does this plant operate daily?
Ordinal 1–5 1) None 2) Clean up shift does not operate on a
daily basis 3) One 4) Two 5) Three
Q5_8 Plant has a person on staff whose primary responsibility is to manage food safety activities at the plant
Dummy 1,0 Missing coded as 0
Q5_9 Percentage of food safety manager’s time devoted to managing food safety activities
Ordinal 1–5 77 skipped out of question (No FS manager)
1) 1% to 24% 2) 25% to 49% 3) 50% to 74% 4) 75% to 99% 5) 100% *86 Missing coded as 0
Q5_10 Plant has a quality control/quality assurance department
Dummy 1,0 Missing coded as 0
Q5_11 Approximately how many employees at this plant work in the plants quality control/quality assurance department?
Continuous 0–100 106 skipped out of question (No QA dept) *Missing coded as 0
(continued)

Analysis o
f Food S
afety Perform
ance in
Meat an
d Po
ultry E
stablish
men
ts
A-8
Table A-1. Food Safety Performance Analysis: Meat Slaughter—Data Dictionary (continued)
Variable Label Format Format
Description Notes
Q5_12 Number of USDA- or state-inspected plants owned by the company that owns this plant
Ordinal 1–4 1) 1 2) 2 to 5 3) 6 to 20 4) 21 or more *Missing coded as 1
EFD Data
Plant Unique Plant ID DO NOT USE IN ANALYSIS
Text
Inspection Activities
CustomSlaughter Activity—Custom slaughter Dummy 1,0
Retail Activity—Retail Dummy 1,0
OnLine Activity—On line slaughter Dummy 1,0
Business Information
POPCODE Midpoint of population within the establishment city
Continuous 12,500–500,000
MULTIPLANT Indicates company ownership Dummy 1,0
EMPACTUAL Actual employment at location Continuous 1–4500 Used Q5_7 for 10 missing
ESTSALES Actual sales of location Continuous 291,000–5,796,000,000
Used midpoint of ranges of Q5_13 for 14 missing
HACCP & Inspection Information
District District number Number 5–90
Circuit Circuit number Number 15–9024 2-digit circuits indicate T/A
TALAIKEN Indicates a Talmadge-Aiken plant Dummy 1,0
Meat Slaughter Volumes
St_Hf Number of steers and heifers slaughtered
Continuous 0–1,725,607
Cw_Bl Number of cows, bulls and stags slaughtered
Continuous 0–356,054
Veal Number of veal calves and heavy calves slaughtered
Continuous 0–88,446
(continued)
Appen
dix A
— M
eat Slau
ghter—
Data D
ictionary
A-9
Table A-1. Food Safety Performance Analysis: Meat Slaughter—Data Dictionary (continued)
Variable Label Format Format
Description Notes
Shp_Gts Number of mature sheep, lambs, goats slaughtered
Continuous 0–135,833
Mkt_Hg Number of barrows and gilts slaughtered
Continuous 0–7,640,614
Old_Hg Number of sows, boars and stags slaughtered
Continuous 0–411,334
Oth_Mt Number of equines and other animals slaughtered
Continuous 0–11,358
Inspection Systems
FDADual FDA Dual Jurisdiction Dummy 1,0
HIMP HACCP-Based Inspection Models Project
Dummy 1,0
NELS New Line Speed Inspection System Dummy 1,0
Plant Information
HACCPSIZE HACCP Size Ordinal 1–3 1:very small 2:small 3:large
PBIS Inspection Procedures (including 01 and 02, scheduled and unscheduled)
Sanitation Inspection procedures—failure rate of sanitation procedures
Continuous 0–0.23 01B01, 01B02, 01C01, and 01C02 procedures
Facility Inspection procedures—failure rate of facility procedures
Continuous 0–0.62 06D01 procedure
HACCP Inspection procedures—failure rate of HACCP procedures
Continuous 0–0.73 03B01, 03B02, 03C01, 03C02, 03J01, and 03J02 procedures
Ecoli Inspection procedures—failure rate of E. coli procedures
Continuous 0–0.50 05A01 and 05A02 procedures

B-1
Appendix B: Young Chicken Slaughter— Data Dictionary
This appendix provides the complete list of available variables for young chicken slaughter establishments (plants), including the variable name, label, format, and explanations for coding. The variables include Salmonella test results for young chicken carcasses, industry survey results, establishment characteristics from the EFD, and noncompliance report data from PBIS. The analysis data set for young chicken carcasses was derived from this list of variables.

Analysis o
f Food S
afety Perform
ance in
Meat an
d Po
ultry E
stablish
men
ts
B-2
Table B-1. Food Safety Performance Analysis: Young Chicken Slaughter—Data Dictionary
Variable Label Format Format
Description Notes
Salmonella Data
BroilerOutcome Broiler-pass/fail indicator. half of perf std = 12/51
Dummy 1,0 0=Pass, 1=Fail
Survey Questions
q1_1 Independent, third-party auditors conduct audits of slaughter operations
Dummy 1,0 Missing coded as 0
Q1_2r Routine frequency for sanitizing hands or gloves that contact raw poultry in the slaughter area of the plant
Ordinal 1–5 1) No specific routine frequency 2) One or more times per shift, but less
than once per hour 3) Once per hour 4) More than once per hour 5) Always before handling the next unit
of product *Missing coded as 1
Q1_3r Routine frequency for sanitizing hands or gloves that contact raw poultry in the deboning area of the plant
Ordinal 1–5 1) No specific routine frequency 2) One or more times per shift, but less
than once per hour 3) Once per hour 4) More than once per hour 5) Always before handling the next unit
of product *Missing coded as 1
Q1_4 Percentage of live birds slaughtered at plant during the past year were imported
Ordinal 1–5 1) None 2) 1% to 9% 3) 10% to 24% 4) 25% to 49% 5) 50% or more *Missing coded as 1
Q1_5n Total amount of raw product, not ground, primal cuts produced during the past year
Continuous 0–3,000,000,000
(continued)

Appen
dix B
— Y
oung C
hicken
Slau
ghter—
Data D
ictionary
B-3
Table B-1. Food Safety Performance Analysis: Young Chicken Slaughter—Data Dictionary (continued)
Variable Label Format Format
Description Notes
Q1_6a1 Technologies slaughter-company-owned lab for microbiological testing
Dummy 1,0 Missing coded as 0
Q1_6b1 Technologies slaughter-bioluminescent testing system
Dummy 1,0 Missing coded as 0
Q1_6c1 Technologies slaughter-conveyor belts made from materials designed to prevent bacterial growth
Dummy 1,0 Missing coded as 0
Q1_6d1 Technologies slaughter-inside-outside bird washers
Dummy 1,0 Missing coded as 0
Q1_6e1 Technologies slaughter-organic acid rinse
Dummy 1,0 Missing coded as 0
Q1_6g1 Technologies slaughter-automatic bird transfer (from kill line to evisceration line)
Dummy 1,0 Missing coded as 0
Q1_7a1 Requires and documents that its animal growers use stipulated production practices to control pathogens
Dummy 1,0 Missing coded as 0
Q1_7c1 Rotates sanitizing chemicals it uses in the slaughter area on an annual basis or more frequently
Dummy 1,0 Missing coded as 0
Q1_7d1 Uses chemical sanitizers for food contact hand tools used in the slaughter area during operations
Dummy 1,0 Missing coded as 0
Q1_7e1 Uses sterilizer pots for heat sterilization of hand tools used in the slaughter area during operations
Dummy 1,0 Missing coded as 0
Q1_7j1 Identifies and tracks its products, by production lot, backward to specific animal growers
Dummy 1,0 Missing coded as 0
(continued)

Analysis o
f Food S
afety Perform
ance in
Meat an
d Po
ultry E
stablish
men
ts
B-4
Table B-1. Food Safety Performance Analysis: Young Chicken Slaughter—Data Dictionary (continued)
Variable Label Format Format
Description Notes
Q1_7k1 Identifies and tracks its products, by production lot, forward to specific buyers (not consumers) of its products
Dummy 1,0 Missing coded as 0
Q1_7l1 Conducts fat pad sampling on a regular schedule
Dummy 1,0 Missing coded as 0
Section 2 of Survey: 58 plants do not further process. Did not answer Section 2.
Q2_2_1 Plant produces ready-to-eat (RTE) products
Dummy 1,0 Missing coded as 0
Q2_2_2 Plant produces not-ready-to-eat (NRTE) products
Dummy 1,0 Missing coded as 0
Q2_2_3 Plant produces products that are inputs to further processing
Dummy 1,0 Missing coded as 0
Q2_6 Percentage of raw poultry processed during the past year that was received or purchased from another plant
Ordinal 1–5 1) None 2) 1% to 9% 3) 10% to 24% 4) 25% to 49% 5) 50% or more *Missing coded as 1
Q2_7 Percentage of raw poultry processed during the past year that was imported as raw poultry
Ordinal 1–5 1) None 2) 1% to 9% 3) 10% to 24% 4) 25% to 49% 5) 50% or more *Missing coded as 1
Q2_11An Estimate total pounds during the past year. [Raw, ground meat (03B)]
Continuous 0–288,000,000
Q2_11Bn Estimate total pounds during the past year. [Thermally processed, commercially sterile (03D)]
Continuous 0
(continued)

Appen
dix B
— Y
oung C
hicken
Slau
ghter—
Data D
ictionary
B-5
Table B-1. Food Safety Performance Analysis: Young Chicken Slaughter—Data Dictionary (continued)
Variable Label Format Format
Description Notes
Q2_11Cn Estimate total pounds during the past year. [Not heat treated, shelf stable (03E)]
Continuous 0–23,400,000 2 plants with volumes
Q2_11Dn Estimate total pounds during the past year. [Heat treated, shelf stable (03F)]
Continuous 0–80,000,000 3 plants with volumes
Q2_11En Estimate total pounds during the past year. [Fully cooked, not shelf stable (03G)]
Continuous 0–238,000,000
Q2_11Fn Estimate total pounds during the past year. [Heat treated, but not fully cooked, not shelf stable (03H)]
Continuous 0–145,000,000
Q2_11Gn Estimate total pounds during the past year. [Secondary inhibitors, not shelf stable (03I)]
Continuous 0–93,436,000 3 plants with volumes
Section 3 of Survey: 8 plants do not conduct additional micro testing. Did not answer Section 3.
Q3_3D Organisms by frequency of microbial testing on carcasses prior to fabrication [Salmonella species]
Ordinal 1–9 1) Never 2) Less than once per month 3) Once per month 4) More than once per month 5) Once per week 6) More than once per week 7) Once per day 8) Once per shift 9) More than once per shift *Plants that do not test coded as 1
(continued)
Analysis o
f Food S
afety Perform
ance in
Meat an
d Po
ultry E
stablish
men
ts
B-6
Table B-1. Food Safety Performance Analysis: Young Chicken Slaughter—Data Dictionary (continued)
Variable Label Format Format
Description Notes
Q3_5D Organisms by frequency of microbial testing on raw meat after fabrication [Salmonella species]
Ordinal 1–9 1) Never 2) Less than once per month 3) Once per month 4) More than once per month 5) Once per week 6) More than once per week 7) Once per day 8) Once per shift 9) More than once per shift *Plants that do not test coded as 1
Q4_1 Plant provides formal food safety course for newly hired production employees
Dummy 1,0 Missing coded as 0
Q4_3 Approximate number of production employees currently working have completed formal HACCP training
Ordinal 1–5 1) None 2) 1 to 3 employees 3) 4 to 9 employees 4) 10 to 20 employees 5) More than 20 employees *Missing coded as 1
Q5_1 Calendar year the plant was built or renovated
Continuous 1947–2004 Used grant date from EFD for 1 plants
Q5_2 Approximate total square footage of the production space for plant
Continuous 700–600,000 Used production area from EFD for 7 plants
q5_3_1r Approximate percentage of the square footage of the production space of this plant that is [Under 5 years old]
Continuous 0–100 Missing coded as 0
q5_3_2r Approximate percentage of the square footage of the production space of this plant that is [5 years to just under 20 years old]
Continuous 0–100 Missing coded as 0
(continued)
Appen
dix B
— Y
oung C
hicken
Slau
ghter—
Data D
ictionary
B-7
Table B-1. Food Safety Performance Analysis: Young Chicken Slaughter—Data Dictionary (continued)
Variable Label Format Format
Description Notes
q5_3_3r Approximate percentage of the square footage of the production space of this plant that is [20 years old or more]
Continuous 0–100 Missing coded as 0
Q5_4 How many slaughter and fabrication shifts does this plant operate daily?
Ordinal 1–4 1) This plant does not operate on a daily basis
2) One 3) Two 4) Three Missing coded as 1
Q5_5 How many deboning shifts does this plant operate daily?
Ordinal 1–5 1) None 2) Deboning shift is not operated on a
daily basis 3) One 4) Two 5) Three Missing coded as 1
Q5_6 How many further processing shifts does this plant operate daily?
Ordinal 1–5 1) None 2) Further processing shift does not
operate on a daily basis 3) One 4) Two 5) Three
Q5_7 How many clean up shifts does this plant operate daily?
Ordinal 1–5 1) None 2) Clean up shift does not operate on a
daily basis 3) One 4) Two 5) Three Missing coded as 1
Q5_9 Plant has a person on staff whose primary responsibility is to manage food safety activities at the plant
Dummy 1,0 Missing coded as 0
(continued)

Analysis o
f Food S
afety Perform
ance in
Meat an
d Po
ultry E
stablish
men
ts
B-8
Table B-1. Food Safety Performance Analysis: Young Chicken Slaughter—Data Dictionary (continued)
Variable Label Format Format
Description Notes
Q5_10 Percentage of food safety manager’s time devoted to managing food safety activities
Ordinal 1–5 33 skipped out of question (No FS manager)
1) 1% to 24% 2) 25% to 49% 3) 50% to 74% 4) 75% to 99% 5) 100% *34 Missing coded as 0
Q5_11 Plant has a quality control/quality assurance department
Dummy 1,0 Missing coded as 0
Q5_12 Approximately how many employees at this plant work in the plants quality control/quality assurance department?
Continuous 0–113 2 skipped out of question (No QA dept) *Missing coded as 0
Q5_13 Number of USDA- or state-inspected plants owned by the company that owns this plant
Ordinal 1–4 1) 1 2) 2 to 5 3) 6 to 20 4) 21 or more *Missing coded as 1
EFD Data
Plant Unique plant ID DO NOT USE IN ANALYSIS
Text
Business Information
POPCODE Midpoint of population within the establishment city
Continuous 12,500–175,000
MULTIPLANT Indicates company ownership Dummy 1,0
EMPACTUAL Actual employment at location Continuous 6–3000 Used Q5_7 for 17 missing
ESTSALES Actual sales of location Continuous 1,116,000–1,518,000,000
Used midpoint of ranges of Q5_13 for 21 missing
(continued)

Appen
dix B
— Y
oung C
hicken
Slau
ghter—
Data D
ictionary
B-9
Table B-1. Food Safety Performance Analysis: Young Chicken Slaughter—Data Dictionary (continued)
Variable Label Format Format
Description Notes
HACCP & Inspection Information
District District number Number 5–90
Circuit Circuit number Number 15–9024
Young Chicken Slaughter Volumes
Yng_Chick Number of young chickens slaughtered
Continuous 0–135,225,459
Oth_Chick Number of capons, light and heavy fowl slaughtered
Continuous 0–14,203,280
Yng_Turk Number of young turkeys slaughtered
Continuous 0–15,926,998
Oth_Turk Number of roaster, breeder, old breeder turkeys slaughtered
Continuous 0–649,516
Oth_Pltry Number of ducks, geese, rabbits, slaughtered
Continuous 0–2,857,272
Inspection Systems
FDADual FDA Dual Jurisdiction Dummy 1,0
HIMP HACCP-Based Inspection Models Project
Dummy 1,0
NELS New Line Speed Inspection System Dummy 1,0
Plant Information
HACCPSIZE HACCP Size Ordinal 1–3 1:very small 2:small 3:large
PBIS Inspection Procedures (including 01 and 02, scheduled and unscheduled)
Sanitation Inspection procedures—failure rate of sanitation procedures
Continuous 0–0.29 01B01, 01B02, 01C01, and 01C02 procedures
Facility Inspection procedures—failure rate of facility procedures
Continuous 0–0.63 06D01 procedure
HACCP Inspection procedures—failure rate of HACCP procedures
Continuous 0–0.14 03B01, 03B02, 03C01, 03C02, 03J01, and 03J02 procedures
Ecoli Inspection procedures—failure rate of E. coli procedures
Continuous 0–0.15 05A01 and 05A02 procedures

C-1
Appendix C: Classification Tree for Beef Carcasses and Ground Beef Produced in Cattle Slaughter Establishments
This appendix provides the results of the classification tree analysis for beef carcasses and ground beef produced in cattle slaughter establishments. Because few establishments fail the Salmonella performance standards for beef carcasses and ground beef, only the initial analyses were conducted for establishments that produce these products. However, the results of this initial analysis provide useful insights into the characteristics of establishments likely to fail.
C.1 RESULTS FOR ESTABLISHMENTS THAT PRODUCE BEEF CARCASSES The classification tree for cattle slaughter establishments based on their Salmonella performance on beef carcasses is provided in Figure C-1. A total of 14 establishments, out of 133 that completed the survey and were subject to Salmonella testing, failed half the Salmonella performance standard during the 2003 through 2005 time period. The results of the classification tree analysis indicate the following:

Analysis o
f Food S
afety Perform
ance in
Meat an
d Po
ultry E
stablish
men
ts
C-2
Figure C-1. Classification of Cattle Slaughter Establishments with Respect to the Beef Carcass Outcome Measure
QCW_BL_L <= 5.153
Class Cases %0 51 100.01 0 0.0
N = 51
QCW_BL_L <= 5.212
Class Cases %0 0 0.01 1 100.0
N = 1
QCW_BL_L > 5.212
Class Cases %0 20 100.01 0 0.0
N = 20
ESTSALES_L <= 15.439
Class Cases %0 20 95.21 1 4.8
N = 21
HACCP <= 0.003
Class Cases %0 7 100.01 0 0.0
N = 7
COTH_MT = (1)
Class Cases %0 2 100.01 0 0.0
N = 2
CQ1_9D1 = (0)
Class Cases %0 6 75.01 2 25.0
N = 8
SANITATION <= 0.007
Class Cases %0 1 100.01 0 0.0
N = 1
FACILITY <= 0.057
Class Cases %0 1 100.01 0 0.0
N = 1
HACCP_TRAINED <= 0.021
Class Cases %0 1 100.01 0 0.0
N = 1
HACCP_TRAINED > 0.021
Class Cases %0 1 8.31 11 91.7
N = 12
FACILITY > 0.057
Class Cases %0 2 15.41 11 84.6
N = 13
SANITATION > 0.007
Class Cases %0 3 21.41 11 78.6
N = 14
CQ1_9D1 = (1)
Class Cases %0 4 26.71 11 73.3
N = 15
COTH_MT = (0)
Class Cases %0 10 43.51 13 56.5
N = 23
HACCP > 0.003
Class Cases %0 12 48.01 13 52.0
N = 25
ESTSALES_L > 15.439
Class Cases %0 19 59.41 13 40.6
N = 32
ESTSALES_L <= 17.825
Class Cases %0 39 73.61 14 26.4
N = 53
ESTSALES_L > 17.825
Class Cases %0 29 100.01 0 0.0
N = 29
QCW_BL_L > 5.153
Class Cases %0 68 82.91 14 17.1
N = 82
Class Cases %0 119 89.51 14 10.5
N = 133

Appendix C — Classification Tree for Beef Carcasses and Ground Beef Produced in Cattle Slaughter Establishments
C-3
The cattle slaughter establishments that failed are those with the number of cows, bulls, and stages slaughtered exceeding 712 (QCW_BL-l = 5.15 in log scale) and with an estimated sales volume less than $54,843,816 (ESTSALES_L = 17.82 in log scale).
Virtually all of the establishments (13 out of 14) are further classified as those whose estimated sales volume is greater than $5,075,827 (ESTSALES = 15.44 in log scale), have a HACCP noncompliance report rate greater than 0.3% (HACCP > 0.003), and do not slaughter equines and other meat species (COTH_MT = 0).
The great majority of the above 13 establishments (11 establishments) are further classified as those that use chemical sanitizers for food hand tools (CQ1_9D1 = 1), have a sanitation noncompliance report rate exceeding 0.7% (SANITATION > 0.007), have a facility noncompliance report rate exceeding 5.7% (FACILITY > 0.057), and have more than 2% of their production employees completed formal HACCP training (HACCP_TRAINED > 0.021).
The classification depicts the most homogeneous classification of establishments based on an evolving set of establishment characteristics defined by the predictor variables that emerge as the strongest at each node of the classification tree.
Considering the cumulative classification power of each predictor variable, however, a measure of relative importance for each variable can be calculated that reflects the given predictor’s overall classification power. Table C-1 indicates the cumulative power of the most important variables in descending order of importance for beef carcasses.
Table C-1. Relative Importance of the Predictor Variables for Beef Carcasses
Variable Description Relative Importance
QCW_BL_L Log of number of cows, bulls, and stags slaughtered annually
22.0%
ESTSALES_L Log of midpoint of establishment sales category 21.7%
Q4_3 Number of production employees who have completed formal HACCP training
14.5%
EMPACTUAL Number of employees at the establishment 13.6%
ST_HF_L Log of number of steers and heifers slaughtered annually
12.5%
Q1_2_4 Establishment uses mechanical side puller to dehide carcasses
7.7%
Q5_12 Number of USDA- or state-inspected establishments owned by the company that owns the establishment
5.0%
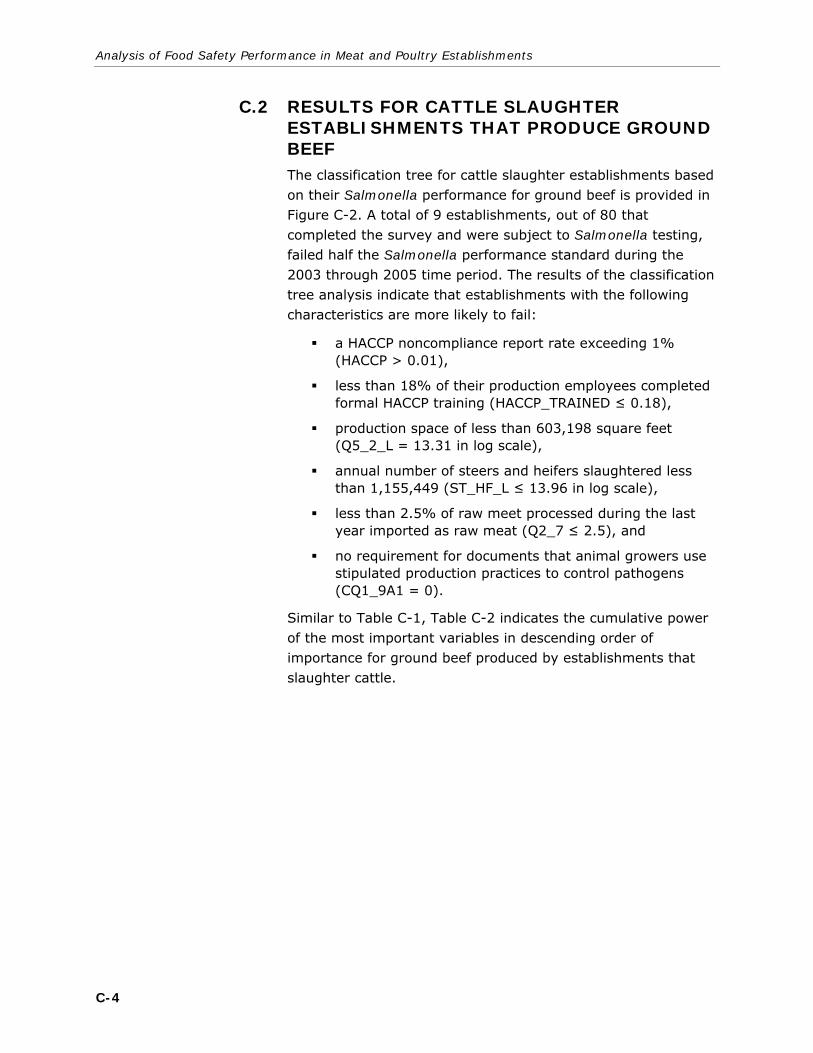
Analysis of Food Safety Performance in Meat and Poultry Establishments
C-4
C.2 RESULTS FOR CATTLE SLAUGHTER ESTABLISHMENTS THAT PRODUCE GROUND BEEF The classification tree for cattle slaughter establishments based on their Salmonella performance for ground beef is provided in Figure C-2. A total of 9 establishments, out of 80 that completed the survey and were subject to Salmonella testing, failed half the Salmonella performance standard during the 2003 through 2005 time period. The results of the classification tree analysis indicate that establishments with the following characteristics are more likely to fail:
a HACCP noncompliance report rate exceeding 1% (HACCP > 0.01),
less than 18% of their production employees completed formal HACCP training (HACCP_TRAINED ≤ 0.18),
production space of less than 603,198 square feet (Q5_2_L = 13.31 in log scale),
annual number of steers and heifers slaughtered less than 1,155,449 (ST_HF_L ≤ 13.96 in log scale),
less than 2.5% of raw meet processed during the last year imported as raw meat (Q2_7 ≤ 2.5), and
no requirement for documents that animal growers use stipulated production practices to control pathogens (CQ1_9A1 = 0).
Similar to Table C-1, Table C-2 indicates the cumulative power of the most important variables in descending order of importance for ground beef produced by establishments that slaughter cattle.

Appendix C — Classification Tree for Beef Carcasses and Ground Beef Produced in Cattle Slaughter Establishments
C-5
Figure C-2. Classification of Cattle Slaughter Establishments with Respect to the Ground Beef Outcome Measure
HACCP <= 0.01
Class = 0Class Cases %
0 38 100.01 0 0.0
N = 38
HACCP_TRAINED <= 0.00
Class = 0Class Cases %
0 5 100.01 0 0.0
N = 5
CQ1_9A1 = (0)
Class = 1Class Cases %
0 2 18.21 9 81.8
N = 11
CQ1_9A1 = (1)
Class = 0Class Cases %
0 1 100.01 0 0.0
N = 1
Q2_7 <= 2.50
Class Cases %0 3 25.01 9 75.0
N = 12
Q2_7 > 2.50
Class = 0Class Cases %
0 1 100.01 0 0.0
N = 1
ST_HF_L <= 13.96
Class Cases %0 4 30.81 9 69.2
N = 13
ST_HF_L > 13.96
Class = 0Class Cases %
0 2 100.01 0 0.0
N = 2
Q5_2_L <= 13.31
Class Cases %0 6 40.01 9 60.0
N = 15
Q5_2_L > 13.31
Class = 0Class Cases %
0 2 100.01 0 0.0
N = 2
CECOLI = (0)
Class Cases %0 8 47.11 9 52.9
N = 17
CECOLI = (1)
Class = 0Class Cases %
0 3 100.01 0 0.0
N = 3
HACCP_TRAINED > 0.00
Class Cases %0 11 55.01 9 45.0
N = 20
CQ1_1_1 = (1)
Class Cases %0 16 64.01 9 36.0
N = 25
CQ1_1_1 = (0)
Class = 0Class Cases %
0 7 100.01 0 0.0
N = 7
HACCP_TRAINED <= 0.18
Class Cases %0 23 71.91 9 28.1
N = 32
HACCP_TRAINED > 0.18
Class = 0Class Cases %
0 10 100.01 0 0.0
N = 10
HACCP > 0.01
Class Cases %0 33 78.61 9 21.4
N = 42
Class Cases %0 71 88.81 9 11.3
N = 80

Analysis of Food Safety Performance in Meat and Poultry Establishments
C-6
Table C-2. Relative Importance of the Predictor Variables for Beef Carcasses
Variable Description Relative Importance
HACCP Percentage of HACCP procedures that resulted in noncompliance reports
29.3%
Q4_3 Number of production employees who have completed formal HACCP training
19.7%
Q1_7R Frequency of sanitizing hands or gloves that contact raw product in the fabrication area of the establishment
18.8%
EMPACTUAL Number of employees at the establishment 15.5%
Q1_8F1 Use of organic acid rinse during slaughter 10.2%
SANITATION Percentage of sanitation procedures that resulted in noncompliance reports
6.5%

D-1
Appendix D: Presentation on Results of the Analysis
This appendix includes the presentation of the results for broiler slaughter and pork slaughter establishments (plants) that RTI presented at FSIS in Washington, DC, on March 12, 2007. The analysis was later revised and finalized for this report.

Analysis of Food Safety Performance in Meat and Poultry Establishments
D-2

Appendix D — Presentation on Results of the Analysis
D-3

Analysis of Food Safety Performance in Meat and Poultry Establishments
D-4

Appendix D — Presentation on Results of the Analysis
D-5

Analysis of Food Safety Performance in Meat and Poultry Establishments
D-6

Appendix D — Presentation on Results of the Analysis
D-7

Analysis of Food Safety Performance in Meat and Poultry Establishments
D-8

Appendix D — Presentation on Results of the Analysis
D-9

Analysis of Food Safety Performance in Meat and Poultry Establishments
D-10

Appendix D — Presentation on Results of the Analysis
D-11

Analysis of Food Safety Performance in Meat and Poultry Establishments
D-12
Related Documents