Analysis of Financial Statements Chapter 4 Ratio Analysis DuPont System Effects of Improving Ratios Limitations of Ratio Analysis Qualitative Factors 4-1

Analysis of Financial Statements Chapter 4 Ratio Analysis DuPont System Effects of Improving Ratios Limitations of Ratio Analysis Qualitative.
Dec 15, 2015
Welcome message from author
This document is posted to help you gain knowledge. Please leave a comment to let me know what you think about it! Share it to your friends and learn new things together.
Transcript
Analysis of Financial Statements
Chapter 4
Ratio Analysis DuPont System Effects of Improving Ratios Limitations of Ratio Analysis Qualitative Factors
4-1
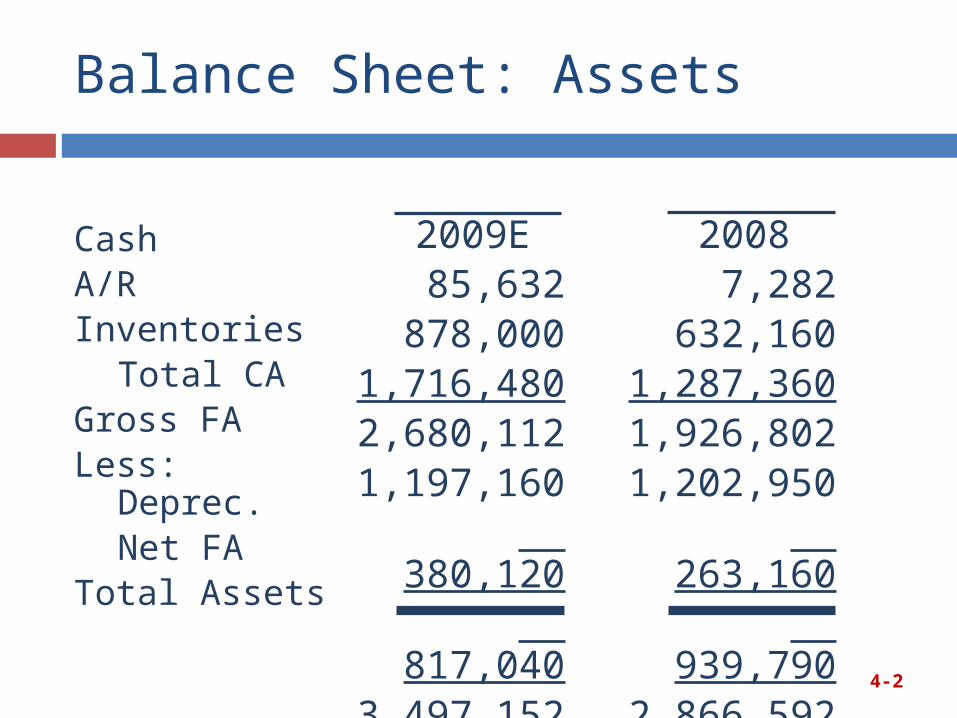
20087,282
632,1601,287,3601,926,8021,202,950 263,160 939,7902,866,592
2009E85,632
878,0001,716,4802,680,1121,197,160 380,120 817,0403,497,152
Balance Sheet: Assets
CashA/RInventories
Total CAGross FALess: Deprec.
Net FATotal Assets
4-2

Balance Sheet: Liabilities and Equity
Accts payableNotes payableAccruals
Total CLLong-term debtCommon stockRetained earnings
Total EquityTotal L & E
4-3
2008524,160
636,808 489,6001,650,568
723,432460,000
32,592 492,5922,866,592
2009E436,800
300,000 408,0001,144,800
400,0001,721,176 231,1761,952,3523,497,152

Income Statement
SalesCOGSOther expenses
EBITDADeprec. & amort.
EBITInterest exp.EBTTaxesNet income
20086,034,0005,528,000
519,988 (13,988) 116,960 (130,948) 136,012 (266,960) (106,784) (160,176)
2009E7,035,600
5,875,99
2 550,000
609,608 116,960
492,648 70,008
422,640 169,056 253,584
4-4
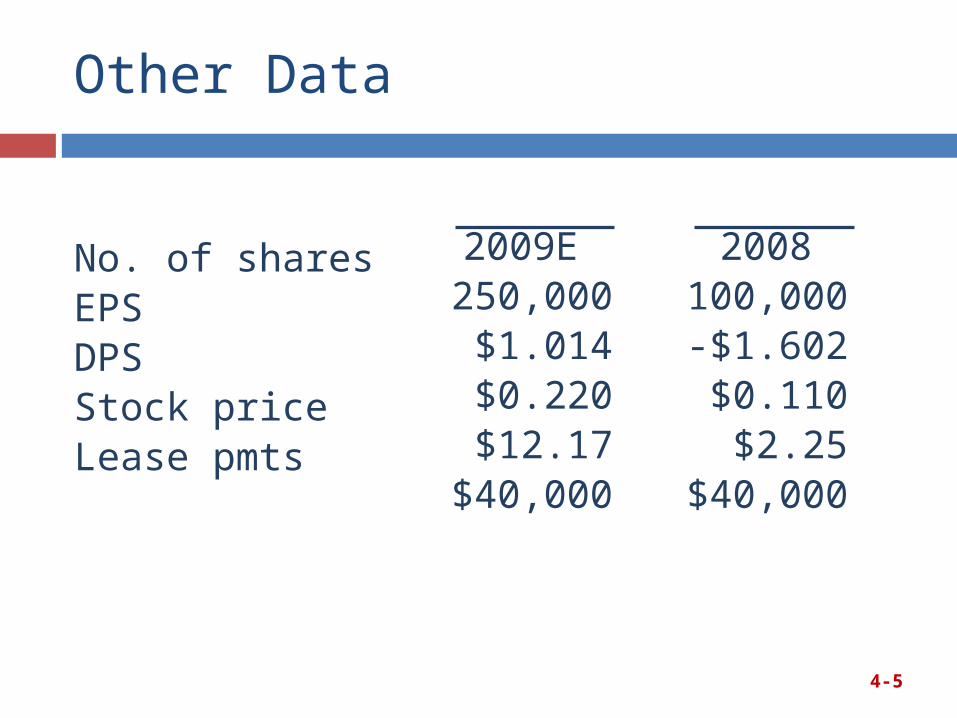
Other Data
No. of sharesEPSDPSStock priceLease pmts
2009E250,000
$1.014$0.220$12.17
$40,000
2008100,000-$1.602$0.110
$2.25$40,000
4-5
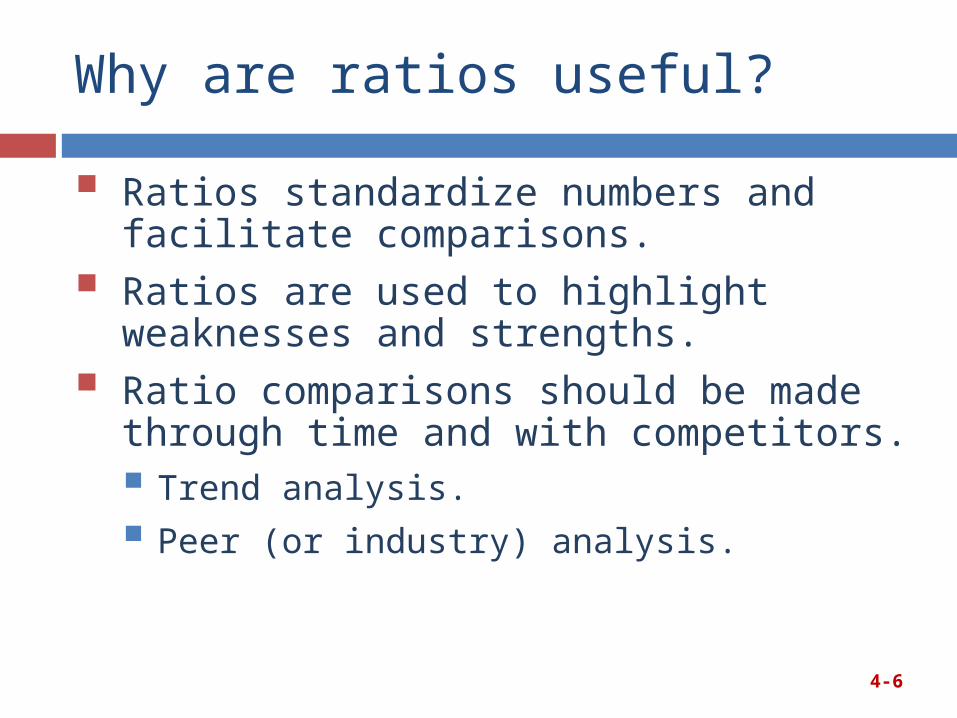
Why are ratios useful?
Ratios standardize numbers and facilitate comparisons.
Ratios are used to highlight weaknesses and strengths.
Ratio comparisons should be made through time and with competitors. Trend analysis.
Peer (or industry) analysis.
4-6

Five Major Categories of Ratios and the Questions They Answer
Liquidity: Can we make required payments?
Asset management: right amount of assets vs. sales?
Debt management: Right mix of debt and equity?
Profitability: Do sales prices exceed unit costs, and are sales high enough as reflected in PM, ROE, and ROA?
Market value: Do investors like what they see as reflected in P/E and M/B ratios?
4-7
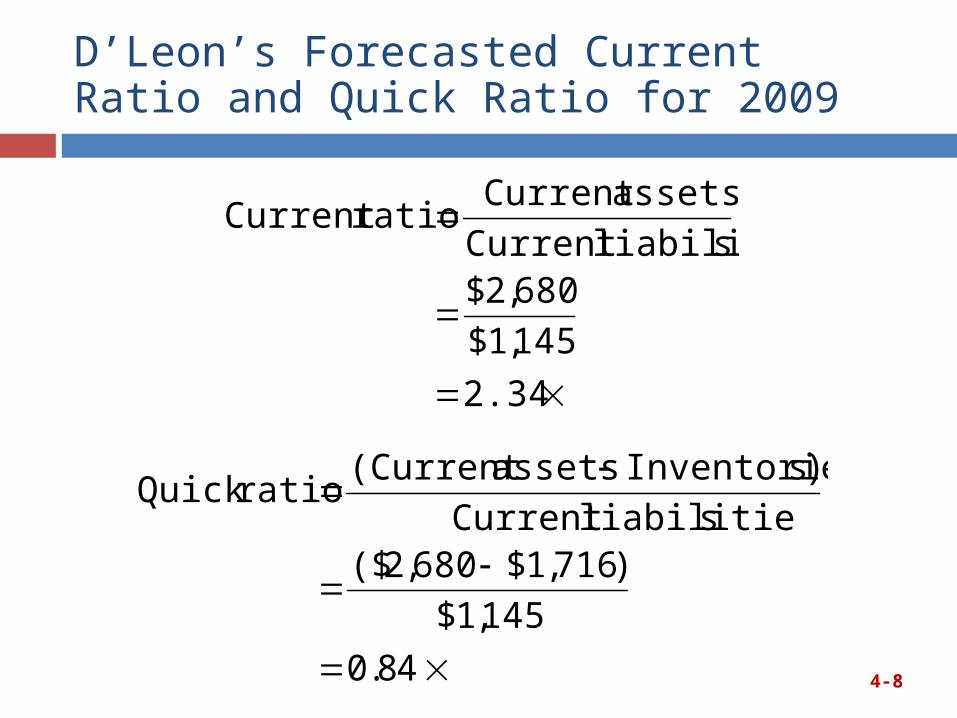
D’Leon’s Forecasted Current Ratio and Quick Ratio for 2009
4-8
2.34
145,1$680,2$
sliabilitieCurrent assetsCurrent
ratioCurrent
48.0
145,1$)716,1$680,2($
sliabilitieCurrent )sInventorieassets(Current
ratio Quick
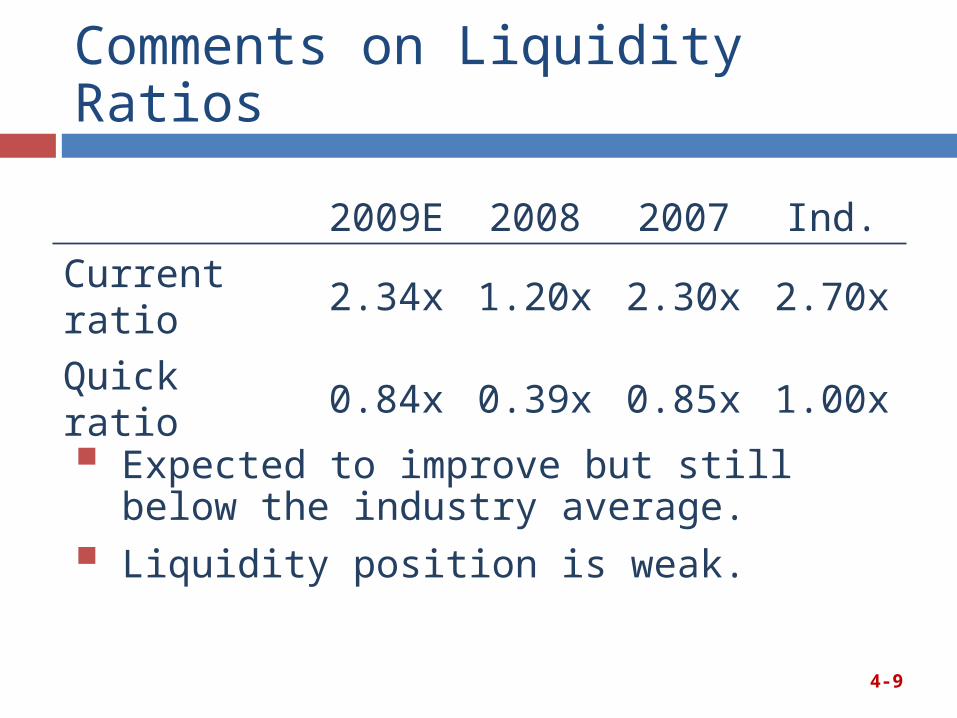
Comments on Liquidity Ratios
2009E 2008 2007 Ind.
Current ratio
2.34x 1.20x 2.30x 2.70x
Quick ratio 0.84x 0.39x 0.85x 1.00x
4-9
Expected to improve but still below the industry average.
Liquidity position is weak.

D’Leon’s Inventory Turnover vs. the Industry Average
2009E
2008 2007 Ind.
Inventory turnover
4.1x 4.70x 4.8x 6.1x
Inv. turnover = Sales/Inventories= $7,036/$1,716= 4.10x
4-10
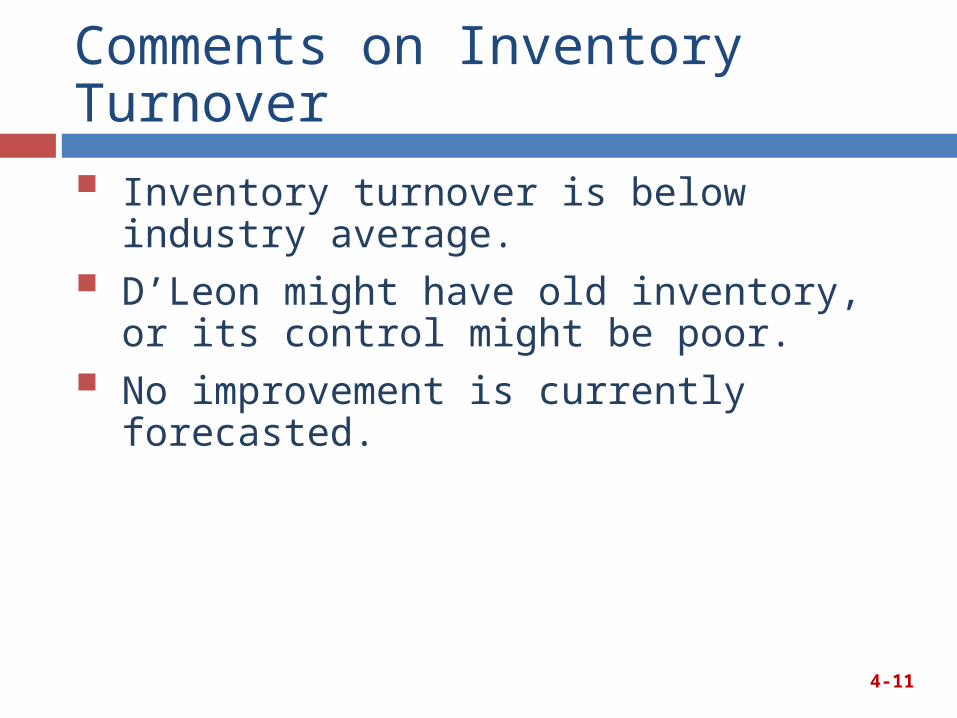
Comments on Inventory Turnover
Inventory turnover is below industry average.
D’Leon might have old inventory, or its control might be poor.
No improvement is currently forecasted.
4-11
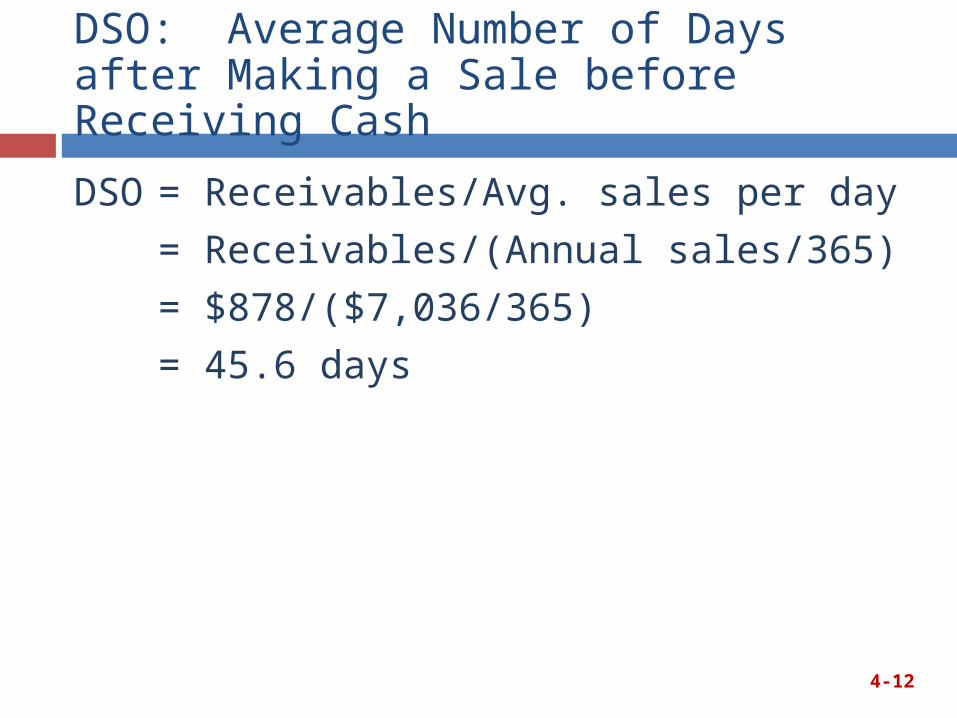
DSO: Average Number of Days after Making a Sale before Receiving Cash
DSO = Receivables/Avg. sales per day
= Receivables/(Annual sales/365)
= $878/($7,036/365)
= 45.6 days
4-12
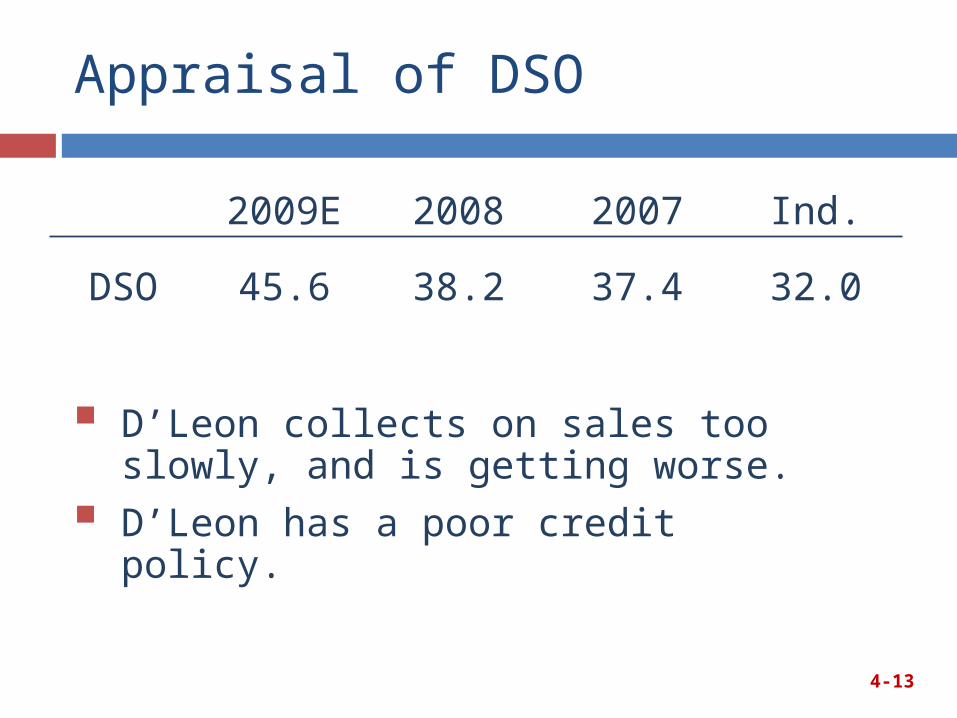
Appraisal of DSO
2009E 2008 2007 Ind.
DSO 45.6 38.2 37.4 32.0
D’Leon collects on sales too slowly, and is getting worse.
D’Leon has a poor credit policy.
4-13
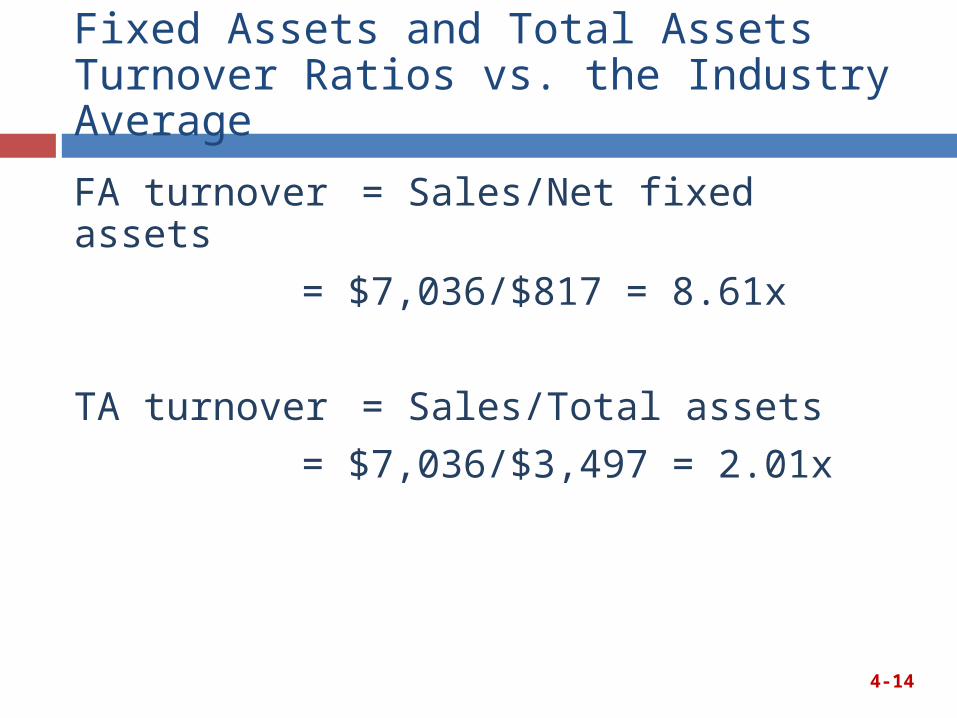
Fixed Assets and Total Assets Turnover Ratios vs. the Industry Average
FA turnover= Sales/Net fixed assets
= $7,036/$817 = 8.61x
TA turnover= Sales/Total assets
= $7,036/$3,497 = 2.01x
4-14

Evaluating the FA Turnover and TA Turnover Ratios
2009E 2008 2007 Ind.
FA TO 8.6x 6.4x 10.0x 7.0x
TA TO 2.0x 2.1x 2.3x 2.6x
FA turnover projected to exceed the industry average.
TA turnover below the industry average. Caused by excessive currents assets (A/R and Inv).
4-15
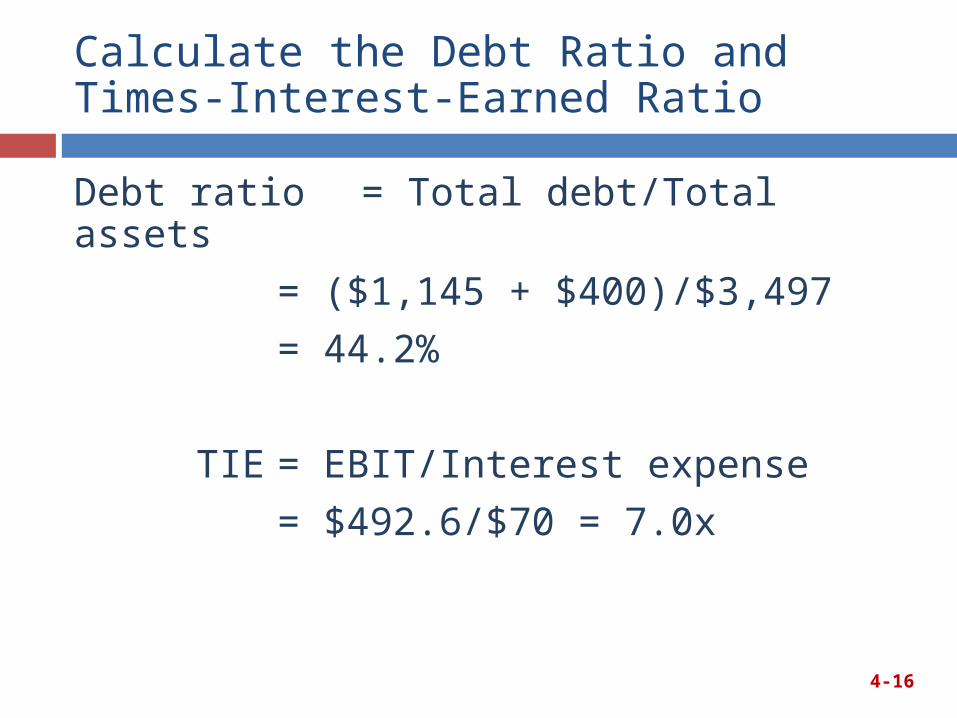
Calculate the Debt Ratio and Times-Interest-Earned Ratio
Debt ratio = Total debt/Total assets
= ($1,145 + $400)/$3,497
= 44.2%
TIE = EBIT/Interest expense
= $492.6/$70 = 7.0x
4-16
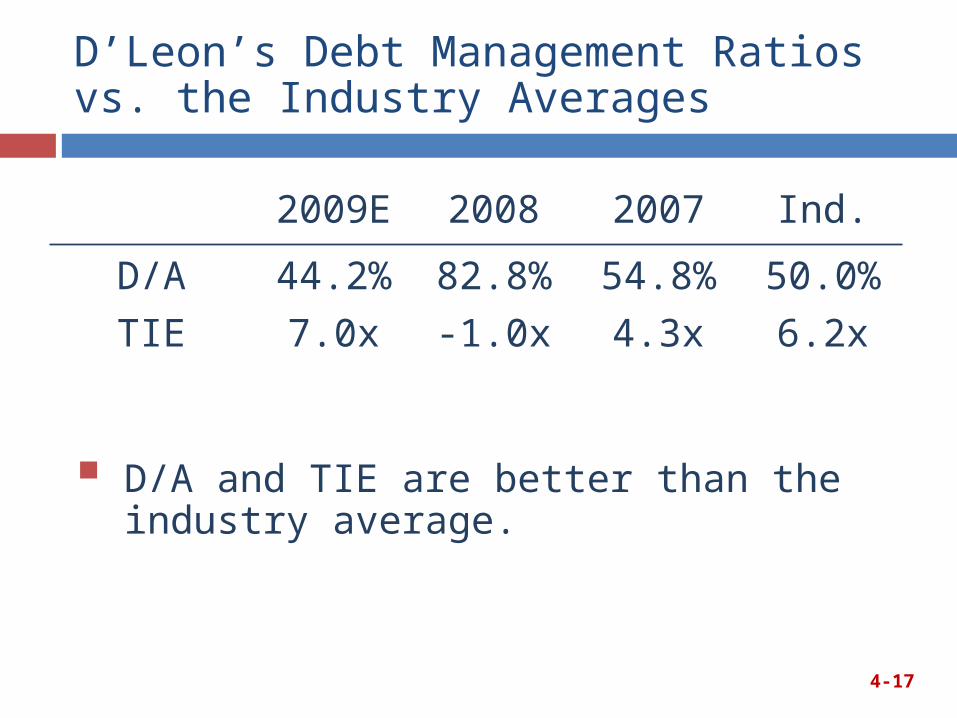
D’Leon’s Debt Management Ratios vs. the Industry Averages
2009E 2008 2007 Ind.
D/A 44.2% 82.8% 54.8% 50.0%
TIE 7.0x -1.0x 4.3x 6.2x
D/A and TIE are better than the industry average.
4-17

Profitability Ratios: Operating Margin, Profit Margin, and Basic Earning Power
4-18
Operating margin = EBIT/Sales = $492.6/$7,036 = 7.0% Profit margin = Net income/Sales = $253.6/$7,036 = 3.6%
Basic earning power = EBIT/Total assets = $492.6/$3,497 = 14.1%
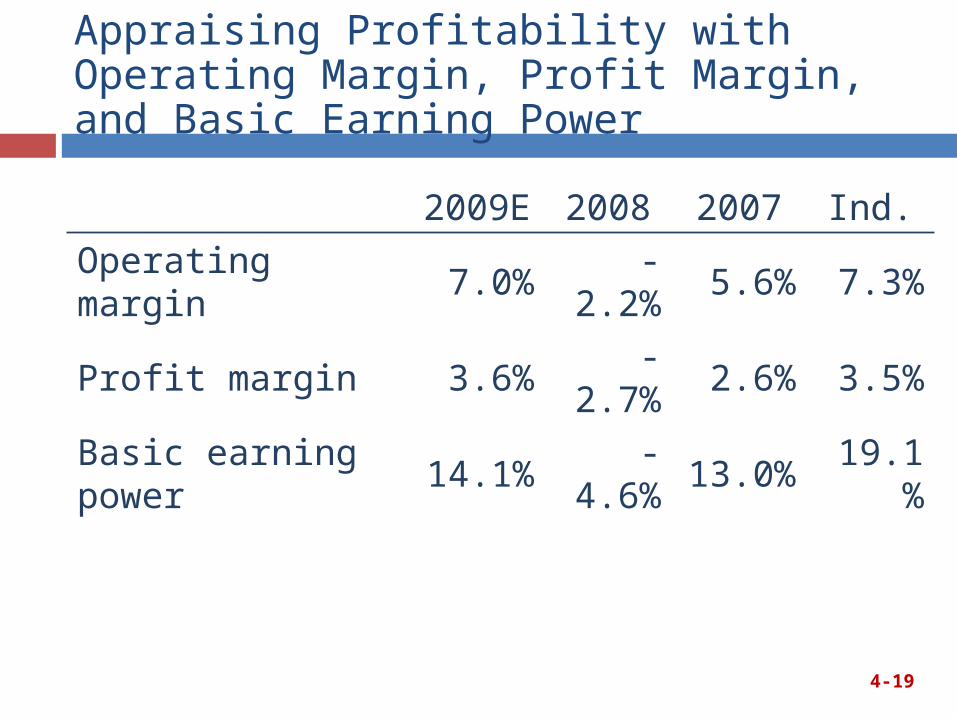
Appraising Profitability with Operating Margin, Profit Margin, and Basic Earning Power
2009E
2008 2007 Ind.
Operating margin 7.0% -2.2% 5.6% 7.3%
Profit margin 3.6% -2.7% 2.6% 3.5%
Basic earning power
14.1%
-4.6%13.0
%19.1
%
4-19
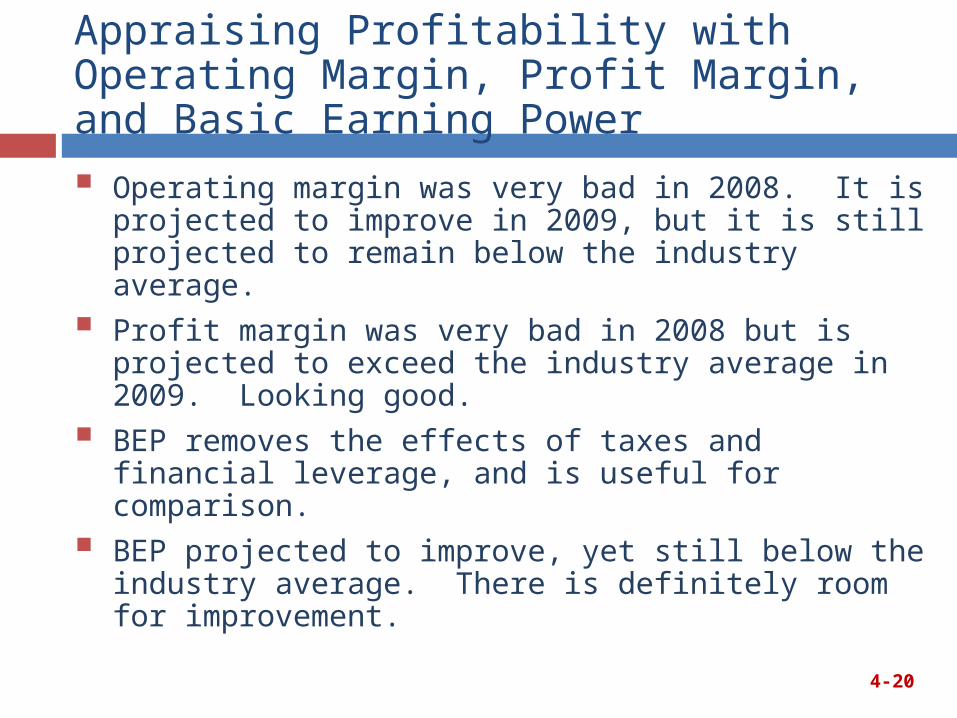
Operating margin was very bad in 2008. It is projected to improve in 2009, but it is still projected to remain below the industry average.
Profit margin was very bad in 2008 but is projected to exceed the industry average in 2009. Looking good.
BEP removes the effects of taxes and financial leverage, and is useful for comparison.
BEP projected to improve, yet still below the industry average. There is definitely room for improvement.
4-20
Appraising Profitability with Operating Margin, Profit Margin, and Basic Earning Power
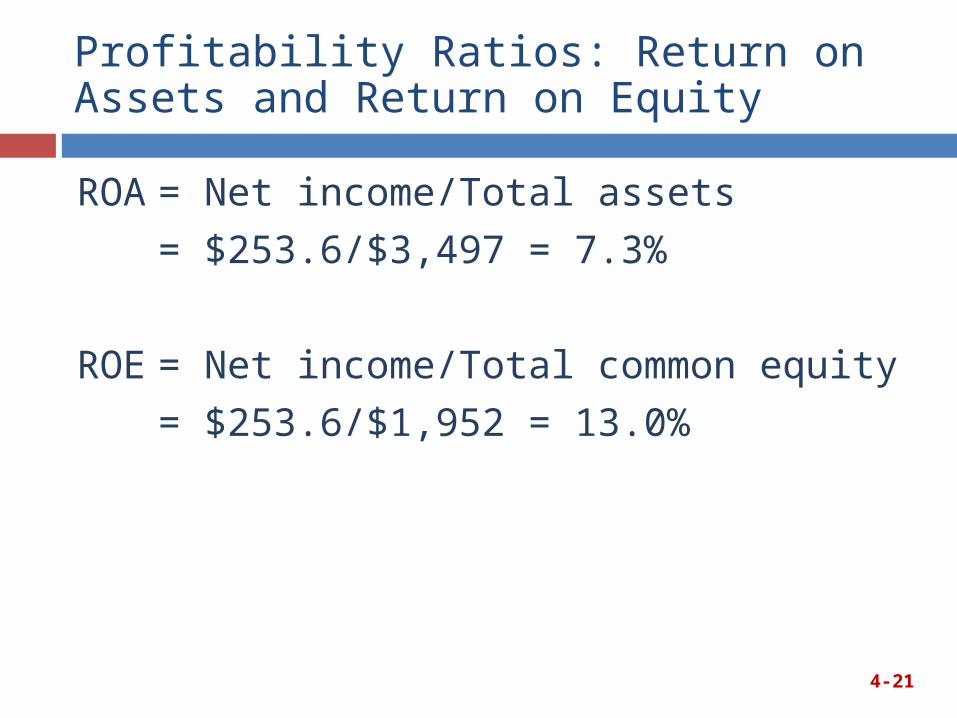
Profitability Ratios: Return on Assets and Return on Equity
ROA= Net income/Total assets
= $253.6/$3,497 = 7.3%
ROE= Net income/Total common equity
= $253.6/$1,952 = 13.0%
4-21

Appraising Profitability with ROA and ROE
2009E 2008 2007 Ind.
ROA 7.3% -5.6% 6.0% 9.1%
ROE 13.0% -32.5% 13.3% 18.2%
4-22
Both ratios rebounded from the previous year, but are still below the industry average. More improvement is needed.
Wide variations in ROE illustrate the effect that leverage can have on profitability.
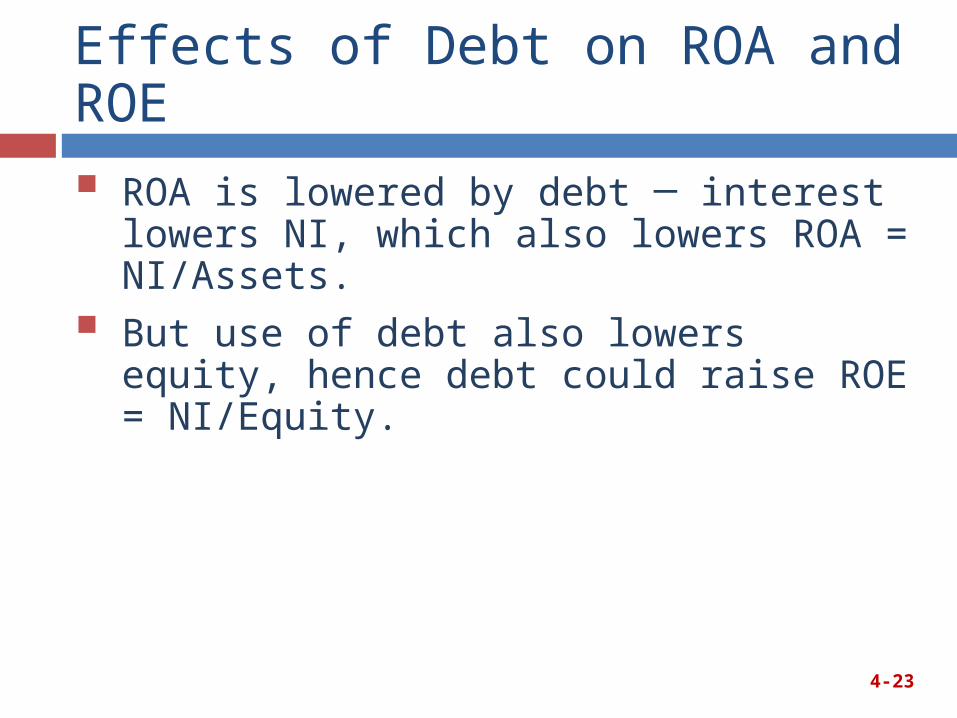
Effects of Debt on ROA and ROE
ROA is lowered by debt ─ interest lowers NI, which also lowers ROA = NI/Assets.
But use of debt also lowers equity, hence debt could raise ROE = NI/Equity.
4-23
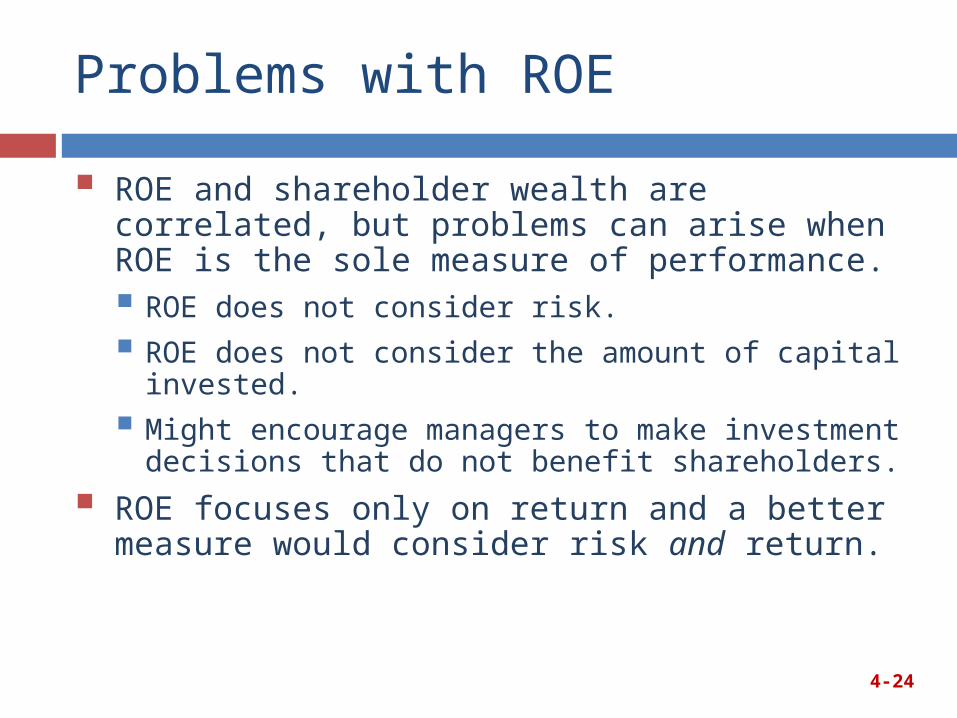
Problems with ROE
ROE and shareholder wealth are correlated, but problems can arise when ROE is the sole measure of performance. ROE does not consider risk.
ROE does not consider the amount of capital invested.
Might encourage managers to make investment decisions that do not benefit shareholders.
ROE focuses only on return and a better measure would consider risk and return.
4-24
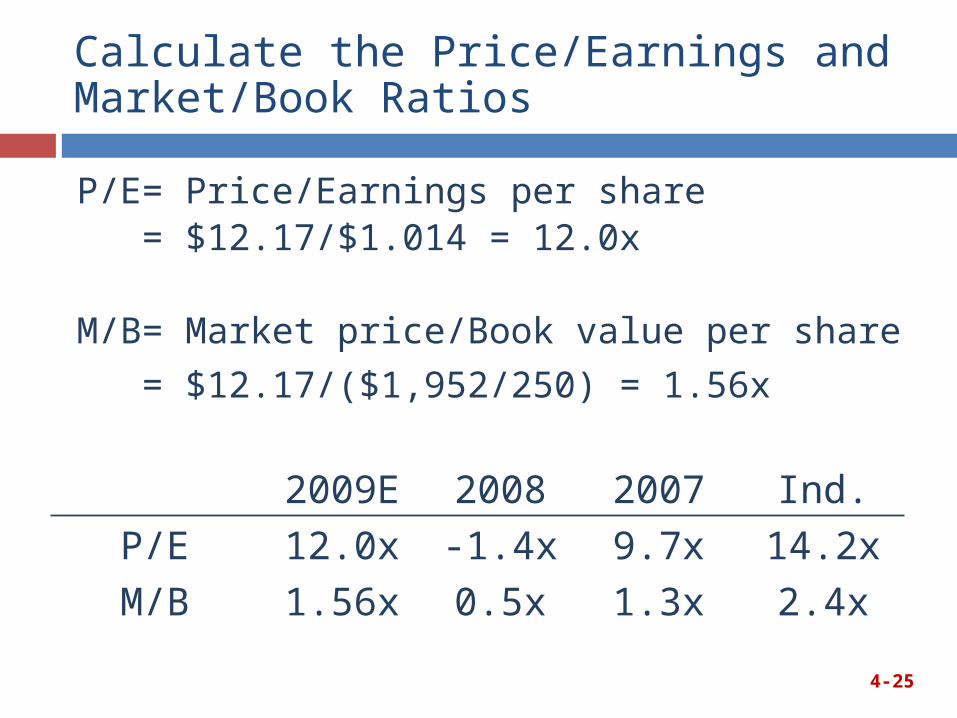
Calculate the Price/Earnings and Market/Book Ratios
P/E = Price/Earnings per share= $12.17/$1.014 = 12.0x
M/B = Market price/Book value per share
= $12.17/($1,952/250) = 1.56x
4-25
2009E 2008 2007 Ind.
P/E 12.0x -1.4x 9.7x 14.2x
M/B 1.56x 0.5x 1.3x 2.4x
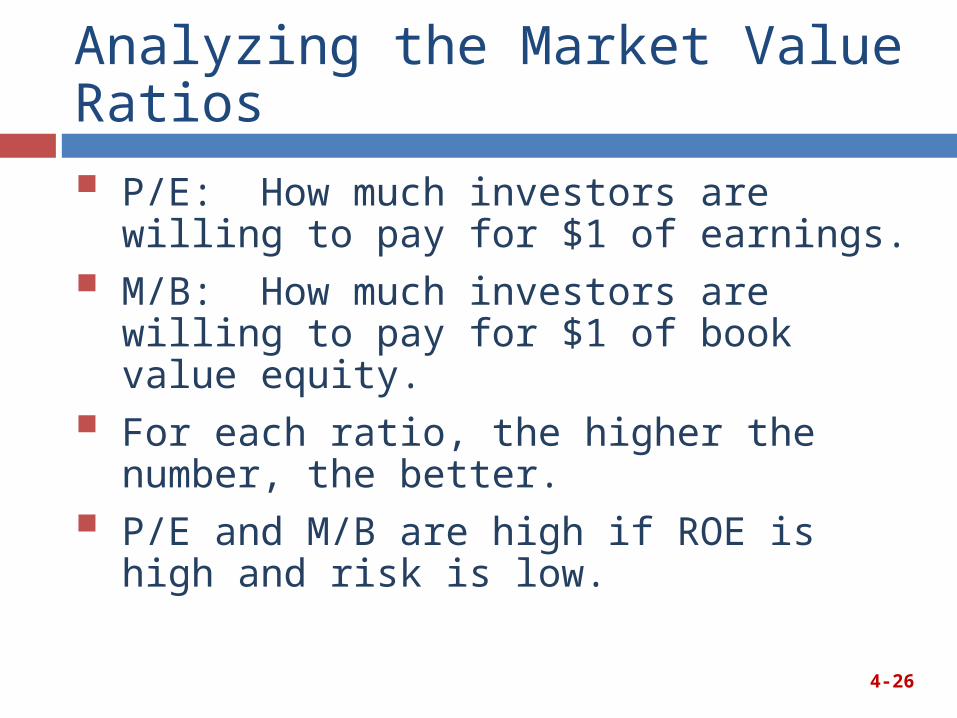
Analyzing the Market Value Ratios
P/E: How much investors are willing to pay for $1 of earnings.
M/B: How much investors are willing to pay for $1 of book value equity.
For each ratio, the higher the number, the better.
P/E and M/B are high if ROE is high and risk is low.
4-26
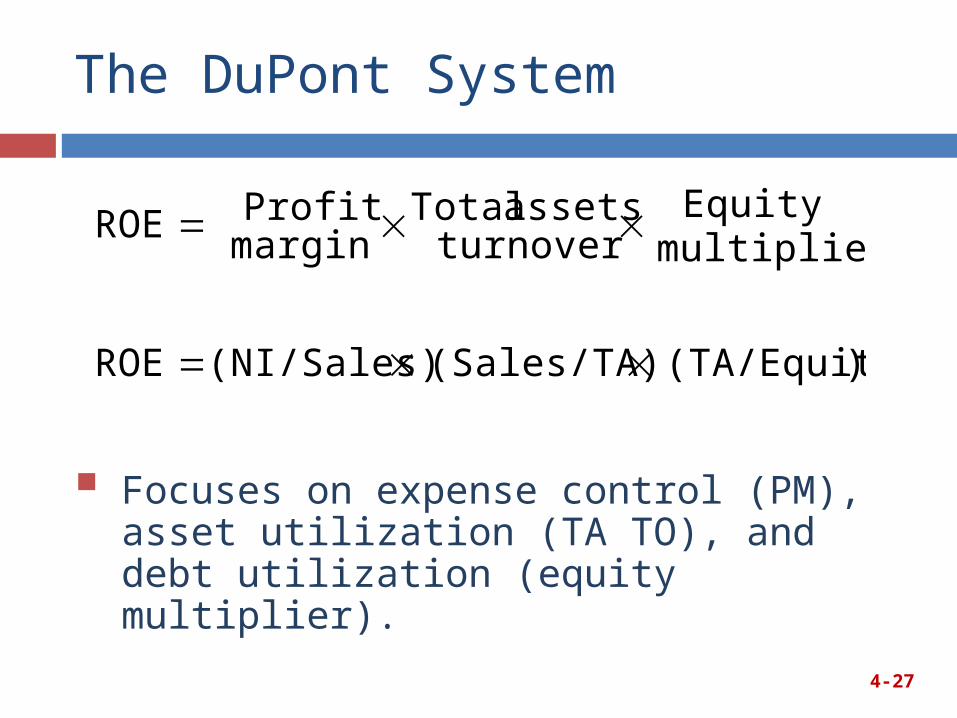
The DuPont System
)(TA/Equity (Sales/TA) (NI/Sales) ROE
multiplierEquity turnover
assets Total marginProfit ROE
Focuses on expense control (PM), asset utilization (TA TO), and debt utilization (equity multiplier).
4-27
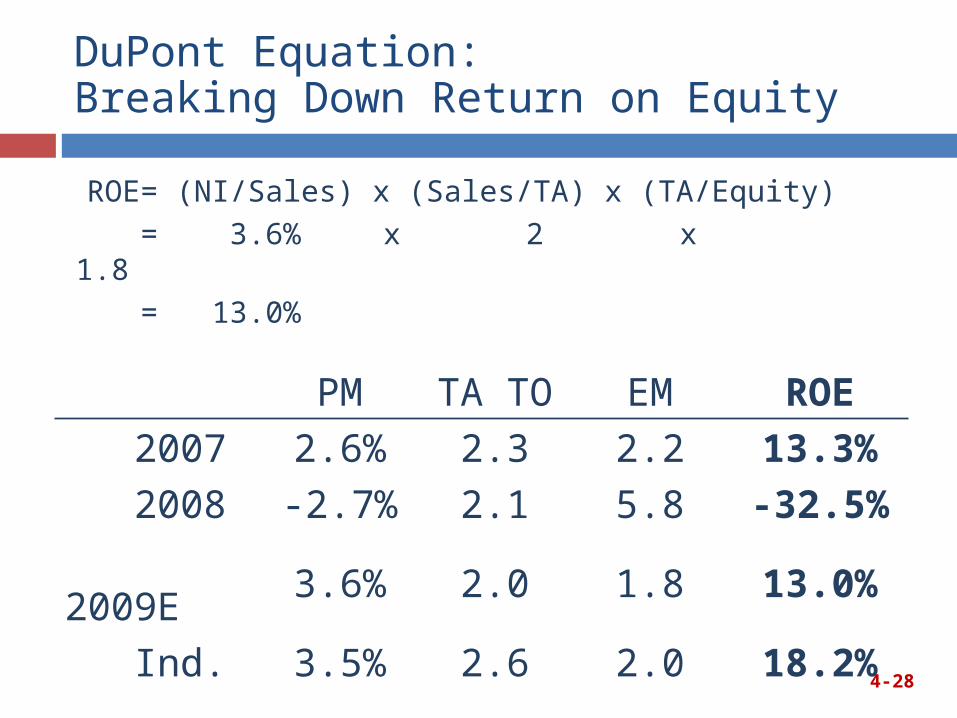
DuPont Equation: Breaking Down Return on Equity
PM TA TO EM ROE
2007 2.6% 2.3 2.2 13.3%
2008 -2.7% 2.1 5.8 -32.5%
2009E 3.6% 2.0 1.8 13.0%
Ind. 3.5% 2.6 2.0 18.2%
ROE= (NI/Sales) x (Sales/TA) x (TA/Equity)= 3.6% x 2 x 1.8 = 13.0%
4-28

An Example:The Effects of Improving Ratios
A/R $ 878 Debt $1,545Other CA 1,802 Equity 1,952Net FA 817TA $3,497 Total L&E $3,497
Sales/Day = $7,035,600/365 = $19,275.62
How would reducing the firm’s DSO to 32 days affect the company?
4-29
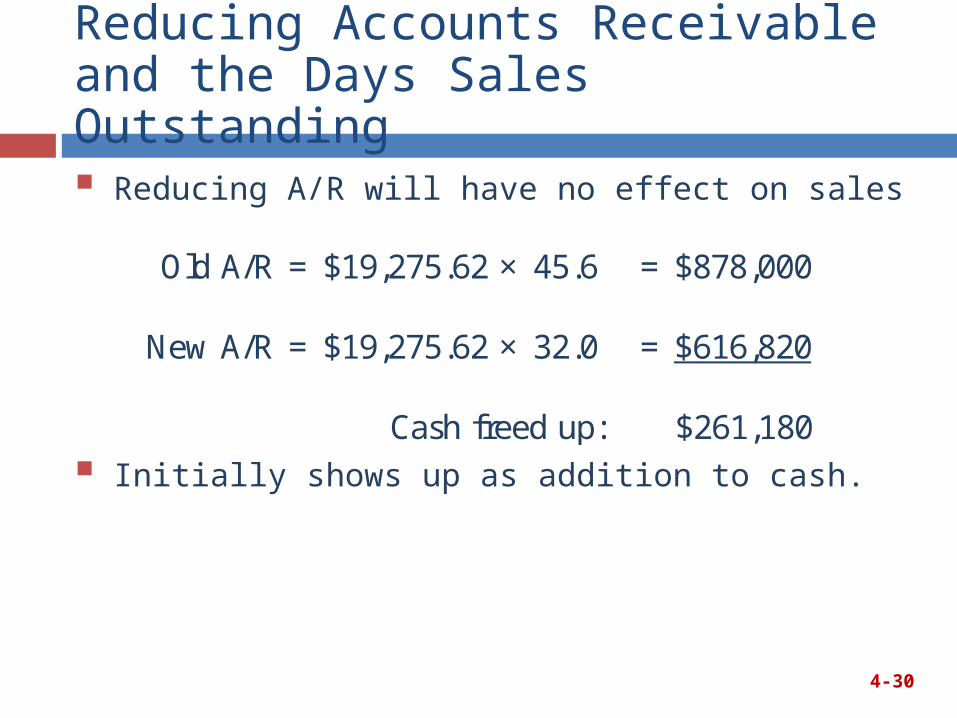
Reducing Accounts Receivable and the Days Sales Outstanding
Reducing A/R will have no effect on sales
Initially shows up as addition to cash.
4-30
Old A/R = $19,275.62 × 45.6 = $878,000
New A/R = $19,275.62 × 32.0 = $616,820
Cash freed up: $261,180

Effect of Reducing Receivables on Balance Sheet and Stock Price
Added cash $ 261 Debt $1,545A/R 617 Equity 1,952Other CA 1,802Net FA 817Total Assets $3,497 Total L&E $3,497
What could be done with the new cash?How might stock price and risk be affected?
4-31
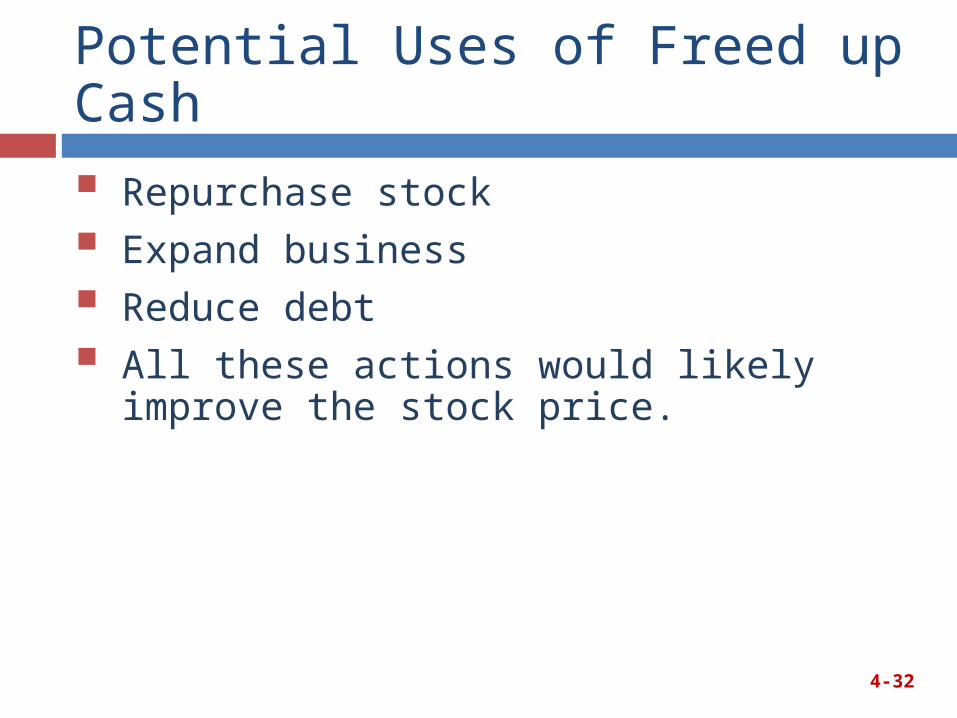
Potential Uses of Freed up Cash
Repurchase stock
Expand business
Reduce debt
All these actions would likely improve the stock price.
4-32
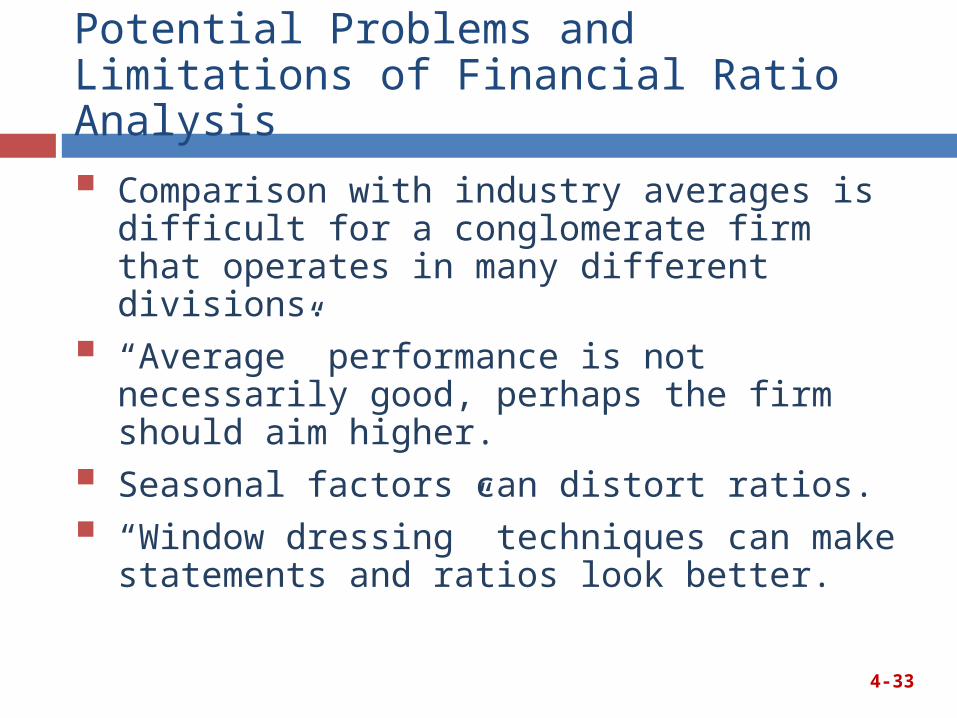
Potential Problems and Limitations of Financial Ratio Analysis
Comparison with industry averages is difficult for a conglomerate firm that operates in many different divisions.
“Average” performance is not necessarily good, perhaps the firm should aim higher.
Seasonal factors can distort ratios.
“Window dressing” techniques can make statements and ratios look better.
4-33

More Issues Regarding Ratios
Different operating and accounting practices can distort comparisons.
Sometimes it is hard to tell if a ratio is “good” or “bad.”
Difficult to tell whether a company is, on balance, in strong or weak position.
4-34

Consider Qualitative Factors When Evaluating a Company’s Future Financial Performance
Are the firm’s revenues tied to one key customer, product, or supplier?
What percentage of the firm’s business is generated overseas?
The firm’s competitive environment
Future prospects
Legal and regulatory environment
4-35
Related Documents