Analysis of Financial Statements Atha Ullah Akakheel MBA (Finance) (AWKUM) School Of Business Mardan,KPK,PAK

Analysis of financial statements.
Jul 14, 2015
Welcome message from author
This document is posted to help you gain knowledge. Please leave a comment to let me know what you think about it! Share it to your friends and learn new things together.
Transcript
Analysis of Financial
Statements
Atha Ullah AkakheelMBA (Finance)
(AWKUM) School Of BusinessMardan,KPK,PAK

Financial Statements
Financial Statement.A financial statement is an official document of the firm, which explores the entire financial information of the firm.
The purpose of FS is to provide information about the financial position, performance and changes in financial position of an enterprise that is useful to a wide range of users in making economic decisions.
Financial Statements
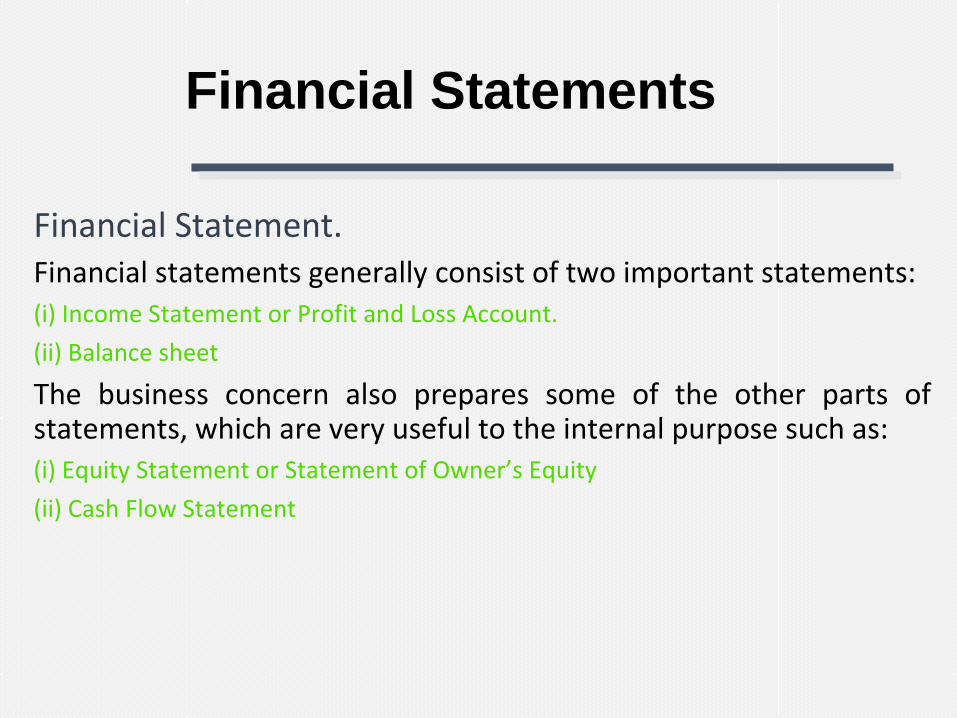
Financial Statement.Financial statements generally consist of two important statements: (i) Income Statement or Profit and Loss Account.
(ii) Balance sheet
The business concern also prepares some of the other parts of statements, which are very useful to the internal purpose such as:(i) Equity Statement or Statement of Owner’s Equity
(ii) Cash Flow Statement
Income Statement
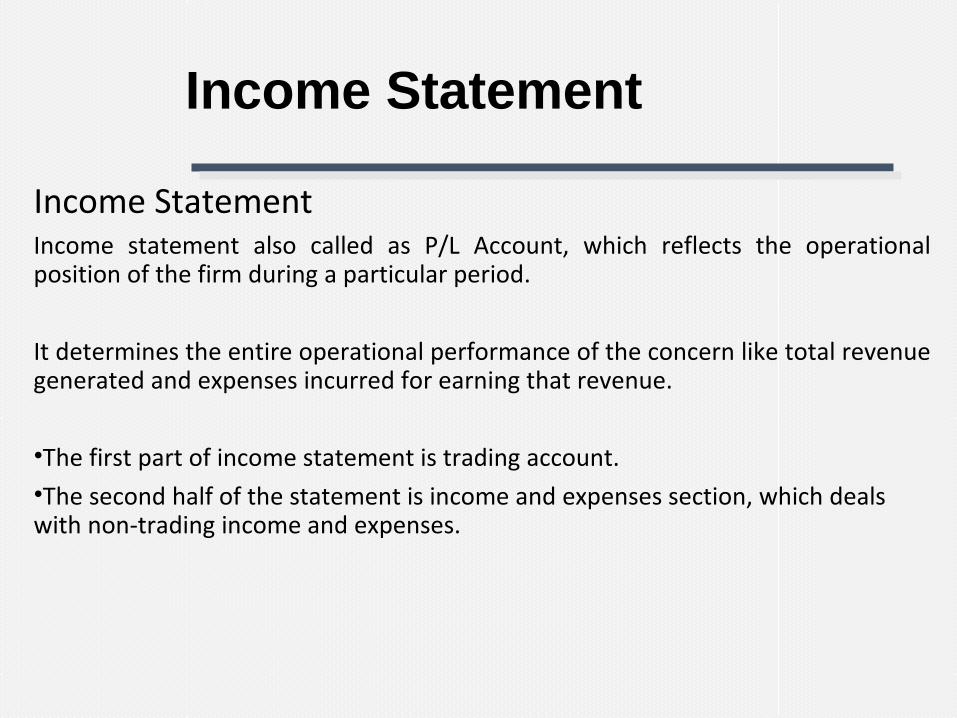
Income StatementIncome statement also called as P/L Account, which reflects the operational position of the firm during a particular period.
It determines the entire operational performance of the concern like total revenue generated and expenses incurred for earning that revenue.
•The first part of income statement is trading account. •The second half of the statement is income and expenses section, which deals with non-trading income and expenses.
Income Statement (Trading Account)
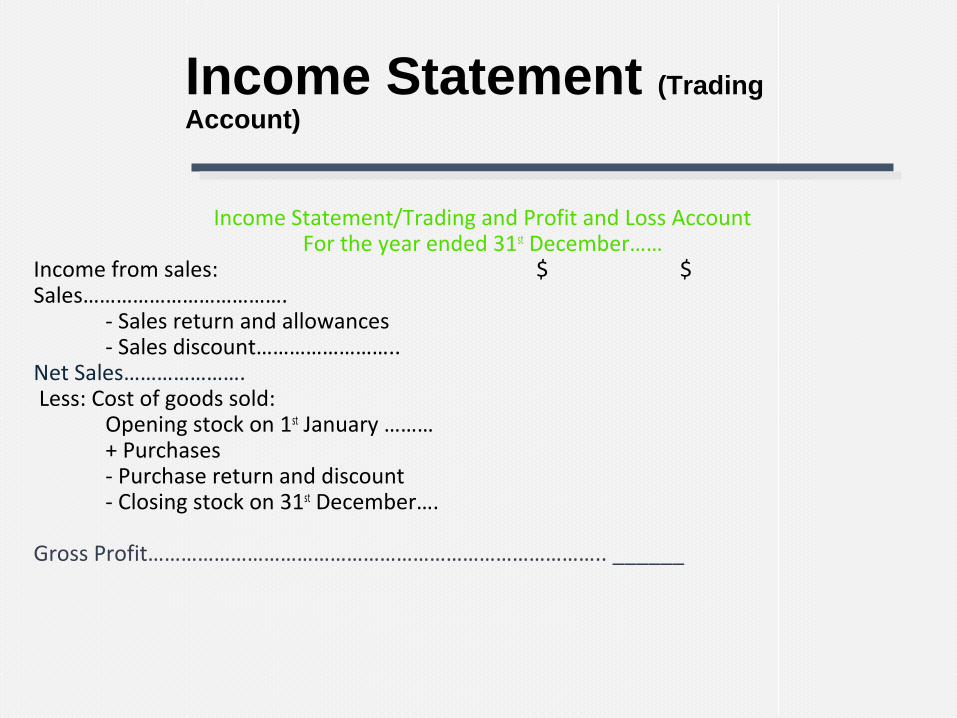
Income Statement/Trading and Profit and Loss AccountFor the year ended 31st December……
Income from sales: $ $Sales……………………………….
- Sales return and allowances- Sales discount……………………..
Net Sales…………………. Less: Cost of goods sold:
Opening stock on 1st January ………+ Purchases- Purchase return and discount - Closing stock on 31st December….
Gross Profit……………………………………………………………………….. ______

Income Statement (Income & Expense A/C)
Operating Expenses:Selling expenses:
Advertising expensesInsurance expenses
Total selling expenses ______ General Expenses:
Office salariesGeneral insurance expenseOffice supplies expenseStationary
Total general expenses ______ Total operating expenses ____Net profit from operations………………………………………… ____
+ Other Income- Other expenses
Net profit before tax (Taxable profit)- Taxation
Net Profit………………………………………………………………………….. ______

Balance Sheet
Balance SheetA financial statement that lists the assets, liabilities and equity of a company at a specific point in time and is used to calculate the net worth of a business.
One of the four basic financial statements, the balance sheet is the only statement which applies to a single point in time

Financial Statements
Business LeadersBalance Sheet
As on 31st December……….ASSETS $ $ $Current Assets:
Cash …Debtor/Accounts Receivables …Note Receivables …Prepayments …Inventory …Short Term Investment …
Total Current Assets …

Financial Statements
Non-Current Assets:Tangible Assets
Building …Less: Depreciation on Building (..) …Land …Furniture …Less: Depreciation on Furniture (..) …Plant & Machinery …Less: Depreciation on P&M (..) …
Intangible AssetsGoodwill …Less: Amortization (..) …Patents …
Investments:Long Term Investment …
Total Non-current Asset …Total Assets …

Financial Statements
LIABILITIES & SHAREHOLDER’S EQUITYCurrent Liabilities:
Trade Accounts Payable …Accrued Expenses …Bank Overdraft …Proposed Dividend …Interest Payable …Note Payable …Tax payable …Unearned Revenues …
Total Current Liabilities ……….

Financial Statements
Long Term Liabilities:Long term obligations …
Total Long term Liabilities … Shareholder’s equity:
Share Capital …Retained Earnings …Revaluation Reserve …Accrued Income …
Total Shareholder’s equity …
Total Liabilities and Shareholder’s Equity .……..…
Financial Statements
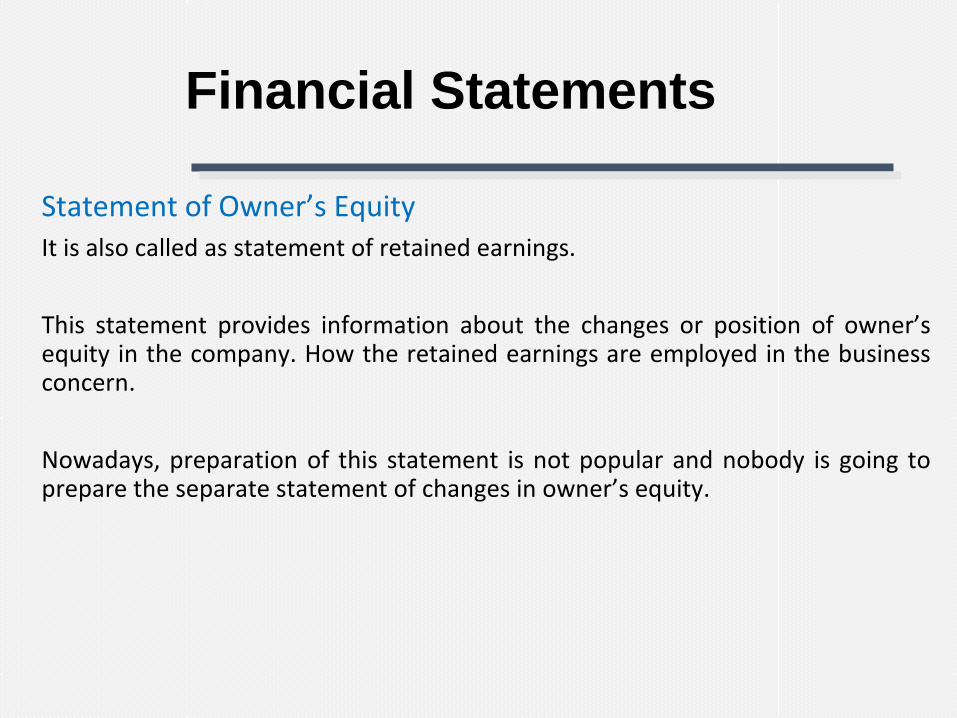
Statement of Owner’s EquityIt is also called as statement of retained earnings.
This statement provides information about the changes or position of owner’s equity in the company. How the retained earnings are employed in the business concern.
Nowadays, preparation of this statement is not popular and nobody is going to prepare the separate statement of changes in owner’s equity.

Financial Statements
Cash Flow StatementA financial statement which reports the inflows and outflows of cash for a particular period for the operating, investing and financing activities undertaken by an entity.
A financial statement also called statement of cash flows or funds flow statement that shows how changes in balance sheet and income statement affect cash and cash equivalents.
•Cash Flows are inflows and outflows of cash and cash equivalents. •Cash Equivalents are short term, highly liquid investments that are readily convertible to known amounts of cash.

Financial Statements
Types of Activities that generate Cash. 1.Operating Activities
2.Investing Activities
3.Financing Activities

Financial Statements
Operating Activities. The principal revenue-producing activities of the entity.
The standard gives the following as examples of cash flows from operating activities:•Cash receipts from the sales of goods and the rendering of services.•Cash from royalties, fees, commissions and other revenues.•Cash payments to suppliers for goods and services.•Cash paid to employees•Interest paid•Taxation
Financial Statements
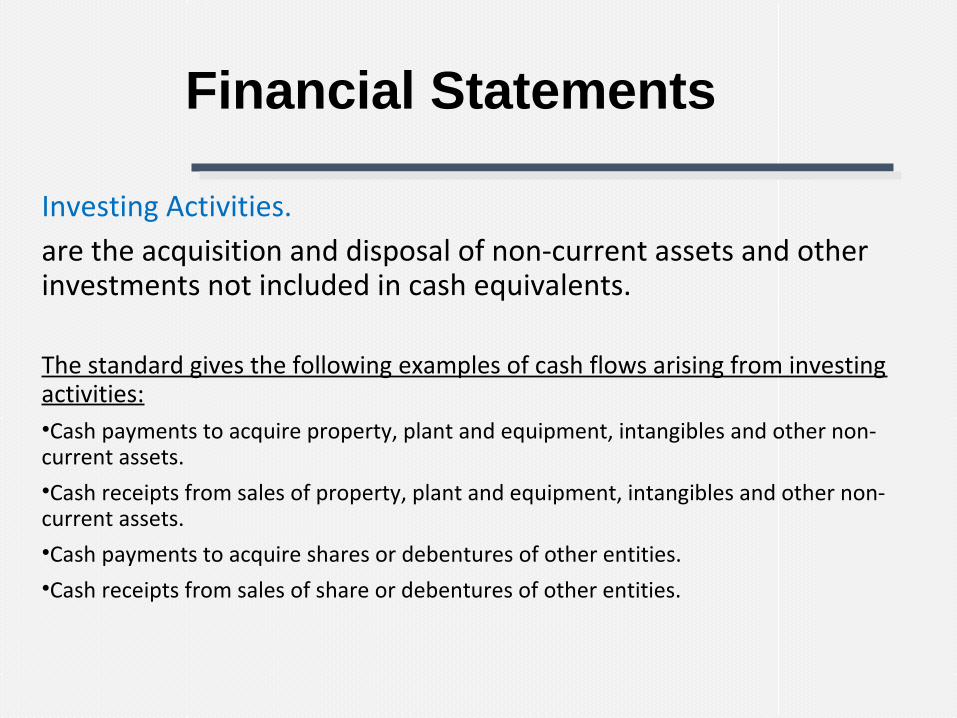
Investing Activities.are the acquisition and disposal of non-current assets and other investments not included in cash equivalents.
The standard gives the following examples of cash flows arising from investing activities:•Cash payments to acquire property, plant and equipment, intangibles and other non-current assets.
•Cash receipts from sales of property, plant and equipment, intangibles and other non-current assets.
•Cash payments to acquire shares or debentures of other entities.
•Cash receipts from sales of share or debentures of other entities.
Financial Statements
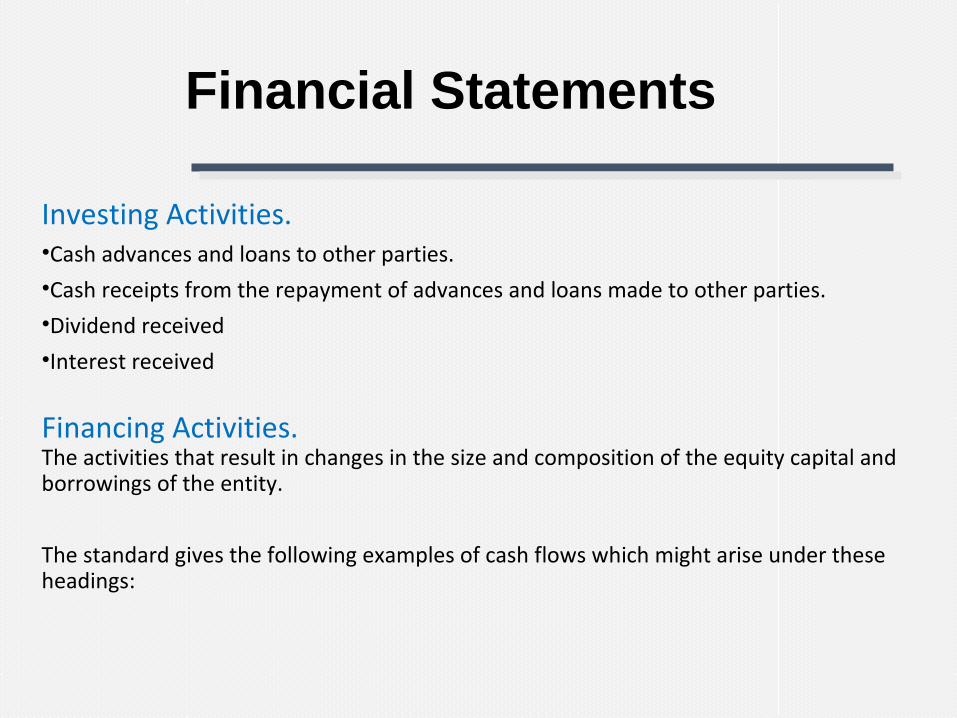
Investing Activities.•Cash advances and loans to other parties.
•Cash receipts from the repayment of advances and loans made to other parties.
•Dividend received
•Interest received
Financing Activities.The activities that result in changes in the size and composition of the equity capital and borrowings of the entity.
The standard gives the following examples of cash flows which might arise under these headings:
Financial Statements
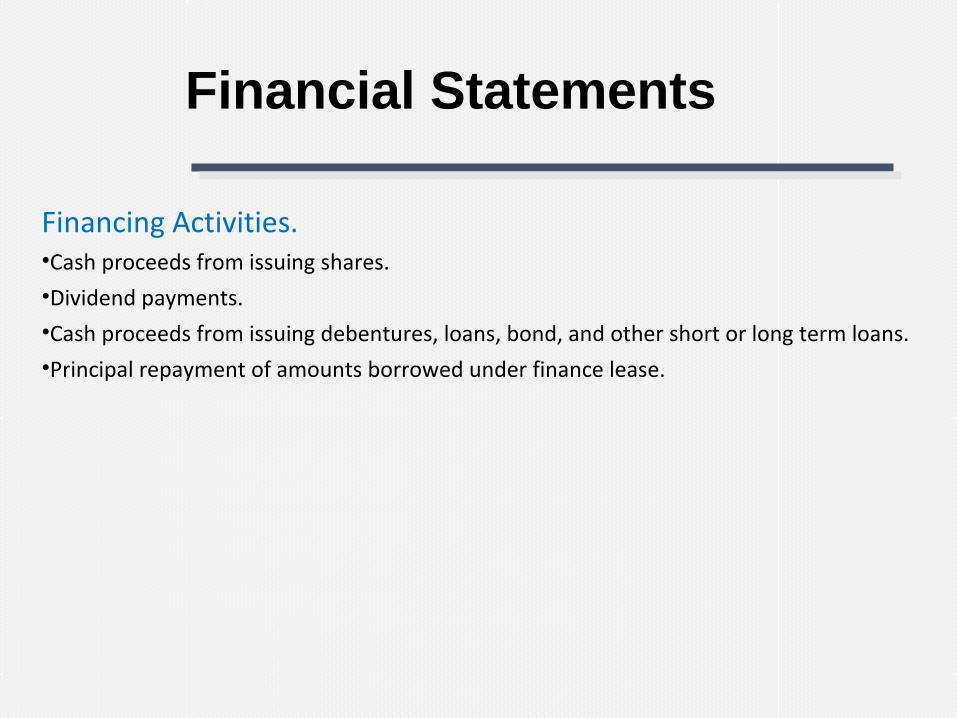
Financing Activities.•Cash proceeds from issuing shares.
•Dividend payments.
•Cash proceeds from issuing debentures, loans, bond, and other short or long term loans.
•Principal repayment of amounts borrowed under finance lease.
Cash Flow Statement
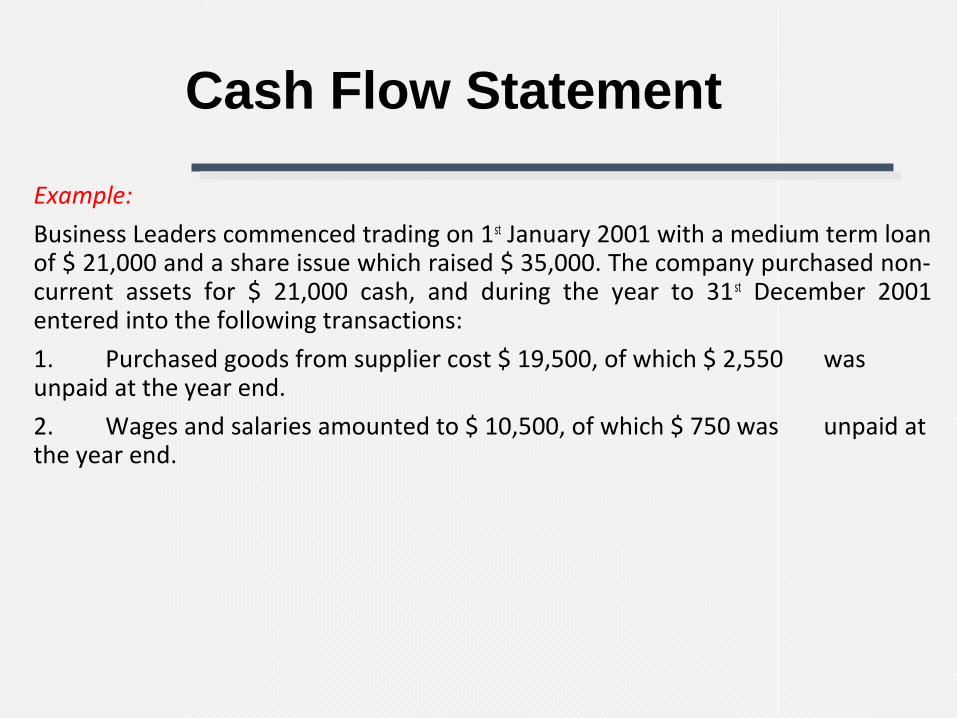
Example:
Business Leaders commenced trading on 1st January 2001 with a medium term loan of $ 21,000 and a share issue which raised $ 35,000. The company purchased non-current assets for $ 21,000 cash, and during the year to 31 st December 2001 entered into the following transactions:
1. Purchased goods from supplier cost $ 19,500, of which $ 2,550 was unpaid at the year end.
2. Wages and salaries amounted to $ 10,500, of which $ 750 was unpaid at the year end.

Cash Flow Statement
3. Interest on the loan of $ 2,100 was fully paid in the year and a repayment of $ 5,250 was made.
4. Sales turnover was $ 29,400, including $ 900 receivables at the year end.
5. Interest on cash deposits at the bank amounted to $ 75.
6. A dividend of 4,000 was proposed as at 31st December 2001.
You are requested to prepare a historical cash flow statement for the year ended 31st December 2001.
Cash Flow Statement
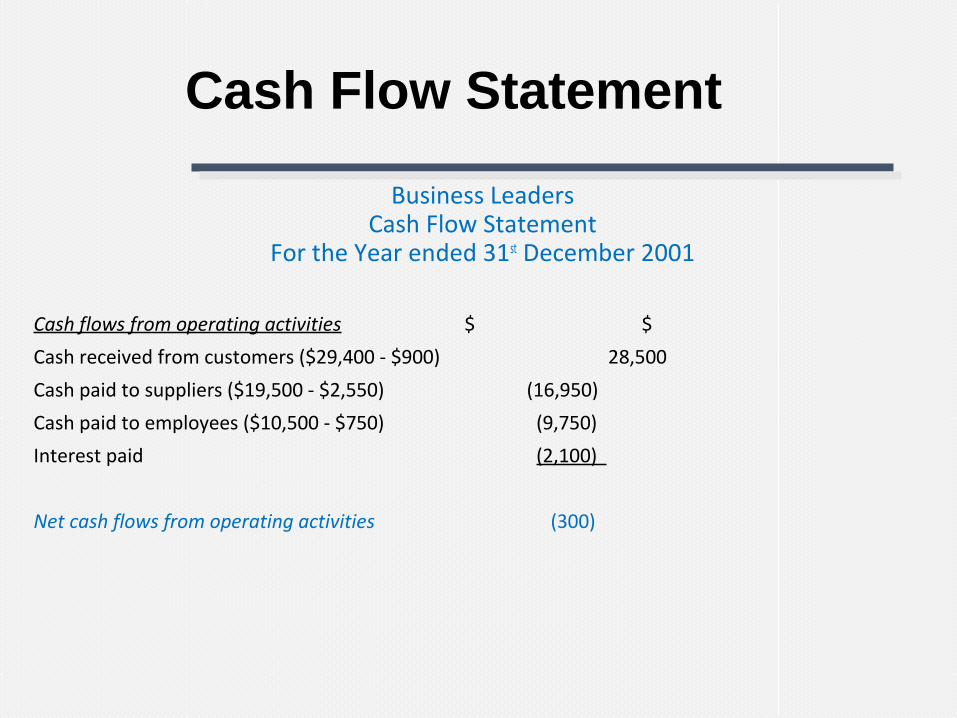
Business LeadersCash Flow Statement
For the Year ended 31st December 2001
Cash flows from operating activities $ $
Cash received from customers ($29,400 - $900) 28,500
Cash paid to suppliers ($19,500 - $2,550) (16,950)
Cash paid to employees ($10,500 - $750) (9,750)
Interest paid (2,100)
Net cash flows from operating activities (300)

Cash Flow Statement
Cash flows from investing activities
Purchase of non-current assets (21,000)
Interest received 75
Net cash flows from investing activities (20,925)
Cash flows from financing activities
Issue of shares 35,000
Proceeds from medium term loan 21,000
Repayment of medium term loan (5,250)
Net Cash from financing activities 50,750
Net increase/decrease in cash and cash equivalents 29,525
Cash and cash equivalents at 1st January 2001 0 Cash and cash equivalent at 31st December 2001 29,525

Financial Statement Analysis
Analysis of Financial Statement is necessary to understand the financial positions during a particular period.
According to Myres, “Financial statement analysis is largely a study of the relationship among the various financial factors in a business as disclosed by a single set of statements and a study of the trend of these factors as shown in a series of statements”.
The following are the common methods or techniques, which are widely used by the business concern:
•Comparative Statement•Trend Analysis•Ratio Analysis

Financial Statement Analysis
Comparative StatementThis statement helps to understand the comparative position of financial and operational performance at different period of time.
Two major types of comparative:•Balance sheet analysis•Comparative profit and loss account analysis.
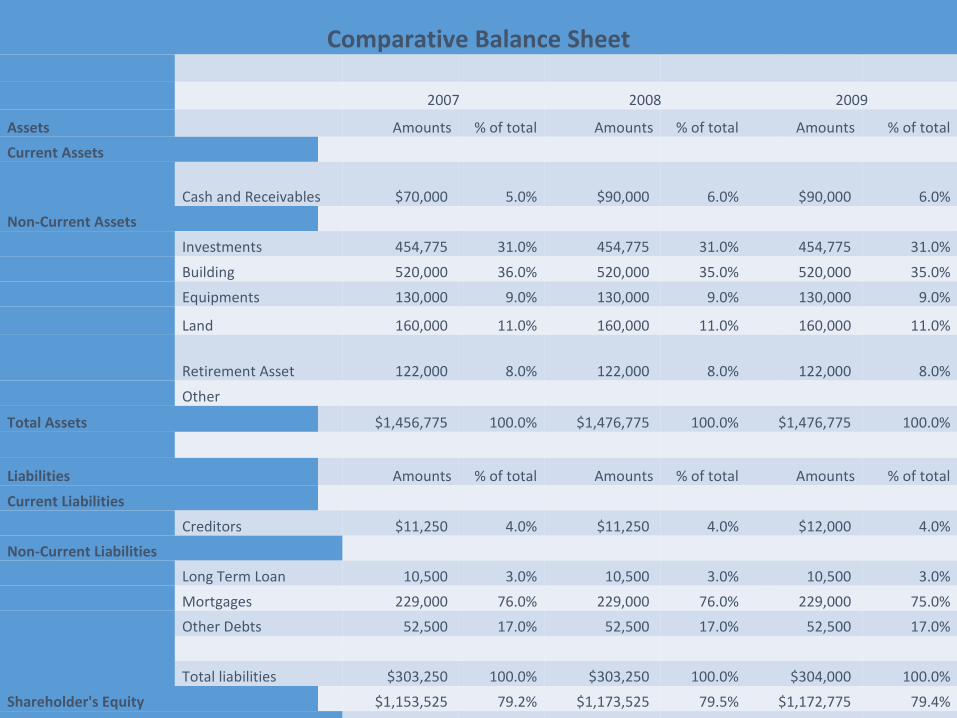
Comparative Balance Sheet
2007 2008 2009
Assets Amounts % of total Amounts % of total Amounts % of total
Current Assets
Cash and Receivables $70,000 5.0% $90,000 6.0% $90,000 6.0%
Non-Current Assets
Investments 454,775 31.0% 454,775 31.0% 454,775 31.0%
Building 520,000 36.0% 520,000 35.0% 520,000 35.0%
Equipments 130,000 9.0% 130,000 9.0% 130,000 9.0%
Land 160,000 11.0% 160,000 11.0% 160,000 11.0%
Retirement Asset 122,000 8.0% 122,000 8.0% 122,000 8.0%
Other
Total Assets $1,456,775 100.0% $1,476,775 100.0% $1,476,775 100.0%
Liabilities Amounts % of total Amounts % of total Amounts % of total
Current Liabilities
Creditors $11,250 4.0% $11,250 4.0% $12,000 4.0%
Non-Current Liabilities
Long Term Loan 10,500 3.0% 10,500 3.0% 10,500 3.0%
Mortgages 229,000 76.0% 229,000 76.0% 229,000 75.0%
Other Debts 52,500 17.0% 52,500 17.0% 52,500 17.0%
Total liabilities $303,250 100.0% $303,250 100.0% $304,000 100.0%
Shareholder's Equity $1,153,525 79.2% $1,173,525 79.5% $1,172,775 79.4%
Total Liabilities and Equity $1,456,775 100.0% $1,476,775 100.0% $1,476,775 100.0%

Trend Analysis
Trend analysis helps to understand the trend relationship with various items, which appear in the financial statements.
In this analysis, only major items are considered for calculating the trend percentage.
Exercise:
Year Deposits Advances Profit
1999 2,05,59,498 97,14,728 3,50,311
2000 2,66,45,251 1,25,50,440 4,06,287
2001 3,19,80,696 1,58,83,495 5,04,020
2002 3,72,99,877 1,77,26,607 5,53,525
2003 4,08,45,783 1,95,99,764 6,37,634
2004 4,40,42,730 2,11,39,869 8,06,755

Trend Analysis
SolutionTrend Analysis (Base year 1999=100)
YearDeposits Advances Profits
Amounts Trend % Amounts Trend % Amounts Trend %
1999 2,05,59,498 100 97,14,728 100 3,50,311 100
2000 2,66,45,251 129.6 1,25,50,440 129.2 4,06,287 115.9
2001 3,19,80,696 155.5 1,58,83,495 163.5 5,04,020 143.9
2002 3,72,99,877 181.4 1,77,26,607 182.5 5,53,525 150
2003 4,08,45,783 198.7 1,95,99,764 201.8 6,37,634 182
2004 4,40,42,730 214.2 2,11,39,869 217.6 8,06,755 230.3
Ratio Analysis
Ratio Analysis is most commonly used tool of financial statement analysis.
Ratio is mathematical relationship between one numbers to another number.
Ratio is used as index for evaluating the financial performance of business concern.

Ratio Analysis
Types of Ratio Analysis
•Liquidity Ratios•Activity Ratios•Solvency Ratios•Profitability Ratios•Shareholder’s Investment Ratios

Ratio Analysis
Liquidity RatiosIt is also called the short term solvency ratio.
This ratio helps to understand the liquidity in a business which is the potential ability to meet obligations.
S. No Ratio Formula Significant Level
1 Current Ratio= _Current Assets___
Current Liabilities2 : 1
2 Quick Ratio= _Quick Assets ___
Current Liabilities1 : 1
Ratio Analysis
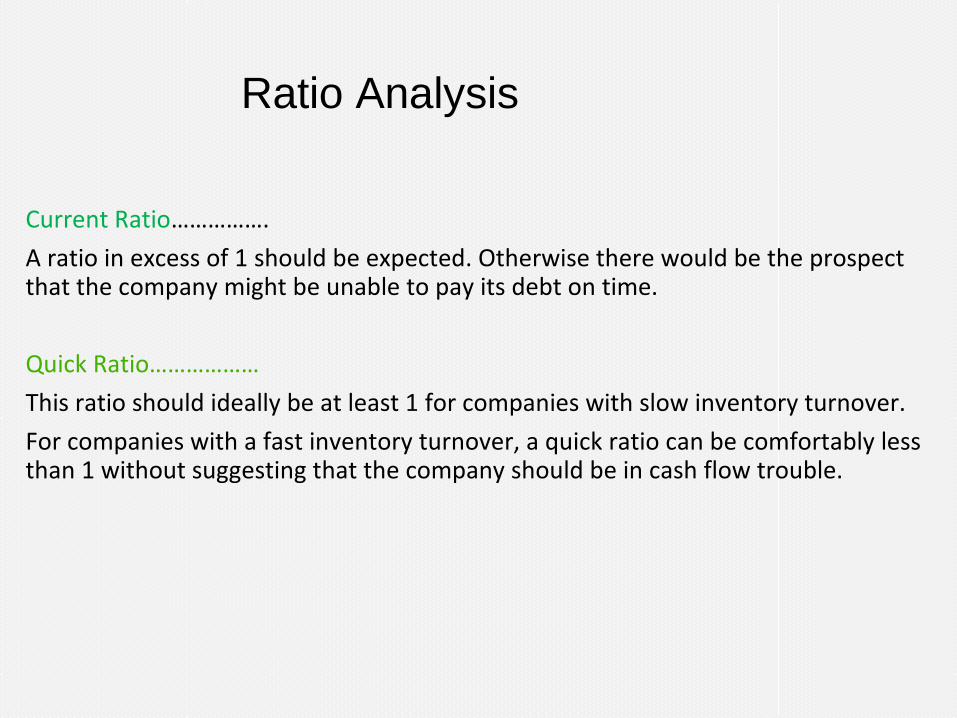
Current Ratio…………….
A ratio in excess of 1 should be expected. Otherwise there would be the prospect that the company might be unable to pay its debt on time.
Quick Ratio………………
This ratio should ideally be at least 1 for companies with slow inventory turnover.
For companies with a fast inventory turnover, a quick ratio can be comfortably less than 1 without suggesting that the company should be in cash flow trouble.

Ratio Analysis
Activity Ratios/Turnover Ratios/Efficiency Ratios
It measures the efficiency of current assets and current liabilities in the business concern during a particular period.
This ratio helps to understand the performance of the business concern. Some of the efficiency ratios are given below:
S. No Ratio Formula
1 Stock Turnover Period = _Inventory _ X 365 Days
Cost of Sales
2 Debtors Collection Period = _Trade Receivables X 365 Days
Sales
3 Accounts Payable Period= _Trade Accounts Payables
Purchases

Ratio Analysis
Solvency Ratios.
It is also called the leverage ratio, which measures the long term obligation of the business concern.
This ratio helps to understand, how the long term funds are used in the business concern. Some the solvency ratios are as follow:
S. No Ratio Formula
1 Debt Ratio= _Total Debts ___
Total Assets
2 Debt Equity Ratio= _Total Liabilities _
Shareholder’s equity
3 Interest Cover Ratio= Profit before interest and tax_ = Times
Interest charges

Ratio Analysis
Debt Ratio…….
There is no absolute guide to the maximum safe debt ratio, but as a very general guide, you might regard 50% as a safe limit to debt. Debt/Equity Ratio……It indicates what proportion of equity and debt the company is using to finance its assets.
Interest Cover. ……
The interest cover ratio shows whether a company is earning enough profit before interest and tax to pay its interest costs comfortably.
The interest cover ratio tells us the safety margin that the business has in terms of being able to meet its interest obligations.
A high interest cover ratio means that the business is easily able to meet its interest obligations from profits.
A low value for the interest cover ratio means that the business is potentially in danger of not being able to meet its interest obligations.

Ratio Analysis
Profitability RatiosProfitability ratio helps to measure the profitability position of the business concern.
S. No Ratio Formula
1 Gross Profit Ratio= Gross Profit X 100
Net Sales
2 Net Profit Ratio = Net Profit after interest and tax X 100
Net Sales
3 Operating Profit Ratio = Profit before interest and tax X 100
Net Sales
4 Return on Equity = Net Profit after interest and tax X 100
Shareholders’ Equity
5 Return on Assets = Net Profit after interest and tax X 100
Total Assets

Ratio Analysis
1. Gross Profit Ratio. It expresses the relationship between gross profit and sales.
2. Net Profit Ratio. is the ratio of net profit to net sales.
3. Operating Profit Ratio: Operating Profit means profit earned by the concern from its business operation and not from the other sources.
All operating incomes are added and non-operating incomes are deducted.
4. Return on equity: measures a corporation's profitability by revealing how much profit a company generates with the money shareholders have invested.

Ratio Analysis
5. Return on Assets. An indicator of how profitable a company is relative to its total assets.
ROA gives an idea as to how efficient management is at using its assets to generate earnings.

Ratio Analysis
Shareholder’s Investment Ratios:These ratios help equity shareholders and other investors to assess the value and quality of an investment in the ordinary shares of a company. They are:
1Earnings per
share
= Net Profit after Interest and Tax – Preferred Dividend
Average number of issued equity shares
2Dividend per
share
= Dividends paid to equity shareholders
Average number of issued equity shares
3 Dividend cover = EPS = times
DPS
4 P/E ratio = Market value per share
EPS

Ratio Analysis
1. Earning per share. Earnings per share is generally considered to be the single most important variable in determining a share's price.
For example, assume that a company has a net income of $25 million. If the company pays out $1 million in preferred dividends and has 10 million shares for half of the year and 15 million shares for the other half, the EPS would be $1.92 (24/12.5).
First, the $1 million is deducted from the net income to get $24 million, then a weighted average is taken to find the number of shares outstanding (0.5 x 10M+ 0.5 x 15M = 12.5M).

Ratio Analysis
2. Dividend per share. It is the amount of the dividend that shareholders have (or will) receive for each share they own. Dividend per share does not usually need to be calculated by investors as it is usually disclosed. Careless readers may sometimes confuse the final dividend with the total paid over the year.
•For example: ABC company paid a total of $237,000 in dividends over the last year of which there was a preferred dividend totaling $59,250. ABC has 2 million shares outstanding so its DPS would be ($237,000-$59,250)/2,000,000 = $0.0889 per share.

Ratio Analysis
3. Dividend cover. It shows the proportion of profit that is available for distribution to shareholders that has been paid (or proposed) and what proportion will be retained in the business to finance future growth. A dividend cover of 2 times would indicate that the company had paid 50% of its distributable profits as dividends, and retained 50% in the business to help finance future operations.

Ratio Analysis
4. Price Earning Ratio. A high P/E ratio indicates strong shareholder confidence in the company and its future, e.g. in profit growth, and a lower P/E ratio indicates lower confidence.
The P/E ratio of one company can be compared with the P/E ratios of:•Other companies in the same business sector
•Other companies generally
For example, if a company is currently trading at $43 a share and earnings over the last 12 months were $1.95 per share, the P/E ratio for the stock would be 22.05 ($43/$1.95).

Reference:
• //www.google.com.pk/url?sa=t&rct=j&q=&esrc=s&source=web&cd=8&cad=rja&uact=8&sqi=2&ved=0CEcQFjAH&url=https%3A%2F%2Ftippie.uiowa.edu%2Fiem%2Fmodules%2Ffinstatement.ppt&ei=dYDwVM-JDojZavTkgIAJ&usg=AFQjCNGGY877p4B2kAmoxmzzRZV_5ToFMw&bvm=bv.87269000,d.d2s
• http://www.accountingtools.com/financial-statement-analysis
• https://www.google.com.pk/url?sa=t&rct=j&q=&esrc=s&source=web&cd=11&cad=rja&uact=8&sqi=2&ved=0CFgQFjAK&url=http%3A%2F%2Fwww.cfainstitute.org%2Flearning%2Fproducts%2Fpublications%2Finv%2FDocuments%2Fcorporate_finance_chapter9.pptx&ei=dYDwVM-JDojZavTkgIAJ&usg=AFQjCNG8yai-AfExTELe8aHNVmIB2qi0jQ&bvm=bv.87269000,d.d2s
• http://www.slideshare.net/search/slideshow?searchfrom=header&q=financial+statment+analyis
Related Documents