Analysis of factors determining sediment yield variability in the highlands of northern Ethiopia L. Tamene a, * , S.J. Park b , R. Dikau c , P.L.G. Vlek a a Center for Development Research (ZEF), University of Bonn, Walter-Flex-Str.3, 53113, Bonn, Germany b Department of Geography, College of Social Sciences, Seoul National University, Seoul 151-742, South Korea c Department of Geography, University of Bonn, Meckenheimer Allee 166, 53115, Bonn, Germany Received 11 April 2005; received in revised form 16 October 2005; accepted 20 October 2005 Available online 15 December 2005 Abstract In many developing countries, sustainable land management and water resources development are threatened by soil erosion and sediment-related problems. In response to such threats, there is an urgent need for improved catchment-based erosion control and sediment management strategies. The design and implementation of such strategies require data on erosion rates and understanding of the factors that control the delivery of sediment through the catchment system. In this study, reservoir sedimentation and corresponding catchment attribute data were used to investigate the major factors controlling sediment yield variability in a mountainous dryland region of northern Ethiopia. Sediment yield data were acquired for representative 11 catchments above reservoirs. Geomorphological and anthropogenic catchment attributes were extracted for each reservoir from different sources including digital elevation models, satellite images and field surveys. Different statistical analyses such as Pearson’s correlation, principal components and multiple regression were implemented to analyze the relationship between sediment yield and catchment characteristics and to determine the major factors controlling the variability of sediment yield. The results show that terrain form, gully erosion, surface lithology, and land cover explain most of the variability in sediment yield among the catchments. The implications of the results, for relevant management intervention targeted at ameliorating the major causative factors of erosion, are also outlined. D 2005 Elsevier B.V. All rights reserved. Keywords: Reservoir survey; Catchment attributes; Statistical analysis; Sediment yield variability; Northern Ethiopia 1. Introduction Agricultural productivity in Ethiopia is highly influ- enced by erratic and unpredictable rainfall, which led to recurrent droughts claiming thousands of human and livestock lives (e.g., Degefu, 1987; Hurni, 1993). To mitigate such crisis, it is necessary to minimize the deleterious impact of rainfall variability through the provision of adequate water supply and its proper uti- lization (Lawrence et al., 2004). Therefore, the govern- ment of Ethiopia, in collaboration with international organizations, launched a massive surface-water har- vesting scheme through the construction of micro- dams. For instance, from 1996 to 2001, over 50 micro-dams were built in the Tigray administrative region of northern Ethiopia. The construction of the micro-dams resulted in var- ious economical, hydrological, and ecological benefits including increase in food production, easy access to drinking water for people and livestock, rise in the ground water level and issuance of new springs (e.g., 0169-555X/$ - see front matter D 2005 Elsevier B.V. All rights reserved. doi:10.1016/j.geomorph.2005.10.007 * Corresponding author. Fax: +49 228 731889. E-mail address: lulseged _ [email protected] (L. Tamene). Geomorphology 76 (2006) 76 – 91 www.elsevier.com/locate/geomorph

Welcome message from author
This document is posted to help you gain knowledge. Please leave a comment to let me know what you think about it! Share it to your friends and learn new things together.
Transcript
www.elsevier.com/locate/geomorph
Geomorphology 76
Analysis of factors determining sediment yield variability in the
highlands of northern Ethiopia
L. Tamene a,*, S.J. Park b, R. Dikau c, P.L.G. Vlek a
a Center for Development Research (ZEF), University of Bonn, Walter-Flex-Str.3, 53113, Bonn, Germanyb Department of Geography, College of Social Sciences, Seoul National University, Seoul 151-742, South Korea
c Department of Geography, University of Bonn, Meckenheimer Allee 166, 53115, Bonn, Germany
Received 11 April 2005; received in revised form 16 October 2005; accepted 20 October 2005
Available online 15 December 2005
Abstract
In many developing countries, sustainable land management and water resources development are threatened by soil erosion
and sediment-related problems. In response to such threats, there is an urgent need for improved catchment-based erosion control
and sediment management strategies. The design and implementation of such strategies require data on erosion rates and
understanding of the factors that control the delivery of sediment through the catchment system. In this study, reservoir
sedimentation and corresponding catchment attribute data were used to investigate the major factors controlling sediment yield
variability in a mountainous dryland region of northern Ethiopia. Sediment yield data were acquired for representative 11
catchments above reservoirs. Geomorphological and anthropogenic catchment attributes were extracted for each reservoir from
different sources including digital elevation models, satellite images and field surveys. Different statistical analyses such as
Pearson’s correlation, principal components and multiple regression were implemented to analyze the relationship between
sediment yield and catchment characteristics and to determine the major factors controlling the variability of sediment yield.
The results show that terrain form, gully erosion, surface lithology, and land cover explain most of the variability in sediment yield
among the catchments. The implications of the results, for relevant management intervention targeted at ameliorating the major
causative factors of erosion, are also outlined.
D 2005 Elsevier B.V. All rights reserved.
Keywords: Reservoir survey; Catchment attributes; Statistical analysis; Sediment yield variability; Northern Ethiopia
1. Introduction
Agricultural productivity in Ethiopia is highly influ-
enced by erratic and unpredictable rainfall, which led to
recurrent droughts claiming thousands of human and
livestock lives (e.g., Degefu, 1987; Hurni, 1993). To
mitigate such crisis, it is necessary to minimize the
deleterious impact of rainfall variability through the
provision of adequate water supply and its proper uti-
0169-555X/$ - see front matter D 2005 Elsevier B.V. All rights reserved.
doi:10.1016/j.geomorph.2005.10.007
* Corresponding author. Fax: +49 228 731889.
E-mail address: [email protected] (L. Tamene).
lization (Lawrence et al., 2004). Therefore, the govern-
ment of Ethiopia, in collaboration with international
organizations, launched a massive surface-water har-
vesting scheme through the construction of micro-
dams. For instance, from 1996 to 2001, over 50
micro-dams were built in the Tigray administrative
region of northern Ethiopia.
The construction of the micro-dams resulted in var-
ious economical, hydrological, and ecological benefits
including increase in food production, easy access to
drinking water for people and livestock, rise in the
ground water level and issuance of new springs (e.g.,
(2006) 76–91
L. Tamene et al. / Geomorphology 76 (2006) 76–91 77
Teshalle, 2001; Woldearegay, 2001; Behailu, 2002).
However, such benefits are threatened by the rapid
loss of the water storage capacity of the dams mainly
due to siltation (e.g., Gebre-Hawariat and Haile, 1999).
The rapid siltation of the reservoirs has resulted in the
loss of their intended services and a large amount of
money spent on their construction. Accelerated siltation
is also responsible for the storage capacity loss of
hydro-electric power dams resulting in frequent power
cuts and rationing-based electric power distribution
(Ayalew, 2002). At the same time, the on-site effect
of erosion, which results in the loss of nutrient-rich top
soil and hence reduced crop yields, is chronic in the
country (e.g., FAO, 1986; Hurni, 1993; Sonneveld and
Keyzer, 2003).
To tackle the on- and off-site threats of erosion, there
is an urgent need for improved catchment-based erosion
control and sediment management strategies (Millward
and Mersey, 2001; Walling et al., 2001). To imple-
ment such strategies, it is necessary to understand the
magnitude of the problem and factors responsible for
it (Mitas and Mitasova, 1998). Knowledge of cause–
effect relationships and their spatial patterns are also
essential to plan water-harvesting schemes and to de-
sign necessary management precautions (Lawrence et
al., 2004).
Although catchment erosion is believed to be re-
sponsible for the rapid loss of storage capacity of the
reservoirs in Ethiopia, there are no detailed studies on
the quantification of erosion rates or on the spatial
dynamics of erosion/siltation processes on a catchment
scale (Gebre-Mariam, 1998). Some of the erosion stud-
ies are based on erosion plots (e.g., SCRP, 2000), which
are difficult to extrapolate to a basin scale. Moreover,
sediment yield measurements conducted at some gaug-
ing stations are not correlated with catchment attributes
for evaluating factors controlling sediment yield vari-
ability. Consequently, there is a need to determine the
effects of catchment attributes on sediment yield to
reservoirs.
Sediment deposition in reservoirs is a reflection of
catchment erosion and deposition processes, which are
controlled by terrain form, soil, surface cover, drainage
networks, and rainfall-related environmental attributes
(Renard and Foster, 1983; Walling, 1994). Integrated
analysis of reservoir sediment yield data with respective
environmental attributes of catchments could facilitate
understanding of the dominant factors governing sedi-
ment yield variability and identify cause–effect rela-
tionships at the catchment scale (Hadley et al., 1985;
Dearing and Foster, 1993; Verstraeten and Poesen,
2001a; Phippen and Wohl, 2003). The relationships
between sediment yield and basin attributes could
also serve as a means of predicting sediment yield of
similar catchments in similar environments (Phippen
and Wohl, 2003).
This study evaluates the major determinant factors of
sediment yields in a mountainous dryland environment
of Northern Ethiopia. Information related to the amount
and rate of sediment deposition in reservoirs was ac-
quired for 11 sites. Corresponding catchment attributes
data derived from different sources were then integrated
with the sediment yield data to evaluate the determinant
factors of sediment yield variability. Understanding the
significance of the different factors in accelerating ero-
sion and sedimentation enabled prioritization of possi-
ble areas of management intervention, targeted to
addressing the major causative factors.
2. Study areas and site characteristics
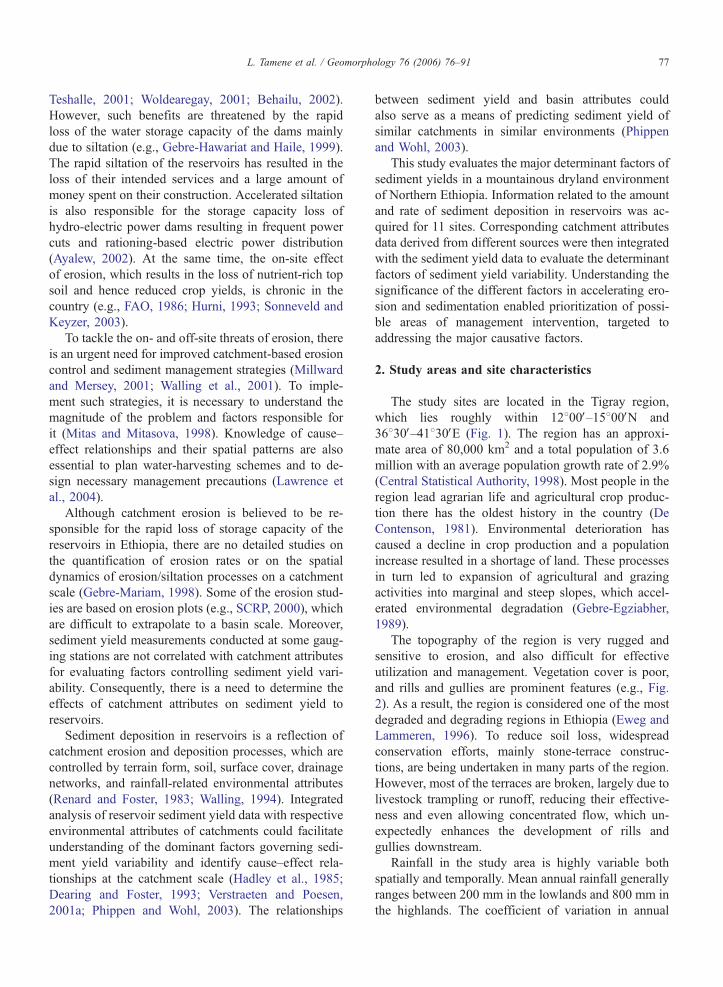
The study sites are located in the Tigray region,
which lies roughly within 12800V–15800VN and
36830V–41830VE (Fig. 1). The region has an approxi-
mate area of 80,000 km2 and a total population of 3.6
million with an average population growth rate of 2.9%
(Central Statistical Authority, 1998). Most people in the
region lead agrarian life and agricultural crop produc-
tion there has the oldest history in the country (De
Contenson, 1981). Environmental deterioration has
caused a decline in crop production and a population
increase resulted in a shortage of land. These processes
in turn led to expansion of agricultural and grazing
activities into marginal and steep slopes, which accel-
erated environmental degradation (Gebre-Egziabher,
1989).
The topography of the region is very rugged and
sensitive to erosion, and also difficult for effective
utilization and management. Vegetation cover is poor,
and rills and gullies are prominent features (e.g., Fig.
2). As a result, the region is considered one of the most
degraded and degrading regions in Ethiopia (Eweg and
Lammeren, 1996). To reduce soil loss, widespread
conservation efforts, mainly stone-terrace construc-
tions, are being undertaken in many parts of the region.
However, most of the terraces are broken, largely due to
livestock trampling or runoff, reducing their effective-
ness and even allowing concentrated flow, which un-
expectedly enhances the development of rills and
gullies downstream.
Rainfall in the study area is highly variable both
spatially and temporally. Mean annual rainfall generally
ranges between 200 mm in the lowlands and 800 mm in
the highlands. The coefficient of variation in annual
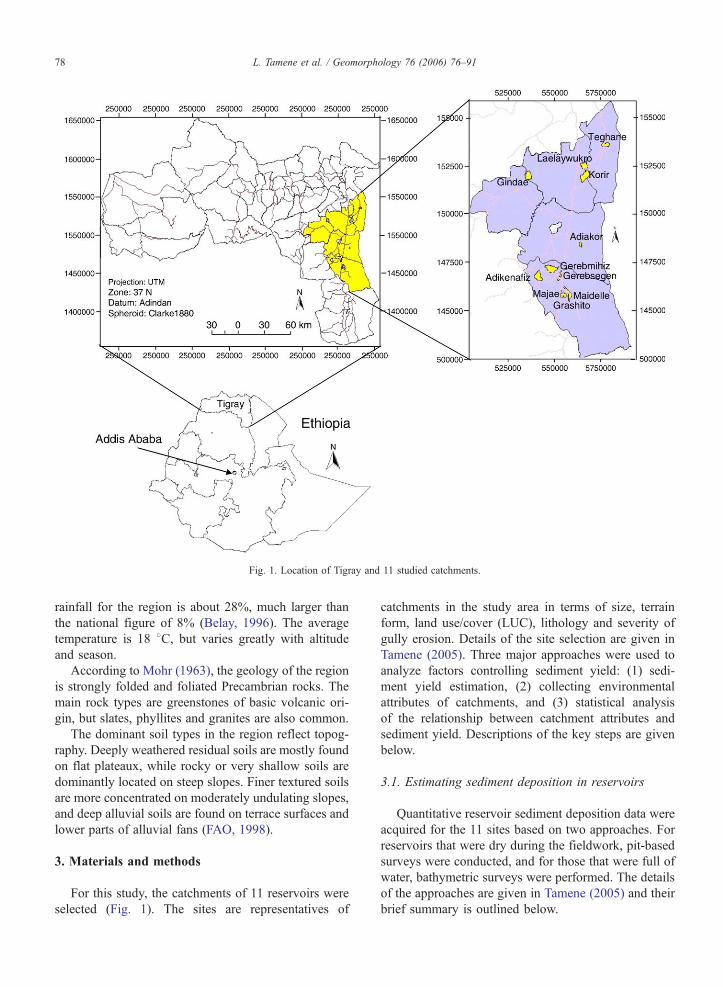
Fig. 1. Location of Tigray and 11 studied catchments.
L. Tamene et al. / Geomorphology 76 (2006) 76–9178
rainfall for the region is about 28%, much larger than
the national figure of 8% (Belay, 1996). The average
temperature is 18 8C, but varies greatly with altitude
and season.
According to Mohr (1963), the geology of the region
is strongly folded and foliated Precambrian rocks. The
main rock types are greenstones of basic volcanic ori-
gin, but slates, phyllites and granites are also common.
The dominant soil types in the region reflect topog-
raphy. Deeply weathered residual soils are mostly found
on flat plateaux, while rocky or very shallow soils are
dominantly located on steep slopes. Finer textured soils
are more concentrated on moderately undulating slopes,
and deep alluvial soils are found on terrace surfaces and
lower parts of alluvial fans (FAO, 1998).
3. Materials and methods
For this study, the catchments of 11 reservoirs were
selected (Fig. 1). The sites are representatives of
catchments in the study area in terms of size, terrain
form, land use/cover (LUC), lithology and severity of
gully erosion. Details of the site selection are given in
Tamene (2005). Three major approaches were used to
analyze factors controlling sediment yield: (1) sedi-
ment yield estimation, (2) collecting environmental
attributes of catchments, and (3) statistical analysis
of the relationship between catchment attributes and
sediment yield. Descriptions of the key steps are given
below.
3.1. Estimating sediment deposition in reservoirs
Quantitative reservoir sediment deposition data were
acquired for the 11 sites based on two approaches. For
reservoirs that were dry during the fieldwork, pit-based
surveys were conducted, and for those that were full of
water, bathymetric surveys were performed. The details
of the approaches are given in Tamene (2005) and their
brief summary is outlined below.
Fig. 2. Examples of gully erosion in Tigray, northern Ethiopia; (a) gully erosion on a floodplain (about 7–8 m deep and 5–6 m wide), (b) gully
erosion of on a floodplain (6 m deep and 3 m wide), (c) gully bank collapse (about 5–7 m deep and 4–5 m wide), (d) livestock disturbance of gully
banks and floors (2 m deep and 8 m wide). These processes were typically observed in the catchments of the three reservoirs with the highest
sediment yield (see Table 4).
L. Tamene et al. / Geomorphology 76 (2006) 76–91 79
In the pit-based method, spatially distributed pits
were opened on the reservoir floor. The number of
pits for each reservoir varied between 11 and 28
(Table 1) depending on the size of the reservoirs
and the pattern of sediment deposition. Then the
thickness of sediment was measured for each pit.
Table 1
Basic reservoir characteristics used to estimate sediment yield in Tigray, no
Site no. Site name RA (ha) C (106 m3) NPL (m
1 Adiakor 1.4 0.51 n.a.
2 Adikenafiz 12.4 0.67 650,00
3 Gerebmihiz 15.4 1.30 719,27
4 Gerebsegen 1.7 0.34 n.a.
5 Gindae 7.6 0.79 530,00
6 Grashito 8.6 0.17 142,20
7 Korir 18.1 2.00 1,980,0
8 Laelaywukro 7.1 0.85 601,67
9 Maidelle 16.6 1.58 1,583,1
10 Majae 1.0 0.30 n.a.
11 Teghane 19.6 1.80 898,19
RA=reservoir area; C =gross reservoir capacity; NPL=normal pool level (l
Y=age of reservoir, TE=trap efficiency; PO=the number of points surv
approaches and about 15% SSY variability was observed between the twoa Pit-based approach.b Bathymetric-based approach.
Next, Thiessen polygon interpolation was used to
estimate the barea of influenceQ of each pit (Goo-
vaerts, 2000). The volume (m3) of sediment trapped
in each polygon was calculated by multiplying sed-
iment thickness/pit depth (m) by the area of each
polygon (m2). The volume in each polygon was then
rthern Ethiopia
3) A (km2) Y (Years) TE (%) PO (Count)
2.8 5 97 11a
0 14.0 6 91 1169b
8 19.5 6 93 910b
4.0 3 95 15a
0 12.8 5 93 15a
0 5.6 5 86 21a (642)b
00 18.6 8 96 763b
8 10.0 6 95 782b
00 8.7 5 97 28a (857)b
2.8 5 96 17a
0 7.0 7 97 1294b
ive storage capacity, with n.a. data not available); A=catchment area;
eyed. Grashito and Maidelle reservoirs were surveyed using both
techniques (Tamene, 2005).
L. Tamene et al. / Geomorphology 76 (2006) 76–9180
summed to estimate the total volume of sediment
trapped in each reservoir.
In the bathymetric survey, the original reservoir ca-
pacity was compared with the current capacity. Infor-
mation on the original capacities of the reservoirs was
acquired from the Tigray Bureau of Water Resources. To
derive existing storage capacity, the depths from the
water surface to the top of the sediment were measured
at more than 600 locations for each reservoir (Table 1)
using a small motorboat with a depth counter and a
global positioning system (GPS). These data were
used to create bathymetric maps and derive existing
storage capacity of reservoirs using Surfer Software.
The original and current storage capacities of each
reservoir were then compared and their differences
gave the volume of sediment deposition (m3).
The measured sediment volume (m3) was converted
to the sediment mass (ton) using representative dry-
bulk density (e.g., Butcher et al., 1993; Verstraeten and
Poesen, 2001b) acquired from the dry-bed reservoirs. In
addition, the weight of deposited sediment was adjusted
for the reservoir trap efficiency (TE; %) calculated
based on Brown (1943) and Verstraeten and Poesen
(2000), which is given as:
TE ¼ 100 1� 1
1þ 0:0021D CA
!ð1Þ
where C is reservoir storage capacity (m3), A is catch-
ment area (km2), and D is a constant ranging from 0.046
to 1 with a mean value of 0.1. Considering the difficulty
of objectively defining a value of D and the scarcity of
data to employ more process-based models, a mean D
value of 0.1 was operationally used in this study.
Finally, total annual sediment yield (SY; t year�1)
and area-specific sediment yield/load (SSY; t km�2
year�1) of reservoirs were calculated based on:
SYp ¼ 100
XPdiATi
� �4dBD
TE4Yð2Þ
SYb ¼ 100SV4dBD
TE4Yð3Þ
SSY ¼ SY
Að4Þ
where SYp and SYb are pit- and bathymetry-based
sediment yields (t year�1), respectively; Pdi is depth
of each pit (m); ATi is area of a Thiessen polygon
around each pit (m2); dBD is dry-bulk density (t
m�3); Y is age of a reservoir (years); and SV is sedi-
ment volume calculated from differences in the storage
capacity of reservoirs (m3).
3.2. Catchment properties
In order to assess factors affecting sediment yield to
the reservoirs, key catchment attributes related to ero-
sion were collected. Contours, streams and spot heights
shown in 1:50,000 topographic maps acquired from the
Ethiopian Mapping Authority (Ethiopian Mapping Au-
thority, 1996) were digitized, and the TOPOGRID tool
of ARC/INFO (Hutchinson, 1989) was used to con-
struct digital elevation models (DEMs) of 10-m cell
size. Major topographic attributes such as the slope,
height difference, relief ratio, and hypsometric integral
were then derived from the DEMs based on their
definitions described in Table 2.
Land use and cover (LUC) maps of the catchments
were derived from 15-m resolution ASTER satellite
images (near infrared bands) acquired in November/
December 2001. Field surveys supported by topographic
maps and GPS as well as aerial photographs were used to
collect training areas for the LUC classification. Then the
maximum likelihood supervised classification algorithm
of IDRISI was employed to derive LUC maps and they
were resampled to a resolution of 10 m to conform to the
cell sizes of the DEMs.
If detailed soil data are unavailable, surface lithology
could serve as a proxy to estimate erodibility potential
(e.g., Evans, 1997; Fargas et al., 1997; Bull et al.,
2003). Shale, marl and limestone are considered to be
more sensitive to erosion than sandstone or metavolca-
nics (e.g., Fargas et al., 1997). Geomorphological and
geological maps (Coltorti et al., undated; Russo et al.,
1996) were digitized to estimate the proportion of such
erodible lithology for each catchment.
Besides the above basic environmental variables of
the catchments, data on gullies, which are prominent
features in the region (e.g., Fig. 2) and substantially
affect erosion/siltation processes, were also collected.
Since it was difficult to acquire quantitative information
on gullies, expert-based rankings were used to drive
semi-qualitative data related to the severity of gully
erosion and bank collapse. Three experts (the first
author and two senior hydrogeology students of
Mekelle University, Ethiopia) individually assessed
the status of gully erosion along a transect in the
field. The number of transects was two to four for
each catchment depending on the size and shape of
catchments. During the survey, information related to
the distribution of gullies and their status such as
dimensions, disturbance by livestock, extent of cultiva-
tion and the degree of bank collapse were collected.
Each expert then assigned a rank of gullying to each
catchment. In order to derive discrete values for statis-
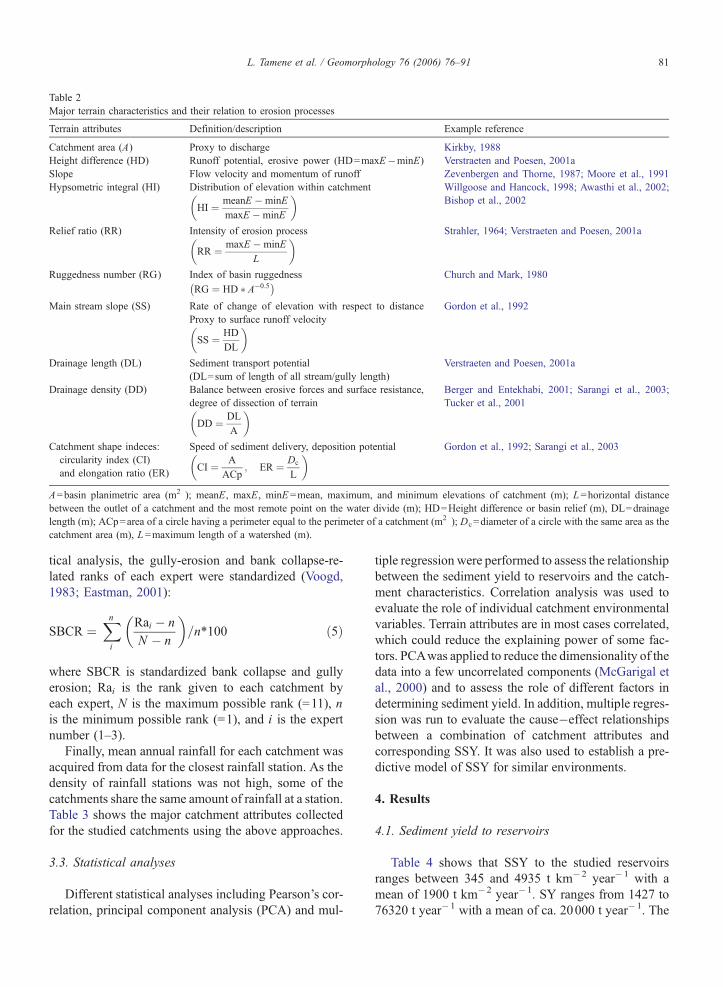
Table 2
Major terrain characteristics and their relation to erosion processes
Terrain attributes Definition/description Example reference
Catchment area (A) Proxy to discharge Kirkby, 1988
Height difference (HD) Runoff potential, erosive power (HD=maxE�minE) Verstraeten and Poesen, 2001a
Slope Flow velocity and momentum of runoff Zevenbergen and Thorne, 1987; Moore et al., 1991
Hypsometric integral (HI) Distribution of elevation within catchment
HI ¼ meanE �minE
maxE �minE
� � Willgoose and Hancock, 1998; Awasthi et al., 2002;
Bishop et al., 2002
Relief ratio (RR) Intensity of erosion process
RR ¼ maxE �minE
L
� � Strahler, 1964; Verstraeten and Poesen, 2001a
Ruggedness number (RG) Index of basin ruggedness
RG ¼ HD � A�0:5� � Church and Mark, 1980
Main stream slope (SS) Rate of change of elevation with respect to distance
Proxy to surface runoff velocity
SS ¼ HD
DL
� �Gordon et al., 1992
Drainage length (DL) Sediment transport potential Verstraeten and Poesen, 2001a
(DL=sum of length of all stream/gully length)
Drainage density (DD) Balance between erosive forces and surface resistance,
degree of dissection of terrain
DD ¼ DL
A
� �Berger and Entekhabi, 2001; Sarangi et al., 2003;
Tucker et al., 2001
Catchment shape indeces:
circularity index (CI)
and elongation ratio (ER)
Speed of sediment delivery, deposition potential
CI ¼ A
ACp; ER ¼ Dc
L
� � Gordon et al., 1992; Sarangi et al., 2003
A=basin planimetric area (m2 ); meanE, maxE, minE =mean, maximum, and minimum elevations of catchment (m); L=horizontal distance
between the outlet of a catchment and the most remote point on the water divide (m); HD=Height difference or basin relief (m), DL=drainage
length (m); ACp=area of a circle having a perimeter equal to the perimeter of a catchment (m2 ); Dc=diameter of a circle with the same area as the
catchment area (m), L=maximum length of a watershed (m).
L. Tamene et al. / Geomorphology 76 (2006) 76–91 81
tical analysis, the gully-erosion and bank collapse-re-
lated ranks of each expert were standardized (Voogd,
1983; Eastman, 2001):
SBCR ¼Xni
Rai � n
N � n
� �=n4100 ð5Þ
where SBCR is standardized bank collapse and gully
erosion; Rai is the rank given to each catchment by
each expert, N is the maximum possible rank (=11), n
is the minimum possible rank (=1), and i is the expert
number (1–3).
Finally, mean annual rainfall for each catchment was
acquired from data for the closest rainfall station. As the
density of rainfall stations was not high, some of the
catchments share the same amount of rainfall at a station.
Table 3 shows the major catchment attributes collected
for the studied catchments using the above approaches.
3.3. Statistical analyses
Different statistical analyses including Pearson’s cor-
relation, principal component analysis (PCA) and mul-
tiple regression were performed to assess the relationship
between the sediment yield to reservoirs and the catch-
ment characteristics. Correlation analysis was used to
evaluate the role of individual catchment environmental
variables. Terrain attributes are in most cases correlated,
which could reduce the explaining power of some fac-
tors. PCAwas applied to reduce the dimensionality of the
data into a few uncorrelated components (McGarigal et
al., 2000) and to assess the role of different factors in
determining sediment yield. In addition, multiple regres-
sion was run to evaluate the cause�effect relationshipsbetween a combination of catchment attributes and
corresponding SSY. It was also used to establish a pre-
dictive model of SSY for similar environments.
4. Results
4.1. Sediment yield to reservoirs
Table 4 shows that SSY to the studied reservoirs
ranges between 345 and 4935 t km�2 year�1 with a
mean of 1900 t km�2 year�1. SY ranges from 1427 to
76320 t year�1 with a mean of ca. 20000 t year�1. The
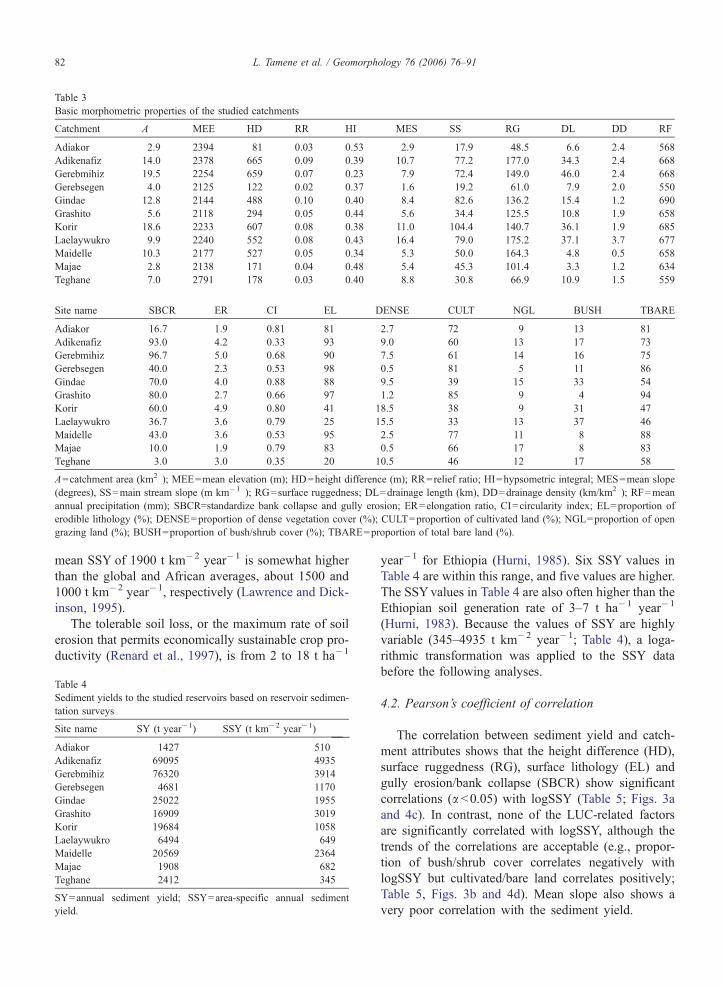
Table 3
Basic morphometric properties of the studied catchments
Catchment A MEE HD RR HI MES SS RG DL DD RF
Adiakor 2.9 2394 81 0.03 0.53 2.9 17.9 48.5 6.6 2.4 568
Adikenafiz 14.0 2378 665 0.09 0.39 10.7 77.2 177.0 34.3 2.4 668
Gerebmihiz 19.5 2254 659 0.07 0.23 7.9 72.4 149.0 46.0 2.4 668
Gerebsegen 4.0 2125 122 0.02 0.37 1.6 19.2 61.0 7.9 2.0 550
Gindae 12.8 2144 488 0.10 0.40 8.4 82.6 136.2 15.4 1.2 690
Grashito 5.6 2118 294 0.05 0.44 5.6 34.4 125.5 10.8 1.9 658
Korir 18.6 2233 607 0.08 0.38 11.0 104.4 140.7 36.1 1.9 685
Laelaywukro 9.9 2240 552 0.08 0.43 16.4 79.0 175.2 37.1 3.7 677
Maidelle 10.3 2177 527 0.05 0.34 5.3 50.0 164.3 4.8 0.5 658
Majae 2.8 2138 171 0.04 0.48 5.4 45.3 101.4 3.3 1.2 634
Teghane 7.0 2791 178 0.03 0.40 8.8 30.8 66.9 10.9 1.5 559
Site name SBCR ER CI EL DENSE CULT NGL BUSH TBARE
Adiakor 16.7 1.9 0.81 81 2.7 72 9 13 81
Adikenafiz 93.0 4.2 0.33 93 9.0 60 13 17 73
Gerebmihiz 96.7 5.0 0.68 90 7.5 61 14 16 75
Gerebsegen 40.0 2.3 0.53 98 0.5 81 5 11 86
Gindae 70.0 4.0 0.88 88 9.5 39 15 33 54
Grashito 80.0 2.7 0.66 97 1.2 85 9 4 94
Korir 60.0 4.9 0.80 41 18.5 38 9 31 47
Laelaywukro 36.7 3.6 0.79 25 15.5 33 13 37 46
Maidelle 43.0 3.6 0.53 95 2.5 77 11 8 88
Majae 10.0 1.9 0.79 83 0.5 66 17 8 83
Teghane 3.0 3.0 0.35 20 10.5 46 12 17 58
A=catchment area (km2 ); MEE=mean elevation (m); HD=height difference (m); RR=relief ratio; HI=hypsometric integral; MES=mean slope
(degrees), SS=main stream slope (m km�1 ); RG=surface ruggedness; DL=drainage length (km), DD=drainage density (km/km2 ); RF=mean
annual precipitation (mm); SBCR=standardize bank collapse and gully erosion; ER=elongation ratio, CI=circularity index; EL=proportion of
erodible lithology (%); DENSE=proportion of dense vegetation cover (%); CULT=proportion of cultivated land (%); NGL=proportion of open
grazing land (%); BUSH=proportion of bush/shrub cover (%); TBARE=proportion of total bare land (%).
L. Tamene et al. / Geomorphology 76 (2006) 76–9182
mean SSY of 1900 t km�2 year�1 is somewhat higher
than the global and African averages, about 1500 and
1000 t km�2 year�1, respectively (Lawrence and Dick-
inson, 1995).
The tolerable soil loss, or the maximum rate of soil
erosion that permits economically sustainable crop pro-
ductivity (Renard et al., 1997), is from 2 to 18 t ha�1
Table 4
Sediment yields to the studied reservoirs based on reservoir sedimen-
tation surveys
Site name SY (t year�1) SSY (t km�2 year�1)
Adiakor 1427 510
Adikenafiz 69095 4935
Gerebmihiz 76320 3914
Gerebsegen 4681 1170
Gindae 25022 1955
Grashito 16909 3019
Korir 19684 1058
Laelaywukro 6494 649
Maidelle 20569 2364
Majae 1908 682
Teghane 2412 345
SY=annual sediment yield; SSY=area-specific annual sediment
yield.
year�1 for Ethiopia (Hurni, 1985). Six SSY values in
Table 4 are within this range, and five values are higher.
The SSYvalues in Table 4 are also often higher than the
Ethiopian soil generation rate of 3–7 t ha�1 year�1
(Hurni, 1983). Because the values of SSY are highly
variable (345–4935 t km�2 year�1; Table 4), a loga-
rithmic transformation was applied to the SSY data
before the following analyses.
4.2. Pearson’s coefficient of correlation
The correlation between sediment yield and catch-
ment attributes shows that the height difference (HD),
surface ruggedness (RG), surface lithology (EL) and
gully erosion/bank collapse (SBCR) show significant
correlations (a b0.05) with logSSY (Table 5; Figs. 3a
and 4c). In contrast, none of the LUC-related factors
are significantly correlated with logSSY, although the
trends of the correlations are acceptable (e.g., propor-
tion of bush/shrub cover correlates negatively with
logSSY but cultivated/bare land correlates positively;
Table 5, Figs. 3b and 4d). Mean slope also shows a
very poor correlation with the sediment yield.
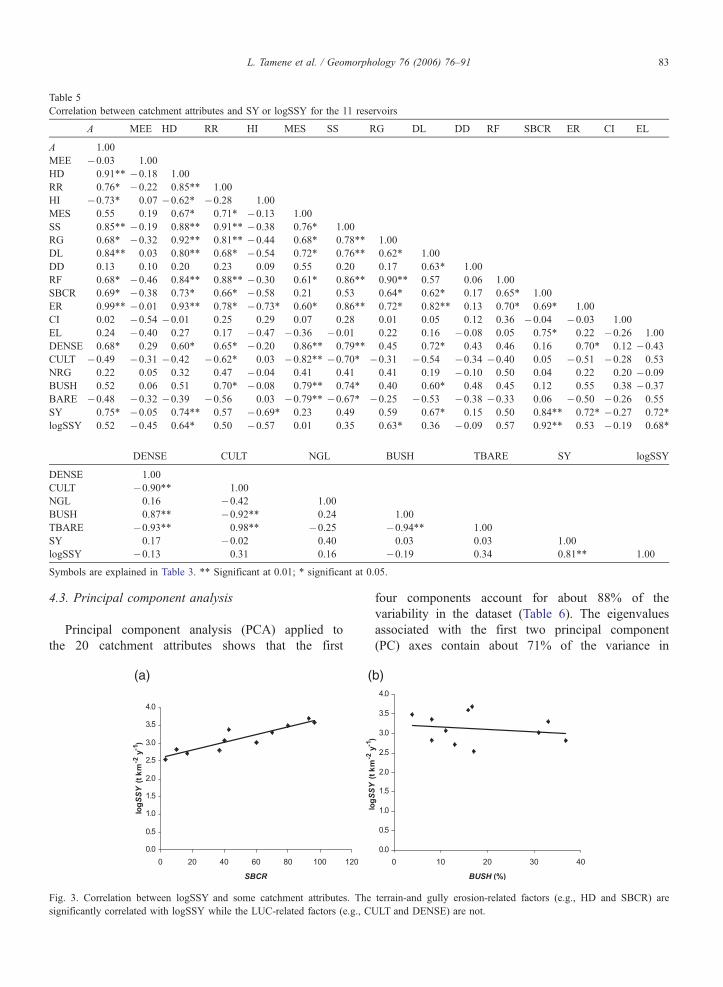
Table 5
Correlation between catchment attributes and SY or logSSY for the 11 reservoirs
A MEE HD RR HI MES SS RG DL DD RF SBCR ER CI EL
A 1.00
MEE �0.03 1.00
HD 0.91** �0.18 1.00
RR 0.76* �0.22 0.85** 1.00
HI �0.73* 0.07 �0.62* �0.28 1.00
MES 0.55 0.19 0.67* 0.71* �0.13 1.00
SS 0.85** �0.19 0.88** 0.91** �0.38 0.76* 1.00
RG 0.68* �0.32 0.92** 0.81** �0.44 0.68* 0.78** 1.00
DL 0.84** 0.03 0.80** 0.68* �0.54 0.72* 0.76** 0.62* 1.00
DD 0.13 0.10 0.20 0.23 0.09 0.55 0.20 0.17 0.63* 1.00
RF 0.68* �0.46 0.84** 0.88** �0.30 0.61* 0.86** 0.90** 0.57 0.06 1.00
SBCR 0.69* �0.38 0.73* 0.66* �0.58 0.21 0.53 0.64* 0.62* 0.17 0.65* 1.00
ER 0.99** �0.01 0.93** 0.78* �0.73* 0.60* 0.86** 0.72* 0.82** 0.13 0.70* 0.69* 1.00
CI 0.02 �0.54 �0.01 0.25 0.29 0.07 0.28 0.01 0.05 0.12 0.36 �0.04 �0.03 1.00
EL 0.24 �0.40 0.27 0.17 �0.47 �0.36 �0.01 0.22 0.16 �0.08 0.05 0.75* 0.22 �0.26 1.00
DENSE 0.68* 0.29 0.60* 0.65* �0.20 0.86** 0.79** 0.45 0.72* 0.43 0.46 0.16 0.70* 0.12 �0.43CULT �0.49 �0.31 �0.42 �0.62* 0.03 �0.82** �0.70* �0.31 �0.54 �0.34 �0.40 0.05 �0.51 �0.28 0.53
NRG 0.22 0.05 0.32 0.47 �0.04 0.41 0.41 0.41 0.19 �0.10 0.50 0.04 0.22 0.20 �0.09BUSH 0.52 0.06 0.51 0.70* �0.08 0.79** 0.74* 0.40 0.60* 0.48 0.45 0.12 0.55 0.38 �0.37BARE �0.48 �0.32 �0.39 �0.56 0.03 �0.79** �0.67* �0.25 �0.53 �0.38 �0.33 0.06 �0.50 �0.26 0.55
SY 0.75* �0.05 0.74** 0.57 �0.69* 0.23 0.49 0.59 0.67* 0.15 0.50 0.84** 0.72* �0.27 0.72*
logSSY 0.52 �0.45 0.64* 0.50 �0.57 0.01 0.35 0.63* 0.36 �0.09 0.57 0.92** 0.53 �0.19 0.68*
DENSE CULT NGL BUSH TBARE SY logSSY
DENSE 1.00
CULT �0.90** 1.00
NGL 0.16 �0.42 1.00
BUSH 0.87** �0.92** 0.24 1.00
TBARE �0.93** 0.98** �0.25 �0.94** 1.00
SY 0.17 �0.02 0.40 0.03 0.03 1.00
logSSY �0.13 0.31 0.16 �0.19 0.34 0.81** 1.00
Symbols are explained in Table 3. ** Significant at 0.01; * significant at 0.05.
L. Tamene et al. / Geomorphology 76 (2006) 76–91 83
4.3. Principal component analysis
Principal component analysis (PCA) applied to
the 20 catchment attributes shows that the first
(a) (
0.0
0.5
1.0
1.5
2.0
2.5
3.0
3.5
4.0
SBCR
logSSY
(t
km
-2 y
-1)
-2-1
0 4020 60 80 100 120
Fig. 3. Correlation between logSSY and some catchment attributes. The
significantly correlated with logSSY while the LUC-related factors (e.g., C
four components account for about 88% of the
variability in the dataset (Table 6). The eigenvalues
associated with the first two principal component
(PC) axes contain about 71% of the variance in
b)
logSSY
(t
km
y)
0.0
0.5
1.0
1.5
2.0
2.5
3.0
3.5
4.0
0 10 20 30 40
BUSH (%)
terrain-and gully erosion-related factors (e.g., HD and SBCR) are
ULT and DENSE) are not.
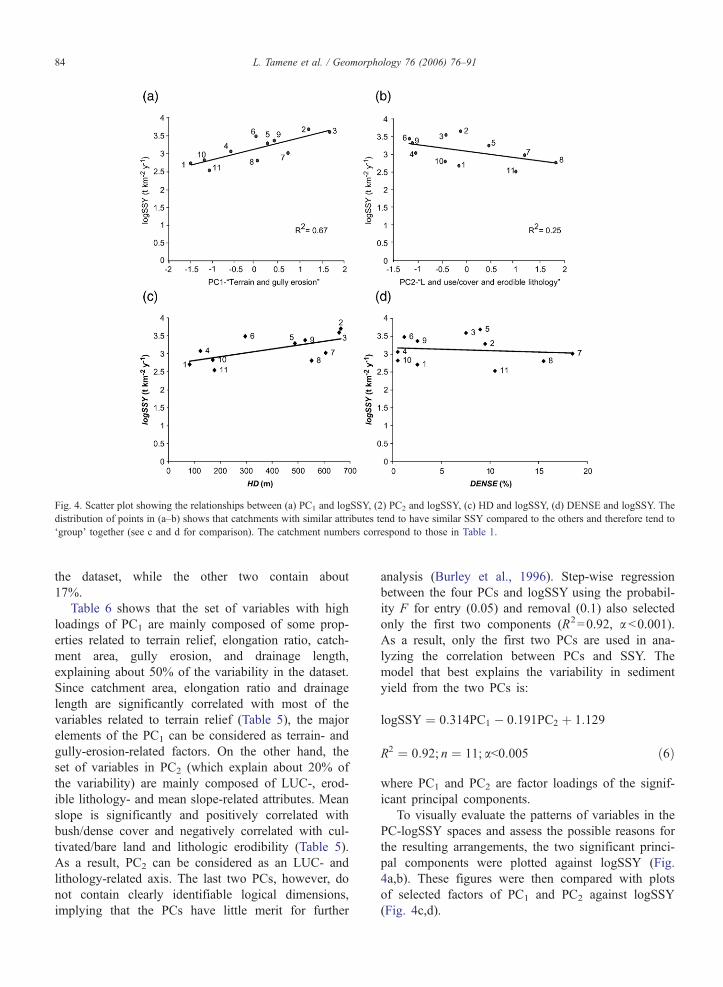
Fig. 4. Scatter plot showing the relationships between (a) PC1 and logSSY, (2) PC2 and logSSY, (c) HD and logSSY, (d) DENSE and logSSY. The
distribution of points in (a–b) shows that catchments with similar attributes tend to have similar SSY compared to the others and therefore tend to
dgroupT together (see c and d for comparison). The catchment numbers correspond to those in Table 1.
L. Tamene et al. / Geomorphology 76 (2006) 76–9184
the dataset, while the other two contain about
17%.
Table 6 shows that the set of variables with high
loadings of PC1 are mainly composed of some prop-
erties related to terrain relief, elongation ratio, catch-
ment area, gully erosion, and drainage length,
explaining about 50% of the variability in the dataset.
Since catchment area, elongation ratio and drainage
length are significantly correlated with most of the
variables related to terrain relief (Table 5), the major
elements of the PC1 can be considered as terrain- and
gully-erosion-related factors. On the other hand, the
set of variables in PC2 (which explain about 20% of
the variability) are mainly composed of LUC-, erod-
ible lithology- and mean slope-related attributes. Mean
slope is significantly and positively correlated with
bush/dense cover and negatively correlated with cul-
tivated/bare land and lithologic erodibility (Table 5).
As a result, PC2 can be considered as an LUC- and
lithology-related axis. The last two PCs, however, do
not contain clearly identifiable logical dimensions,
implying that the PCs have little merit for further
analysis (Burley et al., 1996). Step-wise regression
between the four PCs and logSSY using the probabil-
ity F for entry (0.05) and removal (0.1) also selected
only the first two components (R2=0.92, a b0.001).As a result, only the first two PCs are used in ana-
lyzing the correlation between PCs and SSY. The
model that best explains the variability in sediment
yield from the two PCs is:
logSSY ¼ 0:314PC1 � 0:191PC2 þ 1:129
R2 ¼ 0:92; n ¼ 11; ab0:005 ð6Þ
where PC1 and PC2 are factor loadings of the signif-
icant principal components.
To visually evaluate the patterns of variables in the
PC-logSSY spaces and assess the possible reasons for
the resulting arrangements, the two significant princi-
pal components were plotted against logSSY (Fig.
4a,b). These figures were then compared with plots
of selected factors of PC1 and PC2 against logSSY
(Fig. 4c,d).
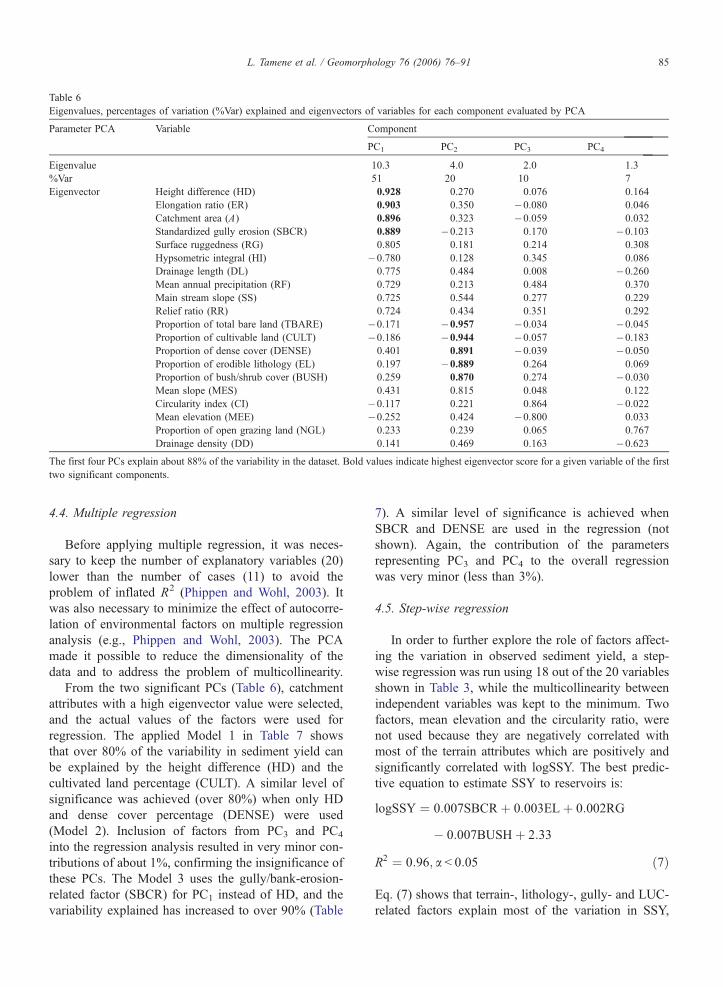
Table 6
Eigenvalues, percentages of variation (%Var) explained and eigenvectors of variables for each component evaluated by PCA
Parameter PCA Variable Component
PC1 PC2 PC3 PC4
Eigenvalue 10.3 4.0 2.0 1.3
%Var 51 20 10 7
Eigenvector Height difference (HD) 0.928 0.270 0.076 0.164
Elongation ratio (ER) 0.903 0.350 �0.080 0.046
Catchment area (A) 0.896 0.323 �0.059 0.032
Standardized gully erosion (SBCR) 0.889 �0.213 0.170 �0.103Surface ruggedness (RG) 0.805 0.181 0.214 0.308
Hypsometric integral (HI) �0.780 0.128 0.345 0.086
Drainage length (DL) 0.775 0.484 0.008 �0.260Mean annual precipitation (RF) 0.729 0.213 0.484 0.370
Main stream slope (SS) 0.725 0.544 0.277 0.229
Relief ratio (RR) 0.724 0.434 0.351 0.292
Proportion of total bare land (TBARE) �0.171 �0.957 �0.034 �0.045Proportion of cultivable land (CULT) �0.186 �0.944 �0.057 �0.183Proportion of dense cover (DENSE) 0.401 0.891 �0.039 �0.050Proportion of erodible lithology (EL) 0.197 �0.889 0.264 0.069
Proportion of bush/shrub cover (BUSH) 0.259 0.870 0.274 �0.030Mean slope (MES) 0.431 0.815 0.048 0.122
Circularity index (CI) �0.117 0.221 0.864 �0.022Mean elevation (MEE) �0.252 0.424 �0.800 0.033
Proportion of open grazing land (NGL) 0.233 0.239 0.065 0.767
Drainage density (DD) 0.141 0.469 0.163 �0.623The first four PCs explain about 88% of the variability in the dataset. Bold values indicate highest eigenvector score for a given variable of the first
two significant components.
L. Tamene et al. / Geomorphology 76 (2006) 76–91 85
4.4. Multiple regression
Before applying multiple regression, it was neces-
sary to keep the number of explanatory variables (20)
lower than the number of cases (11) to avoid the
problem of inflated R2 (Phippen and Wohl, 2003). It
was also necessary to minimize the effect of autocorre-
lation of environmental factors on multiple regression
analysis (e.g., Phippen and Wohl, 2003). The PCA
made it possible to reduce the dimensionality of the
data and to address the problem of multicollinearity.
From the two significant PCs (Table 6), catchment
attributes with a high eigenvector value were selected,
and the actual values of the factors were used for
regression. The applied Model 1 in Table 7 shows
that over 80% of the variability in sediment yield can
be explained by the height difference (HD) and the
cultivated land percentage (CULT). A similar level of
significance was achieved (over 80%) when only HD
and dense cover percentage (DENSE) were used
(Model 2). Inclusion of factors from PC3 and PC4
into the regression analysis resulted in very minor con-
tributions of about 1%, confirming the insignificance of
these PCs. The Model 3 uses the gully/bank-erosion-
related factor (SBCR) for PC1 instead of HD, and the
variability explained has increased to over 90% (Table
7). A similar level of significance is achieved when
SBCR and DENSE are used in the regression (not
shown). Again, the contribution of the parameters
representing PC3 and PC4 to the overall regression
was very minor (less than 3%).
4.5. Step-wise regression
In order to further explore the role of factors affect-
ing the variation in observed sediment yield, a step-
wise regression was run using 18 out of the 20 variables
shown in Table 3, while the multicollinearity between
independent variables was kept to the minimum. Two
factors, mean elevation and the circularity ratio, were
not used because they are negatively correlated with
most of the terrain attributes which are positively and
significantly correlated with logSSY. The best predic-
tive equation to estimate SSY to reservoirs is:
logSSY ¼ 0:007SBCRþ 0:003ELþ 0:002RG
� 0:007BUSHþ 2:33
R2 ¼ 0:96; a b 0:05 ð7Þ
Eq. (7) shows that terrain-, lithology-, gully- and LUC-
related factors explain most of the variation in SSY,
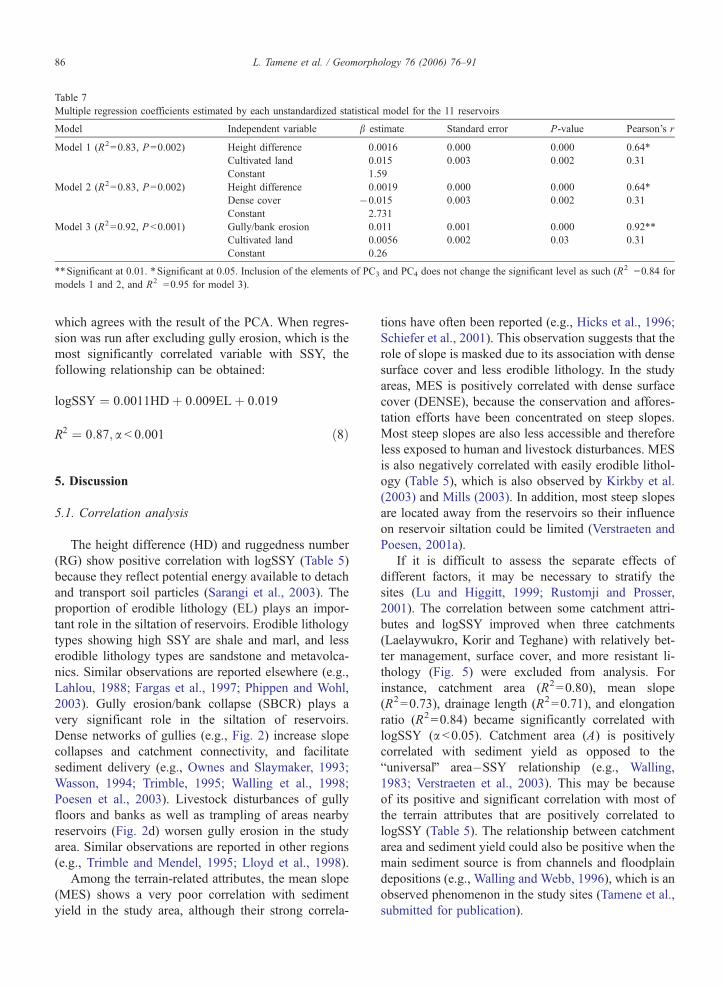
Table 7
Multiple regression coefficients estimated by each unstandardized statistical model for the 11 reservoirs
Model Independent variable b estimate Standard error P-value Pearson’s r
Model 1 (R2=0.83, P=0.002) Height difference 0.0016 0.000 0.000 0.64*
Cultivated land 0.015 0.003 0.002 0.31
Constant 1.59
Model 2 (R2=0.83, P=0.002) Height difference 0.0019 0.000 0.000 0.64*
Dense cover �0.015 0.003 0.002 0.31
Constant 2.731
Model 3 (R2=0.92, P b0.001) Gully/bank erosion 0.011 0.001 0.000 0.92**
Cultivated land 0.0056 0.002 0.03 0.31
Constant 0.26
**Significant at 0.01. *Significant at 0.05. Inclusion of the elements of PC3 and PC4 does not change the significant level as such (R2 =0.84 for
models 1 and 2, and R2 =0.95 for model 3).
L. Tamene et al. / Geomorphology 76 (2006) 76–9186
which agrees with the result of the PCA. When regres-
sion was run after excluding gully erosion, which is the
most significantly correlated variable with SSY, the
following relationship can be obtained:
logSSY ¼ 0:0011HDþ 0:009ELþ 0:019
R2 ¼ 0:87; a b 0:001 ð8Þ
5. Discussion
5.1. Correlation analysis
The height difference (HD) and ruggedness number
(RG) show positive correlation with logSSY (Table 5)
because they reflect potential energy available to detach
and transport soil particles (Sarangi et al., 2003). The
proportion of erodible lithology (EL) plays an impor-
tant role in the siltation of reservoirs. Erodible lithology
types showing high SSY are shale and marl, and less
erodible lithology types are sandstone and metavolca-
nics. Similar observations are reported elsewhere (e.g.,
Lahlou, 1988; Fargas et al., 1997; Phippen and Wohl,
2003). Gully erosion/bank collapse (SBCR) plays a
very significant role in the siltation of reservoirs.
Dense networks of gullies (e.g., Fig. 2) increase slope
collapses and catchment connectivity, and facilitate
sediment delivery (e.g., Ownes and Slaymaker, 1993;
Wasson, 1994; Trimble, 1995; Walling et al., 1998;
Poesen et al., 2003). Livestock disturbances of gully
floors and banks as well as trampling of areas nearby
reservoirs (Fig. 2d) worsen gully erosion in the study
area. Similar observations are reported in other regions
(e.g., Trimble and Mendel, 1995; Lloyd et al., 1998).
Among the terrain-related attributes, the mean slope
(MES) shows a very poor correlation with sediment
yield in the study area, although their strong correla-
tions have often been reported (e.g., Hicks et al., 1996;
Schiefer et al., 2001). This observation suggests that the
role of slope is masked due to its association with dense
surface cover and less erodible lithology. In the study
areas, MES is positively correlated with dense surface
cover (DENSE), because the conservation and affores-
tation efforts have been concentrated on steep slopes.
Most steep slopes are also less accessible and therefore
less exposed to human and livestock disturbances. MES
is also negatively correlated with easily erodible lithol-
ogy (Table 5), which is also observed by Kirkby et al.
(2003) and Mills (2003). In addition, most steep slopes
are located away from the reservoirs so their influence
on reservoir siltation could be limited (Verstraeten and
Poesen, 2001a).
If it is difficult to assess the separate effects of
different factors, it may be necessary to stratify the
sites (Lu and Higgitt, 1999; Rustomji and Prosser,
2001). The correlation between some catchment attri-
butes and logSSY improved when three catchments
(Laelaywukro, Korir and Teghane) with relatively bet-
ter management, surface cover, and more resistant li-
thology (Fig. 5) were excluded from analysis. For
instance, catchment area (R2=0.80), mean slope
(R2=0.73), drainage length (R2=0.71), and elongation
ratio (R2=0.84) became significantly correlated with
logSSY (a b0.05). Catchment area (A) is positively
correlated with sediment yield as opposed to the
buniversalQ area�SSY relationship (e.g., Walling,
1983; Verstraeten et al., 2003). This may be because
of its positive and significant correlation with most of
the terrain attributes that are positively correlated to
logSSY (Table 5). The relationship between catchment
area and sediment yield could also be positive when the
main sediment source is from channels and floodplain
depositions (e.g., Walling and Webb, 1996), which is an
observed phenomenon in the study sites (Tamene et al.,
submitted for publication).
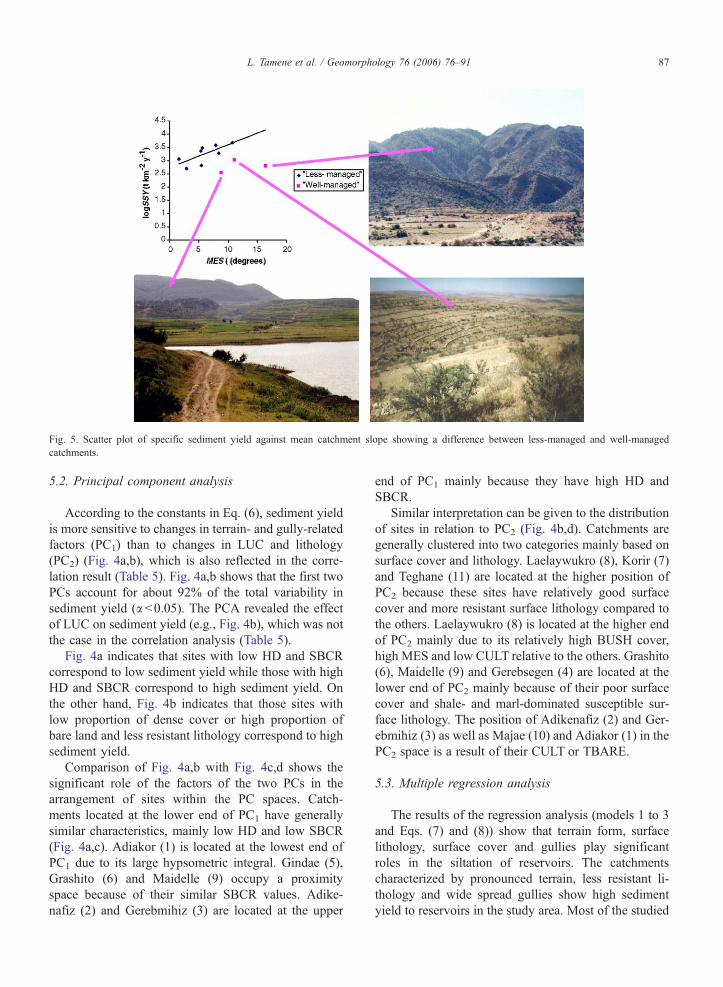
Fig. 5. Scatter plot of specific sediment yield against mean catchment slope showing a difference between less-managed and well-managed
catchments.
L. Tamene et al. / Geomorphology 76 (2006) 76–91 87
5.2. Principal component analysis
According to the constants in Eq. (6), sediment yield
is more sensitive to changes in terrain- and gully-related
factors (PC1) than to changes in LUC and lithology
(PC2) (Fig. 4a,b), which is also reflected in the corre-
lation result (Table 5). Fig. 4a,b shows that the first two
PCs account for about 92% of the total variability in
sediment yield (a b0.05). The PCA revealed the effect
of LUC on sediment yield (e.g., Fig. 4b), which was not
the case in the correlation analysis (Table 5).
Fig. 4a indicates that sites with low HD and SBCR
correspond to low sediment yield while those with high
HD and SBCR correspond to high sediment yield. On
the other hand, Fig. 4b indicates that those sites with
low proportion of dense cover or high proportion of
bare land and less resistant lithology correspond to high
sediment yield.
Comparison of Fig. 4a,b with Fig. 4c,d shows the
significant role of the factors of the two PCs in the
arrangement of sites within the PC spaces. Catch-
ments located at the lower end of PC1 have generally
similar characteristics, mainly low HD and low SBCR
(Fig. 4a,c). Adiakor (1) is located at the lowest end of
PC1 due to its large hypsometric integral. Gindae (5),
Grashito (6) and Maidelle (9) occupy a proximity
space because of their similar SBCR values. Adike-
nafiz (2) and Gerebmihiz (3) are located at the upper
end of PC1 mainly because they have high HD and
SBCR.
Similar interpretation can be given to the distribution
of sites in relation to PC2 (Fig. 4b,d). Catchments are
generally clustered into two categories mainly based on
surface cover and lithology. Laelaywukro (8), Korir (7)
and Teghane (11) are located at the higher position of
PC2 because these sites have relatively good surface
cover and more resistant surface lithology compared to
the others. Laelaywukro (8) is located at the higher end
of PC2 mainly due to its relatively high BUSH cover,
high MES and low CULT relative to the others. Grashito
(6), Maidelle (9) and Gerebsegen (4) are located at the
lower end of PC2 mainly because of their poor surface
cover and shale- and marl-dominated susceptible sur-
face lithology. The position of Adikenafiz (2) and Ger-
ebmihiz (3) as well as Majae (10) and Adiakor (1) in the
PC2 space is a result of their CULT or TBARE.
5.3. Multiple regression analysis
The results of the regression analysis (models 1 to 3
and Eqs. (7) and (8)) show that terrain form, surface
lithology, surface cover and gullies play significant
roles in the siltation of reservoirs. The catchments
characterized by pronounced terrain, less resistant li-
thology and wide spread gullies show high sediment
yield to reservoirs in the study area. Most of the studied
L. Tamene et al. / Geomorphology 76 (2006) 76–9188
catchments are characterized by rugged terrain in their
upslopes and predominantly cultivated land or bare
grazing areas in their lower slopes. The high HD accel-
erates flow energy, and the poor surface cover offers the
minimum protection. As a result, most of the flood-
plains are being eroded contributing sediment genera-
tion and enhancing efficient transport of sediment from
upslopes.
The main purpose of multiple regression analysis is
to assess the relationship between several independent
or predictor variables and a dependent variable. Once
the relationships are established, the equations can be
used to predict the status of a dependent variable in
relation to the independent variables. The equations
presented in Table 7 and Eq. (7) or Eq. (8), for example,
can be used to predict SSY of other similar catchments.
However, detailed analysis for a larger number of sites
will be required to establish a robust prediction model
of annual sediment yield.
5.4. Sediment yield controlling factors and
management implications
Based on the rate of sediment deposition (Table 4)
and the reservoir live storage capacity shown in Table 1,
most of the reservoirs will be filled with sediment within
less than 50% of their intended service time. For in-
stance, the Adikenafiz, Gerebmihiz and Grashito reser-
voirs have lost over 40% of their live storage capacity
within about 25% of their expected service time. The
above two and the Gindae and Maidelle reservoirs have
also lost more than 100% of their dead storage capacity
in less than a quarter of their expected life time. There-
fore the planned food security improvement scheme will
be under threat unless relevant preventive measures are
put in place.
The benefits of proper catchment management and
conservation can be demonstrated by Fig. 5. Three
reservoirs with comparatively proper catchment man-
agement and conservation (pink symbols in the upper
left graph) show relatively low sediment deposition
despite high terrain potential for erosion.
This study shows that terrain-from, surface lithology,
gullies and LUC play significant roles in determining
SSY variability, and gully erosion may be the most
important. The four catchments with high SSY have a
very high problem of gully erosion, whereas three
catchments with low SSY have very limited evidences
of gully erosion. Shibru et al. (2003) also shows that
gullies alone produced an annual soil loss rate of 25 t
ha�1 year�1 in eastern Ethiopia. Therefore, attention
needs to be paid to the rehabilitation/stabilization of
gullies and their banks, and prevent their destabilization
due to livestock trampling, although soil loss assess-
ment programs only infrequently take account of the
contribution of gully erosion (e.g., Liggitt and Fincham,
1989; Poesen et al., 2003). The location of reservoirs
should also be carefully determined to avoid severe
siltation. Reservoirs are often located at the confluences
of a few streams to efficiently collect water. However, if
one of the streams is characterized by heavy gullying, it
may lead to a higher risk of accelerated siltation.
Because only lumped attributes of catchments were
used in this study, the spatial distribution of the factors
responsible for siltation within each catchment could
not be examined. However, we could specify the terrain
attributes that land managers should focus on to tackle
the rapid sedimentation of the reservoirs. For instance,
covering the upland non-cultivable areas with vegeta-
tion looks effective (Tamene, 2005).
6. Conclusions
Identification of the major causative factors of ero-
sion that accelerate siltation in reservoirs is necessary to
guide targeted management. Against this background,
different statistical analyses were performed to assess the
role of different catchment attributes in the siltation of
reservoirs in the drylands of northern Ethiopia. The
results show that pronounced terrain steepness, easily
detachable slope material, poor surface cover, and
gullies accelerate siltation in the reservoirs. These factors
often co-exist, but the distribution of gullies is the most
influential. Some of the catchments show lower sedi-
ment yields despite their steep terrain because catchment
management practices significantly reduced erosion.
The sedimentary records from depositional environ-
ments such as lakes and reservoirs can be used to
provide information on the past long-term behavior of
a river basin (Foster and Walling, 1994; Owens et al.,
1999). We did not perform such analyses because the
reservoirs studied have ages of less than 10 years.
However, discussion in this study will serve as a useful
benchmark for future studies.
Although this paper has mostly performed quantita-
tive analyses, the semi-qualitative expert-based techni-
ques were employed to determine the severity of gully
erosion. In future work, more detailed, quantitative
assessments of gullies need to be performed.
Acknowledgments
The authors acknowledge the financial support by
DAAD (Germany) and fieldwork support by Mekelle
L. Tamene et al. / Geomorphology 76 (2006) 76–91 89
University (Ethiopia). We thank Hailu Girmay and
Tsehaye Gizaw for their assistance during filed work.
Assefa Abegaz and Kifle W. Aregay are also acknowl-
edged for their technical support, mainly related to the
pit-based survey and lithologic mapping, respectively.
We are grateful for the constructive comments given by
the anonymous reviewers of our paper. We are also very
thankful to Takashi Oguchi for his valuable comments
and suggestions.
References
Awasthi, K.D., Sitaula, B.K., Singh, B.R., Bajacharaya, R.M., 2002.
Land use change in the Nepalese watersheds: GIS and geomor-
phometric analysis. Land Degradation and Development 13,
495–513.
Ayalew, L., 2002. Some thing that we need to know about our
rivers’ hydropower potential. http://www.mediaethiopia.com/
Engineering.htm. Accessed: 12.03.03.
Behailu, M., 2002. Assessment and optimisation of traditional irriga-
tion of vertisols in northern Ethiopia: a case study at Gumselasa
micro-dam using maize as an indicator crop. PhD thesis, Univer-
siteit Gent, Belgium.
Belay, A., 1996. Climatic resources, major agro-ecological zones and
farming systems in Tigray. A Paper Presented in the Extension
Intervention Program Workshop, Mekelle.
Berger, K.P., Entekhabi, D., 2001. Basin hydrologic response in
relation to distributed physiographic descriptors and climate.
Journal of Hydrology 247, 169–182.
Bishop, M.P., Shroder, J.F., Bonk, R., Olsenholler, J., 2002. Geomor-
phic change in high mountains: a western Himalayan perspective.
Global and Planetary Change 32, 311–329.
Brown, C.B., 1943. Discussion on bSedimentation in reservoirs, by J.
WitzigQ. Proceedings of the American Society of Civil Engineers
69, 1493–1500.
Bull, L.J., Kirkby, M.J., Shannon, J., Dunsford, H., 2003. Predicting
Hydrological Response Units (HRUs) in semi-arid environments.
Advanced Communications Model 1, 1–26.
Burley, J.V., Fowler, G., Polakowski, K.J., 1996. Agricultural Pro-
ductivity Model for Reclaiming Surface Mines in Mercer County
http://www.ssc.msu.edu/~laej/researchpapers/Burley2/Burley2
text.html. Accessed: 04.02.04.
Butcher, D.P., Labadz, J.C., Potter, A.W.R., White, P., 1993. Reser-
voir sedimentation rates in the Southern Pennine Region, UK. In:
McManus, J., Duck, R.W. (Eds.), Geomorphology and Sedimen-
tology of Lakes and Reservoirs. Wiley, Chichester, pp. 73–92.
Central Statistical Authority (CSA), 1998. The 1994 Population and
Housing Census of Ethiopia, Results of Tigray Region, Summa-
ry Report. Federal Democratic Republic of Ethiopia, Addis
Ababa.
Church, M., Mark, D.M., 1980. On size and scale in geomorphology.
Progress in Physical Geography 4, 342–390.
Coltorti, M., Pieruccini, P., Berakhi, O., Dramis, F., Asrat, A.,
undated. Geomorphological Map of the Southern Slope of the
Amba Aradom (Tigray, Ethiopia). Earth Science Department,
University of Siena, Italy.
Dearing, J.A., Foster, D.L., 1993. Lake sediments and geomorpho-
logical processes: some thoughts. In: McManus, J., Duck, R.W.
(Eds.), Geomorphology and Sedimentology of Lakes and Reser-
voirs. Wiley, Chichester, pp. 73–92.
De Contenson, H., 1981. Pre-Axumite culture. In: Moktar, G. (Ed.),
General History of Africa II: Ancient Civilization of Africa.
University of California Press, Berkeley, pp. 341–361.
Degefu, W., 1987. Some aspects of meteorological drought in Ethio-
pia. In: Glantz, M.H. (Ed.), Drought and Hunger in Africa. Cam-
bridge University Press.
Eastman, J.R., 2001. IDRISI for Windows, Idrisi32 Release 2. Guide
to GIS and Image Processing, vol. 2. Clark Labs, Clark Univer-
sity, USA.
Ethiopian Mapping Authority, 1996. Ethiopia 1:50,000 topographic
maps. Wukro, Kuha, South Mekelle, Adigudom, Atsbi, Axum,
and Hawzen Sheets.
Evans, M., 1997. Temporal and spatial representativeness of Alpine
sediment yield: Cascade Mountains, British Columbia. Earth Sur-
face Processes and Landforms 22, 287–295.
Eweg, H., Lammeren, V.R., 1996. The Application of a Geographical
Information System at the Rehabilitation of Degraded and
Degrading Areas: A Case Study in the Highlands of Tigray.
Centre for Geographical Information Processing, Agricultural
University of Wageningen, Ethiopia. 79 pp.
FAO, 1986. Highlands Reclamation Study Ethiopia Final Report. Vol.
I and II. Rome.
FAO, 1998. The Soil and Terrain Data Base for North-eastern Africa.
Land and Water Digital Media Series, vol. 2. FAO, Rome.
Fargas, D., Martı́nez-Casasnovas, J.A., Poch, R.M., 1997. Identifica-
tion of critical sediment source areas at regional level. Physics and
Chemistry of the Earth 22, 355–359.
Foster, I.D.L., Walling, D.E., 1994. Using reservoir deposits to re-
construct changing sediment yields and sources in the catchment
of the Old Mill Reservoir, South Devon, UK, over the past 50
years. Hydrological Sciences Journal 39, 347–361.
Gebre-Egziabher, T.B., 1989. The environmental variables which led
to the ecological crisis in Ethiopia. Coenoses 4, 61–67.
Gebre-Hawariat, G., Haile, H., 1999. Reservoir Sedimentation Survey
Conducted on Three Micro Dams in Tigray. CoSAERT Report,
Tigray, Mekelle.
Gebre-Mariam, Z., 1998. Human interactions and water quality in the
Horn of Africa. In: Schoneboom, J. (Ed.), Science in Africa-
Emerging Water Management Problems. American Association
for the Advancement of Science Annual Meeting, Philadelphia,
Pennsylvania, pp. 47–61.
Goovaerts, P., 2000. Performance comparison of geostatistical algo-
rithms for incorporating elevation into mapping of precipitation.
Journal of Hydrology 228, 113–129.
Gordon, N.D., McMahon, T.A., Finlayson, B.L., 1992. Stream
Hydrology: An Introduction for Ecologists. Wiley, New York.
526 pp.
Hadley, R.F., Lal, R., Onstand, C.A., Walling, D.E., Yair, A., 1985.
Recent Developments in Erosion and Sediment Yield Studies.
Technical Documents in Hydrology by the working group of
ICCE on the IHP-II Project. UNESCO, Paris.
Hicks, D.M., Hill, J., Shankar, U., 1996. Variation of suspended
sediment yields around New Zealand: the relative importance of
rainfall and geology. In: Walling, D.E., Webb, B.W. (Eds.), Ero-
sion and Sediment Yield: Global and Regional Perspectives,
IAHS Publication, vol. 236, pp. 149–156.
Hurni, H., 1983. Soil erosion and soil formation in agricultural
ecosystems of Ethiopia and Northern Thailand. Mountain Re-
search and Development 3, 131–142.
Hurni, H., 1985. Erosion-Productivity-Conservation Systems in
Ethiopia. Proceedings of the 4th International Conference on
Soil Conservation, Maracay, Venezuela, pp. 654–674.
L. Tamene et al. / Geomorphology 76 (2006) 76–9190
Hurni, H., 1993. Land degradation, famine, and land resource scenar-
ios in Ethiopia. In: Pimentel, D. (Ed.), World Soil Erosion and
Conservation. Cambridge Univ. Press, pp. 27–61.
Hutchinson, M.F., 1989. A new procedure for gridding elevation and
stream line data with automatic removal of spurious pits. Journal
of Hydrology 106, 211–232.
Kirkby, M.J., 1988. Hillslope runoff process and models. Journal of
Hydrology 100, 315–339.
Kirkby, M.J., Bissonais, Y.L., Coulthard, T.J., Daroussin, J., McMa-
hon, M.D., 2003. The development of land quality indicators for
soil degradation by water erosion. Agriculture, Ecosystems and
Environment 81, 125–135.
Lahlou, A., 1988. The silting of Morocaan dams. In: Bordas,
M.P., Walling, D.E. (Eds.), Sediment Budgets. Proceedings of
the Porte Alegre Symposium, December, IAHS Publ., vol. 174,
pp. 71–77.
Lawrence, P., Dickinson, A., 1995. Soil Erosion and Sediment Yield:
A Review of Sediment Data From Rivers and Reservoirs (Report
prepared under FAO writers’ contract). Overseas Development
Unit HR Wallingford Ltd., England.
Lawrence, P., Cascio, A.L., Goldsmith, P., Abbott, C.L., 2004.
Sedimentation in Small Dams. Development of a Catchment Char-
acterization and Sediment Yield Prediction Procedure. DFID Re-
port. http://www.hrwallingford.co.uk/publications/overseas.html.
Accessed 04.08.04.
Liggitt, B., Fincham, R.J., 1989. Gully erosion-the neglected dimen-
sion in soil-erosion research. South African Journal of Science 85,
18–20.
Lloyd, S., Bishop, P., Reinfelds, I., 1998. Shoreline erosion: a
cautionary note in using small farm dams to determine catch-
ment erosion rates. Earth Surface Processes and Landforms 23,
905–912.
Lu, X.X., Higgitt, D.L., 1999. Sediment yield variability in the Upper
Yangtze, China. Earth Surface Processes and Landforms 24,
1077–1093.
McGarigal, K., Cushman, S., Stafford, S., 2000. Multivariate Statis-
tics for Wildlife and Ecology Research. Springer-Verlag, New
York, Inc., New York, USA.
Mills, H.H., 2003. Inferring erosional resistance of bedrock units in
the east Tennessee mountains from digital elevation data. Geo-
morphology 55, 263–281.
Millward, A.A., Mersey, J.E., 2001. Conservation strategies for ef-
fective land management of protected areas using an erosion
prediction information system (EPIS). Journal of Environmental
Management 61, 329–343.
Mitas, L., Mitasova, H., 1998. Distributed soil erosion simulation
for effective erosion prevention. Water Resources Research 34,
505–516.
Mohr, P., 1963. The Geology of Ethiopia. University College of Addis
Ababa Press. 270 pp.
Moore, I.D., Grayson, R.B., Ladson, A.R., 1991. Digital terrain
analysis modelling: a review of hydrological, geomorpho-
logical, and biological applications. Hydrological Processes 5,
3–30.
Ownes, P., Slaymaker, O., 1993. Lacustrine sediment budgets in the
coast mountains of British Columbia, Canada. In: McManus, J.,
Duck, R.W. (Eds.), Geomorphology and Sedimentology of Lakes
and Rivers. Wiley, Chichester, pp. 105–124.
Owens, P.N., Walling, D.E., Leeks, G.J.L., 1999. Use of floodplain
sediment cores to investigate recent historical changes in overbank
sedimentation rates and sediment sources in the catchment of the
River Ouse, Yorkshire, UK. Catena 36, 21–47.
Phippen, S., Wohl, E., 2003. An assessment of land use and other
factors affecting sediment loads in the Rio Puerco watershed, New
Mexico. Geomorphology 52, 269–287.
Poesen, J., Nachtergaele, J., Verstraeten, G., Valentin, C., 2003. Gully
erosion and environmental change: importance and research
needs. Catena 50, 91–133.
Renard, K.G., Foster, G.R., 1983. Soil conservation: principles of
erosion by water. In: Degne, H.E., Willis, W.O. (Eds.), Dryland
Agriculture, Agronomy Monogr., vol. 23, Crop Sci. Soc. Am., and
Soil Sci. Am. Madison, Wisconsin, pp. 156–176.
Renard, K.G., Foster, G.R., Weesies, G.A., McCool, D.K., and Yoder,
D.C., 1997. Predicting soil erosion by water: a guide to conser-
vation planning with the Revised Universal Soil Loss Equation
(RUSLE). USDA Agricultural Handbook 703.
Russo, A., Fantozzi, P.L., Solomon, T., Getaneh, A., Neri, C., Russo,
F., Asfawosson, A., Peccerillo, A, Valera, P., 1996. Geological
map of the Mekelle outlier (western sheet). Italian Cooperation -
Addis Ababa University, Addis Ababa.
Rustomji, P., Prosser, I., 2001. Spatial patterns of sediment deliv-
ery to valley floors: sensitivity to sediment transport capacity
and hillslope hydrology relations. Hydrological Processes 15,
1003–1018.
Sarangi, A., Madramootoo, C.A., Enright, P., 2003. Development of
user interface in ArcGIS for estimation of watershed geomorphol-
ogy. CASE/SCGR 2003 Meeting, Montreal, Quebec.
Schiefer, E., Slaymaker, O., Klinkenberg, B., 2001. Physiographically
controled allometry of specific sediment yield in the Canadian
Cordillera: a lake sediment based approach. Geografiska Annaler
83, 55–65.
SCRP, 2000. Long-term monitoring of the agricultural environ-
ment in six research stations in Ethiopia. Soil Erosion and
Conservation Database, vol. 7. Soil Conservation Research Proj-
ect, Berne.
Sonneveld, B.J.J.S., Keyzer, M.A., 2003. Land Under Pressure: soil
conservation concerns and opportunities for Ethiopia. Land Deg-
radation and Development 14, 347–361.
Shibru, D., Rieger, W., Strauss, P., 2003. Assessment of gully erosion
using phtotogrammetric techniques in eastern Ethiopia. Catena 50,
273–291.
Strahler, A.N., 1964. Quantitative geomorphology of drainage basins
and channel networks. In: Chow, V.T. (Ed.), Handbook of Applied
Hydrology. McGraw-Hill, New York, pp. 439–476.
Tamene, L. 2005. Reservoir siltation in Ethiopia: causes, sources
areas, and management options. PhD thesis, Ecology and Devel-
opment Series 30, Center for Development Research, University
of Bonn.
Tamene, L., Park, S., Dikau, R., Vlek, P., submitted for publication.
Reservoir sedimentation assessment in the semi-arid highlands of
northern Ethiopia: rate of sediment yield and its relation with
catchment area. Earth Surface Processes and Landforms.
Teshalle, H.W., 2001. Impact assessment of micro-dam irrigation
projects. A case study from Hintalo-Wajirat district of Tigray,
Ethiopia. Unpublished Msc Thesis, Agricultural University of
Norway, Noragric.
Trimble, S.W., 1995. Catchment sediment budgets and change. In:
Gurnell, A., Petts, G. (Eds.), Changing River Channels. Wiley,
Chichester, pp. 201–215.
Trimble, S.W., Mendel, A.C., 1995. The cow as a geomorphic
agent—a critical review. Geomorphology 13, 233–253.
Tucker, G.E., Catani, F., Rinaldo, A., Bras, R.L., 2001. Statistical
analysis of drainage density from digital terrain data. Geomor-
phology 36, 187–202.
L. Tamene et al. / Geomorphology 76 (2006) 76–91 91
Verstraeten, G., Poesen, J., 2000. Estimating trap efficiency of small
reservoirs and ponds: methods and implications for the assessment
of sediment yield. Progress in Physical Geography 24, 219–251.
Verstraeten, G., Poesen, J., 2001. Factors controlling sediment yield
from small intensity cultivated catchments in a temperate humid
climate. Geomorphology 40, 123–144.
Verstraeten, G., Poesen, J., 2001. Variability of dry sediment bulk
density between and within retention ponds and its impact on the
calculation of sediment yields. Earth Surface Processes and Land-
forms 26, 375–394.
Verstraeten, G., Poesen, J., Vente, J.D., Koninckx, X., 2003. Sediment
yield variability in Spain: a quantitative and semi-qualitative
analysis using reservoir sedimentation rates. Geomorphology 50,
327–348.
Voogd, H., 1983. Multi-criteria Evaluations for Urban and Regional
Planning. London Princeton University.
Walling, D.E., 1983. The sediment delivery problem. Journal of
Hydrology 65, 209–237.
Walling, D.E., 1994. Measuring sediment yield from river basins. In:
Lal, R. (Ed.), Soil Erosion Research Methods, 2nd ed. Soil and
Water Conservation Society, Ankeny, IA, pp. 39–80.
Walling, D.E., Webb, B.W., 1996. Erosion and sediment yield: a
global overview. In: Walling, D.E., Webb, B.W. (Eds.), Erosion
and Sediment Yield: Global and Regional Perspectives, IAHS
Publication, vol. 236, pp. 3–19.
Walling, D.E., Owens, P.N., Leeks, G.J.L., 1998. The role of channel
and floodplain storage in the suspended sediment budget of the
River Ouse,Yorkshire, UK. Geomorphology 22, 225–242.
Walling, D.E., Collins, A.L., Sichingabula, H.M., Leeks, G.J.L.,
2001. Integrated assessment of catchment suspended sediment
budgets. Land Degradation and Development 12, 387–415.
Wasson, R.J., 1994. Annual and decadal variation of sediment yield in
Australia and some global comparisions. IAHS Publication 224,
269–279.
Willgoose, G., Hancock, G., 1998. Revisiting the hypsometric curve
as an indicator of form and process in transport-limited catchment.
Earth Surface Processes and Landforms 23, 611–623.
Woldearegay, K., 2001. Surface water harvesting and groundwater
recharge with implications to conjunctive water resource manage-
ment in arid to semi-arid environments (with a model site of the
Mekelle area, northern Ethiopia). Proceedings of the International
Conference on Public Management, Policy and Development,
Addis Ababa, Ethiopia.
Zevenbergen, L.W., Thorne, C.R., 1987. Quantitative analysis of land
surface topography. Earth Surface Processes and Landforms 12,
47–56.
Related Documents

![11.[7 17]determinants of adoption and labour intensity of stone-terraces in eastern highlands of ethiopia](https://static.cupdf.com/doc/110x72/546c184bb4af9f7a2c8b4f77/117-17determinants-of-adoption-and-labour-intensity-of-stone-terraces-in-eastern-highlands-of-ethiopia.jpg)