Analysis of Extremes in Climate Science Francis Zwiers Climate Research Division, Environment Canada. Photo: F. Zwiers

Analysis of Extremes in Climate Science Francis Zwiers Climate Research Division, Environment Canada. Photo: F. Zwiers.
Dec 18, 2015
Welcome message from author
This document is posted to help you gain knowledge. Please leave a comment to let me know what you think about it! Share it to your friends and learn new things together.
Transcript

Analysis of Extremes in Climate Science
Francis ZwiersClimate Research Division, Environment Canada.
Photo: F. Zwiers

• Space and time scales • Simple indices• Annual maxima• Multiple maxima per year• Incorporating spatial
information• One-off events
Outline
Photo: F. Zwiers

• Very wide range of space and time scales
• Language used in climate circles not very precise– High impact (but not really extreme)– Exceedence of a relatively low threshold (e.g., 90th
percentile of daily precipitation amounts)– Rare events (long return period)– Unprecedented events (in the available record)
• Range from very small scale (tornadoes) to large scale (eg drought)
Space and time scales

Local Continental
hours
Space
Time
days
month
season
years
Regional
Few observations per period (seasons to interannual)
A single observation in the period of interest
(multi-annual and longer)
Process studies
Process studies
Many observationsper season, many
seasons
“Extremes” likely to be conditioned by climate state in all cases
Simple indices
• Time series of annual counts or exceedences– E.g., number of exceedence above 90th percentile
• Some studies use thresholds as high as 99.7th percentile• Coupled with simple trend analysis techniques or standard
detection and attribution methods – Detected anthropogenic influence in observed surface
temperature indices– Perfect and imperfect model studies of potential to detect
anthropogenic influence in temperature and precipitation extremes
• Statistical issues include– “resolution” of observational data– adaptation of threshold to base period– use of simple analysis techniques that implicitly assume data
are Gaussian

Indices approach is attractive for practical reasons - basis for ETCCDI strategy

Regional workshops – 2002-2005

Indices of temperature “extremes”
• Anthropogenic influence detected in indices of cold nights, warm nights, and cold days
Christidis, et al 2005
Alexander, Zhang, et al 2005
DJF Cold nights JJA warm days

Some simple indices not so simple …
Number of days per year in Canada with temperature above 99th percentile
Rate at which 90th percentile is exceeded in simulated 60-year records (when threshold is estimated from first 30-years)
11%
10%
Zhang, Hegerl, Zwiers, Kenyon, 2005

• Tmax, Tmin, P24-hour, etc
• Analyzed by fitting an extreme value distribution– Typically use the GEV distribution– Fitted by MLE or L-moments
• Analyses sometimes …– impose a “feasibility” constraint– include covariates – incorporate some spatial information
• Often used to – compare models and observations– compare present with future
Annual extremes

• Detection and attribution is an emerging application
– include expected responses to external forcing as covariates
– one approach is via Bayes Factors
• Main Assumptions
– Observed process is weakly stationary
– Annual sample large enough to justify use of EV distribution
• Some challenges
– Data coverage
– Scaling issue
– How best to use spatial information
– What to compare model output against
– Are data being used efficiently?
Annual extremes

• Uneven availability in space and time• Weak spatial dependence• Spatial averages over grid boxes may not be good estimates of “grid
box” quantities simulated by climate models
Observational data rather messy
Trend 5-day max pcp 1950-99 (data: Alexander et al. 2006)
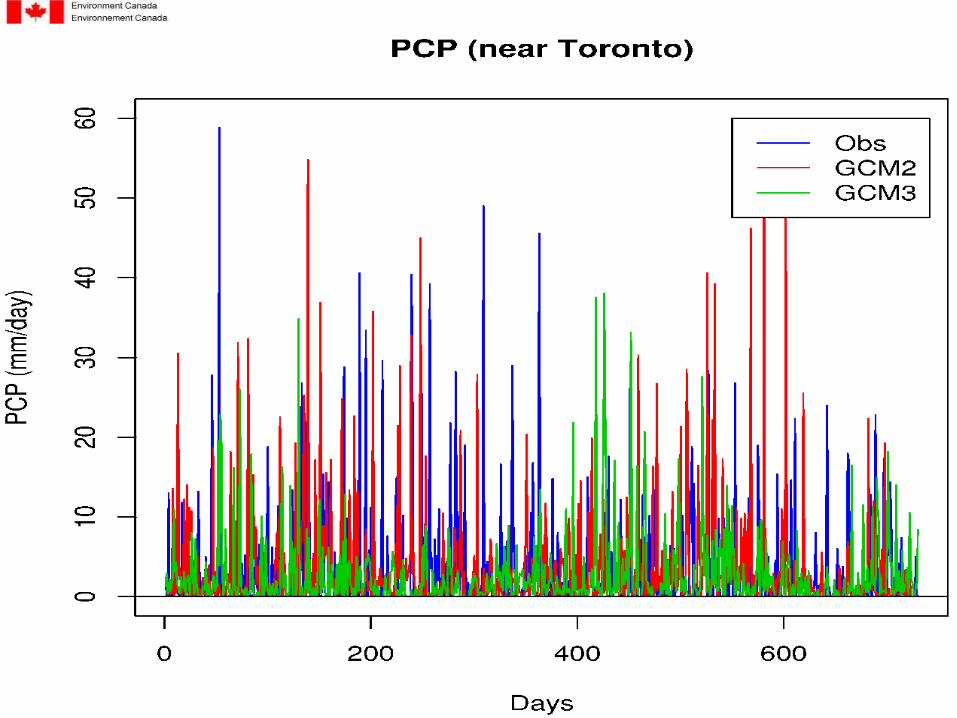

20-yr 24-hr PCP extremes – current climate
Projected waiting time for current climate 20-yr 24-hr PCP event


• Considering only annual extreme is probably not the best use of the available data resource– r-largest techniques (r > 1)– peaks-over-threshold approach (model
exceedence process and exceedences)• Some potential issues include
– “clustering”– Cyclostationary rather than stationary nature of
many observed series• Has implications for both exceedence process
and representation of exceedences
Multiple extremes per year
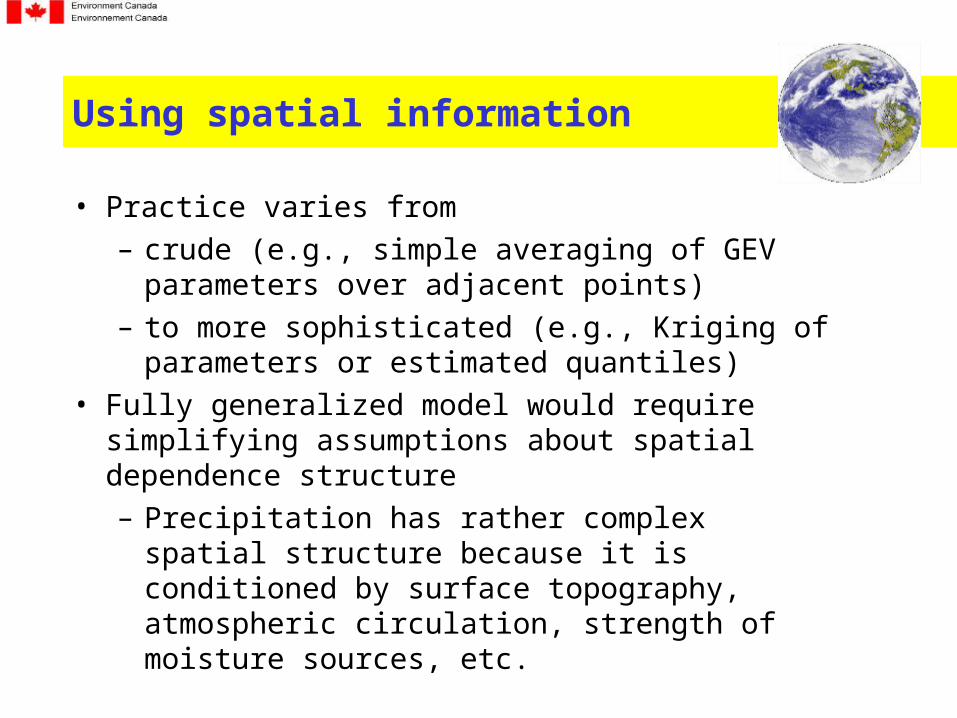
• Practice varies from – crude (e.g., simple averaging of GEV
parameters over adjacent points) – to more sophisticated (e.g., Kriging of
parameters or estimated quantiles)• Fully generalized model would require simplifying
assumptions about spatial dependence structure– Precipitation has rather complex spatial
structure because it is conditioned by surface topography, atmospheric circulation, strength of moisture sources, etc.
Using spatial information

• How to deal with “outliers”?– Annual max daily pcp amount that is much
larger than others, and occurs in 1885– Recently observed value that lies well beyond
range of previously observed values• Both would heavily leverage extreme-value
distributions (raising questions about the suitability of the statistical model)
• Recent events also beg the question – was this due to human interference in the climate system?
Isolated, very extreme events

Fig 9.13a
Surface temperature extremes
Human influence:• Has likelylikely affected
temperature extremes• May have increased
the risk of extremely warm summer conditions regionally.
Risk of extreme warm European summer in 1990s (1.6°C > 1961-90 mean):
- natural forcing only - “all” forcing
FAQ 9.1, Fig. 1
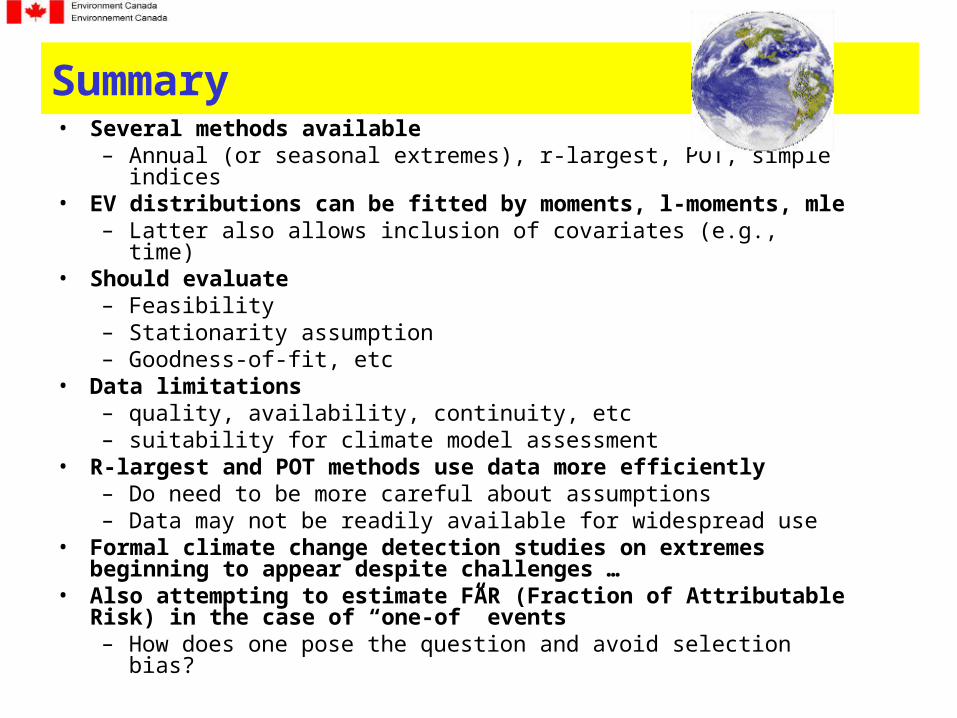
Summary• Several methods available
– Annual (or seasonal extremes), r-largest, POT, simple indices• EV distributions can be fitted by moments, l-moments, mle
– Latter also allows inclusion of covariates (e.g., time)• Should evaluate
– Feasibility– Stationarity assumption– Goodness-of-fit, etc
• Data limitations– quality, availability, continuity, etc– suitability for climate model assessment
• R-largest and POT methods use data more efficiently– Do need to be more careful about assumptions– Data may not be readily available for widespread use
• Formal climate change detection studies on extremes beginning to appear despite challenges …
• Also attempting to estimate FAR (Fraction of Attributable Risk) in the case of “one-of” events – How does one pose the question and avoid selection bias?

The End
Related Documents