Analysis of Enterprise Media Server Workloads: Access Patterns, Locality, Dynamics, and Rate of Change Ludmila Cherkasova, Minaxi Gupta 1 Internet Systems and Storage Laboratory HP Laboratories Palo Alto HPL-2002-56 March 7 th , 2002* E-mail: [email protected] , [email protected] workload analysis, enterprise media servers, static locality, temporal locality, sharing patterns, dynamics, clients characterization, CDNs The main issue we address in this report is the workload analysis of today's enterprise media servers. This analysis aims to establish a set of properties specific for enterprise media server workloads and to compare them with well known related observations about web server workloads. We propose two new metrics to characterize the dynamics and evolution of the accesses, and the rate of change in the site access pattern, and illustrate them with the analysis of two different enterprise media server workloads collected over a significant period of time. Another goal of our workload analysis study is to develop a media server log analysis tool, called MediaMetrics , that produces a media server traffic access profile and its system resource usage in a way useful to service providers. * Internal Accession Date Only Approved for External Publication 1 College of Computing, Georgia Institute of Technology, Atlanta, GA 30332 A shorter version of this paper is to be published in ACM NOSSDAV 2002, the 12th International Conference on Network and Operating System Support for Digital Audio and Video, 12-14 May 2002, Miami Beach, Florida. Copyright Hewlett-Packard Company 2002

Welcome message from author
This document is posted to help you gain knowledge. Please leave a comment to let me know what you think about it! Share it to your friends and learn new things together.
Transcript
Analysis of Enterprise Media Server Workloads: Access Patterns, Locality, Dynamics, and Rate of Change Ludmila Cherkasova, Minaxi Gupta1 Internet Systems and Storage Laboratory HP Laboratories Palo Alto HPL-2002-56 March 7th , 2002* E-mail: [email protected], [email protected] workload analysis, enterprise media servers, static locality, temporal locality, sharing patterns, dynamics, clients characterization, CDNs
The main issue we address in this report is the workload analysis of today's enterprise media servers. This analysis aims to establish a set of properties specific for enterprise media server workloads and to compare them with well known related observations about web server workloads. We propose two new metrics to characterize the dynamics and evolution of the accesses, and the rate of change in the site access pattern, and illustrate them with the analysis of two different enterprise media server workloads collected over a significant period of time. Another goal of our workload analysis study is to develop a media server log analysis tool, called MediaMetrics, that produces a media server traffic access profile and its system resource usage in a way useful to service providers.
* Internal Accession Date Only Approved for External Publication 1 College of Computing, Georgia Institute of Technology, Atlanta, GA 30332 A shorter version of this paper is to be published in ACM NOSSDAV 2002, the 12th International Conference on Network and Operating System Support for Digital Audio and Video, 12-14 May 2002, Miami Beach, Florida. Copyright Hewlett-Packard Company 2002

Analysis of Enterprise Media Server Workloads:
Access Patterns, Locality, Dynamics, and Rate of Change
Ludmila CherkasovaHewlett-Packard Laboratories
1501 Page Mill Road,Palo Alto, CA 94303, [email protected]
Minaxi GuptaCollege of Computing
Georgia Institute of TechnologyAtlanta, GA 30332, [email protected]
AbstractThe main issue we address in this paper is the workload
analysis of today's enterprise media servers. This analy-
sis aims to establish a set of properties speci�c for enter-
prise media server workloads and to compare them with
well known related observations about web server work-
loads. We propose two new metrics to characterize the
dynamics and evolution of the accesses, and the rate of
change in the site access pattern, and illustrate them with
the analysis of two di�erent enterprise media server work-
loads collected over a signi�cant period of time. Another
goal of our workload analysis study is to develop a media
server log analysis tool, called MediaMetrics, that pro-
duces a media server tra�c access pro�le and its system
resource usage in a way useful to service providers.
Keywords: workload analysis, enterprise media
servers, static locality, temporal locality, sharing patterns,
dynamics, clients characterization, CDNs.
1 Introduction
Streaming media represents a new wave of rich In-ternet content. Recent technological advancementsin video creation, compression, bandwidths, caching,streaming, and other content delivery technology havebrought audio and video together to the Internet asrich media. Products for still (JPEG) and motion(MPEG) pictures are available in consumer markets.This enables potentially anyone to be a producer ofrich media content that can be easily distributed andpublished over the Internet. There are predictionsthat rich media will signi�cantly add to the user expe-rience, and therefore, will be the Internet's next "killerapp."
Video from news, sports, and entertainment sites ismore popular than ever. Media servers are being usedfor educational and training purposes by many univer-sities. Use of the media servers in the enterprise envi-ronment is catching momentum too. Enterprises areusing more and more rich media to attract prospectivecustomers, improve e�ectiveness of online advertising,
web marketing, customer interaction centers, collabo-ration, and training.
While there are plenty of reasons to create rich me-dia content, delivering this high bandwidth contentover the Internet presents a number of new challengesto system designers. Real-time nature of multimediacontent makes it sensitive to congestion conditions inthe Internet. Moreover, multimedia streams can con-sume signi�cant bandwidths and their large sizes re-quire orders of magnitude larger amount of storageat the media servers and proxy caches. Understand-ing the nature of media server workloads is crucial toproperly designing and provisioning current and futureservices.
Recently, there have been several studies attempt-ing to uncover the multimedia workloads character-istics. However, most of the studies are devotedto the analysis of workloads for educational mediaservers [1, 2, 3, 12, 13, 16]. One recent study [9] charac-terizes the workload of a media proxy of a large univer-sity. Our paper presents and analyzes the enterprisemedia server workloads based on the access logsfrom two di�erent media servers in Hewlett-PackardCorporation. Both logs are collected over long periodof time (2.5 years and 1 year 9 months). The dura-tion of the logs makes them quite unique and allows usto discover typical and speci�c client access patterns,media server access trends, dynamics and evolution ofthe media workload over time.
Web workload studies have identi�ed di�erent typesof locality in web tra�c. Static locality or concentra-tion of references [5] observes that 10% of the �lesaccessed on the server typically account for 90% ofthe server requests and 90% of the bytes transferred.Temporal locality of references [4] implies that recentlyaccessed documents are more likely to be referencedin the near future. These strongly in uence the traf-�c access patterns seen by the web servers. One goalof our analysis is to characterize locality propertiesin media server workloads and to compare them with

traditional web workloads characterization. Under-standing the nature of locality will help in designingmore e�cient middleware for caching, load balancing,and content distribution systems.
The other questions we address in this paper aretightly related to new trends observed in the evolu-tion of Internet infrastructure such as content distri-bution networks (CDNs) and overlay networks. CDNsare based on large-scale distributed network of serverslocated closer to the edges of Internet for e�cientdelivery of digital content including various forms ofstreaming media. The main goal of CDN's architec-ture is to minimize the network impact in the criticalpath of media delivery.
Access patterns and dynamics of the site have tobe taken into account when making a decision aboutdi�erent caching or content distribution systems. Forexample, if the site is very dynamic, i.e. a large por-tion of the client requests are accessing new content,(news web sites being a prime example), then CDNsare clearly a good choice to handle the load, becausetraditional caching solutions will be less e�cient in dis-tributing the load due to time involved in propagatingthe content through the network caches.
Thus, the other question we address in this paperis how to characterize the dynamics and evolutionof accesses at media sites. The �rst natural stepis to observe the introduction of new �les in the logs,and to analyze the portion of all requests destinate forthose �les. We de�ne new �les impactmetric that aimsto characterize the site evolution due to new content.It is obtained by computing the ratio of the accessestargeting these new �les over time. The de�nition of\new �les" depends on a time scale at which informa-tion changes and might be di�erent for di�erent sites.We propose a second life span metric to measure therate of change in the access pattern of the site.
We have developed a tool called MediaMetricsthat characterizes a media server access pro�le andits system resource usage in both a quantitative andqualitative way. It extracts and reports informationthat could be used by service providers to evaluatecurrent solutions and to improve and optimize rele-vant future components. MediaMetrics performs ananalysis which is entirely based on media server ac-cess logs, which can be from one or multiple serversin a cluster. The tool is written in Perl to process themost common media server log formats: from Win-dows Media Server and RealNetworks Media Server.In this paper, we highlight most interesting part of thestatistics available from our tool.Key new observations from our analysis include:
� Despite the fact that the two studied workloadshad signi�cantly di�erent �le size distribution(one set had well represented groups of short,
medium, and long videos, while the other set wasskewed in long videos range), the clients' viewingbehavior was similar for both sets: with 77-79%of media sessions being less than 10 min long, 7-12% of the sessions being 10-30 min, and 6-13% ofsessions continued for more than 30 min. This re- ects the browsing nature of the most enterpriseclient accesses.
� Most of the incomplete sessions (i.e. terminatedby clients before the video was �nished) are ac-cessing the initial segments of media �les. Thepercentage of sessions with interactive requests(such as pause, rewind, or fast forward duringthe media session) is much higher for medium andlong videos.
� Like web workloads, both the media workloadsexhibit a high locality of accesses: 14-30% of the�les accessed on the server account for 90% ofthe media sessions and 92-94% of the bytes trans-ferred, and were viewed by 96-97% of the uniqueclients.
� While there is a signi�cant number of �les thatare rarely accessed (16% to 19% of the �les areaccessed only once), these numbers are somewhatlower compared to web server workloads.
� The distribution of clients accesses to media �lescan be approximated by Zipf-like distribution forboth workloads. However, noteworthy is that thetime scale plays important role in this approxi-mation. We considered 1-month, 6-month, 1-yearand a whole log duration as a time scale for ourexperiments. For one workload, distribution ofclients accesses to media �les on a 6-month scalestarts to �t Zipf-like distribution. While for theother workload, �le popularity on a monthly ba-sis can be approximated by Zipf-like distribution.For longer time scale in the same workloads, the�le access frequency distribution does not followZip�an distribution.
� Accesses to the new �les constitute most of the ac-cesses in any given month. Also, the bytes trans-ferred due to accesses to new �les are dominantin both workloads. It makes the access pattern ofenterprise media sites resemble the access patternof the news web sites where the most of the clientaccesses target new information. We introducethe new �les impact metric to measure site dy-namics due to new �les. Moreover, we observedthat for enterprise media servers, the tendencyof the number of accesses to be increasing or de-creasing in nature is strongly correlated with thenumber of newly added �les.
2

� For both workloads, 51-52% of accesses to media�les occur during the �rst week of their intro-duction. First �ve weeks of the �les' existenceaccount for 70-80% of all the accesses. We de-�ne a life span metric to re ect the rate of changein accesses to newly introduced �les. Addition-ally, life span metric re ects the timeliness of theintroduced �les. Longer life span re ects that me-dia information on a site is less timely and havemore consistent percentile of accesses over longerperiod of time.
The remainder of the paper presents our results inmore detail. Section 2 discusses related work, brie ydescribes the sites we used in our study, and provides ashort description of the media server log formats. Sec-tion 3 describes the media �les length and the distribu-tion of the accesses, client viewing behavior speci�cs,media �les encoding rates, available bandwidth to thesessions, QoS related issues, completed and abortedsession characteristics, client clustering, and workloadtrends. Section 4 provides insight in locality charac-teristics of studied workloads. Section 5 introducesthe new �les impact metric to capture the media sitedynamics over time, and in particular, the trends inaccess patterns due to the new �les. Section 6 de-�nes the life span metric and measures the rate ofthe site's access pattern changes. Finally, section 7presents conclusion and future work.Acknowledgments: Both the tool and the study
would not have been possible without media accesslogs and help provided by Nic Lyons, Wray Small-wood, Brett Bausk, Magnus Karlsson, Wenting Tang,Yun Fu, John Apostolopoulos, and Susie Wee. Theirhelp is highly appreciated.
2 Background
2.1 Related Work
While web server workloads have been studied exten-sively [4, 5, 6, 8, 10], there have been relatively fewerpapers written about multimedia workload analysis.Acharya et al. [1] characterized non-streaming mul-timedia content stored on web servers. In their laterwork [2], authors present the analysis of the six-monthtrace data from mMOD system (the multicast Mediaon Demand) which had a mix of educational and en-tertainment videos. They observed high temporal lo-cality of accesses, the special client browsing patternshowing clients preference to preview the initial por-tion of the videos, and that rankings of video titles bypopularity do not �t a Zip�an distribution.
Recent studies on client access to MANIC systemaudio content [16] and low-bit rate videos in the Class-
room2000 system [13] provide the analysis of accessesto educational media servers in terms of daily varia-tion in server loads, distribution of media session du-rations, and some client interactivity analysis.
Extensive analysis of educational media serverworkloads is done in [3]. Their study is based on twomedia servers in use at major public universities in theUnited States: eTeach and BIBS. The authors providea detailed study of client session arrival process: theclient sessions arrival in BIBS can be characterized asPoisson, and arrivals in eTeach workload are closer toheavy-tailed Pareto distribution. They also observedthat media delivered per session depends on the media�le length. They discovered di�erent client interactiv-ity patterns for frequently and infrequently accessed�les: any video segment is equally likely to be accessedfor frequent �les, while access frequency is higher forearlier segments in the infrequent videos. The maingoal of [3] was to identify the important parametersfor generating synthetic workloads.
While all the above papers used media server logs,the study by Chesire et al [9] analyzed the media proxyworkload at a large university. The authors presenteda detailed characterization of session duration (mostof the media streams are less than 10 min), objectpopularity (78% of objects are accessed only once),server popularity, and sharing patterns of streamingmedia among the clients.
As the the number of internet users continues togrow, and as the high-speed access methods becomemore ubiquitous, streaming media starts to occupymore sizable fraction of the Internet's bandwidth. Fewrecent papers [15, 14, 18] analyze the impact of stream-ing media on the Internet tra�c and the performanceof popular Internet real-time streaming technologies.
Our paper builds upon this previous work in a num-ber of signi�cant ways. To our knowledge, this paperis the �rst study of enterprise media server workloads.Our data is collected over signi�cant period of time,which makes it unique. The duration of this data al-lowed us to concentrate on the analysis of media serveraccess trends, access locality, dynamics and evolutionof the media workload over time, and to propose twonew metrics to measure these properties. This type ofanalysis is new and has not been reported in previouswork.
2.2 Data Collection Sites
We use access logs from two di�erent servers:
� HP Corporate Media Solutions server(HPC) hosts diverse information about HP:video coverage of major events, keynote speeches,addresses and presentations, meetings with in-dustry analysts, promotional events, product in-
3

troduction, information related to software andhardware products, and demos illustrating theproducts usage. Additionally, it has some train-ing and education information. The logs coveralmost 2.5 years of duration: from the middle ofNovember, 1998 to the middle of April, 2001. Infact, it is a cluster of media servers. For our anal-ysis, we combined several access logs collected atthis cluster. The HPC content is delivered byWindows Media Server [19].
� HPLabs Media server (HPLabs) providesinformation about HP Laboratories, in particu-lar Co�ee Talks (monthly, HPLabs wide, hourlymeetings), videos of prominent presentations,seminars, meetings, some of the HP wide busi-ness related events, Cooltown 1 promotional ma-terials, and some training and educational infor-mation. The logs cover 1 year and 9 months dura-tion: from the middle of July, 1999 to the middleof April, 2001. It is an internal server availableonly for accesses to HP employees. The HPLabscontent is delivered by RealServer G2 [17].
2.3 Media Server Log Formats
The media access logs record the information aboutall the requests and responses processed by a mediaserver. Each line of the access logs provides a descrip-tion of a user request for a particular media �le. Win-dows Media Server and RealNetworks Media Serverhave di�erent log formats which we describe in moredetail in Appendix A.
For our logs, the transmission protocols used byWindows Media Server and RealNetworks MediaServer were UDP and TCP respectively.
The typical �elds contain information about the IP-address of the client machine making the request, thetime stamp at which the request was made, the �le-name of the requested document, the advertised dura-tion of the �le (in seconds), the size of the requested�le (in bytes), the elapsed time of the requested media�le when the play ended (a �le play can be ended pre-maturely if the client hit the stop button), the averagebandwidth (Kb/s) available to the user while the �lewas playing, the number of bytes sent by the server,and the number of bytes received by the client etc.
Clients can pause, rewind, fast forward, or skip to aprede�ned point using a slide bar during their viewingof the requested media �les. A session is a sequenceof client requests corresponding to the same �le ac-cess and re ecting di�erent client activities during thecorresponding �le viewing such as pause, fast forward,
1HP's vision of the future, a world where everyone and ev-erything is connected to the web through wired or wireless links.
or rewind actions. We will explicitly distinguish theusage of the term: a session is the access of a particu-lar �le and there can be multiple requests within thesame session, due to client's interactivity.
Windows Media Server logs contain a separate en-try for each client request. Thus, a single sessionmay be comprised of multiple entries in the serveraccess logs. Each log entry has a start position, theplace where the client started viewing the �le; dura-tion the client watched the �le for; and client action,pause/stop/rewind/fast/forward. This is useful infor-mation for the analysis of clients' interactive behaviorduring the media sessions.
RealServer log format allows for similar �elds, butunfortunately, the HPLabs access logs did not havethese optional �elds because the relevant option wasturned o�. Thus HPLabs workload has only informa-tion about client sessions, the client interactivity dataare not available for HPLabs workload. There is oneentry for each client session in these logs.
3 Workload Characteristization
3.1 Summary Statistics
The overall workload statistics for HPC and HPLabsmedia servers is summarized in the following Table 1.
HPC HPLabsDuration 29 months 21 monthsTotal sessions 666,074 14,489Total Requests 1,179,814 NAUnique Files 2,999 412Unique Clients 131,161 2,482Storage Requirement 42 GB 48 GBBytes Transferred 2,664 GB 172 GB
Table 1: Statistics summary for two sites.
In HPC, 471 �les corresponded to live streams,while the others were stored content. We excludedthem from further analysis.
A glance at the basic statistics shows that HPC me-dia server witnesses more activities and reaches largerclient population than HPLabs server. HPLabs serverclearly targets more speci�c, smaller research commu-nity at HP, and as a result has a very di�erent, \mod-est" pro�le. HPC represents a reasonably busy mediaserver with 300-800 client sessions per weekday and oc-casional peaks reaching 12000 sessions. HPLabs serveris much lighter loaded. By noticing this very obviousdi�erence, it becomes even more interesting whetherwe can �nd common properties typical for enterpriseworkloads in general.
4
a)
0102030405060708090
100
0 20 40 60 80 100 120 140 160
% o
f Tot
al
File Duration (min)
HPC
FilesFile Accesses (Sessions)
b)
0102030405060708090
100
0 20 40 60 80 100 120 140
% o
f Tot
al
File Duration (min)
HPLabs
FilesFile Accesses (Sessions)
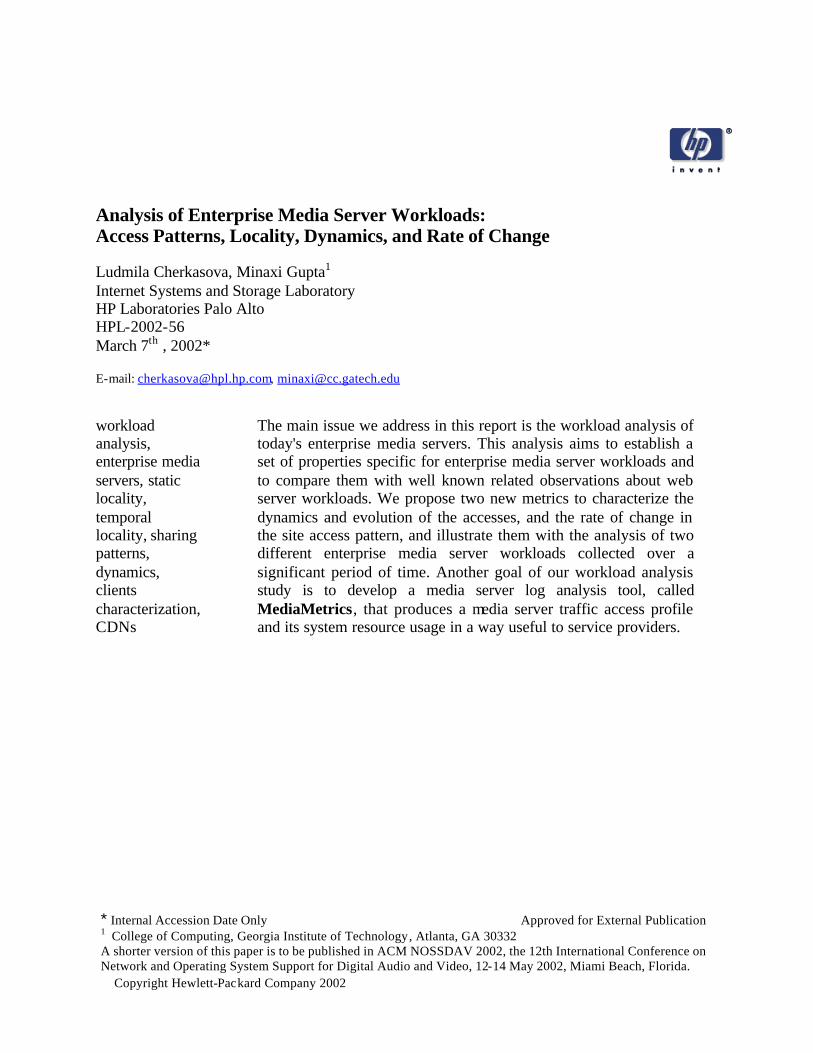
Figure 1: Distribution of �le durations and distribution of client sessions to those �les: a) HPC and b) HPLabs.
a) 0-2min 2-5min 5-10min 10-30min 30-60min >60min
5
10
15
20
25
% o
f T
otal
HPC
Files
Sessions
b) 0-2min 2-5min 5-10min 10-30min 30-60min >60min
10
20
30
40
50
60
% o
f T
otal
HPLabs
FilesSessions
Figure 2: Six classes of �le durations and percentage of client sessions to those �le classes: a) HPC and b) HPLabs.
3.2 Files and Session Characteristics
In this section, we provide a detailed analysis of ad-vertised duration of media �les referenced in the logsand compare that to clients' actual viewing time dis-tribution. The advertised media �le duration re ectsthe total length of the video, while the client can stopviewing or downloading the �le by hitting stop but-ton before the video is �nished, and it can do so aftera sequence of pause, rewind, fast forwards, and usingthe slide bar to jump to speci�c sections of the video.
Figure 1 shows the distribution of stored videos forboth workloads, and percentage of corresponding ac-cesses to those �les.
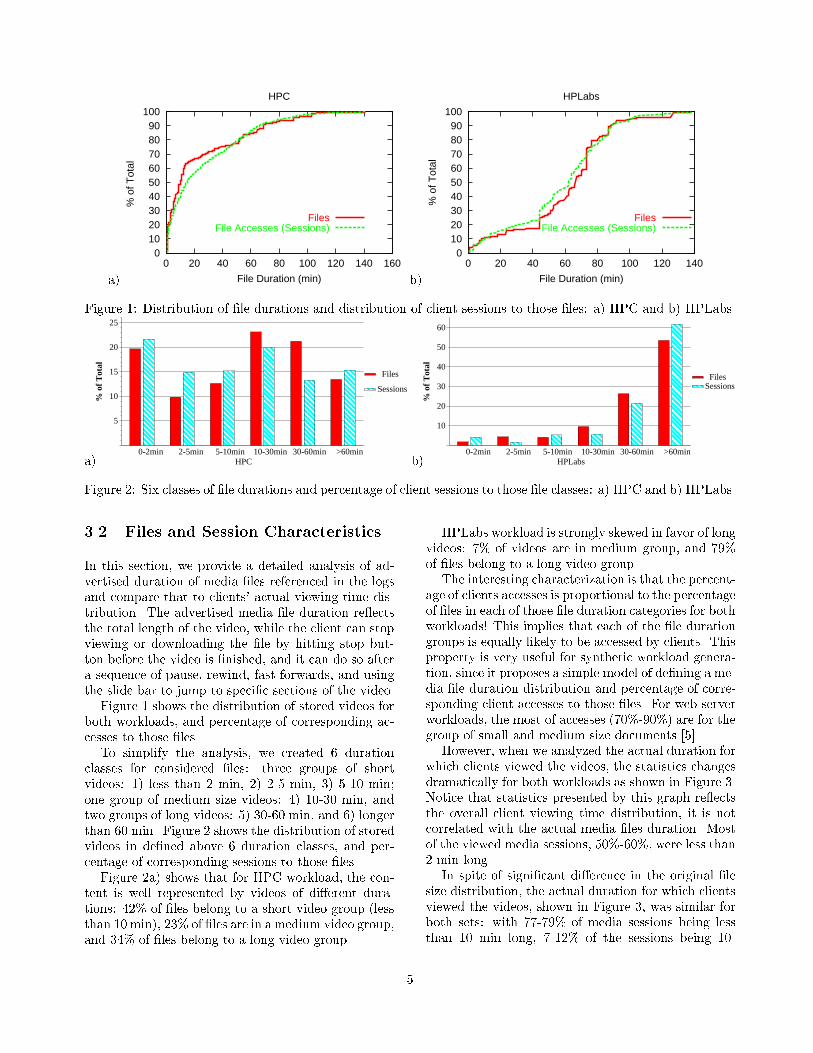
To simplify the analysis, we created 6 durationclasses for considered �les: three groups of shortvideos: 1) less than 2 min, 2) 2-5 min, 3) 5-10 min;one group of medium size videos: 4) 10-30 min, andtwo groups of long videos: 5) 30-60 min, and 6) longerthan 60 min. Figure 2 shows the distribution of storedvideos in de�ned above 6 duration classes, and per-centage of corresponding sessions to those �les.
Figure 2a) shows that for HPC workload, the con-tent is well represented by videos of di�erent dura-tions: 42% of �les belong to a short video group (lessthan 10 min), 23% of �les are in a medium video group,and 34% of �les belong to a long video group.
HPLabs workload is strongly skewed in favor of longvideos: 7% of videos are in medium group, and 79%of �les belong to a long video group.
The interesting characterization is that the percent-age of clients accesses is proportional to the percentageof �les in each of those �le duration categories for bothworkloads! This implies that each of the �le durationgroups is equally likely to be accessed by clients. Thisproperty is very useful for synthetic workload genera-tion, since it proposes a simple model of de�ning a me-dia �le duration distribution and percentage of corre-sponding client accesses to those �les. For web serverworkloads, the most of accesses (70%-90%) are for thegroup of small and medium size documents [5].
However, when we analyzed the actual duration forwhich clients viewed the videos, the statistics changesdramatically for both workloads as shown in Figure 3.Notice that statistics presented by this graph re ectsthe overall client viewing time distribution, it is notcorrelated with the actual media �les duration. Mostof the viewed media sessions, 50%-60%, were less than2 min long.
In spite of signi�cant di�erence in the original �lesize distribution, the actual duration for which clientsviewed the videos, shown in Figure 3, was similar forboth sets: with 77-79% of media sessions being lessthan 10 min long, 7-12% of the sessions being 10-
5

0-2min 2-5min 5-10min 10-30min 30-60min >60min
10
20
30
40
50
60%
of
Tot
al
Sessions Duration
HPC HPLabs
Figure 3: Session duration characterization.
30 min, and 6-13% of sessions continued for more than30 min. The decision to abort the session is only par-tially in uenced by the available bandwidth for thesession (we will show this analysis in more detail inSection 3.4). The observed access pattern rather re- ects the browsing nature of the enterprise client ac-cesses, and that often clients are looking for a speci�cfragment of content in a video, and are not interestedin watching it completely. Knowledge of the approx-imate percent of \browsing" clients helps to estimateand predict the short term load on a server.
3.3 Media Files Encoding Rates and
Sessions Available Bandwidth
Both servers, HPC and HPLabs, had videos encodedat di�erent rate.
Table 2 presents the statistics on �les encodingrates and their trends over time for both workloads.Videos stored at HPC server had most of the �les(59%) encoded at 56 Kb/s rate and lower. However,over the years, the trend is to add more �les encoded athigher rate: for example, in 1999 year, only 1.7% of thevideos were encoded at a rate between 128-256 Kb/s,while in 2001 this group of videos constitutes alreadyup to 27.8% of total. HPLabs server had most of the�les encoded at high bit rate: 67% of all the �les areencoded at 256 Kb/s and higher.
Media access logs report the average bandwidthavailable to the user while the �le was playing. Ta-ble 3 presents the statistics on session available band-width during the di�erent period represented by thelogs for both workloads (1999, 2000, 2001 years). HPCmedia sessions overall had higher available bandwidthto the clients: in 2001, 57.5% of sessions had anaverage available bandwidth above 56Kb/s (we willcall these sessions as high-bandwidth sessions). ForHPLabs workload, in 2001, high-bandwidth sessionsconstituted only 21.7% of total.
For HPC workload, most of �le encoding rates andaverage available bandwidth per session show a goodallingment as shown in Figure 4. Only the group of
videos encoded at rates between 128-256 Kb/s couldnot meet the requirements. While for HPLabs work-load, where the most of the �les were encoded at256 Kb/s and higher, the gap between the demand andavailable bandwidth is very high: most of the sessionshave signi�cant mismatch between the �le encodingrates and the available bandwidth.
This information, provided by MediaMetrics,could be used by the service providers to analyze theclient bandwidth availability for choosing the right en-coding rates.
Media access logs also report the number of bytessent by the server and the number of bytes receivedby the client. MediaMetrics tool uses this infor-mation to make an estimate about the percentage ofbytes lost during the �le transfer, and to implicitlyjudge the quality of service a client might have ex-perienced. This simple technique can produce usefulresults when data is transmitted over UDP, becausein this case, the di�erence in sent and received bytesre ects the percentage of the bytes lost on a way to aclient. It might be less accurate when data is trans-ferred over TCP because in the presence of conges-tion, media server will retransmit part of the data tocompensate for lost packets, and if those packets werereceived by the client in time, then the di�erence inserver sent-bytes and the client received-bytes will notalways explicitly result in worse QoS. For two work-loads under study, HPC data was transmitted overUDP, while for HPLabs workload, the data was trans-ferred over TCP protocol.
The quality of service observed by the low- andhigh-bandwidth sessions in HPC workload was practi-cally the same: 96.5% of low-bandwidth sessions had0-5% of bytes loss per session, and there were 97.1%of high-bandwidth sessions with the same quality ofservice.
For HPLabs workload, the di�erence in server sent-bytes and the client received-bytes between low- andhigh-bandwidth sessions was more pronounced: 64.6%of low bandwidth sessions and 88.8% of high band-width sessions had 0-5% of bytes loss per session. Thisnumbers re ect the essential role of available band-width for viewed media sessions over TCP.
3.4 Completed and Aborted Session
Characteristics
We will call a media session as completed if duringthis session the video was watched entirely. For HPCworkload, 29% of sessions were completed, while forHPLabs workload, completed sessions accounted foronly 12.6% of all sessions. Figure 5 a) shows the over-all distribution of completed sessions duration, whileFigure 5 b) presents a simpli�ed view of the same dis-
6

Period HPC HPLabs
Encoding Rate �56Kb/s 56-128Kb/s 128-256Kb/s �256Kb/s �56Kb/s 56-128Kb/s 128-256Kb/s �256Kb/s
Files (1999) 73.5% 22.4% 1.7% 2.7% 16% 7% 22% 55%Files (2000) 56% 27.4% 15.7% 1% 10% 5% 16% 69%Files (2001) 53% 18.2% 27.8% 1% 13% 2% 17% 68%All �les 59.1% 20.61% 19.4% 0.9% 11% 5% 17% 67%
Table 2: Trends in �les encoding rates for both workloads.
Period HPC HPLabs
Bandwidth �56Kb/s 56-128Kb/s �128Kb/s �56Kb/s 56-128Kb/s �128Kb/s
Sessions (1999) 57.8% 42% 0.2% 71.4% 14.5% 14.1%Sessions (2000) 40.3% 52.2% 7.5% 79.1% 16.6% 4.3%Sessions (2001) 35.8% 57.5% 6.7% 78.3% 18% 3.7%
Table 3: Trends in average available bandwidth per session for both workloads.
a)
1
10
100
1000
0 500 1000 1500 2000 2500
File
Enc
odin
g / B
andw
idth
(K
b/s)
File Number
HPC
Average BandwidthFile Encoding
b)
1
10
100
1000
50 100 150 200 250 300 350 400
File
Enc
odin
g / B
andw
idth
(K
b/s)
File Number
HPLabs
Average BandwidthFile Encoding
Figure 4: File encoding rates and average available bandwidth of client sessions to those �les: a) HPC and b)HPLabs.
a)
0102030405060708090
100
0 20 40 60 80 100 120
% o
f Tot
al
Completed Media Session Duration (min)
HPCHPLabs
b) 0-2min 2-5min 5-10min 10-30min 30-60min >60min
10
20
30
40
% o
f T
otal
Completed Sessions Duration
HPC HPLabs
Figure 5: a) Distribution of completed session durations. b) Simpli�ed distribution of completed sessions for sixduration classes.
Session Type HPC HPLabs
Bandwidth �56Kb/s 56-128Kb/s �128Kb/s �56Kb/s 56-128Kb/s �128Kb/s
All sessions 43.3% 51.1% 5.6% 75% 15.5% 9.5%Completed sessions 33.9% 60.7% 5.4% 77.3% 11.5% 11.2%Aborted sessions 47.1% 47.4% 5.5% 74.8% 15.8% 9.4%
Table 4: Distribution of available bandwidth per session for both workloads.
7

tribution via six duration classes.Media sessions with duration under 2 min account
for 33% of all the completed sessions for both work-loads. While for the rest of completed sessions, theirdurations re ect the corresponding distribution of me-dia session durations speci�c to considered workloadsas shown in Figures 1 and 2.
HPC media sessions overall had higher availablebandwidth to the clients compared to the HPLabs ses-sions. Additionally, for HPC workload, there was agood allingment between the �le encoding and band-width availability requirements as was shown in Sec-tion 3.3. The HPLabs workload exhibits a signi�cantmismatch between the �les encoding and the avail-able bandwidth per session. It explains why, overall,a higher percentage of HPC sessions were completedcompared to HPLabs workload (29% of HPC sessionsversus 12.6% of HPLabs sessions were completed).
The reasonable question to ask is whether the com-pleted sessions had higher available bandwidth to theclients? Or in other words, whether the aborted ses-sions were interrupted because of poor available band-width?
Table 4 presents the statistics on available band-width for completed, aborted, and all the sessionsfor both workloads. For HPC workload, completedsessions have higher percentage of high-bandwidthsessions. However, the di�erence in bandwidth isnot high enough to assert that sessions were abortedbecause of the \poor bandwidth" conditions. ForHPLabs workload, the bandwidth characteristics ofthe completed and aborted sessions are similar, whichsuggest that client will watch the video while he/sheis interested in the video content.
Most of the aborted sessions accessed initial seg-ments of media �les. The number of sessions whichhad incomplete accesses to any other segments of the�le other than the beginning, depend on the size of thevideo: less than 1.5% of sessions in short video groupaccessed any segment of the video other than the be-ginning, 2.4% of sessions in a medium video group,4%-7% of sessions in long video group. Clearly, suchknowledge about the client viewing patterns may bebene�cial when designing media caching strategies.
3.5 Client Interactivity
Windows Media Server log format has a separate en-try for each client request. As a result, we are ableto get information such as pause, rewind or fast for-ward activity by the client during the media ses-sion. Unfortunately, similar data was not available forHPLabs workload. Analysis of these �elds for HPClogs produced very interesting results. First of all, itrevealed that 99.9% of the sessions with interactive
requests were high-bandwidth sessions with availablebandwidth greater than 56 Kb/s. Second, that thepercentage of sessions that access medium and longvideos have much higher interactivity.
0-2min 2-5min 5-10min 10-30min 30-60min >60min
10
20
30
40
% o
f T
otal
HPC
Figure 6: HPC workload: percentage of sessions withinteractive requests for di�erent �le size classes.
Figure 6 shows that only 15.3% of sessions withinteractivity were for a short video group, 22.6% ofinteractive sessions were for medium size videos, and62.2% sessions that had client interactivity were forlong video group. This statistics helps in better un-derstanding the cliens' viewing behaviors.
3.6 Client Clustering by ASs
MediaMetrics tool provides information about theclients clustering by associating them with variousASs (Autonomous Systems). It also reports the corre-sponding number of client sessions and percentage ofbytes lost for those sessions. Since HPLabs logs onlyhad HP's internal clients, they all belong to the sameAS and the results of per AS analysis are not partic-ularly interesting for this case. Here, we present somestatistics about the HPC workload.
0
500
1000
1500
2000
2500
3000
2 4 6 8 10 12 14 16 18 20Num
ber
of C
lient
s an
d S
essi
ons
per
AS
AS
HPC
SessionsClients
Figure 7: Clients and their sessions clustering by AS.
For HPC logs, client population was spread across200 di�erent ASs, with 82% of clients being HP in-
8

a)
0102030405060708090
100
55 60 65 70 75 80 85 90 95 100
Acc
esse
d F
iles
(% o
f Tot
al)
Media Sessions (% of Total)
HPCHPLabs
b)
50556065707580859095
100
55 60 65 70 75 80 85 90 95 100
Byt
es T
rans
fere
d (%
of T
otal
)
Media Sessions (% of Total)
HPCHPLabs
c)
75
80
85
90
95
100
55 60 65 70 75 80 85 90 95 100
Clie
nts
(% o
f Tot
al)
Media Sessions (% of Total)
HPCHPLabs
Figure 8: Two workloads compared: a) �le set locality, b) bytes-transferred locality c) client set locality.
a)
0
20
40
60
80
100
5 20 40 60 80 100
Med
ia S
essi
ons
(% o
f Tot
al)
% of Site’ Active Storage Set
HPCHPLabs
b)
0
20
40
60
80
100
5 20 40 60 80 100
Byt
es T
rans
fere
d (%
of T
otal
)% of Site’ Active Storage Set
HPCHPLabs
Figure 9: Two workloads compared: storage-set locality and bytes-transferred-storage locality.
ternal. 93% of all the sessions in the logs belonged tointernal HP clients. About 45% of all the ASs had just1 client (with 1� 16 sessions). To show client cluster-ing for ASs that had signi�cant number of clients, weplotted 20 most representative ASs excluding the ASthat belonged to HP. Figure 7 shows the number ofclients and corresponding number of sessions for the20 most representative ASs. If we normalize this datathen the combined clients from the �rst 10 ASs ac-count only for 1.6% of clients population and 1.5% ofall the sessions. Clearly, the client population pro-�le was dominated by HP internal clients and theiractivities. For enterprise media servers, this mightbe a typical usage characterization. Overall, with thespread of CDNs and overlay network technologies, un-derstanding of clients, the content they accessed, andtheir clustering will play an essential role in decidinge�cient placement of edge-servers and the content.
3.7 New Trends Over Time
Analysis of HPC workload over time revealed inter-esting overall trends in site media content and sessioncharacteristics:� Total number of unique clients accessing mediacontent in each 6 month duration doubled overthe duration of our logs.
� Total number of sessions in each 6 month durationalso doubled over the duration of our logs.
� Average �le size in each 6 month duration in-creased from less than 7 MB to more than 20 MBin our logs.
� Bytes transferred per session increased from justover 1 MB to over 6 MB in our logs.
4 Locality Characterization
In this section, we will revisit a previously identi�edinvariant for web server workloads. The authors in [5]identi�ed that web tra�c exhibits strong concentra-tion of references, \10% of �les accessed from theserver typically account for 90% of the server requestsand 90% of the bytes transferred".
For locality characterization of our logs, we use atable of all �les accessed along with their frequency(number of times a �le was accessed during the ob-served period) and the �le sizes. This table is orderedin decreasing order of frequency.
Figure 8a) shows the reference locality for the me-dia server access logs used in our study. For bothworkloads, 90% of the media sessions target 14% ofthe �les for HPC server, and 30% of the �les forHPLabs server. This shows high locality of client ac-cesses, though lower than for web workloads. Fig-ure 8b) shows the corresponding bytes transferred dueto these media sessions: 94% for HPC site and 92%for HPLabs site. Observed graphs for both workloads
9

a)
1
10
100
1000
10000
100000
1 10 100 1000 10000
Num
ber
of A
cces
ses
(log)
File Number (log)
HPCHPLabs
b)
1
10
100
1000
10000
100000
1 10 100 1000 10000
Num
ber
of A
cces
ses
(log)
File Number (log)
2000 year
HPC-2000HPC-1-halfHPC-2-half
HPLabs-2000HPLabs-1-halfHPLabs-2-half
c)
1
10
100
1000
10000
1 10 100
Num
ber
of A
cces
ses
(log)
File Number (log)
HPLabs
HPLabs-1-halfHPLabs-2-half
alpha=1.6
Figure 10: File popularity distribution for both workloads a) over entire period of logs, b) over 2000 year andcorresponding �rst and second 6 months in 2000, c) HPLabs workload 6-month periods with corresponding Zipf-like function �tting.
a)
1
10
100
1000
10000
100000
1 10 100 1000
Num
ber
of A
cces
ses
(log)
File Number (log)
HPC
HPC-2000-1HPC-2000-2HPC-2000-3HPC-2000-4HPC-2000-5HPC-2000-6
b)
1
10
100
1000
10000
100000
1 10 100 1000
Num
ber
of A
cces
ses
(log)
File Number (log)
HPC
HPC-2000-7HPC-2000-8HPC-2000-9
HPC-2000-10HPC-2000-11HPC-2000-12
c)
1
10
100
1000
10000
100000
1 10 100 1000
Num
ber
of A
cces
ses
(log)
File Number (log)
HPC
HPC-2000-8alpha=1.5
Figure 11: File popularity distribution for HPC workload a) monthly periods, 1st to 6th months b) monthlyperiods, 7th to 12th months c) 8th month with corresponding Zipf-like function �tting.
are remarkably similar. Figure 8c) shows clients local-ity for both workloads. It can be interpreted in thefollowing way: at HPC server, 14% of the most popu-lar �les (responsible for 90% of accesses) are accessedby 96% of clients. For HPLabs site, 30% of the mostpopular �les are viewed by 97% of the clients.
We also analyzed workload locality from a di�erentangle: what percentage of active storage did the mostpopular �les account for. Here, the active storage setis de�ned by the combined size of all the media �lesaccessed in the logs. For both workloads, we observea high active storage set locality: 80% to 88% of allsessions are to �les that constitute only 20% of thetotal active storage set as can be seen in Figure 9a).Similarly, 82% to 92% of all transferred, most popularbytes are due to �les that constitute only 20% of thetotal active storage set as can be seen in Figure 9b).
This type of analysis helps in estimating the storagerequirements and potential bandwidth savings whenusing optimizations for the popular portion of the me-dia content. Since these metrics are normalized withrespect to the site's active storage set, it allows us tocompare di�erent workloads and to identify the simi-larity inherent to those workloads, independent of theabsolute numbers for storage in each workload.
Answering the question: how does the locality char-acterization in workload vary with a time durationof the logs collection, we found that independent onduration (1-month, 6-month or 12-month durations)both workloads exhibit high locality of client accesses:90% of the media sessions target 10%-30% of the �lesfor HPC server during corresponding duration inter-val, and 20%-35% of the �les for HPLabs server. Thisshows a high locality of client accesses in enterprisemedia server workloads.
Previous studies on web servers and web proxies [7]led to almost universal consensus that web page pop-ularity follows Zipf-like distribution, where the popu-larity of the i-th most popular �le is proportional to1=i�. For web proxies, the value of � is typically lessthan 1, ranging from 0.64 to 0.83, for web servers thereported typical value of � is varying between 1.4-1.6.Paper [9], which analyzes the media proxy workload,reports a Zipf-like distribution for the �le access fre-quencies in their study with � = 0:47. Paper [3] ap-proximated educational media server daily workloadsusing concatenation of two Zipf-like distributions.
Since our workloads under study cover a long pe-riod of time, we decided to investigate whether the �leaccess frequencies exhibit the same behaviour on a dif-
10

a)
0
2000
4000
6000
8000
10000
12000
1 10 100 1000 10000
Num
ber
of U
niqu
e C
lient
s
File Number (log)
HPC
Clients
b)
0
50
100
150
200
250
300
350
1 10 100 1000
Num
ber
of U
niqu
e C
lient
s
File Number (log)
HPLabs
Clients
Figure 12: Files sharing statistics: a) HPC and b) HPLabs.
ferent time scale. We considered 1-month, 6-month,1-year and the entire duration of the logs as a timescale for our experiments.
In order to characterize the distribution of the�le access frequencies for workloads under study, weranked the �les by popularity (i.e. the number of ac-cesses to each �le), and plotted the results on the log-log scale. Figure 10a) shows the �le popularity overentire duration the logs. Both workloads exhibit verysimilar distribution: the HPLabs curve \follows" theHPC curve, but on a lower scale. This can be ex-plained by almost two orders smaller number of ac-cesses and �les in the HPLabs workload. However,both of these curves are far from �tting a straight lineof Zipf-like distribution. Figure 10 b) shows �les pop-ularity for HPC and HPLabs workloads for the yearlyperiod (of 2000 year), as well as 6-months intervals(the corresponding �rst half-year and second half-yearperiods of 2000 year). HPC curves (both 1-year and6-month) are still far from �tting a straight line ofZipf-like distribution.
However, 6-month curves for HPLabs �t reason-ably well with the straight line of Zipf-like distribu-tion when ignoring the �rst 15-20 �les (in [7], authorsmake similar assumptions about ignoring the top 100documents and a at tail at the end of the curve).The straight line on the log-log scale implies that the�le access frequency is proportional to 1=i�. We ob-tained the values of � using least square �tting: forboth 6-month curves � = 1:6 works very well. Fig-ure 11 c) shows �le popularity distribution for theHPLabs workload corresponding to the 6-month peri-ods of 2000, approximated by Zipf-like function 1=i�,with � = 1:6.
Finally, Figure 11 a) and b) shows �les popularityfor the HPC workload on a monthly basis. Most ofthe monthly curves �t straight line reasonably wellwhen ignoring the �rst 10-15 �les and few last �les.For di�erent months, value of � is ranging from 1.4 to1.6. Figure 11 c) shows �le popularity distribution for
HPC workload during August of 2000, approximatedby Zipf-like function 1=i�, with � = 1:5.
The observation that the �le access frequencies forthe media workloads under study can be approximatedby Zipf-like distribution is very useful for syntheticworkload generation. It is interesting that the timescale plays important role for this approximation.
The high locality of accesses to speci�c subset of�les and the high concentration of the clients access-ing these popular �les shown in Figure 8 a) and b)imply that the popular �les are widely accessed bymany di�erent clients. In HPC workload, �rst 70 �lesare accessed by more than 1000 unique clients, withsome frequent �les accessed by 10; 000�12; 000 uniqueclients. (Note, that for better viewability we used alog scale for �le number/rank).
For HPLabs server, degree of sharing is lower (it isexpected, because of the smaller clients population),but for the most frequent �les it is still very signi�-cant: the �rst 17 �les are accessed by 113�341 uniqueclients.
The sharing exhibited by the clients' access pat-terns is essential for designing an e�cient caching in-frastructure.
Complementary to the characterization of the mostfrequently accessed �les, it is useful to have statisticsabout the \opposites": the percentage of the �les thatwere requested only a few times, and the percentageof active storage these �les account for:
Files Requested Storageup to Requirements for
1/5/10 times Corresponding Files
HPC 16% / 38% / 47% 10% / 26% / 34%HPLabs 19% / 45% / 59 % 17% / 39% / 52%
Table 5: Rarely accessed �les statistics.
As the Table 5 shows, 16% to 19% of the �les areaccessed only once, and 47% to 59% of the �les are ac-
11

a)
0
2000
4000
6000
8000
10000
12000
14000
0 100 200 300 400 500 600 700 800 900
Num
ber
of S
essi
ons/
Day
Day Number
HPC
Sessions
b)
0
50
100
150
200
250
300
350
400
450
500
0 100 200 300 400 500 600 700
Num
ber
of S
essi
ons
per
Day
Day Number
HPLabs
Sessions
Figure 13: Number of sessions per day: a) HPC and b) HPLabs.
cessed less than 10 times. These rarely accessed �lesaccount for quite signi�cant amount of storage: 34%to 52% of total active storage set. These numbers aresomewhat lower compared to the web server work-loads. For web server workloads, \onetimers" (�lesaccessed only once) may account for 20%-40% of the�les and the active storage.
The locality properties of the client references aswell as the complementary knowledge about the rarelyaccessed �les are very important in designing themedia proxy caching strategies and e�cient contentplacement on distributed media servers and mediaproxies. As part of our future work in this direction,we intend to explore the temporal locality of client ac-cesses as well as the degree of �le sharing among theclients. We expect that this information will serve asa basis for using media delivery optimizations such asmulticast.
5 Dynamics and Evolution of
Media Sites
In this section, we investigate speci�c �le access pat-terns discovered through the analysis of the two work-loads under study.
First of all, we observed that the tra�c to both theHPC and the HPLabs sites is very bursty. Figure 13shows total number of media sessions per day for theentire duration of the logs. Some days exhibit twoorders of magnitude higher number of sessions for bothworkloads. We will relate this burstiness to sessionsaccessing new �les later in the section.
For enterprise web servers studied before [8], dailytra�c amount was much more stable and predictable.Other studies of di�erent media workloads [9, 3]contained similar observations about media tra�cburstiness, but the degree of burstiness observed wassmaller, and more correlated with the day of the week,
especially for educational media workloads. Both ofthe mentioned studies analyzed workloads over signif-icantly shorter interval of time: workload in [9] was aweek long, and two workloads in [3] were 1 to 3 monthslong.
Since our logs provide information about the clientaccesses over a long period of time, one of the maingoals of this study is to characterize the dynamics andevolution of media sites over time. The �rst natu-ral step is to observe the introduction of new �les inthe logs, and to analyze the portion of all requestsdestinate for those �les. We de�ne a metric callednew �les impact, to characterize the site evolu-tion due to new content, by computing the ratio ofthe accesses targeting these new �les over time. Fig-ures 14 a) and 15 a) show two curves for HPC andHPLabs workload respectively. The curves show allthe �les which were accessed in a particular month,and all the new �les which were accessed in the samemonth. We de�ne a �le being new if it was not everaccessed before, based on the information in the accesslogs. The HPC site has an explicit growth trend withrespect of total number of �les accessed per month,and consistently steady amount of new �les added tothe site during each month.
The growth of total number of �les accessed eachmonth for HPLabs site is \negative". Since this wasunexpected, we asked the team supporting this sitewhether there were speci�c reasons for the trend weobserved. Speci�cally, we wanted to know if there isa signi�cant number of new video �les that \nobodywatches" and hence the logs don't contain any infor-mation about them or if the actual new media contenton that site decreased over time. The team explainedthat lately they had been adding only a limited num-ber of new �les because they are working on a transi-tion plan to upgrade the entire site design and equip-ment. So, the \negative" trend in the addition of new�les to the site was observed correctly.
12

a)
0
100
200
300
400
500
600
700
800
0 5 10 15 20 25 30
Num
ber
of F
iles
per
Mon
th
Month Number
HPC
All FilesNew Files
b)
0
10000
20000
30000
40000
50000
60000
70000
80000
0 5 10 15 20 25 30N
umbe
r of
Ses
sion
s pe
r M
onth
Month Number
HPC
All SessionsSessions to New Files
c)
0
50
100
150
200
250
300
350
400
0 5 10 15 20 25 30
GB
Tra
nsfe
rred
per
Mon
th
Month Number
HPC
All SessionsSessions to New Files
Figure 14: HPC workload: a) all and new �les per month, b) all sessions and sessions to new �les per month, c)all bytes transferred and bytes transferred due to new �le accesses per month
a)
0
20
40
60
80
100
120
0 5 10 15 20 25
Num
ber
of F
iles
per
Mon
th
Month Number
HPLabs
All FilesNew Files
b)
0
500
1000
1500
2000
2500
3000
0 5 10 15 20 25
Num
ber
of S
essi
ons
per
Mon
th
Month Number
HPLabs
All SessionsSessions to New Files
c)
0
5
10
15
20
25
30
0 5 10 15 20 25G
B T
rans
ferr
ed p
er M
onth
Month Number
HPLabs
All SessionsSessions to New Files
Figure 15: HPLabs workload: a) all and new �les per month, b) all sessions and sessions to new �les per month,c) all bytes transferred and bytes transferred due to new �le accesses per month
a)
0
5000
10000
15000
20000
25000
0 5 10 15 20 25 30
Uni
que
Clie
nts
per
Mon
th
Month Number
HPLabs
Unique Clients
b)
0
100
200
300
400
500
600
0 5 10 15 20 25
Uni
que
Clie
nts
per
Mon
th
Month Number
HPLabs
Unique Clients
Figure 16: Unique clients per month a) HPC and b) HPLabs.
13

a)
0
500
1000
1500
2000
2500
0 50 100 150 200 250 300 350 400 450 500
File
Id
Days (since the files introduction)
HPC
File Accesses
b)
0
50
100
150
200
250
300
350
400
450
0 50 100 150 200 250 300 350 400 450 500
File
Id
Days (since the files introduction)
HPLabs
File Accesses
Figure 17: Files accessed on di�erent days after their introduction.
Figures 14 b) and 15 b) show graphs for HPC andHPLabs workload respectively: the number of all ses-sions per month and the number of sessions to the new�les in this month. These graphs re ect that the ac-cesses to the new �les constitute the most or a very sig-ni�cant portion of all accesses, excluding a few monthsthat were exceptions. Figure 14 c) and Figure 15 c)show very similar trends for the bytes transferred permonth and the bytes transferred due to the accessesto new �les. Since the number of new �les added permonth plays a crucial role in de�ning the site dynam-ics, evolution, and growth trends, evaluating the new�les impact metric becomes important.
Figures 14 c) and 15 c) show the number of uniqueclients per month accessing each of the HPC andHPLabs site correspondingly. Again, the graphs arecorrelated with the trends of the sessions to each site'snew �les. Thus, the client population of enterprisemedia site strongly depends on the amount of new in-formation regularly added to the site.
Dynamics of the enterprise web sites exhibits muchmore stability in terms of the accesses to the \old"documents. Only about 2% of the monthly requestsare to the new �les added that month as shown in [8].Di�erently, the access pattern of enterprisemedia sitesresembles with the access pattern of the news web siteswhere most of the client accesses target newly addedinformation.
6 Life Span of File Accesses
In this section, we attempt to answer the followingquestion: how much does the popularity of the �le andfrequency of �le accesses changes over time? The an-swer to this question is critical for designing prefetch-ing or server-push algorithms, as well as for design ofe�cient content distribution strategies in CDN net-
work for media content.First, we plotted the histograms of accesses for
the most frequent �les. Most of histograms hadlognormal-like curve with majority of accesses occur-ring during the �rst 1-4 weeks and with a sharp declinein the number of sessions after that. File access pat-tern with stable, non-declining amount of sessions overlong period of time was much less typical.
Figure 17 shows the distribution of accesses to �lessince they were introduced at the site. On the x-axisare shown days after the �les introduction; y-axis rep-resent the �le ids, e.g. the dot (100,20) means the the�le with id=100 was accessed on 20th day after its �rstintroduction. The graphs in Figure 17 a) and b) re- ect two interesting observation: in spite of existenceof the \long-lived" �les (i.e. the �les which are stillaccessed 1.5 years later after their introduction, themost of the accesses happen in the �rst two months.
Enterprise media server workloads exhibit high lo-cality of references. As has been shown in Section 4,it was observed that 90% of the media server sessionstarget only 14%-30% of the �les. Thus, this small setof �les has the strong impact on the media site perfor-mance and its access patterns. We de�ne the core-90%as the set of most frequently accessed �les that makesup for 90% of all the media sessions. From the per-formance point of view it is these core �les one shouldconcentrate on to obtain good performance as mostof the accesses are to them. Along with understand-ing the dynamics of all the �les at the site, we wouldlike to see whether the core �les exhibit some speci�cproperties.
We de�ne a life duration for a particular �le to bethe time between the �rst and the last accesses tothis �le in the given workload. Figure 18 shows thedistribution of �le life duration for both workloads.
There are two curves on the graphs representing a
14

a)
0
10
20
30
40
50
60
70
80
90
100
50 100 150 200 250 300 350 400 450 500
File
s (%
)
Days (between the first and the last file accesses)
HPC
FilesFiles (Core-90%)
b)
0
10
20
30
40
50
60
70
80
90
100
50 100 150 200 250 300 350 400 450 500
File
s (%
)
Days (between the first and the last file accesses)
HPLabs
FilesFiles (Core-90%)
Figure 18: Days between the �rst and last �le accesses.
a)
30
40
50
60
70
80
90
100
20 40 60 80 100 120 140 160 180 200
Ses
sion
s (%
)
Days (since the files introduction)
HPC
All SessionsSessions (Core-90%)Sessions (Non-Core)
b)
30
40
50
60
70
80
90
100
20 40 60 80 100 120 140 160 180 200
Ses
sion
s (%
)
Days (since the files introduction)
HPLabs
All SessionsSessions (Core-90%)Sessions (Non-Core)
Figure 19: Percent of sessions on days between the �rst and last �le accesses.
life duration distribution for all the �les and for thecore �les. Our analysis shows that high percentageof all �les have a short life duration: �les that \live"less than a month constitute 37% of all the �les in theHPC workload and 50% of all the �les in the HPLabsworkload (this number is partially so high, because 16-19% of all the �les are accessed only once as reportedin Section locality). 73% of all the �les for both work-loads have a life duration less than 6 months. Only10% of �les for the HPL site and 8% for the HPC sitelive longer than a year. As for the frequently accessed�les, much higher percentage of them live longer com-pared to the life duration of all the �les. And addition-ally, the \short-lived" frequent �les in the graphs aremostly represented by the recently introduced �les.
For the �les of di�erent life duration, we introduce anew metric, called a life span metric, which is de�nedas the cumulative distribution of accesses to the �lessince their introduction at a site.
Figure 19 shows the life span of the �le's accessesfor both workloads. The x-axis re ects the days sincethe �les introduction; the y-axis represents the cumu-lative percentage of all the �le accesses up to this day
(relative to the total number of all the sessions overthe entire duration of the logs).
For HPC (HPLabs) workload, 52% (51%) of all thesessions occur during the �rst week of �les existence,68% (61%) of all the sessions occur during two weeksof the �les existence, 74% (66%) - during three weeksof �les existence, 77% (69%) - during four weeks of�les existence, 80% (70%) - during �ve weeks of the�les existence. Thus, HPLabs site has longer life spanfor their �les than HPC site.
Above statistics can be interpreted in a di�erentway, re ecting the rate of changes of the accesses ina given workload: 52% (51%) of all the sessions oc-cur during the �rst week of �le existence, followed byonly 16% (10%) of accesses during the second week,decreasing 6% (5%) of accesses during the third week,and only 3% (1%) - of accesses for 4th and 5th weekssince the �le introduction.
Life span of core-90% �les is almost identical withlife span of all the �les. It is not surprising, because byde�nition the core-90% �les represent 90% of all theaccesses to the site. Their properties have major im-pact on characteristics of life span for the whole site.
15

As for the rest of the �les (non-core �les), their prop-erties are di�erent for the HPC and the HPLabs work-loads. For example, for the HPC workload, 70% of thesessions to non-core �les occur during �rst 42 days af-ter the �les introduction, while for the HPL workload,70% of corresponding sessions occur during the �rst21 days after the introduction of the �les.
The life span metric is a normalized metric. The�les could have been individually introduced at dif-ferent times. The metric re ects the rate of change ofthe �le access pattern during the �les' existence at thesite. Moreover, the life span metric re ects the time-liness of the introduced �les. Longer life span meansthat media information on a site is less timely and hasmore consistent percentile of accesses over a longer pe-riod of time. Life span metric allows one to interpolatethe intensity of the client accesses to the new and theexisting �les over a future period of time.
We believe that locality properties, access patternsof newly introduced �les, and their life span are criticalmetrics in de�ning the e�cient caching infrastructureand future content delivery systems.
7 Conclusion and Future Work
Media server access logs are invaluable source of infor-mation not only to extract business related informa-tion, but also for understanding tra�c access patternsand system resource requirements of di�erent mediasites. Our tool MediaMetrics is specially designedfor system administrators and service providers to un-derstand the nature of tra�c to their media sites. Is-sues of workload analysis are crucial to properly de-signing the site, and its support infrastructure, espe-cially for large, busy media sites.
Our analysis aimed to establish a set of propertiesspeci�c for the enterprise media server workloads andcompare them with the well known related observa-tions about the web server workloads. In particular,we observed high locality of references in media �leaccesses for both workloads. Similar to previous webworkloads studies, our analysis of the media �le pop-ularity distribution revealed that it can be approxi-mated by Zipf-like distribution with � parameter ina range 1.4-1.6. The interesting new observation isthat the time scale plays an important role in thisapproximation. We considered 1-month, 6-month, 1-year and the entire duration of the logs as a time scalefor our experiments. For the HPLabs workload, thedistribution of the clients accesses to the media �leson a 6-month scale starts to �t Zipf-like distribution.While for the HPC workload, the �le popularity on amonthly basis can be approximated by Zipf-like dis-tribution. For longer time scale in the same workloads
{ the �le access frequency distribution does not followa Zip�an distribution.
We introduced the new �les impactmetric for enter-prise media workloads, which re ects that accesses tothe new �les constitute most of the monthly accesses,and the bytes transferred due to the accesses to thenew �les account for most of the transferred bytes.Also, we observed that the growth trend in the siteaccesses directly depend on the amount of the newlyadded �les.
We de�ned a life span metric to re ect the rate ofchange in the accesses to the newly introduced �les.For the studied workloads, 51%-52% of the accessesto the media �les occur during the �rst week of theirintroduction. This stresses a high temporal locality ofthe accesses in media server workloads which is consis-tent with observations in other media workload stud-ies.
Additionally, we also discovered some interestingfacts about the clients' viewing behavior. Despite thefact that the two studied workloads had signi�cantlydi�erent �le size distribution, the clients' viewing be-havior was very similar for the both sets: 77%-79% ofmedia sessions were less than 10 min long, 7%-12% ofthe sessions between 10-30 min, and only 6%-13% ofsessions continued for more than 30 min. This re ectsthe browsing nature of most of the enterprise client ac-cesses. We also found that the percentage of sessionswith interactive requests are much higher for mediumand long videos.
In our future work, we are planning to exploit thelocality properties of the client references and thespeci�cs of client viewing behavior for designing e�-cient media proxy caching strategies, appropriate con-tent placement at distributed media servers and mediaproxies, as well as in using multicast for better band-width utilization.
References
[1] S. Acharya, B. Smith. An experiment to char-acterize videos stored on the web. In Proc. ofACM/SPIE Multimedia Computing and Net-working 1998, January 1998.
[2] S. Acharya, B. Smith, P.Parnes. CharacterizingUser Access to Videos on the World Wide Web.In Proc. of ACM/SPIE Multimedia Computingand Networking. San Jose, CA, January 2000.
[3] Almeida, J. M., J. Krueger, D. L. Eager, and M.K. Vernon. Analysis of Educational Media ServerWorkloads, Proc. 11th Int'l. Workshop on Net-work and Operating System Support for DigitalAudio and Video (NOSSDAV 2001), June 2001.
16

[4] V. Almeida, A. Bestavros, M. Crovella,A. Oliviera. Characterizing reference locality inthe WWW. In Proc. 4th Int. Conf. Parallel andDistributed Information Systems (PFIS), pp.92{106. IEEE Comp. Soc. Press,1996.
[5] M. Arlitt and C. Williamson. Web server work-load characterization: the search for invariants.In Proceedings of the ACM SIGMETRICS '96Conference, Philadelphia, PA, May 1996.
[6] P. Barford, A. Bestavros, A. Bradley, andM. Crovella. Changes in web client access pat-terns: characteristics and caching implications.Technical Report, Boston University, TR-1998-023, 1998.
[7] L.Breslau, P.Cao, L.Fan, G.Phillips, S.Shenker.Web Caching and Zipf-like Distributions: Evi-dence and Implications. In Proceedings of IEEEINFOCOM 1999, March 1999.
[8] L. Cherkasova, M. Karlsson: Dynamics and Evo-lution of Web Sites: Analysis, Metrics and DesignIssues. In Proceedings of the Sixth InternationalSymposium on Computers and Communications(ISCC'01), Hammamet, Tunisia, July 3-5, 2001.
[9] M.Chesire, A.Wolman, G.M.Voelker, H.M.Levy.Measurement and Analysis of a Streaming MediaWorkload. Proceedings of the 3rd USENIX Sym-posium on Internet Technologies and Systems,San Francisco, CA, March 26-28, 2001.
[10] F. Douglis, A. Feldmann, B. Krishnamurthy, andJ.Mogul, \Rate of change and other metrics: Alive study of the World Wide Web". In Pro-ceedings of the USENIX Symposium on InternetTechnologies and Systems, December 1997.
[11] Content Networking. Inktomi Corp.http://www.inktomi.com.
[12] L.He, J.Grudin, A.Gupta. Designing Presenta-tions for On-Demand Viewing. In Proceedings ofACM 2000 Conference on Computer SupportedCooperative Work, Philadelphia, PA, Dec., 2000.
[13] N.Harel, V. Vellanki, A. Chervenak, G. Abowd,U. Ramachandran. Workload of a Media-Enchanced Classroom Server.In Proceedings of IEEE on Workload Character-ization, October, 1999.
[14] D. Loguinov, H. Radha. Measurement Study ofLow-bitrate Internet Video Streaming. In Pro-ceedings of the ACM SIGCOMM Internet Mea-surement Workshop San Francisco, California,USA, November 2001.
[15] A. Mena, J. Heidemann. An Empirical Study ofReal Audio Tra�c. In Proceedings of the IEEEInfocom, p. 101-110. Tel-Aviv, Israel, March,2000.
[16] J.Padhye, J.Kurose. An Empirical Study of ClientInteractions with Continuous-Media CousewareServer. Proc. 8th Int'l. Workshop on Network andOperating System Support for Digital Audio andVideo (NOSSDAV 1998), July 1998.
[17] RealServer administration Guide { RealSyztemG2. RealNetworks, Inc., Nov.1998.http://docs.real.com/docs/serveradminguideg2.pdf
[18] Wang, M. Claypool, Z.Zuo. An Empirical Studyof RealVideo Performance Across the Internet.In Proceedings of the ACM SIGCOMM InternetMeasurement Workshop San Francisco, Califor-nia, USA, November 2001.
[19] Windows Media Services SDK, Version 4.1.Microsoft Corporation.http://msdn.microsoft.com/workshop/imedia/windowsmedia/sdk/wmsdk.asp
17

A APPENDIX
A.1 Windows Media Server Log For-
mat
An entry in the Windows Media Server logs looks like:
15.128.147.57 1999-12-30 08:00:01
jujug57.grenoble.hp.commms://desktvplus.cup.hp.com/carly/dec23_99.asf0 231 1 200 {ef93d2da-77d2-11d3-99be-0060b0c2ea9a}6.4.5.809 fr-FR - - mplayer2.exe 6.4.5.809
Windows_NT4.0.0.1381 Pentium 231 489154 16821mms UDP Voxware_MetaSound - - 495492 495492903 903 0 0 0 0 0 0 2 10 100
15.14.200.234 desktvplus.cup.hp.com 3 0
In our analysis, we used only a subset of entries,which we describe below.
Entry Value
1st 15.128.147.572nd 1999-12-303rd 08:00:015th mms://desktvplus.cup.hp.com/carly/dec23 99.asf6th 07th 2318th 120th 48915421st 1682127th 49549228th 49549242rd 343th 0
Names used for describing the entries below are thesame as used by Microsoft.
� c-ip: 1st entry in the logs, the client IP address. Aclient connected via proxy provides a client proxyserver IP address.
� date: 2nd entry in the logs, the date (in Green-wich mean time) when an entry is generated inthe log �le.
� time: 3rd entry in the logs, the time (in Green-wich mean time) when an entry is generated inthe log �le.
� cs-uri-stem: 5th entry in the logs, the name ofthe �le that is playing, an .asf �le for a unicastand an .asx �le for a multicast. Notice that this�eld is actually a URL, so the �le name has to beextracted.
� c-starttime: 6h entry in the logs, the timestamp(in seconds) of the stream when an entry is gen-erated in the log �le.
� x-duration: 7th entry in the logs, the length oftime a client played content prior to a client event
(fast-forward, rewind, pause, stop, or jump tomarker). A log entry is generated whenever oneof these client events occurs.
� c-rate: 8th entry in the logs, the mode of Win-dows Media Player when the last command eventwas sent.
� 1 = Windows Media Player was pausedor stopped during a play, fast-forward,rewind, or marker jump operation.
� -5 = Windows Media Player was re-wound from a play, stop, or pause op-eration.
� 5 = Windows Media Player was fast-forwarded from a play, stop, or pauseoperation.
� �lelength: 20th entry in the logs, the length of the�le (in seconds). This value is 0 for a live stream.
� �lesize: 21st entry in the logs, the size of the �le(in bytes). This value is 0 for a live stream.
� avgbandwidth: 22nd entry in the logs, the aver-age bandwidth (in bits per second) at which theclient was connected to the server.
� sc-bytes: 28th entry in the logs, the bytes sent bythe server to the client.
� c-bytes: 29th entry in the logs, the number ofbytes received by the client from the server. Fora unicast, c-bytes and sc-bytes must be identical.If not, packet loss occurred.
� s-totalclients: 43rd entry in the logs, the numberof clients connected to the server (but not neces-sarily receiving streams).
� s-cpu-util: 44th entry in the logs, the average loadon the server processor (0%-100%). If multipleprocessors exist, this value is the average for allprocessors.
A.2 Real Media Server Log Format
An entry in the Real Media Server logs looks like:
15.0.143.56 - - [06/Jul/1999:15:12:58 -0700]"GET coffee/HPL-990621.rm PNA/10"
200 893325 [WinNT_4.0_6.0.6.33_play32_LF60_en-US_686][8a3ca9b0-0717-11d3-9aa6-00108300ef70][Stat1: 228 0 0 0 0 16_Kbps_Music_-_High_Response]
[Stat2: 15936 10192 0 0 0 0 0 0 0 0 942216_Kbps_Music_-_High_Response]74612852 2932 54 0 0 1
In our analysis, we used only a subset of entries,which we describe below.
18

Entry Value1st entry 15.0.143.563rd entry [06/Jul/1999:15:12:58 -0700]4th entry GET co�ee/HPL-990621.rm12th entry 7461285213th entry 2932
2nd �eld in 11th entry 101927th entry 893325
Names used for entries mostly the same as used byREAL. Only in few cases special names are used, whensome of the values were derived (to make the dataanalysis uniform across di�erent server types: Win-dows Media Server and Real Media Server). The en-tries are described below in the same as for MicrosoftMedia Server logs, for consistency.
� IP address: 1st entry in the logs, the IP addressof client.
� timestamp: 3th entry in the logs (2nd entry is --, for compatibility with the web server logs), thetime that client accessed the �le in the format
[<dd>/<Mmm>/<yyyy>:<hh>:<mm>:<ss><TZ>]
where TZ is the time zone expressed as the num-ber of hours relative to the Coordinated Univer-sal Time (Greenwich, England). Notice that thistime stamp contains both date and time �elds.
� GET �lename: 4th entry in the logs, the nameof the �le requested by client. Notice that this isthe �le name, not the URL.
� �le size: Depending on how many options arepresent in the logs, this would be the 11th en-try (if none or one option is present), 12th entry(if two options are present { as is the case forour logs), or 13th entry (if all three options arepresent in the logs). It provides the �le size inbytes (the �le requested by the client).
� �le time: The entry next to the �le size entry,contains the duration of the �le being played bythe client.
� Client BPS: 2nd �eld in the 11th log entry (no-tice that 11th log entry is optional in the logs,may be absent), the bandwidth available to theclient when it was viewing the �le. Notice thatthis �gure varies depending on the network con-ditions.
� bytes sent: 7th entry in the logs, the number ofbytes transferred to client during play. This �eldmay be lower than the total size of the media �le,indicating partial playback of the �le. If this �eldis consistently low for some or all media �les, itmay mean that RealPlayers are able to connectto your server, but are unable to play �les.
� Bytes Received: derived value. The 1st �eld inthe 10th log entry (notice that 10th log entry isoptional, may be absent) contains the total pack-ets sent by the server. The 3rd �eld in the 10thlog entry contains the number of missing packets.From this information and some additional infor-mation (such as bytes sent by the server and totalpackets sent by server), we can derive the bytesreceived by the client).
19
Related Documents