Analysis of Energy Infrastructures and Potential Impacts from an Emergent Hydrogen Fueling Infrastructure Andy Lutz, Dave Reichmuth Sandia National Laboratories Livermore, CA June 9, 2009 Sandia is a multiprogram laboratory operated by Sandia Corporation, a Lockheed Martin Company, for the United States Department of Energy’s National Nuclear Security Administration under contract DE-AC04-94AL85000.

Analysis of Energy Infrastructures and Potential Impacts from an Emergent Hydrogen Fueling Infrastructure Andy Lutz, Dave Reichmuth Sandia National Laboratories.
Dec 14, 2015
Welcome message from author
This document is posted to help you gain knowledge. Please leave a comment to let me know what you think about it! Share it to your friends and learn new things together.
Transcript

Analysis of Energy Infrastructures and Potential Impacts from an Emergent
Hydrogen Fueling Infrastructure
Andy Lutz, Dave Reichmuth
Sandia National Laboratories
Livermore, CA
June 9, 2009
Sandia is a multiprogram laboratory operated by Sandia Corporation, a Lockheed Martin Company,for the United States Department of Energy’s National Nuclear Security Administration
under contract DE-AC04-94AL85000.

2
System dynamics projects behavior of vehicle and energy markets
Market Interactions • Compete PHEVs with HFCVs
– H2 from NG by reforming– PHEVs affect electric & gasoline
demand• In CA, electricity demand strongly
coupled to NG
Regulatory Issues• CA Renewable Portfolio Std
– 33% by 2020• Carbon tax on fossil fuels• CAFE standard on gasoline vehicles
Natural Gas
Gasoline
VehicleChoice
Electricity
H2 viaSMR

3
Model economics for NG, electricity, and gasoline
Electricity• Supply:
– Imports (31% in 2007)• Coal (54% of imports)
– In-state production• Must-run: nuclear, hydro,
geo, solar, wind, biomass
• Variable: NG• Demand:
– Historical load data with hourly resolution (Cal-ISO over 1 yr)
– Daily PHEV charging• Price:
– Weighted average of fixed & variable generation costs
– Fill hourly demand with must-run, then NG
Natural Gas• Supply:
– Imports & in-state production
• Demand:
– Electric generation
– Industrial, commercial, residential, and CNG vehicles (fixed)
– HFCV demand from SMR
• Price:
– Market elasticity• Long & short term
– Determines H2 price
Gasoline• Supply:
– Refinery capacity for CA compliant gasoline
• Demand:
– Conventional and PHEV consumption
• Price:
– Oil price specified in time
– Refining margin modeled with market elasticity
• Short-term elasticity for supply
• Long-term elasticity identifies major capacity additions

4
Assumptions
Infrastructure Model• Electric Supply
– NG generation adjustable– Other generation is “must run”– No elasticity in supply/demand – Plug-in vehicles are re-charged at
night
• Natural Gas Supply– Supply elasticity for CA market– Imported and domestic supply
• Gasoline Supply– Oil price: linear projection– Elasticity for CA refinery supply
• Hydrogen Supply– 1 path: Distributed SMR
Vehicle Model• Conventional vehicles
– Gasoline fueled: 20 mpg
• Plug-in Hybrid Electric Vehicles– 48 mpg in gasoline mode– 0.35 kWh/mile electric mode– 1/3rd of miles in gasoline mode
(40-mile electric range)
• Hydrogen Fuel Cell Vehicles– 65 mi/kg
• Vehicle adoption– Adjusted to Scenario #1 of Greene et
al (ORNL, 2008) – 6% yearly sales rate– 20 year vehicle lifetime (5% scrap
rate)

5
Vehicle adoption model borrowsfrom more sophisticated studies
• Use elements of Struben & Sterman model (MIT)
– Willingness to adopt parameterized by marketing and word-of-mouth
– Vehicle sales depend on potential sales share and affinity
– Affinity of vehicle choice depends on a performance metric• Fuel cost and efficiency (mileage) for cost per mile• Add an incremental cost for alternative vehicles, adjusted in time to follow a
learning curve
j
jjjjjjj
j VNN
VWcW
dt
dW;;1
1Exp;;
j
refj
jj
jjjj
j
PP
aaW
aW
dt
dN
dt
dV
6
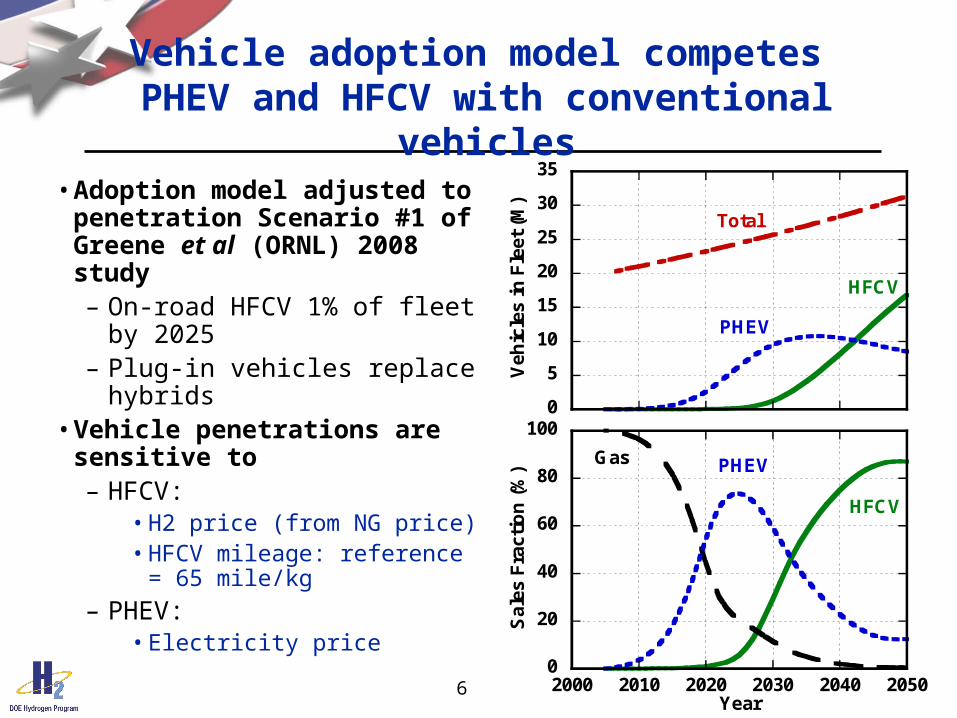
Vehicle adoption model competes PHEV and HFCV with conventional vehicles
• Adoption model adjusted to penetration Scenario #1 of Greene et al (ORNL) 2008 study– On-road HFCV 1% of fleet by
2025 – Plug-in vehicles replace
hybrids • Vehicle penetrations are
sensitive to– HFCV:
• H2 price (from NG price)• HFCV mileage: reference = 65
mile/kg
– PHEV:• Electricity price
0
20
40
60
80
100
2000 2010 2020 2030 2040 2050
Sa
les
Fra
ctio
n (
%)
Year
HFCV
PHEVGas
0
5
10
15
20
25
30
35
Ve
hic
les
in F
leet
(M
)
Total
PHEV
HFCV

7
Penetration of PHEV and HFCV increases H2 and NG costs
• Gasoline price flattens with reduced demand
– Linear increase in oil price• From 65 $/bbl to 140 $/bbl at 2030
– Refining margin decreases, eventually to point where model becomes artificial at low demand
• Electricity price grows due to PHEV demand
• NG price increases due to both PHEV and HFCV demand
– Consumption at 2050 approaches existing pipeline capacity
• H2 price tracks NG for SMR– SMR is only path to H2
• Initial Prices:– Elect = 12 ¢ / kWh– Gas = 2.50 $ / gal – NG = 9 $ / GJ – H2 = 3.20 $ / kg
0
20
40
60
80
100
NG
Su
pp
ly C
ap
acit
y (
%)
0
50
100
150
200
2000 2010 2020 2030 2040 2050
NGElectGasolineH2
Pri
ce
Ch
ang
e (%
)
YearPrice change relative to 2005

8
HFCVs must achieve high mileage to overcome plug-in vehicles
• HFCV mileage– Reference case: 65 mi/kg
– At 55 mi/kg, affinity for HFCV is less than affinity for PHEV
• PHEV mileage– 48 mpg in gasoline mode
– 0.35 kWh/mile electric mode
– 1/3rd of miles in gasoline mode
• Based on National Household Travel Survey
• 40 mile electric range
0
5
10
15
20
25
30
35
Ve
hic
les
in F
leet
(M
)
Total
PHEVHFCV
0
20
40
60
80
100
2000 2010 2020 2030 2040 2050
Sa
les
Fra
ctio
n (
%)
Year
HFCV
PHEVGas

9
Growth in average electric load causes NG capacity to exceed existing infrastructure by 2025
0
5
10
15
20
25
30
35
Ve
hic
les
in F
leet
(M
)
Total
PHEV
HFCV
• Electric load grows at 1% / year– Growth alone increases NG price
170% and electricity price 40%
• Vehicle choice– Higher average electric loads drive
up NG price faster than electricity, favoring PHEVs over HFCVs
0%
50%
100%
150%
200%
250%
2000 2010 2020 2030 2040 2050
Pri
ce
chan
ge
(%)
NG
Electricity
E growth + vehicles
Price change relative to 2005
70
80
90
100
110
120
2000 2010 2020 2030 2040 2050
NG
Su
pp
ly C
ap
acit
y (
%)
E growth only
E growth + Vehicles
Vehicles only
10
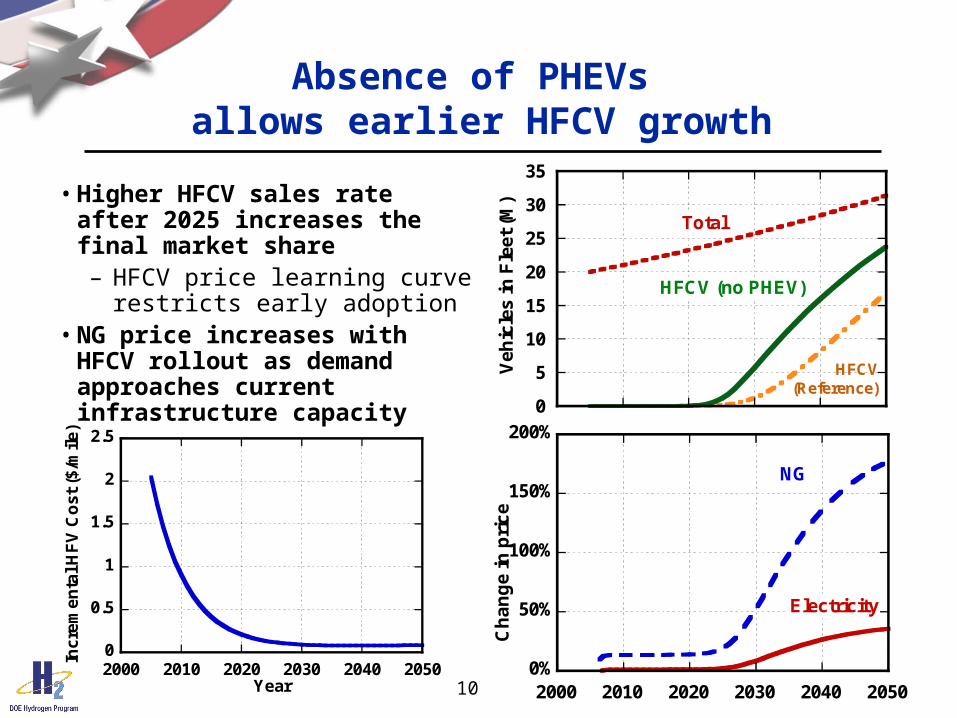
Absence of PHEVs allows earlier HFCV growth
0%
50%
100%
150%
200%
2000 2010 2020 2030 2040 2050
Ch
an
ge
in p
ric
e
NG
Electricity
0
5
10
15
20
25
30
35
Ve
hic
les
in F
leet
(M
)
Total
HFCV(Reference)
HFCV (no PHEV)
• Higher HFCV sales rate after 2025 increases the final market share– HFCV price learning curve
restricts early adoption• NG price increases with HFCV
rollout as demand approaches current infrastructure capacity
0
0.5
1
1.5
2
2.5
2000 2010 2020 2030 2040 2050
Inc
rem
en
tal H
FV
Co
st (
$/m
ile)
Year

11
Carbon tax increases both PHEV and HFCV - at least for CA
• Change in vehicle fleet compared to non-taxed reference case
– PHEV bumped up
– HFCV grow as before
• Conclusion not likely true for other regions!
• Carbon Tax at 200 $ / tonne – 1.76 $/gal gasoline– 1.85 $/kg H2– 0.11 $/kWh electricity
• Tax influence on fuel cost– PHEV ~ 5 ¢ / mile tax– HFCV ~ 3 ¢ / mile tax– Gasoline ~ 9 ¢ / mile tax
California Electricity
Coal
Hydro
Natural Gas
Nuclear
Renew
-4
-3
-2
-1
0
1
2
3
4
2000 2010 2020 2030 2040 2050
Ch
an
ge
in V
ehic
le F
leet
(M
)
Gasoline
PHEV
HFCV

12
Summary
• System dynamics approach allows analysis of energy infrastructures– Model describes market behavior of interconnected infrastructures– HFCV market adoption varies with costs of NG, gasoline, electricity
• Simulations suggests that a transition to PHEV will increase NG price through electricity demand– Since model assumes SMR to H2 only, HFCV competes with PHEV
• Electric load growth (alone) is enough to stress CA’s NG market– Capacity to import gas from will be exceeded by 2035– Aggressive HFCV scenario based on H2 from reforming will move the
NG capacity problem up a decade• Carbon tax will favor the adoption of both PHEV and HFCV• Renewable power will free up NG for supplying HFCV

13
Future Work
• Remainder of FY09:– Dynamics of NG pipeline and storage system
• Canadian NG demand in winter reduces flow to California
• Flow to CA in fall fills storage for winter
• Weekday / weekend demand changes
– Electrolysis option for H2 production• Compete off-peak H2 production with PHEV charging
• Enable renewable H2 with growth in solar/wind
– Model construction of additional electric generation capacity – Peer Review:
• Local connections with UC Davis ITS and CA-Fuel Cell Partnership
• FY10:– Extend SD approach to another region in US– Modify electrical generation model for regional mix
14
Extras

15
Aggressive renewable electricity frees NG supply and increases HFCVs
0
5
10
15
20
25
30
35
Ve
hic
les
in F
leet
(M
) Total
PHEV
HFCV
-80%
-60%
-40%
-20%
0%
20%
40%
2000 2010 2020 2030 2040 2050
Ch
an
ge
in p
ric
e
NG
Electricity
• Increasing renewable power – reduces NG demand– increases electricity price– HFCVs sales rise quickly in
response to low NG price
• California’s goal of 33% renewable electricity by 2020 requires over 1000 MW/yr of new renewable capacity – At linear rate of capacity
increase, would result in 78% renewable power in 2050
• Caveat: model does not consider limits to potential for renewable power!
Related Documents