ANALYSIS OF ELECTRONIC WASTE RECYCLING IN THE UNITED STATES AND POTENTIAL APPLICATION IN CHINA Shumeng Liu Advisor: Professor Nickolas J. Themelis Submitted in partial fulfillment of the requirements for the degree of Master of Science in Earth Resources Engineering Department of Earth and Environmental Engineering Fu Foundation School of Engineering and Applied Science Columbia University December 2014 Research co-sponsored by

Welcome message from author
This document is posted to help you gain knowledge. Please leave a comment to let me know what you think about it! Share it to your friends and learn new things together.
Transcript
ANALYSIS OF ELECTRONIC WASTE RECYCLING IN
THE UNITED STATES AND POTENTIAL
APPLICATION IN CHINA
Shumeng Liu Advisor: Professor Nickolas J. Themelis
Submitted in partial fulfillment of the requirements for the degree of Master of Science in Earth Resources Engineering
Department of Earth and Environmental Engineering
Fu Foundation School of Engineering and Applied Science Columbia University
December 2014
Research co-sponsored by

EXECUTIVE SUMMARY
With increasing consumption of electrical and electronic products worldwide, the generation of
electronic waste (e-waste) is growing rapidly, both in developed and developing countries. It is
reported that in 2012 the generated amount in the U.S. was about 9.4 million tons and in China
7.3 million tons, just next to the U.S. The global e-waste generation amount in the same year was
estimated at 49 million tons. Some measures have been taken to address this problem in
developed countries, such as various electronic waste recycling programs carried out by
municipalities, companies, and non-profit organizations. At the same time, technologies for
electronic waste recycling are being developed for recovering valuable materials from e-waste
and treating hazardous materials properly. However, these activities are at an initial stage, since
the estimated fraction of electronic waste actually recycled is still less than 30% in the U.S..
Another problem is the illegal export of electronic waste by recyclers from developed countries
to less developed countries, such as China. China, as the largest acceptor and the second largest
producer of electronic waste, has become the major sink of the world’s electronic waste.
This study analyzed the electronic waste recycling system in the U.S. as an example of
established such systems in developed countries. Then, the present collecting and disposing
situation of electronic waste in China was examined in detail, including e-waste collection and
recycling in both formal and informal chains. The potential of applying the western electronic
waste recycling systems into China was then further explored as well as the environmental and
social benefits that could be hopefully achieved through this.
China is now taking care of 20% of electronic waste generated globally. About 38% of this
e-waste is recycled by informal recyclers who use primitive recycling methods to recover
valuable materials, leading to serious environmental pollution. Ironically, due to the existence of
informal recyclers, the amount of electronic waste available to formal recyclers, who conduct
environmentally responsible recycling, is just around 18% of the total, far from sufficient to

support the capital investment in processing technologies and costly air pollution control systems
and much of the existing facilities for e-waste recycling are idle.
The problem should be tackled from the perspectives of both regulation and technology.
Regulation support is the most critical issue in solving the electronic waste problem in China and
should be provided in order to prohibit illegal import of e-waste and promote responsible
recycling of the e-waste generated within the country. To prohibit illegal import, Chinese
government should improve existing regulations to avoid loopholes allowing electronic waste
import and at the same time strengthen the inspection to enforce the implementation. To promote
responsible electronic recycling, well-defined Extended Producer Responsibility should also be
established and fully implemented.
From a technology perspective, a combination of existing manual dismantling pre-processing in
China and more advanced western end-processing technology was proposed by a Chinese
researcher in 2012, which was further calculated in this thesis. Annually, about 75 million tons of
raw materials could be conserved and 0.22 million tons of hazardous materials could be avoided
by adopting the proposed recycling chain. Also, a large amount of non-renewable energy and
associated greenhouse gas emissions could be avoided, due to the energy consumption difference
between using virgin or recycled material, which may lead to price reduction of electrical and
electronic products in the future.
The industrialization and regulation of each sector (collection, second-hand market,
refurbishment, remanufacturing, recycling) in electronic waste recycling system is recommended
for China. However, because of the existence of informal sectors in China, it could hardly be
lucrative for formal industries in current situation. Therefore, the Chinese government can play a
critical role in encompassing in this effort, as much as possible, the people engaged in the
informal sectors. It is suggested that, at the beginning, the industrialization of e-waste recycling

and processing be a state-owned enterprise. After it is well developed under the guidance and
investment of the government, it can then be privatized and driven by the market.
ACKNOWLEDGEMENTS
First and foremost, I wish to thank my advisor for, Professor Nickolas J. Themelis for his
valuable guidance during my research process. His patience, motivation, enthusiasm and
immense knowledge showed me the way to my research. Thanks are also due to Liliana
Themelis for her kindness to me during my time in New York.
In addition, I am grateful to thank Dr. Lili Liu of Tsinghua University for sharing her knowledge
about current Chinese electronic waste recycling situation with me.
Last but not least, I would like to thank my parents and friends for their support, company and
love throughout my academic career.
Shumeng Liu, New York City, December 4th, 2014

I
TABLE OF CONTENTS ABBREVIATION AND ACRONYMS ........................................................................................ V 1 Introduction .................................................................................................................................. 1
1.1 Definition of electronic waste ........................................................................................... 1 1.2 E-waste generation in different countries ......................................................................... 2 1.3 Composition of e-waste .................................................................................................... 3
1.3.1 Material composition and metal content of typical end-of-life e-waste ................ 4 1.3.2 Hazardous materials in e-waste ............................................................................. 5 1.3.3 Urban mining potential .......................................................................................... 6
2 E-waste Management System in the United States ...................................................................... 7 2.1 E-waste management regulations ..................................................................................... 7
2.1.1 Federal legislations ................................................................................................ 7 2.1.2 State legislations .................................................................................................... 7
2.2 E-waste recycling initiatives and recycling programs in the U.S. .................................... 9 2.2.1 E-waste recycling initiatives .................................................................................. 9 2.2.2 E-waste recycling programs ................................................................................. 11
2.3 Advanced recycling technologies in the United States ................................................... 14 2.3.1 Certification programs for electronics recyclers .................................................. 14 2.3.2 Recycling technologies ........................................................................................ 16
2.4 Export of e-waste from the United States ....................................................................... 26 3 Electronic Waste Issues in China ............................................................................................... 29
3.1 The e-waste sink of the world: China ............................................................................. 29 3.2 Channels for importing e-waste to China ....................................................................... 29 3.3 Collection of e-waste in China ........................................................................................ 31
3.3.1 Informal collection ............................................................................................... 32 3.3.2 Formal collection ................................................................................................. 33
3.4 Environmental issues associated with e-waste treatment in China ................................. 35 3.4.1 Informal recycling ................................................................................................ 37 3.4.2 Formal recycling .................................................................................................. 39
4 Potential Application of Advanced E-waste Management System in China ............................. 41 4.1 Technology support ........................................................................................................ 41
4.1.1 Proposed e-waste recycling chain ........................................................................ 41 4.1.2 Technology obstacles and recommendations ....................................................... 43
4.2 Regulation support .......................................................................................................... 45 4.3 Industrialization .............................................................................................................. 47
5 Environmental and Social Benefits Analysis ............................................................................. 49 5.1 Electrical and electronic equipment ready for end-of-life management in China .......... 49
5.1.1 Domestic generation ............................................................................................ 49 5.1.2 Imported e-waste .................................................................................................. 53
5.2 Environmental analysis ................................................................................................... 56

II
5.2.1 Raw materials conservation ................................................................................. 57 5.2.2 Hazardous materials reduction ............................................................................. 61 5.2.3 Energy saving ....................................................................................................... 63 5.2.4 GHG reduction ..................................................................................................... 67
5.3 Social analysis ................................................................................................................. 69 6 Conclusions ................................................................................................................................ 71 REFERENCE ................................................................................................................................ 73 APPENDIX A: Definition of e-waste in European Union APPENDIX B: Environmental and occupational impact of informal recycling

III
LIST OF TABLES Table 1 E-waste category pursuant to the EU Directive 2012/19 ........................................... 1 Table 2 Material composition of typical end-of-life e-waste .................................................. 4 Table 3 Metal content in PCB of typical end-of-life e-waste ................................................. 4 Table 4 Principal hazardous substances in e-waste ................................................................ 5 Table 5 Metal content in different raw materials .................................................................... 6 Table 6 Value-share of metals in electronics .......................................................................... 6 Table 7 Impurity distributions during Noranda smelting ..................................................... 26 Table 8 Leaching agents in hydrometallurgical process ....................................................... 40 Table 9 Regulations and laws related to e-waste management in China .............................. 45 Table 10 Domestic generation of e-waste in China (million units) ...................................... 49 Table 11 Average weight of each type of electrical or electronic products .......................... 50 Table 12 Weight of domestic e-waste in China (million tons) ............................................. 51 Table 13 Detailed breakdown of different e-waste category (2010, MIT) ........................... 55 Table 14 Average weight of each unit in different types of e-waste products ..................... 55 Table 15 Annual imported e-waste in China ........................................................................ 56 Table 16 Recycled raw materials .......................................................................................... 59 Table 17 Raw materials content in e-waste .......................................................................... 59 Table 18 Potential recoverable raw materials from e-waste by informal recyclers in China
(2015) ............................................................................................................................ 60 Table 19 Potential recoverable raw materials from e-waste by formal recyclers in China
(2015) ............................................................................................................................ 60 Table 20 Potential recoverable raw materials from e-waste through proposed recycling
chain in China (2015) .................................................................................................... 61 Table 21 Raw materials conservation further achieved if proposed recycling chain adopted
....................................................................................................................................... 61 Table 22 Heavy metal content in e-waste (g/unit) ................................................................ 62 Table 23 Extra Hazardous Materials Reduction Achieved by Adopting Proposed E-waste
Recycling Chain (2015) ................................................................................................ 62 Table 24 Energy consumption intensity for materials’ primary production and recovery ... 65 Table 25 Energy consumption for primary materials production and materials recovery ... 67 Table 26 Potential energy saving achieved by recycling e-waste (2015) ............................. 67 Table 27 GHG emissions intensity of materials’ primary production and recovery ............ 68 Table 28 GHG Emissions from Primary Materials Production and Materials Recovery ..... 68 Table 29 Potential GHG emissions reduction achieved by recycling e-waste (2015) .......... 69
IV
LIST OF FIGURES Figure 1 E-waste generation in typical countries .................................................................... 3 Figure 2 Relationship between e-waste generation and purchasing power ............................ 3 Figure 3 The Map of States with Legislations ........................................................................ 9 Figure 4 Process of Electronics Recycling Program ............................................................. 12 Figure 5 Recycling process of recyclers ............................................................................... 16 Figure 6 Regular Materials Recycling Process ..................................................................... 18 Figure 7 Composition of CRT .............................................................................................. 19 Figure 8 CRT Recycling Process .......................................................................................... 20 Figure 9 Process of Copper Recovery Using Integrated Smelters/Refiners ......................... 23 Figure 10 Export of e-waste from Western Europe and North America .............................. 27 Figure 11 Smuggling map through Vietnam into Mainland China ...................................... 31 Figure 12 E-waste collection flow in China ......................................................................... 32 Figure 13 “Home Appliance Old for New Rebate Program” flow chart .............................. 34 Figure 14 Formal recycling and theoretical disposal of obsolete home appliance ............... 35 Figure 15 Estimated e-waste flow in China (2012) .............................................................. 36 Figure 16 Informal e-waste recycling situation in China ...................................................... 37 Figure 17 End-of-life treatment situation of PCB in China .................................................. 40 Figure 18 Proposed e-waste recycling chain in China .......................................................... 43 Figure 19 Domestic generation of e-waste in China (million units) ..................................... 50 Figure 20 Weight of domestic e-waste in China (million tons) ............................................ 51 Figure 21 Weight percentages of six types of waste electrical or electronic products in
China ............................................................................................................................. 52 Figure 22 Composition of e-waste in China (2012) .............................................................. 53 Figure 23 Weight fractions of exported e-waste in the U.S. (2010, MIT) ............................ 54 Figure 24 Material flow of informal e-waste recycling process ........................................... 58 Figure 25 Material flow of formal e-waste recycling process .............................................. 58 Figure 26 Material flow of proposed e-waste recycling process .......................................... 58 Figure 27 Life of raw material in electronic product ............................................................ 63 Figure 28 Single product recycled material values (Σmiki) and material mixing entropy (H)
with recycling rates (indicated by the area of the circles) for 20 products in the U.S. 64 Figure 29 Typical glass manufacturing process .................................................................... 66
V
ABBREVIATION AND ACRONYMS
ANSI: American National Standards Institute MSW: Municipal Solid Waste
ASQ: American Society for Quality NGO: Non-Governmental Organization
ARF: Advanced Recycling Fee PGM: Platinum Group Metals
BFR: Brominated Flame Retardant PDP: Plasma Display Panel
BAN: Basel Action Network PCB: Printed Circuit Board
CCFL: Cold Cathode Fluorescent Lamp R2: Responsible Recycling
CRT: Cathode Ray Tube StEP: Solving the E-waste Problem
DEQ: Department of Environmental Quality USD: US Dollar
EPA: Environmental Protection Agency EPR: Extended Producer Responsibility
E.U.: European Union ELI: eCycling Leadership Initiative
EEE: Electrical and Electronic Equipment FGC: Federal Green Challenge
GHG: Green House Gas WEC: WasteWise Electronics Challenge
LCD: Liquid-Crystal Display LED: Light Emitting Diode
E-waste: Electronic Waste
RIOS: Recycling Industry Operating Standard
OHSAS: Occupational Health and Safety Management System
ISO: International Organization for Standardization
NAID: National Association for Information Destruction
WEEE: Waste Electrical and Electronic Equipment
SMM: Sustainable Materials Management
1
ANALYSIS OF ELECTRONIC WASTE RECYCLING IN THE UNITED
STATES AND POTENTIAL APPLICATION IN CHINA
1 Introduction
1.1 Definition of electronic waste
Electronic waste (E-waste) describes discarded electrical or electronic equipment. The definition
of e-waste varies among different countries. In European Union, it is divided into ten categories
in the new Waste Electrical and Electronic Equipment (WEEE Directive) 2012/19/EU1 as Table
1. For details, please refer to APPENDIX A.
Table 1 E-waste category pursuant to the EU Directive 2012/19
1 Large household appliances
2 Small household appliances
3 IT and telecommunications equipment
4 Consumer equipment and photovoltaic panels
5 Lighting equipment
6 Electrical and electric tools
7 Toys, leisure and sports equipment
8 Medical devices
9 Monitoring and control instruments
10 Automatic dispensers
Table 1 shows that the definition of e-waste in the European Union (EU) includes everything that
has a power cord or battery. The e-waste definition2 of China is the same as the EU directive but
2
five home appliances: air conditioner, refrigerator, washing machine, TV and computer are
mainly regulated. As the consumption of mobile phones grows dramatically these years, the
obsolete amount of mobile phones3 has also been included now.
In the United States, e-waste is not clearly defined. The term "e-waste" mainly refers to
consumer electronics that are near or at the end of its useful life4. Consumer electronics5 consist
of video and audio equipment and information products, such as television, computer and mobile
phones.
1.2 E-waste generation in different countries
E-waste is the fastest growing sector in the municipal solid waste (MSW) stream. It is estimated
that about 49 million tons of e-waste are produced worldwide in 20126. The European Union
(E.U.) contributed 9.9 million tons. The U.S., the world leader in waste generation discarded 9.4
million tons, while China, who produced 7.3 million tons, was just next to the U.S.. Since all
these data are measured by Solving the E-waste Problem (StEP), an international initiative, this
thesis will follow the e-waste definition of StEP: “All types of electrical and electronic
equipment (EEE) that enters the waste stream. This includes TVs, computers, mobile phones,
white goods (e.g. fridges, washing machines, dryer etc.), home entertainment and stereo systems,
toys, toasters, kettles-almost any household or business item with circuitry or electrical
components with power or battery supply.”
Figure 1 shows the generation of e-waste in various countries6. Since the population of each
region is different, the average e-waste generated per capita is of importance. As shown in Figure
2, the generation of e-waste per capita varies proportionally to purchasing power (USD per
inhabitant, StEP)6. Apparently, the U.S. has the highest the e-waste generation amount both in
total and per inhabitant (29.8 kg per capita). Even though China is second to the U.S. in total

3
e-waste generation, its generation per capita is only 5.4 kg per year.
Figure 1 E-waste generation in typical countries (2012, StEP) 6
Figure 2 Relationship between e-waste generation and purchasing power (2012, StEP) 6
1.3 Composition of e-waste
E-waste usually consists of plastics, glass, various metals, and several elements of the periodic
0
5
10
15
20
25
30
35
0 1 2 3 4 5 6 7 8 9 10
kg per inhabitant
million tonnes
total in million tonnes
kg per inhabitant
0
5
10
15
20
25
30
35
0
10000
20000
30000
40000
50000
60000
kg per inhabitant
USD per inhabitant
Purchasing power
kg per inhabitant

4
table. With the rise in the price of raw materials, the market for these valuable materials,
especially metals, is the economic driver for the e-waste recycling industry. Also, most e-waste
at the end of its life is considered to be hazardous, due to the contained heavy metals, such as
mercury and lead.
1.3.1 Material composition and metal content of typical end-of-life e-waste
Table 2 shows the material composition of selected typical e-waste7. The desktop computer in
this table does not include its monitor. Usually, computer monitors can be divided into
cathode-ray-tube (CRT) display and liquid-crystal display (LCD). Similarly, televisions can be
divided into CRT TV, LCD TV and plasma display panel (PDP) TV. Printed circuit board (PCB)
is used to support and connect electronic components in EEE. PCBs are used in all but the
simplest EEE, where wire wrap or point-to-point construction will be applied instead.
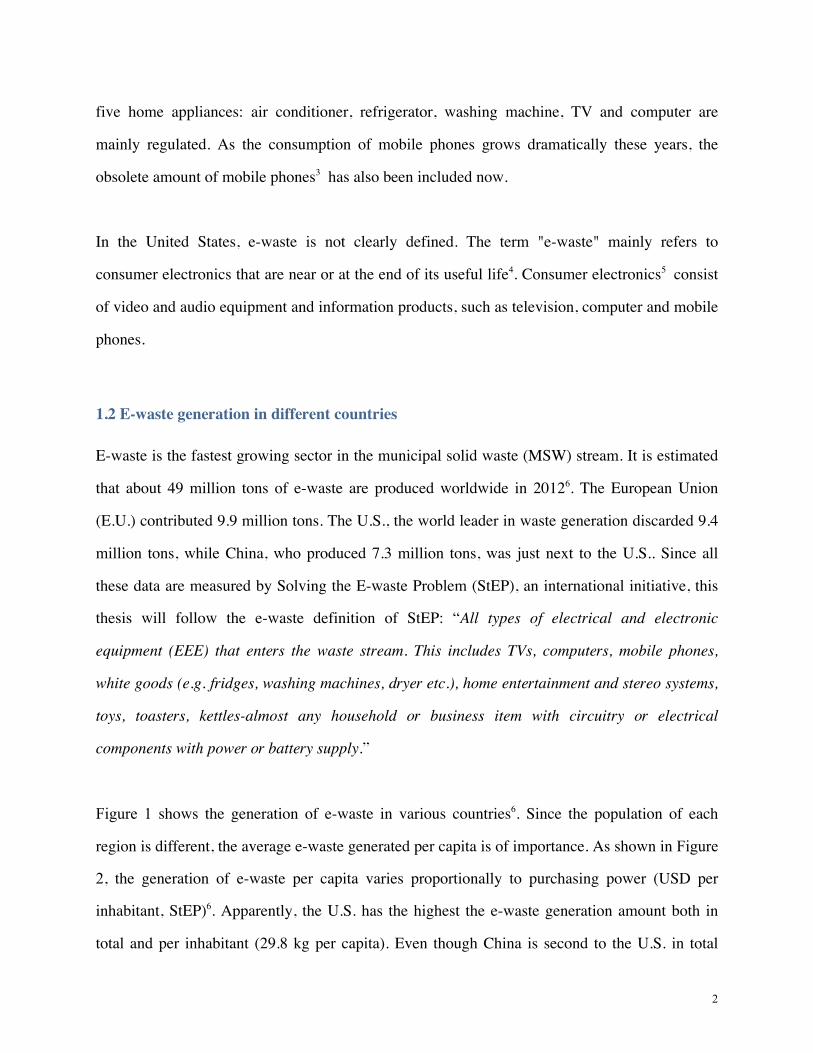
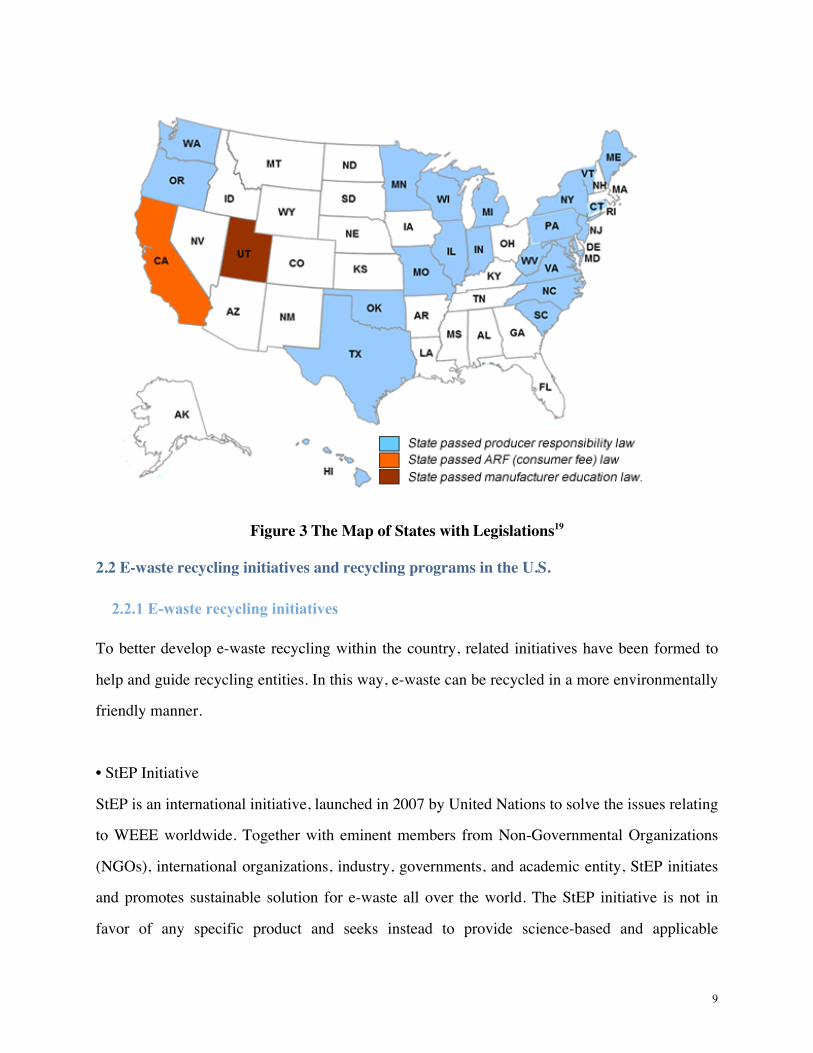
Table 3 shows the concentration of selected common metals in PCBs of various types of EEE7.
Table 2 Material composition of typical end-of-life e-waste7
Equipment type
Weight fraction of materials (%)
Fe Al Cu Plastic PCB CRT glass
Battery Panel glass
Funnel glass
Refrigerator 47.6 1.3 3.4 43.7 0.5 - - - Washing machine 51.7 2.0 3.1 35.3 1.7 - - - Air conditioner 45.9 9.3 17.8 17.7 2.7 - - - CRT TV 12.7 0.1 3.9 17.9 8.7 22.9 12.9 - PDP TV 33.6 15.1 1.2 10.1 7.8 - - - LCD TV 43.0 3.8 0.8 31.8 11.6 - - - Desktop 47.2 - 0.9 2.8 9.4 - - - Laptop 19.5 2.4 1.0 25.8 13.7 - - 14.4 Mobile phone 0.8 - 0.3 37.6 30.3 - - 20.4
Note: “-” means unavailable. It is the same for all subsequent tables.
5
Table 3 Metal content in PCB of typical end-of-life e-waste7
Equipment type Metal content of PCB (mg/kg)
Common metal Precious metal Al Cu Fe Pb Sn Zn Ag Au Pd
Refrigerator 16,000 170,000 21,000 21,000 83,000 17,000 42 44 – Washing machine
1,000 70,000 95,000 2,200 9,100 2,400 51 17 –
Air conditioner 6,900 75,000 20,000 5800 19,000 4,900 58 15 – CRT TV 62,000 72,000 34,000 14,000 18,000 5,300 120 5 20 PDP TV 38,000 210,000 20,000 7,100 15,000 12,000 400 300 – LCD TV 63,000 180,000 49,000 17,000 29,000 20,000 600 200 – Desktop 18,000 200,000 13,000 23,000 18,000 2,700 570 240 150 Laptop 18,000 190,000 37,000 9,800 16,000 16,000 1,100 630 200 Mobile phone 15,000 330,000 18,000 13,000 35,000 5,000 3,800 1,500 300
1.3.2 Hazardous materials in e-waste
As mentioned earlier, e-waste contains some heavy metals. In the U.S., even though the mass of
e-waste accounts for less than 2% of the landfilled MSW, it contributes to 70% of the heavy
metals disposed in landfills8. In addition to metals, some plastics may form toxic dioxins and
furans when incinerated under uncontrolled conditions. Table 4 lists the principal hazardous
substances in e-waste9,10.
Table 4 Principal hazardous substances in e-waste9,10
Hazardous substances Electronic components Public health risk
Lead CRT and solder Damaging the nervous system and causing brain disorders
Mercury Television and computer display Causing sensory impairment, disturbed sensation and a lack of coordination.
Cadmium PCB and semiconductor Liver and kidney problem Brominated flame retardant (BFR)
PCB, cable and case Generating brominated dioxin/furan

6
1.3.3 Urban mining potential
Urban mining is to reclaim materials from waste, buildings and products; the term is commonly
used to describe the process of recovering metals from e-waste instead of ores. The concentration
of metals in e-waste is usually much higher than in related ores as shown in Table 5. Extracting
minerals from ore is extremely energy-intensive, accounting for up to 40% of the final product
cost11. Urban mining provides us with an opportunity to lower the cost and preserve the natural
resources. Besides, as shown in Table 6, copper and precious metals are the most valuable parts
within e-waste.
Table 5 Metal content in different raw materials
Metal Primary Mining Urban Mining12
Cu 0.5-1.0%13 3.0-21%
Al 3-5%14 1.0-19.0%
Ag 850ppm15 6-2000ppm
Au 1-5ppm16 10-1000ppm
Table 6 Value-share of metals in electronics17
Value-share Fe Al Cu Precious Metals
TV-board 4% 10% 50% 36%
PC-board 0% 1% 18% 81%
Mobile phones 0% 0% 9% 91%
Portable audio 2% 0% 82% 15%
DVD-player 13% 3% 42% 42%

7
2 E-waste Management System in the United States
2.1 E-waste management regulations
2.1.1 Federal legislations
There is no federal legislation set especially for e-waste management. The Resource
Conservation and Recovery Act (RCRA)18 is the main federal law governing solid waste, which
is used to govern the disposal of solid waste and hazardous waste. As to e-waste, it only covers
CRT. State regulations are usually more detailed deserving more of our attention.
2.1.2 State legislations
The United States consists of 50 states and the federal District of Columbia (DC). So far,
statewide e-waste recycling legislation has been passed in 25 states 19 . Some states are
considering e-waste recycling laws or improving existing laws. There are mainly three types of
state laws regarding e-waste management.
• Extended Producer Responsibility
Manufacturers are assigned the responsibility by Extended Producer Responsibility (EPR) to take
care of end-of-life management of consumer products. EPR is defined as “an environmental
protection strategy to reach an environmental objective of a decreased total environmental
impact of a product, by making the manufacturer of the product responsible for the entire
life-cycle of the product and especially for the take-back, recycling and final disposal.”20
Product design, which determines the toxicity and waste of the product at the end of life, is under
the greatest control of manufacturers. The management of end-of-life products can be expensive
and time consuming. To some extent, EPR serves as financial incentives to promote
environmental-friendly designing of products. If the manufacturers design the products in a way
easy for end-of-life treatment, they will actually save both time and money during products’
end-of-life treatment stage.

8
• Manufacturer Education21
Before putting a certain consumer electronic into market in the state, manufactures are required
to report to the Department of Environmental Quality (DEQ) and then DEQ will further report to
higher level committee. This law actually authorizes the local government’s participation in
electronics recycling. Besides, manufacturers should establish and implement a public education
program to inform consumers about their recycling programs.
• Advance Recycling Fee
The Advanced Recycling Fee (ARF) is a fee used for recycling while paid at the point of
purchase. The amount of ARF relies on the size and type of the electronics. It is a front-end
financing system that charge consumers a fee when selling certain electronic products. The
money collected is then used for e-waste collection and recycling.
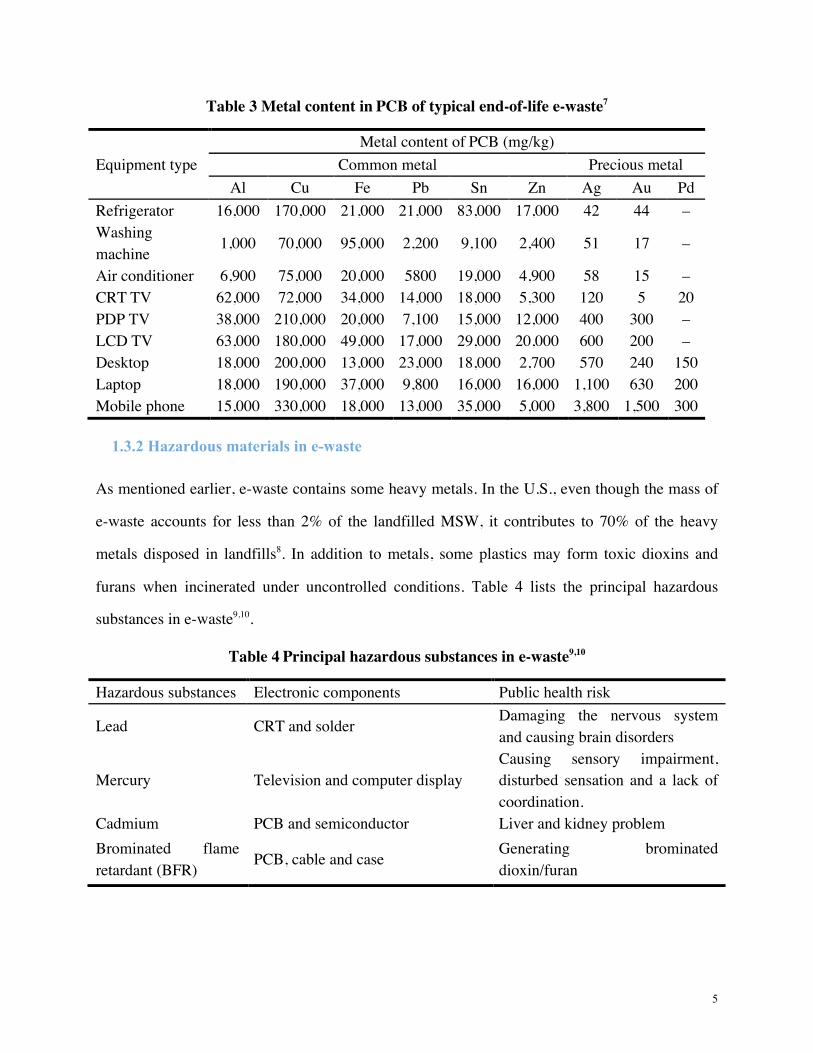
As mentioned above, 25 states have legislations related to e-waste recycling. 23 of them use EPR
approach19. California is the only one applying ARF (consumer fee), while Utah is the only state
using Manufacturer Education. It can be better illustrated in Figure 3 the Map of States with
Legislations.
9
Figure 3 The Map of States with Legislations19
2.2 E-waste recycling initiatives and recycling programs in the U.S.
2.2.1 E-waste recycling initiatives
To better develop e-waste recycling within the country, related initiatives have been formed to
help and guide recycling entities. In this way, e-waste can be recycled in a more environmentally
friendly manner.
• StEP Initiative
StEP is an international initiative, launched in 2007 by United Nations to solve the issues relating
to WEEE worldwide. Together with eminent members from Non-Governmental Organizations
(NGOs), international organizations, industry, governments, and academic entity, StEP initiates
and promotes sustainable solution for e-waste all over the world. The StEP initiative is not in
favor of any specific product and seeks instead to provide science-based and applicable

10
recommendation to solve the e-waste issue.
• Consumer Electronic Association’s eCycling Leadership Initiative
The Consumer Electronics Association (CEA) is a standards and trade organization for the
consumer electronics industry in the U.S.. CEA is an authoritative association on consumer
surveys, engineering standards, market research and forecasts, legislative and regulatory news,
training resources and so on. As of 2013, more than 2,000 companies have joined this association.
Leaded by CEA22, the eCycling Leadership Initiative (ELI) acts as collaboration between
consumer electronics manufacturers, retailers, collectors, recyclers, NGOs and governments at
all levels.
• EPA’s Sustainable Materials Management Electronics Challenge
The definition of Sustainable Materials Management (SMM) is “an approach to serving human
needs by using/reusing resources most productively and sustainably throughout their life cycles,
from the point of resource extraction through material disposal”23. This approach is meant to
minimize materials consumption in an environmental friendly and economical manner. There are
three challenges in this program: Food Recovery Challenge, Electronics Challenge and Federal
Green Challenge. Apparently, Electronics Challenge is the one most related to e-waste recycling.
Electronics Challenge is joined by original electronic products manufacturers and retailers who
are promoting responsible e-waste recycling. EPA provides technical assistance, resources and
recognition to those recycling entities. In this way, the recycling programs can be better guided
and developed. This challenge has a tired structure (Bronze, Silver and Gold) that contains
increasingly comprehensive requirements.
• EPA’s Sustainable Materials Management Federal Green Challenge-Electronics
Same as Electronic Challenge, Federal Green Challenge (FGC) is under the EPA’s Sustainable

11
Materials Management Program. It challenges federal agencies in the U.S. including EPA itself
to lead the society by example in reducing the Federal Government’s environmental impact.
• EPA’s WasteWise Electronics Challenge
The WasteWise Electronics Challenge (WEC) challenges its partners to set goals for reducing
electronics waste. All US business, local governments, and non-profit organizations can
participate in WasteWise. There exist endorsers in this program, who are responsible for
recruiting organizations to become WasteWise partners and providing WasteWiase partners with
ongoing information.
2.2.2 E-waste recycling programs
Under those electronics recycling initiatives, participants are developing their own recycling
programs to realize the goal of reduction, reuse and recycling of e-waste. There are many
recycling programs run by different entities: retailers and manufacturers, recyclers, municipal
collection, non-profit and profit organizations.
(1) Recycling programs run by manufacturers and retailers of electronics
Some manufacturers of electronic products, such as cellphones, computers and televisions, are
running recycling programs to take obsolete equipment back for both environmental and
economic concern. Most of them are only responsible for recycling their own brand products.
The manufacturers distinguished in their recycling performance are APPLE, SAMSUNG, DELL
and HP, who were recognized as the top performers with regard to efforts to address the
electronic recycling issue. As mentioned before, 23 states in the U.S. require manufacturers to be
responsible for getting their own products recycled. They must provide free and convenient
electronics recycling to most consumers in the state, like New York.
Similar to manufacturers, many electronic products retailers are offering several options to

12
donate or recycle electronics. For example, the retailers under EPA’s Electronics Challenge: Best
Buy, Sprint and Staples. Also, some carriers are selling phones and running mobile phone
recycling programs, such as AT&T, T-Mobile and Verizon Wireless.
The general process of recycling program is illustrated as Figure 4.
Figure 4 Process of Electronics Recycling Program
From Figure 4 we can see, usually there are three ways to get our obsolete products recycled:
online recycling, in-store recycling and recycling events. Through in-store recycling and
recycling events, electronics can be recycled directly if covered. During online recycling process,
things get more complicated. First, consumers can use online estimator to get an estimate of what
the item may be worth. Add the item to Trade-in cart and then print a prepaid mailing label. Mail
the item to Trade-in Center. Receive a mail back with a check or gift card. Finally, the collected
electronics will be sent to recyclers to get reused, refurbished/remanufactured or recycled. The
recyclers will give those collectors (manufacturers and retailers) a share of money as a return.
(2) Recycling programs run by electronics recyclers
Apart from taking the recycled products from collectors (e.g. manufacturers and retailers), some
recyclers have their own recycling programs. For example, the WMPaystoRecycle.com is a
service of WM Product Recovery Services, L.L.C., a Waste Management company.

13
Similar to the programs run by manufactures and retailers, consumers can get free quote on the
website for their products and then they will receive a pre-paid label. Once their pre-paid
shipments are received, they can receive a quick and convenient payment through PayPal
account based on the products’ condition. Even though those recyclers do not have their own
stores to get products recycled, they have convenient drop-off locations for local residents. Some
recyclers will charge the consumer for recycling fee based on the size and weight of electronics
while some will not, subject to the state law. Same as manufacturers, they may hold recycling
events to get electronics recycled.
(3) Programs run by municipal collection center
Municipal collection can be carried out through two possible means. One is through assigned
electronics collection center in each area. Another one is municipal recycling program. For
example, in New York City, there is an innovative program named e-cycleNYC. Under this
program, residents can pick up and recycle unwanted electronics conveniently. This program is
set up for apartment buildings. Depending on the size and type of building, apartment buildings
in New York City can be eligible for the following service options by signing up an online
application form.
In this way, residents can recycle their electronics more conveniently since they may hardly
transport televisions and other large electronics to drop-off events or locations and take-back
programs.
(4) Programs run by businesses, institutions and government
Some businesses, institutions and federal governments have their own recycling programs. For
businesses, the recycling rate within the company can sometimes be an advertisement for them.
As to governments, like those under FGC program, they serve as a model in electronics recycling
14
for their citizens.
(5) Programs run by non-profit organization
Goodwill and The Salvation Army are the most successful non-profit organizations holding
electronics recycling programs. Goodwill serves as both the collector and recycler in the
recycling process while The Salvation Army is just the collector. They all have charity shop for
receiving donations and reselling the recycled products. Besides, those non-profit organizations
are sponsoring some electronics recycling events also.
2.3 Advanced recycling technologies in the United States
2.3.1 Certification programs for electronics recyclers
If under no control, electronics recycling process may lead to great environmental problems.
Since it is hard to guarantee all the electronics recycling entities are doing the right things, EPA
has carried out some certification programs for recyclers to encourage them to get products
recycled in a more responsible manner. Current three accredited certification standards exist: the
Responsible Recycling Practice (R2), R2/RIOS and the e-Stewards standards. To get certified,
recyclers need to find a certifying body, which is an independent third-party auditor. And win a
certification from this third-party auditor demonstrating that they do recycle end-of-life
electronics in a responsible manner as required. And those certifying bodies also need to be
accredited by ANSI-ASQ National Accreditation Board (ANAB) before they can certify
electronic recyclers.
• R224
The R2 Practices standard was developed by a multi-stakeholder group that included US EPA
and industry representatives. Establishing a voluntary, market-based mechanism to facilitate best
electronics recycling practices in e-waste recycling industry is the goal of this standard. Now it is

15
maintained and promoted by R2 Solutions, a non-profit organization, which is responsible for
educating the industry about the R2 Standard, informing the public of this standard and
supporting the R2 Governing Council to update the standard. Since R2 is the first certification
program for electronic recyclers in the U.S., it is not as strict as those later. Under special
circumstances, land disposal, incineration and energy recovery of e-waste could be possible.
There is no prohibition on exporting hazardous e-waste to developing countries. Also, the use of
prison recycling operations is allowed.
• R2/RIOS25
The Recycling Industry Operating Standard (RIOS) is a comprehensive quality, environment,
and health & safety (QEH&S) integrated management system standard. It is an ANSI accredited
standard that includes all of the attributes and processes from ISO:9001 (Quality), ISO:14001
(Environmental), and OHSAS:18001(Safety). As mentioned above, R2 is best practices standard
specifically for the electronics industry and e-waste. R2/RIOS is a combination of the two
standards, which means your electronics asset disposition partner has an audited management
system in place.
• E-Stewards Certification26
For the first 2.5 years of the R2 Practices standard, the Electronics TakeBack Coalition and the
Basel Action Network (BAN) actively participated in the standard. BAN then withdrew from the
cooperation, because they thought some aspects of R2 violated the basis of their work. Although
the document of R2 was modified accordingly after their departure, BAN was asked to develop
anther standard. Then e-Stewards came out in the late 2008, after the R2 was completed.
E-Stewards requires all the certification bodies must be company-wide not just facility by facility.
R2 asks for a robust management system but does not have specific requirements. E-Stewards
requires recyclers to be incorporated into International Organization for Standardization (ISO)

16
14001, with most elements of Occupational Health and Safety Management System (OHSAS)
18001. Additionally, e-Stewards standard totally forbids the export of hazardous e-waste to less
developed countries, landfill or incineration plant and the use of prison labor.
2.3.2 Recycling technologies
After being collected via various channels, e-waste is then shipped to recycling entities for
recycling, recyclers need to test their functionality first to determine whether they could be
reused, refurbished/remanufactured or recycled as illustrated in Figure 5. When the products
have been designated as reusable, after cleaning and come tests, they can be sold in some charity
or thrift shops, like Goodwill and The Salvation Army.
Figure 5 Recycling process of recyclers
Usually, people would care much about their private information within their equipment.
Therefore, recyclers should take the responsibility of data destruction. In some special cases,
fully trained technicians should go to their office location to provide hard drive destruction
services, since some customers would require all the data in their obsolete products to be totally
destructed before leaving their facilities. This is very common with consumers working in health
care facilities, banks and other financial institutions, government agencies, and other
organizations whose data security is very important and subject to regulatory compliance. After
electronics have been shipped to recyclers’ place, all the data is wiped or destroyed permanently
before being resold. Also, if the equipment is dismantled and shredded for recycling, data is
damaged at the same time. There is one certification related to data destruction process: National
Association for Information Destruction (NAID) certification. NAID certification program is a

17
voluntary program and used to certify NAID member companies meeting the standards set for a
secure destruction process.
If unfortunately the equipment cannot be resold by any means, it will be put into recycling
processing line where the different materials will be recycled separately. Usually, pre-processing
is used to prepare separated materials stream for further materials recycling (also materials
recovery) by downstream industries. Pre-processing for regular materials and CRT are illustrated
below.
• Pre-processing technologies
Regular materials pre-processing27
It will be dismantled and shredded to optimal size first, and then advanced sorting techniques are
applied to separate the materials into glass, plastic, base metals and precious metals. The
recycling process may change a little bit depending on the company. Technologies adopted by
Sims Recycling Solution are introduced here as an example.
To be specific, prior to mechanized processing, hand sorting of electronics occurs to extract
materials such as batteries, plastics, copper wire and PCB for quality control process. Then
comes initial size reduction process to reduce materials to approximately 100mm in size.
Large-sized particles make it easier for hand pickers to sort large pieces of plastics and glasses
out. It also ensures secure destruction of equipment with sensitive materials such as hard drive.
The following it the secondary size reduction process. Next, overhead electro-magnets are
applied above conveyer to remove ferrous metals from the waste stream. Ferrous metals are
collected in large storage containers for sale as recycled steel. Left materials are further separated
by eddy currents. Eddy currents works by time-varying magnetic fields. Materials can be
separated due to their different accelerations in the same magnetic field. Basically, the
acceleration is determined by conductivity of the materials. Therefore, in this way, materials with

18
low or non-metallic content (PCB, plastic and wire) can be effectively separated from left
non-ferrous metals, such as aluminum and copper. Also, in some more precise facilities, even the
materials with similar conductivity can be further separated by the difference in conductivity
divided by density. Aluminum scrap, as conductive lighter alloys can be separated via eddy
currents from heavier alloys, like copper scrap28. Or, copper and aluminum can be further
separated using certain solution based on their density difference. Last, a process of water
separation or sensor technology is used to separate non-metallic content, such as plastics and
glass, from low-metallic content (PCB and copper wire). The printed circuit boards, steel,
aluminum and copper content are collected and sold as recycled commodities. Those recycled
materials can be further manufactured into new products. Figure 6 is the flow diagram of the
overall recycling process.
Figure 6 Regular Materials Recycling Process
CRT pre-processing29
Since CRT contains high content of lead, it is regulated as hazardous waste and disposed
separately from regular e-wastes recycling process. The distribution of lead is shown in Figure 7.
Glass panel is regarded as unleaded glass as its low lead content while glass funnel is leaded. To
achieve the maximum recycling rate, unleaded and leaded glasses should be separated. Same as
above, the CRT recycling process used by Sims Recycling Solution is illustrated here.

19
Figure 7 Composition of CRT30
The first stage of recycling process involves a controlled size reduction process. Through this
process, screen and the complete tube are shredded down into smaller pieces facilitating the
separation of leaded from unleaded glass ready for sorting. Dust produced during this stage
includes phosphorous material from the tube and screen plus a small number of glass powders.
Then the waste stream will go through electro-magnets and eddy currents to get ferrous materials
and non-ferrous metals out of glass material. Then the mixed leaded and unleaded glass enters
the wash stage. This stage cleans the glass of iron oxides and phosphors that coat the inside of
CRT. It also separate our any glass dust produced in the sizing process. The phosphors, oxide
and dust are then sent for sound environmental disposal, while the glass is sent to the sorting
stage. At the last stage, glass-sensing technology recognizes different properties between leaded
and unleaded glass. The speed of the conveyer for waste stream is known and so a computer
knows when leaded glass reaches the end of the conveyer. Momentum carries unleaded glass
over a separator while leaded glass is re-directed. Then the two glasses are bulked up to sale to
CRT manufacturers, where they are used to make new CRTs in a closed loop recycling solution.
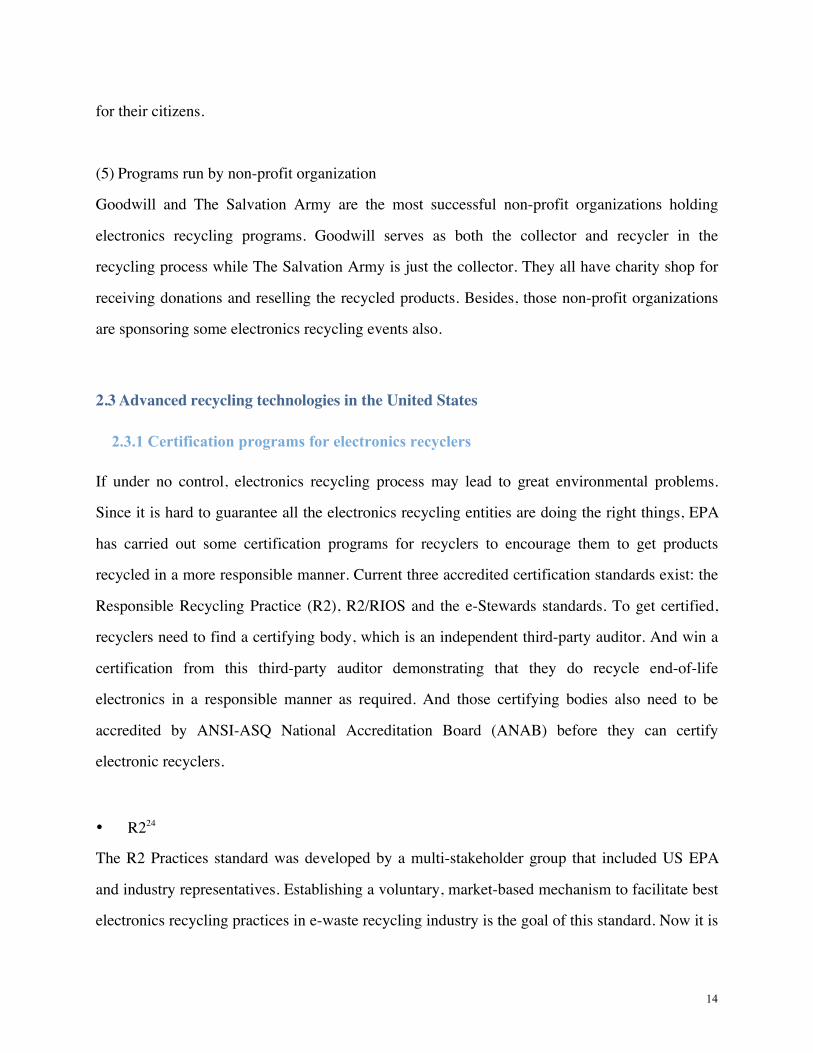
Figure 8 is the flow diagram of the overall CRT recycling process.
20
Figure 8 CRT Recycling Process
However, since the market for CRT technology has shrunken in recent years because of the
advent of flat panel technology, the leaded glass now is usually heated to a molten state to get
lead extracted out31 during the following materials recycling process and cleaned glass is then
recycled as regular glass, instead of making new CRTs.
• End-processing technologies (materials recovery)
Glass
As mentioned earlier, the glass of e-waste can be categorized into leaded glass and unleaded
glass. There are two mature technologies for both kinds of glass. Glass-to-glass is for unleaded
glass while glass-to-lead is for leaded glass. After being separated from leaded glass, unleaded
glass can be put into glass-to-glass recycling process, where those recycled unleaded glass is sent
to glass smelter to produce new glass and for new applications. Since those recycled glass does
not need to go through raw materials acquisition process, much energy will be saved and
emission will be reduced by using them to produce new glass. Actually, leaded glass used to be
recycled to make new tubes for CRT televisions or monitors. But, as mentioned, in recent years,
with the development of flat-screen technology, the market demand for CRT television or
monitor has almost dried up in developed countries. Therefore, glass-to-lead technology comes

21
out. Leaded glass can be put into secondary lead production furnace to extract lead out and silica
can be used as flux during the process.
However, Nulife Glass Processing Ltd has designed a better technology to deal with leaded glass
instead of previous glass-to-lead technology and it has already been applied in many developed
countries including the U.S.61. The process is similar to the secondary lead smelting process,
during which lead is extracted out of molten leaded glass31. After being extracted, the lead can be
further utilized while clean glass can be treated like those unleaded glass mentioned above to
make new glass products. In this way, all the materials put into furnace can be converted to clean
glass and lead.
Plastics
Plastics will be sent to plastics recyclers. Those recyclers will further sort the plastics based on
weight, color or resin code and shredded for reuse applications. There are more than 15 types of
resins among plastic e-waste. The most common ones32 are:
• Acrylonitrile Butadiene Styrene (ABS)
• High-impact Polystyrene (HIPS)
• Polyphenylene Oxide Blends (PPO)
• Polycarbonate (PC)
They are all recyclable plastics. However, unlike other recycled materials, usually plastics will
lose quality through the recycling process. This is because plastics are actually polymers.
Polymers are processed by melting at high temperature and then injected into mold to create the
finished product. During recycling process, the plastic is again exposed to high heat, which could
probably change its properties if it is contaminated by another polymer. Then we call this
material is downcycled 33 . Downcycling means the recycled material has lost quality or
functionality. But the end product can still be used. That is why plastic is rarely recycled into

22
same product that it was originally. Recycled plastics are often not recyclable again. The way to
avoid downcycling is achieving the highest purity when sorting the plastics.
Because the sorting process of plastics is extremely tricky, the contamination during recycling
process sometimes is inevitable. Therefore, instead of recycling, some plastics served as fuel
materials due to their high heating values, while in this case the dioxin issue should be carefully
addressed.
Metals
- Aluminum & Iron
As illustrated before, ferrous materials are separated from other materials using overhead
electro-magnets, while aluminum is separated from other metals using eddy currents or typical
solution according to their density differences. And then separated aluminum and ferrous scraps
will be sent to their corresponding smelting plants to get recovered.
- Copper & Precious metals
From Table 6, we can see that copper and precious metals are the most valuable part in e-waste.
Copper and precious metals are usually recovered together in integrated copper smelters/refiners
in developed countries, where copper get refined first while precious metals are collected under
the anode and then get further refined successively. Precious metals are mainly contained in PCB.
Therefore, PCB is usually collected together with copper. During the dismantling process, PCB
had better be separated out from e-waste stream. This is because precious metals are usually
closely tied up with plastics and non-ferrous metals in PCB. If shredded and separated into
different kinds of materials, the amount of precious metals that could be recovered from PCB
will decrease.
Copper content in e-waste is approximately 10-50 times34 higher than copper ore (0.5-2.0%

23
Cu)13. The copper content in PCB alone is 10-30% Cu35. Considering the huge demand in the
market and resource shortage, e-waste could serve as valuable copper scrap for secondary copper
production. Actually, there are two typical technologies for copper production: pyrometallurgy
and hydrometallurgy. Usually, pyrometallurgy is more commonly used than the other. This is
because of the advancement of pyrometallurgical process as well as low cost compared to
hydrometallurgical process9. The processing steps are as follows. The part of copper smelting
and refining are also illustrated in Figure 9.
Figure 9 Process of Copper Recovery Using Integrated Smelters/Refiners
24
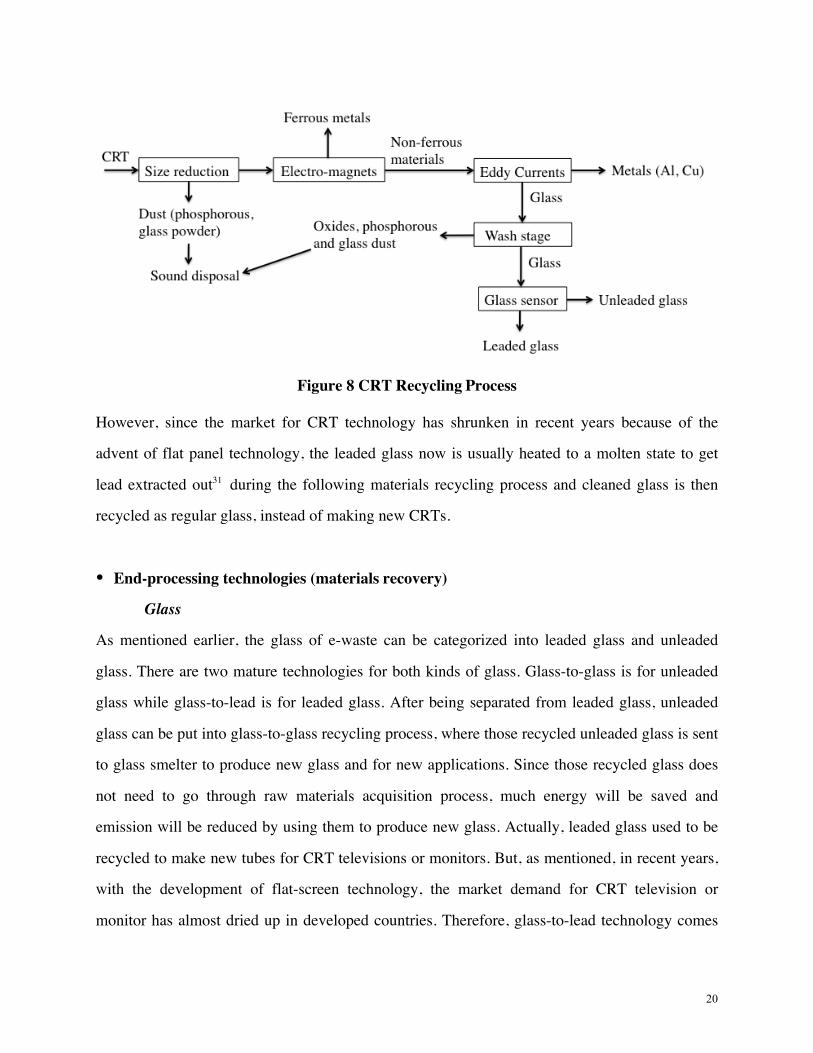
Step 1: Matte smelting. Shredded e-waste scrap is sent to integrated smelter. The objective of
smelting is to oxidize other mixed metals like lead, cadmium, zinc and some aluminum/iron
leftovers. The molten matte contains most of the copper in the scrap (45-75% Cu)13, while the
left slag that is a mixture of various metal oxides will further react with SiO2 flux to form molten
slag. Precious metals are contained within the matte.
Step 2: Converting stage. The molten matte is then moved into converter to get further oxidized
with air or oxygen-enriched air. Left impurities are oxidized and crude (99%Cu)13 blister copper
is produced. E-waste scrap with high copper content (45-75%Cu)13 can be sent directly into
converter without going through smelting process.
Step 3: Fire refining and anode casting. Electrorefining requires strong, flat thin anodes, but the
blister copper coming out from converter is liquid. So, the molten blister copper will be
fire-refined and casted into anode shape molds (99.5%Cu)13.
Step 4: Electrorefining. The corresponding cathodes are made of stainless steel (occasionally
copper). Copper gets refined through two steps: a) electrochemically dissolving copper from
impure copper anodes into electrolyte (usually CuSO4-H2SO4-H2O)13, and b) electrochemically
plating pure copper onto cathodes. The deposited copper will remain on the cathodes for one to
two weeks and then get removed from the cell to get reused.
Step 5: Precious metal refinery. Many anode impurities are insoluble in the electrolyte. Usually
they are precious metals, like Au, Ag, Pd and sometimes heavy metal Pb. They are collected in
the form of slime and treated for further recovery. First, the anode slimes are leached by
oxidizing sulfuric solution to remove residual copper. The residue from leaching is smelted to
get impurities oxidized and then casted to form bullion with silver, gold and platinum group
metals (PGM, e.g. Pd, Pt) concentrated. At last, those precious metals are further recovered
through a series of electrorefining processes36.
Actually, there is no integrated smelter/refiner in the U.S.. Pre-processed e-waste scraps
containing copper and precious metals will be sent overseas to Canada or Western Europe for

25
end-processing9.
- Heavy metals
The most common heavy metals are mercury, lead and cadmium. The amount of those heavy
metals is very small. But even a little amount of those heavy metals can be extremely toxic to
human beings and the environment.
Mercury (Hg)
Mercury is fed in gaseous form to cold cathode fluorescent lamps (CCFL) tubes in the backlights
of LCD monitors, LCD television and laptop. In service the electronically ionized mercury yields
ultraviolet (UV) rays, which are transformed into visible light by the fluorescent layer. If
shredded together with other e-waste, the CCFL backlights will be broken and inside vaporous
mercury will escape. So, the best way to prevent mercury pollution is to dismantle the products
manually into LCD panel and CCFL backlight. In this way, the mercury inside CCFL backlight
can be captured while the LCD panel will be put back into regular e-waste recycling process to
get shredded.
Lead (Pb)
Lead is another dominant toxic material in e-waste. Apart from those within CRT tubes, there are
still huge lead content in e-waste, especially solders that are used to connect components
together. This part of lead content will be mixed with metal scrap and sent to integrated
smelters/refiners to recover the copper first. As mentioned in the recovery process of copper,
some lead would get oxidized during smelting stage and stay in slag. But the distribution of lead
is not just in the slag, lead may also be captured in the dusts from converting and slag cleaning.
The left part of lead will go with copper until the electrorefining stage. During this stage, lead is
found mostly within the anode slimes as insoluble PbSO413. Those Pb-rich waste residues are
then sent to get Pb recovered or disposed safely. The distribution of lead and other related

26
impurities during Noranda smelting is listed in Table 7.
Table 7 Impurity distributions during Noranda smelting13
Element % to matte % to slag % to offgas Ni 77 22 1 Pb 13 13 74 Sb 15 31 54 Zn 6 84 10
From Table 7, we can see the majority of lead should be contained within captured dust. This is
because the temperature within reactors is usually higher than 1200℃12,13, while the melting
point and boiling point of lead oxide are 888℃ and 1477℃ respectively. Lead oxide is the most
common lead compound under high temperature. During heat treatment, most of lead compound
will convert into lead oxide, expect lead chloride and lead sulfide.
Cadmium (Cd)
Cadmium is usually contained in PCB and semiconductors. The melting point and boiling point
of cadmium oxide are 900-1000℃ and 1559℃ respectively. Similar to lead, the distribution of
cadmium should be mainly contained in dust, which is usually collected and disposed safely.
2.4 Export of e-waste from the United States
From those annual reports of recycling programs run by manufacturers or retailers, we do see
remarkable achievements, but the amount of e-waste exported overseas is still significant. It is
obvious that it could be economically beneficial to the U.S. to dump e-waste to less developed
countries. In this way, they can exchange those waste for money instead of disposing them by
themselves and polluting their own environment. Even though we can almost guarantee all the
e-waste sent to those responsible collectors will be sent to downstream responsible certified
recyclers as they promised. There are also some uncertified entities, which may be more
reachable to customers. They also claim responsible recycling and even condemn what they are
27
exactly doing: shipping and selling e-waste in developing countries secretly to avoid disposal
costs and make some money out of it. US EPA estimates about 50%~80% of e-waste were
exported in the name of responsible recycling37. According to the data of United States
International Trade Commission in 2011, the trading volume of the import of e-waste from the
U.S. into China reached 11.54 billion US dollars, accounting for 11.1% of China’s total imports
from the U.S.38. Not only the U.S., other developed countries, like E.U., are also exporting their
generated e-waste to developing countries. Only 19% of e-waste in E.U. is recycled, which
means 81% of these resources escape from being reintroduced in the production system in
Europe. Actually, more than 50% of the e-waste in E.U. goes into unofficial collection routes,
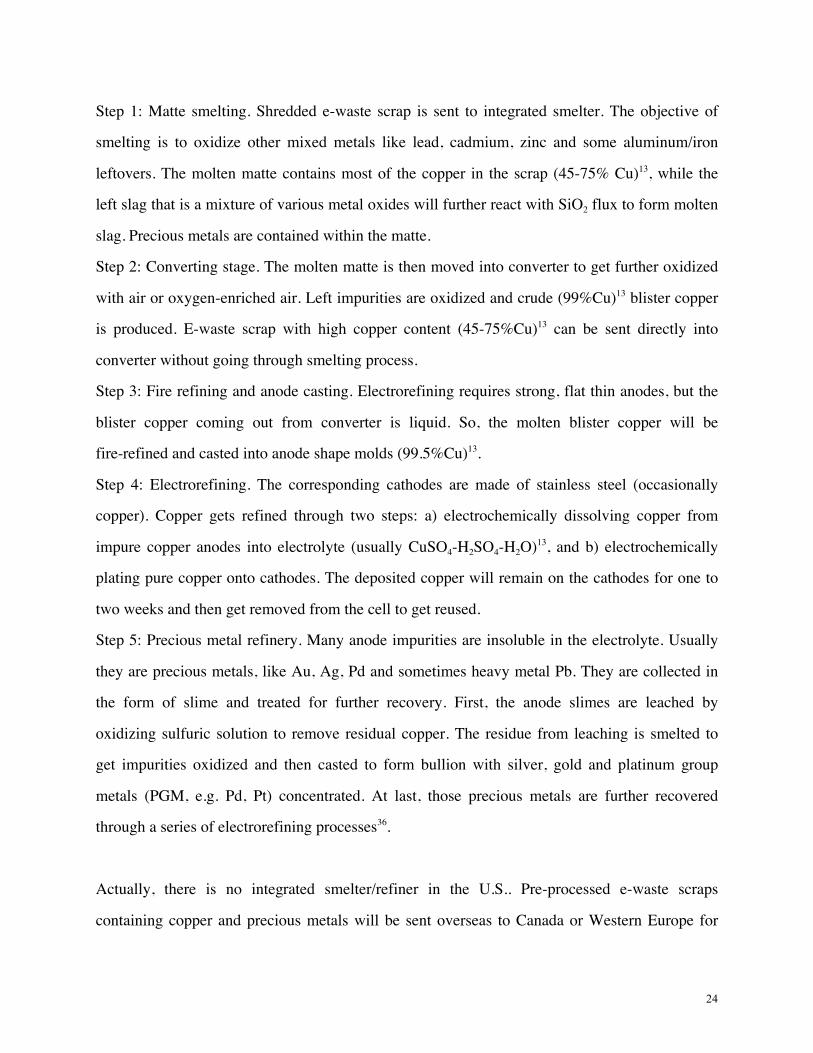
sometimes leading to illegal export and improper treatment39. The export routes of e-waste from
western Europe and north America are shown in Figure 10.
Figure 10 Export of e-waste from Western Europe and North America39
The Basel Convention is an international treaty used to limit the transportation of hazardous
waste among nations, especially from developed to developing countries. For those countries
ratifying the Basel Convention, hazardous cannot be exported without a permit, unless proof can
be provided showing wastes will be managed responsibly in the waste-importing country40. It has

28
significantly decreased the exportation and importation activities of wastes. As of September
2014, there are 181 parties to the Convention, including the E.U.. The U.S. and Haiti have signed
but not ratified the Convention. Since e-waste contains many hazardous materials, e-waste drew
parties’ attention at the most recent conference hold from Nov 27th to Dec 1st 2006. However,
even in counties party to the Convention, illegal export of e-waste still exists due to loopholes in
regulations and lax inspection, let alone non-parties. For non-parties to the Convention, like the
U.S., it has yet to ratify the Basel Convention and has a number of agreements that do not take
away from the Basel Convention, justifying the shipping of e-waste to other countries.
Governments in those developed countries should strengthen the supervision of uncertified
recyclers, encourage them to get certified and educate residents to send their obsolete products to
right places to avoid those uncertified entities. Most importantly, they should join Basel
Convention and develop a comprehensive e-waste management system without loopholes and
then strengthen the inspection over the whole system.
29
3 Electronic Waste Issues in China
3.1 The e-waste sink of the world: China
Figure 10 shows that most of the exported e-waste is shipped to developing countries, like China,
India, Vietnam, and Pakistan. Among these countries, China is the largest sink of e-waste. It was
widely reported that about 70% of e-waste produced globally ended up in China41. However, this
conclusion was drawn by the United Nations in 2003 and has been quoted over the years without
further verification. However, it is not proper to use this data after more than 10 years, because
China has put in place some important regulations during this long period. The annual imported
e-waste in 2010 was estimated to be around 2.6 million tons by a researcher in Netherlands42.
Assuming that the import volume remains constant in recent years and adding the domestic
e-waste generation in China (i.e. 7.3 million tons), the overall e-waste ending up in China
annually is estimated at about 9.9 million tons.
3.2 Channels for importing e-waste to China
Actually, China has explicitly banned the import of e-waste in Catalogue for Managing the Import
of Wastes (Latest edition: MEP, MOC, NDRC, GAC, AQSIQ, 2009, No.36), which is effective since Feb
200043. However, e-waste can still find its way to get into them. As mentioned earlier, China,
which is a party of Basel Convention, is now still taking care of about 20% of global e-waste
(China: 9.9 million tons, global: 49 million tons). The following could be possible channels for
trans-boundary shipments of e-waste into China:
a) Direct shipments to Chinese ports
Since China has already ratified the Basel Convention, it is almost impossible now to directly
ship full containers of e-waste into Chinese ports44. To ship them into mainland China, there
must be some less visible and less direct ways.

30
b) Mixed shipments with bulk mixed metal scraps
The import of mixed metal scraps for recycling is legal, though the import of e-waste is not
allowed in China. Some dealers and smugglers today may blend e-waste with cables and mixed
metal scraps together45. Usually, e-waste only accounts for around 10% of the total and it is very
difficult to distinguish e-waste from other scraps because the fractions are too small. Therefore,
the legality of a shipment of e-waste mixed with metal scraps can be hardly identified.
c) Transport through Hong Kong
Even though Hong Kong is part of China, the legislative system is a little bit different from
mainland China. E-waste cannot enter mainland China but the import of e-waste is allowed for
licensed importers at Hong Kong46. Once the shipment has entered Hong Kong, it can then be
easily re-exported to any other regions or countries, including mainland China47. As shown in
Figure 10, Hong Kong is the main gate for e-waste into China.
d) Transport through Vietnam
Another channel is a circuitous path of exporting e-waste through Vietnam into mainland China.
E-waste exported from Japan and the U.S. is transported to Haiphong in Vietnam where exists
the international port. As shown in Figure 11 that Mong Cai and Dongxin are border cities of
Vietnam and China respectively. Therefore, if e-waste is transported to the Mong Cai, then it can
easily cross the border into China through Dongxin at night in small boats48.

31
Figure 11 Smuggling map through Vietnam into Mainland China
3.3 Collection of e-waste in China
E-waste is collected either informally or formally in China. The central government has not
explicitly banned informal collectors because just the collection itself does not have much
negative environmental impact and in fact reduces the need for landfilling space. The flowchart
below shows the fate of collected e-waste. Because of the valuable content in e-waste and
existence of informal collectors, the amount of e-waste mixed with MSW to landfill or
incineration plant is trivial in China, except for those landfilled residues after informal recycling,
as illustrated in Figure 12 below.

32
Figure 12 E-waste collection flow in China49
3.3.1 Informal collection
Informal self-employed collectors, usually from rural areas, show up in urban areas. Because
most electronic products were introduced into rural areas in the recent years, there is not much
e-waste in rural areas. In the cities, informal collectors are collecting e-waste in following ways:
door-to-door collection, temporary dumpsite scavengers, landfill scavengers, street waste pickers,
and collectors for import waste. They are using cash to exchange for household waste items, not
just e-waste, also plastic, paper and metal scraps. The collected e-waste is then sold to local
second-hand market, repairers, recyclers or downstream scrap dealers according to products
condition. “Cherry picking” is another name of this informal collection process since, in this way,
only the waste with significant value is collected50. Because the value within e-waste is relatively
high, the collection rate is usually high.
Actually informal collection system can be very effective compared with formal one, since
individual collectors are able to reach every waste source. Also, citizens usually are willing to
sell their obsolete products for money and may not bother to send their electronic products to
designated recycling stations. The group of informal collectors is estimated to include 440,000
Comsumer
Formal collector and dealer
Secondhand market
Informal collector
Discard or landfill
Downstream processing enterprises
ManualDismantling
51%
Refurbishment
60%
Residuals5%
Temporary storage
10%15%
24%
40%
Reuse of components Hazardous waste
Enterprises with HW management license
Metals,plastics etc.
Illegal import

33
people51,52 in China.
3.3.2 Formal collection
Formal collection is organized by municipalities and the collected e-waste is directed to
designated environmentally responsible recyclers. Since the recycling process is under better
control in formal recycling process, the cost is higher than informal recycling process. So, when
collecting e-waste, they will charge more than the “cherry picker” collectors. There is no doubt
residents are therefore more willing to sell their products to informal collectors.
The national “Home Appliance Old for New Rebate Program” was launched by the Chinese
government from 2009 to 2011, in order to stimulate the formal recycling of old appliances as
well as the purchase of new home appliances. Those home appliances include air conditioners,
refrigerators, televisions, washing machines and computers, which accounts for more than 50%53
of the total e-waste amount. Authorized participants in this rebate program are supermarkets,
home appliance retailers, chain stores, logistics companies and waste collection companies.
Actually, Chinese government subsidized them to participate in this program. In this case, they
could pay consumers at a higher price than informal collectors, which put them in a favorable
position during competition. It was first launched on June 1st 2009 in nine pilot cities distributed
in different areas of China. Because of the huge success it achieved, the program was then
expanded nationwide since June 1st 2010. Figure 13 shows how exactly this program was run.

34
Figure 13 “Home Appliance Old for New Rebate Program” flow chart3
However, since this program totally relied on the subsidies from the government, with the end of
this program on Dec 31st 2011, the advantage of formal sectors over informal sectors vanished at
the same time. Figure 14 shows the recycling amounts and rate of the five home appliances
before, during and after the program. In Figure 14, we can see an obvious increased recycling
rate as the implementation of this program and also a slump after its termination. The term
“theoretical” means that the amount is not tracked but estimated. Such a successful program still
had to be terminated because all the subsidies demanded to support this national program
imposed a huge financial burden on Chinese government.

35
Figure 14 Formal recycling and theoretical disposal of obsolete home appliance54
3.4 Environmental issues associated with e-waste treatment in China
There are three options for end-of-life processing of e-waste after being collected: refurbishment,
remanufacturing and recycling55. Both refurbished and remanufactured products are supposed to
be reused. Refurbishment is using technical approach to restore electronic products to reusable
status. And then those refurbished products could be resold in second-hand market. However,
both the refurbishment industry and the second-hand markets are not well regulated in China.
The quality and safety of refurbished products can hardly be guaranteed. Different from
refurbishment, remanufacturing is the process of disassembly and recovery at the module level,
and eventually at the product level. Usually, remanufacturing is a mass production process while
refurbishment is small-scale. The quality of remanufactured product could be even higher than
new product. Remanufacturing of electronics in China mainly focuses on cartridges, copiers,
information technology servers and printers, which contain high-value parts and are durable55. If
the products have no chance to get reused, they will be sent for materials recycling. For now,
after being collected, individual informal collectors will sell those waste products either to
296
1917
5633
2066
4173
5148 5854
6671
7585
10980
0.00%
10.00%
20.00%
30.00%
40.00%
50.00%
60.00%
70.00%
80.00%
90.00%
0
2000
4000
6000
8000
10000
12000
2000 2010 2011 2012 2013
10000 units
Formal recycling amount
Theoretical disposal amount
Recycling rate

36
refurbishing workshops or informal e-waste recyclers (later referred to as informal recycling
chain), while those collected formally will be recycled formally (later referred to as formal
recycling chain).
According to Figure 12, about 24% of the domestic e-waste goes to formal collectors while 51%
goes to informal ones49. An estimated 60% of the e-waste from informal collectors will be sent
for end-of-life treatment49. Therefore, at present in China, about 24% of domestic e-waste is sent
for formal recycling while 30.6% is sent for informal recycling. As to imported e-waste, 40% is
refurbished and then used while the remaining 60% goes to informal recycling. The estimated
e-waste flow in this case is shown in Figure 15 below. About 38% of e-waste ends up in informal
recycling entities and only 18% for formal recyclers. A large amount ends up in second-hand
markets.
Figure 15 Estimated e-waste flow in China (2012)42,49
The electronic waste generated domestically and globally exposed Chinese people to great
environmental pollution, which may even be life-threatening. Even if they are sent to formal
e-waste recycling facilities, the formal recyclers will recycle it in a more responsible manner but
Temporary storage
7%
Second-hand market 37%
Informal recyclers
38%
Formal recyclers
18%
Total: 9.9 million tons

37
still with some remaining environmental issues. Associated environmental concerns with both
informal and formal recycling ways will be discussed separately below. It is worth mentioning
that both informal and formal recycling refer to materials recovery process. Therefore, informal
and formal recyclers refer to the entities conducting informal or formal materials recovery
process correspondingly.
3.4.1 Informal recycling
Recycling can help reserve the raw materials for products, while the hazardous chemicals
released during recycling process can harm workers as well as neighboring communities and
environment when under uncontrolled conditions. This uncontrolled recycling process is named
as informal recycling. Workers in informal e-waste recycling industry are estimated to be around
250,000 people51 in China. Photos below were taken from informal e-waste recycling facilities in
China.
Figure 16 Informal e-waste recycling situation in China
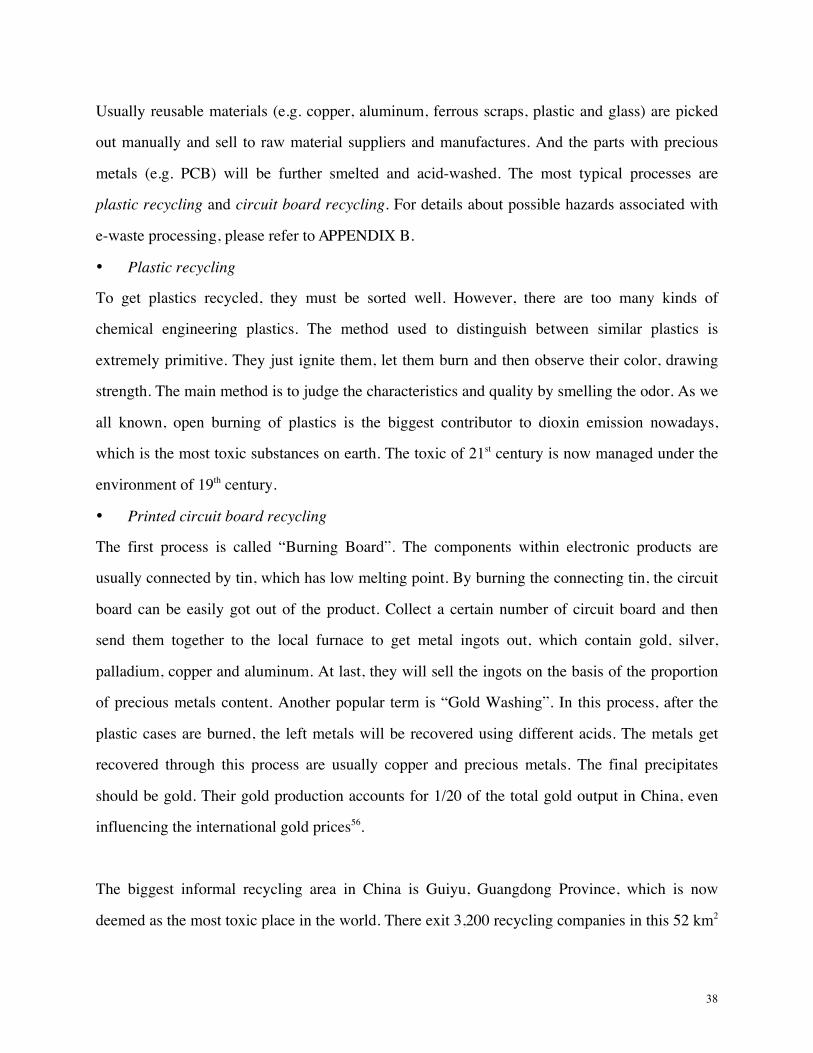
38
Usually reusable materials (e.g. copper, aluminum, ferrous scraps, plastic and glass) are picked
out manually and sell to raw material suppliers and manufactures. And the parts with precious
metals (e.g. PCB) will be further smelted and acid-washed. The most typical processes are
plastic recycling and circuit board recycling. For details about possible hazards associated with
e-waste processing, please refer to APPENDIX B.
• Plastic recycling
To get plastics recycled, they must be sorted well. However, there are too many kinds of
chemical engineering plastics. The method used to distinguish between similar plastics is
extremely primitive. They just ignite them, let them burn and then observe their color, drawing
strength. The main method is to judge the characteristics and quality by smelling the odor. As we
all known, open burning of plastics is the biggest contributor to dioxin emission nowadays,
which is the most toxic substances on earth. The toxic of 21st century is now managed under the
environment of 19th century.
• Printed circuit board recycling
The first process is called “Burning Board”. The components within electronic products are
usually connected by tin, which has low melting point. By burning the connecting tin, the circuit
board can be easily got out of the product. Collect a certain number of circuit board and then
send them together to the local furnace to get metal ingots out, which contain gold, silver,
palladium, copper and aluminum. At last, they will sell the ingots on the basis of the proportion
of precious metals content. Another popular term is “Gold Washing”. In this process, after the
plastic cases are burned, the left metals will be recovered using different acids. The metals get
recovered through this process are usually copper and precious metals. The final precipitates
should be gold. Their gold production accounts for 1/20 of the total gold output in China, even
influencing the international gold prices56.
The biggest informal recycling area in China is Guiyu, Guangdong Province, which is now
deemed as the most toxic place in the world. There exit 3,200 recycling companies in this 52 km2
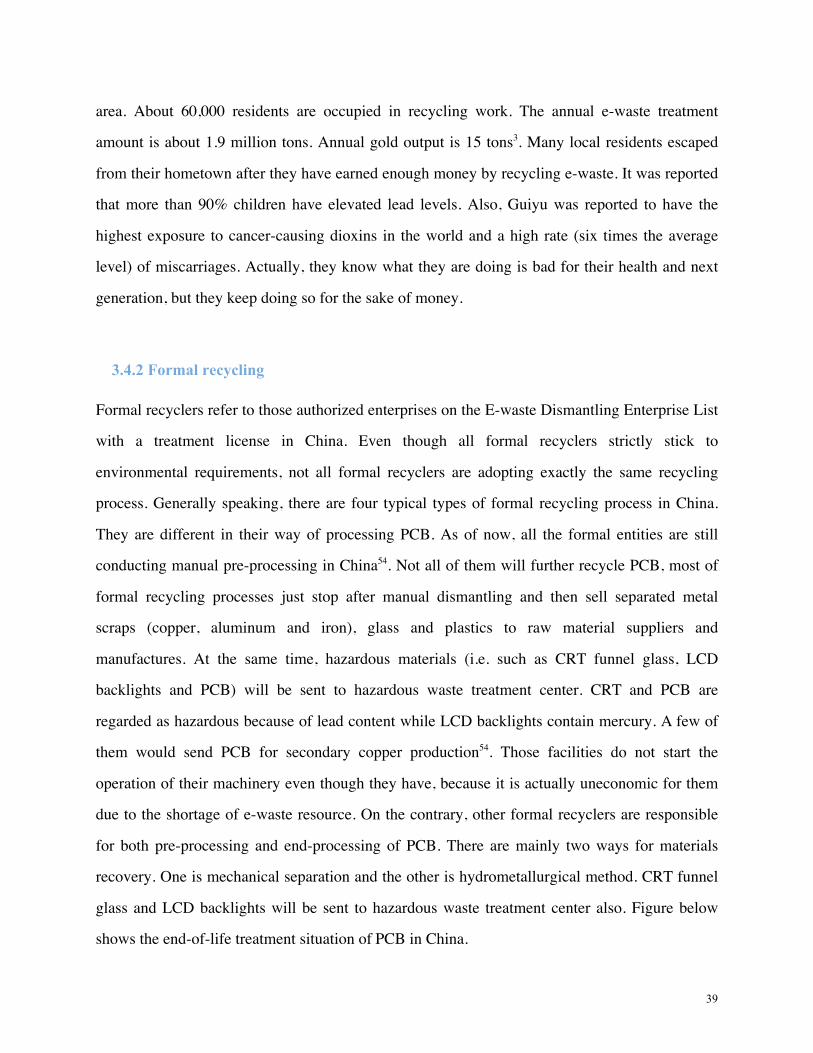
39
area. About 60,000 residents are occupied in recycling work. The annual e-waste treatment
amount is about 1.9 million tons. Annual gold output is 15 tons3. Many local residents escaped
from their hometown after they have earned enough money by recycling e-waste. It was reported
that more than 90% children have elevated lead levels. Also, Guiyu was reported to have the
highest exposure to cancer-causing dioxins in the world and a high rate (six times the average
level) of miscarriages. Actually, they know what they are doing is bad for their health and next
generation, but they keep doing so for the sake of money.
3.4.2 Formal recycling
Formal recyclers refer to those authorized enterprises on the E-waste Dismantling Enterprise List
with a treatment license in China. Even though all formal recyclers strictly stick to
environmental requirements, not all formal recyclers are adopting exactly the same recycling
process. Generally speaking, there are four typical types of formal recycling process in China.
They are different in their way of processing PCB. As of now, all the formal entities are still
conducting manual pre-processing in China54. Not all of them will further recycle PCB, most of
formal recycling processes just stop after manual dismantling and then sell separated metal
scraps (copper, aluminum and iron), glass and plastics to raw material suppliers and
manufactures. At the same time, hazardous materials (i.e. such as CRT funnel glass, LCD
backlights and PCB) will be sent to hazardous waste treatment center. CRT and PCB are
regarded as hazardous because of lead content while LCD backlights contain mercury. A few of
them would send PCB for secondary copper production54. Those facilities do not start the
operation of their machinery even though they have, because it is actually uneconomic for them
due to the shortage of e-waste resource. On the contrary, other formal recyclers are responsible
for both pre-processing and end-processing of PCB. There are mainly two ways for materials
recovery. One is mechanical separation and the other is hydrometallurgical method. CRT funnel
glass and LCD backlights will be sent to hazardous waste treatment center also. Figure below
shows the end-of-life treatment situation of PCB in China.

40
Figure 17 End-of-life treatment situation of PCB in China54
Obviously, mechanical separation is the most common methods for metals recovery from PCB in
China. Mechanical separation is based on the differences in physical properties (e.g. density,
conductibility, magnetic property, etc.) of different metals. However, the separating efficiency is
restricted by similar physical properties. The recovery efficiency of aluminum is reported to be
about 90%57. Hydrometallurgical process is made up of leaching of solid materials, solution
concentration and purification and metal recovery. Even though the materials recovery efficiency
of hydrometallurgical method is higher than mechanical separation, the large amount of caustic
and dangerous leachant (e.g. cyanide) poses great health risks to both the inhabitants and
environment. Table 8 lists the leaching agents used to leach precious metals out of e-waste
products.
Table 8 Leaching agents in hydrometallurgical process
Metal Leaching Agent
Palladium Hydrochloric and Sodium Chlorate
Base Metals Nitric Acid
Gold and Silver Thiourea or Cyanide
Copper Sulphuric Acid or Aqua Regia
Hazardous waste treatment center
54%
Mechanical separation
42%
Hydrometallurgical method
2%
Secondary copper production
2%

41
4 Potential Application of Advanced E-waste Management System in China
Even though western countries set a good example for us about how to get e-waste recycled
responsibly, China cannot directly copy it but incorporate it creatively to better fit into its unique
society. As the biggest electronic manufacturer in the world, China is in need of sufficient raw
materials. So not only the environmental issues, the recovery rate also means a lot to recyclers in
China. To be specific, informal collectors is much more effective than formal collectors, since
individual collectors can reach almost every waste source. Besides, the effectiveness of informal
manual dismantling is significantly higher than formal mechanical shredding, which makes part
of informal recycling valuable. Therefore, it would be better if we could find a way combining
the benefits in both informal and formal chains. In other words, efficient informal collection and
dismantling part was proposed to be linked with efficient, safe and environmental friendly formal
materials recycling to form a better recycling chain37.
4.1 Technology support
4.1.1 Proposed e-waste recycling chain
In collection part, we can continue to let those self-employed collectors to collect e-waste and
then send to formal collection center. The collection center then decides whether the collected
products have the potential to be resold. If yes, they would be sent to refurbishing shops or
remanufacturers to get refurbished or remanufactured. Even though some products would be
repaired before entering second-hand market now, this field is loosely regulated in China.
Therefore the quality and safety of refurbished products can hardly be guaranteed. Also, there is
no professional industry especially responsible for electrical and electronic products
remanufacturing now in China. Actually, no country has recognized remanufacturing officially as
a distinct industrial activity yet, even developed countries, like the U.S.58. For those products,
which can be neither refurbished nor remanufactured, they would be sent for end-of-life
processing to get valuable materials recovered.
42
In pre-processing part, formal recycling entities could hire those previous informal recyclers to
help conduct manual dismantling and sorting. To guarantee those untrained informal recyclers to
dismantle e-waste in an environmental-friendly manner, there should be professional recyclers to
lead them in the workshop and transform them into formal recyclers. After pre-processing,
aluminum scraps, copper scraps, ferrous fractions, glass (leaded and unleaded) and plastics are
separately collected. PCB should be collected together with copper scraps.
In end-processing, the technology adopted now in the formal e-waste recycling in China for
precious metal recovery is hydrometallurgical process while integrated smelting and refining
facilities (pyrometallurgical process) are the most successful technology right now in e-waste
recycling in western countries9. The recycling efficiency of precious metals of both methods is
almost the same. But integrated copper smelter is more economical9 compared to
hydrometallurgical process and avoid the large amount of caustic and dangerous leachant, which
may lead to serious environmental concern. Plastics, aluminum and iron scraps will be sent to
related secondary production factory as usual, while leaded glass can be cleaned first and then
sent to glass factory together with unleaded glass.
The overall proposed treatment chain is illustrated in Figure 18. The color represents the level of
technology support needed.

43
Figure 18 Proposed e-waste recycling chain in China
4.1.2 Technology obstacles and recommendations
The biggest issue associated with remanufacturing is that most of the products were not designed
for remanufacturing, which makes the remanufacturing process difficult. So, to solve the
problems we should motivate or even require manufacturers to take the remanufacturing
possibility into their designs.
As of now, there is no integrated copper smelter in China and to build such state-of-the-art
smelters/refiners needs large initial cost. But there do exist several advanced copper smelters for
secondary copper production in China, like Kaldo furnace and Ausmelt furnace59. Secondary
copper refers to all non-primary copper sources, such as e-waste and metallurgical waste.
Secondary copper currently contributes about 35% to global copper production according to the
International Copper Study Group60. The average treatment capacity in each secondary copper
production plant in China is about 100,000 tons/year59. As to precious metals, even though there
are around 150-200 factories recycling precious metals, their overall treatment capacity is low
and primitive facilities, outdated technology and low recovery rate lead to a waste of resources
and energy. We can add precious metals refinery sector to existing copper smelters to form

44
integrated smelters/refiners as what western countries do. In this way, we can hopefully
maximize the output of these existing smelters or even expand them to handle all the e-waste
disposed in China.
Besides, glass-to-lead technology is proposed for leaded glass recycling in China but the whole
system and facility has not been established yet. Actually, even during glass-to-lead process, at
least 85% of the glass will still be toxic and need to be disposed as hazardous waste61. Therefore,
the Nulife process is a better way out if possible. Since LCD technology is relatively new to
China, the amount of LCD TVs and LCD monitors ready for end-of-life treatment is not that
much. Therefore, the technology for proper treatment of LCD backlights is not mature right now
in China but backlights is required by regulation to be separated out of other e-waste stream and
disposed safely.
To solve the gap between the demand for raw materials and urgency for pollution control,
Chinese government has to invest on the construction of advanced facilities within the country.
However, this cannot be achieved overnight. Before the well establishment of end-processing in
China, there is still another way out, which is the so-called “Best-of-2-Words” philosophy
(Bo2W)37. Bo2W proposes a network for recycling e-waste worldwide. Developing countries,
like China, can export those well-sorted materials to international state-of-the-art end-processing
facilities to get recovered responsibly before technology issue solved. To some extent, it is not so
much as an issue of technology as an issue of money.
Back to pre-processing, the reason why we choose to use manual dismantling and sorting in
China while mechanical processing in western countries is that the labor cost is still low in China
compared with developed countries. However, as the labor cost increases, the formal recycling
sector, which is responsible for pre-processing, will transfer gradually from labor-intensive work
to mechanical process.

45
4.2 Regulation support
As mentioned before, China is a party of Basel Convention, which bans the import of e-waste.
Besides, China has various regulations, laws and standards related to e-waste management. Six
of the most important regulations and laws are shown in Table 9.
Table 9 Regulations and laws related to e-waste management in China50
Regulations/Laws (English)
Regulations/Laws (Chinese)
Major Content Effective Time
Catalogue for Managing the Import of Wastes (Latest edition: MEP, MOC, NDRC, GAC, AQSIQ, 2009, No.36)
进⼝口废物管理⺫⽬目录(环保部,商务部,发改委,海关总署,国家质检总局 公告 2009 年第 36号)
Bans the import of e-waste Feb 2000
Technical Policy on Pollution Prevention and Control of WEEE (SEPA No.115)
废弃家⽤用电器与电⼦子产品污染防治技术政策 环发[2006]115 号
•Set principles of ‘3R’ and ‘polluter pays principle’ •Stipulates eco-design •Makes provisions for environmentally-sound collection, reuse, recycling and disposal of WEEE
Apr 2006
Ordinance on Management of Prevention and Control of Pollution from Electronic and Information Products (MIIT No.39)
电⼦子信息产品污染控制管理办法(⼯工信部令第 39 号)
•Requirements for product eco-design •Restrictions on the use of hazardous substances •Requirements for producers to provide information about their products
Mar 2007
Administrative Measures on Pollution Prevention of WEEE (SEPA No.40); Technical Specifications of Pollution Control for Processing WEEE
电⼦子废物污染环境防治管理办法(环保总局令第 40 号); 废弃电器电⼦子产品处理污染控制技术规范(HJ527-2010)
•Calls for prevention of pollution caused by the disassembly, recycling and disposal of e-waste •Licensing scheme for managing e-waste recycling companies
Feb 2008
Regulation on Management of the Recycling and
废弃电器电⼦子产品回收处理管理条例
•Makes e-waste recycling mandatory
Jan 2011

46
Disposal of Waste Electrical and Electronic Equipment (State Council No.551)
(国务院令第 551号)
•Implements Extended Producer Responsibility •Establishes a special fund to subsidize e-waste recycling
To solve the e-waste problem in China, we have to deal with both recycling and import issues.
To absolutely ban the import of e-waste from developed countries, we should ban the import of
both second-hand EEE and e-waste around the whole country including Hong Kong in any case.
The reason why we should ban them together is that it is really hard to distinguish between
e-waste and second-hand EEE. Otherwise, we should strengthen supervision and inspection of all
the shipments into the ports of China and Hong Kong. China launched its Green Fence Initiative
from Feb 1st to Nov 30th in 2013 for ten months. The National Customs inspected each shipment
carefully to fight against the smuggling of foreign garbage into China. They mainly focused on
two categories of garbage: 1) smuggling of solid waste on the inventory of national banned
importation; 2) smuggling of solid waste not meeting related environmental control standards62.
During the operational period, the customs seized and returned 56,400 tons of foreign garbage63.
The Green Fence was just a trial but has promoted even the recycling industry in developed
countries, such as the U.S.. The trial has been ended but the vigorous inspection of imported
shipments should move towards.
As to the sale of reusable products (directly reusable or refurbished/remanufactured to be
reusable), government should take measures to regulate second-hand market. Currently,
second-hand market is within grey zone of Chinese regulation system. Many products sold in
this market were unqualified. Better-regulated second-market also demands well-established
refurbishment and remanufacturing industries.
As to e-waste materials recycling industry, directly banning the informal recycling plants is not a
wise choice. It is unfair to deny the opportunity for poor people to sacrifice even their health to

47
earn decent money to make a better life. The government should at least create some safe job
opportunities for those people. However, hiring informal recyclers into formal recycling entities
is not an easy thing to do. If they can earn more money as self-employed worker, they will not be
willing to work for formal entities. To achieve this, government should divert e-waste stream
from informal recyclers to formal recyclers. In this way, informal recyclers cannot get enough
e-waste to make money out of it and then they will consider the possible job offered by formal
entities. How could e-waste be redirected? There must be some economic incentive for
customers similar to what the Chinese government did in “Home Appliance Old for New Rebate
Program”. Guarantee of source of e-waste is not only good for recycling entities but also for
refurbishing and especially beneficial to mass production in remanufacturing industries in the
future.
However, providing economic incentive could be a huge burden for the government.
Manufactures, who are making money by selling EEE, should also assume this responsibility of
recycling. Chinese government is now promoting EPR within the country. However, as of now,
it is still unclearly defined and the whole system has not been established. Besides, there are
some potential difficulties. First, it is really hard to identify the producers because of the
prevailing of smuggling and imitation in China. Second, some producers may report more than
actual recycled amount64. To mitigate these difficulties, Chinese government should strengthen
the supervision over and measures against smuggling and imitation. Complete EPR system
should be established, which defines not only the responsibility of producers but also retailers,
consumers and even government. Various recycling programs will develop along with the fully
implementation of EPR in China, which provides more options for consumers to get their
obsolete products recycled.
4.3 Industrialization
E-waste recycling can be better developed if it could be industrialized and driven by the market.

48
However, due to the e-waste management system has not been well established in China. The
industrialization of e-waste recycling still has a long way to go. The possible industries related to
e-waste recycling could be e-waste collection industry, refurbishment/remanufacturing industry
and recycling industry. However, all these industries could hardly be profitable if they are private
enterprises and without other subsidies in current situation. So at the initial stage, they had better
be state-owned enterprise or at least supported by government. After the whole e-waste recycling
system has been further developed in China, those enterprises can be privatized and then only
rely on market without government’s support.

49
5 Environmental and Social Benefits Analysis
5.1 Electrical and electronic equipment ready for end-of-life management in China
5.1.1 Domestic generation
Speaking of e-waste, China now mainly focuses on six types of products: mobile phones,
computer, television, air conditioner, washing machine and refrigerator. As mentioned earlier,
the five main household appliance types, i.e. computer, television, air conditioner, washing
machine and refrigerator, already included in non-implemented Chinese legal measures, were
assessed to account for more than 50% of the total e-waste53.
Table 10 is the estimated domestic generation amount of the six types of WEEE in China. The
data was obtained from the slides presented on 4th ITU Green Standards Week in Beijing by
Basel Convention Regional Centre for Asia and the Pacific in Sep 2014. Figure 19 shows the
accumulated generation amount accordingly65.
Table 10 Domestic generation of e-waste in China (million units)65
Year Refrigerator Washing machine
Air conditioner Television Computer Mobile
phones Total
2010 8.03 13.41 14.40 32.90 38.57 83.18 190.49 2011 8.53 12.41 16.96 43.65 42.99 114.82 239.36 2012 12.09 13.73 21.67 47.38 47.07 184.93 326.87 2013 14.69 16.03 28.32 43.79 50.79 231.33 384.95 2014 12.32 19.04 35.15 28.33 54.13 241.15 390.12 2015 13.75 20.86 37.52 38.11 57.1 241.12 408.46 2016 18.73 24.17 35.08 42.95 59.7 281.97 462.60 2017 23.29 26.59 40.57 44.55 61.97 306.77 503.74 2018 35.77 29.71 42.9 52.05 63.94 317.55 541.92 2019 42.45 35.94 57.07 56.96 65.63 325.74 583.79 2020 54.47 44.68 71.92 66.70 67.08 332.76 637.61
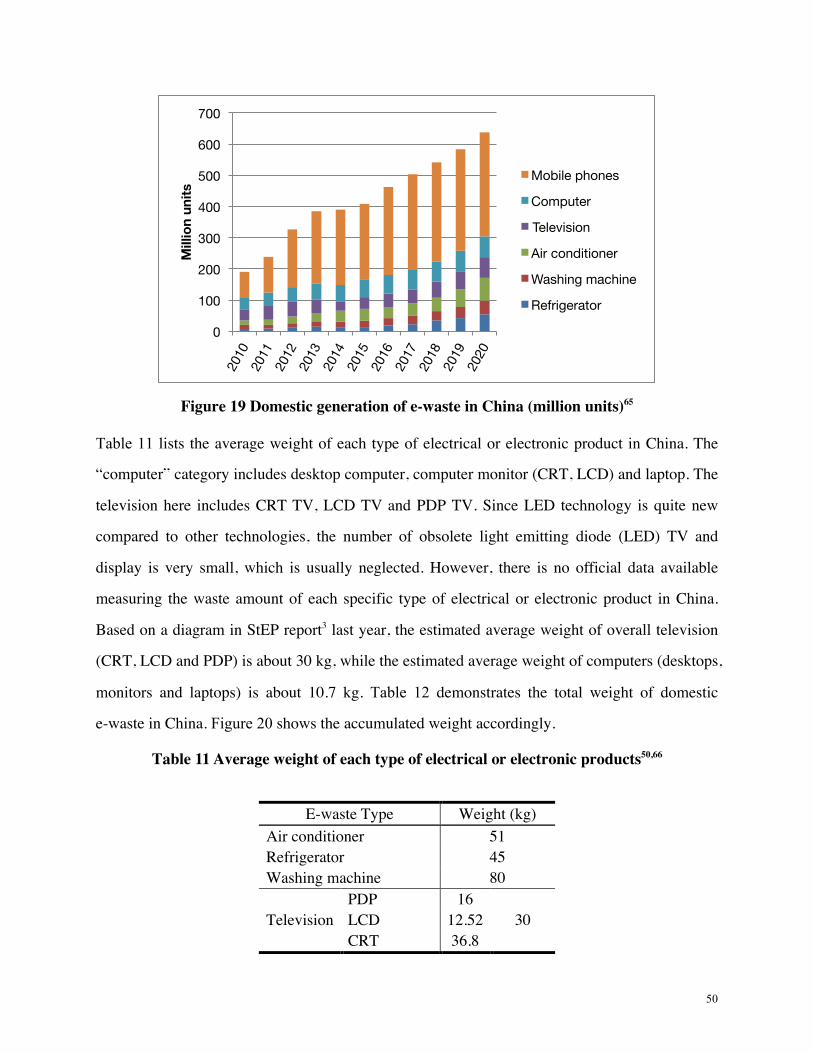
50
Figure 19 Domestic generation of e-waste in China (million units)65
Table 11 lists the average weight of each type of electrical or electronic product in China. The
“computer” category includes desktop computer, computer monitor (CRT, LCD) and laptop. The
television here includes CRT TV, LCD TV and PDP TV. Since LED technology is quite new
compared to other technologies, the number of obsolete light emitting diode (LED) TV and
display is very small, which is usually neglected. However, there is no official data available
measuring the waste amount of each specific type of electrical or electronic product in China.
Based on a diagram in StEP report3 last year, the estimated average weight of overall television
(CRT, LCD and PDP) is about 30 kg, while the estimated average weight of computers (desktops,
monitors and laptops) is about 10.7 kg. Table 12 demonstrates the total weight of domestic
e-waste in China. Figure 20 shows the accumulated weight accordingly.
Table 11 Average weight of each type of electrical or electronic products50,66
E-waste Type Weight (kg) Air conditioner 51 Refrigerator 45 Washing machine 80
Television PDP 16
30 LCD 12.52 CRT 36.8
0
100
200
300
400
500
600
700
Mill
ion
units
Mobile phones
Computer
Television
Air conditioner
Washing machine
Refrigerator

51
Computer
LCD monitors 6.26
10.7 CRT monitors 18.4 Desktop 12.26 Laptop 3.55
Mobile phones 0.133
Note: CRT/LCD TV is assumed to have the same composition as CRT/LCD monitor and the size is usually doubled.
Table 12 Weight of domestic e-waste in China (million tons)50,65,66
Year Refrigerator Washing machine
Air conditioner Television Computer Mobile
phones Total
2010 0.36 1.07 0.73 0.99 0.41 0.01 3.58 2011 0.38 0.99 0.86 1.31 0.46 0.02 4.03 2012 0.54 1.10 1.11 1.43 0.50 0.02 4.70 2013 0.66 1.28 1.44 1.32 0.54 0.03 5.28 2014 0.55 1.52 1.79 0.85 0.58 0.03 5.33 2015 0.62 1.67 1.91 1.15 0.61 0.03 5.99 2016 0.84 1.93 1.79 1.29 0.64 0.04 6.53 2017 1.05 2.13 2.07 1.34 0.66 0.04 7.29 2018 1.61 2.38 2.19 1.57 0.68 0.04 8.47 2019 1.91 2.88 2.91 1.71 0.70 0.04 10.16 2020 2.45 3.57 3.67 2.01 0.72 0.04 12.46
Figure 20 Weight of domestic e-waste in China (million tons)50,65,66
Though the majority of data here are estimated, they can still somehow show the trend to some
0.00
2.00
4.00
6.00
8.00
10.00
12.00
14.00
Mill
ion
tons
Mobile phones
Computer
Television
Air conditioner
Washing machine
Refrigerator
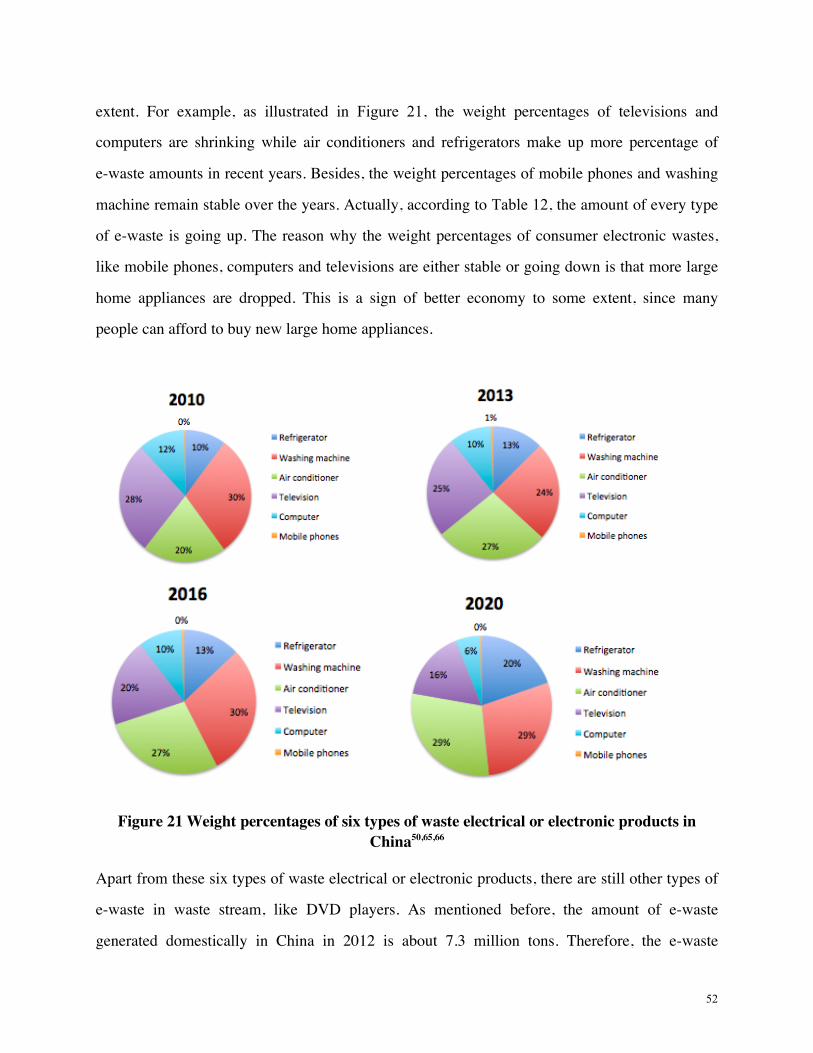
52
extent. For example, as illustrated in Figure 21, the weight percentages of televisions and
computers are shrinking while air conditioners and refrigerators make up more percentage of
e-waste amounts in recent years. Besides, the weight percentages of mobile phones and washing
machine remain stable over the years. Actually, according to Table 12, the amount of every type
of e-waste is going up. The reason why the weight percentages of consumer electronic wastes,
like mobile phones, computers and televisions are either stable or going down is that more large
home appliances are dropped. This is a sign of better economy to some extent, since many
people can afford to buy new large home appliances.
Figure 21 Weight percentages of six types of waste electrical or electronic products in China50,65,66
Apart from these six types of waste electrical or electronic products, there are still other types of
e-waste in waste stream, like DVD players. As mentioned before, the amount of e-waste
generated domestically in China in 2012 is about 7.3 million tons. Therefore, the e-waste

53
composition in 2012 can be illustrated as the pie chart in Figure 22.
Figure 22 Composition of e-waste in China (2012)
As shown in the figure above, these six types of e-waste account for approximate 64% of the
e-waste in 2012 in China.
5.1.2 Imported e-waste
Because this waste stream is illegal, it is impossible to track the amount. However, the average
annual amount was estimated to be around 2.6 million tons in 201042. Assume the imported
amount does not change in recent years. So we are using this number here to further estimate the
composition of imported e-waste in China. According to Figure 10, the imported e-waste is
usually from developed countries. Here, we use the composition of imported e-waste from the
U.S. to represent overall imported e-waste. Figure 23 shows the weight breakdown by product of
export amounts in the U.S.. All the figures about exported e-waste stream from the U.S. are
obtained from a MIT report “Quantitative Characterization of Domestic and Transboundary
Flows of Used Electronics”67.
7% 15%
15%
20% 7%
0%
36%
2012 (total: 7.3 million tons) Refrigerator
Washing machine
Air conditioner
Television
Computer
Mobile phones
Other
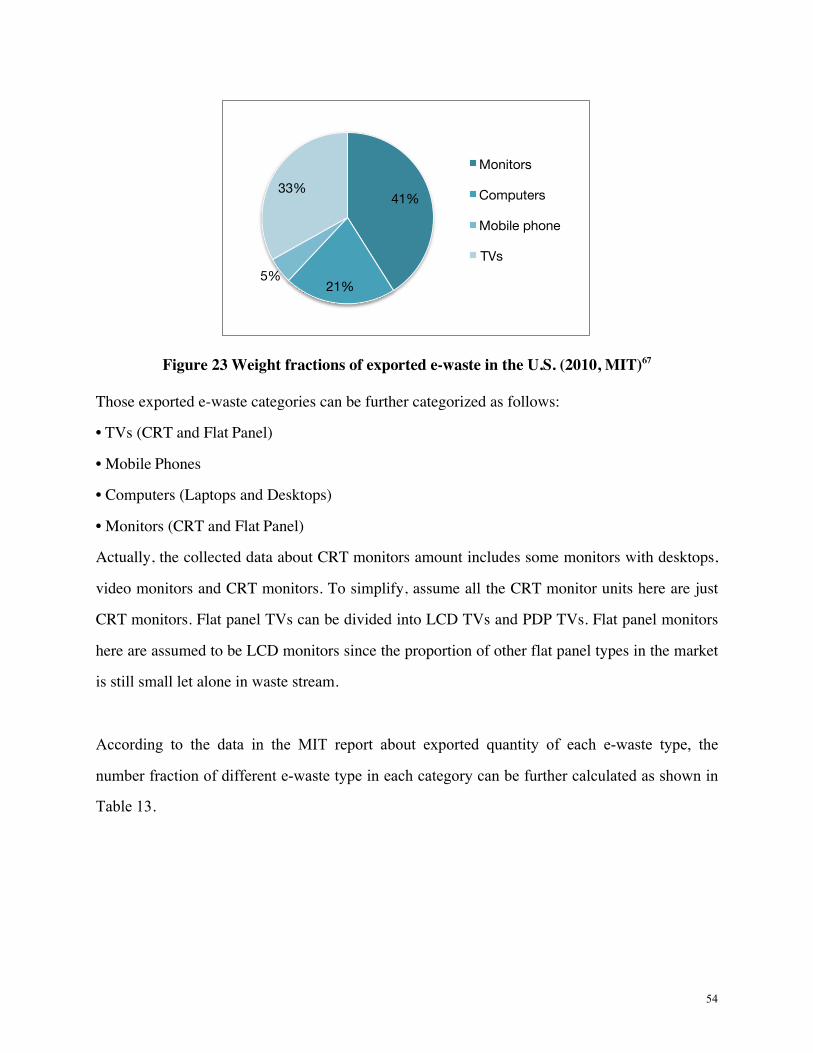
54
Figure 23 Weight fractions of exported e-waste in the U.S. (2010, MIT)67
Those exported e-waste categories can be further categorized as follows:
• TVs (CRT and Flat Panel)
• Mobile Phones
• Computers (Laptops and Desktops)
• Monitors (CRT and Flat Panel)
Actually, the collected data about CRT monitors amount includes some monitors with desktops,
video monitors and CRT monitors. To simplify, assume all the CRT monitor units here are just
CRT monitors. Flat panel TVs can be divided into LCD TVs and PDP TVs. Flat panel monitors
here are assumed to be LCD monitors since the proportion of other flat panel types in the market
is still small let alone in waste stream.
According to the data in the MIT report about exported quantity of each e-waste type, the
number fraction of different e-waste type in each category can be further calculated as shown in
Table 13.
41%
21% 5%
33% Monitors
Computers
Mobile phone
TVs

55
Table 13 Detailed breakdown of different e-waste category (2010, MIT)67
E-waste Type Number Fraction
Televisions PDP TV 0.43% LCD TV 6.71% CRT TV 92.86%
Monitors LCD Monitor 67.90% CRT Monitor 32.10%
Mobile Phones 100.00%
Computers Laptop 72.50% Desktop 27.50%
Note: LCD TVs shipments are about 94% of flat panel TVs shipments worldwide while PDP TVs account for 6% in 201268. Even though this is about shipment not exact information about waste, this shipment information is worldwide, which means both developing countries and developed countries are included. Therefore, it can used to estimate the breakdown of waste flat panel TVs in the U.S. to some extent and then calculate the average weight per television unit.
On the basis of Table 11 and Table 13, average weight of each unit in different categories of
e-waste stream can be calculated as Table 14.
Table 14 Average weight of each unit in different types of e-waste products50,66,67
E-waste Category Average weight per unit (kg) Monitors 35.081
Computers 10.157 Mobile phones 0.133
TVs 5.945 Since the average imported e-waste amount is estimated to be 2.6 million tons per year, weight
of each e-waste category can be further calculated based on weight fractions shown in Figure 23.
According to average weight of each unit in different categories listed in Table 14, the total
quantity of each category can be achieved. Then, the quantity of each e-waste type can be further
calculated based on related number fraction. All the figures above are listed in Table 15.

56
Table 15 Annual imported e-waste in China42,50,66,67
E-waste Type Weight (million tons) Quantity (million units)
Televisions PDP TV
0.86 24.46 0.10
LCD TV 1.64 CRT TV 22.71
Monitors LCD Monitor 1.07 104.95 71.27 CRT Monitor 33.69
Mobile Phones 0.10 0.13 977.44
Computers Laptop 0.55 91.84 66.58 Desktop 25.26
Total 2.60 1198.69 1198.69
5.2 Environmental analysis
Environmental benefits can be earned by transferring existing e-waste recycling situation into the
proposed recycling chain, which include energy saving, green house gas (GHG) reduction, raw
materials conservation and toxic materials saving. However, since there is no record about the
related energy consumption in informal recycling chain as well as its associated GHG emissions.
Therefore, the energy saving and reduction, which will be calculated in this section, focus on the
benefits over zero recycling situation by adopting the proposed e-waste recycling chain. Assume
the percentage of each e-waste flow remains same as current situation after adopting the
proposed recycling chain and the composition of each e-waste flow is the same. The boundary of
environmental analysis in following part is described below:
1) Only the recycling of six types of EEE (air conditioner, refrigerator, washing machine, TV,
computer and mobile phone) is discussed here.
2) Batteries and phone chargers are excluded.
3) Only the recycling of metals and glass is included. The recycling of plastics is out of scope
since not all types of plastics would be recycled and some plastics would be used as fuel in some
cases.
4) Only the benefits gained from end-of-life recycling chain, excluding the benefits from
refurbishment or remanufacturing.
57
5) Exclude transportation difference.
6) The benefits focus on next year (2015).
5.2.1 Raw materials conservation
The overall materials recovery efficiency is determined by both pre-processing efficiency and
end-processing efficiency. Usually, during pre-processing, with regard to materials recovery
manual dismantling efficiency is almost 100% while mechanical pre-processing is about 70%37.
As mentioned, pre-processing technique in both formal/informal chains in China is usually just
manual dismantling and sorting.
During end-processing, copper, aluminum and ferrous scraps are sent to corresponding smelting
plants to recover in both informal and formal chains. Assume the recovery efficiency is similar to
US standards: Al (93%)69, Cu (81%)70 and Fe (98%)71. As to the recovery of precious metals, by
informal leaching, the recovery rate is about 68.9% (assume recovery rate of all precious metals
is similar to gold) while that of integrated smelters could be as high as 95.3%37. As mentioned
earlier, the recovery efficiency of aluminum through mechanical separating system is about
90%57. Here, assume the recovery efficiency of all the other metals is the same as aluminum. As
to formal hydrometallurgical method in China, the recovery efficiency of each kind of precious
metal is reported to be 98% for silver, 93% for palladium and 97% for gold72. Actually, the
recovery efficiency can be various in different reports using different measuring methods. Since
the recovery efficiency of formal hydrometallurgical method is similar to that of integrated
smelters, there is no need to differentiate between the two. Therefore, it is assumed that both of
them can achieve recovery efficiency as high as 95.3%. Also, it is assumed that the glass amount
does not change after class cleaning, as claimed by Nulife61.
The material flow in informal recyclers is illustrated in Figure 24. As mentioned before, PCB
recycling process varies in formal recycling entities. Formal recycling material flow is illustrated

58
in Figure 25. Figure 26 is material flow of the proposed E-waste Recycling Process.
Figure 24 Material flow of informal e-waste recycling process
Figure 25 Material flow of formal e-waste recycling process
Figure 26 Material flow of proposed e-waste recycling process
As mentioned earlier, raw materials mainly discussed here are base metals, precious metals and
glass, which are listed in detail in Table 16. According to Table 2 and Table 3, the raw materials

59
content in each type of e-waste are listed in Table 17.
Table 16 Recycled raw materials
Raw Material Breakdown
Base Metals Al, Fe, Cu
Precious Metals Au, Ag, Pd
Glass -
Table 17 Raw materials content in e-waste7,66,73,74
E-waste Type Glass (kg/unit) Base Metals (kg/unit) Precious Metals (mg/unit)
Leaded Unleaded Cu Al Fe Au Ag Pd Air conditioner 0.00 0.00 9.18 4.75 23.44 20.66 79.87 - Refrigerator 0.00 0.00 1.57 0.59 21.42 9.90 9.45 - Washing machine 0.00 0.00 2.58 1.60 41.49 23.12 69.36 - PDP TV 0.00 5.92 0.45 2.46 5.40 374.40 499.20 - LCD TV 0.00 1.13 0.36 0.57 5.45 290.46 871.39 - CRT TV 8.43 4.75 1.67 0.24 4.78 16.01 384.19 64.03 LCD monitor 0.00 0.56 0.18 0.28 2.73 145.23 435.70 - CRT monitor 4.21 2.37 0.83 0.12 2.39 8.00 192.10 32.02 Mobile phone 0.00 0.02 0.01 - 0.00 60.45 153.14 12.09 Laptop 0.00 0.83 0.13 0.09 0.71 306.40 534.99 97.27 Desktop 0.00 0.00 0.34 - 5.81 276.59 656.89 172.87
In 2015, the domestic e-waste generation and imported e-waste amount can be obtained from
Table 10 and Table 15 respectively. Together with the information about e-waste flow in China
in Figure 8, material recovery efficiency listed in Figure 24-26 as well as the raw materials
amount that could be hopefully recovered in each unit listed in Table 17, the total amount of raw
materials could be conserved through e-waste recycling in different scenarios can be calculated
as shown in Table 18-20.
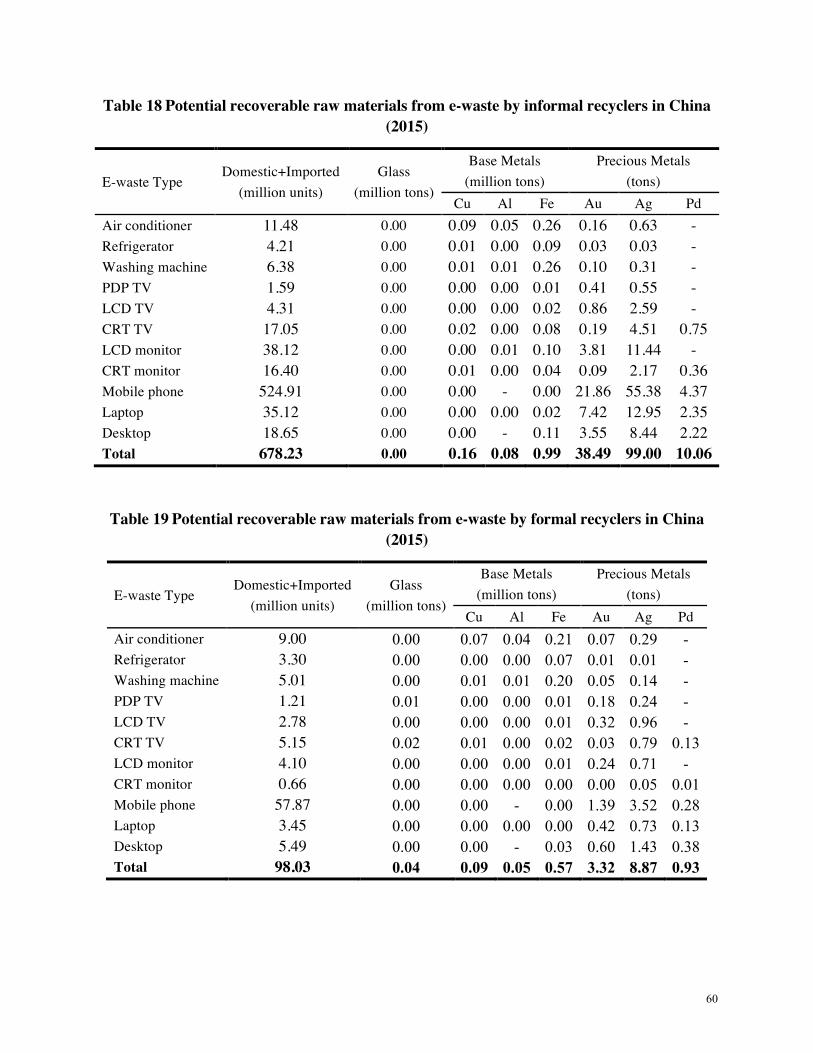
60
Table 18 Potential recoverable raw materials from e-waste by informal recyclers in China (2015)
E-waste Type Domestic+Imported
(million units) Glass
(million tons)
Base Metals (million tons)
Precious Metals (tons)
Cu Al Fe Au Ag Pd Air conditioner 11.48 0.00 0.09 0.05 0.26 0.16 0.63 - Refrigerator 4.21 0.00 0.01 0.00 0.09 0.03 0.03 - Washing machine 6.38 0.00 0.01 0.01 0.26 0.10 0.31 - PDP TV 1.59 0.00 0.00 0.00 0.01 0.41 0.55 - LCD TV 4.31 0.00 0.00 0.00 0.02 0.86 2.59 - CRT TV 17.05 0.00 0.02 0.00 0.08 0.19 4.51 0.75 LCD monitor 38.12 0.00 0.00 0.01 0.10 3.81 11.44 - CRT monitor 16.40 0.00 0.01 0.00 0.04 0.09 2.17 0.36 Mobile phone 524.91 0.00 0.00 - 0.00 21.86 55.38 4.37 Laptop 35.12 0.00 0.00 0.00 0.02 7.42 12.95 2.35 Desktop 18.65 0.00 0.00 - 0.11 3.55 8.44 2.22 Total 678.23 0.00 0.16 0.08 0.99 38.49 99.00 10.06
Table 19 Potential recoverable raw materials from e-waste by formal recyclers in China (2015)
E-waste Type Domestic+Imported
(million units) Glass
(million tons)
Base Metals (million tons)
Precious Metals (tons)
Cu Al Fe Au Ag Pd Air conditioner 9.00 0.00 0.07 0.04 0.21 0.07 0.29 - Refrigerator 3.30 0.00 0.00 0.00 0.07 0.01 0.01 - Washing machine 5.01 0.00 0.01 0.01 0.20 0.05 0.14 - PDP TV 1.21 0.01 0.00 0.00 0.01 0.18 0.24 - LCD TV 2.78 0.00 0.00 0.00 0.01 0.32 0.96 - CRT TV 5.15 0.02 0.01 0.00 0.02 0.03 0.79 0.13 LCD monitor 4.10 0.00 0.00 0.00 0.01 0.24 0.71 - CRT monitor 0.66 0.00 0.00 0.00 0.00 0.00 0.05 0.01 Mobile phone 57.87 0.00 0.00 - 0.00 1.39 3.52 0.28 Laptop 3.45 0.00 0.00 0.00 0.00 0.42 0.73 0.13 Desktop 5.49 0.00 0.00 - 0.03 0.60 1.43 0.38 Total 98.03 0.04 0.09 0.05 0.57 3.32 8.87 0.93
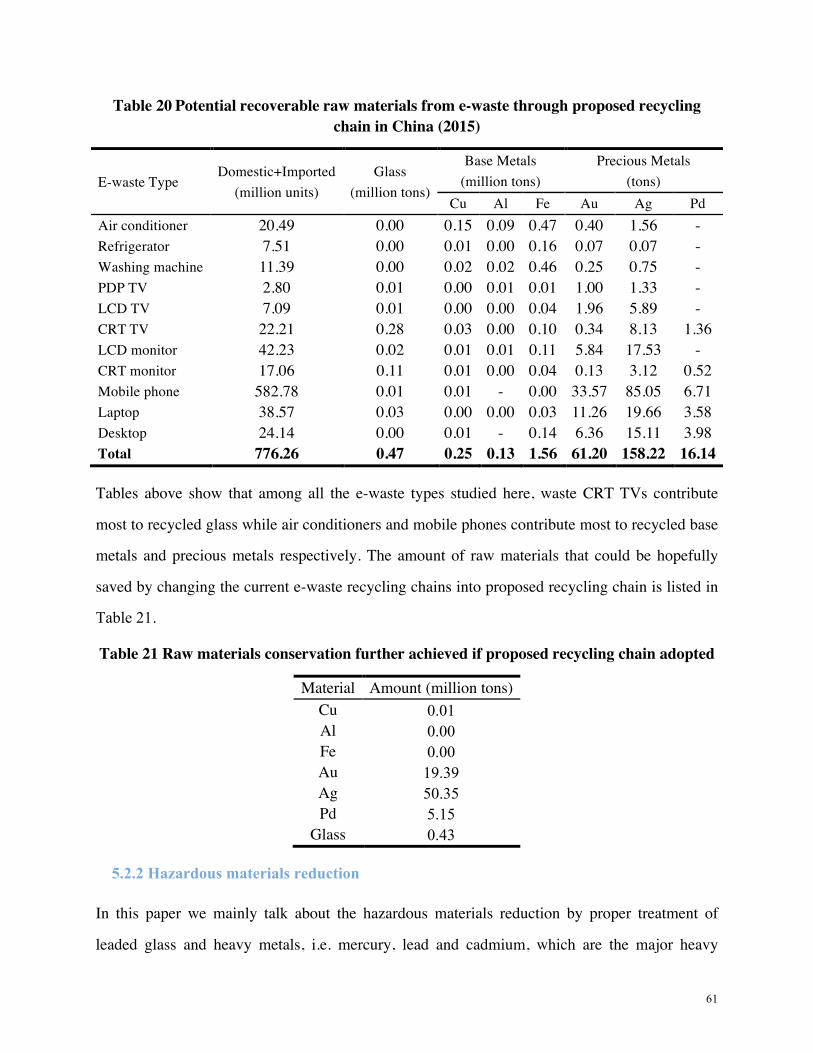
61
Table 20 Potential recoverable raw materials from e-waste through proposed recycling chain in China (2015)
E-waste Type Domestic+Imported
(million units) Glass
(million tons)
Base Metals (million tons)
Precious Metals (tons)
Cu Al Fe Au Ag Pd Air conditioner 20.49 0.00 0.15 0.09 0.47 0.40 1.56 - Refrigerator 7.51 0.00 0.01 0.00 0.16 0.07 0.07 - Washing machine 11.39 0.00 0.02 0.02 0.46 0.25 0.75 - PDP TV 2.80 0.01 0.00 0.01 0.01 1.00 1.33 - LCD TV 7.09 0.01 0.00 0.00 0.04 1.96 5.89 - CRT TV 22.21 0.28 0.03 0.00 0.10 0.34 8.13 1.36 LCD monitor 42.23 0.02 0.01 0.01 0.11 5.84 17.53 - CRT monitor 17.06 0.11 0.01 0.00 0.04 0.13 3.12 0.52 Mobile phone 582.78 0.01 0.01 - 0.00 33.57 85.05 6.71 Laptop 38.57 0.03 0.00 0.00 0.03 11.26 19.66 3.58 Desktop 24.14 0.00 0.01 - 0.14 6.36 15.11 3.98 Total 776.26 0.47 0.25 0.13 1.56 61.20 158.22 16.14
Tables above show that among all the e-waste types studied here, waste CRT TVs contribute
most to recycled glass while air conditioners and mobile phones contribute most to recycled base
metals and precious metals respectively. The amount of raw materials that could be hopefully
saved by changing the current e-waste recycling chains into proposed recycling chain is listed in
Table 21.
Table 21 Raw materials conservation further achieved if proposed recycling chain adopted
Material Amount (million tons) Cu 0.01 Al 0.00 Fe 0.00 Au 19.39 Ag 50.35 Pd 5.15
Glass 0.43
5.2.2 Hazardous materials reduction
In this paper we mainly talk about the hazardous materials reduction by proper treatment of
leaded glass and heavy metals, i.e. mercury, lead and cadmium, which are the major heavy
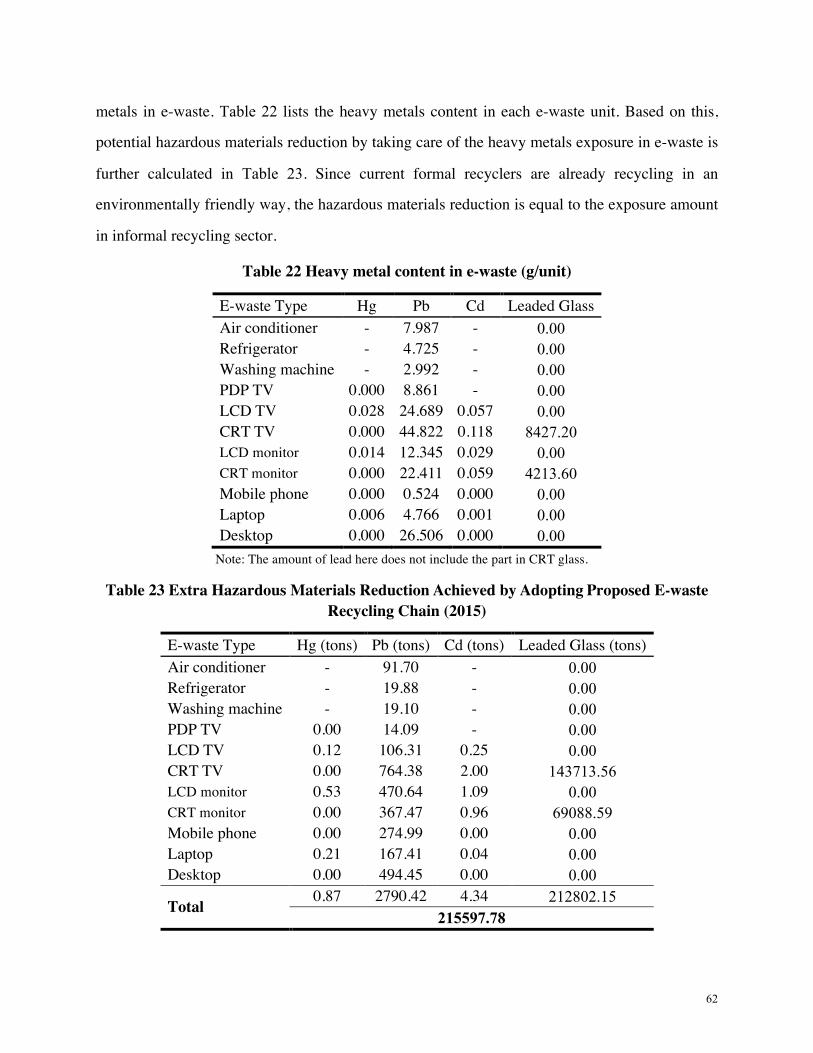
62
metals in e-waste. Table 22 lists the heavy metals content in each e-waste unit. Based on this,
potential hazardous materials reduction by taking care of the heavy metals exposure in e-waste is
further calculated in Table 23. Since current formal recyclers are already recycling in an
environmentally friendly way, the hazardous materials reduction is equal to the exposure amount
in informal recycling sector.
Table 22 Heavy metal content in e-waste (g/unit)
E-waste Type Hg Pb Cd Leaded Glass Air conditioner - 7.987 - 0.00 Refrigerator - 4.725 - 0.00 Washing machine - 2.992 - 0.00 PDP TV 0.000 8.861 - 0.00 LCD TV 0.028 24.689 0.057 0.00 CRT TV 0.000 44.822 0.118 8427.20 LCD monitor 0.014 12.345 0.029 0.00 CRT monitor 0.000 22.411 0.059 4213.60 Mobile phone 0.000 0.524 0.000 0.00 Laptop 0.006 4.766 0.001 0.00 Desktop 0.000 26.506 0.000 0.00
Note: The amount of lead here does not include the part in CRT glass.
Table 23 Extra Hazardous Materials Reduction Achieved by Adopting Proposed E-waste Recycling Chain (2015)
E-waste Type Hg (tons) Pb (tons) Cd (tons) Leaded Glass (tons) Air conditioner - 91.70 - 0.00 Refrigerator - 19.88 - 0.00 Washing machine - 19.10 - 0.00 PDP TV 0.00 14.09 - 0.00 LCD TV 0.12 106.31 0.25 0.00 CRT TV 0.00 764.38 2.00 143713.56 LCD monitor 0.53 470.64 1.09 0.00 CRT monitor 0.00 367.47 0.96 69088.59 Mobile phone 0.00 274.99 0.00 0.00 Laptop 0.21 167.41 0.04 0.00 Desktop 0.00 494.45 0.00 0.00
Total 0.87 2790.42 4.34 212802.15 215597.78

63
From Table 22, we are informed that lead is the most serious issue regarding heavy metals
pollution while leaded glass is the main contributor to e-waste pollution. As discussed before, all
the heavy metals content could be either recovered or properly disposed. And leaded glass can be
transferred into unleaded glass while the lead will also be recovered or safely treated. In either
case, it will not threat the environment and human health. The total amount of hazardous
materials exposure, which can be further avoided by changing to the proposed e-waste recycling
chain compared to current situation, is estimated to be 0.22 million tons.
5.2.3 Energy saving
During the manufacturing of electronic products, raw materials acquisition is one of the biggest
energy-consuming sectors. By recycling waste electronic products, the energy used for raw
materials production can be saved. However, the materials recycling process also takes energy,
especially for electronic products, which are usually manufactured complicatedly. As illustrated
in Figure 27, each kind of raw material should first be extracted from the ground and further
purified. Then it will be alloyed to have its own shape. Next, it will be mixed with other
components to form complete product. At the end of the product’s life, it will go together with
obsolete product and get mixed with other waste. To get recycled, it should be got out of the
waste stream and back to purified state again.
Figure 27 Life of raw material in electronic product

64
Therefore, the benefit here should be the energy consumption difference between raw material
recycling and production. It could be either positive or negative, depending on the actual
situation. Thermodynamics can be applied into calculating the minimum amount of work
required to separate a mixed waste and to restore the original value of the materials. Actually, the
minimum work of separation is negative the Gibbs Free Energy of mixing. In Figure 28, recycled
material values (Σmiki) and material mixing entropy (H) are represented for 20 products in the
U.S..
Figure 28 Single product recycled material values (Σmiki) and material mixing entropy (H) with recycling rates (indicated by the area of the circles) for 20 products in the U.S.75
We can see from the figure above, the recycling of computer, television and cell phone is
relatively hard compared with other waste products. This makes sense since all these kinds of
consumer electronics are usually compact and complicated, which makes them hard to be
recycled. The red line is called “apparent recycling boundary”. This line provides us with a

65
general idea about whether a certain product is worth recycling or not. For example, the products
above the line can usually be recycled in a profitable manner while those below the line require a
recycling fee to be profitable or simply are not recycled. Even though in this many electronic
products are still below the line, as we have scaled up the recycling process and improved the
recycling technology, the recycling boundary can hopefully be shifted down and to the right.
According to the database provided by EPA66 regarding electronics environmental benefits, the
energy needed for primary materials production and materials recovery per kilogram materials
are listed in the table below.
Table 24 Energy consumption intensity for materials’ primary production and recovery66
Materials Primary Production (MJ/kg) Recovery (MJ/kg)
Base Metals
Cu 32.19 0.01a
Al 139.58 6.13
Fe 79.97 5.82
Precious Metalsb
Au 214334 8509.03
Ag 1459 145.78
Pd 183737 4456.95
Glass Unleaded
7.4776 4.9276
Leaded 4.92/4.92+0.01c
Note: a. The energy consumption used for copper recovery looks quite small compared to primary production. Since copper is always recycled together with other precious metals, this energy is used by per kilogram metal recovered (efficiency rate is included). b. Precious metals should go through copper recovery stage first before getting recovered. Therefore, the recovery energy here is the sum of the energy consumption of copper recovery stage and downstream precious metals recovery stage. This can be deemed as a pre-processing stage of precious metals recovery (efficiency rate is included). c. Leaded glass can be reused to produce CRT or it can be smelted to get lead out to produce clean glass. The energy consumption in the cleaning stage is assumed to be the same as copper smelting. Also, efficiency rate has already been included.
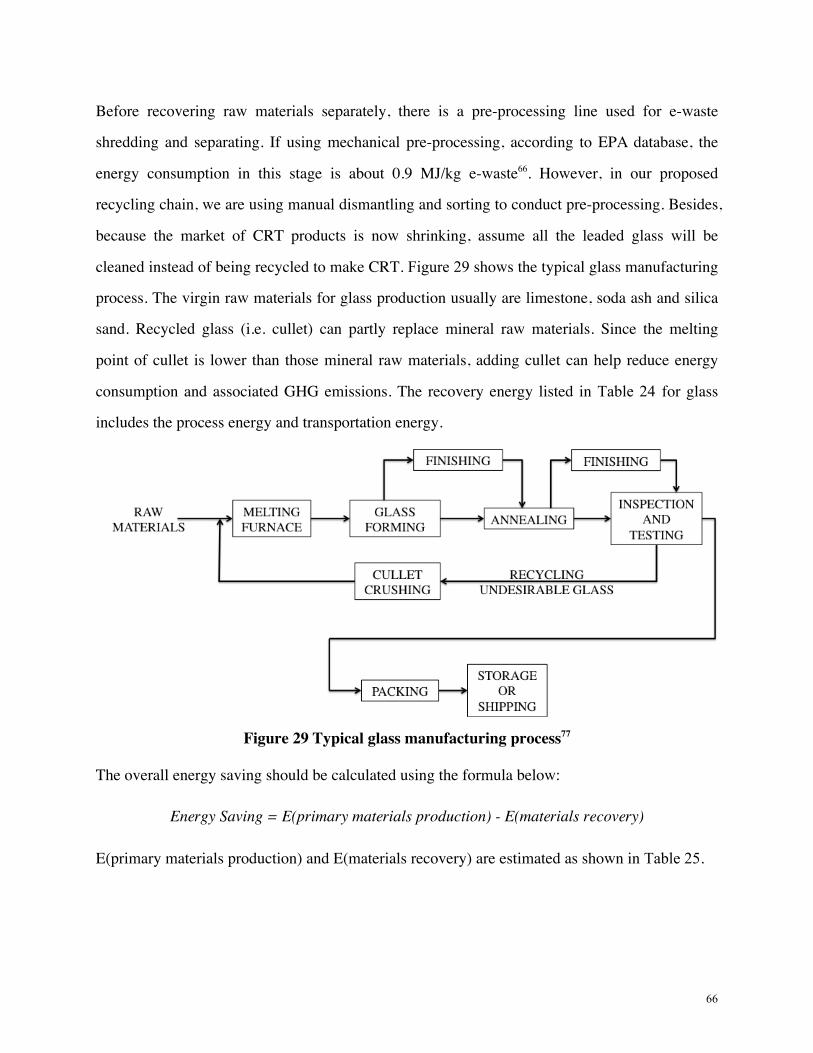
66
Before recovering raw materials separately, there is a pre-processing line used for e-waste
shredding and separating. If using mechanical pre-processing, according to EPA database, the
energy consumption in this stage is about 0.9 MJ/kg e-waste66. However, in our proposed
recycling chain, we are using manual dismantling and sorting to conduct pre-processing. Besides,
because the market of CRT products is now shrinking, assume all the leaded glass will be
cleaned instead of being recycled to make CRT. Figure 29 shows the typical glass manufacturing
process. The virgin raw materials for glass production usually are limestone, soda ash and silica
sand. Recycled glass (i.e. cullet) can partly replace mineral raw materials. Since the melting
point of cullet is lower than those mineral raw materials, adding cullet can help reduce energy
consumption and associated GHG emissions. The recovery energy listed in Table 24 for glass
includes the process energy and transportation energy.
Figure 29 Typical glass manufacturing process77
The overall energy saving should be calculated using the formula below:
Energy Saving = E(primary materials production) - E(materials recovery)
E(primary materials production) and E(materials recovery) are estimated as shown in Table 25.
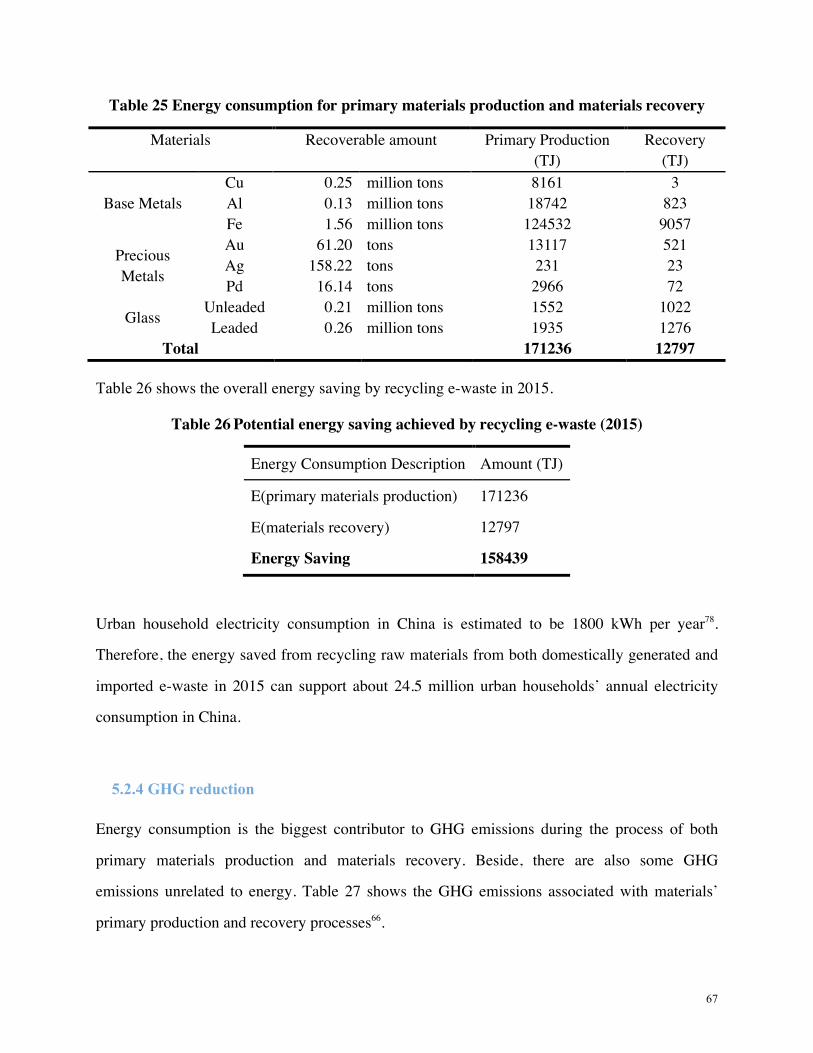
67
Table 25 Energy consumption for primary materials production and materials recovery
Materials Recoverable amount Primary Production (TJ)
Recovery (TJ)
Base Metals Cu 0.25 million tons 8161 3 Al 0.13 million tons 18742 823 Fe 1.56 million tons 124532 9057
Precious Metals
Au 61.20 tons 13117 521 Ag 158.22 tons 231 23 Pd 16.14 tons 2966 72
Glass Unleaded 0.21 million tons 1552 1022 Leaded 0.26 million tons 1935 1276
Total 171236 12797
Table 26 shows the overall energy saving by recycling e-waste in 2015.
Table 26 Potential energy saving achieved by recycling e-waste (2015)
Energy Consumption Description Amount (TJ)
E(primary materials production) 171236
E(materials recovery) 12797
Energy Saving 158439
Urban household electricity consumption in China is estimated to be 1800 kWh per year78.
Therefore, the energy saved from recycling raw materials from both domestically generated and
imported e-waste in 2015 can support about 24.5 million urban households’ annual electricity
consumption in China.
5.2.4 GHG reduction
Energy consumption is the biggest contributor to GHG emissions during the process of both
primary materials production and materials recovery. Beside, there are also some GHG
emissions unrelated to energy. Table 27 shows the GHG emissions associated with materials’
primary production and recovery processes66.

68
Table 27 GHG emissions intensity of materials’ primary production and recovery66
Materials Primary Production (kg CO2-e/kg) Recovery (kg CO2-e/kg)
Base Metals
Cu 1.71 0.88
Al 8.31 0.41
Fe 4.33 0.38
Precious Metals
Au 12621 8109
Ag 95 139
Pd 9297 4248
Glass Unleaded
0.6676 0.3176
Leaded 1.12
Similar to energy saving analysis part, the leaded glass here is assumed to be cleaned at the end
of its life and then put into glass smelter as cullet. The formula for GHG emission reduction can
be expressed as follow.
GHG emission reduction = GHG(primary materials production) - GHG(materials recovery)
GHG(primary materials production) and GHG(materials recovery) are estimated in Table 28 and
the overall emissions and ultimate reduction benefit are shown in Table 29.
Table 28 GHG Emissions from Primary Materials Production and Materials Recovery
Materials Recoverable amount Primary Production (million tons CO2-e)
Recovery (million tons CO2-e)
Base Metals
Cu 0.25 million tons 0.43 0.22 Al 0.14 million tons 1.19 0.06 Fe 1.57 million tons 6.78 0.60
Precious Metals
Au 61.20 tons 0.77 0.52 Ag 158.22 tons 0.02 0.02 Pd 16.14 tons 0.15 0.07
Glass Unleaded 0.21 million tons 0.14 0.06 Leaded 0.26 million tons 0.17 0.29
Total 9.65 1.85
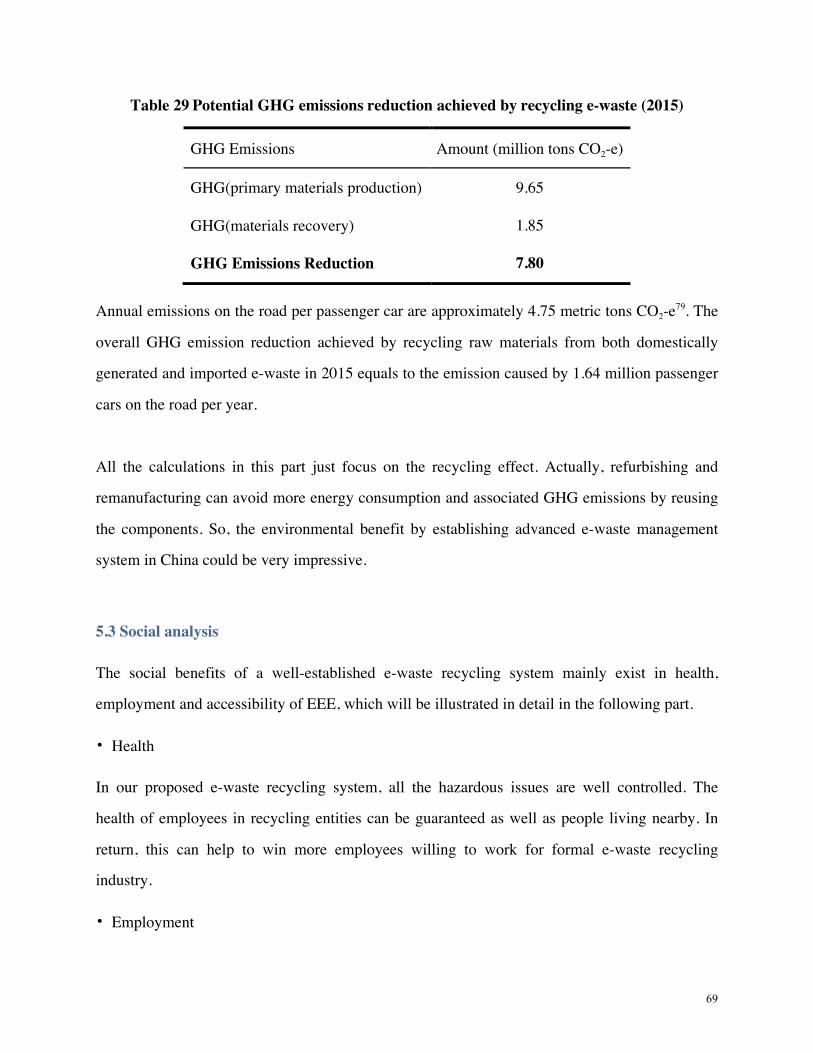
69
Table 29 Potential GHG emissions reduction achieved by recycling e-waste (2015)
GHG Emissions Amount (million tons CO2-e)
GHG(primary materials production) 9.65
GHG(materials recovery) 1.85
GHG Emissions Reduction 7.80
Annual emissions on the road per passenger car are approximately 4.75 metric tons CO2-e79. The
overall GHG emission reduction achieved by recycling raw materials from both domestically
generated and imported e-waste in 2015 equals to the emission caused by 1.64 million passenger
cars on the road per year.
All the calculations in this part just focus on the recycling effect. Actually, refurbishing and
remanufacturing can avoid more energy consumption and associated GHG emissions by reusing
the components. So, the environmental benefit by establishing advanced e-waste management
system in China could be very impressive.
5.3 Social analysis
The social benefits of a well-established e-waste recycling system mainly exist in health,
employment and accessibility of EEE, which will be illustrated in detail in the following part.
• Health
In our proposed e-waste recycling system, all the hazardous issues are well controlled. The
health of employees in recycling entities can be guaranteed as well as people living nearby. In
return, this can help to win more employees willing to work for formal e-waste recycling
industry.
• Employment

70
Even though the formalization of e-waste recycling industry could result in unemployment
because informal entities can hardly survive under the new system, proposed formal entities still
provide a lot of job opportunities to previous people working in informal chain especially in
pre-processing part. Also, as the refurbishing and remanufacturing industry develop in China,
they will provide even more openings for people all over the country.
• Accessibility of EEE
As discussed before, the energy consumption is much lower when using recycled materials
compared to primary materials. This is especially true when the products are refurbished or
remanufactured, which can save even more energy compared to recycling. Since energy
consumption is closely related to the price of products, the lower the energy consumption the
lower the price should be. The low price of those remanufactured products, whose quality could
be even higher than new products, can even drive the prices of new products down. In this way,
more people in less developed areas can afford to buy EEE.

71
6 Conclusions In 2012, the amount of e-waste generated in the U.S. was about 9.4 million tons, while that of
China 7.3 million tons, just next to the U.S.6. The global e-waste generation amount in the same
year was estimated to be 49 million tons6. The e-waste recycling rate in the U.S. is usually higher
than other countries. However, even in the U.S. the recycling rate is less than 30%80.
In addition to huge domestic generation of e-waste (7.3 million tons), China also needs to take
care of about 2.6 million tons of imported e-waste from developed countries42. In total, China is
now taking care of about 20% of electronic waste generated globally. This is a difficult issue for
a large and rapidly developing country technically, economically and socially. The crux of the
problem is the existence of the informal recycling chain (treating 38% of e-waste stream in
China), which has an effective collection system and also receives illegally imported e-waste but
uses processing methods that cause significant pollution and affect both public heath and the
environment. Instead of banning informal recycling entities, China should find a way to integrate
informal recyclers into its formal recycling chain.
Developed countries, like the E.U. and the U.S. set good examples for China. In the U.S., even
though there is a lack of recovery technologies, such as the integrated smelting technology
existing in Canada and Sweden, the overall e-waste recycling system is relatively developed.
There are various recycling programs operating within various states, which provide recycling
facilities with a steady flow of e-waste. The technologies are advanced in recycling facilities and
the treatment process is streamlined. Manufacturers, retailers or even consumers are regulated to
be responsible for the e-waste recycling. Waste is changed to a valuable resource in such an
environmentally friendly system.
The national condition in China is different from the U.S.. China should adapt the valuable
72
experience from the U.S. but not just copy it. China should keep its effective and harmless
informal collection and divert the collected e-waste to formal recycling entities. Formal entities
could hire current informal recyclers to conduct manual dismantling instead of the inefficient
mechanical processing used in developed countries, because as of now the labor cost in China is
still very low. As to end-processing, China should upgrade their recycling facilities. Before
solving the technology issue, China could build relationships with the countries that have
state-of-the-art treatment facilities and send pre-processed e-waste scraps overseas to get
materials recovered. Annually, about 75 million tons of raw materials could be conserved and
0.22 million tons of hazardous materials could be avoided by adopting the proposed recycling
chain. Not just the recycling industry, but also refurbishing and remanufacturing industries
should be developed to further maximize the benefits of e-waste recycling.
The development of all the industries related to e-waste recycling mainly relies on the investment
and regulations from the Chinese government right now. Besides, Chinese government should
improve existing regulations to avoid loopholes allowing e-waste import and at the same time
strengthen the inspection to enforce the implementation. Therefore, Chinese government should
be the biggest participant in this reform regarding e-waste recycling.
73
REFERENCES 1 European Parliament and Council of the European Union. (4 Jul 2012) Directive 2012/19/EU.
http://eur-lex.europa.eu/legal-content/EN/TXT/?uri=CELEX:32012L0019 (1 Oct 2014). 2 Liu, Xianbing, Masaru Tanaka, and Yasuhiro Matsui. "Electrical and electronic waste
management in China: progress and the barriers to overcome." Waste Management & Research
24.1 (2006): 92-101. (1 Oct 2014).
3 Wang, F. (1 Apr 2013). E-Waste Practices in China.
http://www.resource-recycling.com/ESC2013/Wang.pdf (17 Oct 2014).
4 Lewis, B. (15 Dec 2013). World's E-Waste to Grow 33% by 2017, Says Global Report.
http://www.livescience.com/41967-world-e-waste-to-grow-33-percent-2017.html (17 Oct 2014).
5 US EPA publication. “Municipal Solid Waste Generation, Recycling, and Disposal in the
United States Tables and Figures for 2012”. (Feb 2014).
http://www.epa.gov/epawaste/nonhaz/municipal/pubs/2012_msw_dat_tbls.pdf (1 Oct 2014).
6 StEP Initiative - Solving The E-Waste Problem. (2014). Step-initiative.org.
http://www.step-initiative.org/index.php/overview-world.html (1 Oct 2014).
7 Oguchi, Masahiro, et al. "A preliminary categorization of end-of-life electrical and electronic
equipment as secondary metal resources." Waste management 31.9 (2011): 2150-2160. (1 Oct
2014).
8 Jiang, Ping, et al. "Improving the end-of-Life for electronic materials via sustainable recycling
methods." Procedia Environmental Sciences 16 (2012): 485-490. (12 Oct 2014).
9 Namias, Jennifer. The Future of Electronic Waste Recycling in the United States: Obstacles
and Domestic Solutions. Diss. Columbia University, 2013. (12 Oct 2014).
10 Wath, Sushant B., P. S. Dutt, and Tapan Chakrabarti. "E-waste scenario in India, its
management and implications." Environmental monitoring and assessment 172.1-4 (2011):
249-262. (12 Oct 2014).
11 Deloitte Touche Tohmatsu Limited (DTTL) Global Manufacturing Industry group analysis.
World Steel Association. “Energy: Fact sheet”. October 2008. (12 Oct 2014).
12 Cui, Jirang, and Lifeng Zhang. "Metallurgical recovery of metals from electronic waste: A

74
review." Journal of hazardous materials 158.2 (2008): 228-256. (12 Nov 2014).
13 King, Matthew J., Kathryn C. Sole, and William GI Davenport. Extractive metallurgy of
copper. Elsevier, 2011. (12 Nov 2014).
14 Rainforest Relief. (2006). Aluminum.
http://www.rainforestrelief.org/What_to_Avoid_and_Alternatives/Aluminum.html (22 Oct
2014).
15 James Edward Hoffmann. (2013). Silver processing.
http://www.britannica.com/EBchecked/topic/544891/silver-processing#toc81549 (22 Oct 2014).
16 Wikimedia Foundation. (2014). Gold. http://en.wikipedia.org/wiki/Gold (23 Oct 2014).
17 Christian. (7 Sep 2007). Metals recovery from e-scrap in a global environment: technical
capabilities, challenges and experience gained.
http://archive.basel.int/industry/sideevent030907/umicore.pdf (17 Oct 2014).
18 Resource Conservation and Recovery Act, P.L. 94-580, 90 Stat. 2795, 42 USC. § 6901 et
seq., October 21, 1976. RCRA Full text. (12 Nov 2014).
19 Electronics TakeBack Coalition. State legislation.
http://www.electronicstakeback.com/promote-good-laws/state-legislation/ (29 Oct 2014).
20 Thomas Lindhqvist. (April 1992). Towards an [EPR]- analysis of experiences and proposals.
(29 Oct 2014).
21 State of Utah. (2011). Disposal of electronic waste.
http://le.utah.gov/~2011/bills/sbillenr/sb0184.pdf (29 Oct 2014).
22 Consumer Electronics Association. (2014). Consumer electronics association 2013
sustainability report.
http://content.ce.org/2013_CEA_SR_Packet1.0/www/lifeCycle_eCycling.html (20 Oct 2014).
23 US EPA. (2009). Sustainable materials management: The road ahead.
http://www.epa.gov/smm/pdf/vision2.pdf (19 Oct 2014).
24 Responsible Recycling (" R2") Practices for Use in Accredited Certification Programs for
Electronics Recyclers. US Environmental Protection Agency, 2008. (12 Nov 2014).
25 Cindy Miller. (16 Dec 2012). What is the value of R2/RIOS certification?
http://blog.lifespantechnology.com/it-asset-disposition-blog/bid/257162/What-is-the-value-of-R2
-RIOS-certification-and-why-both (19 Oct 2014).

75
26 Pamela J. Gordon, et al. Comparisons of e-Stewards and R2: Insights on business and
environmental benefits.
http://www.techforecasters.com/whitepapers/wp_comparisons_of_e-stewards_and_R2.pdf (19
Oct 2014).
27 Sims Recycling Solutions. Animation: WEEE recycling process [video].
http://www.simsrecycling.com/Newsroom/Animations/WEEE-Recycling-Process (30 Oct 2014).
28 Reuter, M. A., et al. "Metal Recycling: Opportunities, Limits, Infrastructure, a Report of the
Working Group on Global Metals Flows to the International Resource Panel." International
Resources Panel: Paris, France (2013). (30 Oct 2014).
29 Sims Recycling Solutions. Animation: CRT recycling process [video].
http://www.simsrecycling.com/Newsroom/Animations/CRT-Recycling-Process (30 Oct 2014).
30 Florida Department of Environmental Protection. (2014). Cathode Ray Tube (CRT) glass – a
recycling challenge. http://www.dep.state.fl.us/waste/categories/electronics/pages/lead.htm (30
Oct 2014).
31 Electronic Recyclers International, Inc.. (2014). Television recycling.
http://electronicrecyclers.com/sustainability/products-we-recycle/televisions.aspx (1 Nov 2014).
32 Johnston, Michael Laird, and Neil Peters-Michaud2 Jonathan J. Wilker. "Tracking Separated
Plastic Components from E-scrap." (2008). (30 Oct 2014).
33 Claudine Jaboro. (28 Aug 2014). Recycling Plastic Using Fluorescence Gets Green Light.
https://www.polymersolutions.com/blog/recycling-plastic-using-fluorescence-gets-green-light (1
Nov 2014).
34 Pascal Krummenacher and Franklyn Zhu. (5 Aug 2012). Golden E-Waste: a commodity
more valuable than gold (ore).
https://openideo.com/challenge/e-waste/concepting/golden-e-waste-a-commodity-more-valuable
-than-gold-ore (1 Nov 2014).
35 Koyama, Kazuya, Mikiya Tanaka, and Jae-chun Lee. "Copper leaching behavior from waste
printed circuit board in ammoniacal alkaline solution." Materials transactions 47.7 (2006): 1788.
(30 Oct 2014).
36 Wang, Lawrence K., Yung-Tse Hung, and Nazih K. Shammas, eds. Handbook of advanced
industrial and hazardous wastes treatment. CRC Press, 2010. (30 Oct 2014).
76
37 Wang, Feng, J. Huisman, C. Meskers, M. Schluep, A. Stevels, C. Hageluken (Wang et al).
“The Best-of-2 Worlds philosophy: Developing local dismantling and global infrastructure
network for sustainable e-waste treatment in emerging economies.” Waste Management 32
(2012) 2134-2146. Elsevier. Web. 4 February 2013. (30 Oct 2014).
38 颜丹. (13 Jan 2014). 中国为何会成为世界电⼦子垃圾的堆积场. http://www.epochtimes.com/gb/14/1/13/n4057640.htm (1 Nov 2014).
39 Zerowaste Europe. (2011). The need for Zero Electric and Electronic Waste in Europe.
http://www.zerowasteeurope.eu/2011/02/the-need-for-zero-electric-and-electronic-waste-in-euro
pe/ (1 Nov 2014).
40 1800 Ewaste. (2011). Exporting Electronic Waste – The question is.... to where?
http://www.ewaste.com.au/exporting-electronic-waste-where/ (1 Nov 2014).
41 Ivan Watson, et al. (30 May 2013). China: The electronic wastebasket of the world.
http://www.cnn.com/2013/05/30/world/asia/china-electronic-waste-e-waste/ (2 Nov 2014).
42 Zoeteman BCJ, Krikke HR, Venselaar J. Handling WEEE waste flows: on the effectiveness
of producer responsibility in a globalizing world. Int J Adv Manuf Technol
2010;47:415–36. (2 Nov 2014).
43 中华⼈人民共和国国务院. (25 Feb 2009). 废弃电器电⼦子产品回收处理管理条例. http://www.gov.cn/zwgk/2009-03/04/content_1250419.htm (2 Nov 2014).
44 Han, X. and Y. Ma. General Administration of Customs: E-waste imported into China
through smuggling (海关总署:电⼦子垃圾通过⾛走私或夹带进⼊入中国). 2006. Dongfang Daily.
Available from: http://www.ce.cn/cysc/zgjd/kx/200612/25/t20061225_9869057.shtml. (2 Nov
2014).
45 Chiho Tiande, Interview with Chiho-Tiande metal group on the import of e-waste in China
(conducted by UNU), 2009, Chiho-Tiande metal group (CT): Taizhou, China. (2 Nov 2014).
46 Yoshida, A., China: the World’s Largest Recyclable Waste Importer, in International Trade
of Recyclable Resources in Asia 2005, IDE-JETRO (Institute of Developing Economies Japan
External Trade Organization): Chiba Japan. (2 Nov 2014).
47 Hong Kong Environmental Protection Department, Advice on Import and Export of Used
Electrical and Electronic Equipment Having Hazardous Components or Constituents

77
(Fourth edition). 2012. (2 Nov 2014).
48 Shinkuma, T. and H. Nguyen Thi Minh, The flow of e-waste material in the Asian region and
a reconsideration of international trade policies on e-waste. Environmental Impact Assessment Review, 2009. 29(1): p. 25-31. (10 Nov 2014).
49 Jie Yang and Jinhui Li. (Sep 2014). Study on e-waste generation and flow in China.
http://www.google.com/url?sa=t&rct=j&q=&esrc=s&source=web&cd=1&ved=0CCAQFjAA&u
rl=http%3A%2F%2Fwww.itu.int%2Fen%2FITU-T%2FWorkshops-and-Seminars%2Fgsw%2F2
01406%2FDocuments%2FPresentations%2FForum-on-Ewaste-23-09-2014%2FPres01-JieYang-
E-Waste-GSW2014-Session1v2.ppt&ei=2VtNVIL2I-znsAT2jIG4DQ&usg=AFQjCNEQMbdJA
kX41zFpaHWLcvMRYYftMA&sig2=wgWYpO51WiBpdLc-M15Slw&bvm=bv.77880786,d.c
Wc (30 Oct 2014).
50 Wang, Feng. "E-waste in China: A country report." (2013). (2 Sep 2014).
51 Duan, H. and M. Eugster, Employment analysis of WEEE recycling and disposal in China,
2007, Internal working paper of EMPA: St. Gallen, Switzerland. (2 Sep 2014).
52 Yu, J., et al., Managing e-waste in China: Policies, pilot projects and alternative approaches.
Resources, Conservation and Recycling, 2010. 54(11): p. 991-999. (6 Sep 2014).
53 Geering, A. C. Modelling of existing e-waste collection systems in China, a case study based
on household surveys in the Taizhou prefecture. Diss. Master Thesis. Swiss Federal Institute of
Technology (ETH)/Swiss Federal Laboratories for Materials Testing and Research (Empa),
Zurich/St. Gallen Switzerland, 2007. (12 Sep 2014).
54 Tian, H., White paper on current situation and trend of WEEE recycling in China 2013
(中国废弃电器电⼦子产品回收处理及综合利⽤用⾏行业现状与展望⾏行业研究⽩白⽪皮书 2013). (22
Sep 2014).
55 Tan, Quanyin, et al. "Status of End‐of‐life Electronic Product Remanufacturing in China."
Journal of Industrial Ecology (2014). (2 Nov 2014).
56 经济参考报. (23 Jul 2014). 中国⻩黄⾦金产量 1/20 源⾃自电⼦子垃圾,影响国际⾦金价.
http://finance.qq.com/a/20140723/004613.htm (2 Nov 2014).
57 环卫科技⺴⽹网. (21 Apr 2014). 电⼦子废弃物回收利⽤用的物理分选技术.
http://www.chinabaike.com/t/31251/2014/0421/2107591.html (2 Nov 2014).

78
58 Robert T. Lund. (17 Aug 2012). The database of remanufacturers.
http://www.bu.edu/reman/The%20Remanufacturing%20Database.pdf (15 Nov 2014).
59 周明⽂文. 我国废杂铜⼯工业的现状与发展趋势[J]. 有⾊色冶⾦金设计与研究, 2010, 31(006):
29-32. (15 Nov 2014).
60 Outotec. (Oct 2011). Secondary copper processing – a more sustainable solution.
http://www.google.com/url?sa=t&rct=j&q=&esrc=s&source=web&cd=1&ved=0CCAQFjAA&u
rl=http%3A%2F%2Fwww.outotec.com%2FImageVaultFiles%2Fid_567%2Fd_1%2Fcf_2%2F2
011_Issue29_SecondaryCopperProcessing.PDF&ei=hkdzVI2BA_SMsQTzv4DICQ&usg=AFQj
CNFcZWN3sI5QFw_gzJBKz7kz9w4E_g&bvm=bv.80185997,d.cWc (15 Nov 2014). 61 Nulife Glass Processing Ltd.. The Cathode Ray Tube Challenge: New Uses for Recycled
Glass.
https://www.ce.org/CorporateSite/media/Government-Media/Green/proposed-a-solution.pdf (15
Nov 2014).
62 Baike.com. 绿篱⾏行动. http://www.baike.com/wiki/绿篱行动&prd=tupianckxx (15 Nov
2014).
63 国际商报. (7 Feb 2014). 全国海关绿篱⾏行动成效显著.
http://www.shangbao.net.cn/epaper/gjsb/253391.html (20 Nov 2014).
64 Kojima, Michikazu, Aya Yoshida, and So Sasaki. "Difficulties in applying extended
producer responsibility policies in developing countries: case studies in e-waste recycling in
China and Thailand." Journal of Material Cycles and Waste Management 11.3 (2009): 263-269.
(15 Nov 2014).
65 Study on E-waste Generation and Flow in China, Basel Convention Regional Centre for Asia
and the Pacific, 4th ITU Green Standards Week in Beijing, Sep 2014. (15 Nov 2014).
66 EPA. (25 Jul 2012). Electronics Environmental Benefits Calculator [spreadsheet]. FEC
Publications and Resources. http://www2.epa.gov/fec/publications-and-resources#calculator (20
Jun 2014).
67 Duan, Huabo, et al. "Quantitative Characterization of Domestic and Transboundary Flows of
Used Electronics." Analysis of Generation, Collection, and Export in the United States. Available

79
online at http://www. stepinitiative. org/tl_files/step/_documents/MITNCER% 20US% 20Used%
20Electronics% 20Flows% 20Report (2013). (15 Nov 2014).
68 Statista. (2014). Global TV shipments in 2012, by technology.
http://www.statista.com/statistics/260316/global-tv-shipments-by-technology/ (20 Nov 2014).
69 EPA WARM, 2012. Recycling document, Exhibit 1, column (d), aluminum cans used as
proxy. (15 Nov 2014).
70 EPA WARM, 2012. Recycling document, Exhibit 1, column (d), copper wire used as proxy.
(15 Nov 2014).
71 EPA WARM, 2012. Recycling document, Exhibit 1, column (d), steel cans used as proxy.
(15 Nov 2014).
72 Khaliq, Abdul, et al. "Metal Extraction Processes for Electronic Waste and Existing
Industrial Routes: A Review and Australian Perspective." Resources3.1 (2014): 152-179. (15
Nov 2014).
73 Peeters, Jef R., et al. "End-of-Life Treatment Strategies for Flat Screen Televisions: A Case
Study." Sustainable Manufacturing. Springer Berlin Heidelberg, 2012. 103-108. (20 Nov 2014).
74 Ultromex. (2013). Flat screen display recycling.
http://www.ultromex.com/our-technologies/flat-screen-display-recycling.html (25 Nov 2014).
75 Dahmus, Jeffrey B., and Timothy G. Gutowski. "What gets recycled: An information theory
based model for product recycling." Env. Sci.& Tehcn. 41.21 (2007): 7543-7550. (15 Nov 2014).
76 EPA WARM, 2012. Glass. http://epa.gov/epawaste/conserve/tools/warm/pdfs/Glass.pdf (25
Nov 2014).
77 Energy research Centre of the Netherlands. (2011). Increased glass recycling.
http://www.climatetechwiki.org/technology/glass (25 Nov 2014).
78 He, Xiaoping, and David Reiner. "Electricity Demand and Basic Needs: Empirical Evidence
from China’s Households." (20 Nov 2014).
79 EPA Greenhouse Gas Equivalencies Calculator
(http://www.epa.gov/cleanenergy/energy-resources/refs.html). (15 Sep 2014). *80 Electronics TakeBack Coalition. (25 Jun 2014). Facts and figures on e-waste and recycling.
www.electronicstakeback.com/wp-content/uploads/Facts_and_Figures_on_EWaste_and_Recycli
ng.pdf (30 Nov 2014).
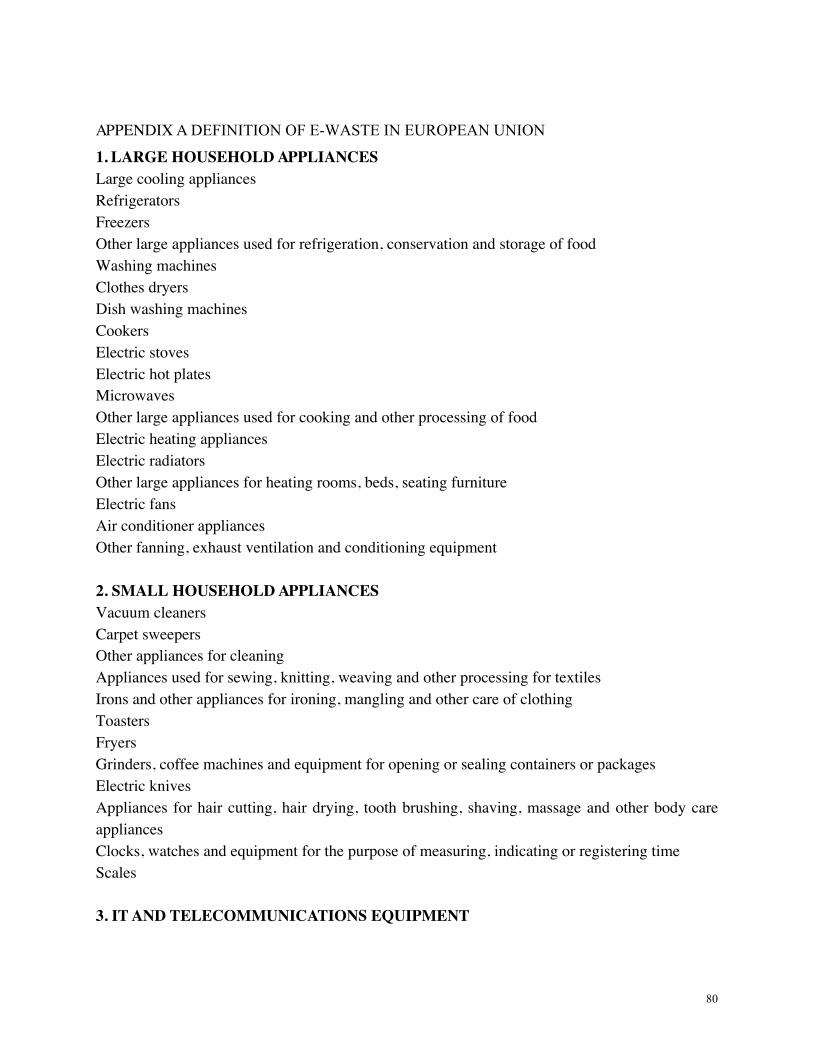
80
APPENDIX A DEFINITION OF E-WASTE IN EUROPEAN UNION 1. LARGE HOUSEHOLD APPLIANCES Large cooling appliances Refrigerators Freezers Other large appliances used for refrigeration, conservation and storage of food Washing machines Clothes dryers Dish washing machines Cookers Electric stoves Electric hot plates Microwaves Other large appliances used for cooking and other processing of food Electric heating appliances Electric radiators Other large appliances for heating rooms, beds, seating furniture Electric fans Air conditioner appliances Other fanning, exhaust ventilation and conditioning equipment 2. SMALL HOUSEHOLD APPLIANCES Vacuum cleaners Carpet sweepers Other appliances for cleaning Appliances used for sewing, knitting, weaving and other processing for textiles Irons and other appliances for ironing, mangling and other care of clothing Toasters Fryers Grinders, coffee machines and equipment for opening or sealing containers or packages Electric knives Appliances for hair cutting, hair drying, tooth brushing, shaving, massage and other body care appliances Clocks, watches and equipment for the purpose of measuring, indicating or registering time Scales 3. IT AND TELECOMMUNICATIONS EQUIPMENT

81
Centralized data processing: Mainframes Minicomputers Printer units Personal computing: Personal computers (CPU, mouse, screen and keyboard included) Laptop computers (CPU, mouse, screen and keyboard included) Notebook computers Notepad computers Printers Copying equipment Electrical and electronic typewriters Pocket and desk calculators and other products and equipment for the collection, storage, processing, presentation or communication of information by electronic means User terminals and systems Facsimile machine (fax) Telex Telephones Pay telephones Cordless telephones Cellular telephones Answering systems and other products or equipment of transmitting sound, images or other information by telecommunications 4. CONSUMER EQUIPMENT AND PHOTOVOLTAIC PANELS Radio sets Television sets Video cameras Video recorders Hi-fi recorders Audio amplifiers Musical instruments and other products or equipment for the purpose of recording or reproducing sound or images, including signals or other technologies for the distribution of sound and image than by telecommunications Photovoltaic panels
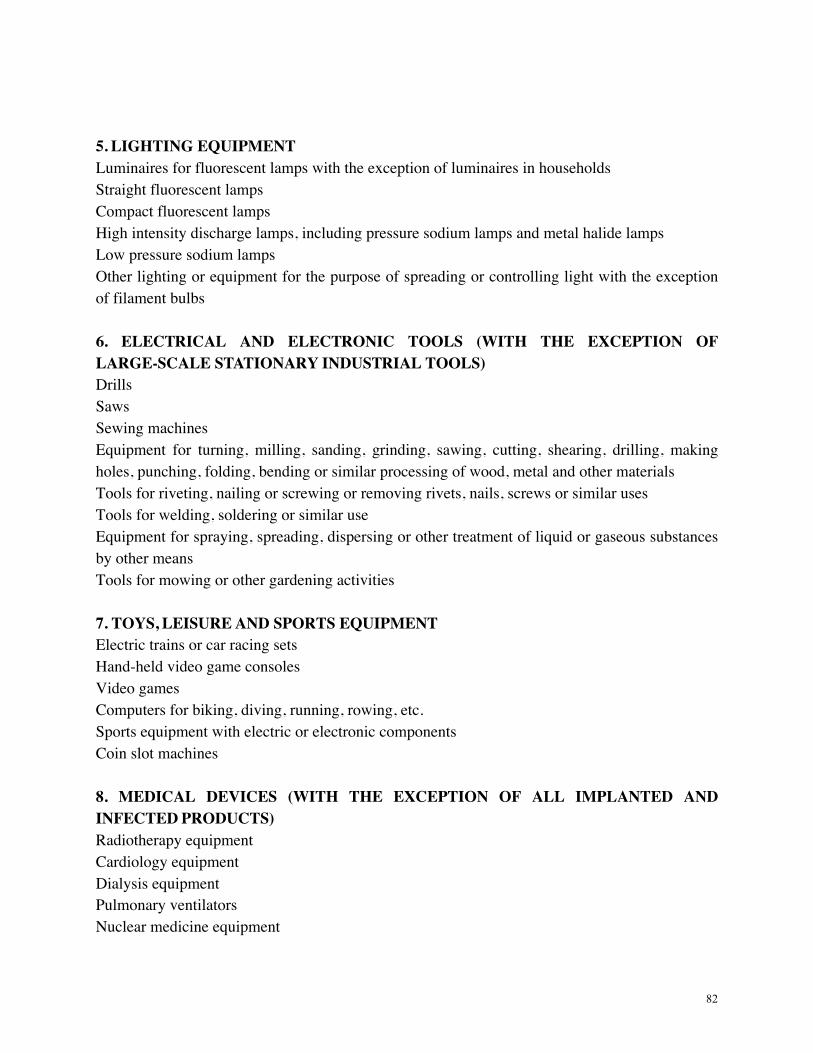
82
5. LIGHTING EQUIPMENT Luminaires for fluorescent lamps with the exception of luminaires in households Straight fluorescent lamps Compact fluorescent lamps High intensity discharge lamps, including pressure sodium lamps and metal halide lamps Low pressure sodium lamps Other lighting or equipment for the purpose of spreading or controlling light with the exception of filament bulbs 6. ELECTRICAL AND ELECTRONIC TOOLS (WITH THE EXCEPTION OF LARGE-SCALE STATIONARY INDUSTRIAL TOOLS) Drills Saws Sewing machines Equipment for turning, milling, sanding, grinding, sawing, cutting, shearing, drilling, making holes, punching, folding, bending or similar processing of wood, metal and other materials Tools for riveting, nailing or screwing or removing rivets, nails, screws or similar uses Tools for welding, soldering or similar use Equipment for spraying, spreading, dispersing or other treatment of liquid or gaseous substances by other means Tools for mowing or other gardening activities 7. TOYS, LEISURE AND SPORTS EQUIPMENT Electric trains or car racing sets Hand-held video game consoles Video games Computers for biking, diving, running, rowing, etc. Sports equipment with electric or electronic components Coin slot machines 8. MEDICAL DEVICES (WITH THE EXCEPTION OF ALL IMPLANTED AND INFECTED PRODUCTS) Radiotherapy equipment Cardiology equipment Dialysis equipment Pulmonary ventilators Nuclear medicine equipment

83
Laboratory equipment for in vitro diagnosis Analyzers Freezers Fertilization tests Other appliances for detecting, preventing, monitoring, treating, alleviating illness, injury or disability 9. MONITORING AND CONTROL INSTRUMENTS Smoke detector Heating regulators Thermostats Measuring, weighing or adjusting appliances for household or as laboratory equipment Other monitoring and control instruments used in industrial installations (e.g. in control panels) 10. AUTOMATIC DISPENSERS Automatic dispensers for hot drinks Automatic dispensers for hot or cold bottles or cans Automatic dispensers for solid products Automatic dispensers for money All appliances which deliver automatically all kinds of products
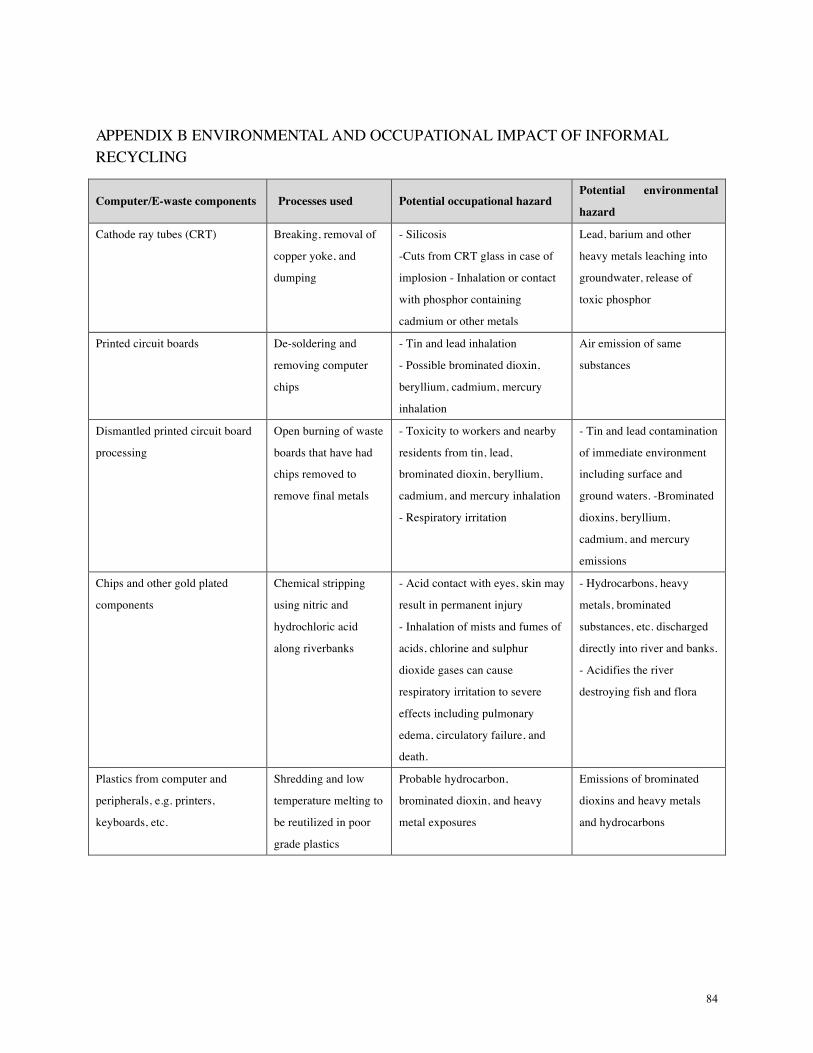
84
APPENDIX B ENVIRONMENTAL AND OCCUPATIONAL IMPACT OF INFORMAL RECYCLING
Computer/E-waste components Processes used Potential occupational hazard Potential environmental
hazard
Cathode ray tubes (CRT) Breaking, removal of
copper yoke, and
dumping
- Silicosis
-Cuts from CRT glass in case of
implosion - Inhalation or contact
with phosphor containing
cadmium or other metals
Lead, barium and other
heavy metals leaching into
groundwater, release of
toxic phosphor
Printed circuit boards De-soldering and
removing computer
chips
- Tin and lead inhalation
- Possible brominated dioxin,
beryllium, cadmium, mercury
inhalation
Air emission of same
substances
Dismantled printed circuit board
processing
Open burning of waste
boards that have had
chips removed to
remove final metals
- Toxicity to workers and nearby
residents from tin, lead,
brominated dioxin, beryllium,
cadmium, and mercury inhalation
- Respiratory irritation
- Tin and lead contamination
of immediate environment
including surface and
ground waters. -Brominated
dioxins, beryllium,
cadmium, and mercury
emissions
Chips and other gold plated
components
Chemical stripping
using nitric and
hydrochloric acid
along riverbanks
- Acid contact with eyes, skin may
result in permanent injury
- Inhalation of mists and fumes of
acids, chlorine and sulphur
dioxide gases can cause
respiratory irritation to severe
effects including pulmonary
edema, circulatory failure, and
death.
- Hydrocarbons, heavy
metals, brominated
substances, etc. discharged
directly into river and banks.
- Acidifies the river
destroying fish and flora
Plastics from computer and
peripherals, e.g. printers,
keyboards, etc.
Shredding and low
temperature melting to
be reutilized in poor
grade plastics
Probable hydrocarbon,
brominated dioxin, and heavy
metal exposures
Emissions of brominated
dioxins and heavy metals
and hydrocarbons

85
Computer wires Open burning to
recover copper
Brominated and chlorinated
dioxin, polycyclic aromatic
hydrocarbons (PAH)
(carcinogenic) exposure to
workers living in the burning
works area.
Hydrocarbon ashes
including PAH's discharged
to air, water, and soil
Miscellaneous computer parts
encased in rubber or plastic, e.g.
steel rollers
Open burning to
recover steel and other
metals
Hydrocarbon including PAHs and
potential dioxin exposure
Hydrocarbon ashes
including PAH's discharged
to air, water, and soil
Toner cartridges
Use of paintbrushes to
recover toner without
any protection
- Respiratory tract irritation
- Carbon black possible human
carcinogen
- Cyan, yellow, and magenta
toners unknown toxicity
Cyan, yellow, and magenta
toners unknown toxicity
Secondary steel or copper and
precious metal smelting
Furnace recovers steel
or copper from waste
including organics
Exposure to dioxins and heavy
metals
Emissions of dioxins and
heavy metals
Source: Wath, Sushant B., P. S. Dutt, and Tapan Chakrabarti. "E-waste scenario in India, its management and implications." Environmental monitoring and assessment 172.1-4 (2011): 249-262.
Related Documents


