Received February 18, 2020, accepted March 10, 2020, date of publication March 16, 2020, date of current version March 27, 2020. Digital Object Identifier 10.1109/ACCESS.2020.2980942 Analysis of Dimensionality Reduction Techniques on Big Data G. THIPPA REDDY 1 , M. PRAVEEN KUMAR REDDY 1 , KURUVA LAKSHMANNA 1 , RAJESH KALURI 1 , DHARMENDRA SINGH RAJPUT 1 , GAUTAM SRIVASTAVA 2,3 , (Senior Member, IEEE), AND THAR BAKER 4 1 School of Infromation Technology and Engineering, VIT, Vellore 632014, India 2 Department of Mathematics and Computer Science, Brandon University, Brandon, R7A 6A9, Canada 3 Research Center for Interneural Computing, China Medical University, Shenyang 10122, China 4 Department of Computer Science, Liverpool John Moores University, Liverpool L3 3AF, U.K. Corresponding authors: Gautam Srivastava ([email protected]) and Thar Baker ([email protected]) ABSTRACT Due to digitization, a huge volume of data is being generated across several sectors such as healthcare, production, sales, IoT devices, Web, organizations. Machine learning algorithms are used to uncover patterns among the attributes of this data. Hence, they can be used to make predictions that can be used by medical practitioners and people at managerial level to make executive decisions. Not all the attributes in the datasets generated are important for training the machine learning algorithms. Some attributes might be irrelevant and some might not affect the outcome of the prediction. Ignoring or removing these irrelevant or less important attributes reduces the burden on machine learning algorithms. In this work two of the prominent dimensionality reduction techniques, Linear Discriminant Analysis (LDA) and Principal Component Analysis (PCA) are investigated on four popular Machine Learning (ML) algorithms, Decision Tree Induction, Support Vector Machine (SVM), Naive Bayes Classifier and Random Forest Classifier using publicly available Cardiotocography (CTG) dataset from University of California and Irvine Machine Learning Repository. The experimentation results prove that PCA outperforms LDA in all the measures. Also, the performance of the classifiers, Decision Tree, Random Forest examined is not affected much by using PCA and LDA.To further analyze the performance of PCA and LDA the eperimentation is carried out on Diabetic Retinopathy (DR) and Intrusion Detection System (IDS) datasets. Experimentation results prove that ML algorithms with PCA produce better results when dimensionality of the datasets is high. When dimensionality of datasets is low it is observed that the ML algorithms without dimensionality reduction yields better results. INDEX TERMS Cardiotocography dataset, dimensionality reduction, feature engineering, linear discrimi- nant analysis, machine learning, principal component analysis. I. INTRODUCTION Machine Learning (ML) is one of the rapid growing tech- nologies in the past 15 years. It has numerous applicaions in various fields like computer vision, bioinformatics, business analytics, healthcare, banking sector, fraud detection, predic- tion of trends etc. ML allows a computer to learn from a huge data samples and predicts the patterns that exisit within the data [1]. Machine learning algorithms are used in the different research areas to predict and classify the test data to produce The associate editor coordinating the review of this manuscript and approving it for publication was Michael Lyu. the accurate results. There is a constant growth in the use of Machine Learning classifier models in medical field [2]. They have proved to be very helpful in diagnosis of various medical and clinical datasets [3]. During pregnancy periods, women are mostly affected with jaundice, high blood pressure and diabetes. These will affect growth of the baby in the womb. Cardiotocography (CTG) is used to diagnose the tests under the formation of fetal health and pregnancy periods [4]. CTG produces a recorded paper result of the mother uterine contractions signals and fetal heart rate [5]. CTG can also be used continuously if any irregularities occur during the fetal auscultation. This 54776 This work is licensed under a Creative Commons Attribution 4.0 License. For more information, see https://creativecommons.org/licenses/by/4.0/ VOLUME 8, 2020

Welcome message from author
This document is posted to help you gain knowledge. Please leave a comment to let me know what you think about it! Share it to your friends and learn new things together.
Transcript

Received February 18, 2020, accepted March 10, 2020, date of publication March 16, 2020, date of current version March 27, 2020.
Digital Object Identifier 10.1109/ACCESS.2020.2980942
Analysis of Dimensionality ReductionTechniques on Big Data
G. THIPPA REDDY 1, M. PRAVEEN KUMAR REDDY 1, KURUVA LAKSHMANNA1,RAJESH KALURI 1, DHARMENDRA SINGH RAJPUT1,GAUTAM SRIVASTAVA 2,3, (Senior Member, IEEE),
AND THAR BAKER 41School of Infromation Technology and Engineering, VIT, Vellore 632014, India2Department of Mathematics and Computer Science, Brandon University, Brandon, R7A 6A9, Canada3Research Center for Interneural Computing, China Medical University, Shenyang 10122, China4Department of Computer Science, Liverpool John Moores University, Liverpool L3 3AF, U.K.
Corresponding authors: Gautam Srivastava ([email protected]) and Thar Baker ([email protected])
ABSTRACT Due to digitization, a huge volume of data is being generated across several sectors suchas healthcare, production, sales, IoT devices, Web, organizations. Machine learning algorithms are usedto uncover patterns among the attributes of this data. Hence, they can be used to make predictions thatcan be used by medical practitioners and people at managerial level to make executive decisions. Not allthe attributes in the datasets generated are important for training the machine learning algorithms. Someattributes might be irrelevant and some might not affect the outcome of the prediction. Ignoring or removingthese irrelevant or less important attributes reduces the burden on machine learning algorithms. In thiswork two of the prominent dimensionality reduction techniques, Linear Discriminant Analysis (LDA) andPrincipal Component Analysis (PCA) are investigated on four popular Machine Learning (ML) algorithms,Decision Tree Induction, Support Vector Machine (SVM), Naive Bayes Classifier and Random ForestClassifier using publicly available Cardiotocography (CTG) dataset from University of California and IrvineMachine Learning Repository. The experimentation results prove that PCA outperforms LDA in all themeasures. Also, the performance of the classifiers, Decision Tree, Random Forest examined is not affectedmuch by using PCA and LDA.To further analyze the performance of PCA and LDA the eperimentation iscarried out on Diabetic Retinopathy (DR) and Intrusion Detection System (IDS) datasets. Experimentationresults prove that ML algorithms with PCA produce better results when dimensionality of the datasets ishigh. When dimensionality of datasets is low it is observed that the ML algorithms without dimensionalityreduction yields better results.
INDEX TERMS Cardiotocography dataset, dimensionality reduction, feature engineering, linear discrimi-nant analysis, machine learning, principal component analysis.
I. INTRODUCTION
Machine Learning (ML) is one of the rapid growing tech-nologies in the past 15 years. It has numerous applicaions invarious fields like computer vision, bioinformatics, businessanalytics, healthcare, banking sector, fraud detection, predic-tion of trends etc. ML allows a computer to learn from a hugedata samples and predicts the patterns that exisit within thedata [1].Machine learning algorithms are used in the differentresearch areas to predict and classify the test data to produce
The associate editor coordinating the review of this manuscript andapproving it for publication was Michael Lyu.
the accurate results. There is a constant growth in the use ofMachine Learning classifiermodels inmedical field [2]. Theyhave proved to be very helpful in diagnosis of variousmedicaland clinical datasets [3].
During pregnancy periods, women aremostly affectedwithjaundice, high blood pressure and diabetes. These will affectgrowth of the baby in the womb. Cardiotocography (CTG)is used to diagnose the tests under the formation of fetalhealth and pregnancy periods [4]. CTG produces a recordedpaper result of the mother uterine contractions signals andfetal heart rate [5]. CTG can also be used continuously ifany irregularities occur during the fetal auscultation. This
54776 This work is licensed under a Creative Commons Attribution 4.0 License. For more information, see https://creativecommons.org/licenses/by/4.0/VOLUME 8, 2020

G. Thippa Reddy et al.: Analysis of Dimensionality Reduction Techniques on Big Data
practice has also become a standard procedure in manynations [6].For any type of human disease prediction, datasets need to
be pre-processed. In this connection, dimensionality reduc-tion plays a vital role in reducing the high-dimensional datainto reduced dimensionality [7]. In the past few decades,numerous dimensionality reduction techniques have beenused for filtering the data samples of the considered dataset.Reduction of dimensionality requires mapping of inputswhich are of high-dimensionality to a lesser-dimensionalilityso that similar points in the input space are mapped to neigh-boring points on the manifold.Feature engineering is an important pre-processing step
that helps in extraction of transformed features from the rawdata that will simplify the ML model and also improvesthe quality of the results of a machine learning algorithm.Machine Learning practitioners spend majority of their timeon data cleaning and feature engineering [8]. Some of theexamples of feature engineering are given below
1) Decomposition of categorical attributes.2) Decomposition of Date-Time attribute into hour of the
day, part of the day, day of the week etc.3) Transforming attributes with numerical values to
reduce the complexity of the input data.
In the current digital world huge amount of data is gen-erated from almost all sectors. Machine learning algorithmsare being used to extract meaningful patterns from thisdata which will aid in making executive and business deci-sions. Dimensionality reduction techniques can tremendouslyreduce the time complexity of training phase of ML algo-rithms hence reducing the burden of the machine learningalgorithms. The main motivation behind this paper is to studythe impact of dimensionality reduction techniques on theperformance of the ML algorithms.In this paper, two of the popular dimensionality reduction
techniques namely Linear Discernment Analysis (LDA) andPrinciple Component Analysis (PCA) are investigated onwidely used ML algorithms namely Decision Tree, NavieBayes, Random Forest and Support Vector Machine usingpublicly available Cardiotocography (CTG) dataset fromUCImachine learning repository [9]. Then experimentation isrepeated on two other datasets namely, Diabetic Retinopa-thy Dataset from UCI machine learning repository [10]and Intrusion Detection Dataset from UCI machine learningrepository [11].The first step in the proposed work is to apply feature
engineering to improve the quality of CTG dataset. In the nextstep the dimensionality reduction techniques, PCA and LDAare applied individually on the CTG dataset that will extractmost important attributes. Next the extracted features are fedto train the aforementioned ML algorithms. In the next step,the performance of ML algorithms without application ofthe dimensionality reduction techniques is compared with theperformance of ML algorithms with application of LDA andPCA separately using several performance metrics. Then the
impact of feature engineering and dimensionality reductiontechniques on the performance of ML algorithms is analysedin detail. The same steps are appliedon DR and IDS datasets.
The main contributions of the paper are as follows:
• Presenting a thorough and systematic review of theliterature and background on dimensionality reductiontechniques.
• Investigate the performance of PCA and LDA on MLalgorithms against several metrics (Accuracy, F1-score,Precision, Recall, Sensitivity, Specificity).
• Prove that the dimesionality reduction techniques do notdegrade the performance of ML algorithms to a greatextent.
• Use feature engineering techniques (like transformation)during pre-processing phase which can reduce the bur-den on ML algorithms.
• Study the effect of dimensionality reduction on severaldatasets with varied dimensions.
The rest of the paper is organized as follows – Section IIreviews the literature. Dimensionality reduction techniquesused in this work and the methodology used in this work aredetailed in Section III. In Section IV, experimentation resultsare analyzed, followed by the conclusion and future work inSection V.
II. LITERATURE REVIEW
In this section, a survey on several articles on ML algorithmsand dimensionality reduction techniques are presented.
The authors in [12] embrace feature engineering principlesto improve the quality of machine learning model to acceler-ate the discovery of potentially interesting catalytic materials.
UCI laboratory data is used in [13] to identify pat-terns using Artificial Neural Networks (ANN), DecisionTrees (DT), SVM and Naive Bayes algorithms. The perfor-mance of these algorithms is compared with the proposedmethod in which an ANNwith 18 neurons in the hidden layeris used. The proposed method gave better results compared toother methods.
The authors in [14] use a Convolutional Neural Net-works (CNN) to predict heart disease based on ECG signals.This technique takes the heart cycles in the training phasewith different starting points from the Electrocardiogram(ECG) signals. CNN can generate features with differentpositions in testing phase.
A neural networks based classification system of FetalHeart Rate (FHR) signals to reduce the errors caused byhuman examination is presented by the authors in [15]. Thisalgorithm is trained on FHR data and diagnoses FHR datain real time. The authors have designed a recurrent neuralnetwork called ‘‘MKRNN’’ and a convolution neural net-work classification method called ‘‘MKNet’’. Analysis of theproposed method on different classification models for fetalheart rate monitoring proved that neural network is innovativeand feasible. Also MKNet is one of the best fetal cardiacmonitoring model for classification.
VOLUME 8, 2020 54777
G. Thippa Reddy et al.: Analysis of Dimensionality Reduction Techniques on Big Data
In [16], the authors propose a new method for selectinga subset of optimal functions to increase the accuracy usingpathological classification of the CTG. Feature selectionperformed with PCA as a pre-processing stage in machinetraining has proven to be very effective in improving compu-tational time and accuracy. This method helps medical staffto make medical decisions more efficiently and quickly byinterpreting CTG readings.In [17], the authors present a computer-aided diagnostic
support system that uses digital signal processing techniquesfor FTH automation, uterine tone signal detection and seg-mentation resulting in high sensitivity (SE) and positive pre-dictivity (PPV). In this work, the main aim of the authors isto improve diagnostic accuracy.An approach for digitalization of CTG signals using image
processing techniques is proposed in [18]. This approachcomprises four main phases: preprocessing, segmentation ofimages, signal removal and signal calibration. Limited adap-tive histogram equalization contrasts and median filtering areused during the pre-processing phase to reduce noise andcontrast enhancement. Otsu threshold algorithm is used topartition CTG images during image segmentation. The corre-lation coefficient is used to calculate whether original signalsandCTG signals are similar. The experimental analysis showsthat the digitization of the CTG signals is better.A new methodology (CWV-BANNSVM) for diagnosing
breast cancer (BC) is introduced by researchers in [19].Wisconsin Breast Cancer Dataset (WBCD) was analyzedusing Artificial Neural Networks and SVM. The proposedmethod integrated these two techniques. In the first techniqueSVM algorithm was applied to the BC dataset and the accu-racy was 99.71%. In the second technique, the authors usedthe boosting ensemble technique and confidence-weightedvoting method for BC detection. To evaluate the performanceof the proposed method, a number of metrics such as Speci-ficity, AUC, Gini, FPR, Tolerance, Precision, FNR, F1-score,and Accuracy were used. Accuracy of the proposed approachwas 100%.Integrated SVM and simulated annealing algorithm is
introduced in [20] to diagnose hepatitis disease. The authorsreviewed the test analysis using the real-time UCI dataset.The proposed hybrid model achieves a 97% accuracy rate.In this approach genetic algorithm and SVMare hybridized tooptimize the parameters for dimensionality reduction. Exper-imental results indicate that the new algorithm significantlyimproves the accuracy.In [21], the authors investigate the Naive Bayes classifica-
tion for the diagnosis of coronary heart disease. The authorsperformed a test analysis using a longitudinal dataset inreal time. The authors compared two methods for describingthe characteristics of a single patient using horizontal aidand average temporal association rules period. The resultsobtained show that the proposed classifier performed betterwhen compared to baseline classifiers.The authors in [22] propose a private-key, fully homomor-
phic encryption algorithm to ensure the confidentiality of
medical data for the private Naive Bayes classification. Thisapproach allows data owner to classify information privatelywithout accessing the trained model. The authors tested thisalgorithm for breast cancer data and achieved fast, accurateresults.
A system for retrieving medical data is proposed bythe researchers in [23],. This work tried to recover miss-ing medical images with several images with linguisticinformation. Decision support tools and Decision Trees areused to collect information. Experimental results indicatethat most recovered medical cases belong to the correctclass.
In [24], the authors propose a Decision Tree based datamining technique to determine risk factors for CHD. Theanalysis was performed using the C4.5 Decision Tree algo-rithm, with different separation parameters based on riskfactors. Experimental results show that CHD diagnosis canbe reduced by this approach.
In [25], the authors integrate PCA and K-means algorithmto predict diabetes. In this work, the authors first appliedPCA for dimensional reduction and then applied K-means tocluster the data. The hybridization of these two techniquesprovides a higher accuracy rate.
The authors in [26] investigated the performance of PCAclustering based on brain tumour images. In this model,the PCA method is first applied to MRI images of differentsizes and applied clustering using K-means and FCM. Theintegration of PCA and K-means leads to a higher perfor-mance rate.
An integrated PCA-SVM algorithms is used in [27] toenhance digital image recognition. Experimental results showthat hybridizing these two strategies provides better accuracyand recognition speed.
Several models are proposed to use meta heuristic algo-rithms such as firefly, BAT, cuckoo search along with popu-lar classifiers like fuzzy rule based classifiers, ANN etc. toclassify diabetic and heart disease datasets. Popular dimen-sionality reduction techniques like Locality Preserving Pro-jections, rough sets etc. are used in these works for featureselection [28]–[32].
Sweta Bhattacharya et al. [33] present a PCA-Firefly algo-rithm to classify intrusion detection dataset. In this work,the transformation is performed by one-hot encoding, dimen-sionality reduction is performed by PCA-Firefly algorithm.The dimensionally reduced dataset is then classified byXGBoost classifier. The superiority of the proposed model isestablished by experimental results.Several researchers pro-posed machine learning models for effective classification ofintrusion detection datasets [34]–[36].
The authors in [37] present a PCA-Firefly based DeepLearning Model for early detection of diabetic retinopathy.Optimal features are selected by PCA-Firefly algorithm andthe Deep Neural Networks classify the diabetes retinopathydataset. The proposed approach yielded good classificationresults when compared to other machine learning approachesconsidered.
54778 VOLUME 8, 2020
G. Thippa Reddy et al.: Analysis of Dimensionality Reduction Techniques on Big Data
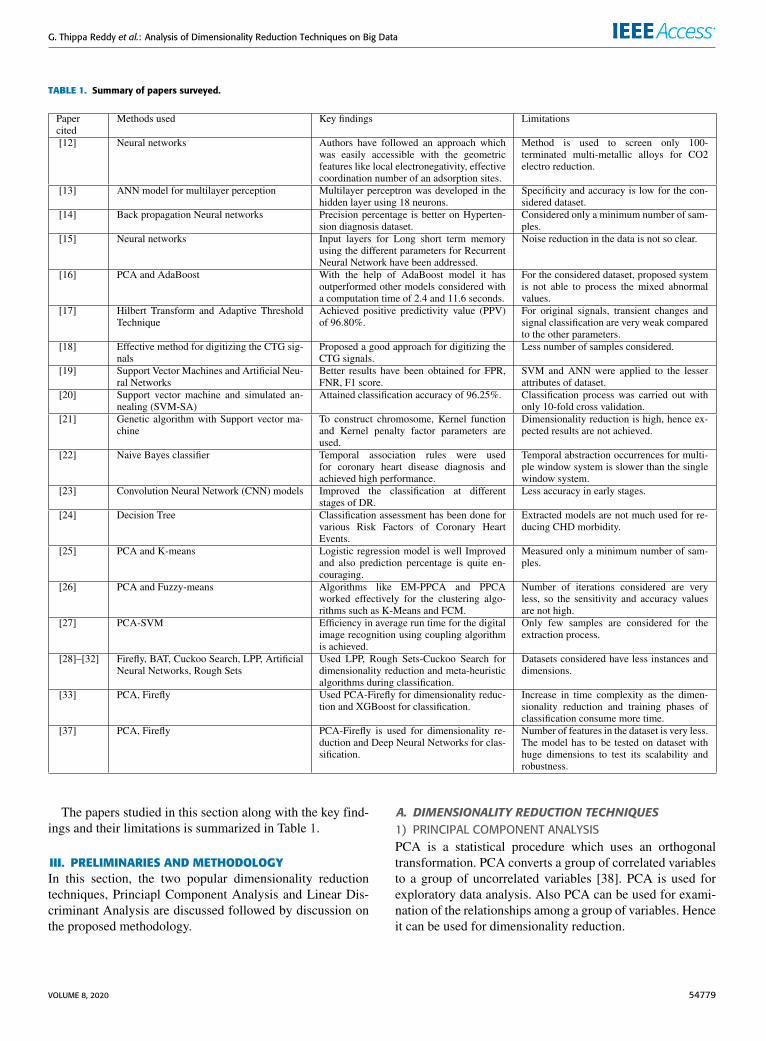
TABLE 1. Summary of papers surveyed.
The papers studied in this section along with the key find-ings and their limitations is summarized in Table 1.
III. PRELIMINARIES AND METHODOLOGY
In this section, the two popular dimensionality reductiontechniques, Princiapl Component Analysis and Linear Dis-criminant Analysis are discussed followed by discussion onthe proposed methodology.
A. DIMENSIONALITY REDUCTION TECHNIQUES
1) PRINCIPAL COMPONENT ANALYSIS
PCA is a statistical procedure which uses an orthogonaltransformation. PCA converts a group of correlated variablesto a group of uncorrelated variables [38]. PCA is used forexploratory data analysis. Also PCA can be used for exami-nation of the relationships among a group of variables. Henceit can be used for dimensionality reduction.
VOLUME 8, 2020 54779

G. Thippa Reddy et al.: Analysis of Dimensionality Reduction Techniques on Big Data
Assume that a dataset x(1),x(2),.....xm has n dimensioninputs. n-dimension data has to be reduced to k-dimension(k ≪ n) using PCA. PCA is described below:
1) Standardization of the raw data: The raw data shouldhave unit variance and zero mean.
x ij =x ij − x j
σj∀j
2) Calculate the co-variance matrix of the raw data asfollows:
∑
=1
m
m∑
i
(xi)(xi)T ,
∑
∈ Rn∗n
3) Calculate the eigenvector and eigenvalue of theco-variance matrix as given in Equation 1.
uT∑
= λµ
U =
| | |
u1 u2 . . . un| | |
, ui ∈ Rn (1)
4) Raw data has to be projected into a k-dimensionalsubspace: Top k eigenvector of co-variance matrix arechosen. These will be the new, original basis for thedata. The Calculation of corresponding vector is givenin Equation 2.
xinew =
uT1 xi
uT2 xi
:::::
:::::
uTk xi
∈ Rk (2)
In this way if the raw data is with n dimensionality, it will bereduced to a new k dimensional representation of the data.
2) LINEAR DISCRIMINANT ANALYSIS (LDA)
LDA is another popular dimensionality reduction approachfor pre-processing step in data mining and machine learningapplications [39]. The main aim of LDA is to project a datasetwith high number of features onto a less-dimensional spacewith good class-separability. This will reduce computationalcosts.
The approach followed by LDA is very much analogousto that of PCA. Apart from maximizing the variance of data(PCA), LDA also maximizes separation of multiple classes.The goal of Linear Discriminant Analysis is to project adimension space onto a lesser subspace i (where i ≤ x − 1)without disturbing the class information.
The 5 steps for performing a LDA are listed below.
1) For every class of dataset, a d-dimensional mean vec-tors is computed.
2) Computation of scatter matrices is carried out.3) The eigenvectors (E1,E2,E3, . . . .Ed ) and their corre-
sponding eigenvalues (ψ1, ψ2, ψ3, . . . .ψd ) of the scat-ter matrices are computed.
4) Sort the eigenvectors in descending order of eigenval-ues and then opt for k eigenvectors which have maxi-mum eigenvalues in order to form a d ∗ i matrix WW.
5) Use the above d ∗ i eigenvector matrix for trans-forming the input samples into a new subspace.i.e., YY = XX ∗WW .
PCA vs. LDA: Both LDA and PCA are linear trans-formation techniques which can be used to reduce thedimensionality/number of features. PCA is an ‘‘unsuper-vised’’ algorithm whereas LDA is ‘‘supervised’’.
B. METHODOLOGY
This work investigates the effect of feature engineering anddimensionality reduction techniques on the performance ofML algorithms on CTG dataset. The various steps used inthis work are discussed below:
1) In step-1 feature engineering techniques, normalizationand conversion of categorical data to numeric data isapplied on CTG dataset. To normalize the input dataset,min-max standardscaler normalization method isused.
2) In step-2, the normalized dataset is experimented usingML algorithms, Decision Tree, Naive Bayes, RandomForest and SVM. The performance of these classifiersis then evaluated on the metrics, Precision, Recall,F1-Score, Accuracy, Sensitivity and Specificity.
3) In step-3 LDA is applied on normalized dataset toextract the most prominent features. The resultantdataset is then experimented on theML algorithms. TheML algorithms using LDA are evaluated on the metricsmentioned in second step.
4) In the step-4, PCA is applied on the normalizeddataset. The resultant dimensionally reduced datasetis then experimented using the aforementioned MLalgorithms. The results obtained are again evaluatedusing the metrics mentioned in step 2.
5) In step-5 the results obtained by the ML algorithmswithout dimensionality reduction and also ML algo-rithms with LDA and PCA are analyzed. The effectof dimensionality reduction on the performance of MLalgorithms is investigated.
6) Repeat steps 1 to 5 on Diabetic Retinopathy and Intru-sion Detection Datasets to analyze the performance ofPCA and LDA on differnt varities of datasets.
The proposedmethodology is shown in Figure 1. The effectof dimensionality reduction techniques on ML algorithms isevaluated in the next section.
IV. RESULTS AND DISCUSSIONS
The experimentation is performed on CTG dataset whichis collected from publicly available UCI machine learningrepository using Python 3. A personal laptop with Win-dows 10 operating system and 8 GB RAM is used for thisexperimentation. The important attributes in the dataset areexplained in Table 2.
54780 VOLUME 8, 2020

G. Thippa Reddy et al.: Analysis of Dimensionality Reduction Techniques on Big Data
FIGURE 1. Proposed model based on PCA and LDA dimensionality reduction techniques.
TABLE 2. Major attributes in the dataset.
A. DATASET DESCRIPTION
Many women feel uneasy during the trimester of their preg-nancy time. During this time, a fetus heart rate also has someproblems with respect to the oxygen supply. Cardiotocogramtracing is used to crisscross the signs of an unborn baby’sheart rate. Cardiotocography is used to observe the fetal heartand contractions of the uterus. Cardiotocography dataset isconsidered from UCI machine learning repository, which has2126 instances and 23 attributes. The major attributes that areused for contractions of the uterus and the fetal heart are UC(uterine contractions per second) and FM (fetal movementsper second). Few other attributes also play a role in recogniz-ing the fetal heart.
B. METRICS FOR EVALUATION OF THE MODEL
1) ACCURACY
It is the percentage of correct predictions that a classifier hasmade when compared to the actual value of the label in thetesting phase. Accuracy can be calculated as below:Accuracy = (TN + TP)/(TN+TP+FN+FP) Where, TP is
true positives, TN is true negatives, FP is false positives, FNis false negatives.
If the class label of a record in a dataset is positive, and theclassifier predicts the class label for that record as positive,then it is called as true positive. If the class label of a record ina dataset is negative, and the classifier predicts the class labelfor that record as negative, then it is called as true negative.If the class label of a record in a dataset is positive, but theclassifier predicts the class label for that record as negative,then it is called as false negative. If the class label of a recordin a dataset is negative, but the classifier predicts the classlabel for that record as positive, then it is called as falsepositive.
2) SENSITIVITY
It is the percentage of true positives that are correctly identi-fied by the classifier during testing. It is calculated as givenbelow: TP/(TP + FN)
3) SPECIFICITY
It is the percentage of true negatives that are correctly iden-tified by the classifier during testing. It is calculated as givenbelow: TN/(TN + FP)
C. PERFORMANCE EVALUATION OF CLASSIFIERS WITH
PCA AND LDA
The results of experimentation are discussed in this section.First the dataset, without dimensionality reduction is exper-imented using the following machine learning algorithms:Decision Tree, Naive Bayes, Random Forest, and SVM.Table 3, Table 4, Table 5, Table 6 show the confusionmatricesfor these algorithms. The confusion matrices show that SVMand Random Forest algorithms perform slightly better thanDecision Tree and Naive Bayes in terms of Precision, Recalland F1-score.
VOLUME 8, 2020 54781
G. Thippa Reddy et al.: Analysis of Dimensionality Reduction Techniques on Big Data
Decision Tree Confusion Marix:
323 3 04 54 00 0 42
TABLE 3. Decision_Tree confusion marix.
Naive Bayes Confusion Matrix:
336 2 24 52 00 6 24
TABLE 4. Naive bayes confusion marix.
Random Forest Confusion Matrix:
325 1 05 53 00 0 42
TABLE 5. Random forest confusion marix.
SVM Confusion Matrix:
332 1 04 54 00 1 34
TABLE 6. SVM confusion marix.
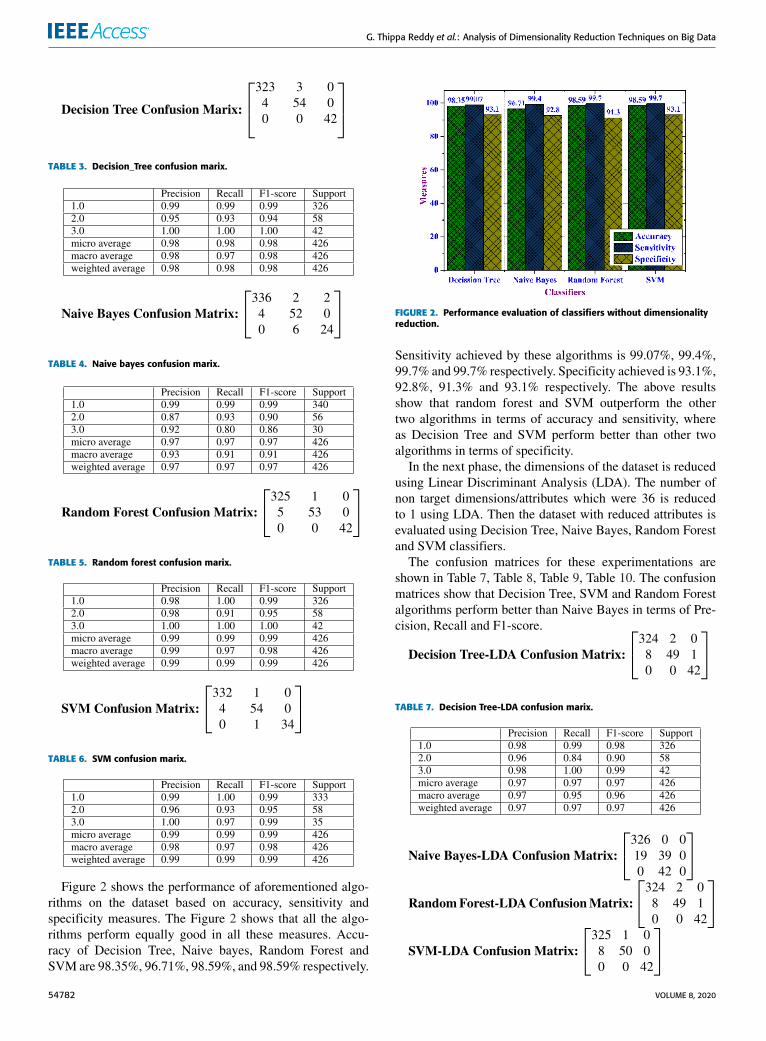
Figure 2 shows the performance of aforementioned algo-rithms on the dataset based on accuracy, sensitivity andspecificity measures. The Figure 2 shows that all the algo-rithms perform equally good in all these measures. Accu-racy of Decision Tree, Naive bayes, Random Forest andSVM are 98.35%, 96.71%, 98.59%, and 98.59% respectively.
FIGURE 2. Performance evaluation of classifiers without dimensionalityreduction.
Sensitivity achieved by these algorithms is 99.07%, 99.4%,99.7% and 99.7% respectively. Specificity achieved is 93.1%,92.8%, 91.3% and 93.1% respectively. The above resultsshow that random forest and SVM outperform the othertwo algorithms in terms of accuracy and sensitivity, whereas Decision Tree and SVM perform better than other twoalgorithms in terms of specificity.
In the next phase, the dimensions of the dataset is reducedusing Linear Discriminant Analysis (LDA). The number ofnon target dimensions/attributes which were 36 is reducedto 1 using LDA. Then the dataset with reduced attributes isevaluated using Decision Tree, Naive Bayes, Random Forestand SVM classifiers.
The confusion matrices for these experimentations areshown in Table 7, Table 8, Table 9, Table 10. The confusionmatrices show that Decision Tree, SVM and Random Forestalgorithms perform better than Naive Bayes in terms of Pre-cision, Recall and F1-score.
Decision Tree-LDA Confusion Matrix:
324 2 08 49 10 0 42
TABLE 7. Decision Tree-LDA confusion marix.
Naive Bayes-LDA Confusion Matrix:
326 0 019 39 00 42 0
RandomForest-LDAConfusionMatrix:
324 2 08 49 10 0 42
SVM-LDA Confusion Matrix:
325 1 08 50 00 0 42
54782 VOLUME 8, 2020

G. Thippa Reddy et al.: Analysis of Dimensionality Reduction Techniques on Big Data
TABLE 8. Naive Bayes-LDA confusion marix.
TABLE 9. Random Forest-LDA confusion marix.
TABLE 10. SVM-LDA confusion marix.
FIGURE 3. Performance evaluation of classifiers using LDA fordimensionality reduction.
Figure 3 shows the performance of these classifiers on thereduced dataset in terms of accuracy, sensitivity and speci-ficity measures. Accuracy of Decision Tree, Naive Bayes,Random Forest and SVM are 97.4%, 85.6%, 97.4% and97.8% respectively. Sensitivity achieved by these algorithmsis 99.3%, 100%, 99.3% and 99.6% respectively. Specificityachieved is 85.9%, 67%, 84.5%, 86.2% respectively. Theseresults show that Naive Bayes with LDA performs relativelyless in terms of accuracy and specificity, whereas its sensitiv-ity is 100%. The other 3 algorithms perform equally good interms of all the three measures.The dataset is then reduced using Principal Component
Analysis (PCA) dimensionality reduction. The dataset which
had 36 non-target dimensions is reduced to 26 non-targetdimensions with PCA. The resultant dataset with reduceddimensions is then experimented using Decision Tree, NaiveBayes, Random Forest and SVM classifiers. The confusionmatrices for these experimentations are shown in Table 11,Table 12, Table 13, Table 14. The confusion matrices showthat Decision Tree, SVM and Random Forest algorithmsperform better than Naive Bayes in terms of Precision, Recalland F1-score.
Decision Tree-PCA Confusion Matrix:
324 2 05 53 00 1 41
TABLE 11. Decision Tree-PCA confusion marix.
Naive Bayes-PCA Confusion Matrix:
338 0 011 45 010 0 22
TABLE 12. Naive Bayes-PCA confusion marix.
RandomForest-PCAConfusionMatrix:
324 1 15 53 00 0 42
TABLE 13. Random Forest-PCA confusion marix.
SVM-PCA Confusion Matrix:
325 3 05 57 00 0 36
Figure 4 shows the performance of these classifiers on thereduced dataset in terms of accuracy, sensitivity and speci-ficity measures. Accuracy of Decision Tree, Naive Bayes,Random Forest and SVM are 98.1%, 95%, 98.3% and98.1% respectively. Sensitivity achieved by these algorithmsis 99.3%, 100%, 99.6% and 99% respectively. Specificityachieved is 91.3%, 80.3%, 91.3% and 92% respectively.
VOLUME 8, 2020 54783

G. Thippa Reddy et al.: Analysis of Dimensionality Reduction Techniques on Big Data
TABLE 14. SVM-PCA confusion marix.
FIGURE 4. Performance evaluation of classifiers using PCA fordimensionality reduction.
As can be observed from Figure 4, Naive Bayes algorithmfares poorly with respect to other three algorithms againstaccuracy and specificity measures. Whereas its sensitivity is100%. The other three algorithms perform equally good interms of all the three measures.The experimantation results on Cardiotocography datasets
are summarized in Table 15.To further analyze the performance of PCA and LDA
on datasets with varying dimensions with several ML algo-rithms, the experimentation is repeated on two other datasetsnamely, Diabetic Retinopathy (DR) dataset and Intrusion
Detection system (IDS) dataset. The diabetic retinopathydataset has 1151 instances and 20 attributes. The IDS datasethas 125973 instances and 43 attributes. After applying one-hot encoding, to transform the data in categorical form intonumericl data, these attributes were increased to 3024.
The experimentation results on Diabetic RetinopathyDataset are summarized in Table 16.The experimentation results of IDS Dataset are summa-
rized in Table 17.From the above investigations the following points can be
observed as per Table 15, Table 16 and Table 17.CTG Dataset (Table 15)
1) Decision tree, Naive Bayes, Random Forest and SVMperform almost the same when without dimensionalityreduction techniques.
2) When the dimensionality of the dataset is reduced usingPCA as well as LDA: Decision Tree, Random Forestand SVM classifiers fare better with respect to allthe three measures. Performance of Naive Bayes isdropped in terms of accuracy and specificity when thedimensions are reduced, but its sensitivity is 100% evenwhen the dimensions are reduced.
3) It can also be observed that dataset with reduced dimen-sions using PCA performs better when compared withthat of LDA.
4) The performance of Decision Tree and Random ForestML algorithms is almost similar even when the lesssignificant features are eliminated by both PCA andLDA.
5) As the number of dimensions and the number ofinstances in this dataset is not that huge, dimensionalityreduction is not having a positive impact on the results.
DR Dataset (Table 16)
1) SVM yielded best accuracy, specificity and sensitivityfor DR dataset without dimensionality reduction.
2) When dimensionality reduction is applied on DRdataset, the perforance of the ML algorithms dropped
TABLE 15. Summary of results for CTG dataset.
54784 VOLUME 8, 2020

G. Thippa Reddy et al.: Analysis of Dimensionality Reduction Techniques on Big Data
TABLE 16. Summary of results for DR dataset.
TABLE 17. Summary of results for IDS dataset.
TABLE 18. Summary of results for IDS dataset (1151 records and 20 attributes).
VOLUME 8, 2020 54785
G. Thippa Reddy et al.: Analysis of Dimensionality Reduction Techniques on Big Data
significantly. RandomForest classifier yielded superiorperformance with PCA on this datasets, where as SVMpermed best when LDA is applied on DR dataset.
IDS Dataset (Table 17)
1) SVM and Random Forest classifiers outperformed theother classifiers considered.
2) Classifiers with PCA yielded better results with respectto all the metrics than Classifiers without dimensioan-lity reduction.
3) When LDA is applied, there is a dip in the performanceof the classifiers.
From Table 16 and Table 17 it can be observed that theperformance of the ML algorithms along with both PCA andLDA for IDS dataset outperform that of DR dataset as thenumber of instances and attributes are huge for IDS dataset.To observe the performance of these ML models on IDSdataset with similar dimensionality as that of DR dataset,a random 1151 records and 20 feataures are fed to thesemodels. The experimental results of the reduced IDS datasetare depicted in Table 18. As some important features areremoved in order tomake the IDS dataset similar to that of DRdataset, the performance of the ML models on IDS dataset isreduced when compared to that of the DR dataset.To summarize the above discussion, when the size of the
dataset is too less, dimeensionality reduction techniques havenegative impact on teh performance of the ML algorithms.When the size and dimensions of the dataset are significantPCA performs better than pure classifiers without dimension-ality reduction and also classifiers with PCA. Hence, as thesize of the dataset increases, it is suggested to use PCA forbetter results in terms of specificity, sensitivity and accuracymetrics. Also Random Forest and SVM algorithms with PCAyield best results. Hence it is recommended to use eitherRandom forest or SVM classifiers with PCAwhen the datasetis of high-dimensions.
V. CONCLUSION AND FUTURE WORK
In this work, the effect of two pioneer dimensionality reduc-tion techniques, namely Principal Component Analysis andLinear Discriminant Analysis on ML algorithms have beeninvestigated. These dimensionality reduction techniques areapplied on Cardiotocography dataset which is available inUCI machine learning repository. This dataset has 36 depen-dent attributes. By choosing to retain 95% of the componentsusing PCA, number of dependent attributes has been reducedto 26, whereas LDA reduced the dependent attributes to 1.This reduced dataset is trained using four popular classifiers,Decision Tree classifier, Naive Bayes classifier, RandomForest classifier and SVM. From the results, it is observedthat the performance of classifiers with PCA is better thanthat of with LDA. Also Decision Tree and Random Forestclassifiers outperform the other two algorithms without usingdimensionality reduction as well as with both PCA and LDA.When the same experimentation is performed on DiabeticRetinopathy dataset, it is observed that both PCA and LDA
had negative performance on the results as the size of thedataset is less. Whereas for IDS dataset, the performanceof the classifiers with PCA is better than that of classifierswithout dimensionality reduction and classifiers with LDA.In future, the effectiveness of these dimensionality reduc-
tion techniques can be tested on high dimensionality datasuch as images, text data etc. Also these techniques can beused on more complex algorithms like Deep Neural Net-works, Convolutional Neural Networks, Recurrent NeuralNetworks, etc.
REFERENCES
[1] C. M. Bishop, Pattern Recognition and Machine Learning. New York, NY,USA: Springer, 2006.
[2] C. E. Rasmussen, ‘‘Gaussian processes in machine learning,’’ in SummerSchool onMachine Learning. Berlin, Germany: Springer, 2003, pp. 63–71.
[3] T. G. Dietterich, ‘‘Ensemble methods in machine learning,’’ in Proc.
Int. Workshop Multiple Classifier Syst. Berlin, Germany: Springer, 2000,pp. 1–15.
[4] R. M. Grivell, Z. Alfirevic, G. M. Gyte, and D. Devane, ‘‘Antenatalcardiotocography for fetal assessment,’’ Cochrane Database SystematicRev., vol. 9, pp. 1–48, Sep. 2015.
[5] Z. Alfirevic, G. M. Gyte, A. Cuthbert, and D. Devane, ‘‘Continuouscardiotocography (CTG) as a form of electronic fetal monitoring (EFM)for fetal assessment during labour,’’ Cochrane Database Systematic Rev.,vol. 2, pp. 1–108, Feb. 2017.
[6] D. Ayres-de-Campos, C. Y. Spong, E. Chandraharan, and F. IntrapartumFetalMonitoring Expert Consensus Panel, ‘‘FIGO consensus guidelines onintrapartum fetal monitoring: Cardiotocography,’’ Int. J. Gynecol. Obstet-rics, vol. 131, no. 1, pp. 13–24, Oct. 2015.
[7] L. Van Der Maaten, E. Postma, and J. Van den Herik, ‘‘Dimensionalityreduction: A comparative,’’ J.Mach. Learn. Res., vol. 10, nos. 66–71, p. 13,2009.
[8] A. Zheng and A. Casari, Feature Engineering for Machine Learning: Prin-ciples and Techniques for Data Scientists. Newton, MA, USA: O’ReillyMedia, 2018.
[9] D. Ayres-de-Campos, J. Bernardes, A. Garrido, J. Marques-de-Sá, andL. Pereira-Leite, ‘‘Sisporto 2.0: A program for automated analysis ofcardiotocograms,’’ J. Maternal-Fetal Med., vol. 9, no. 5, pp. 311–318,Sep. 2000.
[10] B. Antal and A. Hajdu, ‘‘An ensemble-based system for automatic screen-ing of diabetic retinopathy,’’ Knowl.-Based Syst., vol. 60, pp. 20–27,Apr. 2014.
[11] Y. Meidan, M. Bohadana, Y. Mathov, Y. Mirsky, A. Shabtai,D. Breitenbacher, and Y. Elovici, ‘‘N-BaIoT—Network-based detectionof IoT botnet attacks using deep autoencoders,’’ IEEE Pervas. Comput.,vol. 17, no. 3, pp. 12–22, Jul./Sep. 2018.
[12] Z. Li, X. Ma, and H. Xin, ‘‘Feature engineering of machine-learningchemisorption models for catalyst design,’’ Catal. Today, vol. 280,pp. 232–238, Feb. 2017.
[13] C.-A. Cheng and H.-W. Chiu, ‘‘An artificial neural network model forthe evaluation of carotid artery stenting prognosis using a national-widedatabase,’’ in Proc. 39th Annu. Int. Conf. IEEE Eng. Med. Biol. Soc.
(EMBC), Jul. 2017, pp. 2566–2569.
[14] S. Zaman and R. Toufiq, ‘‘Codon based back propagation neural networkapproach to classify hypertension gene sequences,’’ in Proc. Int. Conf.
Electr., Comput. Commun. Eng. (ECCE), Feb. 2017, pp. 443–446.
[15] H. Tang, T. Wang, M. Li, and X. Yang, ‘‘The design and implementa-tion of cardiotocography signals classification algorithm based on neu-ral network,’’ Comput. Math. Methods Med., vol. 2018, Dec. 2018,Art. no. 8568617.
[16] Y. Zhang and Z. Zhao, ‘‘Fetal state assessment based on cardiotocographyparameters using PCA and AdaBoost,’’ in Proc. 10th Int. Congr. ImageSignal Process., Biomed. Eng. Informat. (CISP-BMEI), Oct. 2017, pp. 1–6.
[17] J. A. Lobo Marques, P. C. Cortez, J. P. D. V. Madeiro, S. J. Fong,F. S. Schlindwein, and V. H. C. D. Albuquerque, ‘‘Automatic cardiotocog-raphy diagnostic system based on Hilbert transform and adaptive thresholdtechnique,’’ IEEE Access, vol. 7, pp. 73085–73094, 2019.
54786 VOLUME 8, 2020

G. Thippa Reddy et al.: Analysis of Dimensionality Reduction Techniques on Big Data
[18] Z. Cömert, A. Şengür, Y. Akbulut, Ü. Budak, A. F. Kocamaz, andS. Güngör, ‘‘A simple and effective approach for digitization of the CTGsignals from CTG traces,’’ IRBM, vol. 40, no. 5, pp. 286–296, Oct. 2019.
[19] M. Abdar and V. Makarenkov, ‘‘CWV-BANN-SVM ensemble learn-ing classifier for an accurate diagnosis of breast cancer,’’ Measurement,vol. 146, pp. 557–570, Nov. 2019.
[20] J. S. Sartakhti, M. H. Zangooei, and K. Mozafari, ‘‘Hepatitis disease diag-nosis using a novel hybrid method based on support vector machine andsimulated annealing (SVM-SA),’’ Comput. Methods Programs Biomed.,vol. 108, no. 2, pp. 570–579, Nov. 2012.
[21] Z. Tao, L. Huiling, W. Wenwen, and Y. Xia, ‘‘GA-SVM based featureselection and parameter optimization in hospitalization expense model-ing,’’ Appl. Soft Comput., vol. 75, pp. 323–332, Feb. 2019.
[22] K. Orphanou, A. Dagliati, L. Sacchi, A. Stassopoulou, E. Keravnou, andR. Bellazzi, ‘‘Incorporating repeating temporal association rules in NaïveBayes classifiers for coronary heart disease diagnosis,’’ J. Biomed. Infor-mat., vol. 81, pp. 74–82, May 2018.
[23] S. Qummar, F. G.Khan, S. Shah, A.Khan, S. Shamshirband, Z. U. Rehman,I. Ahmed Khan, and W. Jadoon, ‘‘A deep learning ensemble approach fordiabetic retinopathy detection,’’ IEEE Access, vol. 7, pp. 150530–150539,2019.
[24] M. A. Karaolis, J. A. Moutiris, D. Hadjipanayi, and C. S. Pattichis,‘‘Assessment of the risk factors of coronary heart events based on datamining with decision trees,’’ IEEE Trans. Inf. Technol. Biomed., vol. 14,no. 3, pp. 559–566, May 2010.
[25] C. Zhu, C. U. Idemudia, andW. Feng, ‘‘Improved logistic regressionmodelfor diabetes prediction by integrating PCA and K -means techniques,’’Informat. Med. Unlocked, vol. 17, 2019, Art. no. 100179.
[26] I. E. Kaya, A. Ç. Pehlivanlı, E. G. Sekizkardeş, and T. Ibrikci, ‘‘PCA basedclustering for brain tumor segmentation of T1w MRI images,’’ Comput.Methods Programs Biomed., vol. 140, pp. 19–28, Mar. 2017.
[27] L. Hu and J. Cui, ‘‘Digital image recognition based on Fractional-order-PCA-SVM coupling algorithm,’’ Measurement, vol. 145, pp. 150–159,Oct. 2019.
[28] G. Thippa Reddy and N. Khare, ‘‘FFBAT-optimized rule based fuzzylogic classifier for diabetes,’’ Int. J. Eng. Res. Afr., vol. 24, pp. 137–152,Jun. 2016.
[29] N. Khare and G. T. Reddy, ‘‘Heart disease classification system usingoptimised fuzzy rule based algorithm,’’ Int. J. Biomed. Eng. Technol.,vol. 27, no. 3, pp. 183–202, 2018.
[30] G. T. Reddy andN. Khare, ‘‘An efficient system for heart disease predictionusing hybrid OFBAT with rule-based fuzzy logic model,’’ J. Circuits, Syst.Comput., vol. 26, no. 04, Apr. 2017, Art. no. 1750061.
[31] T. R. Gadekallu and N. Khare, ‘‘Cuckoo search optimized reductionand fuzzy logic classifier for heart disease and diabetes prediction,’’ Int.J. Fuzzy Syst. Appl., vol. 6, no. 2, pp. 25–42, Apr. 2017.
[32] G. T. Reddy and N. Khare, ‘‘Hybrid firefly-bat optimized fuzzy artificialneural network based classifier for diabetes diagnosis,’’ Int. J. Intell. Eng.Syst., vol. 10, no. 4, pp. 18–27, 2017.
[33] S. Bhattacharya, S. R. K. S, P. K. R. Maddikunta, R. Kaluri, S. Singh,T. R. Gadekallu, M. Alazab, and U. Tariq, ‘‘A novel PCA-firefly basedXGBoost classification model for intrusion detection in networks usingGPU,’’ Electronics, vol. 9, no. 2, p. 219, 2020.
[34] R. Vinayakumar, M. Alazab, K. P. Soman, P. Poornachandran,A. Al-Nemrat, and S. Venkatraman, ‘‘Deep learning approachfor intelligent intrusion detection system,’’ IEEE Access, vol. 7,pp. 41525–41550, 2019.
[35] R. Vinayakumar, M. Alazab, K. P. Soman, P. Poornachandran, andS. Venkatraman, ‘‘Robust intelligent malware detection using deep learn-ing,’’ IEEE Access, vol. 7, pp. 46717–46738, 2019.
[36] S. Kaur and M. Singh, ‘‘Hybrid intrusion detection and signature genera-tion using deep recurrent neural networks,’’ Neural Comput. Appl., vol. 1,pp. 1–19, Apr. 2019.
[37] T. R. Gadekallu, N. Khare, S. Bhattacharya, S. Singh, P. K. R. Maddikunta,I.-H. Ra, and M. Alazab, ‘‘Early detection of diabetic retinopathy usingPCA-firefly based deep learning model,’’ Electronics, vol. 9, no. 2, p. 274,2020.
[38] H. Abdi and L. J. Williams, ‘‘Principal component analysis,’’ Wiley Inter-discipl. Rev., Comput. Statist., vol. 2, no. 4, pp. 433–459, 2010.
[39] J. Ye, R. Janardan, and Q. Li, ‘‘Two-dimensional linear discriminantanalysis,’’ in Proc. Adv. Neural Inf. Process. Syst., 2005, pp. 1569–1576.
G. THIPPA REDDY received the B.Tech. degreein computer science and engineering (CSE) fromNagarjuna University, the M.Tech. degree in CSEfrom Anna University, Chennai, India, and thePh.D. degree from VIT, Vellore, India. He has14 years of experience in teaching. He producedmore than 25 international/national publications.He is currently working as an Assistant Professor(Senior) with the School of Information Technol-ogy and Engineering, VIT. He is currently working
in the area of machine learning, the Internet of Things, deep neural networks,blockchain.
M. PRAVEEN KUMAR REDDY receivedthe B.Tech. degree in computer science andengineering (CSE) from JNT University, theM.Tech. degree in CSE from VIT, Vellore, Indiaand the Ph.D. degree from VIT, Vellore, India.He had worked as Software Developer with IBM,in 2011. He worked in Alcatel-Lucent, in 2013.He was a Visiting Professor with the GuangdongUniversity of Technology, China, in 2019. He iscurrently working as an Assistant Professor with
the School of Information Technology and Engineering, VIT. He producedmore than 15 international/national publications. He is currently working inthe area of energy aware applications for the Internet of Things (IoT) andhigh-performance computing.
KURUVA LAKSHMANNA received the B.Tech.degree in computer science and engineeringfrom the Sri Venkateswara University Col-lege of Engineering, Tirupathi, India, in 2006,the M.Tech. degree in computer science and engi-neering(information security) from the NationalInstitute of Technology at Calicut, India, 2009, andthe Ph.D. degree from VIT, India, 2017. He was aVisiting Professor with the Guangdong Universityof Technology, China, in 2018. He is currently
working as an Assistant Professor Senior with VIT, India. His researchinterests are data mining in DNA sequences, algorithms, and knowledgemining.
RAJESH KALURI received the B.Tech. degreein computer science and engineering (CSE) fromJNTU, Hyderabad, the M.Tech. degree in CSEfrom ANU, Guntur, India, and the Ph.D. degreein computer vision from VIT, India. He is having8.5 years of teach experience. He was a VisitingProfessor with the Guangdong University of Tech-nology, China, in 2015 and 2016. He is currentlyworking as an Assistant Professor (Senior) withthe School of Information Technology and Engi-
neering, VIT, India. He has published research articles in various reputedinternational journals. His current researches are in the areas of computervision and human computer interaction.
VOLUME 8, 2020 54787
G. Thippa Reddy et al.: Analysis of Dimensionality Reduction Techniques on Big Data
DHARMENDRA SINGH RAJPUT received thePh.D. degree from NIT Bhopal, India, in 2013.He is currently working as an Associate Pro-fessor with VIT, India. His research areas aredatamining, artificial intelligence, soft computing,automata, and natural language processing.
GAUTAM SRIVASTAVA (Senior Member, IEEE)received the B.Sc. degree from Briar Cliff Uni-versity, USA, in 2004, and the M.Sc. and Ph.D.degrees from the University of Victoria, Victoria,BC, Canada, in 2006 and 2011, respectively. Hethen taught for three years at the Department ofComputer Science, University of Victoria, wherehe was regarded as one of the top undergradu-ate professors in the Computer Science CourseInstruction at the University. In 2014, he joined a
tenure-track position at Brandon University, Brandon, MB, Canada, wherehe currently is active in various professional and scholarly activities. He waspromoted to the rank an Associate Professor in January 2018. He is popularlyknown as an active in research in the field of data mining and big data.In his eight-year academic career, he has published a total of 60 articles inhigh-impact conferences in many countries and in high-status journals (SCIand SCIE) and has also delivered invited guest lectures on big data, cloudcomputing, Internet of Things, and cryptography at many Taiwanese andCzech universities. He received the Best Oral Presenter Award in FSDM2017 which was held at the National Dong Hwa University (NDHU) inShoufeng (Hualien County), Taiwan, in November 2017. He currently hasactive research projects with other academics in Taiwan, Singapore, Canada,Czech Republic, Poland, andUSA.He is constantly looking for collaborationopportunities with foreign professors and students. He is an Editor of severalinternational scientific research journals.
THAR BAKER received the Ph.D. degree in auto-nomic cloud applications from LJMU, in 2010.He was working as a Postdoctoral Research Asso-ciate in autonomic cloud computing with LJMU,where he built the first private cloud computingresearch platform for the Department of Com-puter Science. He worked as a Lecturer withthe Department of Computer Science, Manch-esterMetropolitan University (MMU), in 2011. Hebecame a Senior Fellowwith the Higher Education
Academy (SFHEA), in 2018. He is currently a Reader in cloud engineer-ing and the Head of the Applied Computing Research Group (ACRG),Department of Computer Science, Liverpool JohnMoores University. He haspublished numerous refereed research articles in multidisciplinary researchareas including: cloud computing, distributed software systems, big data,algorithm design, green and sustainable computing, and autonomic webscience. He has successfully completed the Strategic Executive Developmentfor Diverse Leasers in Higher Education (StellarHE) Course in 2016. He hasbeen actively involved as a member of editorial board and review committeefor a number of peer reviewed international journals, and is on programmecommittee for a number of international conferences. He was appointed as anExpert Evaluator in the European FP7 Connected Communities CONFINEProject from 2012 to 2015.
54788 VOLUME 8, 2020
Related Documents