COURSE MANUAL Analysis of Demographic Data in Educational Management EME204 University of Ibadan Distance Learning Centre Open and Distance Learning Course Series Development

Welcome message from author
This document is posted to help you gain knowledge. Please leave a comment to let me know what you think about it! Share it to your friends and learn new things together.
Transcript

COURSE MANUAL
Analysis of Demographic Data in Educational Management
EME204
University of Ibadan Distance Learning Centre
Open and Distance Learning Course Series Development


Copyright © 1991, 2015 by Distance Learning Centre, University of Ibadan, Ibadan.
All rights reserved. No part of this publication may be reproduced, stored in a retrieval system, or transmitted in any form or by any means, electronic, mechanical, photocopying, recording or otherwise, without the prior permission of the copyright owner.
ISBN: 978-2828-99-8
General Editor: Prof. Bayo Okunade
University of Ibadan Distance Learning Centre University of Ibadan,
Nigeria Telex: 31128NG
Tel: +234 (80775935727) E-mail: [email protected]
Website: www.dlc.ui.edu.ng

Contents ii
Vice-Chancellor’s Message The Distance Learning Centre is building on a solid tradition of over two decades of service in the provision of External Studies Programme and now Distance Learning Education in Nigeria and beyond. The Distance Learning mode to which we are committed is providing access to many deserving Nigerians in having access to higher education especially those who by the nature of their engagement do not have the luxury of full time education. Recently, it is contributing in no small measure to providing places for teeming Nigerian youths who for one reason or the other could not get admission into the conventional universities.
These course materials have been written by writers specially trained in ODL course delivery. The writers have made great efforts to provide up to date information, knowledge and skills in the different disciplines and ensure that the materials are user-friendly. In addition to provision of course materials in print and e-format, a lot of Information Technology input has also gone into the deployment of course materials. Most of them can be downloaded from the DLC website and are available in audio format which you can also download into your mobile phones, IPod, MP3 among other devices to allow you listen to the audio study sessions. Some of the study session materials have been scripted and are being broadcast on the university’s Diamond Radio FM 101.1, while others have been delivered and captured in audio-visual format in a classroom environment for use by our students. Detailed information on availability and access is available on the website. We will continue in our efforts to provide and review course materials for our courses.
However, for you to take advantage of these formats, you will need to improve on your I.T. skills and develop requisite distance learning Culture. It is well known that, for efficient and effective provision of Distance learning education, availability of appropriate and relevant course materials is a sine qua non. So also, is the availability of multiple plat form for the convenience of our students. It is in fulfilment of this, that series of course materials are being written to enable our students study at their own pace and convenience.
It is our hope that you will put these course materials to the best use.
Prof. Abel Idowu Olayinka Vice-Chancellor
Foreword As part of its vision of providing education for “Liberty and Development” for Nigerians and the International Community, the University of Ibadan, Distance Learning Centre has recently embarked on a vigorous repositioning agenda which aimed at embracing a holistic and all encompassing approach to the delivery of its Open Distance Learning (ODL) programmes. Thus we are committed to global best practices in distance learning provision. Apart from providing an efficient administrative and academic support for our students, we are committed to providing educational resource materials for the use of our students. We are convinced that, without an up-to-date, learner-friendly and distance learning compliant course materials, there cannot be any basis to lay claim to being a provider of distance learning education. Indeed, availability of appropriate course materials in multiple formats is the hub of any distance learning provision worldwide.
In view of the above, we are vigorously pursuing as a matter of priority, the provision of credible, learner-friendly and interactive course materials for all our courses. We commissioned the authoring of, and review of course materials to teams of experts and their outputs were subjected to rigorous peer review to ensure standard. The approach not only emphasizes cognitive knowledge, but also skills and humane values which are at the core of education, even in an ICT age.
The development of the materials which is on-going also had input from experienced editors and illustrators who have ensured that they are accurate, current and learner-friendly. They are specially written with distance learners in mind. This is very important because, distance learning involves non-residential students who can often feel isolated from the community of learners. It is important to note that, for a distance learner to excel there is the need to source and read relevant materials apart from this course material. Therefore, adequate supplementary reading materials as well as other information sources are suggested in the course materials.
Apart from the responsibility for you to read this course material with others, you are also advised to seek assistance from your course facilitators especially academic advisors during your study even before the interactive session which is by design for revision. Your academic advisors will assist you using convenient technology including Google Hang Out, You Tube, Talk Fusion, etc. but you have to take advantage of these. It is also going to be of immense advantage if you complete assignments as at when due so as to have necessary feedbacks as a guide.
The implication of the above is that, a distance learner has a responsibility to develop requisite distance learning culture which includes diligent and disciplined self-study, seeking available administrative and academic support and acquisition of basic information technology skills. This is why you are encouraged to develop your computer skills by availing yourself the opportunity of training that the Centre’s provide and put these into use.

Contents iv
In conclusion, it is envisaged that the course materials would also be useful for the regular students of tertiary institutions in Nigeria who are faced with a dearth of high quality textbooks. We are therefore, delighted to present these titles to both our distance learning students and the university’s regular students. We are confident that the materials will be an invaluable resource to all.
We would like to thank all our authors, reviewers and production staff for the high quality of work.
Best wishes.
Professor Bayo Okunade Director

Course Development Team Content Authoring Akinwumiju J.A. and Owolabi S.O.
Content Reviewer Olayemi .J. Abiodun-Oyebanji Ph.D.
Content Editor
Production Editor
Learning Design/Assessment Authoring
Managing Editor
General Editor
Prof. Remi Raji-Oyelade
Ogundele Olumuyiwa Caleb
Folajimi Olambo Fakoya
Ogunmefun Oladele Abiodun
Prof. Bayo Okunade

Contents vi
Contents
About this course manual 1
How this course manual is structured .................................................................................................................... 1
Course Overview 3
Welcome to Analysis of Demographic Data in Educational Management EME204 ............................ 3 Course outcomes .............................................................................................................................................................. 3
Getting around this course manual 6
Margin icons ....................................................................................................................................................................... 6
Study Session 1 7
The Nature of Demography ......................................................................................................................................... 7 Introduction .......................................................................................................................................................... 7 Terminology .......................................................................................................................................................... 7 1.1 What is Demography? ............................................................................................................................... 7 1.2 Basic concepts in demography .............................................................................................................. 8
1.2.1 Demography ................................................................................................................................. 9 1.2.2 Population................................................................................................................................... 10 1.2.3 Census and sample surveys................................................................................................. 10 1.2.4 Vital processes .......................................................................................................................... 11 1.2.5 Vital statistics ............................................................................................................................ 11
Study Session Summary ............................................................................................................................................. 15 Assessment ...................................................................................................................................................................... 15 Bibliography .................................................................................................................................................................... 15
Study Session 2 16
Techniques in Demography ...................................................................................................................................... 16 Introduction ....................................................................................................................................................... 16 Terminology ....................................................................................................................................................... 16 2.1 Computational Techniques .................................................................................................................. 16
2.1.1 Sex Ratio Test ............................................................................................................................ 17 2.1.2 Age Ratio Test ........................................................................................................................... 17 2.1.3 Crude Birth Rate....................................................................................................................... 18 2.1.4 Crude Death Rate ..................................................................................................................... 18 2.1.5 Natural Increase ....................................................................................................................... 19 2.1.6 General Fertility Rates (GFR) ............................................................................................. 20 2.1.7 Age-Specific Fertility Rate (ASFR) .................................................................................... 21 2.1.8 Age-Specific Death Rate (ASDR) ........................................................................................ 22 2.1.9 Infant Death Rate (IDR) ........................................................................................................ 23
Study Session Summary ............................................................................................................................................. 24 Assessment ...................................................................................................................................................................... 24 Bibliography .................................................................................................................................................................... 24
Study Session 3 25
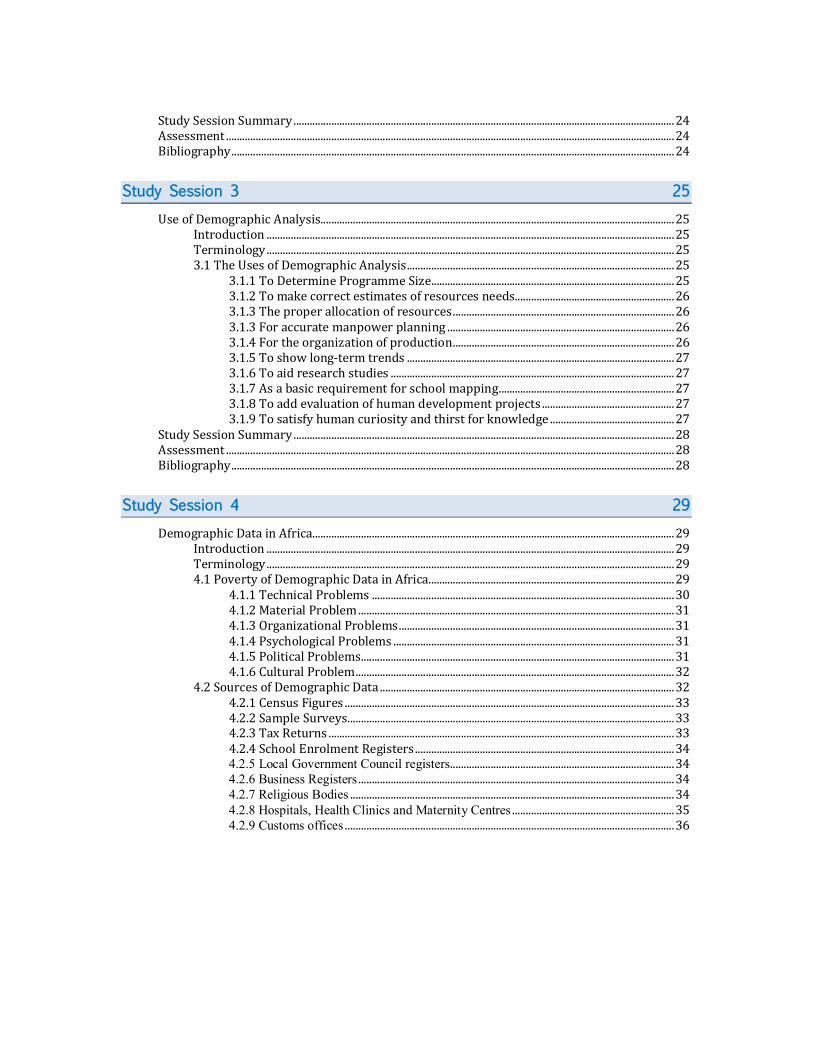
Use of Demographic Analysis................................................................................................................................... 25 Introduction ....................................................................................................................................................... 25 Terminology ....................................................................................................................................................... 25 3.1 The Uses of Demographic Analysis ................................................................................................... 25
3.1.1 To Determine Programme Size.......................................................................................... 25 3.1.2 To make correct estimates of resources needs........................................................... 26 3.1.3 The proper allocation of resources .................................................................................. 26 3.1.3 For accurate manpower planning .................................................................................... 26 3.1.4 For the organization of production .................................................................................. 26 3.1.5 To show long-term trends ................................................................................................... 27 3.1.6 To aid research studies ......................................................................................................... 27 3.1.7 As a basic requirement for school mapping ................................................................. 27 3.1.8 To add evaluation of human development projects ................................................. 27 3.1.9 To satisfy human curiosity and thirst for knowledge .............................................. 27
Study Session Summary ............................................................................................................................................. 28 Assessment ...................................................................................................................................................................... 28 Bibliography .................................................................................................................................................................... 28
Study Session 4 29
Demographic Data in Africa...................................................................................................................................... 29 Introduction ....................................................................................................................................................... 29 Terminology ....................................................................................................................................................... 29 4.1 Poverty of Demographic Data in Africa........................................................................................... 29
4.1.1 Technical Problems ................................................................................................................ 30 4.1.2 Material Problem ..................................................................................................................... 31 4.1.3 Organizational Problems ...................................................................................................... 31 4.1.4 Psychological Problems ........................................................................................................ 31 4.1.5 Political Problems.................................................................................................................... 31 4.1.6 Cultural Problem ...................................................................................................................... 32
4.2 Sources of Demographic Data ............................................................................................................. 32 4.2.1 Census Figures .......................................................................................................................... 33 4.2.2 Sample Surveys......................................................................................................................... 33 4.2.3 Tax Returns ................................................................................................................................ 33 4.2.4 School Enrolment Registers ................................................................................................ 34 4.2.5 Local Government Council registers ................................................................................... 34 4.2.6 Business Registers ..................................................................................................................... 34 4.2.7 Religious Bodies ........................................................................................................................ 34 4.2.8 Hospitals, Health Clinics and Maternity Centres ............................................................ 35 4.2.9 Customs offices .......................................................................................................................... 36

Contents viii
Study Session Summary ............................................................................................................................................. 36 Assessment ...................................................................................................................................................................... 36 Bibliography .................................................................................................................................................................... 36
Study Session 5 37
Methods of Measuring Natality ............................................................................................................................... 37 Introduction ....................................................................................................................................................... 37 Terminology ....................................................................................................................................................... 37 5.1 What is Natality? ....................................................................................................................................... 37
5.1.1 The Crude Birth Rate.............................................................................................................. 38 5.1.2 Fertility Rates ............................................................................................................................ 39
The General Fertility Rate (GFR) ..................................................................................... 39 Age- Specific Fertility Rate .................................................................................................. 41
Study Session Summary ............................................................................................................................................. 42 Assessment ...................................................................................................................................................................... 42 Bibliography .................................................................................................................................................................... 42
Study Session 6 43
Mortality Rate ................................................................................................................................................................. 43 Introduction ....................................................................................................................................................... 43 Terminology ....................................................................................................................................................... 43 6.1 Defining Mortality Rate .......................................................................................................................... 43
6.1.1 Endogenous Mortality ........................................................................................................... 44 6.1.2 Exogenous Mortality .............................................................................................................. 44
6.2 Methods of Measuring Mortality........................................................................................................ 45 6.2.1 Crude Death Rate ..................................................................................................................... 46 6.2.2 Mortality Rates by Age .......................................................................................................... 47 6.2.3 Age-specific Death Rate ........................................................................................................ 48 6.2.4 Infant Mortality ........................................................................................................................ 48
Study Session Summary ............................................................................................................................................. 50 Assessment ...................................................................................................................................................................... 50 Bibliography .................................................................................................................................................................... 50
Study Session 7 51
Population Growth and Forecasting Enrolment .............................................................................................. 51 Introduction ....................................................................................................................................................... 51 Terminology ....................................................................................................................................................... 52 7.1 Population Growth ................................................................................................................................... 52
7.1.1 The Natural Growth Rate of Population ......................................................................... 52 7.2 Population Projections ........................................................................................................................... 54
7.2.1 Birth Projections ...................................................................................................................... 54 7.2.2 Forecasting School Enrolment ........................................................................................... 55
7.3 Effects of Population Structure on Education .............................................................................. 56 7.3.1 Age Structure ............................................................................................................................. 56 7.3.2 Occupational Structure ......................................................................................................... 58 7.3.3 Geographical Structure ......................................................................................................... 58
Study Session Summary ............................................................................................................................................. 59 Assessment ...................................................................................................................................................................... 59 Bibliography .................................................................................................................................................................... 60
Study Session 8 60
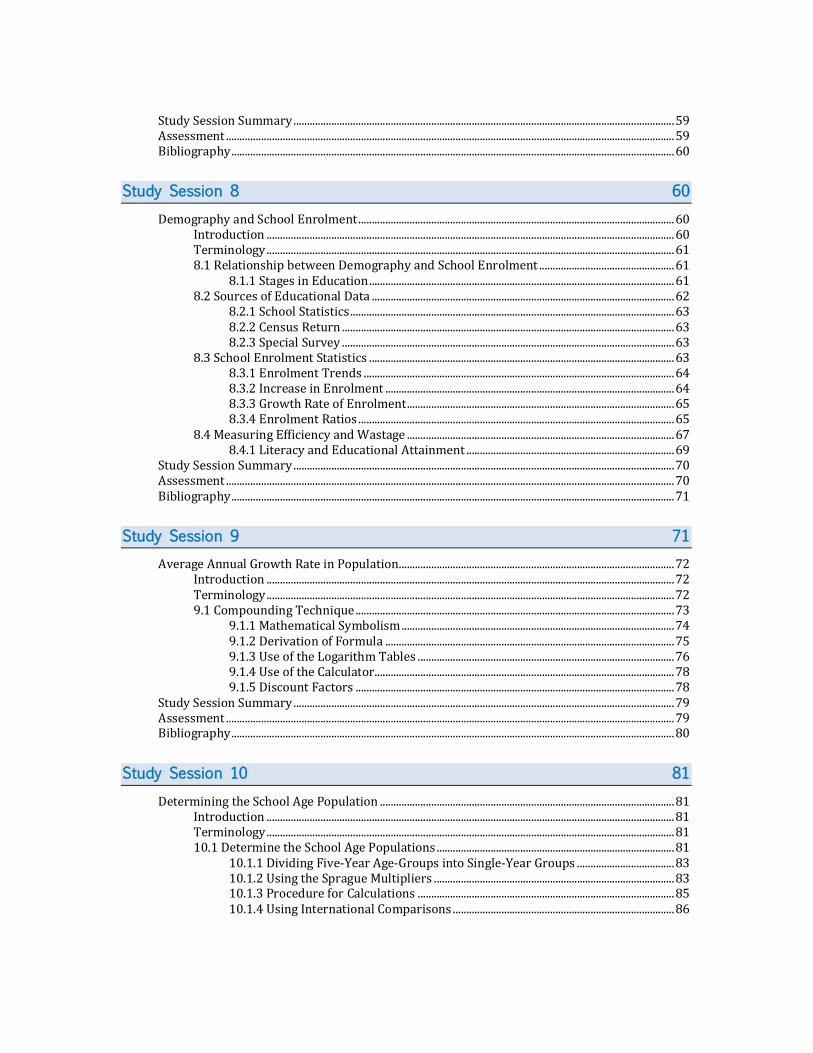
Demography and School Enrolment ..................................................................................................................... 60 Introduction ....................................................................................................................................................... 60 Terminology ....................................................................................................................................................... 61 8.1 Relationship between Demography and School Enrolment .................................................. 61
8.1.1 Stages in Education ................................................................................................................. 61 8.2 Sources of Educational Data ................................................................................................................ 62
8.2.1 School Statistics ........................................................................................................................ 63 8.2.2 Census Return ........................................................................................................................... 63 8.2.3 Special Survey ........................................................................................................................... 63
8.3 School Enrolment Statistics ................................................................................................................. 63 8.3.1 Enrolment Trends ................................................................................................................... 64 8.3.2 Increase in Enrolment ........................................................................................................... 64 8.3.3 Growth Rate of Enrolment ................................................................................................... 65 8.3.4 Enrolment Ratios ..................................................................................................................... 65
8.4 Measuring Efficiency and Wastage ................................................................................................... 67 8.4.1 Literacy and Educational Attainment ............................................................................. 69
Study Session Summary ............................................................................................................................................. 70 Assessment ...................................................................................................................................................................... 70 Bibliography .................................................................................................................................................................... 71
Study Session 9 71
Average Annual Growth Rate in Population ...................................................................................................... 72 Introduction ....................................................................................................................................................... 72 Terminology ....................................................................................................................................................... 72 9.1 Compounding Technique ...................................................................................................................... 73
9.1.1 Mathematical Symbolism ..................................................................................................... 74 9.1.2 Derivation of Formula ........................................................................................................... 75 9.1.3 Use of the Logarithm Tables ............................................................................................... 76 9.1.4 Use of the Calculator............................................................................................................... 78 9.1.5 Discount Factors ...................................................................................................................... 78
Study Session Summary ............................................................................................................................................. 79 Assessment ...................................................................................................................................................................... 79 Bibliography .................................................................................................................................................................... 80
Study Session 10 81
Determining the School Age Population ............................................................................................................. 81 Introduction ....................................................................................................................................................... 81 Terminology ....................................................................................................................................................... 81 10.1 Determine the School Age Populations ........................................................................................ 81
10.1.1 Dividing Five-Year Age-Groups into Single-Year Groups .................................... 83 10.1.2 Using the Sprague Multipliers ......................................................................................... 83 10.1.3 Procedure for Calculations ............................................................................................... 85 10.1.4 Using International Comparisons .................................................................................. 86
Contents x
Study Session Summary ............................................................................................................................................. 87 Assessment ...................................................................................................................................................................... 87 Bibliography .................................................................................................................................................................... 87
Study Session 11 88
Relative Value of Demographic Data .................................................................................................................... 88 Introduction ....................................................................................................................................................... 88 Terminology ....................................................................................................................................................... 88 11.1 Errors in Demographic Data ............................................................................................................. 89
11.1.1 Technical Problems .............................................................................................................. 89 11.1.2 Material Problems ................................................................................................................ 89 11.1.3 Organizational Problems ................................................................................................... 90 11.1.4 Psychological Problems...................................................................................................... 90 11.1.5 Political Problems ................................................................................................................. 90 11.1.6 Errors Due to Sampling ...................................................................................................... 91
Study Session Summary ............................................................................................................................................. 91 Assessment ...................................................................................................................................................................... 91 Bibliography .................................................................................................................................................................... 92
Study Session 12 93
Detecting and Adjusting Age Errors...................................................................................................................... 94 Introduction ....................................................................................................................................................... 94 Terminology ....................................................................................................................................................... 94 12.1 Inaccurate Census Data ....................................................................................................................... 94
12.1.1 Detecting Age Errors ........................................................................................................... 94 Sex Ratio Test ............................................................................................................................ 95 Age Ratio Test ........................................................................................................................... 95 Comparison Test ...................................................................................................................... 97
12.1.2 Adjusting Age Errors ........................................................................................................... 97 Study Session Summary ............................................................................................................................................. 98 Assessment ...................................................................................................................................................................... 98 Bibliography .................................................................................................................................................................... 98
Study Session 13 99
Population Distribution and School Locational Planning ............................................................................ 99 Introduction ....................................................................................................................................................... 99 Terminology ....................................................................................................................................................... 99 13.1 Geographical Distribution of Population .................................................................................. 100
13.1.1 Measuring the Geographical Distribution of a Population ............................... 100 13.1.2 School Catchment Area .................................................................................................... 101 13.1.3 Planning the Location of Schools ................................................................................ 102

Study Session Summary .......................................................................................................................................... 103 Assessment ................................................................................................................................................................... 103 Bibliography ................................................................................................................................................................. 103
Notes on Self-Assessment Questions 104
References 113


About this course manual
1
About this course manual Analysis of Demographic Data in Educational ManagementEME204 has been produced by University of Ibadan Distance Learning Centre. All course manuals produced by University of Ibadan Distance Learning Centreare structured in the same way, as outlined below.
How this course manual is structured
The course overview The course overview gives you a general introduction to the course. Information contained in the course overview will help you determine:
If the course is suitable for you.
What you will already need to know.
What you can expect from the course.
How much time you will need to invest to complete the course.
The overview also provides guidance on:
Study skills.
Where to get help.
Course assignments and assessments.
Margin icons.
We strongly recommend that you read the overview carefully before starting your study.
The course content The course is broken down into Study Sessions. Each Study Session comprises:
An introduction to the Study Session content.
Study Session outcomes.
Core content of the Study Session with a variety of learning activities.
A Study Session summary.
Assignments and/or assessments, as applicable.
Bibliography

EME204 Analysis of Demographic Data in Educational Management
2
Your comments After completing Analysis of Demographic Data in Educational Management we would appreciate it if you would take a few moments to give us your feedback on any aspect of this course. Your feedback might include comments on:
Course content and structure.
Course reading materials and resources.
Course assignments.
Course assessments.
Course duration.
Course support (assigned tutors, technical help, etc.)
Your constructive feedback will help us to improve and enhance this course.

Course Overview
3
Course Overview
Welcome to Analysis of Demographic Data in Educational ManagementEME204
Demography is the scientific study of certain characteristics of human population, particularly with respect to their magnitude, change overtime, size, development, and structure according to sex, age, occupation, geographical location and other characteristics. Demographic data for educational management is a course on demography. It is a course designed to introduce you to the simple techniques of analysing demographic data in educational management. Data needed for the planning of any society service programme include data on human resources, that is, the demographic particulars of the clients system – size and natural rate increase of the population in need and the population served. Educational management must be able to analyze these data to discover trends and be able to manipulate keys variables to obtain different scenarios of the key social system. They equally needed to be proficient in analysing population data and making projections for the future. In this lecture, we focus on demographic analysis. We are focusing on the basic principles, concepts, analysis, techniques and applications of demography in relation to educational planning. In doing these, we have endeavoured to make the issues clear and our treatment brief. Our approach in this lecture (course work) is new and innovative. It is a six – tier approach: introduction, objectives, pre-test, main text summary and post-test. Our treatment of each lecture is in line with this format.
Course outcomes Upon completion of Analysis of Demographic Data in Educational ManagementEME204, you will be able to:
discuss the nature of demography; define some key terms and concepts in demography; understand some basic techniques in analysing demographic data; appreciate the uses of demographic data in educational

EME204 Analysis of Demographic Data in Educational Management
4
Outcomes management; identify the problems and sources of demographic data in Africa; explain the methods of measuring natality; explain the methods of measuring mortality; measure population growth; forecast school population; analyze population structure; identify the effects of population structure on education; relate demography with school enrolment; carry out mathematical computation on basic indices relating to
school enrolment; analyze some basic rates which contribute to the efficiency of the
educational system; calculate the average annual growth rate in population examine the relative value of demographic data detect census errors adjust the age-pyramid; determine population distribution and school locational planning.


6
EME204 Analysis of Demographic Data in Educational Management
Getting around this course manual
Margin icons While working through this course manual you will notice the frequent use of margin icons. These icons serve to “signpost” a particular piece of text, a new task or change in activity; they have been included to help you to find your way around this course manual.
A complete icon set is shown below. We suggest that you familiarize yourself with the icons and their meaning before starting your study.
Activity Assessment Assignment Case study
Discussion Group Activity Help Outcomes
Note Reflection Reading Study skills
Summary Terminology Time Tip

Study Session 1The Nature of Demography
7
Demography
The study of the characteristics of human populations, such as size, growth, density, distribution, and vital statistics.
Study Session 1
The Nature of Demography Introduction
In this study session, we will be looking at the nature of demography. We will start by defining what demography is. Thereafter, we will highlight and discuss some of the basic concepts that are important in the study of demography.
Learning Outcomes
Outcomes
When you have studied this session, you should be able to:
1.1 define demography
1.2 discuss some of the basic concepts in demography
Terminology Demography The study of statistics such as births, deaths, income, or
the incidence of disease, which illustrate the changing structure of human populations.
Population The number of all the organisms of the same group or species, which live in a particular geographical area, and have the capability of interbreeding.
Statistics The mathematical science involved in the application of quantitative principles to the collection, analysis, and presentation of numerical data.
1.1 What is Demography? As earlier noted, we will start this study session by looking at what demography means. For some of you, demography is a new concept that you are just hearing for the first time. Whereas for other, it is not. Demography is derived from two Greek words namely ‘Demas’ meaning ‘people’, and ‘Grapho’ meaning ‘to draw or write’. Thus, Demography means to draw or write about people. The fusion of the two words initially traced to Achilles Guilllard in 1855 in his book ‘Elements de statistique humaine en demographic camparee’. Simply put, demography

8
EME204 Analysis of Demographic Data in Educational Management
is the study of statistical methods of human population involving primarily the measurement of the size, growth and diminution of the numbers of the people, the proportion of living beings born or dying within the same area or region and the related functions of fertility, mortality, and marriage.
Figure 1.1 We might Consider a Demography of Lagos to know its growth rate (https://17350-
presscdn-0-16-pagely.netdna-ssl.com)
Since the Second World War, majority of the developing countries have experienced two interrelated phenomena having profound social and economic implications:
1. Populations have increased at an unprecedented rate; and 2. The demand for, the availability, and the expectation of education
have developed at a pace with no historic parallel.
With all the above in mind, this study session will focus on the nature of demography and its place in efficient and effective planning of education and definitions of some important concepts in demography.
ITQ
Question
The word demography is derived from two Latin words; demas and grapho. What does these words mean?
Feedback
The word demas means people; while the word grapho means draw or write.
1.2 Basic Concepts in Demography As a planner, you will come across demographic concepts and terms in your day-to-day activities. It is, therefore, important to define some basic concepts in demography but before then, let us look at some examples of Nigeria’s demography.
Study Session 1The Nature of Demography
9
Population
The total number of people inhabiting a specific area.
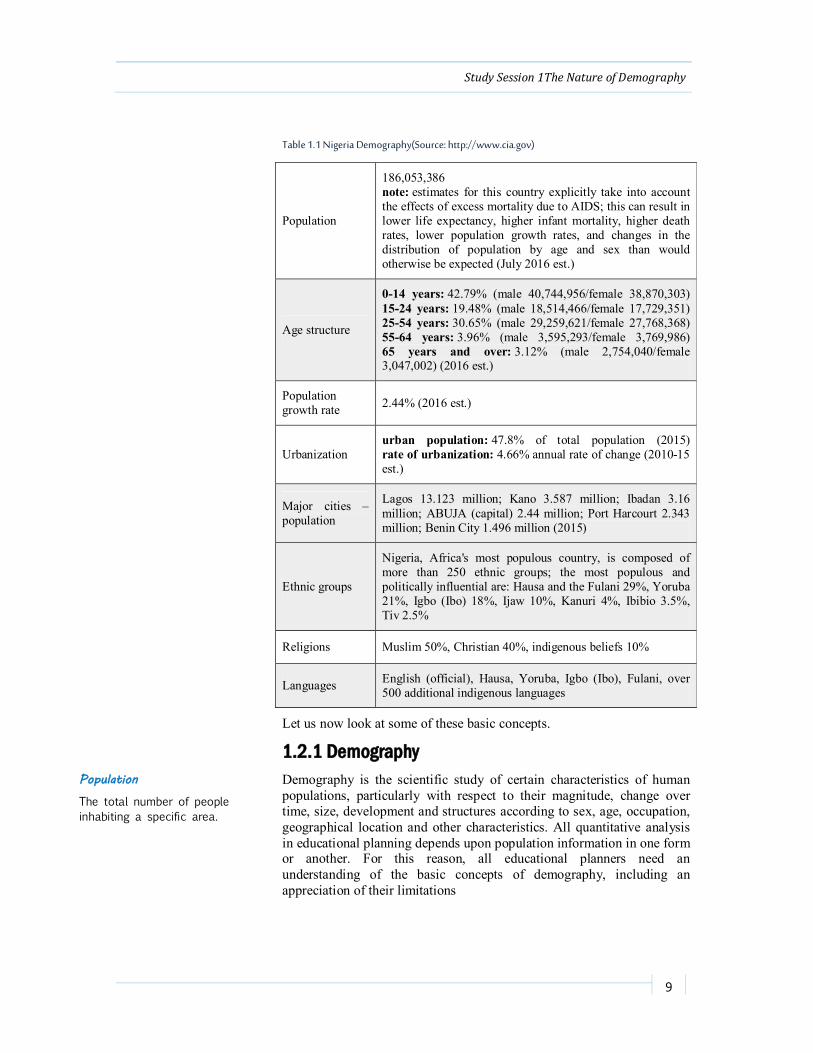
Table 1.1 Nigeria Demography(Source: http://www.cia.gov)
Population
186,053,386 note: estimates for this country explicitly take into account the effects of excess mortality due to AIDS; this can result in lower life expectancy, higher infant mortality, higher death rates, lower population growth rates, and changes in the distribution of population by age and sex than would otherwise be expected (July 2016 est.)
Age structure
0-14 years: 42.79% (male 40,744,956/female 38,870,303) 15-24 years: 19.48% (male 18,514,466/female 17,729,351) 25-54 years: 30.65% (male 29,259,621/female 27,768,368) 55-64 years: 3.96% (male 3,595,293/female 3,769,986) 65 years and over: 3.12% (male 2,754,040/female 3,047,002) (2016 est.)
Population growth rate 2.44% (2016 est.)
Urbanization urban population: 47.8% of total population (2015) rate of urbanization: 4.66% annual rate of change (2010-15 est.)
Major cities – population
Lagos 13.123 million; Kano 3.587 million; Ibadan 3.16 million; ABUJA (capital) 2.44 million; Port Harcourt 2.343 million; Benin City 1.496 million (2015)
Ethnic groups
Nigeria, Africa's most populous country, is composed of more than 250 ethnic groups; the most populous and politically influential are: Hausa and the Fulani 29%, Yoruba 21%, Igbo (Ibo) 18%, Ijaw 10%, Kanuri 4%, Ibibio 3.5%, Tiv 2.5%
Religions Muslim 50%, Christian 40%, indigenous beliefs 10%
Languages English (official), Hausa, Yoruba, Igbo (Ibo), Fulani, over 500 additional indigenous languages
Let us now look at some of these basic concepts.
1.2.1 Demography Demography is the scientific study of certain characteristics of human populations, particularly with respect to their magnitude, change over time, size, development and structures according to sex, age, occupation, geographical location and other characteristics. All quantitative analysis in educational planning depends upon population information in one form or another. For this reason, all educational planners need an understanding of the basic concepts of demography, including an appreciation of their limitations
10
EME204 Analysis of Demographic Data in Educational Management
1.2.2 Population In statistical terms, any collection of distinct elements may be referred to as a population or universe. The population of a particular area consists of all the inhabitants of that area, though it is applied to a specific group only, e.g. the school-age population, the teaching force, etc. The findings of demography are one of the foundations on which educational plans are built and for this reason, planners should have a sufficient knowledge of demography methods and concepts, their meanings and limitations. Nearly all quantitative analyses and estimates of the quantitative aspects of education are related to population, its size, structure, location, dynamics and prospects. The validity of analyses and estimates – beyond the purely mathematical operations, depend on:
1. Its logical consistency, 2. The assumptions made, 3. The quality of the basic data.
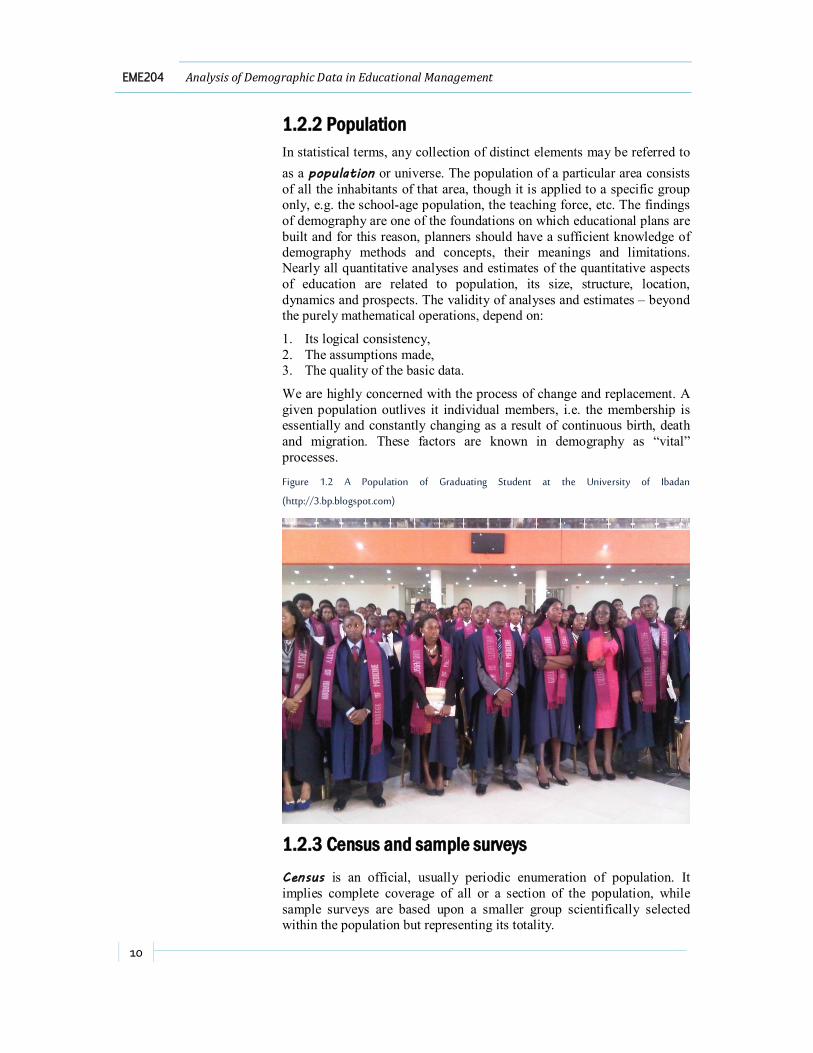
We are highly concerned with the process of change and replacement. A given population outlives it individual members, i.e. the membership is essentially and constantly changing as a result of continuous birth, death and migration. These factors are known in demography as “vital” processes.
Figure 1.2 A Population of Graduating Student at the University of Ibadan
(http://3.bp.blogspot.com)
1.2.3 Census and sample surveys Census is an official, usually periodic enumeration of population. It implies complete coverage of all or a section of the population, while sample surveys are based upon a smaller group scientifically selected within the population but representing its totality.

Study Session 1The Nature of Demography
11
Figure 1.3 A census can show the whole population of Nigerians while a survey could show the
number of unemployed youth (http://thesheet.ng)
1.2.4 Vital processes The elements of a population group keep changing through processes of replacement. While some elements of a population group are withdrawing through death and emigration, new elements are flowing in through birth and immigration. The processes of continuous births, deaths and immigration are referred to as vital processes in demography.
1.2.5 Vital statistics These are data dealing with the vital processes, i.e. data dealing with the processes of entry into and departure from a population group elements making up the population. There are three major events producing the vital statistics; birth, death and migration.
ITQ
Question
What is census?
Feedback
A census is the procedure of systematically acquiring and recording information about the members of a given population.
Other concepts that we should still be mindful of includes:
1. Vital registration: It represents a non-conventional system of collecting vital statistics. The recording of vital events such as births, deaths, marriages, migration, etc. on a continuous basis in the various public departments and private organizations is called vital registration.
2. De-facto Enumeration: There are two main approaches to census enumeration. De-facto enumeration refers to the counting of people, wherever they may be found at a particular time such as on a census day. A major shortcoming of this approach is that it tends to under-estimate the actual population, as there could be some people in transit at reference time e.g. salespersons, drivers and travellers. All national residing abroad and are also excluded.
3. De-jure Enumeration: This is the counting of people in their usual place of residence. The pitfall of this method is that people who are

12
EME204 Analysis of Demographic Data in Educational Management
highly residentially mobile may be doubly counted if enumeration lasts for several hours. In practice, both approaches are often synthesized so as to minimize counting errors.
4. Error detection: A number of tests are available for detecting systematic errors in enumeration such as inaccurate distribution of age which could occur because of:
i. false statement made by those who do not know how old they are;
ii. false statements made by those who do not want their true ages to be known
iii. false statements made by those who have digital preferences, for example, reporting ages in round figures such as 0’s and 5’s.
5. Rates and ratios: For some purpose, expressing demographic data in actual or absolute numbers is tolerable. Sometimes, however, we need to measure numerical data in relation to other numbers. Rates and ratios provide the measurement of demography by which behaviour in one section of the population can be compared with that of another. A ratio is a quotient that indicates the relation in size of one number to another. A proportion is a ratio indicating the relation in magnitude of one part to the whole. A percentage is a proportion in a hundred. A rate is a ratio used to indicate the relative frequency of the occurrence of a particular event within a population of sub-groups, rates and ratios are often expressed in per thousand terms in demographic analysis.
6. Specific rates and crude rates: For many purposes, the population of a given area has to be broken down into different sub-groups. Rates calculated for such sub-groups are called specific rates as opposed to crude rates or general rates, which apply to the whole population as a whole.
ITQ
Question
Under vital registration, what type of registrations are considered vital?
Feedback
Vital registration involves the registration of a population’s vital information like births, deaths, marriages, migration etc.
7. Fertility and mortality: Fertility is the capacity of initiating, sustain or supporting reproduction. It is the rate at which a given population is adding to itself by births. Mortality refers to the frequency of numbers of deaths in proportion to a given population.
8. Life expectancy: Life expectancy and survival rates are useful social indicators whose levels reflects the influence of factors such as levels of health conditions, social-cultural developments and general living standards. These two indicators are derivable from life tables. Life expectancy at any age indicates the length of life that an individual could expect at that age if mortality rates were constant. At birth (eo) it is a widely used social indicator. Table 1:2 presents the expectation of life at birth (eo) and other health related indicators in Nigeria.

Study Session 1The Nature of Demography
13
Table1.2: Health Related Demography of Nigeria(Source: http://www.cia.gov)
Mother's mean age at first birth
20.3 note: median age at first birth among women 25-29 (2013 est.)
Infant mortality rate total: 71.2 deaths/1,000 live births male: 76 deaths/1,000 live births female: 66.2 deaths/1,000 live births (2016 est.)
Life expectancy at birth total population: 53.4 years male: 52.4 years female: 54.5 years (2016 est.)
Total fertility rate 5.13 children born/woman (2016 est.)
Contraceptive prevalence rate 15.1% (2013)
HIV/AIDS - adult prevalence rate 3.17% (2014 est.)
HIV/AIDS - people living with HIV/AIDS 3,391,600 (2014 est.)
HIV/AIDS – deaths 174,300 (2014 est.)
Drinking water source
improved: urban: 80.8% of population rural: 57.3% of population total: 68.5% of population unimproved: urban: 19.2% of population rural: 42.7% of population total: 31.5% of population (2015 est.)
Sanitation facility access
improved: urban: 32.8% of population rural: 25.4% of population total: 29% of population unimproved: urban: 67.2% of population rural: 74.6% of population total: 71% of population (2015 est.)
There are two other concepts that are worthy if note. This are the survival rate and life table. for us to know what this two mean, let us look at the activity 1.1 below.
14
EME204 Analysis of Demographic Data in Educational Management
Activity
Activity 1.1Survival Rate Vs. Life Table
This activity will be discussing two major concepts that we must consider when discussing demography. Go through the text and answer the question therein.
Survival Rate
Survival rate is defined as the percent of people who survive a disease such as cancer for a specified amount of time. For example, if the 5-year survival rate for a particular cancer is 34 percent, this means that 34 out of 100 people initially diagnosed with that cancer would be alive after 5 years.
Life Tables
A life table is a death rate experienced by a population group during a chosen period of time and the demographic data that can be inferred from the death rate, all expressed in a tabular form. The basis of the table, the mortality rate is symbolized as q. The decimal qx is the probability of dying between the any age x and age x+1, where x ranges from zero to the longest duration of life.Once qxis established the other value in the table, such as death (dx) and survivors (1x) can be computed by using a hypothetical cohort of say, 10,000 persons and working out the demographic particulars in the cohort till the death of the lasts person in the cohort. Thus, it is contrived that the cohort loses a given proportion at each age. Life tables assume that a cohort loses membership only through death. Deaths are randomly and evenly distributed overtime and they occur at each age according to fixed schedule.
If after 5 years, 20% of the people diagnosed with HIV/Aids survives, what rate do we call this?
Discussion:
The rate at which the diagnosed patient survives is what we refer to as survival rate. Survival rate is a part of survival analysis. It is the percentage of people in a study or treatment group still alive for a given period after diagnosis. Survival rates are important for prognosis but because the rate is based on the population as a whole, an individual prognosis may be different depending on newer treatments since the last statistical analysis as well as the overall general health of the patient.
Study Session 1The Nature of Demography
15
Study Session Summary
Summary
In this Study Session, an attempt has been made to provide definitions for some terminologies frequently employed in demography and in demographic analysis. We have also tried to explain some concepts that are basic to the study of the discipline. To make the reader feel more confident and at home with the new terms, simple techniques for estimating the parameters and practical illustrations were also provided. These are done so as to set a base for a proper development of the course- Techniques in Analysing Demographic Data.
Assessment
Assessment
SAQ 1.1 (tests Learning Outcome 1.1) So many people will misuse the word population for demography. In your own words, describe what demography means.
SAQ 1.2 (tests Learning Outcome 1.2) There are many concepts used when the issue of demography arises. Some of these concepts are highlighted below. Discuss any of three of them. 1. Population 2. Census 3. Vital process 4. Survival rate 5. Vital statistics
Bibliography
Reading
CIA (2017). The world fact book: Nigeria. http://www.cia.gov/library/publications/the-world-fact-book/nigeria
Essay24.com (2017). Definition, Nature, Scope and importance of Demography. www.essay24.com/social-issues/definition-nature-scope-and-importance-of-demography/47935.html
Owolabi, J. (2001). ‘Curriculum planning and manpower development in Nigeria’. A paper presented at the Annual Conference of the Nigerian Association for Educational Administration and Planning, held at the University of Benin, Benin City, Nigeria, October 29th-November 1st , 2001

16
EME204 Analysis of Demographic Data in Educational Management
Study Session 2
Techniques in Demography Introduction
In the previous study session, we focused on definitions of demography, some of its basic concepts and terms commonly used in demographic analysis. These concepts and terms are basic to the study of demography in relation to educational planning. In this study session, our focus is on computational techniques of the basic concepts commonly used in demographic analysis. We need to understand these techniques before looking at the practical applications of such concepts in educational planning.
Learning Outcomes
Outcomes
When you have studied this session, you should be able to:
2.1 highlight different computation techniques
Terminology Sex ratio The proportion of males to females in a given population,
usually expressed as the number of males per 100 females at a specific stage in life, especially at conception, birth, and a given stage between birth and death.
Fertility rate The ratio of live births in an area to the population of that area; expressed per 1000 population per year.
Study Session 2Techniques in Demography
17
Computational Technique
Mathematical models used to numerically study the behaviour of complex systems by means of a computer simulation.
Sex ratio
The ratio of males to females in a population.
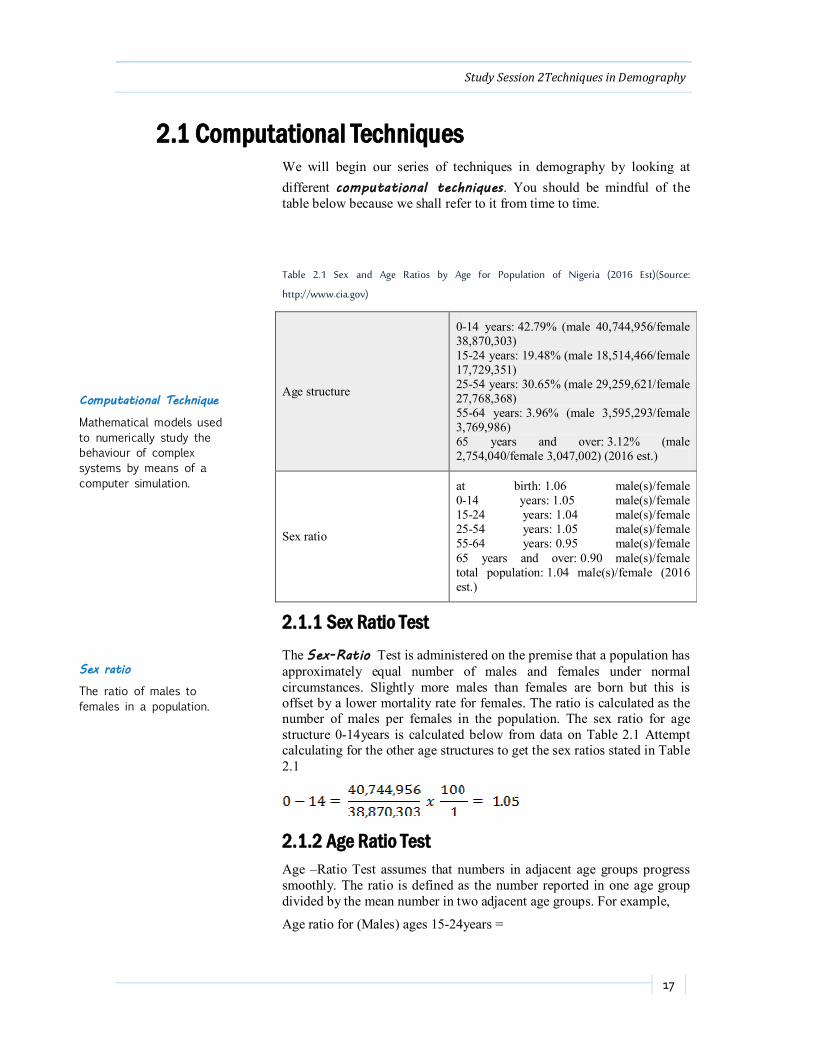
2.1 Computational Techniques We will begin our series of techniques in demography by looking at different computational techniques. You should be mindful of the table below because we shall refer to it from time to time.
Table 2.1 Sex and Age Ratios by Age for Population of Nigeria (2016 Est)(Source:
http://www.cia.gov)
Age structure
0-14 years: 42.79% (male 40,744,956/female 38,870,303) 15-24 years: 19.48% (male 18,514,466/female 17,729,351) 25-54 years: 30.65% (male 29,259,621/female 27,768,368) 55-64 years: 3.96% (male 3,595,293/female 3,769,986) 65 years and over: 3.12% (male 2,754,040/female 3,047,002) (2016 est.)
Sex ratio
at birth: 1.06 male(s)/female 0-14 years: 1.05 male(s)/female 15-24 years: 1.04 male(s)/female 25-54 years: 1.05 male(s)/female 55-64 years: 0.95 male(s)/female 65 years and over: 0.90 male(s)/female total population: 1.04 male(s)/female (2016 est.)
2.1.1 Sex Ratio Test The Sex-Ratio Test is administered on the premise that a population has approximately equal number of males and females under normal circumstances. Slightly more males than females are born but this is offset by a lower mortality rate for females. The ratio is calculated as the number of males per females in the population. The sex ratio for age structure 0-14years is calculated below from data on Table 2.1 Attempt calculating for the other age structures to get the sex ratios stated in Table 2.1
2.1.2 Age Ratio Test Age –Ratio Test assumes that numbers in adjacent age groups progress smoothly. The ratio is defined as the number reported in one age group divided by the mean number in two adjacent age groups. For example,
Age ratio for (Males) ages 15-24years =

18
EME204 Analysis of Demographic Data in Educational Management
Can you calculate the age ratio for males in the age structure of 25-54years and 55-64years?
2.1.3 Crude Birth Rate This is the number of live births occurring in a group in a given year divided by the estimated, mid-year population of that group. (It is a popular convention in demography to use mid-year figures, which can be obtained by simple interpretation:
Where:
= the population statistics at the beginning of year
t1 and t2 is the statistics at the beginning of year (t +1)
Symbolically,
Where B Number of live births in a year
P Total mid-year population in the same year
K An arbitrary constant per which we like to express our rates. K is often assumed to be 1000.
ITQ
Question
In an hypothetical country called Batule, the following data was gathered:
1. B 62,000 number of live births in 2014 2. P 2,000,000 estimated mid-year population obtained by adding
January 2014 and 2015 population respectively and dividing by 2
K 1000 (a constant)
Feedback
In 2014, there were 31 births per 1000 Batulese.
2.1.4 Crude Death Rate Death is the extinction of a population element through termination of life. Crude Death Rate is the number of deaths occurring in a group, in

Study Session 2Techniques in Demography
19
a given year divided by the estimated mid-year population of that group and expressed as rates per 1000 population.
Symbolically,
Where:
D Number of deaths in a year
P Total mid-year population in the same year
K 1000 (a constant)
Example 2.1 In Batule, there was;
D 18,000 number of deaths in 2014
P 2,000,000 estimated mid-year population in 2014.
Therefore,
In 2014 there were 9 deaths per 1,000 Batulese.
Table 2.2: Hypothetical CBR, CDR and Rates of Natural Increase in the Major Regions, 2010 -
2015
Region CBR CDR Rate of Natural Increase
World Total 31.8 12.8 19.0
More Developed Regions 17.2 9.2 8.0
Less Developed Regions 37.8 14.4 23.4
South Asia 42.7 16.8 25.9
East Asia 26.0 9.8 16.2
Africa 46.5 20.0 26.5
Latin America 36.7 9.2 27.5
2.1.5 Natural Increase In a society where it is assumed that there is no migration, the balance of births and deaths represent population growth or decline. In real life
20
EME204 Analysis of Demographic Data in Educational Management
Fertility rate
The number of offspring born per mating pair, individual or population.
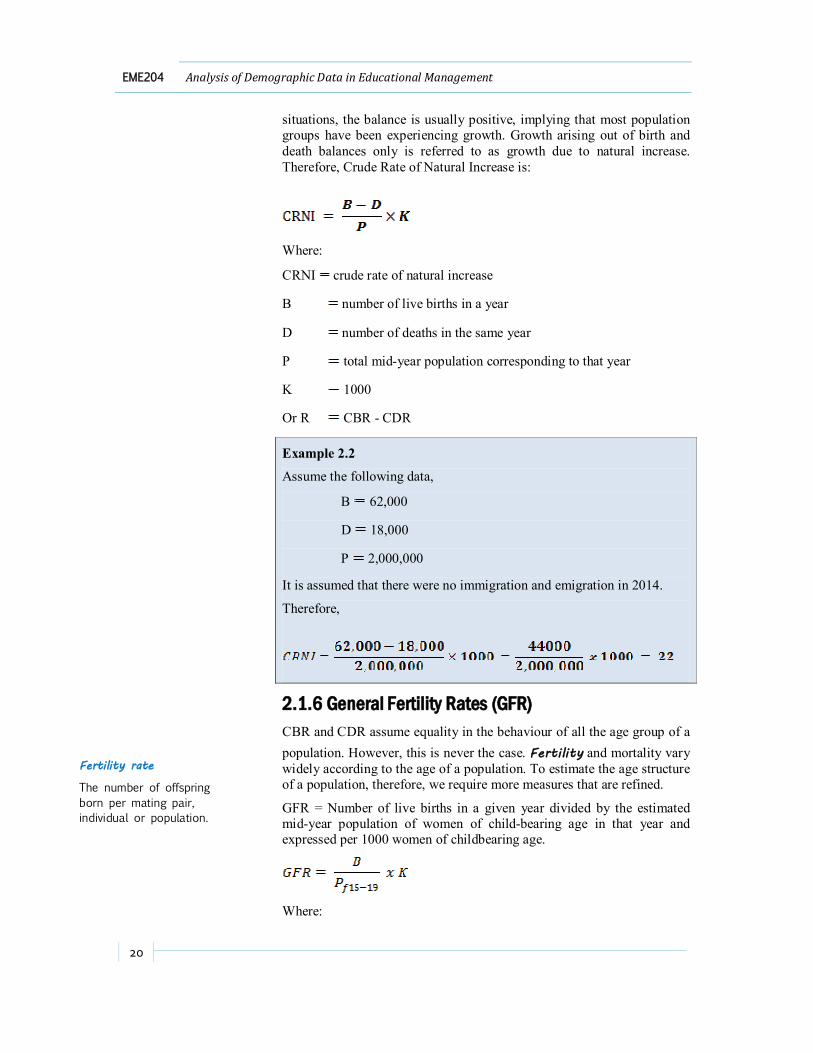
situations, the balance is usually positive, implying that most population groups have been experiencing growth. Growth arising out of birth and death balances only is referred to as growth due to natural increase. Therefore, Crude Rate of Natural Increase is:
Where:
CRNI crude rate of natural increase
B number of live births in a year
D number of deaths in the same year
P total mid-year population corresponding to that year
K 1000
Or R CBR - CDR
Example 2.2
Assume the following data,
B 62,000
D 18,000
P 2,000,000
It is assumed that there were no immigration and emigration in 2014.
Therefore,
2.1.6 General Fertility Rates (GFR) CBR and CDR assume equality in the behaviour of all the age group of a population. However, this is never the case. Fertility and mortality vary widely according to the age of a population. To estimate the age structure of a population, therefore, we require more measures that are refined.
GFR = Number of live births in a given year divided by the estimated mid-year population of women of child-bearing age in that year and expressed per 1000 women of childbearing age.
Where:
Study Session 2Techniques in Demography
21
B = total number of live births in a year
Pf15-49 = estimated mid-year population of women of child-bearing age (15-49)
K = 1000
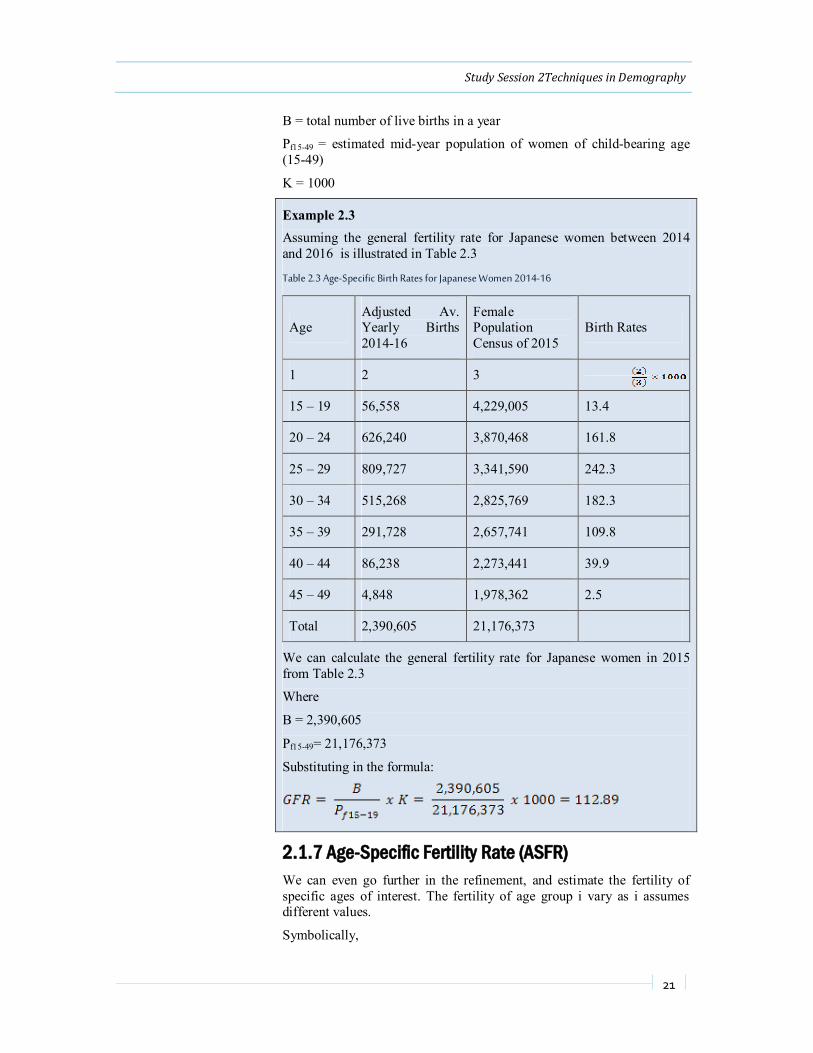
Example 2.3 Assuming the general fertility rate for Japanese women between 2014 and 2016 is illustrated in Table 2.3
Table 2.3 Age-Specific Birth Rates for Japanese Women 2014-16
Age Adjusted Av. Yearly Births 2014-16
Female Population Census of 2015
Birth Rates
1 2 3
15 – 19 56,558 4,229,005 13.4
20 – 24 626,240 3,870,468 161.8
25 – 29 809,727 3,341,590 242.3
30 – 34 515,268 2,825,769 182.3
35 – 39 291,728 2,657,741 109.8
40 – 44 86,238 2,273,441 39.9
45 – 49 4,848 1,978,362 2.5
Total 2,390,605 21,176,373
We can calculate the general fertility rate for Japanese women in 2015 from Table 2.3
Where
B = 2,390,605
Pf15-49= 21,176,373
Substituting in the formula:
2.1.7 Age-Specific Fertility Rate (ASFR) We can even go further in the refinement, and estimate the fertility of specific ages of interest. The fertility of age group i vary as i assumes different values.
Symbolically,

22
EME204 Analysis of Demographic Data in Educational Management
Where:
Bi = number of live births born to women who belong to the age group i during the year.
Pf i = estimated mid-year population of women of age-group i in that year
K = 1000.
ITQ
Question
The age-specific fertility rate for Japanese women in the age group 20-24. Calculate the ASFR
Feedback
.
2.1.8 Age-Specific Death Rate (ASDR) Another refined measure (this time) of mortality is the Age-Specific Death Rate (ASDR). With this measure, we can know the mortality differentials that a population experiences at different ages.
ASDR number of deaths in an age group in a year divided by the total estimated mid-year population of the age group in the same year multiplied by 1000.
Therefore,
where:
Di = number of deaths in the ith age-group in a year total estimated mid-year
Pi = population of the ith age-group in the same year
K = 1000

Study Session 2Techniques in Demography
23
Table 2.4Hypothetical Age-Specific Death Rates for the population of Nigeria Both Sexes 2005-
2007
Age Population Census of 2006
Average Yearly Deaths 2005-05
Death Rate per 1000 population
1 2 3 (3/2) x 1000
1-4 700,762 20,683 29.5
5-9 811,363 5,451 6.7
10-14 805,642 2,589 3.2
15-19 680,614 3,345 4.9
20-24 641,571 5,104 8
25-34 1,027,405 9,305 9.1
35-44 790,514 8,775 11.1
45-54 515,695 8,209 15.9
55-64 293,598 8,075 27.5
65 and above 229,498 21,958 95.7
All Ages 6,657,339 125,803 18.9
2.1.9 Infant Death Rate (IDR) The survival rate of newly born infants may be an indication of the standard of living of people, the nutritional and health status of the mothers and the level of medical facilities obtainable in the society. Where these things are poor, high prenatal and puerperal facilities as well as high infant mortalities often result. The age-specific death rate for infants in their first year of life is therefore, of special interest to health development planners. This rate is sometimes called the Infant Mortality Rate or the Infant Death Rate and expressed as:

24
EME204 Analysis of Demographic Data in Educational Management
Where:
Do = number of deaths below age one during a year
B = number of live births in that year
K = 1000
Example 2.4
Assuming the reports on vital statistics in Nigeria for 2014 showed:
62,000 live births during the year and
8,280 death among infants
Therefore,
Study Session Summary
Summary
In this Study Session, we embarked on basic computational techniques, which are relevant to demographic analysis in relation to educational planning and development. We were able to derive the computational formulae for sex ratio, age ratio, crude birth rate, crude death rate, crude rate of natural increase, general fertility rate, age-specific death rate, and infant death rate (infant mortality rate).
Assessment
Assessment
SAQ 2.1 (tests Learning Outcome 2.1) Under computation techniques, we have many ways to use when dealing with demography. Discuss any two of these techniques.
Bibliography
Reading
Owolabi, J. (2001). ‘Curriculum planning and manpower development in Nigeria’. A paper presented at the Annual Conference of the Nigerian Association for Educational Administration and Planning, held at the University of Benin, Benin City, Nigeria, October 29th-November 1st , 2001
Owolabi J, (2006). Quantitative methods of educational planning. Makere University, Kampala. Lucky Odoni (Nig) Emterprises, Ogun,
Study Session 3Use of Demographic Analysis
25
Nigeria.
Study Session 3
Use of Demographic Analysis Introduction
In this study session, we will be examining the many uses of demographic analysis.
Learning Outcomes
Outcomes
When you have studied this session, you should be able to:
3.1 highlight the different uses of demographic analysis
Terminology Manpower Total supply of personnel available or engaged for a
specific job or task.
3.1 The Uses of Demographic Analysis It is a general believe among all educational planners that all educators must have a working knowledge of demographic analysis and appreciate its limitation. For a proper understanding of the study of demography, it is essential to begin by identifying the usefulness of the concept.
Note
Educational planners base their projection on demographic analysis and results.
In general, analysis of demographic data is often required:
3.1.1 To Determine Programme Size Planners used to know the size of the target population in order to know the size of programmes the resources available can support. With the

26
EME204 Analysis of Demographic Data in Educational Management
Manpower
The number of people working or available for work or service.
knowledge, they will be in a better position to give suitable advice to policy makers on what programmes are feasible.
For example, an accurate knowledge of the size of school-age populations may assist planners and, subsequently, policy makers to know what extent educational services can be provided free by public authorities.
3.1.2 To make correct estimates of resources needs When planners are to work out ways and means of accommodating a given policy, the resources required will be functionally related to the size of the target population. Making appropriate estimates of resources will therefore depend on having a reliable knowledge of the number to be created for.
3.1.3 The proper allocation of resources The needs of development are many but resources are limited in supply. To make a fair distribution of the limited resources among alternative uses, in the context of egalitarianism, a good knowledge of the size of people to benefit and hence the size of social services programmes will be required.
3.1.3 For accurate manpower planning To set quantitative targets for the training of high-level manpower, where a set standard of living is to be attained, it is necessary to know the demographic characteristics of the inhabitants. For example, a government that desires to train a medical doctor per 1,000 people will require, first to know how many people there are, before deciding on the number of medical personnel to train. The structure of the population will also influence the type and size of the machinery to set up (e.g. schools) for the training of high-level manpower.
ITQ
Question
Why do educational planners need to know the size of the target population?
Feedback
Planners used to know the size of the target population in order to know the size of programmes the resources available can support.
3.1.4 For the organization of production A good knowledge of the size and the structure of a population is essential for production managers in order to be able to satisfy market demands and maximize business profits. Some educational programmes, especially in the private sector, are run on business lines. All ventures (including some education programmes) that are considered as

Study Session 3Use of Demographic Analysis
27
investments should be business oriented. The managers of such programmes may be able to organize production better and maximize returns on investments, if they are able to have accurate knowledge of the nature and size of potential markets.
3.1.5 To show long-term trends Projections are crucial to all planning activities. Enrolment projections are at the heart of almost all aspects of educational planning. By projecting school enrolment figures we are able to gain insights into the long-term implications of the past trends of parameters determining enrolment and possible future changes in these parameters. The enrolment projections permit a numerical assessment of the future intake, and number of school leavers. In particular they throw light on the feasibility of teaching specific national goals. They also serve as a basis for the quantification of future resource requirements in terms of teachers, school buildings and finance. They may indicate the need for adjusting the targets or changing educational policies.
3.1.6 To aid research studies Demographic analyses of populations are of interest to social scientists that make scientific inquiries into social behaviour of groups. Many of their research studies are based on proper analysis of the size structure and distribution of social groups. For example, you can determine the size of a sample that will be representative of a given population universe only when you know the size of the universe.
3.1.7 As a basic requirement for school mapping School mapping is the process of identifying the sites where educational facilities are to be located. Since the spatial distribution of a population will provide clues as to how schools should be sited in the various communities of the population group, an analysis of population distribution is necessarily a pre-condition for a good mapping of schools.
3.1.8 To add evaluation of human development projects To know the extent to which an objective has been achieved or to assess the performance of a public institution in charge of a particular programme, the client size of the target population and the size of the population served will permit the calculation of the extent of the programme coverage.
3.1.9 To satisfy human curiosity and thirst for knowledge The demographic characteristics of human groups is often desired even by laymen since human beings are naturally curious to know about the composition of their social group, its status ranking in the comity of nations with respect to size, structure and social standing. This information is desired not only by members of a social group but also by members of other social groups, as it helps in understanding better the world in which we live.

28
EME204 Analysis of Demographic Data in Educational Management
Briefly, planning can only be realistic if it is based on some reliable statistical description of the system and on a careful study of trends, so as to be able to forestall resource requirements and monitor measurable performance in the execution of planned projects.
Study Session Summary
Summary
In this Study Session, we examined the different uses of demographic analysis.
Assessment
Assessment
SAQ 3.1 (tests Learning Outcome 3.1) Give at least five uses of demographic analysis.
Bibliography
Reading
Essay24.com (2017). Definition, Nature, Scope and importance of Demography. www.essay24.com/social-issues/definition-nature-scope-and-importance-of-demography/47935.html
Owolabi, J. (2001). ‘Statistical models and projections in educational management’ in Okunola P.O. (ed). Theory and practice of educational management, Oyo, Nigeria: OYSCEI
Owolabi, J. (2001). ‘Curriculum planning and manpower development in Nigeria’. A paper presented at the Annual Conference of the Nigerian Association for Educational Administration and Planning, held at the University of Benin, Benin City, Nigeria, October 29th-November 1st , 2001
Owolabi J, (2006). Quantitative methods of educational planning. Makere University, kampala. Lucky Odoni (Nig) Emterprises, Ogun, Nigeria.

Study Session 4Demographic Data in Africa
29
Demographic data
The Decennial Census and other surveys of individuals and households administered by the Census Bureau.
Study Session 4
Demographic Data in Africa Introduction
In this study session, we will be discussing the demographic data in Africa. We will be explaining why the demographic data in African countries are unreliable and inaccurate. We will also look at the different sources of demographic data in Africa.
Learning Outcomes
Outcomes
When you have studied this session, you should be able to:
4.1 explain the poverty of demographic data in Africa
4.2 highlight sources of data
Terminology Demographic data
Data that is statistically socio-economic in nature such as population, race, income, education and employment, which represent specific geographic locations and are often associated with time.
Sample survey A survey which is carried out using a sampling method, i.e. in which a portion only, and not the whole population is surveyed.
Poll tax Also known as head tax or capitation, is a tax levied as a fixed sum on every liable individual.
4.1 Poverty of Demographic Data in Africa Educational managers in Africa are handicapped by lack of accurate statistical figures. Most population data in the continent of Africa are inadequate as they are unreliable. Quantitative estimates of educational targets are often based on speculative rather than on valid figures. This explains why failures to reach anticipated targets of quantitative achievements are common and frequent in African countries. The poverty of demographic data on the African continent has two dimensions.

30
EME204 Analysis of Demographic Data in Educational Management
To know what this two dimensions are, engage with the activity below and answer the question that follows.
Activity
Activity 4.1
Most African country has a system of civil registration capable of producing any worthwhile demographic statistics on a national level. Thus, all demographic estimates for a country are based on the often-inaccurate national censuses. In these censuses, the numbers of questions asked are restricted to the barest minimum to simplify the exercises and ensure rapid releases of basic data. The simplification often leads to loss of some useful information that are not rapidly apparent to the census administrators. For example, no Nigerian census ever had accurate information on the literacy status of the population. Census enumeration in Africa is bedevilled by so much technical, material, organizational, psychological and political problems that the demographic data obtained from the census figures are usually subject to wide margins of error.
From the above article, can you summarize the two dimensions that the poverty of demographic data had on the African continent?
Discussion:
To summarise the two dimensions that poverty of demographic data had on the African continent, we can write thus:
1. The demographic information available is scanty. 2. The demographic information available are unreliable
From the above article, we would discover that the demographic data available to the African continent is either scanty or unreliable. As such, let us break down the problems we have noted.
4.1.1 Technical Problems Conducting census by self-enumeration has not been possible in Africa because of the low literacy ratios. Unlike censuses in some other regions of the world, the physical presence of the enumeration is required. The questionnaires have to be interviewed-administered. This poses the problem of location (where to meet the people). By de-facto techniques, the enumerator counts persons at the place where they are physically present at a particular time, such as on a census night. This tends to underestimate the actual population as there could be some people in transit at the stated time- travellers, salesmen, drivers, cattle drovers and tramps (those who may be on ship in territorial waters at airports, etc). By de-jure enumeration, people are counted in their usual place of residence. But many Africans do have more than one place of residence. The pitfall of this method, therefore, is that people who are highly residentially mobile may be counted twice if enumeration lasts for several hours. Attempts to continue the definition of “usual place of residence” to mean

Study Session 4Demographic Data in Africa
31
parental home will distort actual population situations, overestimating the population of the source region of city migrants while seriously underestimating the population of the city and to some extent the administrative regions encompassing those cities. The Nigerian census of 1952/53 used the technique of de-facto enumeration while the subsequent were more or less mixtures of de-facto and de-jure enumeration techniques.
4.1.2 Material Problem If other things are equal, the shorter the duration of a census exercise the more valid the results. However, infrastructural facilities in Africa make easy and quick contact with isolated and far away regions difficult. Providing adequate number of helicopters to resolve the problem of poor transportation and communication networks is not within the material capacity of any African government. The duration of census exercises are unavoidably longer than desired and even then, whole ethnic group are known to have been left out of national counting exercises because they were not easily accessible.
4.1.3 Organizational Problems To produce adequate number of well-trained enumerators, provide them with necessary incentives to endure hardship and faithfully carry out assignment, and organize an efficient supervision and monitoring activity, is a task that has never been satisfactorily carried out by any African government.
4.1.4 Psychological Problems During the colonial administration, income tax assessment was based on the number of taxable adults in a community, calculated after an initial head-count of the members of that community. Africans, therefore, tended to link any form of head-counting with taxation and have always engaged various tactics to evade it. The pre-independence population figures in most African countries may therefore be an under-count.
4.1.5 Political Problems The multiple of ethnic grouping in every African country presents serious political problems that militate against any hope of accurate head-counting. The loyalty of any African is first to his small enclave- the clan, the cottage, or the village- then to his ethnic group or tribe and if he is an elite, who is aware of the geographical extent of a country created for him, his loyalty to the amorphous political unit exists in proportion to the amount of his nationalistic sentiments. By and large, the great majority of African put their tribes before their countries. There are therefore sub-nations within African nations that are rival groups that compete for political power at the centre. Since the centre are dependent on their population size, ethnic and other forms of sub-regional grouping have strong motives for inflating their sizes. Charges of inflated numbers are difficult to prove where there has never been any census accepted by all as fair. In the 1973, 1991, and 2006 census exercises in Nigeria, population figures were so much suspected to be unreasonably released

32
EME204 Analysis of Demographic Data in Educational Management
by the census board null and void. Numbers could be inflated when enumerators are induced to count ghost inhabitants, to duplicate or invent fictitious names, and when analysts decide to create their own figures instead of working with given data. International respectability for the validity of national census figures in Africa is yet very low. Educational managers are advised to devise alternative ways of collecting demographic data for their administrative units of interest, or use national data with great caution allowing for wide margins of errors that may arise as a result of inaccurate data base.
4.1.6 Cultural Problem In some African states, it is not customary to count the number of people living in a house; many parents desist from allowing their children to be counted.
ITQ
Question
How does political problem manifests itself in African demography?
Feedback
Political problem tends to occur in Africans demography when Citizens choose to pay their allegiance to a particular region, ethnic or sub-division within their territory instead of the collective interests of their respective countries. Whenever this arises, it undermines the effectiveness and efficiency to be achieved in a population census.
4.2 Sources of Demographic Data The number and socio-economic characteristics of a population can be computed from different documents originating from traditional sources such as:
Population Censuses, Sample Surveys are from non-traditional sources or vital registrations such as:
1. The Income Tax Register 2. School Enrolment Registers 3. Local Government Council Registers 4. Business registers 5. Registers of Religious Bodies;
Levels and tendencies in fertility as well as MORTALITY RATES can be obtained from:
1. Hospitals, Health and Maternity Centres. 2. Figure on in and out-migration are kept at: 3. Frontier Customs Posts 4. Air and Seaports
Study Session 4Demographic Data in Africa
33
Sample survey
A study that obtains data from a subset of a population, in order to estimate population attributes.
Poll tax
A tax levied on every adult, without reference to their income or resources.
4.2.1 Census Figures The decennial census reports of the Nigerian Census Bureau have been subject of heavy criticisms. During the colonial period, Nigerians tended to link any form of head counting with taxation and engaged various strategies to evade it. The pre-independence population figures are therefore most likely to be undercounts. This view was justified by subsequent events. Projections of the school-age population for the 1956 Western Nigerian free universal education was based on the colonial census figures. The number of school-age children far exceeded the projected numbers. On the other hand, the highly politicized post-independence census was bedevilled with a different direction of error. Population groups inflated their sizes by enumerating ghost inhabitants to be sure they would not over-swallowed by other tribes. The game became open that no declared figures of 1973 had to be cancelled to avert national crisis. The 2006 population census also generated arguments between the federal government and Lagos State government. Nigeria’s census figures are now believed to be on the low end of the international reliability spectrum. For administrative purposes therefore, public and private organizations treat official figures with much scepticism. For several purposes it may treat official figures with much scepticism. For several purposes it may be more expedient to ignore official releases and consult other sources.
4.2.2 Sample Surveys Alternative sources for estimating current population include sample surveys. Figures derived from random sampling procedures in localized areas, by international agencies (the World Bank, WHO, UNESCO, UNICEF), internationally reputable independent organizations (e.g. Population Reference Bureau Inc., Connecticut) and research fellows have been more reliable, despite their attendant sampling errors, than are the releases from Federal Census Bureau. The major weakness of sample surveys is that they are sporadic and they seldom cover the whole country. Cross-comparison of data from different areas are often difficult since the time-bases of data are usually different.
4.2.3 Tax Returns In rural areas, the finance departments of Local Government Councils have the responsibility of listing taxable adults and that of collecting poll tax from them. The arrangement for poll tax collection affords the LGAs the opportunity of recording the ward, the surname, other names, age, sex and occupation of non-wage earners between the ages of 15 and 60 who are neither in firm nor at school. Considering the high proportion of the self-employed in the rural sector, a well administered poll tax system can supply useful information about the demographic characteristics of rural inhabitants. Civil servants and workers in government parastatals, who constitute the bulk of salary earners, submit similar information through their pay-masters, to the in-land revenue offices.
34
EME204 Analysis of Demographic Data in Educational Management
The major limitation of this data source is the incidence of tax evasion. The last civilian interlude in the contemporary administration of the country attempted to eradicate poll-tax in many states. A complete eradication of poll-tax will pose serious limitations to the use of tax registers as a source of demographic data.
ITQ
Question
What is sample survey?
Feedback
A sample survey is a survey which is carried out using a sampling method, i.e. in which a portion only, and not the whole population is surveyed.
4.2.4 School Enrolment Registers Perhaps the most reliable statistical data in Nigeria is that emanating from educational institutions. In most cases school registers are well kept and information provided are highly reliable since no one stands to benefit from falsification of facts. Upon admission, information regarding the age, sex, place of birth, ethnic group, father’s and mother’s occupation is collected. The school enrolment register provide a ready source of data for cohort studies. The possible reduction of number in a cohort that would be due to transfers, repetition, drop-outs and deaths could provide information on relatives mortality and mobility rates in several generations. Extrapolation to the entire population of an age-group at state and national levels is possible.
4.2.5 Local Government Council registers The various registrations carried out at the local government offices can also provide limited but useful information on the demographic characteristics of the local inhabitants. The number and classification of traditional chiefs and emirs, the names of villages and wards, the number of councillors, the amount of poll tax collected in each precisely given. The last of this information may be an idea of the relative status of the economy in each council area.
4.2.6 Business Registers Every registered firm keeps staff records. These records often list names of employees and provide information on their ages, sexes, ethnic groups, marital status, number of wives and their assignments. Demographic data on such population groups are comprehensive and accessible. But these groups are fragments of the total population group, and in a pre-industrial society company employees are significantly small in number.
4.2.7 Religious Bodies Christian clergies and Quran teachers keep records of church and mosque members and students. They also keep registers of Baptisms, Weddings,
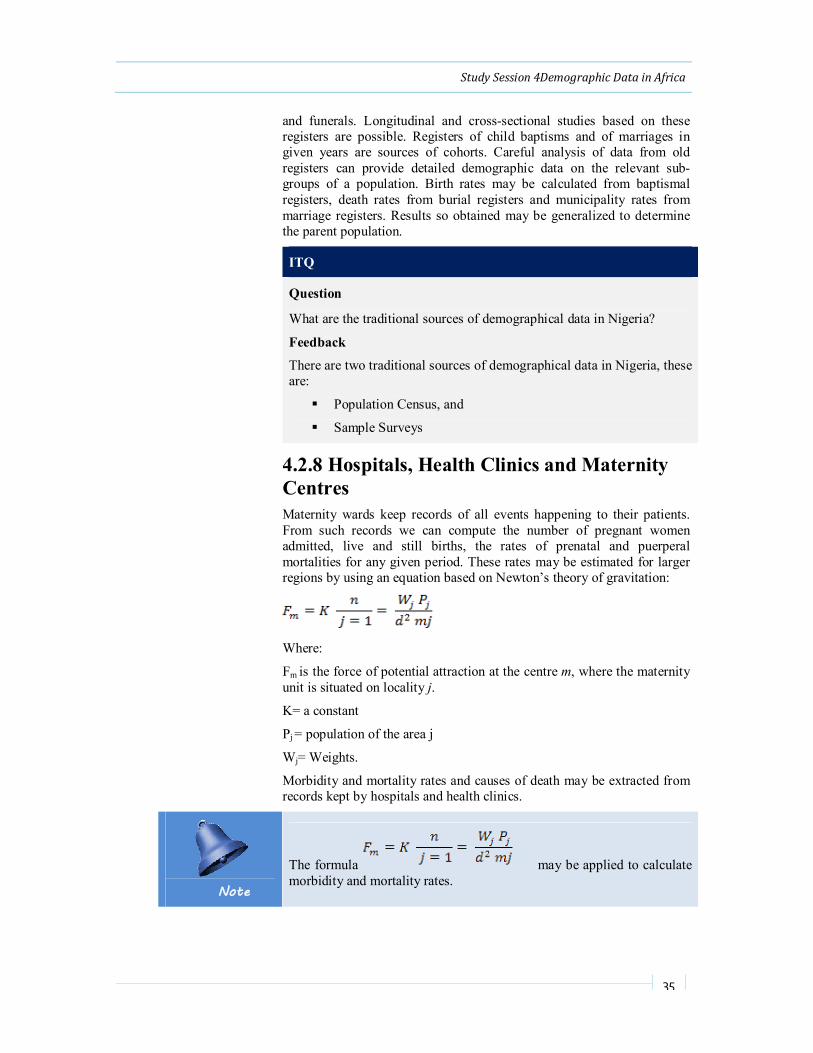
Study Session 4Demographic Data in Africa
35
and funerals. Longitudinal and cross-sectional studies based on these registers are possible. Registers of child baptisms and of marriages in given years are sources of cohorts. Careful analysis of data from old registers can provide detailed demographic data on the relevant sub-groups of a population. Birth rates may be calculated from baptismal registers, death rates from burial registers and municipality rates from marriage registers. Results so obtained may be generalized to determine the parent population.
ITQ
Question
What are the traditional sources of demographical data in Nigeria?
Feedback
There are two traditional sources of demographical data in Nigeria, these are:
Population Census, and
Sample Surveys
4.2.8 Hospitals, Health Clinics and Maternity Centres Maternity wards keep records of all events happening to their patients. From such records we can compute the number of pregnant women admitted, live and still births, the rates of prenatal and puerperal mortalities for any given period. These rates may be estimated for larger regions by using an equation based on Newton’s theory of gravitation:
Where:
Fm is the force of potential attraction at the centre m, where the maternity unit is situated on locality j.
K= a constant
Pj = population of the area j
Wj= Weights.
Morbidity and mortality rates and causes of death may be extracted from records kept by hospitals and health clinics.
Note
The formula may be applied to calculate morbidity and mortality rates.

36
EME204 Analysis of Demographic Data in Educational Management
4.2.9 Customs offices Emigrants and immigrants through air, sea ports and frontier customs posts are required to complete exit or entry records as part of customs formalities. Frequent analysis of the data contained in these records provides information on the demographic characteristics of the emigrants and immigrants.
Study Session Summary
Summary
In this Study Session, we examined the demographic data in Nigeria. We started by explaining the poverty of demographic data in Nigeria. Thereafter, we pointed out the different sources of demographic data.
Assessment
Assessment
SAQ 4.1 (tests Learning Outcome 4.1) Demographic data in African continent can be categorized as being insufficient and unreliable. Can you explain further?
SAQ 4.2 (tests Learning Outcome 4.2) Discuss, at least five, sources of demographic data.
Bibliography
Reading
Essay24.com (2017). Definition, Nature, Scope and importance of Demography. www.essay24.com/social-issues/definition-nature-scope-and-importance-of-demography/47935.html
Owolabi, J. (2001). ‘Statistical models and projections in educational management’ in Okunola P.O. (ed). Theory and practice of educational management, Oyo, Nigeria: OYSCEI
Owolabi, J. (2001). ‘Curriculum planning and manpower development in Nigeria’. A paper presented at the Annual Conference of the Nigerian Association for Educational Administration and Planning, held at the University of Benin, Benin City, Nigeria, October 29th-November 1st , 2001
Owolabi J, (2006). Quantitative methods of educational planning. Makere University, kampala. Lucky Odoni (Nig) Emterprises, Ogun, Nigeria.
Owolabi, S.O. (2000). School mapping for Ghana: training manual, Accra, Ghana. UNICEF

Study Session 5Methods of Measuring Natality
37
Natality
The birth rate within a population.
Study Session 5
Methods of Measuring Natality Introduction
In the last study session, we focus on demographic data in Africa – their problems and sources. In this study session, we will concentrate on the methods of measuring natality (a positive change in population size). The two major methods we will be using are the crude birth rate and fertility rate.
Learning Outcomes
Outcomes
When you have studied this session, you should be able to:
5.1 estimate natality
Terminology Natality The ratio of the number of births to the size of the
population; birth rate.
5.1 What is Natality? Have you heard the word “Natality” before? What of Mortality? That sounds more familiar. Well, we can say natality is the opposite of mortality. Simply put, natality is the birth rate within a population. When compared with the death or mortality rate, the growth or decrease in a population can be determined. The natality rate can be expressed as the number of births per 1,000 individuals in a population. Absolute natality indicates how many births there could potentially be in ideal
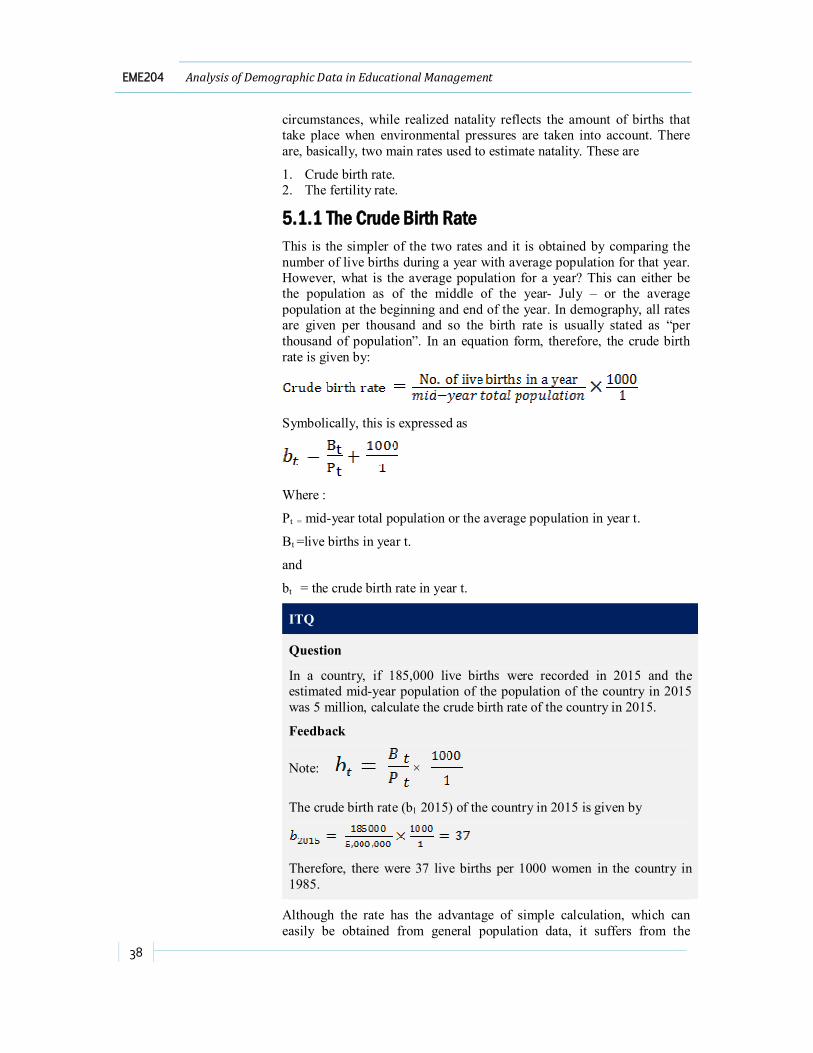
38
EME204 Analysis of Demographic Data in Educational Management
circumstances, while realized natality reflects the amount of births that take place when environmental pressures are taken into account. There are, basically, two main rates used to estimate natality. These are
1. Crude birth rate. 2. The fertility rate.
5.1.1 The Crude Birth Rate This is the simpler of the two rates and it is obtained by comparing the number of live births during a year with average population for that year. However, what is the average population for a year? This can either be the population as of the middle of the year- July – or the average population at the beginning and end of the year. In demography, all rates are given per thousand and so the birth rate is usually stated as “per thousand of population”. In an equation form, therefore, the crude birth rate is given by:
Symbolically, this is expressed as
Where :
Pt = mid-year total population or the average population in year t.
Bt =live births in year t.
and
bt = the crude birth rate in year t.
ITQ
Question
In a country, if 185,000 live births were recorded in 2015 and the estimated mid-year population of the population of the country in 2015 was 5 million, calculate the crude birth rate of the country in 2015.
Feedback
Note: ×
The crude birth rate (b1 2015) of the country in 2015 is given by
Therefore, there were 37 live births per 1000 women in the country in 1985.
Although the rate has the advantage of simple calculation, which can easily be obtained from general population data, it suffers from the
Study Session 5Methods of Measuring Natality
39
disadvantage that it gives the ratio of live births to the total population. This is indeed a crude measure, since only a part of the female population is of child bearing age, which is usually between the ages of 15 and 49 years of age. Thus, the crude birth rate may vary according to the age structure of the population, particularly the percentage of women of childbearing age in relation to the total population.
Note
The crude birth rate is an elementary statistic (measure or index) which requires only global information for its calculation. It is not calculated with any reference to the structure of the population, age in the population is an important factor in determining present and future population changes.
5.1.2 Fertility Rates Fertility measures the rate at which the population augments itself by births, relating birth to the number of females “at risks”, that is, of child-bearing age. There are two types of fertility rate:
1. The general fertility rate, and 2. Age-specific fertility rate.
The General Fertility Rate (GFR) This is defined as the number of live births in a year divide by mid-year population of women of child bearing potential multiplied by 1000.
Symbolically, this is expressed as:
Note
Often, the child bearing age is taken to be 15-49 years of age. It is called a general fertility rate because it attributes births to all women within these age limits.
Since there may be illegitimate births, there is further distinction between the general fertility and the legitimate fertility rates. When the total number of births is related to the total number of women of child-bearing potential, we have the general fertility rate. But, when the total number of live births is related to only married women this is known as legitimate fertility rate.
Thus, the equation forms of the above types of fertility rates can be stated as:
and,

40
EME204 Analysis of Demographic Data in Educational Management
Where,
Pf,t = female population in year t;
Pm,t = married women population in year t;
Bt = total number of live births in year t;
Bl,t = total number of legitimate live births in year t;
Fg,t = general fertility rate;
fl,t = the legitimate fertility rate.
The general fertility rate does not give an accurate idea of fertility. It fails to take into account the fact that fertility varies with age. Fertility is very strong in women between the ages of 20 and 30. For this reason, planners prefer to calculate fertility rate by age, since the fertility rate for population may be higher or lower for women aged 20-30 years old. The point being made here is that fertility is not constant over all years of child-bearing potential. A more aggregated measure of fertility is the age-specific fertility rate. Table 5.1 illustrate the calculation of an assumed Age-Specific Birth Rates using age structured from 0 –above 66years, adjusted average yearly births between 2014 and 2016, and average female population for the years
Table 5.1Age-Specific Birth Rates
Age Structure
1
Adjusted Ave, yearly Births 2014-2016 (B)
2
Female Population (Pf)
3
Birth Rates
(2/3) x 1000
0-14 100,000 38,870,303 2.57
15-24 5,020,780 17,729,351 283.19
25 – 54 8,900,000 27,768,368 320.51
55-64 300,000 3,769,986 79.58
66yrs and over 90,000 3,047,002 29.54
Total 14,410,780 91,185,010 158.04
From the above table, to calculate the general fertility rate for all women, irrespective of age structure, in 2016, the formula is:
i.e. approximately 715 births/1000
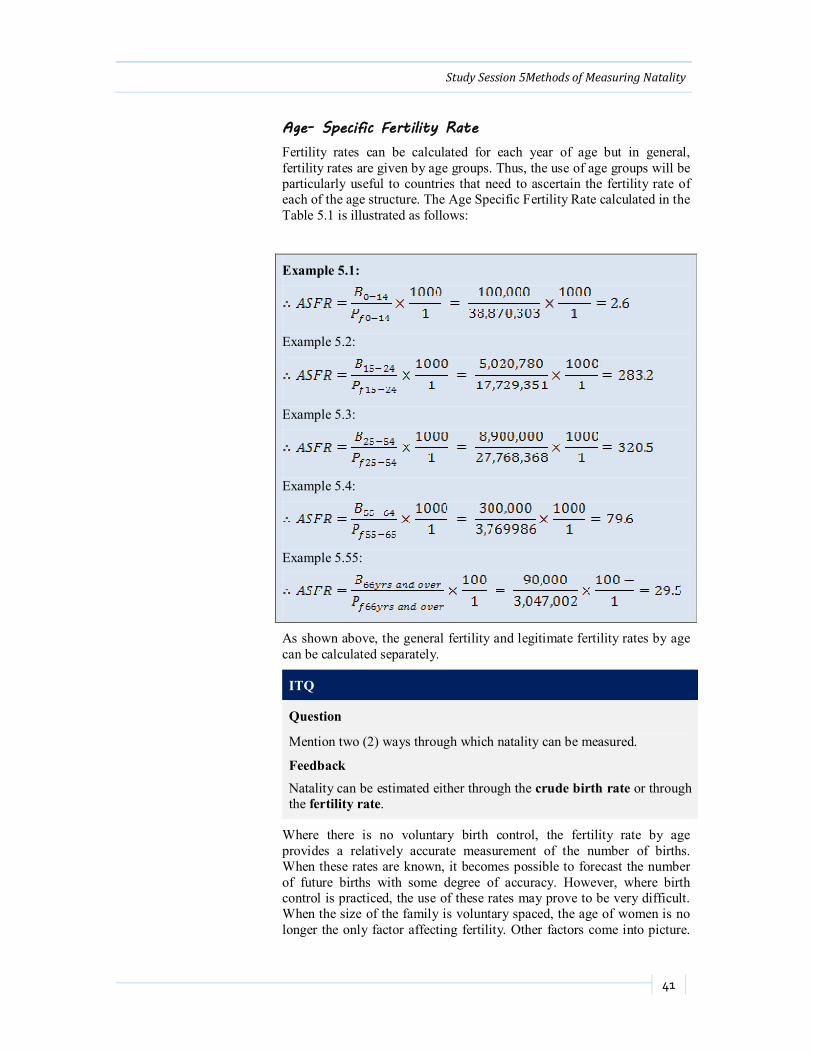
Study Session 5Methods of Measuring Natality
41
Age- Specific Fertility Rate Fertility rates can be calculated for each year of age but in general, fertility rates are given by age groups. Thus, the use of age groups will be particularly useful to countries that need to ascertain the fertility rate of each of the age structure. The Age Specific Fertility Rate calculated in the Table 5.1 is illustrated as follows:
Example 5.1:
Example 5.2:
Example 5.3:
Example 5.4:
Example 5.55:
As shown above, the general fertility and legitimate fertility rates by age can be calculated separately.
ITQ
Question
Mention two (2) ways through which natality can be measured.
Feedback
Natality can be estimated either through the crude birth rate or through the fertility rate.
Where there is no voluntary birth control, the fertility rate by age provides a relatively accurate measurement of the number of births. When these rates are known, it becomes possible to forecast the number of future births with some degree of accuracy. However, where birth control is practiced, the use of these rates may prove to be very difficult. When the size of the family is voluntary spaced, the age of women is no longer the only factor affecting fertility. Other factors come into picture.
42
EME204 Analysis of Demographic Data in Educational Management
They include age at marriage, length of time married, the number of children preceding a given birth, etc. Basically, many factors affect fertility. Some of them are:
1. The availability and use of techniques of birth control; 2. The age at marriage; 3. The average time between births; 4. Duration of marriage; and 5. Diseases/epidemic.
In such a situation, one can see that fertility rate by age becomes less significant. Despite these shortcomings, as long as one is cautious, fertility rates by age are still the best way of forecasting future births.
A distinction is sometimes made in demography analysis, between “fertility” and “fecundity”, fecundity refers to the biological capacity for having children (potential fertility) and the word fertility being used to refer to actual births (actual fertility). The two terms mean the same thing when there is no intentional limitation of births, or birth control, but otherwise are different in meaning; as a “fecund” couple may in fact remain voluntarily childless and therefore lack “fertility”.
Study Session Summary
Summary
In this Study Session, we examined the concept of natality. We started by defining natality. Thereafter, we examined the two ways through which natality can be estimated; the crude birthrate and the fertility rate.
Assessment
Assessment
SAQ 5.1 (tests Learning Outcome 5.1) There are two types of fertility rate, the general fertility rate and the age-specific fertility rate. Discuss the two.
Bibliography
Owolabi, J. (2001). ‘Statistical models and projections in educational management’ in Okunola P.O. (ed). Theory and practice of educational management, Oyo, Nigeria: OYSCEI
Owolabi J, (2006). Quantitative methods of educational planning. Makere University, kampala. Lucky Odoni (Nig) Emterprises, Ogun,

Study Session 6Mortality Rate
43
Reading Nigeria.
Study Session 6
Mortality Rate Introduction
In previous study session, we looked at the methods of measuring natality (i.e. a positive change in population size). In this study session, however, we are going to focus on the negative change in population size (i.e mortality). The study of population changes must take into consideration the trend of any increase or decrease in population over a period. Obviously, the two main factors, which affect this trend, are natality and mortality. Emphasis will be on the two types of mortality: endogenous and exogenous mortality. We are also going to concentrate on various methods of measuring mortality. These include; crude death rate, age-specific death rate, infant mortality rate and prenatal mortality.
Learning Outcomes
Outcomes
When you have studied this session, you should be able to:
6.1 define Mortality rate
6.2 highlight the methods of measuring mortality rate
Terminology Mortality rate A measure of the number of deaths (in general, or due to a
specific cause) in a particular population, scaled to the size of that population, per unit of time.
Infant mortality The death of children under the age of one year.
6.1 Defining Mortality Rate Mortality rate, or death rate, is a measure of the number of deaths (in general, or due to a specific cause) in a particular population, scaled to the size of that population, per unit of time. Mortality rate is typically expressed in units of deaths per 1,000 individuals per year; thus, a

44
EME204 Analysis of Demographic Data in Educational Management
Mortality rate
The number of a particular group who die each year.
mortality rate of 9.5 (out of 1,000) in a population of 1,000 would mean 9.5 deaths per year in that entire population, or 0.95% out of the total. It is distinct from "morbidity", a term used to refer to either the prevalence or incidence of a disease, and from the incidence rate (the number of newly appearing cases of the disease per unit of time).
There are two types of mortality namely; endogenous mortality and exogenous mortality. The typology determines which category to class a particular death as explained below:
6.1.1 Endogenous Mortality This is the type of death that occurs from a cause, which is to some extent, inherent in the individual. Thus, when a child is born with deformity and dies because of it, that death can be categorized as endogenous mortality. Endogenous mortality also includes deaths resulting from old age or diseases that accompany old age such as vascular lesions and cancer.
Figure 6.1 The Death Caused because of Old age is regarded as Endogenous Mortality
(https://www.smashwallpapers.com)
6.1.2 Exogenous Mortality This is concerned with other causes such as accidents, contagious diseases and alimentary diseases. Although, there appears to be a clear-cut distinction between these two types of mortality, it is not very clear

Study Session 6Mortality Rate
45
when real situations are examined because the cause of death may be unknown or may not be declared or be multiple. Nonetheless, the distinction is very useful. An interesting fact is that, even though the process of hygiene, medical care, and raising the standard of living are capable of reducing exogenous mortality. Medical progress can indeed prevent certain premature deaths but it cannot prolong life beyond a certain limit. Thus, when there is a decline in mortality, it affects the younger generation rather the older ones. The net effect, therefore, is that a decline in the mortality rate has the effect of creating a younger population, that is, an increase in the population in comparison with the older sector.
Figure 6.2 Death as a Result of Accident is considered Exogenous Mortality ()
ITQ
Question (True/False)
Mortality is the ratio of the number of births to the size of the population.
Feedback
The statement above is false. Mortality can be described as relative incidence of death within a particular group categorized according to age or some other factor such as occupation. However, the ratio of the number of births to the size of the population is Natality.
6.2 Methods of Measuring Mortality We shall now examine the ways of measuring mortality just as we did for natality in the previous session. However, these measurements of

46
EME204 Analysis of Demographic Data in Educational Management
mortality are technical and most methods require detailed statistics that are available in most developing countries. We shall therefore, restrict ourselves to a discussion of only four measurements, which are relevant to this programme. These are:
1. Crude death rate and 2. Mortality rates by age 3. Age-Specific death rate 4. Infant mortality
6.2.1 Crude Death Rate This is the simplest way of measuring mortality. The crude death rate is obtained by dividing the total numbers of deaths in a year by the average population figure for that year (i.e. the total mid-year population). Symbolically, crude death rate is given by:
Mathematically, the crude death rate may be expressed as:
As stated under the crude birth rate, the mid-year total population is also referred to as the average annual population. It is also the average of the population at the beginning or end of the year. The mid- year population means July 1
Where:
Example:6.1
In a country, there were 54,000 deaths recorded in 2015. The mid-year estimated population of the country was 5 million. Calculate the crude deaths rate of the country in 2015.
Solution
Recall that:
Then, for the country
Therefore, there were approximately 11 deaths per 1000 in the country
Using the data in Table 6.1 to calculate the crude death rate can be
Study Session 6Mortality Rate
47
illustrated thus:
Note
The calculation of crude death rate is straight forward because it does not require detailed statistics about mortality. However, it has the disadvantage of making international comparisons look very ridiculous.
For instance, assume the crude birth rate in china; (Taiwan) was 5.7 per thousand in 2015and for the United States in the same year was 9.4 per thousand. The conclusion for this is that mortality level was higher in the United States than in China (Taiwan). However, this was not the case because of the age structure of the two countries population. The proportion of deaths in relation to total population is a function of the age structure. A youthful population will invariably exhibit a lower crude death rate than an older population. This explains the lower figure for china (Taiwan) in 2015 as against the United States. This same picture may be obtained when other developing countries with younger population are compared with the advanced countries with older population.
Note
It is this diminution of the significance of the crude deaths rate of demographers that has led to the use of mortality rates by age. This is because mortality rates by age provide much more accurate indications of the level of mortality of a given population. Because of differences in mortality rates between sexes, mortality rates by age are usually calculated separately for men and women.
6.2.2 Mortality Rates by Age In calculating mortality rates by age, the term “cohort” is much used when referring to people born during the same period, usually the same year. Through the years, it is obvious that the number of persons in a cohort will decrease because of deaths. By following the cohort trend and of other cohorts one can study the effects of mortality. By comparing, for example, the number of deaths in a cohort, one can obtain a measurement of mortality at age 40.
Note
The calculation of mortality rates needs detailed statistical data, including statistics covering the number of deaths at a given age and the number of survivors at the same age for the cohorts. In many developing countries, these detailed information are not available. Then, in that case, it is necessary to calculate the death rates at different ages and these rates in turn give the proportion of deaths of persons of each respective age during the year compared with the average total number of individuals of that age during that same year.

48
EME204 Analysis of Demographic Data in Educational Management
Infant mortality
Deaths of young children, typically those less than one year of age.
6.2.3 Age-specific Death Rate This is calculated by dividing the number of deaths in a year by the mid-year population of the specific age group and multiplied by one thousand. Let us take note of the table below.
Table 6.1 Age Specific Death Rate
Age Structure
(1)
Adjusted Average yearly Deaths 2014-
2016
(2)
Population
(3)
Death Rate / 1000 population
(2/3) x 1000
0-14 20,000 38,870,303 0.51
15-24 1,500,000 17,729,351 84.61
25 – 54 3,500,000 27,768,368 126.04
55-64 150,000 3,769,986 39.79
66yrs and over 50,000 3,047,002 16.41
Total 5,220,000 91,185,010 57.25
Example: 6.2
From the above, the age-specific death rate for Nigeria in 2016 for the age group 25-54 can be illustrated thus:
Solution
Therefore, there were 126 deaths per thousand for the age group of 25-54 in year 2016
6.2.4 Infant Mortality It is essential that we devote special attention to a discussion of infant mortality for two main reasons:
1. Infant mortality is usually very high, and 2. Infant mortality level is of much interest to educational planners
because the number of children for whom schooling must be provided in the future depends on that level.
Study Session 6Mortality Rate
49
Infant mortality is measured by the mortality rate at age 0, that is, the ratio of deaths from birth to 1 year of age to the total number of live births. Symbolically, this is given by:
Mathematically, this is given as:
Where
; and
ITQ
Question
Let us assume that the demographic statistics of Nigeria in 2015 showed that there were 62,000 live births and 8,280 deaths among infants in the same year. Find the infant death rate in 2015.
Feedback
The infant death rate of Nigeria in 2015 can be illustrated thus:
Therefore, there were approximately 134 infantile deaths per 1000 in 2015.
As earlier mentioned, this rate is generally much higher than other age-specific death rates until a great age is reached. This and other age-specific rates up to the year of entry into the school system is of obvious significance to the educational planner in projecting future school intake and enrolment ratios.
Note
Usually still-births are distinguished from infant mortality when the distinction is carried further to include what is carried prenatal mortality. Prenatal mortality is obtained by adding endogenous mortality to still-births.
While the concepts of prenatal mortality and infant mortality are theoretically very accurate, their measurement is often imperfect especially in developing countries. This is because a very large proportion of infant deaths ( and also births) are often not registered.
50
EME204 Analysis of Demographic Data in Educational Management
Study Session Summary
Summary
In this Study Session, we have been focusing on mortality- its types - endogenous and exogenous, methods of measuring mortality (crude death rates, mortality rates by age, age-specific mortality rate and infant mortality). In all, we came up with the conclusion that deaths result from a number of causes, some of which cannot, in principle, be influenced by public and government policies. We also noted that the different age groups in the population experience different rates of mortality from specified causes.
Assessment
Assessment
SAQ 6.1 (tests Learning Outcome 6.1) Mortal is the measurement of death against the number of population. Explain.
SAQ 6.2 (tests Learning Outcome 6.2)
There are four methods of measuring mortality, as pointed out above. Discuss any two.
Bibliography
Reading
Owolabi, J. (2001). ‘Statistical models and projections in educational management’ in Okunola P.O. (ed). Theory and practice of educational management, Oyo, Nigeria: OYSCEI
Owolabi J, (2006). Quantitative methods of educational planning. Makere University, kampala. Lucky Odoni (Nig) Emterprises, Ogun, Nigeria.
Study Session 7Population Growth and Forecasting Enrolment
51
Study Session 7
Population Growth and Forecasting Enrolment
Introduction In the last two study sessions, we have been examining the methods of measuring population change (natality and mortality). In this study session, we are going to be introduced to the method of measuring population growth and the method of forecasting enrolment.
Learning Outcomes
Outcomes
When you have studied this session, you should be able to:
7.1 determine how to compute natural growth rate of a population
7.2 make a comparative analysis of the population growth rates in selected countries
7.3 project population for the future enrolment
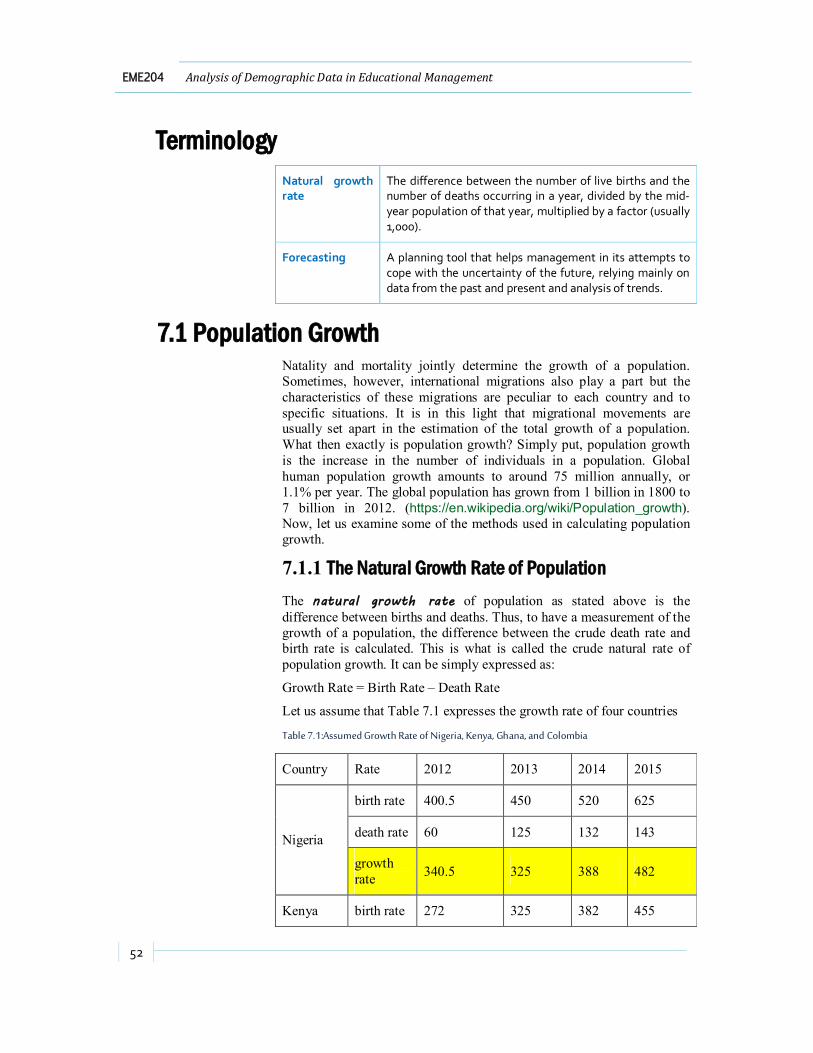
52
EME204 Analysis of Demographic Data in Educational Management
Terminology Natural growth rate
The difference between the number of live births and the number of deaths occurring in a year, divided by the mid-year population of that year, multiplied by a factor (usually 1,000).
Forecasting A planning tool that helps management in its attempts to cope with the uncertainty of the future, relying mainly on data from the past and present and analysis of trends.
7.1 Population Growth Natality and mortality jointly determine the growth of a population. Sometimes, however, international migrations also play a part but the characteristics of these migrations are peculiar to each country and to specific situations. It is in this light that migrational movements are usually set apart in the estimation of the total growth of a population. What then exactly is population growth? Simply put, population growth is the increase in the number of individuals in a population. Global human population growth amounts to around 75 million annually, or 1.1% per year. The global population has grown from 1 billion in 1800 to 7 billion in 2012. (https://en.wikipedia.org/wiki/Population_growth). Now, let us examine some of the methods used in calculating population growth.
7.1.1 The Natural Growth Rate of Population The natural growth rate of population as stated above is the difference between births and deaths. Thus, to have a measurement of the growth of a population, the difference between the crude death rate and birth rate is calculated. This is what is called the crude natural rate of population growth. It can be simply expressed as:
Growth Rate = Birth Rate – Death Rate
Let us assume that Table 7.1 expresses the growth rate of four countries
Table 7.1:Assumed Growth Rate of Nigeria, Kenya, Ghana, and Colombia
Country Rate 2012 2013 2014 2015
Nigeria
birth rate 400.5 450 520 625
death rate 60 125 132 143
growth rate 340.5 325 388 482
Kenya birth rate 272 325 382 455
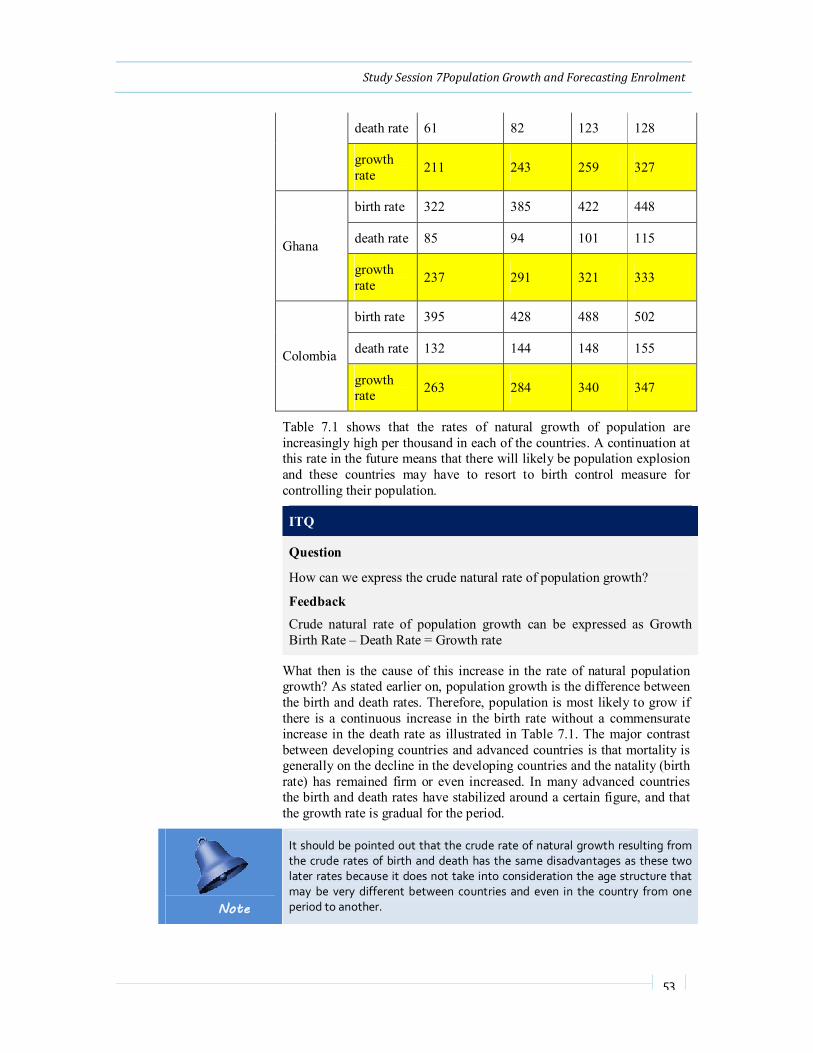
Study Session 7Population Growth and Forecasting Enrolment
53
death rate 61 82 123 128
growth rate 211 243 259 327
Ghana
birth rate 322 385 422 448
death rate 85 94 101 115
growth rate 237 291 321 333
Colombia
birth rate 395 428 488 502
death rate 132 144 148 155
growth rate 263 284 340 347
Table 7.1 shows that the rates of natural growth of population are increasingly high per thousand in each of the countries. A continuation at this rate in the future means that there will likely be population explosion and these countries may have to resort to birth control measure for controlling their population.
ITQ
Question
How can we express the crude natural rate of population growth?
Feedback
Crude natural rate of population growth can be expressed as Growth Birth Rate – Death Rate = Growth rate
What then is the cause of this increase in the rate of natural population growth? As stated earlier on, population growth is the difference between the birth and death rates. Therefore, population is most likely to grow if there is a continuous increase in the birth rate without a commensurate increase in the death rate as illustrated in Table 7.1. The major contrast between developing countries and advanced countries is that mortality is generally on the decline in the developing countries and the natality (birth rate) has remained firm or even increased. In many advanced countries the birth and death rates have stabilized around a certain figure, and that the growth rate is gradual for the period.
Note
It should be pointed out that the crude rate of natural growth resulting from the crude rates of birth and death has the same disadvantages as these two later rates because it does not take into consideration the age structure that may be very different between countries and even in the country from one period to another.

54
EME204 Analysis of Demographic Data in Educational Management
Natural growth rate
The national income growth rate necessary to neither increase nor decrease unemployment.
7.2Population Projections The main aims of the education planner for projecting future population is to enable him/her obtain an estimate of the children he would have to cater for in the future in an education plan. Hence, in this section, we are going to concern ourselves only with the projection of births, which has a strong influence on the preparation of education plans. Let us now look at some of the population projection that can be made.
7.2.1 Birth Projections In making birth projections, we begin by calculating what is referred to as projective fertility rates. This is done by using the current fertility data and drawing up assumptions as to the future trend. The next step is to estimate the number of women in different cohorts. Let us assume, for example, that the projective fertility rates by age and the numbers of women different cohorts are as shown in Table 7.2
Table 7.2 Hypothetical projective Fertility Rates by Age (per thousand)
Year of birth of female cohorts
1
Women Population
as at 1/7/2025
2
Women Population
as at 1/7/2029
3
Projective fertility rates,
2017-2022 (%)
4
Average Number of Fertile Women
(2+3)/2
5
Number of Birth
Forecast
(5x6)/1000
6
2012-2016 400800 387173 145 393987 57128
2007-2011 370000 352980 700 361490 253043
2002-2006 340400 321338 1055 330869 349067
1997-2001 318200 298790 895 308495 276103
1992-1996 296000 276464 680 286232 194638
1987-1991 266400 247485 415 256943 106631
1982-1986 222000 204240 155 213120 33034
1977-1981 170500 159132 25 164816 4120
1,273,764
To project the number of births from the cohort of women born between 2007 and 2011. That is, those who will be in the age group of 15-19 years at 1st July 2029, the average number of fertile women will have to be
Study Session 7Population Growth and Forecasting Enrolment
55
Forecasting
The use of historic data to determine the direction of future trends.
calculated. The average number of fertile women can be derived by summing up the number of women population for 2007-2011 at year 2025 with the figure at 2029. It can be illustrated thus:
Therefore,
To forecast the number of births for the period can be calculated by multiplying the average number of fertile women by the projective fertility rate and divide by 1000 as illustrated thus:
Therefore,
This procedure can be repeated for each of the cohort and the summation of the number of birth forecasts will be 1,273,764 births but this has to be broken down by sex. Usually this will be based on the ratio of boys: girls in the current population. Assuming that the male: female ratio is 102: 100, then the numbers of boys will be 630,513 and the number of girls will be 643,251. However, a certain number of these children will die before 1 July 2029 so that in order to obtain the number in the 0 – 4 age group of 1 July 2029 we have to multiply these figures (by sex) by the corresponding rates of survival amongst children. When this is done, school enrolment is forecast.
ITQ
Question
What do you calculate first before making birth projection?
Feedback
In making birth projections, we begin by calculating what is referred to as projective fertility rates.
7.2.2 Forecasting School Enrolment All we have discussed in this module has been mainly to find a way of forecasting school enrolments which is crucial part in the process of preparing educational plans. This is because without a reliable estimate of the expected school population no educational planner would be able to proceed to formulate a plan that would be acceptable to the government. Furthermore, the presence of such a forecast will aid the estimation of the total educational costs and the need to plan the necessary means of finding the funds. When attempting to forecast future school enrolment,

56
EME204 Analysis of Demographic Data in Educational Management
at the national level, one has to estimate the school age population. Population projections showing the future age structure of the population, which is, in a similar pattern as that shown above, will have to be done. When these projections have been obtained it may be necessary to adjust your estimates to reflect international migrations but this will depend on each country’s situation, as mentioned earlier on. However, in general such migrant movements have very little effect on the school age population except perhaps at the tertiary level.
In a country where there is compulsory education, the forecasting of school enrolment figures does not present any particular difficulty. This is because if the country has an effective system of compulsory education, school-enrolled population is approximately equivalent to the school age population. However, for the other levels the enrolment rates of the school age population must be available for schooling at that level.
7.3 Effects of Population Structure on Education Structure refers to the configuration of elements, constituents or parts in a complex entity, organization or arrangement. It is the way something is “made up” or composed. We can look at the composition or structure of a population from different viewpoints. The structure of a population may be examined by age, by occupation or by geographical location. Let us first consider the effects of age distribution on education.
7.3.1 Age Structure The age structure summarizes the demographic past of a population because the number of people at each age is determined by:
1 The number of births in the generation from which they have come; 2 The effects of mortality on that generation; and 3 The size of the net migration of the age structure of a population 4 Hence, a close examination of the age structure of a population may
reveal past occurrences of demographic importance.
Three major types of age distribution are noticeable: young, old and rejuvenated populations. A population is said to be young when the proportion of children (under 15 population) is very high. The population is aged when the adults are more in number than children. The youthfulness or agedness of a population is conspicuous in its age pyramid. A young population has a pyramid with a wide base; it tapers off to the top. The wide base indicates preponderance of children and the contracted upper region shows that adults are relatively few. Most of the less developed countries have this age structure.
When there is considerable decrease in the birth rate the pyramid shrinks or becomes deflated at the base. This is an old population. Sweden, Germany, Japan and U.K. are in their old ages. If after experiencing a decrease in the birth rate, a country begins to show an increasing trend, the pyramid will be inflated at the middle signifying a rejuvenation of population. The decade after the Second World War witnessed rejuvenation of population in Europe and America.

Study Session 7Population Growth and Forecasting Enrolment
57
Go through the article below to know what impact age structure had on teacher requirement, educational expenditure and school enrolment ratio.
Activity
Activity 7.1 Impact of Age Structure
The age structure plays a lot of role in any country’s educational sector. We will look at these impacts in three phases.
Age Structure and Teacher Requirements In developing countries where the age structures are the youthful type there are smaller numbers of people in the older generations. Since teachers are usually older than their students, this implies that teachers of any age group are recruited from older generations, which are comparatively less numerous. This phenomenon may partially account for why developing countries encounter great difficulties in getting sufficient number of people to recruit as teachers. As a population matures towards the old age, the number of adults approaches the number of children and there is often no shortage of people to teach.
Age Structure and Educational Expenditure Supporting the school age population is a burden for the economically active group. The 5 – 14 year age-group does not exercise any economic activity but constitutes a dependency burden on the working class is heavy. A country with a youthful age-structure necessarily expends more of its economic resources on providing education for their young ones.
Table 8.1 Age Structure and Dependency Burden
Country Year
Population (Age 5-14yrs)
1
Population (Age 15-64yrs)
2
Burden (%)
(1/2*100)
China 2015 300,000,000 800,000,000 38
Zambia 2015 250,000 1,200,000 21
India 2015 250,000,000 700,000,000 36
Canada 2015 380,000 580,000 66
U.K. 2015 450,000 900,000 50
Sweden 2015 150,000 390,000 38
Nigeria 2015 38,000,000 49,000,000 78
According to the hypothetical data in Table 8.1, Nigeria has the highest dependency burden of 78%; followed by Canada (88%), then the United Kingdom (50%).

58
EME204 Analysis of Demographic Data in Educational Management
Age Structure and School Enrolment Ratios The youthful age structure constitutes a planning problem since the size of school age children increases every year. The enrolment ratio will fall unless effort is made to enrol more children than in the preceding year. To provide schooling for the extra number of children there must be continuous expansion in enrolment as well as in resources each year. Thus, the youthful age structure in developing countries constitutes a formidable barrier to progress towards their being at par with the rest of the world in education attainments. In the old age structures, enrolment is either constant or decreasing.
Can you summarize, in three sentences, the impacts of age structure on education as explained in the above article?
Discussion:
7.3.2 Occupational Structure An occupational distribution of a population affords us the privilege of knowing the proportion of the active population in the different sectors of economic activity (primary, secondary and tertiary sectors). It is also possible to know the percentage of the active population engaged in each occupation. Given the desired level of productivity in each occupation and in sector, it is possible to estimate the manpower requirements. Such estimates will affect the planning of future enrolments in technical, vocational and higher education.
7.3.3 Geographical Structure School locational planners have to take cognizance of the spatial distribution of a population in making plans. Two major parameters affect the sitting of new schools: population size and catchment area is confined to the maximum walking distance stipulated by official regulation if children have to walk to school. Means of transportation and availability of special facilities (e.g. school lunch) can also affect the location of schools. Secondary schools need large catchment areas because of lower enrolment ratios. This catchment area can be larger where there is a school bus pick-up system. The catchment area of a boarding school is not as much determined by home-school distance as by administrative and political factors. Largely, the geographical distribution of the potential clients of a school is an important consideration in the locational planning of that school
Population Chance and Management of Education
We have examined the effects that structure of a static population has on the management of education. However, in the real life situations, demographic characteristics are always changing. We
Study Session 7Population Growth and Forecasting Enrolment
59
therefore need to consider the dynamics of population change and see how such changes are accommodated in the management of education. An increase or decrease in the size of a population is determined mainly by natality and mortality, since the effect of immigration tends to be neutralized by emigration. Internal migrations have no perceptible effect on the total size, even though they do dislocate the geographical structure of a population. Natality is measured by crude birth rate and fertility rates, while mortality is measured by crude death rate, infant mortality, and age specific death rates. The balance of births and deaths represents growth due to natural increase. The rate of population growth due to natural increase is the parameter of special interest to educational managers. Effective management of education requires the ability to make forecast of the population numbers that the education system will have to cater for in the near future. Estimates of future numbers are derived from projections based on the population growth rates. Since the expected sizes of future enrolments in schools have determinative effects on educational policy formulation, educational managers are better prepared for their assignments when there are adequately informed about the size of population, its structure and its rate of growth due to natural increase.
Study Session Summary
Summary
In this Study Session, we discussed population growth and looked at how to forecast enrolment. We started by explaining what population growth means. In doing so, we examined the natural growth rate of population. Thereafter, we discussed how to project population growth. To do this, we looked at birth projection and discussed how to forecast school enrolment.
Assessment
Assessment
SAQ 7.1 (tests Learning Outcome 7.1) In your own words, describe what you understand by “population growth”.
SAQ7.2 (tests Learning Outcome 7.2) Describe how to project birth rate.
SAQ7.3 (tests Learning Outcome 7.3) Can you discuss the effect of population on age structure?
60
EME204 Analysis of Demographic Data in Educational Management
Bibliography
Reading
Owolabi, J. (2001). ‘Statistical models and projections in educational management’ in Okunola P.O. (ed). Theory and practice of educational management, Oyo, Nigeria: OYSCEI
Owolabi, J. (2001). ‘Curriculum planning and manpower development in Nigeria’. A paper presented at the Annual Conference of the Nigerian Association for Educational Administration and Planning, held at the University of Benin, Benin City, Nigeria, October 29th-November 1st , 2001
Owolabi J, (2006). Quantitative methods of educational planning. Makere University, Kampala. Lucky Odoni (Nig) Emterprises, Ogun, Nigeria.
Owolabi, S.O. (2000). School mapping for Ghana: training manual, Accra, Ghana. UNICEF
Study Session 8
Demography and School Enrolment Introduction
In this study session, we will be discussing the relationship between demography and school enrolment. We will highlight the different stages in education. Thereafter, we looked at the sources of educational data. Lastly, we discussed the school enrolment statistics.
Learning Outcomes
Outcomes
When you have studied this session, you should be able to:
8.1 discuss demography and school enrolment
8.2 highlight the different sources of educational data
8.3 describe school enrolment statistics

Study Session 8Demography and School Enrolment
61
Sex distribution
The number of males and females in a given population.
Terminology Sex distribution The number of males and females in a given population.
8.1 Relationship between Demography and School Enrolment
Population characteristics such as age distribution, sex distribution, literacy and educational attainment are very important for the determination of educational status of a population. The age and sex distribution of a population can provide the bases on which enrolment rates and ratios is calculated, while the literacy characteristics can give us better insight into the educational needs of the people. As at October 2016, the literacy (defined as people of age 15 and over that can read and write) rate of Nigerian 186,053,386 total population was 59.6%, while it was 69.2% for male population and 49.7% (2015 est.) for female population. The data on estimated population of Nigeria further stated that age structure from 15-60year and over constitute 57.21% of the population. Therefore the literate population is approximately 106,441,142.
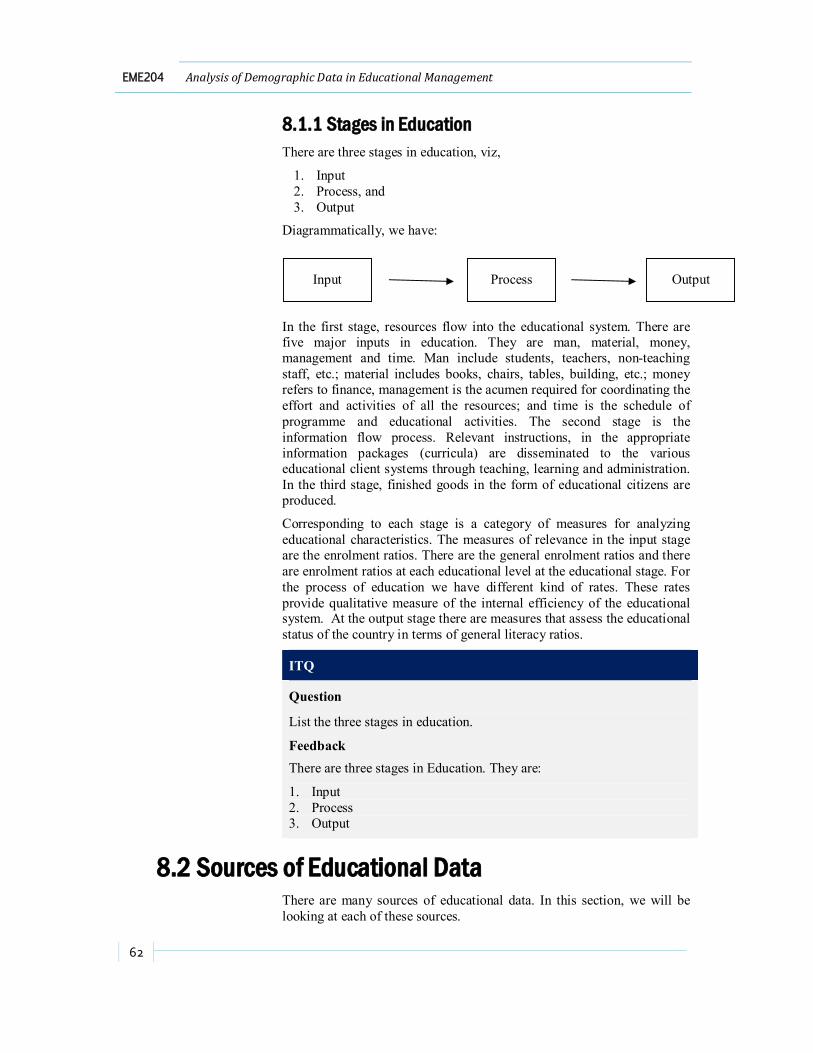
62
EME204 Analysis of Demographic Data in Educational Management
8.1.1 Stages in Education There are three stages in education, viz,
1. Input 2. Process, and 3. Output
Diagrammatically, we have:
In the first stage, resources flow into the educational system. There are five major inputs in education. They are man, material, money, management and time. Man include students, teachers, non-teaching staff, etc.; material includes books, chairs, tables, building, etc.; money refers to finance, management is the acumen required for coordinating the effort and activities of all the resources; and time is the schedule of programme and educational activities. The second stage is the information flow process. Relevant instructions, in the appropriate information packages (curricula) are disseminated to the various educational client systems through teaching, learning and administration. In the third stage, finished goods in the form of educational citizens are produced.
Corresponding to each stage is a category of measures for analyzing educational characteristics. The measures of relevance in the input stage are the enrolment ratios. There are the general enrolment ratios and there are enrolment ratios at each educational level at the educational stage. For the process of education we have different kind of rates. These rates provide qualitative measure of the internal efficiency of the educational system. At the output stage there are measures that assess the educational status of the country in terms of general literacy ratios.
ITQ
Question
List the three stages in education.
Feedback There are three stages in Education. They are:
1. Input 2. Process 3. Output
8.2 Sources of Educational Data There are many sources of educational data. In this section, we will be looking at each of these sources.
Input Process Output

Study Session 8Demography and School Enrolment
63
8.2.1 School Statistics Data on resources input and those on the process of education are classified in the series of booklets called “School Statistics” produced by the statistics division of the Ministry of Education. They are also available in the different schools and colleges, and in the local schools boards.
8.2.2 Census Return Data on the general level of education or the literacy ratios of a country are to be contained in the national census returns. Nigerian population estimates derived from previous censuses have been useful as earlier pointed out. Data on the age and sex distribution can be estimated from the census returns.
8.2.3 Special Survey It is not possible to compute the literacy ratios of a country by simply resorting to summation of previous school outputs because:
1. It is possible to become literate without going through the school system. There are formal and non-formal ways of learning
2. Education is behaviour modification. The behaviour of school outputs with regards to the vital processes, may tends to differ from group to group, to extrapolate and know how many of the past school outputs are still living, for example.
However, special surveys can be conducted to determine current data on literacy ratios. Such surveys must take into consideration the heterogeneous nature of the educational characteristics and the cultural heritage of the different sub groups of the population. School returns may sometimes be too slow in the production data on the internal efficiency of the educational system. Conducting special surveys may be a faster way of collecting the latest data on wastage rates in localized areas.
ITQ
Question
The sources of educational data are ________, __________ and __________.
Feedback
We can get educational data from the following sources:
1. School statistics 2. Census return 3. Special survey
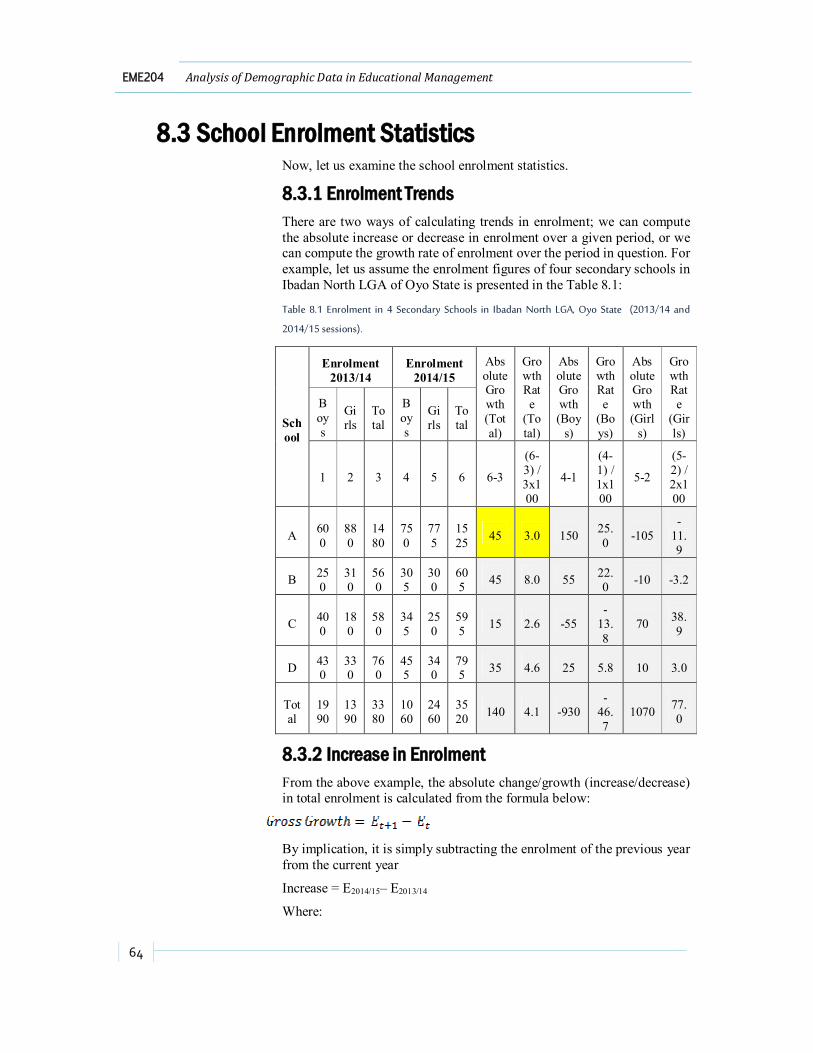
64
EME204 Analysis of Demographic Data in Educational Management
8.3 School Enrolment Statistics Now, let us examine the school enrolment statistics.
8.3.1 Enrolment Trends There are two ways of calculating trends in enrolment; we can compute the absolute increase or decrease in enrolment over a given period, or we can compute the growth rate of enrolment over the period in question. For example, let us assume the enrolment figures of four secondary schools in Ibadan North LGA of Oyo State is presented in the Table 8.1:
Table 8.1 Enrolment in 4 Secondary Schools in Ibadan North LGA, Oyo State (2013/14 and
2014/15 sessions).
School
Enrolment 2013/14
Enrolment 2014/15
Absolute Growth (Total)
Growth Rate
(Total)
Absolute Growth (Boy
s)
Growth Rate
(Boys)
Absolute Growth (Girl
s)
Growth Rate
(Girls)
Boys
Girls
Total
Boys
Girls
Total
1 2 3 4 5 6 6-3
(6-3) / 3x100
4-1
(4-1) / 1x100
5-2
(5-2) / 2x100
A 600
880
1480
750
775
1525 45 3.0 150 25.
0 -105 -
11.9
B 250
310
560
305
300
605 45 8.0 55 22.
0 -10 -3.2
C 400
180
580
345
250
595 15 2.6 -55
-13.8
70 38.9
D 430
330
760
455
340
795 35 4.6 25 5.8 10 3.0
Total
1990
1390
3380
1060
2460
3520 140 4.1 -930
-46.7
1070 77.0
8.3.2 Increase in Enrolment From the above example, the absolute change/growth (increase/decrease) in total enrolment is calculated from the formula below:
By implication, it is simply subtracting the enrolment of the previous year from the current year
Increase = E2014/15– E2013/14
Where:

Study Session 8Demography and School Enrolment
65
E = Enrolment
Et+1 = Enrolment in current year
Et=Enrolment in previous year
To calculate the absolute/gross growth in total enrolment for school A:
8.3.3 Growth Rate of Enrolment The growth rate of enrolment can be computed using this formula:
Simply put, it is:
Growth rate =E 2014/15 –E2013/14 x 100
E2013/14
To calculate the growth rate in total enrolment for school A:
Can you use the formula above the remaining data and compare your results with those highlighted in Table 8.1?
8.3.4 Enrolment Ratios This is the ratio between the number of students enrolled of a given age and the size of the population in the given age- group. Three types of enrolment ratios are discussed namely:
1. Overall enrolment ratio, 2. Level- specific enrolment ratio, and 3. Age- specific enrolment ratio
Solution:
1. The overall, crude or general enrolment ratio is expressed as:
Where:
Et = Total enrolment at all levels and ages covered in year t
Pa, t= Total population in age –group “a” which corresponds to all levels (often 6 – 24 years) in year t.

66
EME204 Analysis of Demographic Data in Educational Management
ITQ
Question
If the total enrolment at all levels of education in 2014 is 8.3 million and the total school age population (6 -24years) in the same year is 35.5 million, what is the overall enrolment in 2014?
Feedback The overall enrolment ratio in 2014 is:
2. Level- specific enrolment ratio: Often called “enrolment ratio for primary (p), secondary (s) or higher(h) education” may be defined as the ratio between the primary enrolment at educational level “h” , for example, and the population that should be enrolled at that level of education. It is expressed as:
Where:
E( h,t) = Total enrolment at level “h” in year “t”
P (b,t) = Total population in the age – group “ b” which corresponds to level “ h” in year “t”
As the numerator includes all students enrolled regardless of age, the level – specific enrolment ratio is often referred to as the gross level enrolment ratio. This may be adjusted for length of schooling and entry age to make international comparison of enrolment ratios possible.
3. Age- specific enrolment ratio relates the enrolment of a given age or in a given year to the population of the same age in the same year. It may be expressed as:
Where:
E(b,t) = Enrolment in age-group “ b” in year “t”
P(b,t) = Total Population of age-group “b” in year “t”
Note that only those enrolled students of the correct age -group need appear in the numerator. This implies that the over- age (or under-age) students that are enrolled will be excluded in the computation. For this reason, this ratio is usually taken as the net level enrolment ratio when it relates to a level.
Study Session 8Demography and School Enrolment
67
For example, at the primary level, the age–specific enrolment ratio (net level enrolment ratio) in 2015 will be the summation of only the pupils of ages 6 to 11 that are enrolled in 2015, divided by the summation of all children in the given age bracket (6–11) in the society in 2015, multiplied by 100. Therefore, it is expressed thus when illustrated in formula:
The use of enrolment ratios depends very much on data availability and the purpose for which they are required. The crude enrolment ratio is the least instructive. It merely gives us an idea of how many people; relations to school-age population are actually, in schools. The level-specific (gross-level) enrolment ratio helps identify the relative absorbing capacity of educational system while the age-specific enrolled people of a given age group.
There can sometimes be wide gaps between the three different enrolment ratios. The age specific (net level) ratio gives somewhat partial picture as it excludes those students who are actually enrolled but are outside the prescribed age group. The performance of the educational sector as to the population served may thus be undervalued. The level-specific (gross) ratio gives an often over-stated index as it includes under and over-aged students.
8.4 Measuring Efficiency and Wastage While enrolment ratios are indicators of a country’s educational performance, enrolment rates tell us about the internal efficiency of the school system. They show how well the students progress from one grade to the other. In this respect three concepts are useful: promotion, repetition, and drop-out rates. The total number enrolled in a grade level in any particular year is made up of all students promoted to this grade level plus those who are now repeating this grade level minus those who have dropped out.
Note
Note that the out-flow (transfer) in a country will cancel if the system is closed. When dealing with individual schools however, transfers can be considered as positive or negative drop-outs.
Grade enrolment can therefore be represented by the formula:
Where:
E(g, t) = Enrolment in the grade level of this year.
P(g, t) = Promotion to the grade level of this year.
68
EME204 Analysis of Demographic Data in Educational Management
R(g, t) = Repeaters in the grade level of this year.
To calculate the wastage ratio of a grade level we need information on the number of drop-outs. To know how many have dropped out we can use the formula:
Once the number of promotes and the repeaters are known, the drop-outs can be determined. This can be computed using the following set of formulae:
1. The Promotion Rate: Is the number of students in a particular grade level divided by the total number of students enrolled in the previous year multiplied by 100:
2. The Repetition Rate: Is the number of students repeating a given
grade level divided by the number enrolled in the same grade level the year before multiplied by 100. It can be expressed thus:
Where:
R = Repetition rate
Rg,t = Number repeating grade in year t
Eg,t-1 = Enrolment of grade in previous year
3. The Drop-Out Rate: Is the number of students dropping out from a given grade level in a year, divided by the number enrolled in that grade level in the same year multiplied by 100 as illustrated below:
By law, some states operate automatic promotion in Nigeria as a result of ‘free education’ programme of government but in practice repeating a grade level is not uncommon (usually at parent’s request). Recently, Oyo State has repealed the regulation. If promotion were really automatic and attendance is compulsory (no drop-out allowed), then wastage ratio would be + 1 and this would show a seemingly perfect internal efficiency of the system.
Study Session 8Demography and School Enrolment
69
ITQ
Question
List the three methods that can be used to determine the wastage ratio?
Feedback
The methods used to determine the wastage ratio are:
1. The Promotion Rate 2. The Repetition Rate 3. The Drop-out Rate
8.4.1 Literacy and Educational Attainment In societies where literacy (or illiteracy) rates are available, some measures of educational attainments of the total population can be quite useful. Literacy is the ability of a person to both read and write, with understanding, a short statement of his everyday life. The crude rate of illiteracy as well as the age-specific illiteracy rates can be computed.
Age-specific illiteracy rate can be expressed as:
Where:
I(b, t) = Number of illiteracy in age-group b in year t.
P(b, t) = Total population of age-group b in year b in year t
I = Number of illiterates
L = Number of literates
I + L= P
Crude illiteracy rate can be expressed as:
Summing the expression from b = 15 to b = m means finding the illiteracy level of the population aged 15 and above.
The specific grade attainment rate can be expressed as:
Where:
Cg (b, t) = persons at age b who completed exact grade level b at time t
Pb, t. = population of student in grade level b at time t
70
EME204 Analysis of Demographic Data in Educational Management
The Cumulative grade attainment rate can be expressed as:
Where:
Cg+ (b, t) = persons at age b who completed grade level g or beyond.
Two other measures of central tendency frequently employed in the analysis of educational attainment data are the median and the mean years of school completed.
The Median constitutes the middle value, in terms of years of schoolings, which divides the distribution of the population by educational attainment into two parts, above and below which lies and equal number of values. The median is a positional measure indicating at what educational level the middle person is located in the distribution. The Mean is the arithmetic average of the years of schooling completed by all persons in a population.
Study Session Summary
Summary
In this Study Session, we have succeeded in identifying the place of demographic analysis in school enrolment. The three stages passed through during the process of educating were critically dealt with. Sources of educational data were identified and discussed. The study session ended with an introduction to school enrolment statistics: its trend, growth rate, change in enrolment and determination of enrolment ratios.
Assessment
Assessment
SAQ 8.1 (tests Learning Outcome8.1) Discuss the different stages in education.
SAQ 8.2 (tests Learning Outcome 8.2) We have three different sources of educational data. Discuss any two of them.
SAQ 8.3 (tests Learning Outcome 8.3) Discuss how to calculate the growth rate of school enrolment.
SAQ 8.4 (tests Learning Outcome 8.4) If Age-specific illiteracy rate can be expressed as:
Study Session 8Demography and School Enrolment
71
What does I(b, t), P(b, t), I, and L stand for?
Bibliography
Reading
Owolabi, J. (2001). ‘Curriculum planning and manpower development in Nigeria’. A paper presented at the Annual Conference of the Nigerian Association for Educational Administration and Planning, held at the University of Benin, Benin City, Nigeria, October 29th-November 1st , 2001
Owolabi J, (2006). Quantitative methods of educational planning. Makere University, kampala. Lucky Odoni (Nig) Emterprises, Ogun, Nigeria.
Owolabi, S.O. (2000). School mapping for Ghana: training manual, Accra, Ghana. UNICEF
Patwari, A.S. and Akinwumiju J.A. statistical Analysis of demographic data. Ibadan department of educational management, U.I, 1990
Owolabi, J. (2001). ‘Curriculum planning and manpower development in Nigeria’. A paper presented at the Annual Conference of the Nigerian Association for Educational Administration and Planning, held at the University of Benin, Benin City, Nigeria, October 29th-November 1st , 2001
72
EME204 Analysis of Demographic Data in Educational Management
Study Session 9
Average Annual Growth Rate in Population Introduction
In this study session, we will be introduced to the various methods of measuring average annual growth rate in population.
Learning Outcomes
Outcomes
When you have studied this session, you should be able to:
9.1 point-out different methods of measuring average annual growth rate
Terminology Discount factor A mathematical term that measures how much people
care about tomorrow (or, more generally, whatever is defined as one period in the future) as compared to today.
The rate at which human population is growing in the last few years is of great concern to all governments throughout the world. Again, school enrolment at all levels of education has increased at an alarming rate in the last two decades or so while facilities are not increasing or being provided to meet the demand of the explosion. It is worthwhile exercise, as planners, to pay more attention to rates of increase in population. We are going to focus on the method of calculating average growth rate in population. We are going to employ the most elementary tools for doing this. We are going to use techniques of compounding and discounting.
Compounding and discounting are techniques used for comparing the “size” of variables at different point in time. In compounding we find the future worth of present resources and the other variables such as population, enrolment, etc., growing by geometric progression. In discounting, we calculate what a future amount is worth today. It is just the reverse of compounding. It looks from the future to the present. In educational planning, compounding is a very helpful technique. It can help work out readily answers to a host of complex questions pertaining to targets and projections of enrolments, teacher demand and supply, costs, finances and others concerned with the business of social planning to gain a mastery of these techniques.
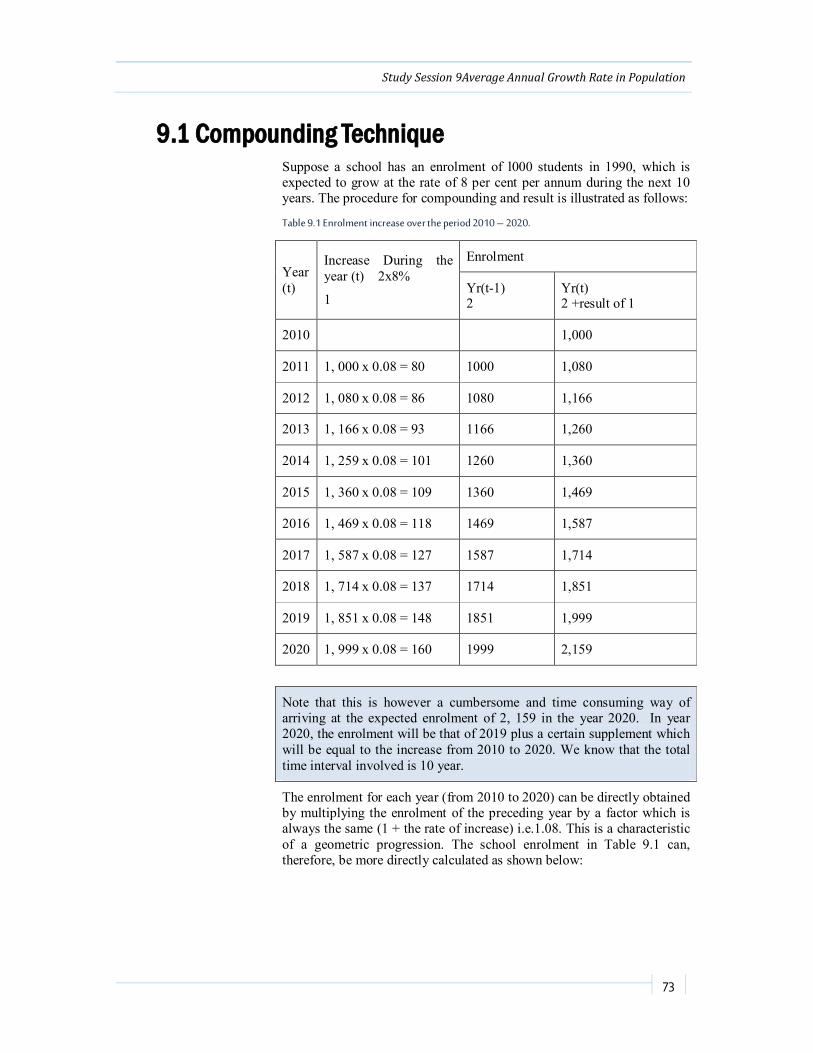
Study Session 9Average Annual Growth Rate in Population
73
9.1 Compounding Technique Suppose a school has an enrolment of l000 students in 1990, which is expected to grow at the rate of 8 per cent per annum during the next 10 years. The procedure for compounding and result is illustrated as follows:
Table 9.1 Enrolment increase over the period 2010 – 2020.
Year (t)
Increase During the year (t) 2x8%
1
Enrolment
Yr(t-1) 2
Yr(t) 2 +result of 1
2010
1,000
2011 1, 000 x 0.08 = 80 1000 1,080
2012 1, 080 x 0.08 = 86 1080 1,166
2013 1, 166 x 0.08 = 93 1166 1,260
2014 1, 259 x 0.08 = 101 1260 1,360
2015 1, 360 x 0.08 = 109 1360 1,469
2016 1, 469 x 0.08 = 118 1469 1,587
2017 1, 587 x 0.08 = 127 1587 1,714
2018 1, 714 x 0.08 = 137 1714 1,851
2019 1, 851 x 0.08 = 148 1851 1,999
2020 1, 999 x 0.08 = 160 1999 2,159
Note that this is however a cumbersome and time consuming way of arriving at the expected enrolment of 2, 159 in the year 2020. In year 2020, the enrolment will be that of 2019 plus a certain supplement which will be equal to the increase from 2010 to 2020. We know that the total time interval involved is 10 year.
The enrolment for each year (from 2010 to 2020) can be directly obtained by multiplying the enrolment of the preceding year by a factor which is always the same (1 + the rate of increase) i.e.1.08. This is a characteristic of a geometric progression. The school enrolment in Table 9.1 can, therefore, be more directly calculated as shown below:
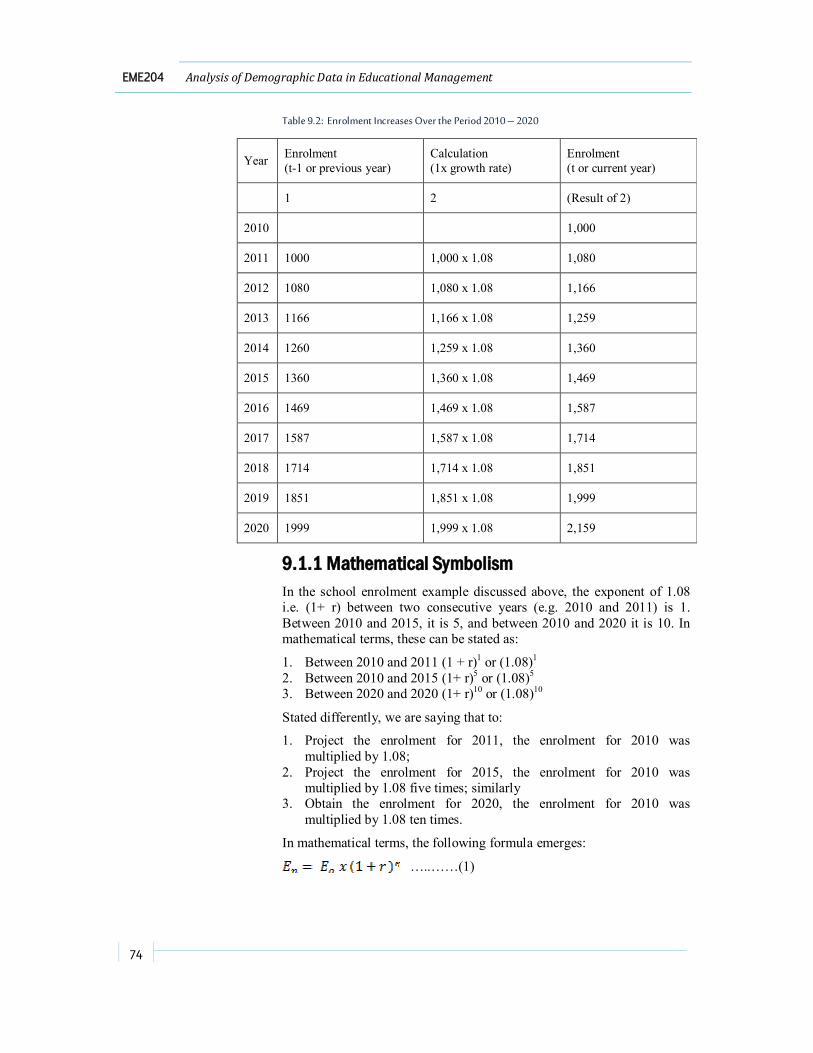
74
EME204 Analysis of Demographic Data in Educational Management
Table 9.2: Enrolment Increases Over the Period 2010 – 2020
Year Enrolment (t-1 or previous year)
Calculation (1x growth rate)
Enrolment (t or current year)
1 2 (Result of 2)
2010
1,000
2011 1000 1,000 x 1.08 1,080
2012 1080 1,080 x 1.08 1,166
2013 1166 1,166 x 1.08 1,259
2014 1260 1,259 x 1.08 1,360
2015 1360 1,360 x 1.08 1,469
2016 1469 1,469 x 1.08 1,587
2017 1587 1,587 x 1.08 1,714
2018 1714 1,714 x 1.08 1,851
2019 1851 1,851 x 1.08 1,999
2020 1999 1,999 x 1.08 2,159
9.1.1 Mathematical Symbolism In the school enrolment example discussed above, the exponent of 1.08 i.e. (1+ r) between two consecutive years (e.g. 2010 and 2011) is 1. Between 2010 and 2015, it is 5, and between 2010 and 2020 it is 10. In mathematical terms, these can be stated as:
1. Between 2010 and 2011 (1 + r)1 or (1.08)1 2. Between 2010 and 2015 (1+ r)5 or (1.08)5 3. Between 2020 and 2020 (1+ r)10 or (1.08)10
Stated differently, we are saying that to:
1. Project the enrolment for 2011, the enrolment for 2010 was multiplied by 1.08;
2. Project the enrolment for 2015, the enrolment for 2010 was multiplied by 1.08 five times; similarly
3. Obtain the enrolment for 2020, the enrolment for 2010 was multiplied by 1.08 ten times.
In mathematical terms, the following formula emerges:
…..……(1)

Study Session 9Average Annual Growth Rate in Population
75
Where:
Eo= Enrolment in the initial year 2010
En = Enrolment in the final year 2020
r = Rate of enrolment increase (here 1.08)
n = Number of year in-between the initial and final year under consideration. For example, from 2010 to 2020 is 10 years.
Inserting the figures from our examples:
9.1.2 Derivation of Formula In demography, the relation is given as:
…..2
For determining the average annual rate of growth.
In the above, equation (1) is not only used in connection with enrolment but also with others which grow according to a geometric progression. For example, in demography when “E” is substituted with “P” and the exponent “n” refers to the number of grow periods. In our example, it referred to time interval in years. In some cases such growth period may be calculated in periods which are shorter or longer than year. Hence:
“n refers to the number of time intervals between”
Where:
Pn= final year’s population
Po = initial year’s population
r = rate of change in population
n = number of years between initial period and final period.
Now,
Suppose, we want to find r
Then:
Take log of both sides:
i.e.
Note that, here you know the numerical values of Pn Po and n.
Then, take anti-log of the right hand side to get
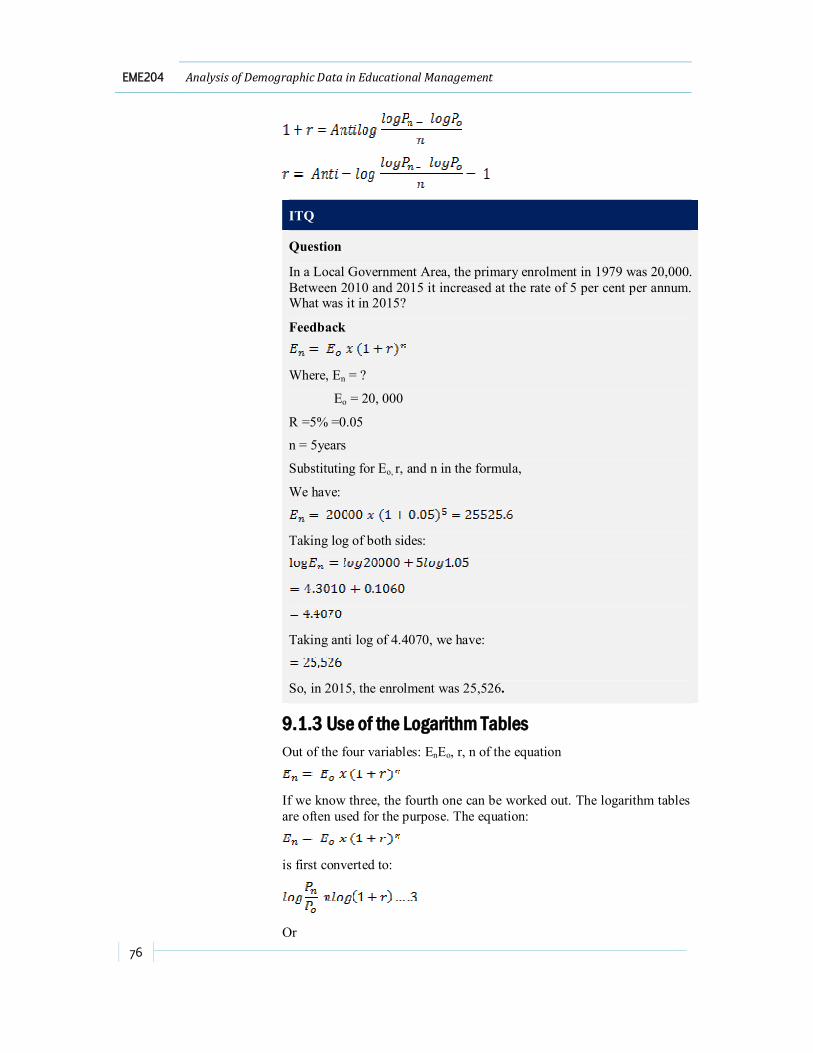
76
EME204 Analysis of Demographic Data in Educational Management
ITQ
Question
In a Local Government Area, the primary enrolment in 1979 was 20,000. Between 2010 and 2015 it increased at the rate of 5 per cent per annum. What was it in 2015?
Feedback
Where, En = ?
Eo = 20, 000
R =5% =0.05
n = 5years
Substituting for Eo, r, and n in the formula,
We have:
Taking log of both sides:
Taking anti log of 4.4070, we have:
So, in 2015, the enrolment was 25,526.
9.1.3 Use of the Logarithm Tables Out of the four variables: EnEo, r, n of the equation
If we know three, the fourth one can be worked out. The logarithm tables are often used for the purpose. The equation:
is first converted to:
Or

Study Session 9Average Annual Growth Rate in Population
77
To elaborate the application of these equations, let us study the case of a school district where the primary school enrolment in 2010 was 20,000. Between 2010 and 2015, it increased at the rate of 5 per cent per annum. What was the enrolment in 2010?
Using our equation (4), we have:
Taking anti-log, we have:
Supposing, we know that the enrolment in 2010 was 20,000 and in 2015, it was 25,526 and we were to find out the rate of growth.
We can use equation (3) above:
Therefore:
Taking anti-log, we have:
ITQ
Question
Let us calculate as to how long it will take Nigeria’s present university enrolment of 50,000 to reach 100,000 if it grows at the rate of 10 per cent per annum.
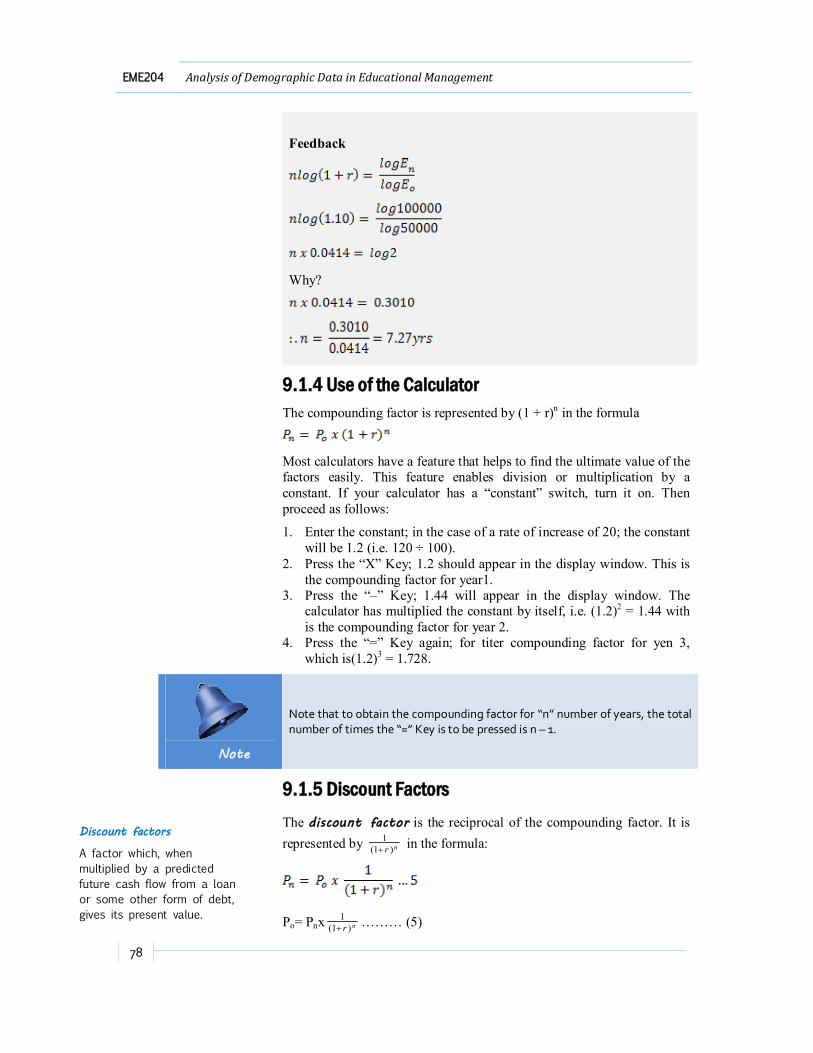
78
EME204 Analysis of Demographic Data in Educational Management
Discount factors
A factor which, when multiplied by a predicted future cash flow from a loan or some other form of debt, gives its present value.
Feedback
Why?
9.1.4 Use of the Calculator The compounding factor is represented by (1 + r)n in the formula
Most calculators have a feature that helps to find the ultimate value of the factors easily. This feature enables division or multiplication by a constant. If your calculator has a “constant” switch, turn it on. Then proceed as follows:
1. Enter the constant; in the case of a rate of increase of 20; the constant will be 1.2 (i.e. 120 ÷ 100).
2. Press the “X” Key; 1.2 should appear in the display window. This is the compounding factor for year1.
3. Press the “–” Key; 1.44 will appear in the display window. The calculator has multiplied the constant by itself, i.e. (1.2)2 = 1.44 with is the compounding factor for year 2.
4. Press the “=” Key again; for titer compounding factor for yen 3, which is(1.2)3 = 1.728.
Note
Note that to obtain the compounding factor for “n” number of years, the total number of times the “=” Key is to be pressed is n – 1.
9.1.5 Discount Factors The discount factor is the reciprocal of the compounding factor. It is represented by nr )1(
1 in the formula:
Po= Pnx nr )1(1 ……… (5)
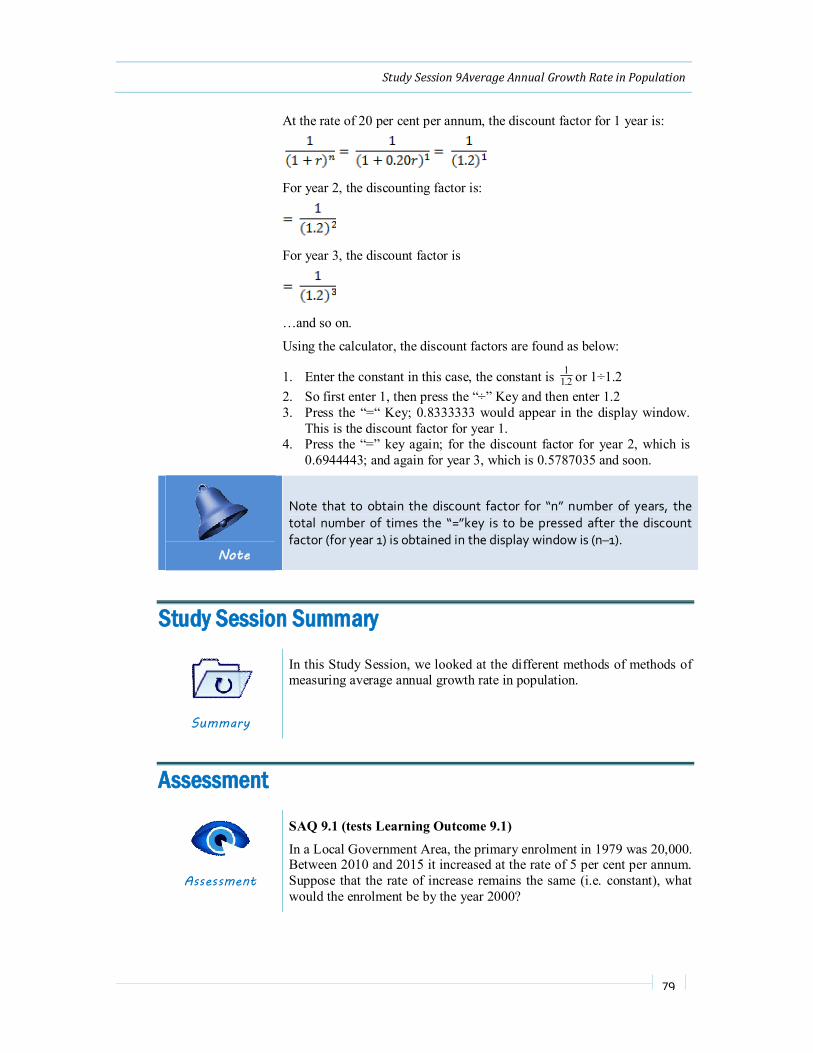
Study Session 9Average Annual Growth Rate in Population
79
At the rate of 20 per cent per annum, the discount factor for 1 year is:
For year 2, the discounting factor is:
For year 3, the discount factor is
…and so on.
Using the calculator, the discount factors are found as below:
1. Enter the constant in this case, the constant is 2.11 or 1÷1.2
2. So first enter 1, then press the “÷” Key and then enter 1.2 3. Press the “=“ Key; 0.8333333 would appear in the display window.
This is the discount factor for year 1. 4. Press the “=” key again; for the discount factor for year 2, which is
0.6944443; and again for year 3, which is 0.5787035 and soon.
Note
Note that to obtain the discount factor for “n” number of years, the total number of times the “=”key is to be pressed after the discount factor (for year 1) is obtained in the display window is (n–1).
Study Session Summary
Summary
In this Study Session, we looked at the different methods of methods of measuring average annual growth rate in population.
Assessment
Assessment
SAQ 9.1 (tests Learning Outcome 9.1)
In a Local Government Area, the primary enrolment in 1979 was 20,000. Between 2010 and 2015 it increased at the rate of 5 per cent per annum. Suppose that the rate of increase remains the same (i.e. constant), what would the enrolment be by the year 2000?

80
EME204 Analysis of Demographic Data in Educational Management
Bibliography
Reading
Owolabi, J. (2001). ‘Curriculum planning and manpower development in Nigeria’. A paper presented at the Annual Conference of the Nigerian Association for Educational Administration and Planning, held at the University of Benin, Benin City, Nigeria, October 29th-November 1st , 2001
Owolabi J, (2006). Quantitative methods of educational planning. Makere University, kampala. Lucky Odoni (Nig) Emterprises, Ogun, Nigeria.
Owolabi, S.O. (2000). School mapping for Ghana: training manual, Accra, Ghana. UNICEF
Patwari, A.S. and Akinwumiju J.A. statistical Analysis of demographic data. Ibadan department of educational management, U.I, 1990
Study Session 10Determining the School Age Population
81
Age group
A number of people or things classed together as being of similar age.
Study Session 10
Determining the School Age Population Introduction
As a manager of educational programme, you are expected to know about techniques for protecting future demands for education. To be proficient in calculating the number of children expected in various grades in the future. As basis for your calculations, you must be capable to determining the number of children that are qualified by age, to be in each grade. However, figures in additional census data are usually presented in 5 or 10 years age groups. This study session shows you how to break up the 5-year age-group population (or 10 years age groups) into single year-ages. Once you can determine the single year-ages of any census figure, you will be able to calculate school age population at any level.
Learning Outcomes
Outcomes
When you have studied this session, you should be able to
10.1 illustrate how to determine school age population
Terminology Age group Persons of approximately the same age and often of the
same sex, nationality, educational or social background, etc.
10.1 Determine the School Age Populations The groupings in census reports do not often correspond to school age populations. Hence educational managers need to know the techniques of estimating these populations (e.g. primary and secondary school age population), from the National census data. The most popular technique splits the number in census age groups into number for single-years of age. The single-year age population is then summed up to arrive at the required school age population. This method will first required splitting the ten-year age-groups into two groups each by following formula:
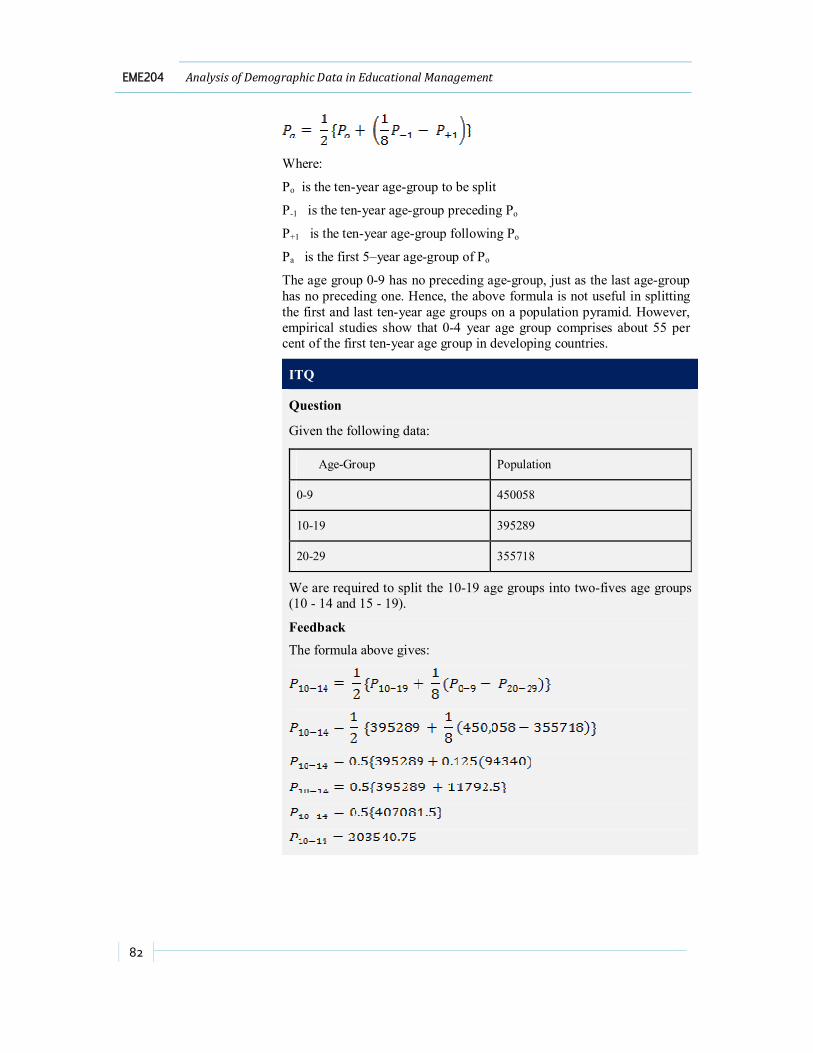
82
EME204 Analysis of Demographic Data in Educational Management
Where:
Po is the ten-year age-group to be split
P-1 is the ten-year age-group preceding Po
P+1 is the ten-year age-group following Po
Pa is the first 5–year age-group of Po
The age group 0-9 has no preceding age-group, just as the last age-group has no preceding one. Hence, the above formula is not useful in splitting the first and last ten-year age groups on a population pyramid. However, empirical studies show that 0-4 year age group comprises about 55 per cent of the first ten-year age group in developing countries.
ITQ
Question
Given the following data:
Age-Group Population
0-9 450058
10-19 395289
20-29 355718
We are required to split the 10-19 age groups into two-fives age groups (10 - 14 and 15 - 19).
Feedback
The formula above gives:

Study Session 10Determining the School Age Population
83
10.1.1 Dividing Five-Year Age-Groups into Single-Year Groups If it is possible to know the actual number of children aged 6, 7, 8, ..,, then it will be easy to compute the school age populations. Two methods of making interpolations can be used to break up the number in the Five-year age-groups into single-year numbers. The single-year groups can then be summed up for any age bracket we want. A manager must not however lose sight of the limit of the accuracy of such derived data. The splitting techniques cannot guarantee exact single-year figures for any particular society. However, when there is reason to believe that there has been no variation in the birth rate in the preceding years, the interpolations can be reliable. Epidemics war of genocide and baby booms are common causes of variations in the birth rates. The two methods of interpolations cannot be relied upon when such incidences are noticeable.
10.1.2 Using the Sprague Multipliers Table of Sprague multipliers (coefficients) are established to facilitate computation when splitting numbers. The procedure for operation requires knowing the numbers in the age-groups under consideration, as well as numbers in the two proceedings and two following age-groups. There are five different types of age-groups to consider. The first group (0-4 year age-group) has no preceding age-group. The second (5-9 year age-group) has only one preceding group. The third is made of 70-74 year older and 75 plus. The interpolation of the first group is based on the numbers in the three following age groups. That of the second is based on one preceding and two following age-groups. The procedures are reversed when splitting numbers in the last two age-groups into single-year numbers.
Table 10.1 The Sprague Multiplier
The Sprague Multipliers
AGE
Age-Groups
0 –4 5–9 10–14
15–19
20–24
25–29
0 yrs. +0.3616
-0.2768
+0.1488
-0.0338 - -
1 yrs. +0.264
-0.096 +0.04
-0.008 - -
2 yrs. +0.184 +0.04
-0.032
+0.008 - -
3 yrs. +0.12 +0.13 -0.72 +0.01 - -

84
EME204 Analysis of Demographic Data in Educational Management
6 68
4 yrs. +0.0704
+0.1968
-0.0848
+0.0176 - -
Second Table
5 yrs. +0.0339
+0.2272
-0.0752
+0.0144 - -
6 yrs. +0.009
+0.2272
-0.048
+0.008 - -
7 yrs. -0.008
+0.216
-0.008 +0 - -
8 yrs. -0.016
+0.184 +0.04
-0.008 - -
9 yrs.
-0.0176
+0.1408
+0.0912
-0.0144 - -
Intermediate Table
10 yrs.
-0.0128
+0.0848
+0.1504
-0.024
+0.0016 -
11 yrs.
-0.0016
+0.0144
+0.2224
-0.0416
+0.0064 -
12 yrs. +0.0064
-0.0336
+0.2544
-0.0336
+0.0064 -
13 yrs. +0.0064
-0.0416
+0.2224
+0.0144
-0.0016 -
14 yrs. +0.0016
-0.024
+0.1504
+0.0848
-0.0128 -
15 yrs. -
-0.0128
+0.0848
+0.1504
-0.024
+0.0016

Study Session 10Determining the School Age Population
85
16 yrs. -
-0.0016
+0.0144
+0.2224
-0.0416
+0.0064
17 yrs. - +0.0064
-0.0336
+0.2554
-0.0336
+0.0064
18 yrs. - +0.0064
-0.0416
+0.2224
+0.0144
-0.0016
19 yrs. - +0.0016
-0.024
+0.1504
+0.0848
-0.0128
20 yrs. - -
-0.0128
+0.0848
+0.1504
-0.024
+0.0016
Five tables of coefficients are therefore necessary. Since educational managers have little or no business with the last two age groups three tables of coefficients with suffice.
10.1.3 Procedure for Calculations Any single-years age data can be determined by multiplying the number in the appropriate five years age-groups with the coefficients indicated against the single-years age for which the number is to be estimated.
ITQ
Question
Using example in Study session 10.2.1 (10 year figures have been split into 5 yeas age-groups), estimate the number of 6 year olds in the population:
Age group Population
0 – 4 247,532
5 – 9 202,526
10 – 14 203,541
15 – 19 191,748
20 – 24 185,780
Feedback
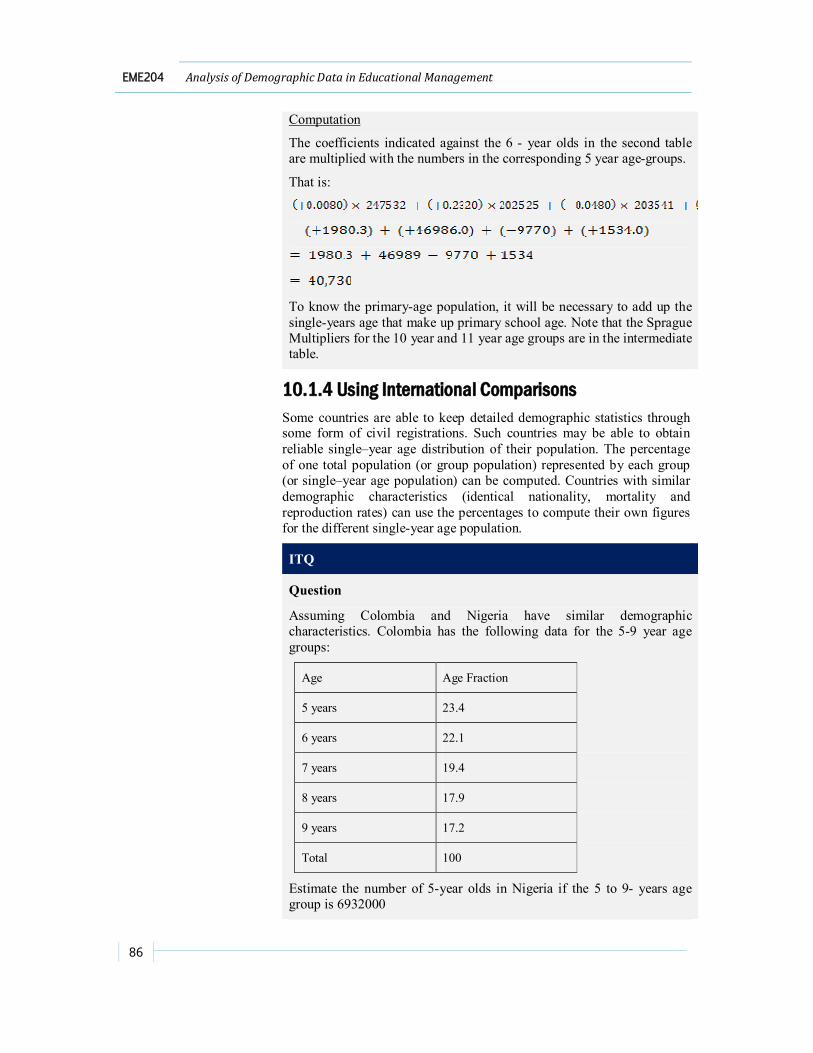
86
EME204 Analysis of Demographic Data in Educational Management
Computation
The coefficients indicated against the 6 - year olds in the second table are multiplied with the numbers in the corresponding 5 year age-groups.
That is:
To know the primary-age population, it will be necessary to add up the single-years age that make up primary school age. Note that the Sprague Multipliers for the 10 year and 11 year age groups are in the intermediate table.
10.1.4 Using International Comparisons Some countries are able to keep detailed demographic statistics through some form of civil registrations. Such countries may be able to obtain reliable single–year age distribution of their population. The percentage of one total population (or group population) represented by each group (or single–year age population) can be computed. Countries with similar demographic characteristics (identical nationality, mortality and reproduction rates) can use the percentages to compute their own figures for the different single-year age population.
ITQ
Question
Assuming Colombia and Nigeria have similar demographic characteristics. Colombia has the following data for the 5-9 year age groups:
Age Age Fraction
5 years 23.4
6 years 22.1
7 years 19.4
8 years 17.9
9 years 17.2
Total 100
Estimate the number of 5-year olds in Nigeria if the 5 to 9- years age group is 6932000
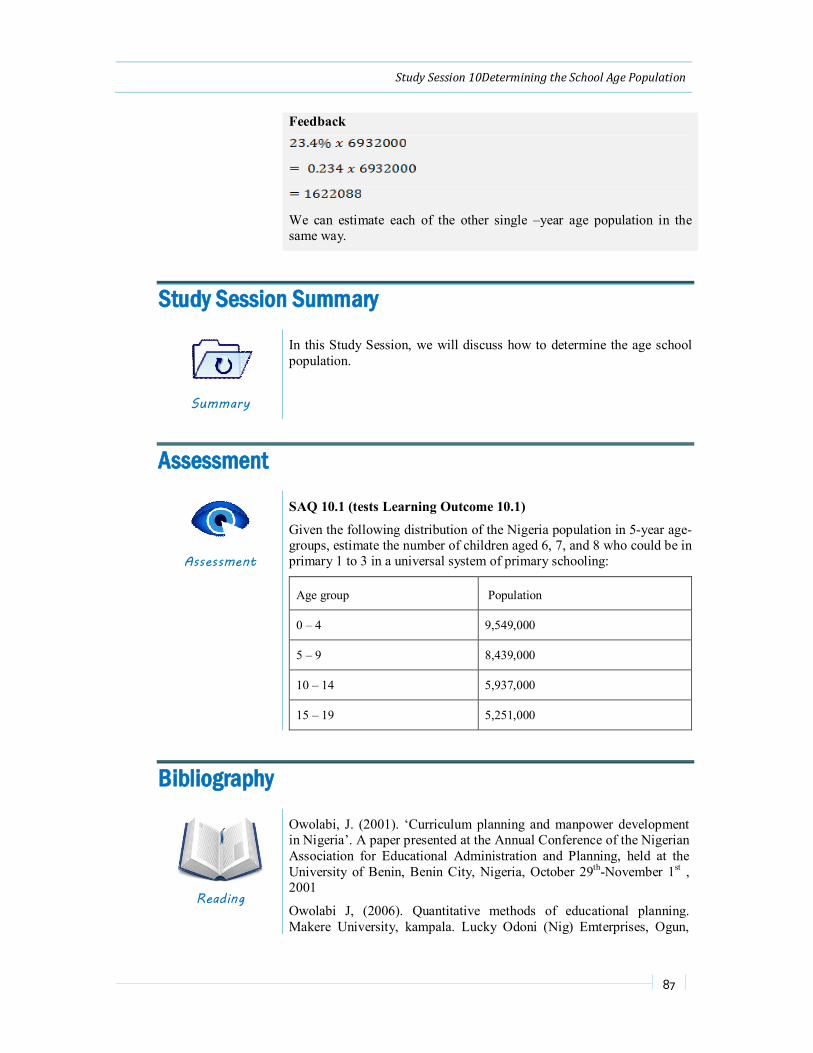
Study Session 10Determining the School Age Population
87
Feedback
We can estimate each of the other single –year age population in the same way.
Study Session Summary
Summary
In this Study Session, we will discuss how to determine the age school population.
Assessment
Assessment
SAQ 10.1 (tests Learning Outcome 10.1)
Given the following distribution of the Nigeria population in 5-year age-groups, estimate the number of children aged 6, 7, and 8 who could be in primary 1 to 3 in a universal system of primary schooling:
Age group Population
0 – 4 9,549,000
5 – 9 8,439,000
10 – 14 5,937,000
15 – 19 5,251,000
Bibliography
Reading
Owolabi, J. (2001). ‘Curriculum planning and manpower development in Nigeria’. A paper presented at the Annual Conference of the Nigerian Association for Educational Administration and Planning, held at the University of Benin, Benin City, Nigeria, October 29th-November 1st , 2001
Owolabi J, (2006). Quantitative methods of educational planning. Makere University, kampala. Lucky Odoni (Nig) Emterprises, Ogun,

88
EME204 Analysis of Demographic Data in Educational Management
Nigeria.
Owolabi, S.O. (2000). School mapping for Ghana: training manual, Accra, Ghana. UNICEF
Patwari, A.S. and Akinwumiju J.A. statistical Analysis of demographic data. Ibadan department of educational management, U.I, 1990
Study Session 11
Relative Value of Demographic Data Introduction
In study session four, we highlighted different sources of demographic data. We also pointed-out some problems associated with census data in Nigeria. In this study session, we will be made to see the complexities in the operation of census enumeration and the difficulties encountered in obtaining accurate demographic statistics, especially where the necessary facilities are not available and where people are illiterates and ignorant of the real purpose for census taking. We will then see why demographic data are generally not free of errors.
Learning Outcomes
Outcomes
When you have studied this session, you should be able to:
11.1 explain errors in demographic data
Terminology Census An official enumeration of the population, with details as
to age, sex, occupation, etc.
Sample A subset containing the characteristics of a larger population.
Study Session 11Relative Value of Demographic Data
89
Census
An official count or survey, especially of a population.
11.1 Errors in Demographic Data Census enumeration in Nigeria (and in the rest of the developing world), is bedevilled by so much technical, materials, organizational, psychological and political problems that the demographic data obtained from the census figures are usually subject to a wide margin of error.Let us now consider some of the errors due to the organization of enumeration.
11.1.1 Technical Problems Conducting census by self-enumeration has not been possible in Nigeria because of our low literacy ratios. Unlike census in the developed countries, Nigerian census requires the physical presence of the enumerators. The questionnaires have to be interview-administered. This poses the problem of where to meet the people.
By de-facto enumeration technique, the enumerator count people at the place where they are physically present at a particular time, such as on a census night. This may underestimate the actual population, as there could be some people in transit at the stated time-travellers, salesmen, drivers, cattle drovers and tramps (those who may be on ship in territorial waters, at airport, etc.).
By de-jure enumeration technique, people are counted in their usual places of residence. But many Nigerians do have more than one place of abode. The pitfall of this method therefore is that people who are highly residentially mobile may be double-counted if enumeration lasts for several hours. Attempts to confine the definition of “usual place of residence” to mean “parental home” will distort actual population situations –overestimating the population of the source regions of city migrants while seriously underestimating the population of cities, and to some extent, the administrative regions encompassing those cities. The Nigerian census of 1952/53 used the technique of de-facto enumeration, while the subsequent counts were more or less mixtures of de-facto and de-jure enumeration techniques.
11.1.2 Material Problems If other things are equal, the shorter the duration of the census exercise the more valid is the result. But poor infrastructural facilities in Nigeria make easy and quick contact with isolated and far away regions difficult. Providing adequate number of helicopters to resolve the problem of poor transportation and communication networks is not within the material capacity of any African government. The duration of census exercises are unavoidably longer than desired, and even then, whole ethnic groups are known to have been left out of national counting exercises because they were not accessible in time.
ITQ
Question

90
EME204 Analysis of Demographic Data in Educational Management
Where does de-factor enumeration technique count people?
Feedback
By de-facto enumeration technique, the enumerator count people at the place where they are physically present at a particular time, such as on a census night.
11.1.3 Organizational Problems To produce adequate number of well-trained enumerators, provide them with necessary incentives to endure hardships and faithfully carry out the assignments and organize an efficient supervision and monitoring activity. This is a task that has never been satisfactorily carried out by any African government.
11.1.4 Psychological Problems During the colonial administration income tax of a community was based on number of taxable adults in that community calculated after an initial headcount of the members of that community. Africans, therefore, tended to link any form of headcount with taxation and have always engaged various tactics to evade it. The pre-independence population figures in most African countries may therefore be undercounts.
11.1.5 Political Problems The multiplicity of ethnic groupings in every African country presents serious political problems that militate against any hope of accurate head counting. The loyalty of any Nigerian is first to his small enclave-the clan, the cottage, or village-then to his ethnic group or tribe and, if he is an elite, who is aware of the geographical extent of a country created for him, his loyalty to the amorphous political unit exists in proportion to the amount of his nationalistic sentiments. By and large the great majority of Nigerians (or Africans) put their tribes before their country. There are therefore sub-nations within the nation. Those sub-nations are rival groups that compete for political power at the centre. Since the political strength and the size of the sub-nations representation at the centre are dependent on their population size, ethnic groups and other forms of sub-regional groupings have strong motives for inflating their sizes. Charges of inflated number are difficult to prove where there has never been any census accepted by all as being accurate. In the 1973 census exercise in Nigeria, population figures were so much suspected to be unreasonably inflated that the Nigerian head state had to declare the figures released by the census board null and void.
Numbers could be inflated when enumerators are induced to count ghost inhabitant or when analysts decide to create their own figures institute of national census figures in Africa is low. Educational managers are advised to devise alternative ways of collecting demographic data for their administrative units of interest or use national census data with great collection, allowing for wide margins of errors that may arise as a result of the accurate data base.

Study Session 11Relative Value of Demographic Data
91
Sample
A small part or quantity intended to show what the whole is like.
11.1.6 Errors Due to Sampling A sample is representation of a larger population. The sample is expected to have the same characteristic as the parent population from which it is drawn. A sample of 10 schools out of a total number of 50 will be expected to exhibit all the characteristics of the 50 schools. The same expectation exists when the sample increases in number, say to be 40. You can see then that the representativeness of a sample depend to some extent on the size (the larger the sample the better chances has to being close to the actual fact). How well a sample represents the actual population also depends on the quality of the sampling, than on the skill of those in charge of the sampling procedure. When sample are too small or when the procedure for selection is poor, the characters exhibited may be very much different from the characters of the real population. Demographic data derived from sampling is always subject to sampling errors, the extent of which depends on sampling procedure adopted and sample size.
Controlling for Errors
The many errors which infiltrate into a census-taking operation which emanate as sampling errors because of the above listed factors can only be corrected to the extent that the direction of the errors whether upward or downward – and the relative size of the error is known. A control census is sometimes carried out for this purpose. A control census is applied to sample of the population but it is accomplished with better facilities and a more highly qualified staff. The comparison of the result obtained in the control census with the obtained in the initial census makes it possible to determine the relative values of the demographic data, and (when errors are committed, it makes it possible to discover the type and magnitude of errors).
Study Session Summary
Summary
In this Study Session, we looked at some of the errors that we encounter in demographic data.
Assessment
Assessment
SAQ 11.1 (tests Learning Outcome 11.1) Highlight any two types of the errors encountered in demographic data.
92
EME204 Analysis of Demographic Data in Educational Management
Bibliography
Reading
Kauchak, D; Eggen, P.; and Carter, C. (2002). Introduction to teaching: becoming a professional teacher. Upper Saddle River, NJ; Merrill Prentice Hall
Owolabi, J. (2001). ‘Statistical models and projections in educational management’ in Okunola P.O. (ed). Theory and practice of educational management, Oyo, Nigeria: OYSCEI
Owolabi, J. (2001). ‘Curriculum planning and manpower development in Nigeria’. A paper presented at the Annual Conference of the Nigerian Association for Educational Administration and Planning, held at the University of Benin, Benin City, Nigeria, October 29th-November 1st , 2001
Owolabi J, (2006). Quantitative methods of educational planning. Makere University, kampala. Lucky Odoni (Nig) Emterprises, Ogun, Nigeria.
Owolabi, S.O. (2000). School mapping for Ghana: training manual, Accra, Ghana. UNICEF
Patwari, A.S. and Akinwumiju J.A. statistical Analysis of demographic data. Ibadan department of educational management, U.I, 1990

Study Session 11Relative Value of Demographic Data
93
94
EME204 Analysis of Demographic Data in Educational Management
Systematic errors
An error having a non-zero mean, so that its effect is not reduced when observations are averaged.
Study Session 12
Detecting and Adjusting Age Errors Introduction
In this study session, we will be discussing how to detect and adjust age errors. We will begin by pointing out inaccuracies in census data. We will discuss how to detect age errors and how to adjust such errors.
Learning Outcomes
Outcomes
When you have studied this session, you should be able to:
12.1 explain inaccurate census data
Terminology Systematic error Consistent, repeatable error associated with faulty
equipment or a flawed experiment design.
12.1 Inaccurate Census Data To provide a fair chance for the successful implementation of educational planners therefore need to test for the accuracy of the demographic data obtainable. Besides the errors originating from the inefficient organization of the enumeration, the accuracy of the information supplied to census enumeration is often in question. Fortunately, techniques have been developed for detecting and correcting systematic errors. The most common systematic error in census enumeration is inaccurate age reporting. An age distribution of a population may be inaccurate if there are false statements made by those who do not know their true ages, or those who do not want their true ages to be known. There may also be those who prefer to report their ages in figures ending in 0 and 5. When a large proportion of the population exhibits such preference for particular figures the age distribution becomes consciously inaccurate.
12.1.1 Detecting Age Errors A number of tests are available for detecting and adjusting the age distribution of the population. Before applying any of these methods, we must be sure that we account for non-systematic errors, for example those
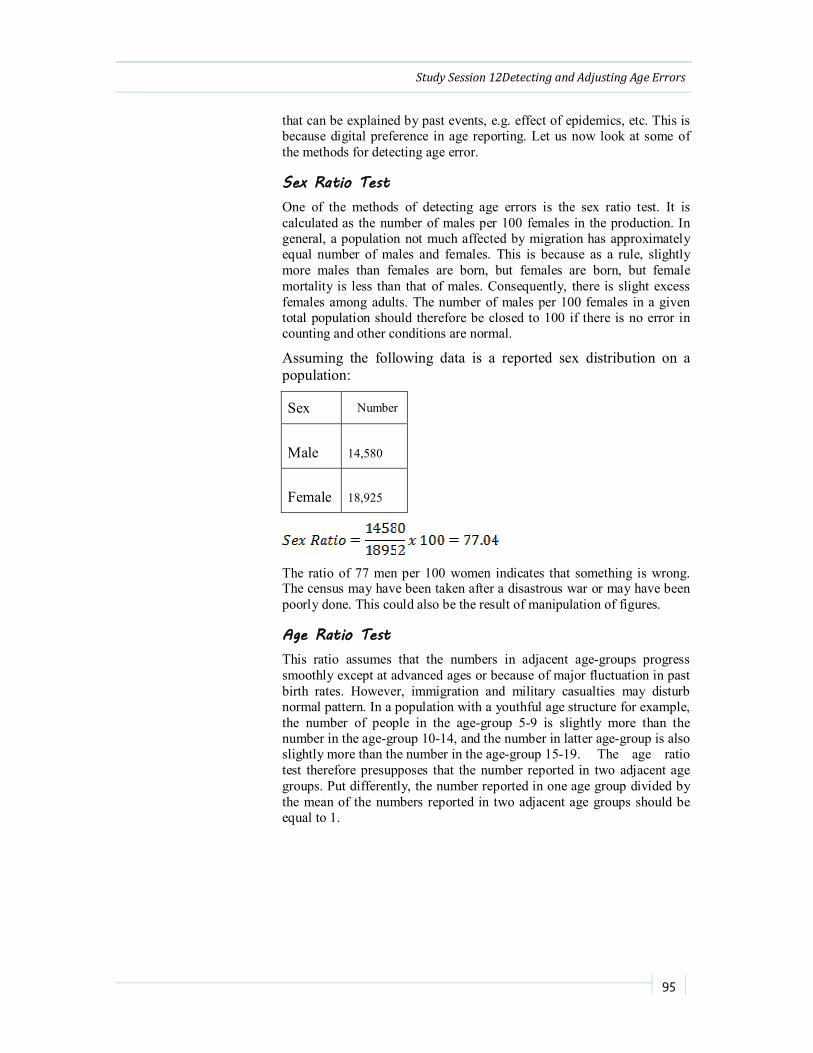
Study Session 12Detecting and Adjusting Age Errors
95
that can be explained by past events, e.g. effect of epidemics, etc. This is because digital preference in age reporting. Let us now look at some of the methods for detecting age error.
Sex Ratio Test One of the methods of detecting age errors is the sex ratio test. It is calculated as the number of males per 100 females in the production. In general, a population not much affected by migration has approximately equal number of males and females. This is because as a rule, slightly more males than females are born, but females are born, but female mortality is less than that of males. Consequently, there is slight excess females among adults. The number of males per 100 females in a given total population should therefore be closed to 100 if there is no error in counting and other conditions are normal.
Assuming the following data is a reported sex distribution on a population:
Sex Number
Male 14,580
Female 18,925
The ratio of 77 men per 100 women indicates that something is wrong. The census may have been taken after a disastrous war or may have been poorly done. This could also be the result of manipulation of figures.
Age Ratio Test This ratio assumes that the numbers in adjacent age-groups progress smoothly except at advanced ages or because of major fluctuation in past birth rates. However, immigration and military casualties may disturb normal pattern. In a population with a youthful age structure for example, the number of people in the age-group 5-9 is slightly more than the number in the age-group 10-14, and the number in latter age-group is also slightly more than the number in the age-group 15-19. The age ratio test therefore presupposes that the number reported in two adjacent age groups. Put differently, the number reported in one age group divided by the mean of the numbers reported in two adjacent age groups should be equal to 1.

96
EME204 Analysis of Demographic Data in Educational Management
Suppose we have the following distribution for a country:
Age groups Numbers
0 -4 440,000
5-9 425,000
10-14 405,000
The age-ratio for the groups=
This counting is fairly accurate.
ITQ
Question
The Table below is an assumed Sex and Age Ratios for Population of Nigeria, 2003
Age Group
Population ('000) Sex Ratio
Age Ratio
Total Male Female Male Female
1 2 3 4 5 6 7
0-4 9549 4710 4839 97
5-9 8439 4361 4078 107 1.1 1.084
10-14 5937 3255 2682 121 0.969 0.78
Find the age ratio.
Feedback
As we can see from the table the sex ratio for age 5—9
Their age ratio equals:

Study Session 12Detecting and Adjusting Age Errors
97
Comparison Test
In this test, we normally compare the reported age structure with an appropriate stable age structure. For example in a stable population with relatively high fertility, the age structure has a pyramidal shape.Compare different age structures to illustrate relative fertility levels, dependency rates and other ratios.
Other Tests In order to measure the degree of age accuracy, a number of other methods have been developed. These are Whipple index, Myer’s index, Bachi’s index and UN method. We shall briefly look at just one.
Whipple index is used to detect the concentration on ages ending in 0s or 5s.
To compute this index:
Sum up the ages between 23 and 62.
Sum up the ages ending in 0s and 5s.
The result should vary between a minimum of 100 representing no concentration at all, and a maximum of 500 If not returns were recorded with any digits other than 0 and 5.
12.1.2 Adjusting Age Errors If accuracies in statements are due to digital preference (when respondents are attracted to figures ending in 0 and 5), grouping the ages in consecutive five age-groups eliminates the irregularities because in each five years age group, there will be an ending in 5 or in 0. Most census reports are presented in 5-years age-groups. If inaccuracies which have no historical explanations still persists, you can use the Logit, Carrier-Farra Ratio, and the UN methods. I shall not bug you with too many technicalities, but let us consider one methods of smoothing the age structure. The UN method links the five years age-group to the two age- groups preceding and the two age-groups following, by this formula:
P0 =1/16(-p-2+4p-1+10p+4p-2) Where
P0 = the number in the age-group to be considered,
P-1 = the first preceding age group
P-2 =the second preceding age-group

98
EME204 Analysis of Demographic Data in Educational Management
P1= the first following age-group
P2 = the second following age-group
p0 = the required adjusted number in the age-group considered.
The only drawback of these adjustment techniques is that they eliminate irregularities without discrimination. Not only are the irregularities due to false statements eliminated, irregularities due to the particular history of a population are as well wiped out. These formulae also make no adequate provision for adjusting numbers in the first and the last age group on a population pyramid.
Study Session Summary
Summary
In this Study Session, we examined how to detect and adjust age errors. We started by examining inaccurate census data. We also discuss the different methods of detecting age errors.
Assessment
Assessment
SAQ 12.1 (tests Learning Outcome 12.1) There are three methods of detecting age errors. Discuss any two (2) 0f them.
Bibliography
Reading
Owolabi, J. (2001). ‘Statistical models and projections in educational management’ in Okunola P.O. (ed). Theory and practice of educational management, Oyo, Nigeria: OYSCEI
Owolabi, J. (2001). ‘Curriculum planning and manpower development in Nigeria’. A paper presented at the Annual Conference of the Nigerian Association for Educational Administration and Planning, held at the University of Benin, Benin City, Nigeria, October 29th-November 1st , 2001
Owolabi J, (2006). Quantitative methods of educational planning. Makere University, kampala. Lucky Odoni (Nig) Emterprises, Ogun, Nigeria.
Owolabi, S.O. (2000). School mapping for Ghana: training manual, Accra, Ghana. UNICEF
Patwari, A.S. and Akinwumiju J.A. statistical Analysis of demographic
Study Session 13Population Distribution and School Locational Planning
99
data. Ibadan department of educational management, U.I, 1990
Study Session 13
Population Distribution and School Locational Planning
Introduction There is a limit to the usefulness of density maps when planning the location of schools. The planner needs to know the exact density of each village as well as the settlement patterns. Conducting sample studies cannot help the educational planner, as the peculiar characteristics of each village cannot be become known in a sample. In this study session, you are going to read the best way to present your data on population of new schools, and about the problem of citing schools in sparsely populated rural district.
Learning Outcomes
Outcomes
When you have studied this session, you should be able to:
13.1 discuss the geographical distribution of population
Terminology Population density
The number of people living per unit of an area (e.g. per square mile); the number of people relative to the space occupied by them.
Catchment area The area from which a city, service or institution attracts a population that uses its services.

100
EME204 Analysis of Demographic Data in Educational Management
Population density
Measure of the intensity of land use, expressed as number of people per square kilometer or square mile.
13.1 Geographical Distribution of Population Population density maps provide a rough assessment of the geographical distribution of population. From the map one can know which area are sparsely populated and those that are densely populated. However, to provide useful guide to an educational planner more information is required than what could be read from a density map. There are two kinds of settlement patterns. We have the nucleated pattern where large numbers of people build houses very close to each other. In such places, we have large number of people coming from a small area. People in a large geographic unit can settle in a few locations in nucleated pattern. The population, distributed over the whole area may be sparse, but because they are assembled in few locations they adopt the characteristics of urban areas. Conversely, densely populated areas may have dispersed settlement pattern. In survey the population distribution of an area, we must focus on the smallest administration units, as an average density figure is necessarily of less significance.
The density of each administrative unit is best appreciated after a complete census of the population. When the population data are based on village survey by sampling, estimates of population density in such cases is extremely vague, because when sample results are extrapolated to the whole administrative units, village densities are hidden. A large city can raise the density rate of an administrative unit and falsify the data for the rural areas contained in that unit. For this reason, the population of urban centres should be excluded when estimating densities for the purpose of school location.
13.1.1 Measuring the Geographical Distribution of a Population A way of estimating the geographical spread of a population is to classify the units according to the number of their inhabitants. We can list all settlement that has less than 500 people, those with population range of 500—999, and so on. We can determine the proportion of the total that each of these groupings constitutes. Even though the overall size of the local characteristics of the communities (whether settlement is nucleated or dispersed), the classification by number can be helpful to policy makers. The implication of indicating minimum size of a village that can attract a school becomes obvious. Such data on a local government area is important for planning the location of educational institutions.
Below in Table 13.1, is the assumed distribution of villages in Morocco according to size of population. This table shows that more than four fifths of the total Moroccan population lives in communities of less than 500 people. This would appear to be a major problem for the development of education in rural areas.
Table 13.1 Distribution of villages in Morocco according to size of population
Population Number of villages Percentage of total
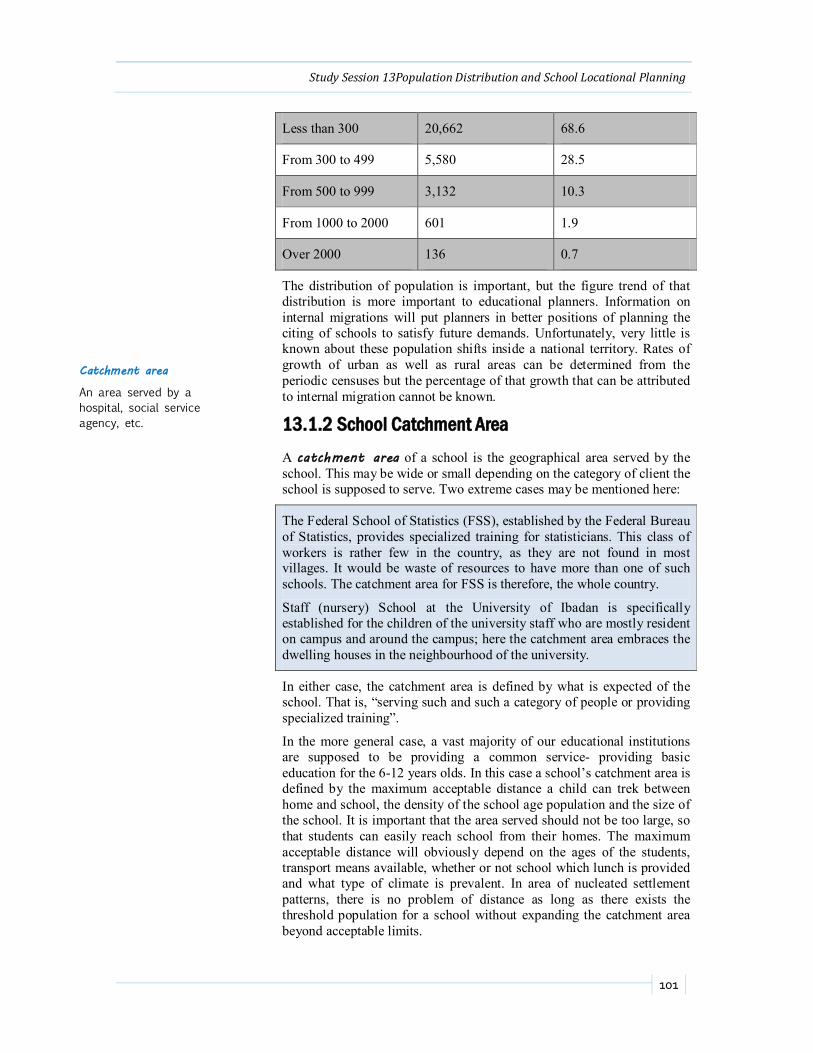
Study Session 13Population Distribution and School Locational Planning
101
Catchment area
An area served by a hospital, social service agency, etc.
Less than 300 20,662 68.6
From 300 to 499 5,580 28.5
From 500 to 999 3,132 10.3
From 1000 to 2000 601 1.9
Over 2000 136 0.7
The distribution of population is important, but the figure trend of that distribution is more important to educational planners. Information on internal migrations will put planners in better positions of planning the citing of schools to satisfy future demands. Unfortunately, very little is known about these population shifts inside a national territory. Rates of growth of urban as well as rural areas can be determined from the periodic censuses but the percentage of that growth that can be attributed to internal migration cannot be known.
13.1.2 School Catchment Area A catchment area of a school is the geographical area served by the school. This may be wide or small depending on the category of client the school is supposed to serve. Two extreme cases may be mentioned here:
The Federal School of Statistics (FSS), established by the Federal Bureau of Statistics, provides specialized training for statisticians. This class of workers is rather few in the country, as they are not found in most villages. It would be waste of resources to have more than one of such schools. The catchment area for FSS is therefore, the whole country.
Staff (nursery) School at the University of Ibadan is specifically established for the children of the university staff who are mostly resident on campus and around the campus; here the catchment area embraces the dwelling houses in the neighbourhood of the university.
In either case, the catchment area is defined by what is expected of the school. That is, “serving such and such a category of people or providing specialized training”.
In the more general case, a vast majority of our educational institutions are supposed to be providing a common service- providing basic education for the 6-12 years olds. In this case a school’s catchment area is defined by the maximum acceptable distance a child can trek between home and school, the density of the school age population and the size of the school. It is important that the area served should not be too large, so that students can easily reach school from their homes. The maximum acceptable distance will obviously depend on the ages of the students, transport means available, whether or not school which lunch is provided and what type of climate is prevalent. In area of nucleated settlement patterns, there is no problem of distance as long as there exists the threshold population for a school without expanding the catchment area beyond acceptable limits.
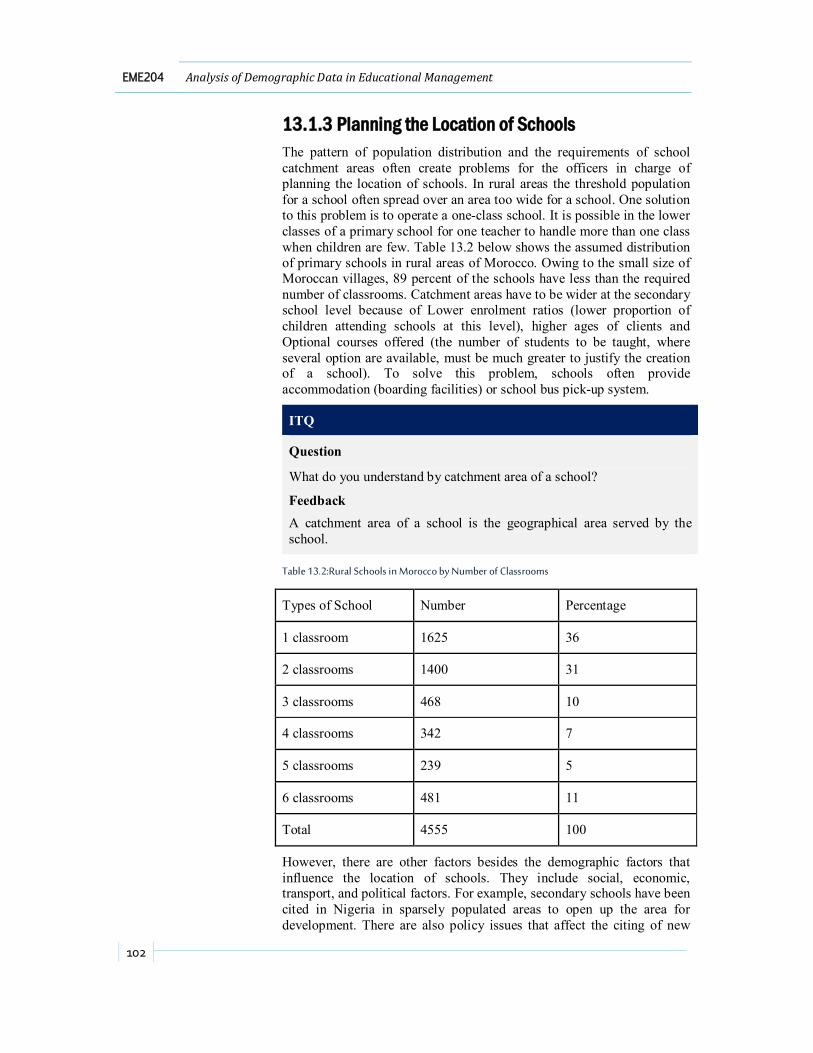
102
EME204 Analysis of Demographic Data in Educational Management
13.1.3 Planning the Location of Schools The pattern of population distribution and the requirements of school catchment areas often create problems for the officers in charge of planning the location of schools. In rural areas the threshold population for a school often spread over an area too wide for a school. One solution to this problem is to operate a one-class school. It is possible in the lower classes of a primary school for one teacher to handle more than one class when children are few. Table 13.2 below shows the assumed distribution of primary schools in rural areas of Morocco. Owing to the small size of Moroccan villages, 89 percent of the schools have less than the required number of classrooms. Catchment areas have to be wider at the secondary school level because of Lower enrolment ratios (lower proportion of children attending schools at this level), higher ages of clients and Optional courses offered (the number of students to be taught, where several option are available, must be much greater to justify the creation of a school). To solve this problem, schools often provide accommodation (boarding facilities) or school bus pick-up system.
ITQ
Question
What do you understand by catchment area of a school?
Feedback A catchment area of a school is the geographical area served by the school.
Table 13.2:Rural Schools in Morocco by Number of Classrooms
Types of School Number Percentage
1 classroom 1625 36
2 classrooms 1400 31
3 classrooms 468 10
4 classrooms 342 7
5 classrooms 239 5
6 classrooms 481 11
Total 4555 100
However, there are other factors besides the demographic factors that influence the location of schools. They include social, economic, transport, and political factors. For example, secondary schools have been cited in Nigeria in sparsely populated areas to open up the area for development. There are also policy issues that affect the citing of new

Study Session 13Population Distribution and School Locational Planning
103
schools. The question that equal opportunities be provided for both boys and girls regardless of where they live; should universal basic education be made compulsory; etc. may lead to the creation of educational institutions in all part of the country and in the least favourable sites with all the consequences that they will have on the expenditure on education.
Study Session Summary
Summary
In this Study Session, we looked at population distribution and school location planning. In order to do this, we discussed how to measure the geographical distribution of a population. We also examined what we mean by school catchment areas. Lastly, we enumerated how to plan the location of a school.
Assessment
Assessment
SAQ 13.1 (tests Learning Outcome 13.1) Assuming an entrepreneur, who wishes to invest in educational sector, asked you to explain how to determine where to locate a school. Describe to him how the location of a school can be planned.
Bibliography
Reading
Essay24.com (2017). Definition, Nature, Scope and importance of Demography. www.essay24.com/social-issues/definition-nature-scope-and-importance-of-demography/47935.html
Kauchak, D; Eggen, P.; and Carter, C. (2002). Introduction to teaching: becoming a professional teacher. Upper Saddle River, NJ; Merrill Prentice Hall
Owolabi, J. (2001). ‘Curriculum planning and manpower development in Nigeria’. A paper presented at the Annual Conference of the Nigerian Association for Educational Administration and Planning, held at the University of Benin, Benin City, Nigeria, October 29th-November 1st , 2001
Owolabi J, (2006). Quantitative methods of educational planning. Makere University, kampala. Lucky Odoni (Nig) Emterprises, Ogun, Nigeria.
Owolabi, S.O. (2000). School mapping for Ghana: training manual, Accra, Ghana. UNICEF
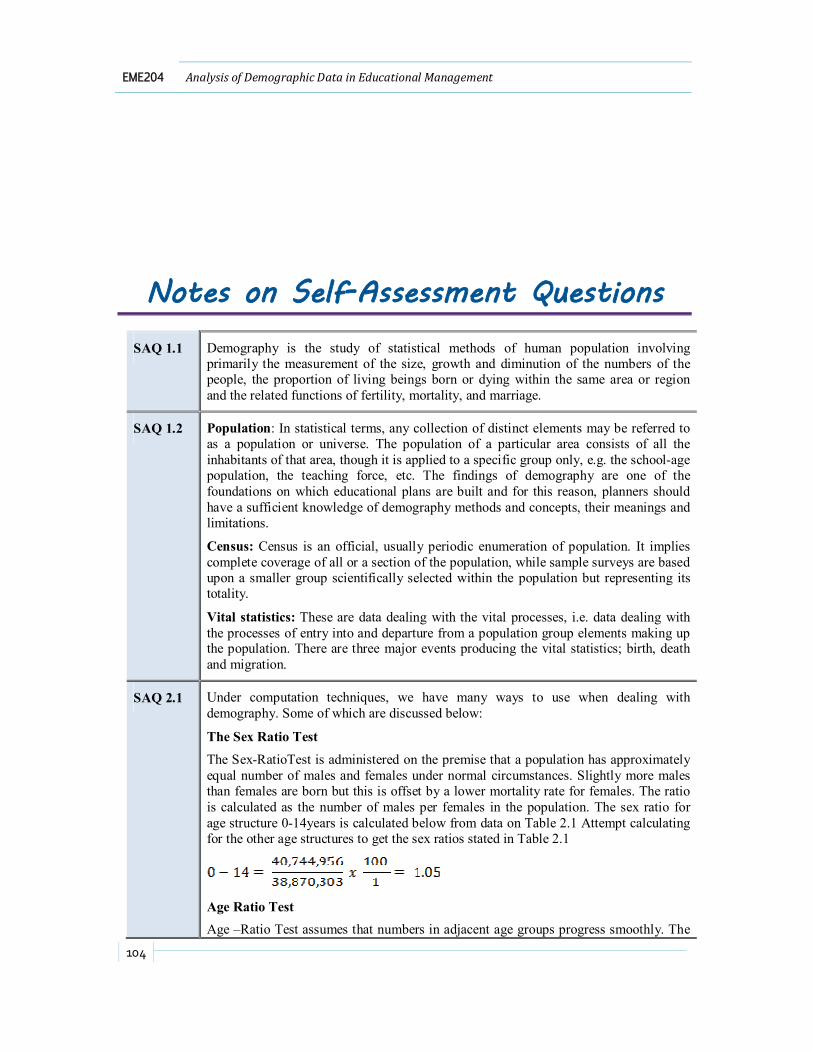
104
EME204 Analysis of Demographic Data in Educational Management
Notes on Self-Assessment Questions
SAQ 1.1 Demography is the study of statistical methods of human population involving primarily the measurement of the size, growth and diminution of the numbers of the people, the proportion of living beings born or dying within the same area or region and the related functions of fertility, mortality, and marriage.
SAQ 1.2 Population: In statistical terms, any collection of distinct elements may be referred to as a population or universe. The population of a particular area consists of all the inhabitants of that area, though it is applied to a specific group only, e.g. the school-age population, the teaching force, etc. The findings of demography are one of the foundations on which educational plans are built and for this reason, planners should have a sufficient knowledge of demography methods and concepts, their meanings and limitations.
Census: Census is an official, usually periodic enumeration of population. It implies complete coverage of all or a section of the population, while sample surveys are based upon a smaller group scientifically selected within the population but representing its totality.
Vital statistics: These are data dealing with the vital processes, i.e. data dealing with the processes of entry into and departure from a population group elements making up the population. There are three major events producing the vital statistics; birth, death and migration.
SAQ 2.1 Under computation techniques, we have many ways to use when dealing with demography. Some of which are discussed below:
The Sex Ratio Test The Sex-RatioTest is administered on the premise that a population has approximately equal number of males and females under normal circumstances. Slightly more males than females are born but this is offset by a lower mortality rate for females. The ratio is calculated as the number of males per females in the population. The sex ratio for age structure 0-14years is calculated below from data on Table 2.1 Attempt calculating for the other age structures to get the sex ratios stated in Table 2.1
Age Ratio Test Age –Ratio Test assumes that numbers in adjacent age groups progress smoothly. The

Notes on Self-Assessment QuestionsPopulation Distribution and School Locational Planning
105
ratio is defined as the number reported in one age group divided by the mean number in two adjacent age groups. For example,
Age ratio for (Males) ages 15-24years =
Crude Birth Rate This is the number of live births occurring in a group in a given year divided by the estimated, mid-year population of that group. (It is a popular convention in demography to use mid-year figures, which can be obtained by simple interpretation:
Where:
= the population statistics at the beginning of year
t1 and t2 is the statistics at the beginning of year (t +1)
Symbolically,
Where B Number of live births in a year
P Total mid-year population in the same year
K An arbitrary constant per which we like to express our rates. K is often assumed to be 1000.
SAQ 3.1 The Uses of Demographic Analysis include:
To Determine Programme Size
To make correct estimates of resources needs
The proper allocation of resources
For accurate manpower planning
For the organization of production
To show long-term trends
SAQ 4.1 Educational managers in Africa are handicapped by lack of accurate statistical figures. Most population data in the continent of Africa are inadequate as they are unreliable. Quantitative estimates of educational targets are often based on speculative rather than on valid figures. This explains why failures to reach anticipated targets of quantitative achievements are common and frequent in African countries.
SAQ 4.2 Population Censuses, Sample Surveys are from non-traditional sources or vital registrations such as:
The Income Tax Register School Enrolment Registers
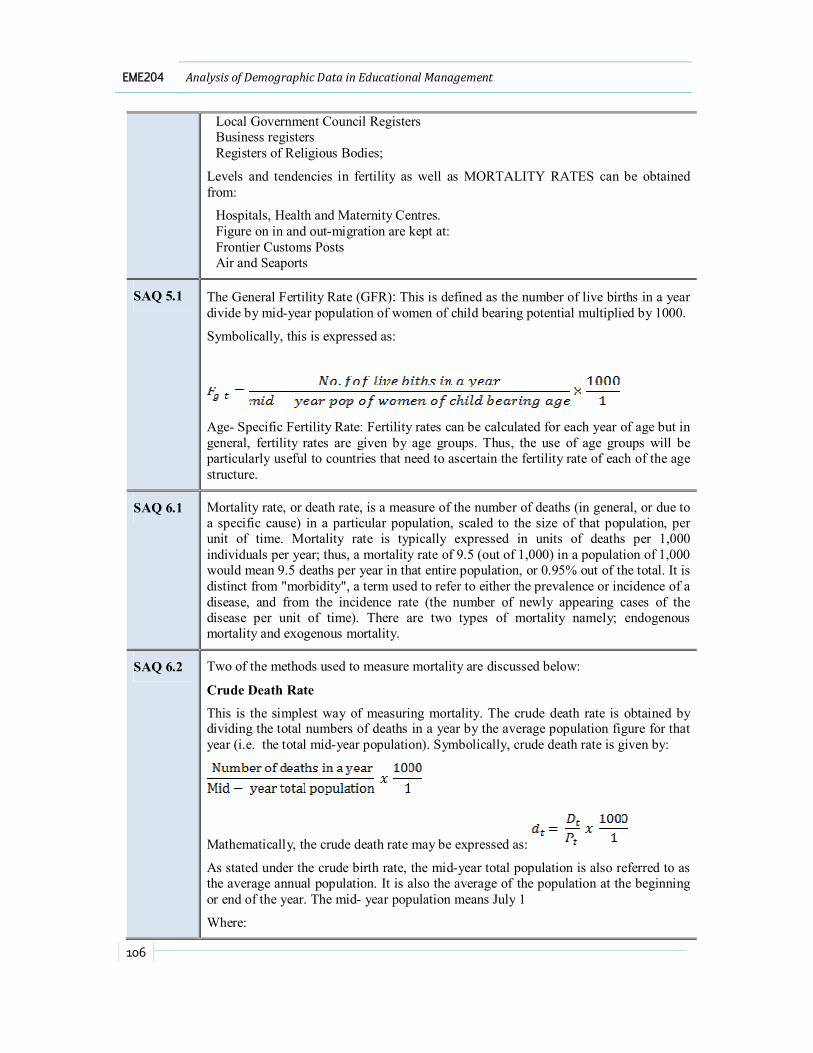
106
EME204 Analysis of Demographic Data in Educational Management
Local Government Council Registers Business registers Registers of Religious Bodies;
Levels and tendencies in fertility as well as MORTALITY RATES can be obtained from:
Hospitals, Health and Maternity Centres. Figure on in and out-migration are kept at: Frontier Customs Posts Air and Seaports
SAQ 5.1 The General Fertility Rate (GFR): This is defined as the number of live births in a year divide by mid-year population of women of child bearing potential multiplied by 1000. Symbolically, this is expressed as:
Age- Specific Fertility Rate: Fertility rates can be calculated for each year of age but in general, fertility rates are given by age groups. Thus, the use of age groups will be particularly useful to countries that need to ascertain the fertility rate of each of the age structure.
SAQ 6.1 Mortality rate, or death rate, is a measure of the number of deaths (in general, or due to a specific cause) in a particular population, scaled to the size of that population, per unit of time. Mortality rate is typically expressed in units of deaths per 1,000 individuals per year; thus, a mortality rate of 9.5 (out of 1,000) in a population of 1,000 would mean 9.5 deaths per year in that entire population, or 0.95% out of the total. It is distinct from "morbidity", a term used to refer to either the prevalence or incidence of a disease, and from the incidence rate (the number of newly appearing cases of the disease per unit of time). There are two types of mortality namely; endogenous mortality and exogenous mortality.
SAQ 6.2 Two of the methods used to measure mortality are discussed below:
Crude Death Rate This is the simplest way of measuring mortality. The crude death rate is obtained by dividing the total numbers of deaths in a year by the average population figure for that year (i.e. the total mid-year population). Symbolically, crude death rate is given by:
Mathematically, the crude death rate may be expressed as:
As stated under the crude birth rate, the mid-year total population is also referred to as the average annual population. It is also the average of the population at the beginning or end of the year. The mid- year population means July 1
Where:
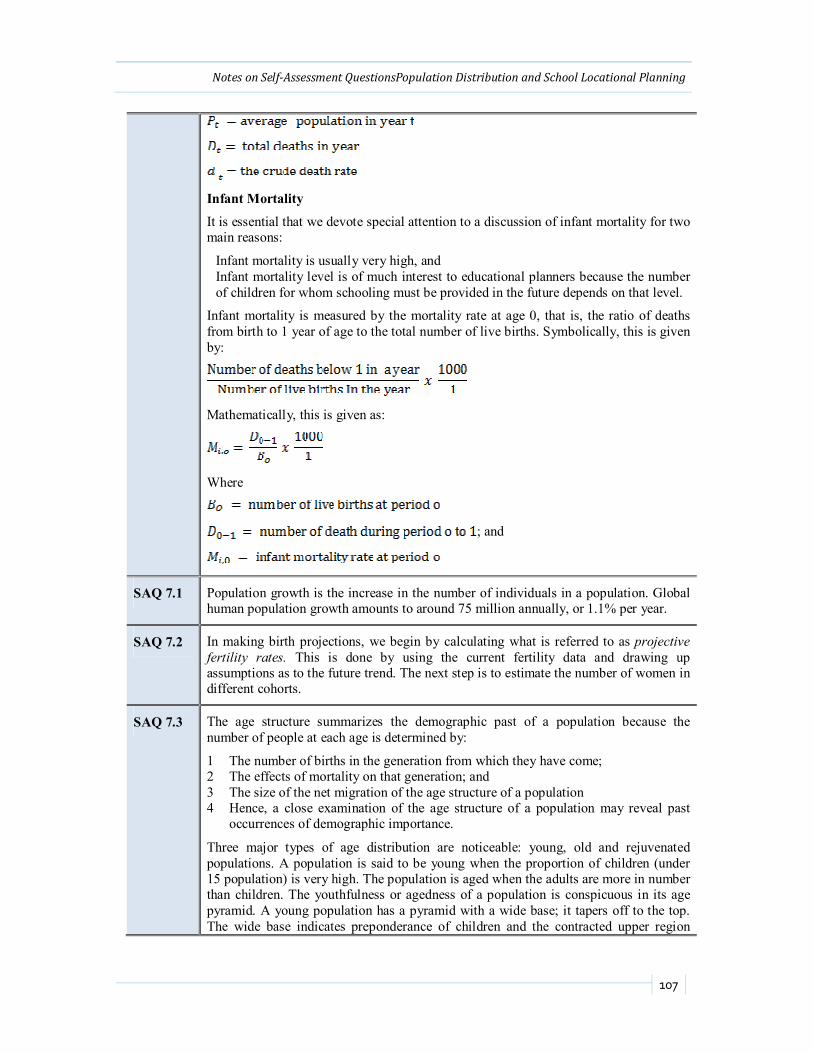
Notes on Self-Assessment QuestionsPopulation Distribution and School Locational Planning
107
Infant Mortality It is essential that we devote special attention to a discussion of infant mortality for two main reasons:
Infant mortality is usually very high, and Infant mortality level is of much interest to educational planners because the number of children for whom schooling must be provided in the future depends on that level.
Infant mortality is measured by the mortality rate at age 0, that is, the ratio of deaths from birth to 1 year of age to the total number of live births. Symbolically, this is given by:
Mathematically, this is given as:
Where
; and
SAQ 7.1 Population growth is the increase in the number of individuals in a population. Global human population growth amounts to around 75 million annually, or 1.1% per year.
SAQ 7.2 In making birth projections, we begin by calculating what is referred to as projective fertility rates. This is done by using the current fertility data and drawing up assumptions as to the future trend. The next step is to estimate the number of women in different cohorts.
SAQ 7.3 The age structure summarizes the demographic past of a population because the number of people at each age is determined by:
1 The number of births in the generation from which they have come; 2 The effects of mortality on that generation; and 3 The size of the net migration of the age structure of a population 4 Hence, a close examination of the age structure of a population may reveal past
occurrences of demographic importance.
Three major types of age distribution are noticeable: young, old and rejuvenated populations. A population is said to be young when the proportion of children (under 15 population) is very high. The population is aged when the adults are more in number than children. The youthfulness or agedness of a population is conspicuous in its age pyramid. A young population has a pyramid with a wide base; it tapers off to the top. The wide base indicates preponderance of children and the contracted upper region
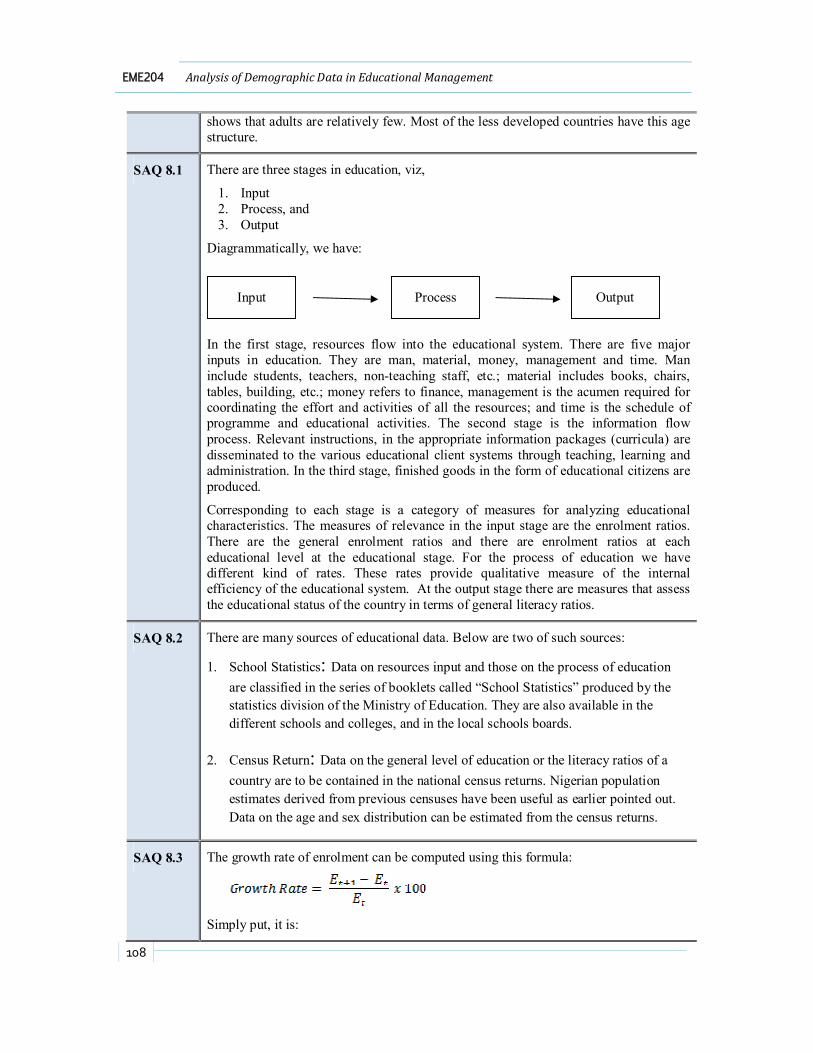
108
EME204 Analysis of Demographic Data in Educational Management
shows that adults are relatively few. Most of the less developed countries have this age structure.
SAQ 8.1 There are three stages in education, viz,
1. Input 2. Process, and 3. Output
Diagrammatically, we have:
In the first stage, resources flow into the educational system. There are five major inputs in education. They are man, material, money, management and time. Man include students, teachers, non-teaching staff, etc.; material includes books, chairs, tables, building, etc.; money refers to finance, management is the acumen required for coordinating the effort and activities of all the resources; and time is the schedule of programme and educational activities. The second stage is the information flow process. Relevant instructions, in the appropriate information packages (curricula) are disseminated to the various educational client systems through teaching, learning and administration. In the third stage, finished goods in the form of educational citizens are produced.
Corresponding to each stage is a category of measures for analyzing educational characteristics. The measures of relevance in the input stage are the enrolment ratios. There are the general enrolment ratios and there are enrolment ratios at each educational level at the educational stage. For the process of education we have different kind of rates. These rates provide qualitative measure of the internal efficiency of the educational system. At the output stage there are measures that assess the educational status of the country in terms of general literacy ratios.
SAQ 8.2 There are many sources of educational data. Below are two of such sources:
1. School Statistics: Data on resources input and those on the process of education are classified in the series of booklets called “School Statistics” produced by the statistics division of the Ministry of Education. They are also available in the different schools and colleges, and in the local schools boards.
2. Census Return: Data on the general level of education or the literacy ratios of a country are to be contained in the national census returns. Nigerian population estimates derived from previous censuses have been useful as earlier pointed out. Data on the age and sex distribution can be estimated from the census returns.
SAQ 8.3 The growth rate of enrolment can be computed using this formula:
Simply put, it is:
Input Process Output
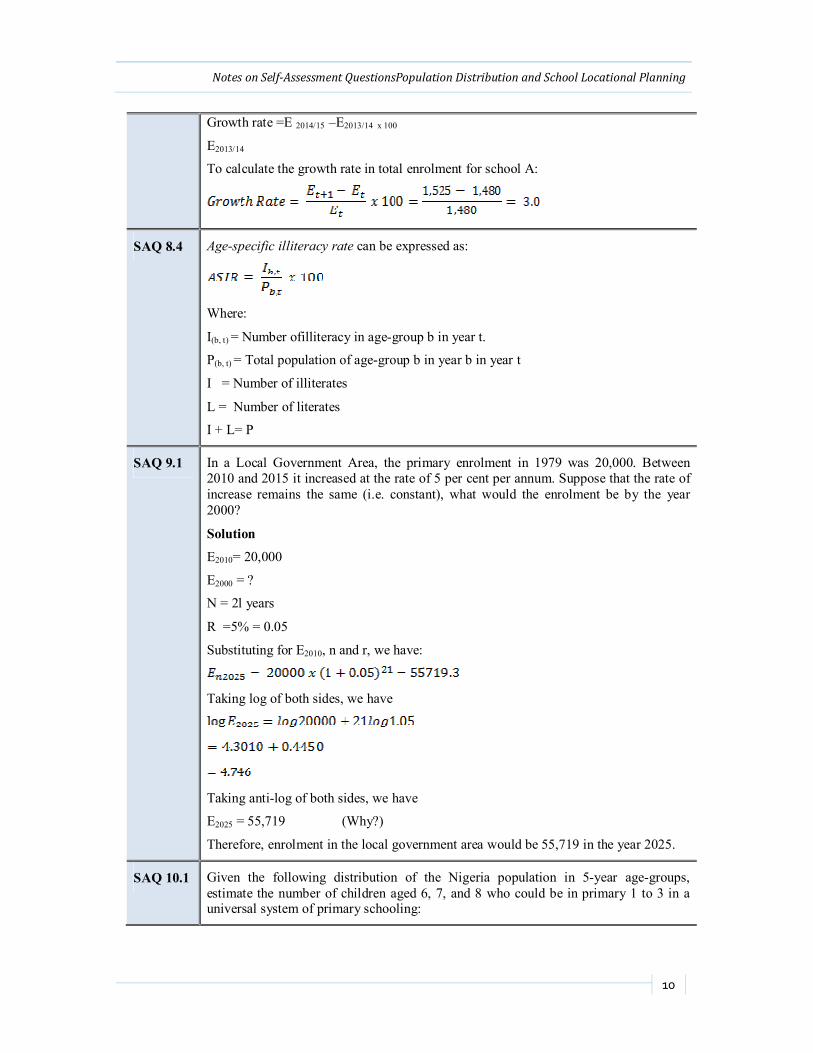
Notes on Self-Assessment QuestionsPopulation Distribution and School Locational Planning
109
Growth rate =E 2014/15 –E2013/14 x 100
E2013/14
To calculate the growth rate in total enrolment for school A:
SAQ 8.4 Age-specific illiteracy rate can be expressed as:
Where:
I(b, t) = Number ofilliteracy in age-group b in year t.
P(b, t) = Total population of age-group b in year b in year t
I = Number of illiterates
L = Number of literates
I + L= P
SAQ 9.1 In a Local Government Area, the primary enrolment in 1979 was 20,000. Between 2010 and 2015 it increased at the rate of 5 per cent per annum. Suppose that the rate of increase remains the same (i.e. constant), what would the enrolment be by the year 2000?
Solution
E2010= 20,000
E2000 = ?
N = 2l years
R =5% = 0.05
Substituting for E2010, n and r, we have:
Taking log of both sides, we have
Taking anti-log of both sides, we have
E2025 = 55,719 (Why?)
Therefore, enrolment in the local government area would be 55,719 in the year 2025.
SAQ 10.1 Given the following distribution of the Nigeria population in 5-year age-groups, estimate the number of children aged 6, 7, and 8 who could be in primary 1 to 3 in a universal system of primary schooling:
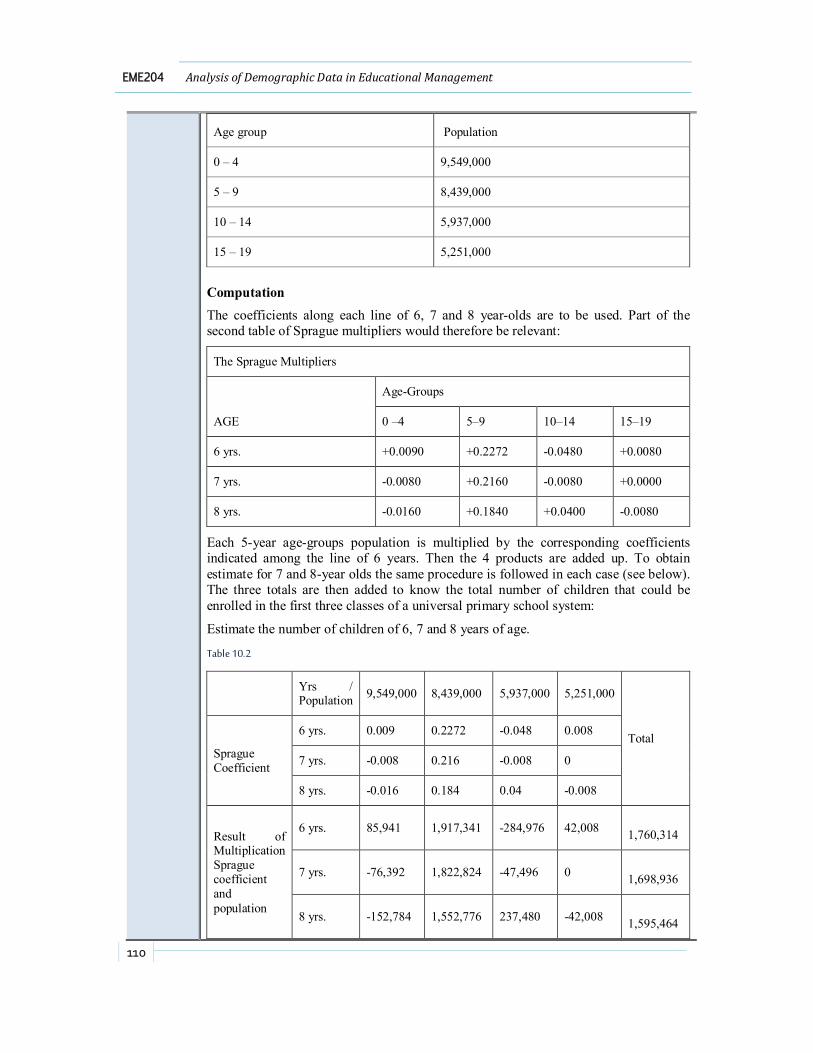
110
EME204 Analysis of Demographic Data in Educational Management
Age group Population
0 – 4 9,549,000
5 – 9 8,439,000
10 – 14 5,937,000
15 – 19 5,251,000
Computation The coefficients along each line of 6, 7 and 8 year-olds are to be used. Part of the second table of Sprague multipliers would therefore be relevant:
The Sprague Multipliers
AGE
Age-Groups
0 –4 5–9 10–14 15–19
6 yrs. +0.0090 +0.2272 -0.0480 +0.0080
7 yrs. -0.0080 +0.2160 -0.0080 +0.0000
8 yrs. -0.0160 +0.1840 +0.0400 -0.0080
Each 5-year age-groups population is multiplied by the corresponding coefficients indicated among the line of 6 years. Then the 4 products are added up. To obtain estimate for 7 and 8-year olds the same procedure is followed in each case (see below). The three totals are then added to know the total number of children that could be enrolled in the first three classes of a universal primary school system:
Estimate the number of children of 6, 7 and 8 years of age.
Table 10.2
Yrs / Population 9,549,000 8,439,000 5,937,000 5,251,000
Total Sprague Coefficient
6 yrs. 0.009 0.2272 -0.048 0.008
7 yrs. -0.008 0.216 -0.008 0
8 yrs. -0.016 0.184 0.04 -0.008
Result of Multiplication Sprague coefficient and population
6 yrs. 85,941 1,917,341 -284,976 42,008 1,760,314
7 yrs. -76,392 1,822,824 -47,496 0 1,698,936
8 yrs. -152,784 1,552,776 237,480 -42,008 1,595,464

Notes on Self-Assessment QuestionsPopulation Distribution and School Locational Planning
111
5,054,714
SAQ 11.1 Some of the errors encountered in demographic data includes:
Technical Problems Conducting census by self-enumeration has not been possible in Nigeria because of our low literacy ratios. Unlike census in the developed countries, Nigerian census requires the physical presence of the enumerators. The questionnaires have to be interview-administered. This poses the problem of where to meet the people. By de-facto enumeration technique, the enumerator count people at the place where they are physically present at a particular time, such as on a census night. This may underestimate the actual population, as there could be some people in transit at the stated time-travellers, salesmen, drivers, cattle drovers and tramps (those who may be on ship in territorial waters, at airport, etc.). By de-jure enumeration people are counted in their usual places of residence. But many Nigerians do have more than one place of abode. The pitfall of this method therefore is that people who are highly residentially mobile may be double-counted if enumeration lasts for several hours. Attempts to confine the definition of “usual place of residence” to mean “parental home” will distort actual population situations –overestimating the population of the source regions of city migrants while seriously underestimating the population of cities, and to some extent, the administrative regions encompassing those cities. The Nigerian census of 1952/53 used the technique of de-facto enumeration, while the subsequent counts were more or less mixtures of de-facto and de-jure enumeration techniques. Material Problems If other things are equal, the shorter the duration of the census exercise the more valid is the result. But poor infrastructural facilities in Nigeria make easy and quick contact with isolated and far away regions difficult. Providing adequate number of helicopters to resolve the problem of poor transportation and communication networks is not within the material capacity of any African government. The duration of census exercises are unavoidably longer than desired, and even then, whole ethnic groups are known to have been left out of national counting exercises because they were not accessible in time.
SAQ 12.1 The methods of detecting age errors are:
Sex Ratio Test One of the methods of detecting age errors is the sex ratio test. It is calculated as the number of males per 100 females in the production. In general, a population not much affected by migration has approximately equal number of males and females. This is because as a rule, slightly more males than females are born, but females are born, but female mortality is less than that of males. Consequently, there is slight excess females among adults. The number of males per 100 females in a given total population should therefore be closed to 100 if there is no error in counting and other conditions are

112
EME204 Analysis of Demographic Data in Educational Management
normal.
Age Ratio Test
This ratio assumes that the numbers in adjacent age-groups progress smoothly except at advanced ages or because of major fluctuation in past birth rates. However, immigration and military casualties may disturb normal pattern. In a population with a youthful age structure for example, the number of people in the age-group 5-9 is slightly more than the number in the age-group 10-14, and the number in latter age-group is also slightly more than the number in the age-group 15-19. The age ratio test therefore presupposes that the number reported in two adjacent age groups. Put differently, the number reported in one age group divided by the mean of the numbers reported in two adjacent age groups should be equal to 1.
SAQ 13.1 The pattern of population distribution and the requirements of school catchment areas often create problems for the officers in charge of planning the location of schools. In rural areas the threshold population for a school often spread over an area too wide for a school. One solution to this problem is to operate a one-class school. It is possible in the lower classes of a primary school for one teacher to handle more than one class when children are few.
However, there are other factors besides the demographic factors that influence the location of schools. They include social, economic, transport, and political factors. For example, secondary schools have been cited in Nigeria in sparsely populated areas to open up the area for development. There are also policy issues that affect the citing of new schools. The question that equal opportunities be provided for both boys and girls regardless of where they live; should universal basic education be made compulsory; etc. may lead to the creation of educational institutions in all part of the country and in the least favourable sites with all the consequences that they will have on the expenditure on education.
ReferencesPopulation Distribution and School Locational Planning
113
References CIA (2017). The world fact book: Nigeria.
http://www.cia.gov/library/publications/the-world-fact-book/nigeria
Essay24.com (2017). Definition, Nature, Scope and importance of Demography. www.essay24.com/social-issues/definition-nature-scope-and-importance-of-demography/47935.html
Owolabi J, (2006). Quantitative methods of educational planning. Makere University, Kampala. Lucky Odoni (Nig) Emterprises, Ogun, Nigeria.
Owolabi, J. (2001). ‘Curriculum planning and manpower development in Nigeria’. A paper presented at the Annual Conference of the Nigerian Association for Educational Administration and Planning, held at the University of Benin, Benin City, Nigeria, October 29th-November 1st , 2001
Owolabi, J. (2001). ‘Statistical models and projections in educational management’ in Okunola P.O. (ed). Theory and practice of educational management, Oyo, Nigeria: OYSCEI
Owolabi, S.O. (2000). School mapping for Ghana: training manual, Accra, Ghana. UNICEF
Owolabi, S.O. (2000). School mapping for Ghana: training manual, Accra, Ghana. UNICEF
Related Documents