1 Analysis of Decision-making in Electrical Devices Use in Indonesian Households Muhammad Ery Wijaya * and Tetsuo Tezuka Energy Economics Laboratory, Department of Socio-Environmental Energy Science, Graduate School of Energy Science, Kyoto University, Japan * Corresponding Author. Tel: (81) 75-753-3346, E-mail: [email protected] Abstract: Understanding the characteristics of household electricity consumption and its driving factors under the changing cultural circumstances of society can be useful in designing proper regulations related to energy saving in households. This paper analyses the results of a field survey of the Indonesian households in making decisions about electrical devices use, with aim to understand the consumers’ behavior in consuming electricity in order to give clear understanding of household electricity consumption characteristics to support the better design of energy conservation policy for society. The study focused on two cities with different cultural backgrounds; Yogyakarta and Bandung in Java Island. The viewpoints of decision-making were based on the behavioral economics and technological perception. The results show that monthly electricity expenditure and knowledge in electrical devices use (power consumption and energy efficiency of devices) could be a signal in decision-making in electrical devices in both cities regardless to the payment system, despite of low knowledge of people in electricity prices. However, the change of electricity prices does not indicate as signal in decision-making. Therefore, the effort to increase awareness on energy conservation should for improving the energy efficiency standard on electrical devices and rectifying the prepaid system of electricity payment in order to raise awareness of electricity use. Keywords: household, decision-making, electrical devices use, Indonesia 1. Introduction Recently, energy efficiency of electrical devices has been improved significantly in the recent years. However, these newly developed efficient devices will not be widely used unless societies actively adopt them. The improvement in energy efficiency will have an impact on overall energy demand, and subsequently on the environment (Young, 2007). However, it does not necessarily lead to an overall decline in the physical consumption, due to inappropriate in consumption practice. Therefore, in order to decrease household energy use, both an increase in energy efficiency (through the adoption of higher efficiency class device models) and the promotion of more ecological consumer behaviors (through better use of electrical devices) should be promoted (Gaspar and Antunes, 2011).

Welcome message from author
This document is posted to help you gain knowledge. Please leave a comment to let me know what you think about it! Share it to your friends and learn new things together.
Transcript
1
Analysis of Decision-making in Electrical Devices Use in Indonesian Households
Muhammad Ery Wijaya* and Tetsuo Tezuka
Energy Economics Laboratory, Department of Socio-Environmental Energy Science,
Graduate School of Energy Science, Kyoto University, Japan * Corresponding Author. Tel: (81) 75-753-3346, E-mail: [email protected]
Abstract:
Understanding the characteristics of household electricity consumption and its driving factors under the
changing cultural circumstances of society can be useful in designing proper regulations related to energy saving
in households. This paper analyses the results of a field survey of the Indonesian households in making decisions
about electrical devices use, with aim to understand the consumers’ behavior in consuming electricity in order to
give clear understanding of household electricity consumption characteristics to support the better design of
energy conservation policy for society. The study focused on two cities with different cultural backgrounds;
Yogyakarta and Bandung in Java Island. The viewpoints of decision-making were based on the behavioral
economics and technological perception. The results show that monthly electricity expenditure and knowledge in
electrical devices use (power consumption and energy efficiency of devices) could be a signal in decision-making
in electrical devices in both cities regardless to the payment system, despite of low knowledge of people in
electricity prices. However, the change of electricity prices does not indicate as signal in decision-making.
Therefore, the effort to increase awareness on energy conservation should for improving the energy efficiency
standard on electrical devices and rectifying the prepaid system of electricity payment in order to raise awareness
of electricity use.
Keywords: household, decision-making, electrical devices use, Indonesia
1. Introduction
Recently, energy efficiency of electrical devices has been improved significantly in the recent years.
However, these newly developed efficient devices will not be widely used unless societies actively adopt them.
The improvement in energy efficiency will have an impact on overall energy demand, and subsequently on the
environment (Young, 2007). However, it does not necessarily lead to an overall decline in the physical
consumption, due to inappropriate in consumption practice. Therefore, in order to decrease household energy use,
both an increase in energy efficiency (through the adoption of higher efficiency class device models) and the
promotion of more ecological consumer behaviors (through better use of electrical devices) should be promoted
(Gaspar and Antunes, 2011).
2
Guerin, et. al, (2000) summarized numerous studies of household energy consumption, the study found
that most frequently identified variables affected energy behavior and energy consumption were occupant
characteristics, occupant attitudes and occupant actions. Moreover, the cultural backgrounds also influencing in
the differences of energy consumption pattern as found between Japan and Norway (Wilhite et al., 1996).
However, there are a few studies have investigated energy consumption from the consumers perspective. One of
the studies is Yamamoto et al. (2008), investigated the decision-making in electrical device use in Japan. The
study found that the price did not function as a signal in decision-making in electrical device user. Rather,
decision-making was dependent on the characteristics of particular electrical devices and the electricity payment
system.
The aim of this paper is to analysis decision-making in electrical devices use in Indonesian households to
understand the consumers’ behavior in consuming electricity in order to give clear understanding of household
electricity consumption characteristics to support the better design of energy conservation policy for society.
2. Electricity Consumption in Indonesia
Indonesian economic development boosts the increasing of industrial and commercial sector as well as
the people’s welfare. During the years 2001 to 2009 the GDP per capita continues to increase sharply, which the
average was as much as 15% annually. In 2001 the GDP per capita amounted to US$ 748, and in 2009 became
US$ 2,698 (SI, 2010a and CDI-EMR, 2010). These situations are predicted to keep continued over coming years
due to revival of the world economy. Despite of encouraging economic growth, but the largest economic activity
in Indonesia is still centralized in Jawa-Madura and Bali area, or known as JaMaLi area. In 2010, total population
in this area was recorded 141 million people, or almost 60% of total population in the country (SI, 2010b). In
2000, total electricity consumption was 79 TWh, and increased to 135 TWh in 2009 (CDI-EMR, 2010), almost
78% of it was consumed by JaMali area. National electrification ratio in 2009 reached to 63.75%, and it will
continue to grow rapidly following the national economic growth (PLN, 2010). Current situation in JaMaLi area,
the industrial sector takes the largest proportion of electricity consumption as much as 47%, and followed by the
household sector with 39% (MEMR, 2008).
3. Methodology
This research obtained the primary information by using questionnaire survey conducted in two cities,
namely Bandung and Yogyakarta. The reason to select these cities was that both cities steeped in their culture.
Bandung was selected as representation of Sundanese culture, while Yogyakarta because as center of Javanese
culture. In addition, Sundanese and Javanese people counted as the largest electricity consumers in Indonesia.
There were 100 households randomly selected to be investigated in-depth from each city. In Bandung, the only
Sundanese people were recruited as respondents, while in Yogyakarta only Javanese people were selected. The
respondent were recruited through a door-to-door solicitation procedure in which then they were asked for
requested to participate in the survey by filling the questionnaire. The research was conducted from October to
3
November 2011. There were about 30% of households in this survey using prepaid system in their electricity
payment.
3.1. Bandung
Bandung is well known as Paris Van Java since there were luxurious hotels, restaurants, cafes and
European boutiques opened in this city during the Dutch colonization. Even today, is known a fashion center in
Indonesian. Bandung located about 180 kilometers southeast of Jakarta, as the capital of West Java province.
Topographically, the city situated at an altitude of 768 meters above sea level, the highest point in the north with
an altitude of 1050 meters and the lowest in the south is 675 meters above sea level. The average temperature is
24°C. Most of the population is Sundanese.
3.2. Yogyakarta
This city previously was capital of Indonesia during 1945 to 1949. At the present, it is known as one of
special provinces and the center of Javanese culture. Geographically, it is located in the southern part of Central.
The average daily temperature range between 26 degree and 28 degree and Yogyakarta is bathed in tropical;
sunshine along the year. Beside of its culture, Yogyakarta known as the student city due to the high rate of
inhabitant is student, while most of population is Javanese.
3.3. Outline of the Questionnaire Survey
The survey was performed by using questionnaire method. The concern of the questions was centered on
two aspects; behavioral economics and technological perspectives. The content of the questionnaire covered: 1)
knowledge in electricity prices, 2) memory of electricity payment, 3) awareness of the changes of electricity bill,
4) awareness of electricity consumed by electrical devices, 5) awareness of the energy efficiency, 6) response in
the change of electricity price, and 7) effects of payment system.
4. Results and Discussion
4.1 Understanding in Electricity Price
In daily life, behavioral economics tend to close relationship with price variable. Therefore, price is often
considered to be an important signal in decision-making when people consuming electricity (Yamamoto et al.
2008). Indonesia has one of the lowest electricity tariffs in Asia. Electricity tariffs for the household sector have
remained the same since 2003 to 2010, although the cost of supply has more than doubled from US$ 0.056 to
US$ 0.132/kilowatt-hour (kWh) between 2004 and 2008. In real terms, the tariffs have actually reduced by about
50% between 2003 and 2009, while over the same period tariffs for residential customers in countries across the
region have increased 33% in the Philippines, 20% in Malaysia, 18% in Viet Nam, and 11% in Singapore (ADB,
2010). According to Regulation of Minister Energy and Mineral Resources (MEMR) No.7/2010, electricity tariff
for the residential sector is basically categorized into three groups of consumers, which are low-class households
(with installed voltage 450 to 2,200VA), medium-class households (3,500 to 5,500 VA), and high-class
4
households (over 6,600 VA). This regulation also mentioned the increasing of electricity tariff for all households
except for consumers with 450VA and 900VA by about 18% from which in year 2003. Almost respondents in this
research were included in the low-class households since this group takes the largest share of residential
electricity consumers in the country. The electricity tariff for the low-class households are US$ 0.042/kWh,
US$ 0.61/kWh, US$ 0.079/kWh, and US$ 0.080/kWh for 450 VA, 900 VA, 1,300 VA, and 2,200 VA,
respectively.
In the survey, the questionnaire began to investigate the behavioral economics of respondents to the
electricity consumption by asking on: 1) how understand they were with their electricity prices given by
government, 2) how well they remembered with their monthly electricity bill (both questions was scaled of 1 (not
at all) to 4 (highly)), and 3) how aware they were of the changes of their monthly electricity bill on scale of 1 (not
at all) to 5 (highly). The results as shown in Table 1 indicated that people in Bandung had significantly better
understanding of electricity prices as compared to people in Yogyakarta. In contrast, in the aspect of remembering
monthly electricity bill and awareness of changes in monthly electricity bill, there was no significant difference
found between Bandung and Yogyakarta (p-value > 0.05).
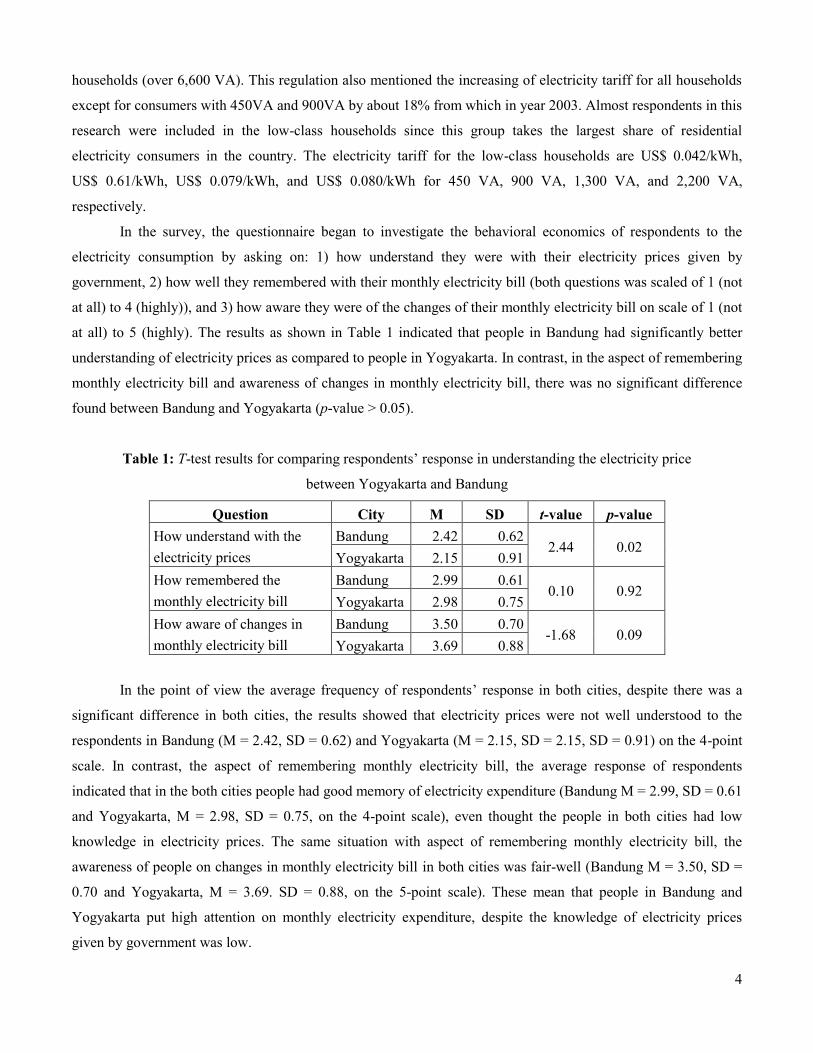
Table 1: T-test results for comparing respondents’ response in understanding the electricity price
between Yogyakarta and Bandung
Question City M SD t-value p-value
How understand with the
electricity prices
Bandung 2.42 0.62 2.44 0.02
Yogyakarta 2.15 0.91
How remembered the
monthly electricity bill
Bandung 2.99 0.61 0.10 0.92
Yogyakarta 2.98 0.75
How aware of changes in
monthly electricity bill
Bandung 3.50 0.70 -1.68 0.09
Yogyakarta 3.69 0.88
In the point of view the average frequency of respondents’ response in both cities, despite there was a
significant difference in both cities, the results showed that electricity prices were not well understood to the
respondents in Bandung (M = 2.42, SD = 0.62) and Yogyakarta (M = 2.15, SD = 2.15, SD = 0.91) on the 4-point
scale. In contrast, the aspect of remembering monthly electricity bill, the average response of respondents
indicated that in the both cities people had good memory of electricity expenditure (Bandung M = 2.99, SD = 0.61
and Yogyakarta, M = 2.98, SD = 0.75, on the 4-point scale), even thought the people in both cities had low
knowledge in electricity prices. The same situation with aspect of remembering monthly electricity bill, the
awareness of people on changes in monthly electricity bill in both cities was fair-well (Bandung M = 3.50, SD =
0.70 and Yogyakarta, M = 3.69. SD = 0.88, on the 5-point scale). These mean that people in Bandung and
Yogyakarta put high attention on monthly electricity expenditure, despite the knowledge of electricity prices
given by government was low.
5
4.2 Electricity Consumed by Devices
Electrical devices consume electricity during use, and the fact that electricity costs are calculated from
amount of electricity consumed by devices. Hence, the logic argumentation is by understanding power
consumption by devices, then that knowledge can be an indication of the decision-making in using devices. It is
important to be noted that rate of power consumed by devices could be a consideration in electrical devices
purchase and electrical devices use. From this point, respondents in two cities were then assessed the awareness of
electricity consumed by eight devices that often used: washing machine, water pump, rice cooker, lighting,
electric fan, air conditioner, refrigerator and television, on a scale of 1 (not at all) to 5 (highly).
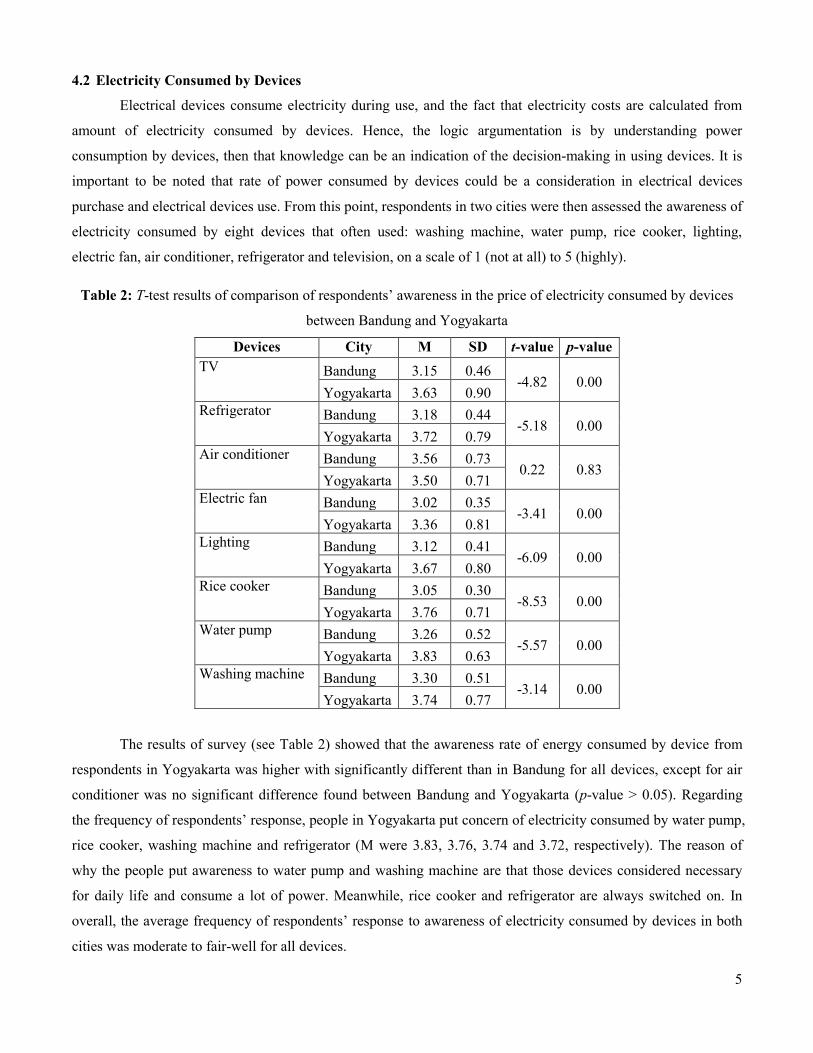
Table 2: T-test results of comparison of respondents’ awareness in the price of electricity consumed by devices
between Bandung and Yogyakarta
Devices City M SD t-value p-value
TV Bandung 3.15 0.46 -4.82 0.00
Yogyakarta 3.63 0.90
Refrigerator Bandung 3.18 0.44 -5.18 0.00
Yogyakarta 3.72 0.79
Air conditioner Bandung 3.56 0.73 0.22 0.83
Yogyakarta 3.50 0.71
Electric fan Bandung 3.02 0.35 -3.41 0.00
Yogyakarta 3.36 0.81
Lighting Bandung 3.12 0.41 -6.09 0.00
Yogyakarta 3.67 0.80
Rice cooker Bandung 3.05 0.30 -8.53 0.00
Yogyakarta 3.76 0.71
Water pump Bandung 3.26 0.52 -5.57 0.00
Yogyakarta 3.83 0.63
Washing machine Bandung 3.30 0.51 -3.14 0.00
Yogyakarta 3.74 0.77
The results of survey (see Table 2) showed that the awareness rate of energy consumed by device from
respondents in Yogyakarta was higher with significantly different than in Bandung for all devices, except for air
conditioner was no significant difference found between Bandung and Yogyakarta (p-value > 0.05). Regarding
the frequency of respondents’ response, people in Yogyakarta put concern of electricity consumed by water pump,
rice cooker, washing machine and refrigerator (M were 3.83, 3.76, 3.74 and 3.72, respectively). The reason of
why the people put awareness to water pump and washing machine are that those devices considered necessary
for daily life and consume a lot of power. Meanwhile, rice cooker and refrigerator are always switched on. In
overall, the average frequency of respondents’ response to awareness of electricity consumed by devices in both
cities was moderate to fair-well for all devices.
6
4.3 Awareness of Energy Efficiency of Devices
The efficiency of a device is one of factors to influence the electricity consumption; the higher the rate of
efficiency, the lower the electricity consumption. Therefore, the knowledge and awareness of energy efficiency of
devices being used are important to measure costs of electricity for consumers. The purpose to analysis the
awareness of energy efficiency of devices is to see whether the people use this knowledge in using electrical
devices in their home or not, in order to reduce the electricity consumption and monthly electricity bill. From the
survey in both cities, respondents were asked how aware they were of the energy efficiency of eight devices (the
number of devices is mentioned in sub-chapter 4.2). The question was scaled from 1 (not at all) to 5 (highly).
The results indicate that in average the respondents’ awareness in both cities was moderate to fair-well for
all devices, averaging on over than 3 (but less than 4) on the 5- point scale. Although the survey found that the
awareness of energy efficiency of devices were delighted, but from the overall respondents’ responses there were
significant differences in both cities. The awareness rate of energy efficiency from respondents in Yogyakarta was
higher with significantly different than in Bandung for all devices, except for air conditioner (p-value > 0.05).
Table 3 shows the comparison of energy efficiency awareness of devices in Bandung and Yogyakarta.
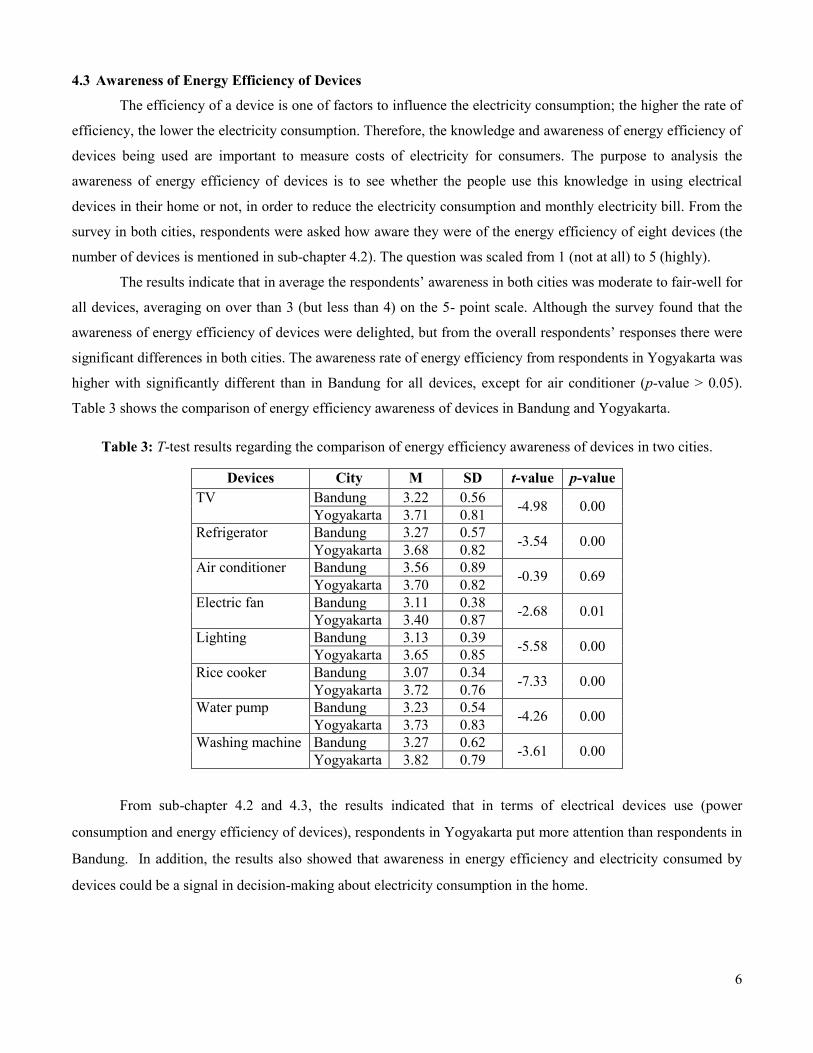
Table 3: T-test results regarding the comparison of energy efficiency awareness of devices in two cities.
Devices City M SD t-value p-value
TV Bandung 3.22 0.56 -4.98 0.00
Yogyakarta 3.71 0.81
Refrigerator Bandung 3.27 0.57 -3.54 0.00
Yogyakarta 3.68 0.82
Air conditioner Bandung 3.56 0.89 -0.39 0.69
Yogyakarta 3.70 0.82
Electric fan Bandung 3.11 0.38 -2.68 0.01
Yogyakarta 3.40 0.87
Lighting Bandung 3.13 0.39 -5.58 0.00
Yogyakarta 3.65 0.85
Rice cooker Bandung 3.07 0.34 -7.33 0.00
Yogyakarta 3.72 0.76
Water pump Bandung 3.23 0.54 -4.26 0.00
Yogyakarta 3.73 0.83
Washing machine Bandung 3.27 0.62 -3.61 0.00
Yogyakarta 3.82 0.79
From sub-chapter 4.2 and 4.3, the results indicated that in terms of electrical devices use (power
consumption and energy efficiency of devices), respondents in Yogyakarta put more attention than respondents in
Bandung. In addition, the results also showed that awareness in energy efficiency and electricity consumed by
devices could be a signal in decision-making about electricity consumption in the home.
7
4.4 Responses in the Change of Electricity Price
The price, once again is suspected to be one important indicator in decision-making of electrical devices
use. Then, the change in prices would be assessed to see the response of consumers in decision-making in
electrical devices use. Respondents in each city were asked how their use of each appliance would change if the
electricity price increased by 10% from current price. The question was scaled from 1 (large decrease) to 5 (large
increase). The results are then presented in Table 4.
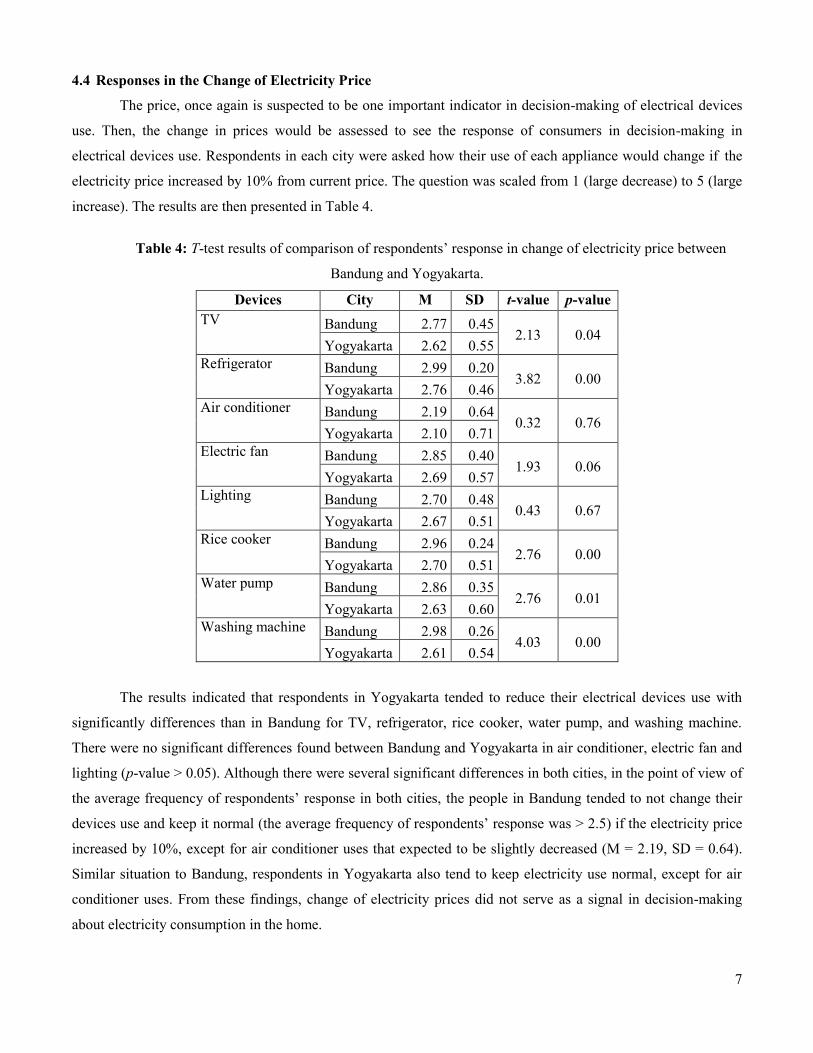
Table 4: T-test results of comparison of respondents’ response in change of electricity price between
Bandung and Yogyakarta.
Devices City M SD t-value p-value
TV Bandung 2.77 0.45 2.13 0.04
Yogyakarta 2.62 0.55
Refrigerator Bandung 2.99 0.20 3.82 0.00
Yogyakarta 2.76 0.46
Air conditioner Bandung 2.19 0.64 0.32 0.76
Yogyakarta 2.10 0.71
Electric fan Bandung 2.85 0.40 1.93 0.06
Yogyakarta 2.69 0.57
Lighting Bandung 2.70 0.48 0.43 0.67
Yogyakarta 2.67 0.51
Rice cooker Bandung 2.96 0.24 2.76 0.00
Yogyakarta 2.70 0.51
Water pump Bandung 2.86 0.35 2.76 0.01
Yogyakarta 2.63 0.60
Washing machine Bandung 2.98 0.26 4.03 0.00
Yogyakarta 2.61 0.54
The results indicated that respondents in Yogyakarta tended to reduce their electrical devices use with
significantly differences than in Bandung for TV, refrigerator, rice cooker, water pump, and washing machine.
There were no significant differences found between Bandung and Yogyakarta in air conditioner, electric fan and
lighting (p-value > 0.05). Although there were several significant differences in both cities, in the point of view of
the average frequency of respondents’ response in both cities, the people in Bandung tended to not change their
devices use and keep it normal (the average frequency of respondents’ response was > 2.5) if the electricity price
increased by 10%, except for air conditioner uses that expected to be slightly decreased (M = 2.19, SD = 0.64).
Similar situation to Bandung, respondents in Yogyakarta also tend to keep electricity use normal, except for air
conditioner uses. From these findings, change of electricity prices did not serve as a signal in decision-making
about electricity consumption in the home.
8
4.5 Effects of Payment System
Yamamoto et al. (2008) argue that the payment system for home electricity consumption plays an
important role in decision-making. Faruqui et al. (2010) reviewed 12 pilot studies that investigate the effect of in
home displays showing electricity use on consumer behavior, and proved that prepayment metering increases
awareness of electricity use. In Indonesia, there are two payment systems that have been enacted, which are
postpaid system and prepaid system. By using postpaid system, the consumers are charged with a load fee and
usage fee. The consumers can see the total amount of use electricity during a month in their bill. Meanwhile, by
using prepaid system, the consumers is free of charge from a load fee, but to be able to use electricity the
consumers should purchase a voucher through ATM or specific designated kiosks with an amount determined by
the consumers themselves. The prepaid system able to show the amount electricity consumed in real time, and the
remaining of electricity that can be used by consumer.
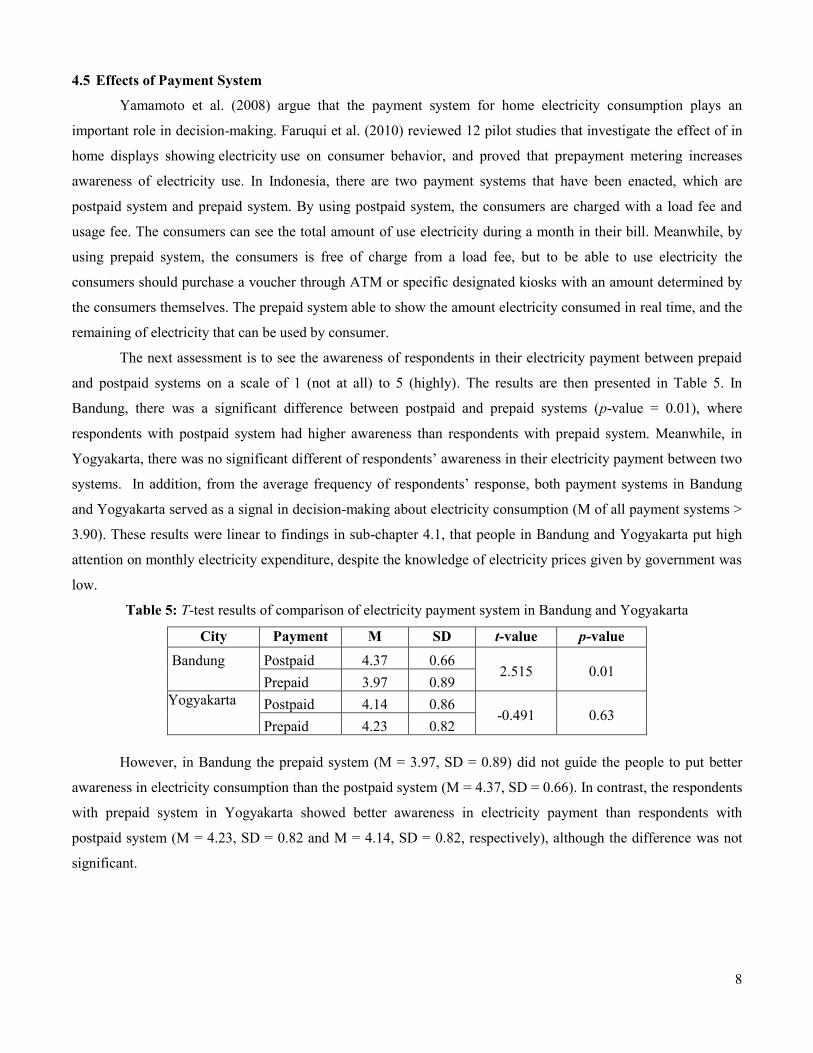
The next assessment is to see the awareness of respondents in their electricity payment between prepaid
and postpaid systems on a scale of 1 (not at all) to 5 (highly). The results are then presented in Table 5. In
Bandung, there was a significant difference between postpaid and prepaid systems (p-value = 0.01), where
respondents with postpaid system had higher awareness than respondents with prepaid system. Meanwhile, in
Yogyakarta, there was no significant different of respondents’ awareness in their electricity payment between two
systems. In addition, from the average frequency of respondents’ response, both payment systems in Bandung
and Yogyakarta served as a signal in decision-making about electricity consumption (M of all payment systems >
3.90). These results were linear to findings in sub-chapter 4.1, that people in Bandung and Yogyakarta put high
attention on monthly electricity expenditure, despite the knowledge of electricity prices given by government was
low.
Table 5: T-test results of comparison of electricity payment system in Bandung and Yogyakarta
City Payment M SD t-value p-value
Bandung Postpaid 4.37 0.66 2.515 0.01
Prepaid 3.97 0.89
Yogyakarta Postpaid 4.14 0.86 -0.491 0.63
Prepaid 4.23 0.82
However, in Bandung the prepaid system (M = 3.97, SD = 0.89) did not guide the people to put better
awareness in electricity consumption than the postpaid system (M = 4.37, SD = 0.66). In contrast, the respondents
with prepaid system in Yogyakarta showed better awareness in electricity payment than respondents with
postpaid system (M = 4.23, SD = 0.82 and M = 4.14, SD = 0.82, respectively), although the difference was not
significant.
9
5. Conclusion
The decision-making in electrical devices use in the home in two different cities with different cultural
backgrounds has been studied and analyzed. The results show that monthly electricity expenditure and knowledge
in electrical devices use (power consumption and energy efficiency of devices) could be a signal in decision-
making in electrical appliances in both cities regardless to the payment system, despite of low knowledge of
people in electricity prices given by government. However, the change of electricity prices did not indicate as
signal in decision-making.
Although the results of survey in pattern were similar, people in Bandung had significantly better
understanding of electricity prices as compared to people in Yogyakarta. However, the awareness rate of energy
consumed by devices and energy efficiency of devices in Yogyakarta was higher with significantly different than
in Bandung for all devices, except for air conditioner. The results also indicated that if electricity prices increased
by 10% from current price, respondents in Yogyakarta tended to reduce their electrical devices use with
significantly differences than in Bandung for TV, refrigerator, rice cooker, water pump, and washing machine,
despite in the average frequency of respondents’ response tended to not change their devices use and keep it
normal
The results of this study have clarified that policy option to increase electricity price in order to increase
people’s awareness in their electricity consumption will not result in a significant reduction in electricity
consumption. The reason is that electricity is necessities of life and routinely used by people in their daily life.
Therefore, the effort to increase awareness on energy conservation should for improving the energy efficiency
standard on electrical devices and rectifying the prepaid system of electricity payment in order to raise awareness
of electricity use.
6. Acknowledgment
This study was funded by the Kyoto University Global Center of Excellent (GCOE) Program “Energy
Science in the Age of Global Warming”. The authors would like to acknowledge all the people who participated
as respondents in this research. The first author would convey the gratitude to Ministry of Education, Culture,
Sports, Science and Technology (MEXT) Japan for providing scholarships during the study.
References
ADB, 2010, Proposed Loan and Administration of Loan and Grant Republic of Indonesia: Java-Bali Electricity
Distribution Performance Improvement Project, Asian Development Bank. Available at <
http://www.adb.org/Documents/RRPs/INO/40061-INO-RRP.pdf>.
CDI-EMR, 2010, Handbook of Energy and Economic Statistics of Indonesia, Center for Data and Information on
Energy and Mineral Resources, Jakarta. (in Indonesian).
Faruqui, A., Sergici, S., Sharif, A., 2010, The impact of informational feedback on energy consumption - A
survey of the experimental evidence, Energy 35, 1598-1608.
10
Gaspar, R., Antunes, D., 2011, Energy efficiency and appliance purchase in Europe: Consumer profiles and
choice determinants, Energy Policy 39, 7335-7346.
Guerin, D.A., Yust, B.L., Coopet, J.G., 2000, Occupant Predictors of Household Energy Behavior and
Consumption Change as Found in Energy Studies Since 1975, Family and Consumer Science
Research Journal, 19 (1), 48-80.
MEMR, 2008, National Electricity Master Plan 2008-2027, Ministry of Energy and Mineral Resources, Jakarta.
(in Indonesian).
PLN, 2010, Annual Report 2009: Brightening the Nation in Harmony, PT. Perusahaan Listrik Negara (State
Electricity Enterprise). Available at < http://www.pln.co.id/dataweb/AR/ARPLN2009.pdf>. (in
Indonesian).
SI, 2010a, Strategic Data 2010, Statistics Indonesia, Jakarta. Available at <http://www.bps.go.id/
65tahun/data_strategis.pdf> (in Indonesian).
SI, 2010b, Population Census 2010, Statistics Indonesia, Jakarta. Available at <
http://www.bps.go.id/download_file /SP2010_agregat_data_perProvinsi.pdf> (in Indonesian).
Wilhite, H., Nakagami, H., Masuda, T., Yamaga, Y., Haneda, H., 1996, A Cross-cultural Analysis of Household
Energy Use Behavior in Japan and Norway, Energy Policy, 24 (No.9), 795-803.
Yamamoto, Y., Suzuki, A., Fuwa, Y., Satu, T., 2008, Decision-making in electrical appliance use in the home,
Energy Policy 36, 1679-1686.
Young, D., 2007, When do energy-efficiency appliances generate energy savings?, Energy Policy 36, 34-46.
Related Documents