ANALYSIS OF CONVENTIONAL LOW VOLTAGE POWER LINE COMMUNICATION METHODS FOR AUTOMATIC METER READING AND THE CLASSIFICATION AND EXPERIMENTAL VERIFICATION OF NOISE TYPES FOR LOW VOLTAGE POWER LINE COMMUNICATION NETWORK A THESIS SUBMITTED TO THE GRADUATE SCHOOL OF NATURAL AND APPLIED SCIENCES OF MIDDLE EAST TECHNICAL UNIVERSITY BY BATUHAN DANIŞMAN IN PARTIAL FULFILLMENT OF THE REQUIREMENTS FOR THE DEGREE OF MASTER OF SCIENCE IN ELECTRICAL AND ELECTRONICS ENGINEERING FEBRUARY 2009

Welcome message from author
This document is posted to help you gain knowledge. Please leave a comment to let me know what you think about it! Share it to your friends and learn new things together.
Transcript

ANALYSIS OF CONVENTIONAL LOW VOLTAGE POWER LINE COMMUNICATION METHODS FOR AUTOMATIC METER READING AND THE CLASSIFICATION AND EXPERIMENTAL VERIFICATION OF NOISE
TYPES FOR LOW VOLTAGE POWER LINE COMMUNICATION NETWORK
A THESIS SUBMITTED TO THE GRADUATE SCHOOL OF NATURAL AND APPLIED SCIENCES
OF MIDDLE EAST TECHNICAL UNIVERSITY
BY
BATUHAN DANIŞMAN
IN PARTIAL FULFILLMENT OF THE REQUIREMENTS FOR
THE DEGREE OF MASTER OF SCIENCE IN
ELECTRICAL AND ELECTRONICS ENGINEERING
FEBRUARY 2009

ii
Approval of the thesis:
ANALYSIS OF CONVENTIONAL LOW VOLTAGE POWER LINE COMMUNICATION METHODS FOR AUTOMATIC METER READING
AND THE CLASSIFICATION AND EXPERIMENTAL VERIFICATION OF NOISE TYPES FOR LOW VOLTAGE POWER LINE COMMUNICATION
NETWORK submitted by BATUHAN DANIŞMAN in partial fulfillment of the requirements for the degree of Master of Science in Electrical and Electronics Engineering Department, Middle East Technical University by, Prof. Dr. Canan Özgen ____________ Dean, Graduate School of Natural and Applied Sciences Prof. Dr. İsmet Erkmen ____________ Head of Department, Electrical and Electronics Engineering Prof. Dr. Osman Sevaioğlu ____________ Supervisor, Electrical and Electronics Engineering Dept., METU Examining Committee Members: Prof. Dr. Mirzahan HIZAL _______________ Electrical and Electronics Engineering Dept., METU Prof. Dr. Osman SEVAİOĞLU _______________ Electrical and Electronics Engineering Dept., METU Prof. Dr. Ömer USTA _______________ Electrical and Electronics Engineering Dept., İTÜ Prof. Dr. Cengiz TAPLAMACIOĞLU _______________ Electrical and Electronics Engineering Dept., Gazi University Assist. Prof. Dr. Cüneyt BAZLAMAÇCI _______________ Electrical and Electronics Engineering Dept., METU Date: 11/02/2009

iii
I hereby declare that all information in this document has been obtained and presented in accordance with academic rules and ethical conduct. I also declare that, as required by these rules and conduct, I have fully cited and referenced all material and results that are not original to this work. Name, Last name : Batuhan Danışman
Signature :

iv
ABSTRACT
ANALYSIS OF CONVENTIONAL LOW VOLTAGE POWER LINE COMMUNICATION METHODS FOR AUTOMATIC METER READING AND THE CLASSIFICATION AND EXPERIMENTAL VERIFICATION OF NOISE
TYPES FOR LOW VOLTAGE POWER LINE COMMUNICATION NETWORK
Danışman, Batuhan
M.S., Department of Electrical and Electronics Engineering
Supervisor: Prof. Dr. Osman Sevaioğlu
February 2009, 249 pages
In this thesis, the conventional low voltage power line communication methods is
investigated in the axis of automated meter reading applications and the classification
and experimental verification of common noise types for low voltage power line
communication network. The investigated system provides the real time transmission
of electricity consumption data recorded by electricity meters, initially to a local
computer via a low voltage line through a low speed PLC (Power Line Carrier)
environment and subsequently to a corporate network through a high speed data
transmission medium. The automated meter system provides a more effective
tracking and data acquisition, a more detailed and vigorous knowledge about
consumer behavior for subscriber assessment in electricity distribution in association
with a brand new management and system supervision concept in electricity
distribution control and management technology. The theoretical studies are
experimentally verified for the Turkish low voltage power infrastructure through
laboratory experiments performed in METU Electrical and Electronics Engineering
Department, Electrical Machines and Drives Laboratory and R&D Laboratories of

v
MAKEL facilities in Hadımköy. The single phase voltage of the mains line between
the phase and neutral is monitored to exhibit the disturbing effects of various noise
sources. The resulting voltage spectrum is logged by using digital data acquisition
devices in time and frequency domain. The waveforms are converted to frequency
domain using the Fast Fourier Transform (FFT) functions of the MATLAB. The
experimental results are compared to the theoretical findings obtained through
literature survey.
Keywords: Power Line Communication, Automatic Meter Reading, Digital Data
Acquisition, Low Voltage Distribution Network, Time Domain Analysis, Frequency
Domain Analysis, Fast Fourier Transform.

vi
ÖZ
KONVANSİYONEL ALÇAK GERİLİM GÜÇ HATLARI KULLANILARAK
OTOMATİK SAYAÇ OKUMA METODLARININ ANALİZİ VE ALÇAK
GERİLİM GÜÇ HATLARINDAKİ GÜRÜLTÜ TİPLERİNİN
SINIFLANDIRILMASI VE ANALİZ EDİLMESİ
Danışman Batuhan
Yüksek Lisans, Elektrik ve Elektronik Mühendisliği Bölümü
Tez Yöneticisi: Prof. Dr. Osman Sevaioğlu
Şubat 2009, 249 sayfa
Bu tezde düşük voltajlı güç hatları üzerinden bilgi aktarımı metodlari otomatik sayaç
okuma uygulamaları ekseninde incelenmiştir. Ayrıca düşük voltajlı güç hatlarında
görülen gürültü tipleri sınıflandırılarak ve deneysel olarak doğrulanmasına
çalışılmıştır. Uzaktan sayaç okuma metodu, elektrik sayaçları tarafından okunan
elektrik tüketim verilerinin gerçek zamanda PLC (Power Line Carrier) ortamı ile AG
(Alçak Gerilim) hatları üzerinden düşük bir veri iletişim hızı ile önce mahalli bir
bilgisayara aktarılmasını ve buradan da daha yüksek bir veri iltişim hızı ile şirketin
ana bilgisayarına aktarılmasını öngörmektedir. Bu metod ile, elektrik dağıtımında
abone tahakkukunda daha etkin bir izleme, veri toplama, abone davranışları hakkında
daha detaylı ve etkin bir şekilde bilgi sahibi olunması mümkündür. Uzaktan sayaç

vii
okuma metodu ile, elektrik dağıtım sistemi kontrol ve işletme teknolojisinde yeni bir
işletme ve sistem denetim anlayışı öngörülmektedir. Teorik çalışmalar, ODTÜ
Elektrik Makineleri ve Sürücüleri ve de Hadımköy MAKEL fabrikalarında yapılan
laboratuvar deneyleriyle Türkiye düşük voltajlı güç şebekesi üzerinde
doğrulanmıştır. Şebekenin tek faz voltajı, faz nötr arasında ölçülerek değişik gürültü
kaynaklarının etkileri gözlemlenmiştir. Oluşan voltaj ve güç spektrumları zaman ve
frekans ekseninde kaydedilmiştir. Zaman ekseninde kaydedilen voltaj ve güç
spektrumları frekans eksenine MATLAB programının Fast Fourier Transform
özelliği kullanılarak çevrilmiştir. Deneysel sonuçlar teorik bulgularla
karşılaştırılmıştır.
Anahtar sözcükler: Güç Hattı İletimi, Uzaktan Sayaç Okuma, Dijital Data Elde Etme,
Düşük Voltajlı Dağıtım Şebekesi, Zaman Ekseninde Analiz, Frekans Ekseninde
Analiz, Fast Fourier Transform

viii
To my family,
Nuri Danışman
Sümer Yılmaz
Orhan Danışman
Handan Danışman
Ece Yılmaz
Bige Yılmaz
Zeynep Aran

ix
ACKNOWLEDGMENTS
I express my sincerest thanks to my supervisor, Prof. Dr. Osman Sevaioğlu and Prof.
Dr. Ömer Usta for their guidance, support, encouragement, and valuable
contributions throughout my graduate education.
I would like to express my deepest gratitude to my family for their support.
I would like to thank all the engineers working in the R&D department of MAKEL
for their support and help during my thesis work.
I would like to thank my colleagues and managers at AREVA T&D for their
understanding, help and support.
I would like to extend my special appreciation to my friends Zeynep Aran and Ömer
Göksu for their support they have given me throughout my thesis.
I also would like to thank Ömer Göksu for his valuable comments and
encouragement.
I wish to thank the Department of Electrical and Electronics Engineering faculty and
staff and Graduate School of Natural and Applied Sciences for their help throughout
my graduate study.
I wish to thank the Department of Electrical and Electronics Engineering faculty and
staff and Graduate School of Natural and Applied Sciences for their help throughout
my graduate study.

x
TABLE OF CONTENTS
ABSTRACT............................................................................................................... iv
ÖZ .............................................................................................................................. vi
DEDICATION .......................................................................................................... vii
ACKNOWLEDGMENTS .......................................................................................viii
TABLE OF CONTENTS........................................................................................... ix
LIST OF TABLES ...................................................................................................xiii
LIST OF FIGURES .................................................................................................. xv
CHAPTER
1. PLC: USING POWER LINES FOR DIGITAL COMMUNICATIONS.............. 1
1.1. Introduction.................................................................................................... 1
1.1.1 Scope of the Thesis ............................................................................... 1
1.2. Communication Standards for PLC............................................................... 4
1.2.1 Regulatory Standards for PLC ................................................................. 7
1.3. Brief History of PLC.................................................................................... 10
2. PLC APPLICATIONS IN AMR......................................................................... 14
2.1. What is AMR? ............................................................................................. 14
2.2. Brief History of AMR.................................................................................. 14
2.3. AMR Application Methods Using AMR..................................................... 15

xi
2.3.1 An overview of the common aspects of automatic meter reading
methods ............................................................................................................... 15
2.3.2 PLC Reading Technology................................................................... 17
2.3.3 Integrity and Topology of PLC Network ............................................ 18
2.3.4 PLC Reading Network Protocol (MODBUS) .................................... 19
2.3.5 The Transmitted Packet Format .......................................................... 22
2.3.6 Routing Algorithm .............................................................................. 23
2.3.7 Carrier Sense Multiple Access with Collision Detection.................... 24
2.3.8 The Token Bus MAC Protocol ........................................................... 25
2.3.9 Functions and Operation of MAC....................................................... 26
2.3.10 Other Physical Layer Protocols......................................................... 29
2.3.11 A Cost Effective Alternative Remote Metering Solution: The
Ampmeter System............................................................................................ 31
2.3.12 DLMS: The application protocol for communicating meters ........... 53
2.3.13 ATICON’s Low Cost Power Line Modem for Domestic Applications
............................................................................................................................. 59
2.3.14 An AMR Application Example: Automatic Remote Meter Reading
Using Power Line Carrier Systems in UK .......................................................... 64
2.3.15 Enterprise Wide Benefits of the PLC Based AMR........................... 68
3. PLC IN EUROPE AND TURKEY..................................................................... 72
3.1. Current Status in European Metering Market.............................................. 72
3.2. PLC Applications in Europe ........................................................................ 75
3.2.1 Automated Meter Reading and Energy Management .......................... 77
3.2.2 Indoor Applications for Building Automation..................................... 77
3.2.3 Outdoor Applications, Enhanced Value Services (EVS) .................... 78
3.3 Added Value Introduced by the PLC Applications to the Turkish Energy
Market ………………………………………………………………………………79
3.3.1 The reregulation of the power industry and PLC applications………..79
3.3.2 The Open Electric Power Pool............................................................ .81
3.3.3 Remote Detection of Illicit Electricity Usage via Power Line
Communications ................................................................................................. 89

xii
3.3.4 Broadband over Power Line (BPL) .................................................... 95
3.3.5 Existing and Foreseeable Complications of PLC Applications in Turkey
............................................................................................................................. 99
3.3.6 Conclusion ......................................................................................... 100
4. ADVANTAGES AND DISADVANTAGES OF PLC TECHNOLOGY AS
COMPARED TO ALTERNATIVE COMMUNICATION MEDIA .............. 104
4.1. Introduction................................................................................................ 104
4.2. Comparative Analysis of PLC with the Alternative Communication Media
.................................................................................................................... 105
4.3. The SWOT Analysis for PLC.................................................................... 108
4.3.1 Strengths and Weaknesses ................................................................. 108
4.3.2 Opportunities for the Utility Companies…………………………......111
4.4. Business Aspects of PLC in the scope of Telecommunications and Energy
Market ........................................................................................................ 113
5. PLC SYSTEM CHARACTERISTICS
5.1. Impedance .................................................................................................. 116
5.1.1. Power Line Impedance Characteristics .......................................... 116
5.1.2. The residential power line impedance ............................................ 118
5.1.3. Load Impedance Measurements...................................................... 120
5.2. Attenuation................................................................................................. 122
5.2.1. Power Line Attenuation Characteristics.......................................... 122
5.2.2. Attenuation and Measurement of mains cables .............................. 126
5.2.3. In-home signal strength measurements for signal attenuation........ 133
5.2.4. In-home signal strength measurements for signal attenuation…… 133
5.2.5. Conclusion ...................................................................................... 134
6. NOISE AND DISTURBANCES IN THE POWER LINE NETWORK.......... 135
6.1. Introduction................................................................................................ 135
6.2. Noise in High Voltage PLC Systems......................................................... 137
6.3. Noise in Low Voltage PLC Systems ......................................................... 138

xiii
6.3.1. Operating Environment of Low Voltage Power Lines ................... 139
6.3.2. Classification of Noise in Low Voltage Power Lines..................... 142
6.3.3. The Detailed Analysis of Noise Types ........................................... 147
6.3.3.1 Background noise...................................................................... 147
6.3.3.2 Impulsive noise ......................................................................... 153
6.3.3.3 Narrow Band noise.................................................................... 173
6.3.4 Other Observed Noise Types that are not classified .......................... 174
6.3.5 Power Line Coupling ......................................................................... 179
6.4 Conclusion .................................................................................................. 184
7. EXPERIMENTAL RESULTS OF THE CLASSIFIED NOISE TYPES FOR
POWER LINE CHANNEL............................................................................... 186
7.1. Experimental setup .................................................................................... 186
7.2. Noise measurement techniques.................................................................. 198
7.3. Experimental Results for the Background Noise....................................... 200
7.4. Experimental Results for the Appliance Noise.......................................... 201
7.4.1 Impulsive noise .................................................................................. 203
7.4.1.1 Asynchronous impulsive noise and periodic impulsive noise
asynchronous to system frequency................................................................... .204
7.4.1.2 Impulsive noise synchronous to the system frequency (Harmonic
noise)…………………………………………………………………….…………210
7.4.1.3 Narrow band noise……...……….……………………..……….212
7.5 Conclusion .................................................................................................. 214
8. CONCLUSION................................................................................................. 216
8.1. Experimental results and conclusion ......................................................... 216
8.2. Recommendations...................................................................................... 221
8.3. Future Work ............................................................................................... 223
REFERENCES........................................................................................................ 229

xiv
LIST OF TABLES
TABLES
Table 2.1 The transmitted packet format. ................................................................. 23
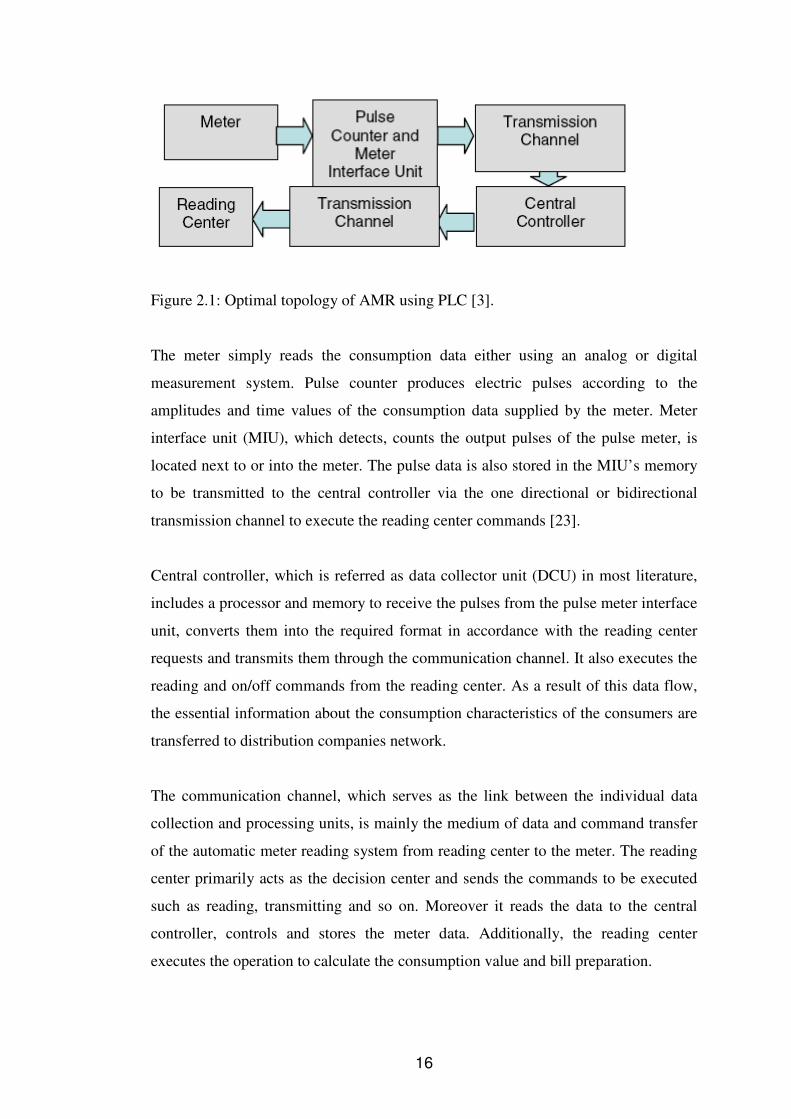
Table 2.2 MAC protocol packet format .................................................................... 27
Table 2.3 The Electronic ID...................................................................................... 42
Table 2.4 The 10 message types designed for the AMR system protocol ................ 43
Table 2.5 The hello packet format ............................................................................ 44
Table 2.6 The hello confirm packet format............................................................... 44
Table 2.7 Sample concentrator database................................................................... 46
Table 2.8 Sample relay database............................................................................... 46
Table 2.9 Selecting 10 consecutive meters with communication status of 1............ 48
Table 3.1 The realized peak time instantaneous power demand and energy demand
values in Turkey between 1997 and 2006................................................................. 85
Table 3.2 The estimated instantaneous power demand and energy demand between
years 2007 – 2016 prior to the global financial crisis in 2008.................................. 86
Table 5.1 Impedances of typical electric household appliances in Turkey............. 121
Table 5.2 Types and sizes of the measured cables.................................................. 129
Table 5.3 Attenuation levels between the divisions of homes (in decibels) .......... 133
Table 6.1 Power wire characteristics ...................................................................... 141
Table 6.2 Low impedance power line loads............................................................ 142
Table 6.3 The most common disturbances and power quality issues that are not
classified conventional noise types in low voltage PLC systems. .......... 177, 178, 179
Table 7.1 The technical specifications for data acquisition devices Wavebook 516 E
and Lecroy 6050A 500 Mhz oscilloscope quad 5 GS/s .......................................... 188
Table 7.2 The technical specifications for Agilent N9320A Spectrum Analyzer... 189

xv
Table 7.3 Measured amplitude and duration characteristics of noise from common
household appliances. ............................................................................................. 203

xvi
LIST OF FIGURES
FIGURES
Figure 1.1 CENELEC Frequency Band Allocation for Europe. ................................. 5
Figure 1.2 FCC Frequency Band Allocation for North America................................ 6
Figure 1.3 Frequency ranges and PLC signal level limits specified in EN 50065...... 7
Figure 1.4 Regularity limits for maximum transmit-voltages................................... 10
Figure 2.1 Optimal Topology of AMR using PLC ................................................... 16
Figure 2.2 The operation flowchart of each node in case of receiving a packet....... 22
Figure 2.3 The schematical representation of Ampmeter AMR system................... 32
Figure 2.4 Major components of the Ampmeter system architecture....................... 32
Figure 2.5 Architecture of the Ampmeter system for a single phase........................ 34
Figure 2.6 A typical AMR system using power line carriers.................................... 36
Figure 2.7 Implementing the AMR network in a hierarchical structure…………….40
Figure 2.8 Logical ring formed on the physical bus ................................................. 52
Figure 2.9 The virtual distribution equipment .......................................................... 54
Figure 2.10 Communications within the OSI reference model................................. 55
Figure 2.11 EHS Power-Line Datagram ................................................................... 61
Figure 2.12 Layer DLMS model............................................................................... 65
Figure 2.13 IEC protocol architecture....................................................................... 66
Figure 2.14 A companion specification .................................................................... 67
Figure 2.15 Proposed protocol architecture for remote meter reading system ......... 68
Figure 3.1 Penetration rate for remote electricity meter reading in EU23+2............ 74
Figure 3.2 Typical topology of a residential distribution grid in central Europe...... 76
Figure 3.3 The reregulation of the power industry. .................................................. 80
Figure 3.4 Key utility operator ventures in Europe .................................................. 87
Figure 3.5 The schematical illustration of detection system of illegal electricity usage
................................................................................................................................... 92
xvii
Figure 3.6 Illegal detector system for one subscriber. .............................................. 93
Figure 3.7 Basic BPL-System................................................................................... 97
Figure 4.1 The integrated energy distribution market infrastructure (source:
EnerSearchAB). ...................................................................................................... 106
Figure 4.2 The comparison between PLT and other relevant technologies for the
provision of Information Society access infrastructure and services
(source: Mason Communications Ltd).................................................................... 107
Figure 4.3 Comparison of access technology upgrade paths (source: Spectrum)... 108
Figure 5.1 Power Line Impedance Measurements by Nicholson and Malack ...... 119
Figure 5.2 Open ring net ......................................................................................... 123
Figure 5.3 The general construction of coaxial cable from inside to outside ......... 123
Figure 5.4 Cross sections of typical indoor power cables....................................... 127
Figure 5.5 Relationship of the relative dielectric constant with frequency and
temperature ............................................................................................................. 127
Figure 5.6 A distributed transmission line model .................................................. 128
Figure 5.7 Attenuation of the measured mains cables ........................................... 130
Figure 5.8 The transfer function of low voltage line versus frequency ................ 131
Figure 6.1 Illustration of modeling for total receiver noise for a system that
superposition principle applies to ......................................................................... 140
Figure 6.2 Strong noise synchronous to power frequency measured at the suburban
location ................................................................................................................... 143
Figure 6.3 The asynchronous impulsive noise examples caused by an electric drill
and a silicon controlled rectifier (SCR) respectively ........................................... 145
Figure 6.4 Residential power circuit that Hooijen uses in his measurements ...... 148
Figure 6.5 Distribution of all noise spectra measured at the urban location of
measurement ........................................................................................................ 149
Figure 6.6 Background noise level of a low voltage power line ......................... 151
Figure 6.7 Comparison of noise PSD versus frequency ..................................... 152
Figure 6.8 Time domain signal of two impulse events REF an analysis of the
broadband noise scenario in powerline networks ........................................ 154, 155
Figure 6.9 The amplitude of the instantaneous asynchronous impulsive noise
increases with the absolute instantaneous value of the power line voltage ......... 157

xviii
Figure 6.10 Noise in the 50 – 500 KHz range ....................................................... 158
Figure 6.11 Synchronous noise and errored timeslots ......................................... 160
Figure 6.12 The master and slave polling algorithm ........................................... 162
Figure 6.13 The packet format ............................................................................. 163
Figure 6.14 Efficiency vs. timeslots used ............................................................ 164
Figure 6.15 Lamp dimmer in the dim position .................................................... 165
Figure 6.16 Throughput vs. message length (2 BAD slots) ................................. 166
Figure 6.17 Lamp dimmer in the dim position .................................................... 167
Figure 6.18 Lamp dimmer in the bright position .................................................... 168
Figure 6.19 Throughput vs. Message Length ...................................................... 169
Figure 6.20 Impulsive noise with a period of approximately 250 kHz ................ 171
Figure 6.21 Noise from electric toothbrush charging stand ................................. 172
Figure 6.22 Power line intercom spectrum ......................................................... 173
Figure 6.23 Strong narrow band noise measured at an industrial location .......... 174
Figure 6.24 Recommended Phase Coupling Circuit ............................................ 180
Figure 6.25 Transformer Isolated Coupling Circuit for Power Line Communications
……………………………………………………………………………………..181
Figure 6.26 Power Line Coupling Circuit found in X-10 Devices ...................... 182
Figure 6.27 Power Line Coupling for CEBus Devices suggested by Intellon .…...183
Figure 6.28 Coupling Circuit for LonWorks PLT-21 Transceiver ...................... 183
Figure 7.1 Schematic representation of the measurement setup used for the noise
measurement…………………………………………………………………….... 187
Figure 7.2 The photograph of the line coupler used for the experiments in MAKEL’s
R&D Laboratories. ............................................................................................... 190
Figure 7.3 The schematical representation of the coupling circuit used ............. 190
Figure 7.4 The squared magnitude of the frequency response of the Filter 1 ...... 192
Figure 7.5 The squared magnitude of the frequency response of the Filter 2 ....... 193
Figure 7.6 A schematic of the measurement setup for Agilent N9320A spectrum
analyzer ................................................................................................................. 194
Figure 7.7 The test schematics for the Agilent N9320A Spectrum Analyzer ....... 195
Figure 7.8 The test schematics for the Wavebook 516E Digital Data Acquisition
Device ................................................................................................................... 195

xix
Figure 7.9 The test schematics for the Lecroy 6050A Digital Data Acquisition
Device ................................................................................................................... 196
Figure 7.10 The background noise spectrum in the frequency domain ................ 200
Figure 7.11 The rms magnitudes of noise voltage values of various electric
appliances ............................................................................................................... 202
Figure 7.12 Impulsive noise for triac-controlled light dimmer ............................. 204
Figure 7.13 The transient asynchronous impulsive noise for the triac controlled
dimmer .................................................................................................................. 205
Figure 7.14 The steady state voltage spectrum of the asynchronous periodic
impulsive noise for the triac controlled dimmer ................................................... 206
Figure 7.15 Asynchronous impulsive noise in ms scale ....................................... 208
Figure 7.16 Asynchronous impulsive noise in µs scale ........................................ 209
Figure 7.17 The transient impulsive noise for the startup of the hair dryer .......... 210
Figure 7.18 The fundamental and the odd harmonics observed by taking the Fast
Fourier Transform of the system voltage .............................................................. 211
Figure 7.19 The voltage spectrum for the laptop with the switched mode power
supply…………...............…………………………………………………………212
Figure 7.20 The voltage spectrum for the PC monitor indicating a narrow band noise
between 9 to 79.5 kHz ............................................................................................ 213
Figure 7.21 The voltage spectrum for the hand drill indicating a narrow band noise
................................................................................................................................. 214

1
CHAPTER 1
PLC: USING POWER LINES FOR DIGITAL COMMUNICATIONS
1.1 INTRODUCTION
Power line communication can be simply described as the distribution of data and
other signals via electric power distribution wires. Briefly, electric power is
transmitted over high voltage transmission lines following generation, distributed
over the medium voltage and converted to low voltage in the distribution
transformers to be used in consumer premises. PLC can be applied at each stage.
However, power line communication over the low voltage power line is the main
concentration of this thesis work. A low voltage line (LVL) is defined as the power
line that includes all the devices connected to the secondary side of a distribution
transformer which is a medium voltage to low voltage transformer. All PLC systems
operate by adding a modulated carrier signal on the mains wiring system [1].
1.1.1 Scope of the Thesis
Research and development on the all aspects of the PLC technology has been
continuing in the metering industry and in the academic world. Academic research is
mainly focused on the modeling of low voltage power line distribution networks,
design of the coupling circuits and network topologies. Motivation of these studies is
to design and produce more efficient and cost effective low power networks. As
described in the early chapters of the thesis, development of intelligent protocols,
algorithms and circuit models for low voltage power line communication which

2
results in efficient, robust and cost-effective power line communication methods is
challenging.
In this thesis, the conventional noise types for low voltage power line network is
identified and the classified noise types are verified by laboratory experiments on the
Turkish low voltage power line network. The literature of the low voltage power line
networks characteristics and the automatic meter reading methods are reviewed first.
Then, the conventional noise types are classified for the low voltage power line
networks depending on the literature studies and finally the measurements and
observations for the theoretically defined noise types are verified via experiments in
METU EE Machinery and Drives Laboratories and R&D laboratories of MAKEL in
Hadımköy.
The first 5 chapters of the thesis include the comprehensive theoretical studies about
the methodology of low voltage power line communication based automatic meter
reading, power line channel communication applications in European and Turkish
markets, the advantages of power line communication technology compared to the
competitive technologies and the characterization of power line communication
methods.
Similar to other communication media such as RF and wireless, PLC operates in a
noisy environment with various noise sources occurring concomitantly. The noise
types and their typical sources are studied in details in Chapter 6. The identified
noise types are background noise, impulsive noise, harmonic noise and narrowband
noise. These noise types are statistically analyzed and some of them are explicitly
defined as a function of frequency and distance.
In Chapter 7, the graphical results and interpretations of these classified noise types
are presented through the experiments performed in METU EE Machinery and
Drives Laboratories and R&D laboratories of MAKEL in Hadımköy. Prior to these
experiments, different line coupler design were developed and simulated over the
Simplorer to obtain proper line coupler circuits. The lie coupler also functions as a

3
high pass filter, blocking the nominal 50 Hz power signal component and spectral
components with low frequencies. The power and voltage spectrum of the resulting
test data were logged in time and frequency domain using the digital data acquisition
devices and spectrum analyzer. The time data is converted to the frequency domain
by using Fast Fourier Transform functions of MATLAB and implementing a simple
code in MATLAB (See Appendix B)
Measurements are performed between the phase and neutral line using the nearest
socket to the incoming mains cable at the laboratory premise. All external noise
sources are switched off. As a result, the interferences observed are either generated
in the laboratory building and adjacent buildings and transmitted over the low
voltage network or picked up by the power lines influenced by the broadcast signals.
Moreover, the measured noise sources are positioned at equal distance from the
source and observation point.
For the digital data acquisition, the sampling frequency is set to 1 MHz. As a result,
the resulting power spectrums are logged for 5 seconds at a sampling rate of 1M
sample per second, leading to a resolution of 0.2 Hz in the frequency response.
Initially no noise sources are connected to the line to measure the background power
spectrum in the frequency domain. During the theoretical in Chapter 6, studies
spectrum fitting and statistical analysis methods are employed in several literatures.
In Chapter 7, the power spectrums obtained are investigated in the frequency
domain. Note that, during the experiments the target is not to model the background
noise but to investigate the applicability of noise models to the Turkish low voltage
network. The experiments are confined to the frequency range between 9 to 150 kHz
in order to comply with the CENELEC standards.
The impulsive noise is classified under three titles: asynchronous impulsive noise,
periodic impulsive noise synchronous to the mains frequency (harmonic noise) and
periodic impulsive noise asynchronous to the system frequency. The impulse noise is
monitored in time and frequency domain. Besides, the three main characteristics of

4
the impulse noise (impulse duration, interarrival time and impulse amplitude are
measured).The data acquisition time is kept long enough to avoid the disturbing
effects of a long impulsive noise. Similarly; a second data acquisition is performed
about 500 ms after the previous one to check the stability of the channel frequency
response after an impulsive noise. The asynchronous impulsive noise and periodic
impulsive noise asynchronous to the system frequency are analyzed in time and
frequency domain. The periodic impulsive noise synchronous to the mains frequency
(harmonic noise) is logged in time domain and the output is converted to frequency
domain using Fast Fourier Transform (FFT) in order to monitor the fundamental
component and the dominant odd harmonics. Finally, the narrow band noise is
observed over the specified intervals of the entire frequency band.
The outline of the thesis is as follows. In the second chapter, power line
communication applications in automatic meter reading are explained. The third
chapter includes the power line communication examples in Europe and Turkey with
present situation and future projections. The fourth chapter involves the advantages
and disadvantages of PLC technology as compared to alternative communication
media. The fifth chapter describes the major characteristics of the PLC system. In
sixth chapter, the noise and disturbances in the power line network are theoretically
defined. The seventh chapter investigates the experimental results of the classified
noise types for power line channel. Finally, the eighth and last chapter provides the
conclusion of the thesis with remarks and points towards future work.
1.2 COMMUNICATION STANDARDS FOR PLC
The power line has been broadly studied as a communication media for high
frequency signals in the recent years. Until recently, most home and building
automation were depending on communication systems that required special wiring
such as twisted pairs, coaxial and fiber optic. In the last decade, the major
developments in the PLC technology have started the emergence of devices that use
the power line to transmit control signals with an acceptable degree of reliability.

5
However, there are still some concerns on this issue, as the low voltage power grid is
initially designed for transmission of power at 50-60 Hz and at most 400 Hz. In
addition, power line is a highly electronically contaminated environment with high
signal attenuation at the frequencies of interest. As a result of these physical
drawbacks, the installation of repeaters is necessary. Moreover, if data transmission
is intended to pass behind the distribution transformer, bridges over distribution
transformers are also necessary.
Another major difficulty for PLC technology is the lack of standardization. There are
different standard for different parts of the world, differentiating mainly on the
maximum transmitted power and allowable bandwidth limitations. Figures 1.1 and
1.2 indicate the frequency spectrum limitations for two different PLC markets;
Europe and North America [2].
Figure 1.1: CENELEC Frequency Band Allocation for Europe [2]

6
Figure 1.2: FCC Frequency Band Allocation for North America [2]
In Europe, the communication standards for PLC are defined by CENELEC (Comité
Européen de Normalization Electrotechnique) which is an organization that is
composed of the national electrotechnical committees of some 18 European
countries. CENELEC (Comité Européen de Normalization Electrotechnique), the
E.E.C’s (European Electrical Committee) electrical standardization body published
the standard EN50065 on low voltage mains signaling [3], [4]. According to those
regulations, power line communication over the low voltage lines is restricted in the
frequency range between 3 kHz to 148.5 kHz. This standard describes some
characteristics of PLC such as the frequency bands allocated to different
applications, access protocol for different users, limits for the terminal output voltage
in the operating band and limits for conducted and radiated disturbances. In addition,
it also includes the test conditions and the methods for measurement. For European
standards the upper limits of the frequency band is 148.5 kHz. However, the upper
limit for the frequency band is considered to be extended for the sake of
compatibility with the USA standards. Still, for the rest of this thesis work, those
narrow bandwidth limitations of the European standards will be taken as a basis.
As seen Figure 1.3, this standard specifies the frequency bands allocated for
applications, access protocols for various users, limits for terminal output voltage,

7
limits for the conducted and radiated disturbance and the test conditions and methods
for measurement of devices. In the technical report of IEC 1334-1-4 [6], the data
transmission parameters such as the impedance, the transfer function and the noise of
low voltage and medium voltage power lines are defined as a function of the
operation range, frequency and time. Further information can be taken from the
related IEC standard published.
Figure 1.3: Frequency ranges and PLC signal level limits specified in EN 50065 [5].
1.2.1 Regulatory Standards for Power line Communications
Also the CENELEC Standard 50090, which has a lot of similarities with the CEBus
standard used in the USA, describes the details of networking at homes and buildings
with some communication media such as coaxial cables, fiber cables, power lines,
twisted pair wires and RF medium [7]. The standard mainly aims to provide the
multiple user efficiency and interoperability between the various system designs of
different PLC technology developers by defining the access techniques, protocols,

8
modulation and coding techniques and data rates. Another concern is avoiding the
interference with ripple control systems.
EN 50065 standards, which allocates the frequency band between 3 to 148.5 kHz for
PLC system operations, provides detailed regulations on parameters such as
frequency range, transmitting power and signal strength. In brief, the utilities operate
below 95 kHz and the private users over 95 kHz [8], [9]. For any case, the signal
level can not exceed 2V. In practice, the measurements indicate that the optimal
frequencies are in the range of 50 – 90 kHz where the noise levels are relatively low.
Also note that, the relatively high frequencies yield a considerable decrease in the
size and costs of the capacitances and inductances used for the filters and coupling
devices. Furthermore, this standard identifies some requirements both for immunity
of PLC system to interference from other PLC systems and for interference produced
by the system itself. The lower frequency boundary is set to 3 kHz in order to avoid
interference with the ripple control systems that operate around these frequencies.
Similarly, the upper boundary is set to 148.5 kHz to prevent the interferences with
medium wave (MW) and long wave (LW) radio broadcasts. EN 50065 standards,
which are separately explained for utility and end user, also specify communication
protocol, equipment impedance (to avoid excessive signal attenuation) and faltering
specifications for carrier removal [10].
The frequency band between 9 to 148.5 kHz is divided into several categories:
• The A-band is between 9 – 95 kHz and is allocated for electrical utility
applications such as automatic meter reading. In this frequency band access
protocol is not applied.
The rest of frequency band (95 – 148.5 kHz) contains B, C and D frequency bands
that are allocated for end-user applications. The frequency band was divided into 3
different subcategories according to the regulations in protocols used.
• For B band that spans the range from 95 – 125 kHz, there is no requirement
to use access protocol. However the lack of access protocol jeopardizes

9
reliability of the communication by making it possible for two systems to
transmit at the same time on the B band. As collision risk is highly available,
this range is allocated to less critical applications such as baby monitors and
intercoms:
• The C band covers the frequency band between 125 – 140 kHz and contrary
to B band, requires access protocol, preventing simultaneous message
transmission. For various systems that operate in this region only one
transmitter can operate at any time. Intra-building computer communications
are common applications that operate in this band.
• The D band comprises the frequency band between 140 – 148.5 kHz and does
not require access protocol similar to A band. Consequently message
collision is a probable problem.
Moreover, the limitation of the transmitted signal behavior for PLC is a matter of
electromagnetic compatibility (EMC). As stated in Fig above, the maximum signal
voltage level for 9 kHz is 134 dB(µV) (or 5V), where 120 dB(µV) is determined as
the maximum signal voltage level for 95 kHz. Similarly, for D band the maximum
transmitted power is limited with 500 mW. Practically for indoor applications the
transmission signal amplitude is limited to 630 mV within a bandwidth of 50 kHz.
Consequently, for outdoor PLC applications such as AMR, the upper limit for the
transmission signal strength is 5V within the predetermined 95 kHz frequency
threshold [11], [12].
As stated before, between 3 kHz to 148.5 kHz the European Standard published by
CENELEC standardizes the transmitted power limits. Beyond 150 kHz EMC
aspects come into the picture. The related standard defines the radio disturbance
limits for higher frequencies. The limitations for conduction-bound noise signals are
described up to 30 MHz. Beyond 30 MHz, the restrictions for maximum
electromagnetic field strength in a default distance is identified [13].

10
Finally, the regulatory limits for maximum transmit voltages for the frequencies
below 148.5 are represented in Figure 1.4. For the frequencies above 148.5 kHz, the
standard defines the properties of the time domain signal, not the power spectral
density spectrum.
Figure 1.4: Regularity limits for maximum transmit-voltages [12]
1.3 BRIEF HISTORY OF PLC
The idea of sending communication signals on the distribution grid is not a recent
idea. However the number of devices connected to dedicated wiring is far more than
the devices installed to AC mains wiring. But the reason for this is the
underestimated communication benefits of PLC. Only in the recent several decades
the transmission advantages of PLC such as reliability, being less susceptible to
hazards, economical architecture for long transmission lines and convenience for
maintenance at the transmission terminals are realized and benefited.

11
In the 1920’s two patents were issued to the American Telephone and Telegraph
Company in the field of “Carrier Transmission over Power Circuits”. Furthermore, in
1924 United States patents with the numbers 1,607,668 and 1,672,940 prove systems
for transmitting and receiving communication signals over three phase AC power
wiring [14]. In Europe, PLC initiated with the outspreading mains supply about 80
years ago. The first carrier frequency systems (CFS) came into service at high
tension voltage in the frequency range between 15 – 500 kHz in year 1922 [15].
High voltage lines are favorable carriers for RF energy, considering that open-wire
equipment with cross connections are rare. A transmission power of 10W is usually
sufficient to transmit over distances of more than 500 km. In the late 1920’s, PLC
was applied in teleprotection when the PLC system was not subject to licensing. The
PLC was smoothly operated in the frequency band from 10 to 490 kHz. There were
only some limited cases of radio interference reported. Moreover, the PLC
equipment was effectively isolated from the mains frequency and the noise
components around the mains frequency. However the line coupling losses and the
line attenuation losses were still vast [16].
In the past and today, the primary purpose of CFS for the utility companies (UCs) is
the proper operation of the distribution system. However with the recent
developments in digital modulation and coding schemes, an enhancement of
bandwidth efficiency can be possible for future CFS applications. As stated earlier,
UCs preferred to build their own communication network, neglecting the already
existing telecommunication networks for remote measuring and control tasks
because of their slow rate of penetration and lack of real-time operation. Still the
power distribution wirings were referred as a promising medium for UCs as almost
all the end point users were connected to the mains line. For medium and low voltage
lines the load management was the primary task in means of communication.
However the information flow was limited and unidirectional from the UC to the
customer.

12
Ripple carrier signaling (RCS) was introduced in year 1930. The earliest form of
AMR systems developed were fixed carrier, analogue systems that was first put to
trial in the 1950s using the ripple control signalling method [17]. Differently from
CFS, RCS was designed for medium voltage level (10-20kV) and low voltage level
(240/415V) distribution systems. CFS was abandoned because of some difficulties
such as high number of cross connections and various conductor types (open-wire
and cable). In addition, the long distance RF signal propagation was unfavorable
because of impedance matching problems and high attenuation. In order to surmount
the impairments, large scales of RF transmission power needed to be used and this
was causing some electromagnetic compatibility (EMC) problems. Thus, the
frequency range for RCS was reduced below 3 kHz to 125 Hz. Moreover the
transmission powers needed in the range from 10 KW to 1 MW as the impedance of
the loaded distribution network was very low. In those days, typical telegram was
consisting of 10 to 60 packets adding up to 20 to 120 bits with some time delays and
the total length was around 0.5 to 3 minutes. The Ripple Control Signaling was used
in the power grid at low frequencies. It required high transmitter power but provided
low bit rate. RCS was a one way communication and used mainly for applications
such as management of street lights, load control and tariff switching. The RCS was
later abandoned despite its high reliability because the improvement and extension
capabilities of this method were insufficient for the new technologies developed [15].
Another candidate application for the purpose of moving the PLC to the main stream
was a commercialized version of military spread spectrum technology. The research
and product development companies concentrated on commercial spread spectrum,
which was assumed to overcome the unstable and unpredictable characteristics of
power line, since the beginning of 1980’s. However until today the spread spectrum
technique could not generate promising products for deployment of PLC [14].
Finally, in the mid 1980s, the utility companies began to invest on R&D studies and
contributed to the further development of PLC. The major driving factor for these
studies was the implementation of the Supervisory Control and Data Acquisition
(SCADA) systems. The R&D departments of some specific utility companies and the

13
working groups sponsored by these utility companies, located in both US and
Europe, investigated the electric grid as a medium for data transfer. The signal noise
levels and the attenuation of the signal through the grid were measured. These
systems offer a slightly higher data transmission rate. Then investigations were made
in the mid 1980s by several utility companies to analyze the characteristic properties
of the electric grid as a medium for communication. Signaling frequencies in the
range of 5 – 500 kHz were investigated. Main areas of investigation were the signal-
to-noise ratio levels affected by the power line channel, as well as the attenuation of
the signal by the transmission grid. As a result of these intense research activities, bi-
directional communication in the power grid was developed through the late 1980s
and the early 1990s. The present systems came onto the market during this time
frame. The main difference in the newer systems was the use of much higher
frequencies (the wideband frequency range, often in MHz range) and a substantial
reduction in the signal levels. As a result of this development two-way
communication became realistic [18].
Today advance protocol techniques are employed to make them adaptive to network
changes and to achieve better management of data transmissions. Some modern PLC
solutions operate in the carrier frequency range of 1-30 MHz. The foreseen future
development will utilize the frequencies in the GHz range with a much higher
bandwidth and a high data throughput, possibly in the order of megabit/second speed
range [19].
14
CHAPTER 2
PLC APPLICATIONS IN AMR
2.1 WHAT IS AMR?
Automatic meter reading, or AMR, is the technology of automatically collecting data
from energy metering devices (water, gas and electric) and transferring that data to a
central database for billing and/or analyzing. In other words, like the name implies,
AMR refers to the collection of data from electronic meters and transmission of the
collected data via communication links without any human intervention. This saves
employee trips, and means that predictions about next months billing can be based on
actual consumption rather than on an estimate based on previous consumption,
giving customers better control of their consumption [20], [21].
2.2 BRIEF HISTORY OF AMR
First AMR tests were conducted in 1967 by AT&T in cooperation with a group of
utility companies and Westinghouse. As a result of these experiments, AT&T
introduced its phone based AMR service with a cost of $2 per meter which was four
times more than the cost of manual reading at these times. Therefore, the solution
was economically unfeasible. Several years after that, in 1972, the General Electric
Corporate Research Centre, in conjunction with GE Meter Department in
Somersworth, New Hampshire initiated an R&D effort to implement a remote
metering system for centralized TOU (time-of-use) metering referred as AMRAC.
Moreover, in 1977, a Utility Communication Division was established at Rockwell
International to develop distribution carrier communication systems. Later in 1984,

15
General Electric acquired an exclusive license from the Rockwell International to
commercialize the distribution line carrier product designs and related design and
technology.
In 1985, the implementation of several full scale projects initiated the modern era of
AMR. Hackensack Water Co. ad Equitable Gas Co. implemented the first full scale
AMR project for water and gas meters respectively. Following that, in 1986,
Minnegasco established a 450,000 point radio based AMR system. In 1987,
Philadelphia Electric Co. managed to reach to a large number of inaccessible meters
by installing thousands of distribution line carrier AMR units. Today, the advances in
solid state electronics, microprocessor components and low cost surface mount
technology assembly techniques enables the production of reliable and cost effective
products that rationalize the use of AMR systems on a large scale [21], [22].
2.3 AMR APPLICATIONS METHODS USING PLC
2.3.1 An overview of the common aspects of conventional automatic meter
reading methods
Independent from the type of communication system employed, every automatic
meter system is composed of some specific units. The transmission between the
elements should be clearly defined. Each unit should be distinguished by a unique
identification code, should be able to communicate to the other units directly or via
one or more intermediate units and should be able to receive and transmit data to and
from other units. The Figure 2.1 below briefly illustrates the AMR units.
16
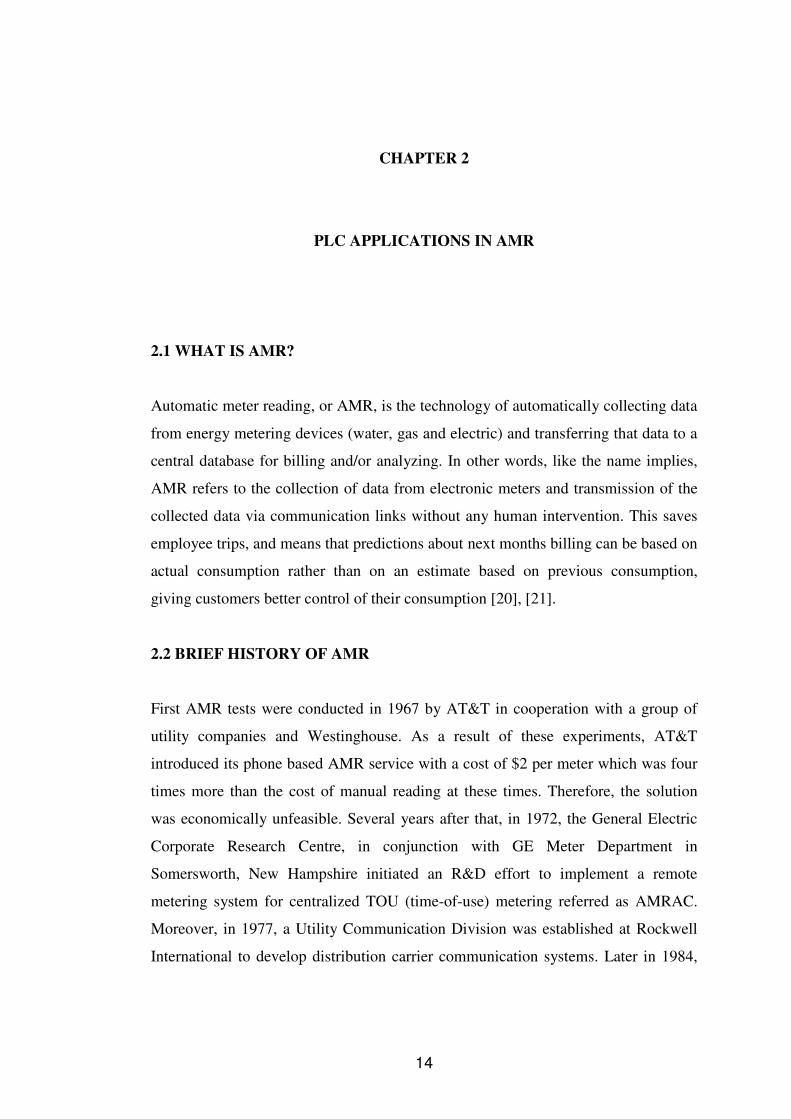
Figure 2.1: Optimal topology of AMR using PLC [3].
The meter simply reads the consumption data either using an analog or digital
measurement system. Pulse counter produces electric pulses according to the
amplitudes and time values of the consumption data supplied by the meter. Meter
interface unit (MIU), which detects, counts the output pulses of the pulse meter, is
located next to or into the meter. The pulse data is also stored in the MIU’s memory
to be transmitted to the central controller via the one directional or bidirectional
transmission channel to execute the reading center commands [23].
Central controller, which is referred as data collector unit (DCU) in most literature,
includes a processor and memory to receive the pulses from the pulse meter interface
unit, converts them into the required format in accordance with the reading center
requests and transmits them through the communication channel. It also executes the
reading and on/off commands from the reading center. As a result of this data flow,
the essential information about the consumption characteristics of the consumers are
transferred to distribution companies network.
The communication channel, which serves as the link between the individual data
collection and processing units, is mainly the medium of data and command transfer
of the automatic meter reading system from reading center to the meter. The reading
center primarily acts as the decision center and sends the commands to be executed
such as reading, transmitting and so on. Moreover it reads the data to the central
controller, controls and stores the meter data. Additionally, the reading center
executes the operation to calculate the consumption value and bill preparation.

17
2.3.2 PLC Reading Technology
In the context of the automatic meter reading system using PLC studied in this thesis
work, the communication channel between the meter interface unit and the center
controller is the LV power line. There are various alternatives for the communication
channel between the central controller and reading center such as GSM, GPRS,
radio, telephone lines or MV power lines. The maximum distance that is convenient
for transmission between the meter interface unit and central controller (data
collector unit in our case) depends on different parameters such as power line
impedance, wire twisting and vicinity, quality of nodes and the power line,
underground or overhead lines and even the wind direction. The practical maximum
distance between a MIU and DCU is considered to be around 150 to 300 meters;
however this limit can be exceeded by employing MIUs as metering devices and/or
including repeaters with an effective distribution [24].
A PLC modem is occupied on both sides of the communication channel between the
meter interface unit and the central controller. A multi frequency modem may be
used rather than a single one to make use of various frequencies to communicate
between the AMR units and to avoid signal interference. For multi layers systems,
one frequency can be allocated for the communication between the upper layer
(reading center) and the middle layer (DCU) and another frequency for the
communication between the middle layer and the lower layer (MIU).
For the wired communication system, as the transmitted signal is added on the power
signal, the choice of modulation is critical in order to avoid the disturbance.
Moreover, for long communication distances, the signal can not be transmitted in the
digital form because of the resistive and inductive losses. In order to avoid these
losses and disturbances, FSK modulation can be used. Due to the sinusoidal signal of
FSK, the power line and the passive elements may cause signal attenuation but the
consumption data is still preserved uncorrupted. Additional benefits of FSK are its
ability to transmit in high frequencies and its reliability [25].

18
2.3.3 Integrity and Topology of PLC Network
The difficulties, such as data transmission security and accuracy having priority over
the communication speed for the functionality of an AMR system and the high line
losses in low voltage, promote lower baud rates to increase data reliability and
precision. Lower baud rates also enable higher transmission distance range.
Theoretically, considering various parameters such as the distance between the MIUs
and DCUs, the number of MIUs under a MIU, attenuation and line losses, the
optimum baud rate can be chosen as 600 bps.
Another issue is the integrity. In an AMR structure, all of the system units should
communicate with each other in an integrated manner. Considering the network
topology, consumers that are further away from the DCUs suffer from the PLC
signal distance range threshold. DCUs might not be able to directly communicate
with all the MIUs under its branch. Also the MIUs under a substation might not be
able to see all MIUs in its network.
Collision is a common problem of all communication media. Due to the common
carrier frequencies used by all units for injection, audit and control procedures should
be put into service in order to avoid collision originating from the simultaneous
injection of two different units. Collision takes place in the case when two devices
can directly communicate with each other and send data at the same time. For the
implementation of collision detection topology the transmitting units can not identify
the carriers of each other, another intermediate device is needed to identify the
signals of both sides. In this case if two devices inject data at the same time, the
collided data is received by the third intermediate unit and considered to be invalid
Consequently, several key points to prevent collision are listed below:
1- There should be only one DCU under a substation network operating as the
master. The line management and control of data transmission traffic should
be this DCU’s responsibility.

19
2- Each consumer should be given a unique ID to discern it from other
consumers.
3- Collision detection and prevention software should be implemented to avoid
simultaneous signal injection.
One of the most widespread protocols that satisfy the above conditions for low speed
PLC channels is MODBUS.
2.3.4 PLC Reading Network Protocol (MODBUS)
Modbus is a serial communication protocol that is frequently used to transmit data in
LV and MV distribution lines. It is a simple implementation of master/slave logic for
serial interfaces. Modbus is suitable for applications with few communication
stations and short transfer time because of its limited transfer rate around 38.4
kBaud.
Modbus protocol uses the 9-148.5 kHz frequency range in accordance with the
CENELEC (EN 50065-1) standard which is applicable for the devices operating with
carrier frequencies in the range of 3 kHz to 148.5 kHz for LV power line
transmission. According to this standard, different frequency bands are allocated to
specific applications in order to diminish the mutual effects of communication
signals transmitted by the various units in the system and to reduce the disturbing
effects of power line communication on various sensitive electronic devices.
As stated below the structure is composed of a single master and several slave
stations controlled by this master. There are two alternative communication
mechanisms that can be employed in the context of MODBUS: [26]
1- Request/Respond (Polling) Mechanism: Master stations sends a request
message to the slave stations and the slave stations respond back with
acknowledge message.

20
2- Broadcast mechanism: Master sends a global command to all the slave
stations and the slave stations execute the command without sending
acknowledge.
For the MODBUS application studied in the scope of this thesis work the frequency
band between 125 kHz to 140 kHz is allocated. Also the power line signal
transmitted in this frequency range is subject to access protocol. Accordingly, if the
communication medium is shared by several systems, the following requisites are to
be fulfilled. Firstly; all devices connected should use a frequency for data
recognition. Secondly; the line access time for a transmitter should not exceed one
second and should not be less than 125 ms in order to be considered as a valid
transmission. Moreover, the maximum interval between signal series in a sending
stage is limited to 20ms. The carrier detection algorithm is employed to detect the
frequency band occupancy. As a result, each element is allowed to inject a signal
only if the line is detected to be idle.
There is no specific procedure to select a master node. However, high density signal
points are better candidates. Again note that in each network only one unit can be
determined as master and each node is given a unique ID. Furthermore; the route of
data interchanges starting from the master node, including the intermediate nodes (if
the destination node is not directly accessible by the master node) and ending with
the destination node, is identified in the message format.
After injecting the packet, the master node waits for the acknowledge message from
the destination node. The destination node converts the sent message to acknowledge
message and gives it to the line after executing the command specified in the sent
message. The destination node reverses the direction of the direct path to find the
return route. The PLC modems in both sides of the communication medium between
the MIUs and DCUs convert the data into a particular format to avoid the reception
of invalid signals from the disturbance sources. This should be a unique format for
all the units so that every node adopts the packet. After receiving the packet each
node checks the data format and accepts if it is in known format or rejects if it is not

21
in proper format. Then if the format is appropriate, the node checks whether it is the
destination node or intermediate node. If it is the intermediate node, the packet is
transferred to the next node. Finally when the packet arrives to the destination node
and the node verifies itself as the destination node by checking the pointer in the
package, the command is executed and the packet is put back to the return path in the
form of acknowledge packet. Considering that each packet is designed so as to be
received by only one destination node, an additional indicator is needed. A pointer is
inserted into the packet format to indicate the current position of the packet on its
route to the destination node. An intermediate node reacts to a packet it received only
if the pointer register is in accordance with the position of this specific node in the
route. All the other nodes that do not match with the pointer ignore the packet. Thus
each time a packet is transmitted to adjacent nodes, only one node responds to the
packet and the collision is avoided. This data flow is expressed in Figure 2.2. The
algorithm explained above is common for every network that uses power line as a
communication channel. The packet design is flexible and can be modified according
to constraints of the protocol used.

22
Figure 2.2: The operation flowchart of each node in case of receiving a packet [23]
2.3.5 The Transmitted Packet Format
Figure 2.3 is the standard format for a command packet from DCU to MIUs or an
acknowledge packet from MIUs to DCU. Packet length is specified in a separate
register. The mix byte includes the packet type (command or acknowledge),
command type (reading or writing), path length and the path pointer. The pointer is
again crucial for a reliable transmission so that when the destination node receives

23
the packet it confirms the path by checking the pointer. The destination node should
have the same address as the destination ID and the pointer should be equal to zero
when the packet reaches the destination node.
Table 2.1: The transmitted packet format [23]
The packet body includes the consumption value. It should be noted that only meter
consumption value returns to the DCU, other information such as tariff and demand
can be calculated in MIU or other middle layers and transferred to the reading center.
As mentioned under MODBUS protocol specifications, the line access of a unit is
limited by a maximum duration of one second. Taking into account the PLC modem
used and the delay time between transmitting two bytes and the software delays, the
maximum packet length can be calculated. The packets whose lengths exceed this
amount should be transmitted in multi packets. As stated before, the line access time
for a transmitter should not exceed one second and should not be less than 125 ms in
order to be considered as a valid transmission.
2.3.6 Routing Algorithm
In order to route the best path to each MIU, the DCU initially tries to read all the
MIUs under its branch directly by sending a command to each MIU and waiting for a
response for a specific time. Then DCU makes the list of MIU from which it receives
the acknowledge packet. Secondly; DCU tries to reach to the other MIUs by using
the direct path MIUs as intermediate unit and again makes another list of the second
stage MIUs that can be reached via the direct path MIUs. DCU repeats this procedure
for a particular number of times and keeps the list of the founded MIUs in each stage
and also records the number of intermediate MIUs used to reach them. Finally, DCU
assigns weights for each route that can be used to reach every single MIU, selects the

24
three paths with the maximum weight (minimıum number of intermediate MIUs) and
stores them in the routing list of this specific MIU. The DCU tries to reach the MIUs
by first trying the route with the maximum weight and uses the alternative routes
with smaller weights if it fails.
2.3.7 Carrier Sense Multiple Access with Collision Detection (CSMA/CD)
Carrier Sense Multiple Access with Collision Detection is a networking protocol in
which a carrier sensing scheme is employed. If a transmitting data station detects
another signal while transmitting a frame, stops transmitting that frame, transmits a
jam signal and then waits for a random time interval [26]. Collision detection is used
to improve CSMA performance by terminating transmission as soon as a collision is
detected and by reducing the probability of a second collision on retry [27].
Methods for collision detection depends on the media used, however on an electrical
bus such as Ethernet, collisions can be detected by comparing the transmitted data
with received data. If they are different, another transmitter, this points out that
another transmitter is overlaying the first transmitter’s signal (a collision exists), and
transmission terminates immediately. Following that, a jam signal is broadcast and
all transmitters back off by random intervals, reducing the probability of another
collision resulting from a retry attempt.
CSMA/CD MAC sub layer monitors the physical medium for traffic by watching the
“carrier sense” signal provided by the PLC (physical layer signals to MAC layer),
even for the instants when there is no packet to be transmitted. When the medium is
busy, the CSMA/CD MAC gives the priority to the passing frame and delays its own
pending transmission. When the last bit of the passing frame leaves the channel and
the “carrier sense” signal changes from true to false, the CSMA/CD MAC continues
with the proper transmission [28], [29].

25
“Collision detect” signal provided by the physical layer is monitored to detect
collisions. When a collision is detected during a frame transmission, the transmission
is not immediately terminated. Instead, the transmission continues until additional
bits (counting from the time “collision detect” signal is generated) determined by
“jam size” have been transmitted. This collision enforcement or jam is applied to
guarantee that the duration of the collision is sufficient for the all transmitting
stations in the network to detect the collision [26].
2.3.8 The Token Bus MAC Protocol
The token bus MAC protocol is an alternative communication protocol for the
Carrier Sense Multiple Access/Collision Detect (CSMA/CD) methods.
As described in details in the Chapter 6 , the power grid is exposed to various sources
of transmission loss such as power line noise, frequency dependent signal attenuation
and frequency dependent power line impedance. Until the utilization of spread
spectrum techniques, power line was only used for noncritical, low level control and
data transfer applications. Today, power line modems using the advance modulation
techniques can be employed to establish power line local area networks (PLLAN) for
reliable data communications in high data rates [30].
The physical layer of the PLLAN employs the spread spectrum techniques for the
data transmission over the mains line. The MAC that operates on the physical layer
regulates access to the power line utilizing a token passing scheme based on IEEE
802.4 token bus standard.
The token bus protocol has some considerable advantages compared to CSMA/CD
protocols
• A token is used to determine transmission priority and regulate the access to
the bus. Thus, the nodes do not have to contend for the allocation of the bus

26
as it is the case for other protocol such as carrier sense media access with
collision detection (CSMA/CD)
• This protocol executes smoothly under medium and heavy load traffic
conditions which is a common situation for power line channel transmission.
• The token bus protocol is suitable for the peer to peer network in the sense
that each node is guaranteed to have access to the bus and allocated a fair
share of the network bandwidth.
• The failure of a node on the logical ring can be determined with minimum
overhead
2.3.9 Functions and Operation of MAC
MAC performs the main tasks of the data link layer. MAC determines the timing to
place a frame on the bus, coordinating with the other nodes’ MACs to control access
to the shared bus. Besides, MAC provides the initialization, development and
maintenance of the logical ring and addition of new nodes to the logical ring.
Moreover MAC has additional responsibilities such as fault detection and recovery
[31].
MAC constitutes the logical ring for the data transmission on the bus according to
the numerical ordering of the node addresses. The token, which represents the
permission to use the line, is handed on from one node to the successor node in
ascending order of the node addresses. The node resides in a particular node only
during a predefined token holding time which is equal to the time required for the
transmission of one packet. Once a node completes the transmission of any data
frames, it hands on the token to the successor node by sending a token control frame.
The related packet format of the token bus protocol is shown in Table 2.2. The
header information is added to data that is passed to the MAC that operates in the
physical layer and handed on to the physical layer controller that adds the preamble
and postamble and the CRC code to the data for actual physical transmission. In case
of any failure of transmission, the physical controller sends the transmission failure
message to the MAC which employs an adaptive retransmission policy to decide if
27
the entire packet is to be resubmitted to the physical layer controller for another
transmission attempt.
Table 2.2: MAC protocol packet format [32]
As stated before, MAC has addition functions such as network initialization, addition
of new nodes, deletion of nodes, new token generation and recovery form duplicate
tokens.
2.3.9.1 The network node list
The network list that contains the address of all other nodes on the network is formed
at each node for the PLLAN management. The network list that is formed in the
numeric order of the node addresses is updated at regular intervals. The node uses the
network list to determine its successor node [30].
2.3.9.2 Addition of new nodes
The MAC protocol periodically searches for new nodes to add to the logical ring.
The token holding node polls the nodes that are addressed between itself and the
successor node. The token holding node tries to pass the token to the polled nodes
until an active node is reached. The token is passed to the successor node if an active
node could not be located. If the token holding node finds a new node, new node
broadcasts its address to all listening nodes and passes the token to the predecessor
node which is the token holding node now. The listening nodes accordingly update
their network node lists when they receive a broadcast message. The token holding
node assigns the new node as its successor and passes the token and its network list
to the new node. By this way, the new node becomes a part of the logical ring [33].

28
2.3.9.3 Deletion of failed nodes
Due to some troublesome power line conditions or node failures, if a node can not
successfully transfer the token to the successor node, this node is considered to have
failed. Then the token holding node sends a network command to all the nodes to
remove its successor node, which it could not deliver the token, from their network
lists. After that, the token holding node finds a potential successor from its network
list and passes the token to that node. In case of another failure, the previous step is
repeated. After several trials, if no node remains in the network list, the token
holding node assumes that no other potential successor exists and the network
initialization process is started [33].
2.3.9.4 Network initialization
Each node listens to the network for a predefined time (according to the address of
the node) waiting for a network activity. Unless the node detects a network activity
during this fixed time, it generates a token and assumes master status which means
that now it has the responsibility to initialize the ring. To begin the initialization
process the initial network master incrementally polls the network address, trying to
pass the token until an active node is determined. The located node broadcasts its
address to the entire network and then passes the token to its predecessor node which
is the network initializer. The listening nodes update their network lists according to
the broadcast message from the second node. This is how a network composed of
two nodes is established. Note that the procedure for the addition of nodes is
described in the previous section.
2.3.9.5 New token generation
New token generation is necessary in case of a lost token condition. If a physical
layer control determines a lost token condition, the node’s firmware warns the related
MAC after a predetermined time out period. Then, this node assumes master status

29
and begins the network initialization procedure. At the mean time, the physical layer
controller constantly monitors the network to avoid another node to operate as a
master. If this is the case such that two nodes simultaneously generate a new token
and assume master status, the physical layer control of on of these nodes will
immediately drop the token as soon as it detects the error condition. Thus, only one
master node remains. Also if the two nodes drop their token at the same time, then
the network initialization is initiated again.
2.3.10 Other Physical Layer Protocols
There are several physical layer protocols available from various PLC manufacturers.
These protocols are briefly described as below [34], [35].
2.3.10.1 X-10
X-10, which is one of the oldest power line communication protocols, employs
Amplitude Shift Keying (ASK) modulation. Simply, a 120 kHz AM carrier signal is
superimposed to the ac power line at zero crossing to minimize the noise interference
and the information is coded according to the bursts of this signal. To ensure the
communication reliability, every bit is sent twice and consequently the transmission
takes a full line cycle. As a result the transmission rate is limited to 50 BPS for a 50
Hz mains frequency. X-10 command is composed of two packets with a 3 cycle gap
between them. As stated above, each of two packets carry two identical messages of
11 bits. That adds up to a 48 cycle command length with a duration of 0.8 second [2],
[36].
Although the initial X-10 applications were unidirectional, later some bidirectional
products are also manufactured. Mostly, the control signals from the X-10
controllers are transmitted to the simple receivers are used to control lighting and
similar appliances. X-10 has quite poor bandwidth and the transmission reliability is
in considerable distress because of the unfriendly and noisy transmission
environment.

30
2.3.10.2 CEBus
CEBus protocol employs peer to peer communications model. CEBus provides
protocol standards for RF, twisted pair, PLC and some other home networking
methods. For CEBus, a binary digit is represented by how long a frequency burst is
applied to the channel. For example, if a binary “1” is represented by a 100
microsecond burst, a binary “0” may be represented by a 200 microsecond burst.
Consequently, the CEBus transmission rate depends on the number of “0” and “1”
characters transmitted [37].
In CEBus protocol, every node in the network has access to the communication
media every time. As a result collision is probable. A Carrier Sense Multiple
Access/Collision Detection and Collision Resolution (CSMA/CDCR) protocol is
utilized to avoid collision. As stated before when the CSMA/CD protocol is
explained, according to this protocol, a particular node waits for the line to be clear
and makes sure that there is no other nodes transmitting before it sends a package
[37]. The objective of this protocol is the optimum allocation of communication
channel in the sense that as many nodes as possible can use the medium without
interfering with each other. The physical layer of the protocol is based on spread
spectrum technology. The packet format includes the mandatory sender and receiver
address and is transmitted over the media at about 10 Kbps [38].
CEBus is a commercially owned protocol so its applications require registration fees.
Generally, currently commercially available CEBus protocols are simple systems
designed for home automation. Still, there are some high capacity systems that are
developed in some research institutes.
2.3.10.3 LonWorks
Similar to CEBus, LonWorks is also based on peer to peer connection by
implementing Carrier Sense Multiple Access (CSMA) protocol. Differently from the
CEBus, LonWorks utilizes narrow band spread spectrum modulation scheme (125 –

31
140 kHz, BPSK) with a multibit correlator to protect the data against the interference
noise by using a patented impulse noise cancellation scheme. As LonWorks uses a
narrower transmission band, the levels of distortion of the transmitted signals is
considerably lower than that of wide band spread spectrum [39].
2.3.11 A COST EFFECTIVE ALTERNATIVE REMOTE METERING
SOLUTION: THE AMPMETER SYSYTEM
Coming into picture as an improvement for the optimal topology of AMR solution
described above, the Ampmeter systems shares most of the common units of the
optimal topology of AMR and has some additional specialties [40].
Especially for premises such as apartment complexes, university dorms and military
complexes with high turnover of residents, manual reading is an expensive
application that needs multiple trips to the customer premise. AMR can be employed
at these kinds of applications for the automated billing and remote control and
management of the meters.
Ampmeter is a bidirectional AMR that integrated PLC and GSM/GPRS technologies
to enable utility company to remotely connect and disconnect energy measurement
services, activate load balancing and cost control. The design of the AMR system
without the need of additional wiring is illustrated in Figure 2.5.

32
Figure 2.3: The schematical representation of Ampmeter AMR system [41]
Similar to the optimal topology described above, the Ampmeter consists of three
parts: the meter interface module, the data concentrator system and the central
computer system. The illustration of the proposed architecture is given in Figure 2.4.
Figure 2.4: Major components of the Ampmeter system architecture [42]

33
The parts of the system are not to be defined in details as most of the parts have the
same functions as the optimal topology design. In short, the meter interface consists
of a backup power supply accompanied by the meter sensors, controlling electronics,
memory for storing data and a communication interface that facilitates the data
transfer from this remote device to the central computer. As stated also for the
optimal topology, the Ampmeter system is also bidirectional, enabling the central
computer signals to be received by the remote metering unit and vice versa. The data
concentrator, which acts as a bridge between the central computer and the meter
interface unit, is employed for the transmission of data and control signals between
the meter interface unit and the central computer. In this particular system, the link
between the remote metering unit and the concentrator is a low voltage power line.
On the other hand, a GPRS system is used for the link between the concentrator and
the central computer which is composed of the host computer and the GPRS modem
for the link to the concentrator.
The main functionality of the units can be summarized according to the diagram in
Figure 2.5

34
Figure 2.5: Architecture of the Ampmeter system for a single phase [43]
2.3.11.1 The main components of Ampmeter system
2.3.11.1.1 Central station (Central computer)
Central station provides the administration, configuration and operation of automatic
data acquisition, processing and transmission over the man machine interface (MMI).
The database included stores the configuration, operation and acquired data and the
scheduler performs the periodic tasks automatically. At the central station, the meter
data is converted and transmitted to the utility company’s related departments to be
stored as a historical database [43].
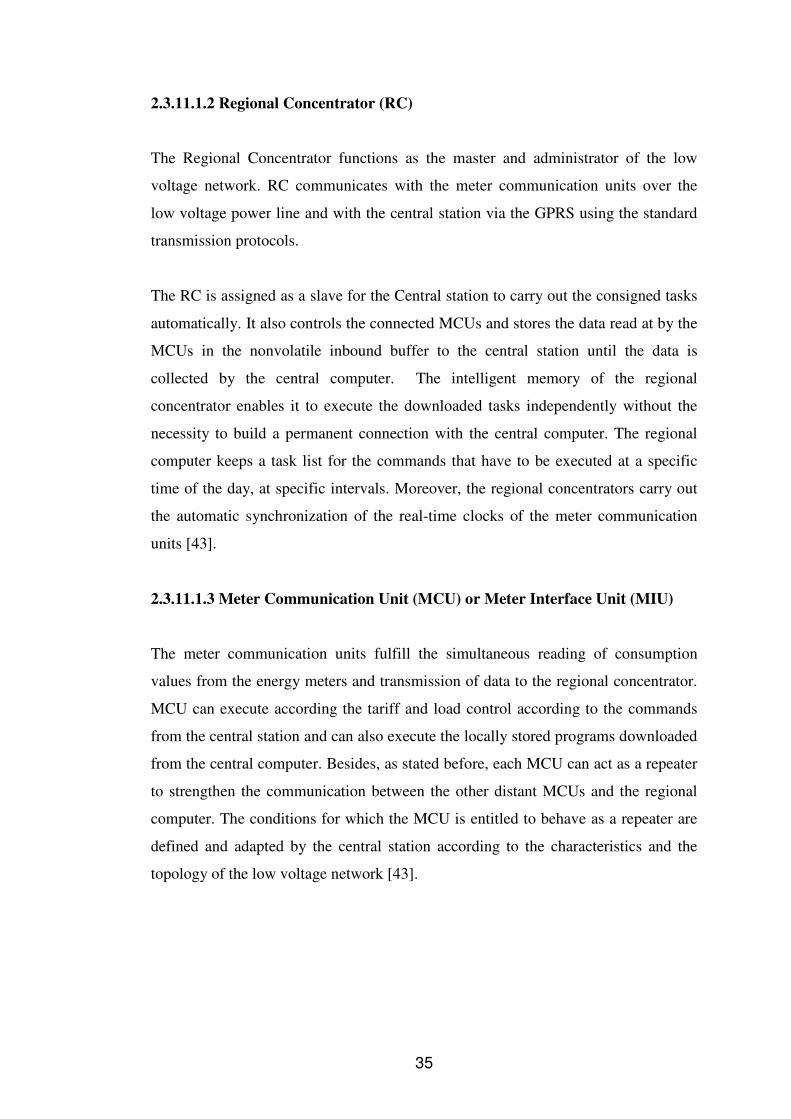
35
2.3.11.1.2 Regional Concentrator (RC)
The Regional Concentrator functions as the master and administrator of the low
voltage network. RC communicates with the meter communication units over the
low voltage power line and with the central station via the GPRS using the standard
transmission protocols.
The RC is assigned as a slave for the Central station to carry out the consigned tasks
automatically. It also controls the connected MCUs and stores the data read at by the
MCUs in the nonvolatile inbound buffer to the central station until the data is
collected by the central computer. The intelligent memory of the regional
concentrator enables it to execute the downloaded tasks independently without the
necessity to build a permanent connection with the central computer. The regional
computer keeps a task list for the commands that have to be executed at a specific
time of the day, at specific intervals. Moreover, the regional concentrators carry out
the automatic synchronization of the real-time clocks of the meter communication
units [43].
2.3.11.1.3 Meter Communication Unit (MCU) or Meter Interface Unit (MIU)
The meter communication units fulfill the simultaneous reading of consumption
values from the energy meters and transmission of data to the regional concentrator.
MCU can execute according the tariff and load control according to the commands
from the central station and can also execute the locally stored programs downloaded
from the central computer. Besides, as stated before, each MCU can act as a repeater
to strengthen the communication between the other distant MCUs and the regional
computer. The conditions for which the MCU is entitled to behave as a repeater are
defined and adapted by the central station according to the characteristics and the
topology of the low voltage network [43].
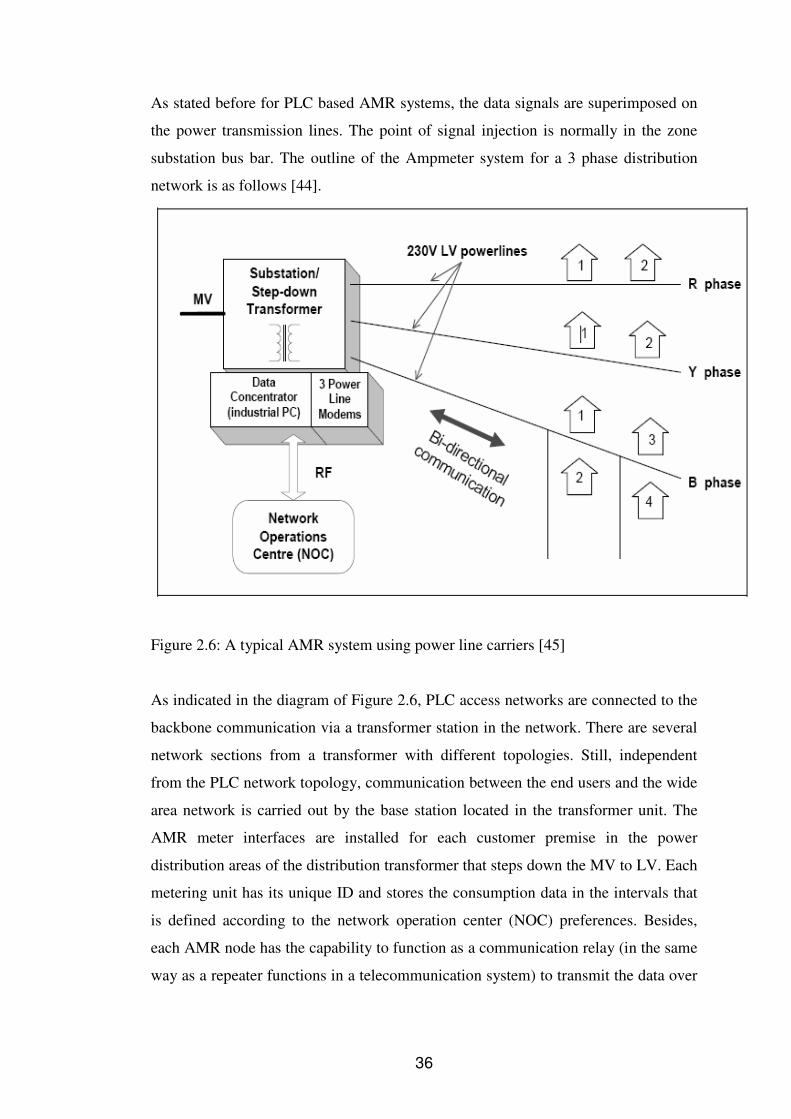
36
As stated before for PLC based AMR systems, the data signals are superimposed on
the power transmission lines. The point of signal injection is normally in the zone
substation bus bar. The outline of the Ampmeter system for a 3 phase distribution
network is as follows [44].
Figure 2.6: A typical AMR system using power line carriers [45]
As indicated in the diagram of Figure 2.6, PLC access networks are connected to the
backbone communication via a transformer station in the network. There are several
network sections from a transformer with different topologies. Still, independent
from the PLC network topology, communication between the end users and the wide
area network is carried out by the base station located in the transformer unit. The
AMR meter interfaces are installed for each customer premise in the power
distribution areas of the distribution transformer that steps down the MV to LV. Each
metering unit has its unique ID and stores the consumption data in the intervals that
is defined according to the network operation center (NOC) preferences. Besides,
each AMR node has the capability to function as a communication relay (in the same
way as a repeater functions in a telecommunication system) to transmit the data over

37
a noisy path between another AMR meter and the concentrator that struggles to send
or receive information to that problematic AMR meter.
Considering Figure 2.6, the data concentrator, which is normally located at the
distribution transformer, is composed of a PC and three power line modems for each
phase (R,Y and B). Besides, for each isolated section of the low voltage network, a
new data concentrator should be located. Because the carrier frequencies of the AMR
system is significantly higher than the mains frequency and the distribution
transformers act like a low pass filter at the low voltage boundary, forming a
restricted section for this specific low voltage sub network. The Ampmeter system
also uses the same master/slave approach same as the optimal topology solution.
Again the data concentrators are the masters and the AMR metering units are the
slaves. As the data concentrators are on the LV side of the distribution transformer,
the communication and control signals are simply transmitted over the power line
between the concentrator and the metering unit. For the communication between the
concentrator and the network operation center (NOC), a GPRS link by the use of
GPRS modems is employed. Depending on the geographical position of the system
installed and data transmission rate requirements, GSM, direct fiber optic, copper
links or Ethernet protocol 802.11b can be utilized for the link between the NOC and
the concentrator [46].
2.3.11.2 The Functions and the benefits of Ampmeter
As stated before the main functions of the Ampmeter is Automatic Meter Reading,
remote connection of services and e-billing. Moreover, it enables the utility company
to monitor the electrical network profiles of the customers. On the customer side,
multi-tariff structures and increased cost control are added benefits. It provides both
browser access over the Internet and cellular access over GSM. In addition, fraud
management and complete logging of the customers’ consumption values are
included.
The Ampmeter system provides savings and improvements in the following ways:

38
• No additional cables required, GPRS is a wireless technology and PLC uses
the existing cables
• The utility company benefits short deployment time, fast learning curve and a
low total cost of software ownership and usage.
• Modest annual operating costs. GPRS is one of the most inexpensive wireless
technologies and PLC requires almost no operating cost.
• The human intervention is avoided by abandoning the manual reading. All
the utility meters are read automatically and transferred to the billing system.
• The utility company can keep track of the consumption profiles of the
customers in real time. The Ampmeter application server is connected online
with each individual Ampmeter module to read the meter information and
execute the control commands.
• The utility company can easily monitor the consumption above the prepaid
amount and the unpaid bills. If necessary, the consumer can be removed from
the utility grid remotely. Moreover, additional cost savings can be achieved
by detecting the tampering of meters with methods such as reverse rotation,
meter slowing and bypass. The bidirectional communication of Ampmeter
enables the utility company to check the current meter data against the
historical data in case of any suspicion.
Besides, the functions of the PLC based Ampmeter can be summarized as follows:
• All the utility meters are read automatically and remotely on request via a
browser based interface provided to the utility company. The consumption
values are transmitted to the billing system which reduces the operational
costs and increases accuracy. Similarly, the final reading due to residence
changes is performed very quickly, reducing the operational cost. So as to
say, on-request, scheduled and final readings are performed easily and
accurately
• The proposed solution also enable the sub-metering of building complexes
such as a construction site or a shopping centre, providing the electrical

39
network profiles and energy consumption information of the users,
distributing the internal cost to monitor each individual load.
• The system offers appliance and utility control. In addition the network
demand and supply management reduces the risk of power outages due to
over consumption.
• The remote control enables the utility to cut off the energy to the illicit user or
the customers who exceed the prepaid amount.
• The system offers logs and statistics over a browser based interface to the
user, indicating the historical consumption profiles.
• The system offers interoperability to enterprise resource planning (ERP) and
geographical information systems (GIS).
• Multi tariff structure, e-billing and prepaid cash solutions are available
2.3.11.3 Modeling the Ampmeter Network Structure
It is not always possible to obtain a direct communication between the data
concentrator and a meter communication unit (MCU) because of the some channel
impairments and high signal attenuation. As a result, the MCUs that are not directly
reachable by the data concentrator has to communicate with the concentrator with the
help of communication relays that operate as intermediate devices both to boost the
transmitted signal voltage level and to collect and temporarily store the metering data
from the MCUs that are not directly reachable. According to this approach, the
network topology is divided into a hierarchical structure based on the ability of the
MCUs to receive a direct signal from a source and transmit it to a destination without
the need of using a relay on the way to boost the signal voltage level. So, the MCUs
that can directly communicate with the concentrator are defined as Level 1 meters.
The grouping of these MCUs forms the Level 1 of the hierarchical network. The
MCU to be chosen as a relay should be considerably far away from the concentrator
but still has to have a fairly stable and dependable communication link status. Only
by this way, the relay MCU can boost the received signal and send it far in the rest of
the network. Similarly, the MCUs that cannot communicate with the concentrator
directly but can communicate with the relay in Level 1, are called Level 2 meters.

40
This procedure is broadened until all of the MCUs in the network can communicate
either with the concentrator or with the relays. The figure 2.7 illustrates an AMR
network in hierarchical structure.
Figure 2.7: Implementing the AMR network in a hierarchical structure [45]
Also note that the locations of the MCUs in the above diagram are not done through
logic. As stated before, for the procedure of the hierarchical structure, the MCUs are
labeled systematically according to their distances to the concentrator. The actual
logic is that when the concentrator broadcasts the hello packet during the
41
initialization, the MCUs are registered to the network one after another according to
the order of their reply packets which is called the hello confirm. Logically, the
reply packets of the MCUs that are nearer to the concentrator will reach the
concentrator faster and the closer MCUs will be given earlier network addresses.
However, this first come first serve principle is not always applicable in practice. The
reason is that in spite of the noisy environment and the channel impairments, the
transmitted signals travel very fast in the channel, leading to a very short total
transmission time. Actually this transmission time is much shorter than the time it
takes for the concentrator to process an incoming packet especially from the MCUs
that are nearer to the concentrator. As a result in this processing time, a lot of
incoming packets are processed all together, and concentrator is unable to distinguish
the real arrival order of the packets, causing an unreliable address assignment for the
related MCUs. This phenomenon is called signal jamming [47]. There are various
solutions to this problem but the simplest one for the AMR applications is to
randomly delay the transmission time of the packets from the concentrator.
Principally, the concentrator randomly adds a delay period to the packets that are
sent out to the MCUs. Thereby, the concentrator sends out each packet at a randomly
delayed time interval and records the time difference. By this way, the signal
jamming is prevented to some extent and transmission collisions are decreased.
2.3.11.3.1 Basic Parameters of the Model
The meter ID, the different data packet formats and the database of the model is the
described below. Note that although for the logic design and the microprocessor
controlled algorithms, binary numbers are used to store and manipulate network
address, in this chapter of this thesis work, decimal numbers are used for the
representation of the network address to make them more understandable.
2.3.11.3.1.1 The Meter ID
Basically, the ID or network address of a MCU uniquely identifies the meter and
indicates the meter location in the network. The format of the meter ID is as follows.

42
Note that for the phase bit the phases R, Y and B correspond to the 1, 2 and 3
respectively.
Table 2.3: The Electronic ID [45]
Every meter manufactured has a unique identification number issued by the
manufacturer. This identification number is the electronic ID of the meter. After the
installation of the meter at the customer premise, this identification number is
registered to the customer’s database. This ID is also manually recorded to the
EPROM of the AMR meter in the customer site. As a result, all the information
about the related customer such as the address of the premise, the consumption data
etc. can be reached by searching with this identification number. Moreover, this
meter ID can be added to the data packets sent out from a particular meter,
specifying the location of the meter in the network. The uniqueness of the meter ID
is important to link a particular meter on the AMR network to the meter’s actual
physical address. Moreover, it enables the model to share network topology
information to be employed to construct the overall network structure [47].
2.3.11.3.1.2 Data Packet Design
The typical packet design for the proposed AMR network is illustrated in Table 2.4

43
Table 2.4: The 10 message types designed for the AMR system protocol [45]
For a packet transmission both the Source ID and the Destination ID are needed to
specify where the packet comes from are where it is sent to. Each MCU’s unique
network address that indicates its location in the network can be used as source or
destination ID. Nevertheless, some default value may need to be assigned to the
Source or Destination IDs in predefined cases:
• For packets sent from the concentrator, by default the source ID is 1111111.
• For packets sent to the concentrator, the destination ID is 1111111.
• For broadcast packets sent to all MCUs in the network, the destination ID is
0000000.
• For a hello packet sent from a MCU whose address is not yet assigned, by
default the source ID is 0000000.
The hello packet is used for the initialization of the network for the purpose of
registering the slaves to the network. This process can be resembled to sending a
message saying “hello, can anybody hear me?” Every MCU that can receive the

44
message properly will reply back with a hello confirm packet which includes the
network address of the MCU and the electronic ID. In addition the signal to
interference ratio (SIR), which is used for the determination of the communication
relays, is also sent. Note that, the signal to interference ratio (SIR) in dB is calculated
according to the formula;
SNR(dB)= 20 log10(VR/VT). (2.1)
Similarly, the functionality of a particular MCU can be controlled by making the
MCU send out hello packets periodically. In this way, the communication links of
the MCU to the surrounding MCUs can be checked. The meter status register
indicates whether the MCU is functional or not. The register is set to 1 if the meter is
functional. If the meter is removed from the system or the customer has ended the
contractor with the utility, the register is set to 0. Similarly, if the meter is damaged
and the communication with the meter is lost, the status register is set 0. At this
stage, if the MCU does not respond after a preset number of hello messages, the
customer database is checked at the network operations centre to determine the
location of the damaged meter. Then, a technician is sent to the physical address of
the meter to see if the meter is damaged or removed from the system. The hello and
the hello confirm packet formats are as follows:
Table 2.5: The hello packet format [45]
Table 2.6: The hello confirm packet format [45]
The third packet type, assign address packet, is used by the concentrator to assign
network address (meter ID) to the meters. Obviously, when the meter receives this
packet, it replies back with the assign address confirm packet. Another message type

45
called the relay designation field determines if the related meter is defined as a relay
or not. Apparently, if the meter is assigned as a relay in the hierarchical network, the
register is set to 1, otherwise it is 0. Moreover, the data request packet is sent to
collect the meter readings. The concentrator sends the data request packet to a meter
to receive its meter readings. The meter responds back to this message with the data
send packet containing the required information.
Furthermore, the repeat send data packet is used by a relay or concentrator to confirm
that the receiver has properly decoded the data sent message. When a relay or
concentrator receives a data send packet, it replies back to the sender of the metering
data with the repeat data send packet that includes the same information as the data
send packet. This entire process is employed to check the data integrity.
The eight packet type, the relay report packet, is composed of the routing information
of a particular level in the network. Relay report packet is sent by a particular layer
containing the topological data of the meters that are one level down from this relay
to the concentrator. As expected, the relay confirm packet is sent from the
concentrator to the relay that has sent the relay report packet for the purpose of
informing the sender relay that the relay report packet is received. The last packet
type, the alert packet, is used to send an alarm message to the network operation
center in accordance with the alarm monitoring service of the AMR utility company.
The alert packet, which is an integral part of the AMR’s value added service, has the
highest priority and all the other transmission is stopped to make the alarm signal be
transmitted to the destination. Nevertheless, the alarm signal should be short
compared to other message types for the purpose of minimum transmission time and
immediate respond or reaction.
2.3.11.3.2 Proposed Database Structures
The vital information about the network architecture and functions are stored in the
concentrator database. The information about all meters is accumulated in this
database and has a sample format as in Table 2.7.

46
Table 2.7: Sample concentrator database [45]
On the other hand, the relay database has a similar structure to the concentrator
database except the fact that the relay database does not store the information about
all of the meters in the network but it keeps the information for the meters that use it
as an access point and send data through it. Note that for the sample relay database in
the Table 2.8. The meters listed under the relay database are one level below the
level of the relay.
Table 2.8: Sample relay database [45]
Similarly, the meter database holds the locally stored information about the meter
such as meter ID, electronic no., SIR value and the up-to-date meter data in its

47
storage memory. Furthermore, each meter checks the noise level in its nearby
communication environment at periods of 100 ms.
2.3.11.3.3 Communication Relay Designation
Practically, starting from the outermost meter i.e. the meter with the largest network
address (according to Table 2.9, the meter with the network address 1060), 10
consecutive active (communication status register value equal to 1) meters are
chosen. These meters are signed with a circle in Table 2.9. After that, the Dijkstra
algorithm is applied on these 10 consecutive meters with the metric calculated as the
distance from the meter to the main distribution line. The details and algorithmic
logic of the Dijkstra algorithm can be seen in Appendix A. One of the meters among
these 10 meters is chosen as the communication relay for the meters in this level,
depending on the Dijkstra algorithm.

48
Table 2.9: Selecting 10 consecutive meters with communication status of “1” [45]
As seen in Table 2.9, the meter with the network address 1047 has 1 in the relay
register as it is chosen as the communication relay. In addition to the communication
relay three other relays are chosen as the backup relays because of the noisy channel
conditions of the LV power line. However, in the further trials, it was observed that
the distance metric methodology is not suitable as it is based on the transmission
time of arrival, resulting to signal jamming problems.
A more realistic variable was searched to optimize the relay designation. According
to the signal to noise ratio equation, the received signal strength and also the SIR

49
value is reversely proportional to the distance due to the cable attenuation factor. For
that reason, omitting the other variables, a meter’s SIR value can be expected to
decrease as the meter is further away from the concentrator. As the purpose is t o
select the meter that is considerably distant from the concentrator (to have a broad
range of meters in its vicinity) but still has a sufficient signal strength and a
dependable connection status to the concentrator, it is logical to select the meter with
the smallest SIR value which is still above a specific preset SIR threshold as the
communication relay. However, considering the unfriendly and unpredictable nature
of the power line, it is always possible for a meter with a SIR value slightly above
the threshold to experience communication problems due to rapidly changing
communication channel conditions such as a sudden impulsive noise or multipath
interferences coming out as a result of load changes. For the model described above,
a 6 dB SIR margin is added to the threshold value of 11 dB, yielding a total SIR of
17 dB. The meter with the SIR value closest to 17 dB is to be selected as the
communication relay with the suitable communication range and a reliable
communication status.
As stated before, the primary intention for this model was to select three backup
relays. However as the backup relays chosen will have SIR values very close to the
original communication relay, it is probable that these backup relays might also be at
the edge of failing. Thus, the final decision is not to choose any back up relay. When
a selected communication relay fails to respond to a packet, depending on the
transmission direction of the packet, the relay either one level up or down the
communication relay will be able to detect that this particular relay has stopped
transmitting. Following that, the functioning relay starts to send out hello packets,
collecting the SIR values from the meter that respond with the hello confirm packets.
According to these new SIR data, the functioning relay is to select another relay as
the new communication relay in this particular level.

50
2.3.11.3.4 Network Topology Update
For the proposed AMR model, the topological database of the system is updated
periodically to guarantee that the system regularly adapts its routing topology in
accordance with the network changes.
The process starts with the concentrator broadcasting hello packets throughout the
network in a periodical basis. Naturally; all the meters located in the Level 1 respond
to these packets with the hello confirm packets. Similarly, the currently chosen relays
on all other levels of the network send hello packets to the meters that are located in
the lower level in network hierarchy. As all those meters are assigned their network
IDs, the assignation process is omitted. Only the relay report and the relay report
confirm packets are communicated between the concentrator and the relay of each
corresponding level. In this way, the update of the entire database is completed with
the meters registered with their up to date addresses and information in the
concentrator database.
2.3.11.3.5 Routing Techniques
2.3.11.3.5.1 Adaptive Routing
Obviously, low voltage is an unfriendly communication environment because of
various channel impairments. The noise levels are highly variable and dependent on
the load types connected to the line. Besides, the changing load impedance and high
attenuation develop the need for multiple and alternative paths for signal
transmission. So as to say, no signal transmission path is reliable enough for
continuous and uninterrupted transmission.
Adaptive routing (referred also as dynamic routing) is employed as a routing
technique that can adapt the transmission channel to the changes such as traffic
patterns, equipment failures, channel availability and circuit expansions such as
addition or removal of some nodes or new area development. Adaptive routing

51
protocols are effectively used for network configuration of AMR systems as the LV
network is a dynamically changing network. The main benefits of the adaptive
routing are improving network performance and increasing the fault tolerance by
offering multiple routing paths [48].
The adaptive routing protocols are favorable as the cost for signal processing
decreases and better communication performances are observed. Besides,
considering the rapidly and unexpectedly changing communication environment of
the PLC based AMR networks such as new housing area developments and land
transformations, the adaptive routing protocol’s potential to adapt future changes is
important [45].
Several networking protocols exist in the literature that are applicable for PLC based
AMR networks. The Adaptive Token Passing Protocol and the Open Shortest Path
First (OSPF) Routing Protocol are the two most widespread protocols.
Adaptive Token Passing Protocol and Open Shortest Path First (OSPF) Routing
Protocol
Token passing protocol is an algorithm that is based on passing a token around a ring
or nodes according to a logarithmic, binary search methodology [49]. Fundamentally,
the token represents the access right to the communication medium, which means
that the node that possesses the token has the momentary allocation and the control
over the channel. The token is circulated among the participating nodes and the by
the use of this token, a logical ring is established.

52
Figure 2.8: Logical ring formed on the physical bus [49]
The steady state operation of the protocol consists of two stages; token transfer phase
and the data transfer phase. The other operations involved are ring initialization,
addition or removal of a station, lost token recovery etc.
The adaptive token passing method can be employed for AMR network initialization
such that each logical ring established during one complete process of token passing
algorithm is to be defined as a hierarchical level of the AMR network. However, in
practice this method has some disadvantages. As stated before, there are two stages,
token transfer and data transfer, which lead to too much overhead resulting from
passing the token around the tree structured network. Moreover, the constant
maintenance of the network (addition and removal of nodes, new token generation
etc) may incur additional overheads [50].
Considering the limited transmission rate and channel capacity of the narrowband
AMR system described, algorithm that can occupy the channel less are more
favorable. That is why, some network designers prefer to use the Open Shortest Path
First (OSPF) Routing Algorithm that broadcast routing information only when
changes occur in the network architecture such as a failed communication link or an
additional meter being installed to the AMR system. Furthermore, OSPF has no
limitations on the number of nodes (or meters for AMR), OSPF supports hierarchical
network structures. Besides OSPF employs IP multicast routing which means less

53
processing on router units for the units that are not listening to the network. Finally,
the updates are sent only in case of routing changes and not periodically. This leads
to an effective usage of bandwidth [51].
2.3.12 DLMS: The application protocol for communicating meters
DLMS, which aims for the standardization of the messaging system, represents the
Distribution Line Message Specification. In some literature it is also referred as
Device Language Message Specification. This standard ensures the non-proprietary,
internationally standardized communications protocol for PLC. The initialization and
the evolution of this standard resemble the standardization studies for the Telecom
Industry when new applications and devices were coming forward but were isolated
from each other without interoperability. The telecommunication companies quickly
realized that this lack of interoperability stands in their way to expand the
telecommunications market. So as to say, the companies were settling for a share of a
small market rather than developing together a bigger market. This ambition leaded
to an international effort to develop the Open System Architecture (OSI) Model
which was published by ISO in 1984. Most of the communication standards
including the Internet Protocol Suite depend on the layered model of OSI. Eventually
today, telecommunications market is considerably big and the telecom service
providers, manufacturers and the end users are getting their shares from this big
market [52].
The communication systems are commonly used by utility companies for
management of energy production and supply under the name of Distribution
Automation applications. Moreover, Customer Automation applications such as
remote meter reading and tariff control also make use of communication systems.
However most of the emerging technologies in this field are also use proprietary
protocols and stand as isolated, non-interoperable applications. On this account,
International Electrotechnical Commission (IEC) is working on standardizing DLMS
to introduce a common language for all kinds of communication systems employed
in energy industry. The target of DLMS studies is to guarantee the interoperability of

54
the all the metering communication equipment (meters, data concentrator etc.) The
proposed solutions are aimed to be simple enough and independent on metering
application or the communication medium.
2.3.12.1 The DLMS Object Model
DLMS, which is an object oriented application model, employs object oriented
modeling to describe the DLMS device model and service procedures. In the scope
of DLMS, the operations and characteristics of the abstract object types are
described.
The DLMS model is represented by five object types. The outmost object type is the
Virtual Distribution Equipment (VDE) which models a real application. The other
four objects are located in the VDE. The four objects are classified under two
categories:
• The resources of a real device are represented by the virtual objects including
data set, task invocation and variables.
• The Virtual Application Association Object specifies the communication
aspects.

55
Figure 2.9: The virtual distribution equipment [53]
All the objects above are interface objects that model the real device in an external
point of view. To ensure independence from the real application, the DLMS objects
do not interfere with the modeling of the real objects. All the real appliances such as
meters, concentrators etc. are indicated as virtual distribution equipments to which
external observes have no direct access.
2.3.12.2 DLMS as an Application Protocol
In scope of the DLMS model, different object instances are defined and the
operations of these object instances are cited remotely. In the context of the OSI
reference model, this type of remote citation stands for the application protocol. Note
that, the DLMS model is not a communication protocol but is used as a basis for
communication protocol because it represents an abstract structure for all
communication related functions. The main benefit of OSI reference model is the
decreasing the complexity by logically fragmenting the entire communication system
into smaller functional models, referred as layers [53].
Figure 2.10: Communications within the OSI reference model [53]

56
The layers of the OSI protocol are divided into two groups. From bottom the top, the
lower layers are:
1) Physical
2) Data link
3) Network
4) Transport
And the higher layers are:
5) Session
6) Presentation
7) Application
According to OSI protocol communication illustrated Figure 2.10, the consequent
application processes that are outside the layer protocol transmit their messages via
the communications functions distributed in the layers. Obviously, application
processes can only be in contact with the closest layer which is the application layer.
Similarly, the application layer contact with the next layer and this process goes
down to the physical layer which has no other layers but the real physical
communication medium with the real world signals.
Note that each layer isolates its communication aspects from the layer below. In this
particular approach, the application layer provides the system with a communication
channel independent specification for the message exchange in the application
process and an interface to the communications support supplied by the other layers.
In order to activate the operations of the DLMS objects, a message is transmitted
from a client that uses the application process of the DLMS model to another client
that employs the same application process which contains DLMS objects. The
DLMS application protocol is used to specify these messages and to execute these
messages in the Application Layer. Following the OSI Application Layer

57
conventions, the supported message formats referred as service syntax and the
dynamic behavior which consists of the regulation for the way the services are
executed. The service syntax for DLMS services is determined according to the ISO
standard Abstract Syntax Notation No.1. On the other hand the dynamic behavior is
described by the help of state transition diagrams and time sequence diagrams [54].
2.3.12.3 The Current Status of DLMS and the Upgrade Path
DLMS protocol was developed primarily by Electricity de France in cooperation
with Landis&Gyr. DLMS was intended as a simpler messaging system alternative
for the already standardized Manufacturing Message Specification referred as ISO
9506-1 and 9506-2. Moreover, the protocol is named as DLMS as the first complete
communications protocol that makes use of DLMS was an application of power line
carrier technology called Power Line Automation Network (PLAN). Accordingly,
the Working Group 9 of the IEC TC57 completed the standardization of the DLMS
and named it as IEC 1334-4-41. This international standard defines the DLMS
Object Model and defines DLMS as an application protocol in terms of protocol and
services. Again, the same working group had some studies on DLMS based
communications in the scope of PLC communications and other elements of the OSI
protocol’s higher layer application such as transfer syntax, association control service
element, etc. The group also came up with three PLC communication profiles and
proposed them to be standardized [54].
The DLMS is also attractive for different types of utilities and other standardization
bodies of the meter communications domain as it can be used as the basis of all
Application Protocol for all meter types. Furthermore, another working group, IEC
TC13/WG14 has some studies on DLMS communications profiles for other
communications media such as twisted pair, PSTN, etc. Similarly, CEN TC294 has
some studies on DLMS based communication protocol for other utility meters such
as water, gas, heat etc.

58
On the other hand, the user of the DLMS model should be able to identify the
relation between the DLMS model which is the solely identified visualization of the
model by the client and the real objects defined by the DLMS model. The logarithm
and the real life counterpart of the objects defined should be clear to the client. For
example an integer value returned by the protocol’s logarithm can represent the
power fails since the last reading, the current tariff rate or any other parameter
defined in the model concept. The link between the objects created and their real life
equivalents should be perspicuous. It is the companion standards that define this
relationship between the DLMS attributes of the objects created within DLMS model
and the real objects. Thus, interoperability can be attained by clearly defining both
the DLMS protocol and the related companion standard.
In conclusion, DLMS is at the development stage of its life cycle compared to some
other multimedia metering systems that is composed of meters that can serve several
types of utilities (electricity-gas or electricity-water) by working over several
communication media at the same time. Besides, these multimedia meter systems
including the multivendor meters are more favorable in means of interoperability. To
close the gap, there are several developments that DLMS should focus on:
• The open technical issues should be resolved.
• Complete metering systems such as industrial DLMS client systems should
be developed
• Standard communication profiles should developed for communication media
such as PSTN, twisted pair etc.
• Similar standards for other energy distribution equipments other than the
meters only, should be generated
Only after these steps, the DLMS protocol can be the common language for metering
communication systems providing the simplicity, flexibility and ubiquity.

59
2.3.13 ATICON’S Low Cost Power Line Modem for Domestic Applications
Obviously, the installation costs of the PLC technology are relatively low compared
to its rivals, as there is no need of any additional wiring. This low cost aspect is
important for the consumer market. The system is composed of the power line
modem, power supply, line interface, application protocol and an opto-galvanically
separated I/O interface [55].
Besides, the utility applications such as AMR, PLC can also be employed for home
automation systems, enabling the individual stations to communicate and exchange
information with each other as a way of linking the domestic appliances to the global
world. Some example application fields are energy management and reduction of
peak power consumption of white goods. As the household devices do not need
power continuously but only for a certain period of time, the peak power
consumption can be reduced and the energy price can be lowered if these
consumption periods can be interlaced. Some other potential application areas of
PLC for home automation are remote control, entertainment (audio, video), security
(burglar alarms), safety (water leak detection) and HVAC [56].
The PLC based home automation systems are also compatible with CENELEC
EN50065-1 standards defined for the transmission on low voltage installations. As
stated before for the definition of CENELEC standards, the frequency band
allocations are as follows:
• A band: 3 – 95 kHz is allocated to energy suppliers.
• B band: 95 – 125 kHz can be used by any application without the need of an
access protocol
• C band: 125 – 140 kHz is reserved for home automation products. CSMA
(Carrier Sense Multiple Access) algorithm is required to be employed to
provide the co-existence of different systems in this frequency band.
• D band: 140 – 148,5 kHz is reserved for alarm and security systems without
the necessity of using an access protocol [57].

60
2.3.13.1 EHS – a Common European Standard
As stated before to increase the penetration rate, adding value to the acceptance of
home automation technology and the interoperability and the compatibility are
targeted by several projects such as EUREKA and ESPRIT. [58] Some major
European companies such as ABB, AEG, British Telecom, Electricité de France
(EdF), Electrolux, GEC, Philips and Siemens are involved in the development of
these projects resulting in European Home System Network (EHS). The EHS is
applicable over six different physical medium for the information transfer to and
from the domestic appliances. These are: twisted pair (9.6 kBaud), twisted pair 2 (64
kBaud, ISDN), coaxial, infrared and radio frequency.
EHS also enables the plug&play installation mechanism for the power line. The
network addresses of the nodes are automatically assigned (registration) and the
application links are established (enrolment). Thus, there is no need for a technician
for the installment process. Last but not the least, the standardized command
language of EHS provides the flexibility for the applications from various
manufacturers.
2.3.13.2 EHS Power Line Medium
Power line channel is a standardized medium of the EHS specification. The
communication is established via a 2400 half duplex protocol with FSK (Frequency
Shift Keying) modulation in accordance with the CENELEC EN 50065-1 standard
over the C band using CSMA (Carrier Sense Multiple Access) collision avoidance.
The centre frequency is 132,5 kHz and the frequency deviation for data transmission
is ± 0,6 kHz. Thus, the logical “1” is represented by the lower frequency (131,9
kHz) and obviously the logical “0” is represented by the upper frequency (133,1
kHz) Finally, in accordance with the CENELEC C band limitations the output level
of the power line transmitter can not exceed 116 dB(µV). The figure 2.20 below is
the schematic of the EHS Power Line Diagram.

61
Figure 2.11: EHS Power-Line Datagram
For EHS, differently from the conventional common serial data protocols, there is no
start or stop bits for every data byte. A 16-bit preamble consisted of 8 falling and 8
rising edges are employed for the synchronization of the receiver and the transmitter.
The following 16 bit header code is used for the recognization of the EHS datagrams
or EHS acknowledges in case of loss or destruction of bits due to a noise in the
network. For the purpose of 6 bit Forward Error Correction (FEC), each byte of the
following sequence (every 8 bits) is extended to 14 bits. The generator polynomial
for the FEC is x6+x5+x4+x3+1 and at maximum three succeeding bit errors can be
corrected within 14 bits. This error correction algorithm is suitable to avoid the
disturbing effects by the switch mode power supplies or light dimmers in the form of
impulse noises that can last approximately 1 ms, mostly repeated every same phase
angle. As mentioned before, the EHS power line packet can be a datagram or an
acknowledge packet. The datagrams are used for the transmission of control
information while the acknowledge packets s are for the confirmation of the
reception of a diagrams by the receiving node.

62
2.3.13.3 The components of Aticon’s Low Cost Power Line Modem
2.3.13.3.1 Power Line Modem
In brief, power line modem generates the FSK-modulated signals, supervises the
CSMA collision avoidance protocol and provides the clock, reset and watchdog to
the system [59].
2.3.13.3.2 Power Line Interface
The power line interface acts as the coupling circuit between the power line modem
and the mains line. The power line modem modulates the signal at the sender side
and the sender power line interface feeds the modulated signal to the line. At the
receiver side, power line interface receives the signal and passes to the power line
modem for demodulation. For the cost concerns, no inductive signal transformers are
used for galvanic isolation. Thus, the system is not galvanically isolated from the
mains. The primary component of the power line interface is the high voltage
coupling capacitor that has a low impedance at the centre frequency of 132.5 kHz.
Furthermore some analog filters are also employed in addition to the coupling
capacitors to improve the quality of the receiving signal. Additionally, a varistor is
also used to protect the line interface against potential damages of the transients in
mains line [59].
2.3.13.3.3 Power Supply
A switch mode power supply is employed for voltage conversion. The power supply
firstly divides the mains voltages up to 250 V into short sections and then smoothes
these divided portions to DC voltage. The switch mode power supply provides two
different voltage outputs: 10V for the power line modem with a current rating up to
200 mA and 5V for the microcontroller with a current rating up to 100 mA [59].

63
2.3.13.3.4 Application Processor
The application processor used is a cost efficient Intel-8052 compliant
microcontroller with 256 bytes of internal RAM. In addition to that, a serial
EEPROM of 256 bytes memory can be added to the system. Finally, the serial
interface of the microcontroller is connected to the opto-galvanically separated I/O
interface with a connection speed of up to 19200 bauds over full duplex
asynchronous data transmission [59].
2.3.13.3.5 I/O Interface
The power line node is connected to the outer world over the I/O interface. Two
inputs and the two outputs are supplied with an isolation voltage of up to 5300 V AC
and the maximum switching frequency of the optocouplers is 20 kHz [59].
2.3.13.3.6 Software
The triple bit scanning algorithm with majority decision yields a high noise rejection
capacity. The carrier detection provided by the software enables the reception of
signal below 5mV. The EHS protocol, which defines the commands for various
applications such as heating, air conditioning, security, safety etc, increases the
system flexibility. As stated before, the structure of the EHS protocol stack
implementation complies with the OSI model, omitting the layers 4, 5, and 6.
According to the regular protocol algorithm, a unique network address is assigned to
each device (registration), and then each device begins to search for the
communication partners in its surrounding network (enrollment). Finally, the
network addresses and the defining properties of the nodes are stored in the
Application Title Directory [59].

64
2.3.13.4 Conclusion
After the rapid development of signal processing and semiconductor technologies,
the transfer rates for the PLC devices described are able to reach to speeds above 100
kbps. Comparing all the PLC alternatives described in this thesis work, no single
solution is a clear winner above another one. But the coexistence of each of them in
this unfriendly communication environment is a more realistic conception.
2.3.14 An AMR Application Example: Automatic Remote Meter Reading Using
Power Line Carrier Systems in UK
The low voltage distribution network that is also functioning as a communications
medium has the delivery of electricity functionality at 230 V and 50 Hz. An
integrated remote metering communication and information system infrastructure is
needed not only for the cost effective tariffing structures but also for the fact that the
communication path from the supplier to the end user can involve multi parties and
can have a complex structure.
Depending on the previous experiences in meter reading business, the utility
companies realized that to satisfy the potential customers of a fully automatic remote
meter reading system, the implementation of an accurate system that has less faults
and faster repair times is crucial. Moreover the system should be resilient and should
be able to interface with the various communication technologies available. Needless
to say, the various customer infrastructures that can be interfaced with the AMR
network should be further investigated as the type and size of customer infrastructure
affects the amount and type of data that can be transmitted over the system [60], [61],
[62].
After the deregulation of the UK Electricity Supply Industry a three tier model was
developed. Tier 1 is for the customers with requirements of 1 MW and above, tier 2
is for the customers with requirements of less than 1 MW but greater than 100 KW
and tier 3 is for the customers with less than 100 KW.

65
Another aspect worth noting for the load requirements of the customer systems and
the related customer infrastructures is the time periods that the peak consumption of
loads occurs. Within the day time, the load variations occur between the hours 06.00
- 09.00, 12.00 - 14.00 and 16.00 - 21.00. For example, for industrial premises, the
utility load requirements are expected to decrease at 18.00. Besides, some
fluctuations also occur in weekends and holidays. The seasonal variations should be
also taken into account. Therefore, the best time for the PLC based meter reading to
read the domestic and residential consumption can be between the midnight and
07.00 in the morning when the human activity is limited. For the residential reading
the readings can be also switched to the hours between 10.00 and 15.00 when the
people are at work. Hence, the human interference to the PLC systems as noise
sources is minimized. Similarly, for factories an appropriate time of the day for
readings is the evening hours when the production is stopped. For all these
applications, the physical interface needed to execute the transmission, the volume of
the data sent, the complexity of addressing, protocols and control mechanisms are
core elements to be decided [63].
2.3.14.1 The Proposed Remote Meter Reading Protocol Architecture
For AMR purposes, CENELEC defines a protocol stack of Low Voltage Distribution
Networks that is composed of 3 layer DLMS model, derived from a the well known
OSI 7 layer model. See Figure 2.12 for the 3 layer DLMS model.
Figure 2.12: Layer DLMS model [63]

66
The top level which is the application layer is independent of any communication
media to have a clear and unique view of all meter configurations. Oppositely, the
layer 1 and 2 depend on the communications media employed. The related
configuration is shown in Figure 2.13. The application layer is divided into two parts:
the distribution line message specifications (DLMS) and the logical link access
control (LLAC). DLMS was initially developed by Electricity de France (EDF) for
PLC applications by modifying the Manufacturer Messaging System (MMS) which
was defined as an International Standard by IEC TC 57.
Figure 2.13: IEC protocol architecture. [63]
In addition to the DLMS standards and for the purpose of adapting the DLMS
metering applications, a common Companion Standard (CS) that is composed of
additional rules to ensure the interoperability and compatibility with the semantics
and the syntax of the DLMS kernel is defined. CS can be specific for the individual
meters manufactured by various companies and reflects the capabilities of those
meters. The CS can not be represented as a independent and transparent presentation
of a meter rather than an Application Layer Companion Specification. The related
development scheme of a Companion Specification is illustrated in Figure 2.14.

67
Figure 2.14: A companion specification [63]
DLMS has common elements for all meters such as ID, encryption key, address of
the node, and billing. Still, every manufacturer can differentiate its metering
capabilities within the terms of the standards. Apparently, definition of the objects is
an integral part of the Companion Specification of a meter since these objects
determine the meter’s aspects and behaviors in the communication link’s perspective.
Companion Specification indicates the physical devices such as meters and meter
interface units as individual or multiple Virtual Distribution Equipments (VDEs).
Each VDE defines another function of the device. For example, a single VDE, which
is called Management VDE, can be attributed the task of representing the
information of the physical device itself. Thus, even the simplest MCU in the remote
meter reading configuration will include the Management VDE, while on the other
hand a metering node includes both the Management VDE and the Metering VDE.
Similarly, for a more complex remote meter reading architecture specific nodes can
include not only Management and Metering VDEs but also Supervision and special
application VDEs [64].
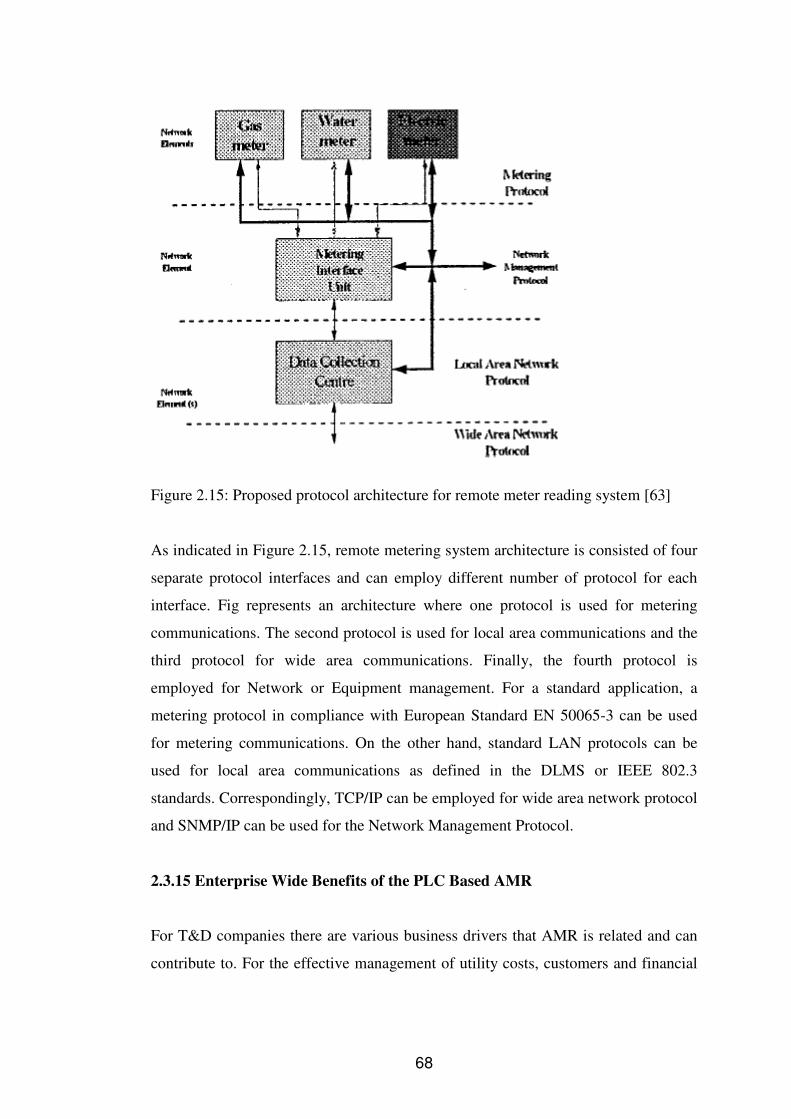
68
Figure 2.15: Proposed protocol architecture for remote meter reading system [63]
As indicated in Figure 2.15, remote metering system architecture is consisted of four
separate protocol interfaces and can employ different number of protocol for each
interface. Fig represents an architecture where one protocol is used for metering
communications. The second protocol is used for local area communications and the
third protocol for wide area communications. Finally, the fourth protocol is
employed for Network or Equipment management. For a standard application, a
metering protocol in compliance with European Standard EN 50065-3 can be used
for metering communications. On the other hand, standard LAN protocols can be
used for local area communications as defined in the DLMS or IEEE 802.3
standards. Correspondingly, TCP/IP can be employed for wide area network protocol
and SNMP/IP can be used for the Network Management Protocol.
2.3.15 Enterprise Wide Benefits of the PLC Based AMR
For T&D companies there are various business drivers that AMR is related and can
contribute to. For the effective management of utility costs, customers and financial

69
returns, the key elements are T&D operations, asset management, customer service
and energy efficiency. The definitions and the primary objectives of these business
drivers are as follows:
T&D Operations: AMR contributes to the effective planning, design and execution
of T&D infrastructure. The timing and the cost efficiency of the T&D infrastructure
construction, facility maintenance and inspection, customer field service, outage
management, metering operations and supply chain are the main areas of
contribution.
• Asset Management: Asset management aims to meet the target levels of
reliability and safety at acceptable levels of cost and risk by means of
balancing the financial and operational performance.
• Customer Service: Customer service includes all the work to provide the
utility customers with faster and diversified service and more accurate
information through customer communications, account management, service
request, trouble response, metering, billing and collection.
• Energy Efficiency: Energy efficiency covers all the tasks related with
minimizing the overall cost of energy, diminishing price risks and attaining a
suitable level of energy supply reliability by controlling alternative resources
such as distributed generation, load management and demand response [65].
2.3.15.1 Enterprise AMR Applications
The meter reading techniques can be mainly divided into two categories: in-field and
centralized meter reading. Briefly, for the in-field reading, the technical personnel go
to the actual site to obtain the metering data while for centralized meter reading no
personnel is dispatched to collect the data, the data is transmitted to control center.
Enterprise AMR applications can be grouped into three broad categories:

70
• Billing and customer service: The simple and complex billing applications
include demand response, dynamic pricing, change of party (move in or move
out of the customer), bill inquiry, outage complaints, virtual and/or physical
service connect and disconnect.
• Revenue Protection: Revenue protection includes the load, site and meter
integrity monitoring, energy diversion, illicit energy utilization detection and
rate validation.
• T&D Operations: T&D operations are composed of the tasks such as outage
and restoration notification, system planning, leak detection, rate design,
maintenance and operations.
2.3.15.2 The Practical Enterprise Benefits of AMR
The enterprise benefits of AMR are crucial in the basis of the core business drivers of
the T&D business that AMR can contribute to. As stated before these are T&D
Operations, Asset Management, Customer Service and Energy Efficiency. Smart
Grids and AMI: Understanding the big pictures Areva T&D official website intranet
documents [66].
In the context of T&D Operations, AMR adds value to the meter reading operations
by increasing the accuracy and the frequency of meter readings. AMR increases the
number of physical meter reading per billing cycle while decreasing the total cost of
reading a meter and the probability of field personnel injuries. Complex billing data
that provides detailed information on the real load patterns contributes to the
distribution system planning and design, transformer load management and load
forecasting. The effective and comprehensive use of this information can reduce the
asset intensity and capacity requirements of T&D companies. Besides, the
distribution losses are reduced and the network reliability is improved. The
continuous monitoring of site, meter and load contributes to the equipment
protection. Furthermore, the energy diversion is more rapidly detected and avoided.
In case of outage or restoration, the on-demand data in association with the outage
and restoration notification data, enables the fast and accurate outage localization and

71
restoration activities and eases the crew utilization and mobilization. All of the
mentioned improvements add value to the service reliability and efficiency.

72
CHAPTER 3
PLC IN EUROPE AND TURKEY
3.1 CURRENT STATUS IN EUROPEAN METERING MARKET
Electricity is supplied almost all the households and businesses in the Europe. Thus,
metering is a primary business aspect for the utility companies. As of beginning of
2006, there were approximately 244 million electricity meters in the EU region plus
Norway and Switzerland (EU23+2). With the liberalization of the European
electricity distribution market, the metering applications are experiencing substantial
changes and the utility meters are required to be connected to the data
communication networks [15]. The basic structure of Automatic Meter Reading was
explained in the previous chapters. Automatic meter reading can be referred as the
collection of intelligent metering services depending on bidirectional data
communication.
Manually read electricity meters are in use since the beginning of utility industry in
the late 19th century. Since the 1980s the automatic meter reading has went into the
melting pot especially in the US where radio based AMR applications are in high
demand. The simple reading benefits of the metering technology are expanded with
added value services enabled by two way real-time data communication.
The fluctuating energy prices promoted the energy markets reforms and supported
the public interest in energy conservation As a result, the AMR solutions are in great
request especially in Western Europe. Based on the previous calculations of the
utility companies, upgrading all the energy meters in Europe would cost € 40 billion.

73
Among all the EU 23 countries, Italy is the leading country in means of the number
of customers equipped with advance metering systems. Sweden will make all the
infrastructure compatible to AMR after the new national metering regulation comes
into effect at the end of 2009. Moreover, the expansion in Sweden is expected to
trigger the AMR coverage in Denmark, Norway and Finland. The Dutch authorities
are planning to promote AMR by the aid of legal legislations. [15]
Specifically, at the beginning of 1999, Enel S.P.A of Italy, the largest publicly traded
utility corporation in the world, initiated the adaptation of Echelon’s AMR network
infrastructure to convert the Italian national power grid to an intelligent services
delivery network. The bidirectional communication and data transmission system is
called SITRED. The distribution network is designed to provide a data transmission
line in each distribution installation (power substation or distribution transformer)
and at each customer or industrial premise, making use of only the existing
distribution infrastructure. The applications specific to ENEL infrastructure was
included in SITRED, such as remote control of power distribution network, remote
reading of consumption data, MV and LV customer service automation. This project
costs around € 2.2 billion with a five-year payback period for the ten million meters
installed. The average cost per connected meter was around $85. The Enel project
was perpetuated by regional utilities such as ACEA of Rome [45], [67].
After the introduction of Enel’s project, similar applications were initiated by other
European utility companies. For example, in 2002 Vattenfall started to employ
remote meter reading applications in Sweden and Finland. In 2003 the first round of
AMR was installed in Sweden by E.ON. The other companies such as the Nordic
energy groups Fortum, Skagerak Energi and the companies taking part in the
Swedish SAMS buying consortium followed by introducing AMR applications. The
Dutch company, Nuon introduced AMR deployments according to future regulation
expectations in Netherlands.
Approximately 3.5 billion euros are expected to be invested to the intelligent
metering solutions by the year 2010. As seen in Figure 3.1, the penetration rate for

74
remote meter reading is estimated to rise from 16 to 19.7 percent by the end of 2010.
Moreover, the annual shipments of smart meters will be around 3.7 million units.
According to the calculations of the national utility companies, a capital investment
of € 40 billion is involved to upgrade all electricity meters in the EU to remote meter
reading systems.
Figure 3.1: Penetration rate for remote electricity meter reading in EU23+2 [45]
Macroeconomic parameters such as energy consumption patterns, tax policies and
the competitive and regulatory structures of different countries, affect the expansion
of AMR in the European domestic markets. Technological developments, rising
electricity consumption and electricity prices are the additional driving factors for
AMR deployment. The European countries with the highest deployment of the AMR
are the ones with the highest electricity consumption per capita (such as Sweden,
Finland and Norway) and the ones with the highest electricity prices (Italy, Denmark
and the Netherlands). Following those countries, the AMR solutions are growing
rapidly in Western Europe as a result of the energy market reforms and increasing
public interest in energy consumption because of the rising electricity prices.

75
3.2 PLC APPLICATIONS IN EUROPE
The European market became a convenient environment for true competition after
the considerable completion of the telecommunication and energy market
deregulations. The electric power wiring that already exist in the form of distribution
infrastructure can cover the need of alternative cable links to customer premises in
order to activate the competitive market [68].
According to the current R&D studies, the data transmission rates up to several
megabits per second and transmission frequencies around 20 MHZ are attainable for
European power distribution infrastructure. Nonetheless, the power distribution grid
characteristics are considerably different from the other communication channels
such as telephone cable or radio links. Figure 3.2 designates typical topology of
European power distribution grids. The typical European distribution gird topology is
star shaped. In general up to ten cables are fed by a single transformer and each
transformer supplies between 30 to 40 households. Thus approximately 300 to 400
customers are connected to a transformer station [15].

76
Figure 3.2: Typical topology of a residential distribution grid in central Europe [68]
The development and standardization in bidirectional signaling is expected to
introduce enhanced value services (EVS). For the moment, EVS includes some
functions such as load management, tariff switching, control and supervision of the
customer’s premises and remote metering [69], [70]. Considering the European
standards and norms such as CENELEC EN 50065 which described was in detail
previously, bidirectional signaling at data rates up to several thousand bits per
seconds is applicable. The maximum transmission limits and user dedication was
also indicated in CENELEC EN 50065 which differs considerably from American
and Japanese norms for which the frequency range is extended up to 450 kHz and
transmission over the protection earth line is allowed where interference levels are
much lower [15], [68].

77
3.2.1 Automatic Meter Reading and Energy Management
The leading example of PLC applications is the AMR system installed by Iberdola in
the entire village of Zarauz in Basque region of northern Spain. The project was a
consortium between Ikusi, a Spanish systems integrator, and Iberdola, the largest
utility company of Spain.
The system, which is composed of in-home customer display units, metering devices,
and the power distribution medium, monitors real-time consumption, time of day
energy rates, overall system demand, peak consumption times and performs invoice
period comparisons. In the scope of the project, almost 10 km of power line was
retrofitted for automatic meter reading. The products of Adaptive Networks which is
a Brighton, US based company, were employed. 50 concentrator units were installed
at transformer stations and approximately 1500 customer display units were installed
in customer residences. The throughput of the power line system established was
measured as 19.2 kbps. The data rates on the order of a few hundred bits per second
were obtained in the secondary parts of the distribution transformers. In accordance
with a usual AMR design, the meters and the customer displays were networked to
the concentrators (MIUs) and the concentrators were connected to the central control
(DCUs) and monitoring centers via telephone lines, radio or fiber links due to the
geographical limitations. The customer display units yield the information on elapsed
consumption and cost, sales rate at current time of the day, alarms and messages
form the utility and allow load control for energy management, making it possible
for the customer to take conscious decisions.
3.2.2 Indoor Applications for Building Automation
Fundamentally, CENELEC B or C bands can be used for “smart home” applications
by using the existing power wirings. Smart home application examples are sensors
and actuators for air-conditioning, heating and illumination systems that are remotely
controlled and security systems such as fire or burglar alarms. However in the recent

78
year there have been inadequate improvements in this field mainly due to lack of
understanding of the power line characteristics and models.
One of the remarkable research and development works in this field was conducted
at the University of Karlsruhe in order to model the power supply networks as a
communication medium. The prototypes that were designed as a result of these
studies were later proceeded into series production in industry and these systems
have reached maturity in the market. In year 1996 a building automation system
called Powernet-EIB, which was able to establish a network with intelligent
appliances and electrically powered building equipment such as air-conditioning and
illumination was introduced. The critical disadvantage of the EIB system is the
necessity for using a separate two-wire bus. Nonetheless, Powernet-EIB benefits the
advantage of using the existing supply wiring and is a good candidate to expedite the
competition in the market.
3.2.3 Outdoor Applications, Enhanced Value Services (EVS)
Needless to say, the power line communication applications are not confined to
indoors. Every indoor power network is in connection with the neighboring indoor
network and at least one distribution transformer. The properties of power wiring are
subject to big changes in frequencies other than the mains frequency. The more the
frequency is, the more electrical and magnetic losses are. In addition the
electromagnetic field propagation should be taken into account as the transmission
distance can exceed 1 km. Looking on the bright side, the know-how collected
through indoor PLC applications can be transferred to outdoor applications and the
system designs that proved to be successful for indoor channels can be modified for
their outdoor counterparts. For instance, there have been some ongoing studies to
modify the Powernet-EIB technology to utility distribution networks.

79
3.3 ADDED VALUE INTRODUCED BY THE PLC APPLICATIONS TO THE
TURKISH MARKET
To begin with, despite some technical deficiencies, the entire PLC infrastructure of
Turkish interconnected network is already present; connections to all the consumer
premises exist and are active. Thus starting costs are considerably low and consists
of mainly the transmitter and receiver units. The low voltage network in our country
can generally be classified as a meshed network. In case of any failure or fault, a
consumer can be reached from several medium to low voltage distribution
transformers. With the introduction of transmission and distribution market
deregulation, PLC is expected to initiate a new power market model.
3.3.1 The reregulation of the power industry and PLC applications
The process of opening the power markets for competition is usually referred as
deregulation in most literature. However considering the necessity for careful
monitoring of network costs, the evolving power markets should be even more
regulated than the traditional power markets. Thus, in this chapter the term
“reregulation” will be used in place of “deregulation” to describe the free
competition power markets [71].
The reregulated market structures for different domestic markets differ slightly.
However, Figure 3.3 is a quite generic and explanatory representation of a
reregulated power market. In a monopolistic market, a single authority or company is
responsible for the generation, transmission and distribution of electricity. As the
power is purchased from a power utility, there is no need to separate generation from
transmission and distribution either at the supplier side or customer side. As a result,
in the traditional monopolistic power market model, the customer has no choice of
power supplier.

80
Figure 3.3: The reregulation of the power industry [71]
On the other side, in a reregulated market, the power is sold through a power pool in
means of bilateral contracts. Alternatively, some countries enact the power
production to be sold to a power pool. In either case, the buyers of the power pool are
power resellers or high demand, large customers. Transportation is separated from
the generation both at the production and consumption side. The non-competitive
transportation costs are paid to the transmission and distribution company by the
reseller and the reseller charges the consumer for the transportation when the
electricity is actually sold.
The efficiency of power market reregulation can be further increased if the customers
can buy the power directly form the power pool or even directly form the producers.
As a result, the resellers can be bypasses from the process in a way similar to how
resellers are bypassed in music or travel industries. Instead of directly bypassing the
resellers, one can think of adopting slimmed energy resellers, operating by the IT
substantially for functions such as electronic billing and consumption forecast.
Alternatively, there might be some companies whose core business is in another area
but they might also sell cheap electricity as bi-product or extra service. However, the

81
aimed application is for small and medium to trade electricity directly from a power
pool without reseller interference. Although this chapter concentrates mainly on trade
between small customers and the power pool the concepts described can substantially
be applied to the bilateral trading with producers.
3.3.2 The Open Electric Power Pool
3.3.2.1 Local computations and communication
Considering the trade in power pools, it is not possible to predict the exact future
consumption and as a result the long term selling is not logical. The future
predictions about the energy consumption should be made in shorter time intervals.
Also the added value of purchasing from a power pool rather than a reseller is not big
enough for making a daily purchase profitable. So as to say, the purchase process
should be handled by software, acting as a representative of the customer. The so
called “software agent” will continuously check the demand vs. supply and make
purchasing decisions according to immediate calculations. This software agent used
for electricity trading, called HOMEBOTS, will not be described in detail [72]. Only
the related benefits and intended uses of the software will be described
In order to implement the data flow that this software needs to process PLC is a good
candidate because of its wide coverage. Also considering that, for electronic power
line markets the bandwidth is not an important criteria, PLC is a powerful alternative
to fast telephone lines and fast Internet. The wide availability and coverage
overcomes the speed requirements.
3.3.2.2 Contract responsibility
For the case of reregulated power markets, the time elapsed between two consequent
data communications is in the order of an hour or 30 minutes. The energy trade takes
place in advance of the related period and when the trade is set to a deal, the
customer and the producer are committed to the purchased amount, called contracted
82
amount. Variations from the contracted amount induce considerable fees or penalties.
For the conventional and large scale reregulated power markets, estimating the
consumption values are more straightforward due to the statistical equalizing
techniques and other resources and methods for estimation. Moreover, in most of the
time, there is a possibility to match the demand and supply in a way to meet the
mutual responsibilities.
On the other hand, for a small customer i.e. an individual household, the software
agent can not control the demand or supply. Thus, even a small deviation or
unplanned activity might destroy the estimations. This problem can be solved by
decreasing the estimation time intervals. Hourly measurements might be
considerable for manual power trade applications. However for automated electronic
trade, the resolution of minutes is perfectly achievable. Note that, this does not bring
on a necessity to increase the metering resolution as limited bandwidth is a major
problem. Instead an improvement is software make up for this deficiency.
Note that, the binding force of the contracted amounts will be void of interest, if the
time between consecutive measurements is decreased. So as to say, if the time
between successive trades approaches to zero, the deviation from the contracted
amount also approaches zero. Considering an extreme example, if the time between
the trade can be executed every second, a household uses a fuse of 16 A, the
maximum deviation from the contracted amount can not exceed 0.001 kWh.
Looking at the big picture, with the introduction of more automated trading agents
that are able to trade in short time intervals and that can represent controllable loads,
the difference between the spot prices (determined in advance) and regulating prices
(instantaneously determined on-line) can be expected to decrease.
The most comprehensive examples for a reregulated market are the Nordic countries
despite being still not as developed as the model described above. In this market
structure, the short term market is controlled by the grid operator and only the
producers can place bids that affect the decrease or increase of production in the

83
market. Again the grid operator selects bids in case of a perceptible mismatch
between supply and demand [71].
3.3.2.3 Grid Operation
Grid operation is still a monopolistic and highly regulated aspect of the power
market. So as to provide grid stability and security, the power grid operation is
restricted with some constraints and not all possible combinations of consumption
and production are allowed. In addition, too sudden or extreme fluctuations in the
allocation should be avoided, even if the initial and final allocations are stable. The
resistive losses on the power line incur transportation costs in addition to the
investment costs. The problems identified vary from one country to another. For
example, the related losses are more critical for US than for Nordic countries. So as
to say, the grid stability, security and cost management should be carefully
considered for a power market. The main reason that the electronic power markets
model is still not adapted to all electricity trading markets is the difficulty of
integrating grid operation to a competitive environment. Moreover, the fact that the
allocations might change severely between regions violates the stability and security
of the grid. However still there are some logical reasons to think that a more detailed
electronic power market agent with smaller measurement intervals would decrease
the difference between the demand prediction and the actual demand. Some of these
reasons are that the customers will trade directly against dynamic prices; they will
use their incentives to adjust their demand accordingly and control their loads.
Considering that there will always be some fee for a transaction, the customers will
be willing to compensate the variations locally as the cost of transaction between
agents that are close to each other is lower. The power line communication for the
agents that can reach each other via a common power line will be cheaper than those
that are geographically distant from each other. As a result, the variation of
compensation among the neighbors will be more preferable than the compensations
from the agents of other areas [71].

84
3.3.2.4 Changes in Market Conditions, Legal and Technical Environment
In order to be able to integrate PLC into the energy and telecommunication
applications, it should be considered that the current developments are dragging the
market to a highly dynamic and uncertain environment, where sector boundaries are
shifting, and crucial financial power is obtained through mergers and acquisitions. As
a result, in all dimensions of the distribution and generation market competition is
increasing. On the other hand, the legal legislations are redesigned, local and
international companies are approaching Turkish market as new entrants.
Consequently, new operational and business strategies are needed to be developed
according to the rapidly changing market conditions.
3.3.2.5 Electricity sector liberalization
The emerging expectations of privatization, liberalization and open competition in
electricity generation, distribution and transmission businesses are evoking radical
changes in corporate structures, organizational cultures, business goals, market
expansion strategies and customer orientation [72].
Moreover, the electricity transmission, distribution and generation businesses are
experiencing consistent financial struggles in means of their fundamental operations.
According to Nuclear Energy Information Platform’s study, dated January 21st 2008,
the total electricity production of Turkey increased by %8.4 in 2007 compared to
2006 and reached to 191.2 billion kWhs. In the same period, national electricity
demand increased 8.6% ad reached to 189.5 billion kWh. In Table 3.1 below, the
instantaneous peak time power demands and the power demand increase values are
listed. For 2005, the peak time instantaneous power demand was 25174 MW where
as the minimum instantaneous power demand was 10120 MW. Similarly, for 2008,
the peak time instantaneous power demand was 27594 MW and the minimum
instantaneous power demand was 10545 MW. The energy demand values for years
between 1997 and 2006 are also listed. Except 2001, (the year when a big financial
crisis occurred) the annual demand increased around 6.5 – 8.5 %. Most recently, the

85
energy demand suffered again from a global financial crisis as of 4th quarter of 2008.
The profit margins of electricity companies also shrunk considerably.
Table 3.1: The realized peak time instantaneous power demand and energy demand
values in Turkey between 1997 and 2006 [73], [74], [75].
According to the same study by Nuclear Energy Information Platform, dated January
21st 2008, the energy demand for the next 10 years was projected as in Table 3.2.
However, considering the recent financial situation around the Europe and rest of the
world, this demand estimation should be revised.
YEARS Instantaneous Peak Time Power
Demand in MW
%
Increase
Energy
demand in
GWs
%
Increase
1997 16.926 11,1 105.517 11,3
1998 17.799 5,2 114.023 8,1
1999 18.938 6,4 118.485 3,9
2000 19.390 2,4 128.276 8,3
2001 19.612 1,1 128.871 -1,1
2002 21.006 7,1 132.553 4,5
2003 21.729 3,4 141.151 6,5
2004 23.485 8,1 150.018 6,3
2005 25.174 7,2 160.794 7,2
2006 27.594 9,6 174.230 8,3
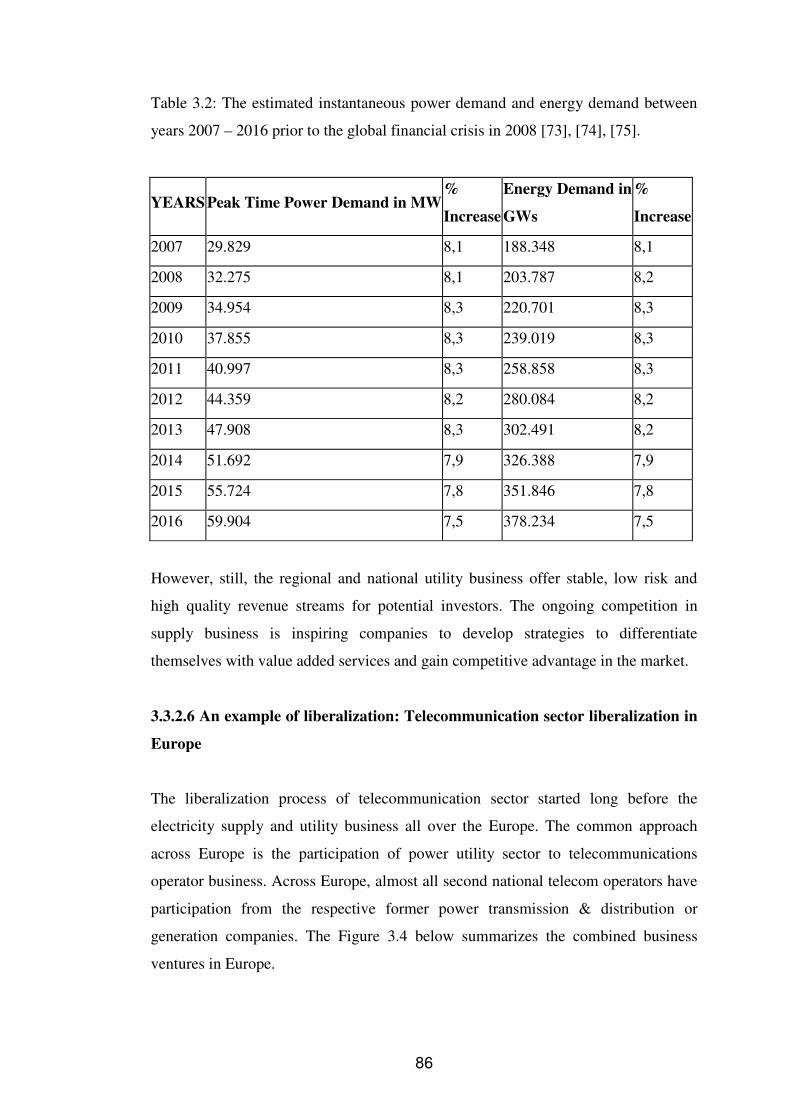
86
Table 3.2: The estimated instantaneous power demand and energy demand between
years 2007 – 2016 prior to the global financial crisis in 2008 [73], [74], [75].
However, still, the regional and national utility business offer stable, low risk and
high quality revenue streams for potential investors. The ongoing competition in
supply business is inspiring companies to develop strategies to differentiate
themselves with value added services and gain competitive advantage in the market.
3.3.2.6 An example of liberalization: Telecommunication sector liberalization in
Europe
The liberalization process of telecommunication sector started long before the
electricity supply and utility business all over the Europe. The common approach
across Europe is the participation of power utility sector to telecommunications
operator business. Across Europe, almost all second national telecom operators have
participation from the respective former power transmission & distribution or
generation companies. The Figure 3.4 below summarizes the combined business
ventures in Europe.
YEARS Peak Time Power Demand in MW %
Increase
Energy Demand in
GWs
%
Increase
2007 29.829 8,1 188.348 8,1
2008 32.275 8,1 203.787 8,2
2009 34.954 8,3 220.701 8,3
2010 37.855 8,3 239.019 8,3
2011 40.997 8,3 258.858 8,3
2012 44.359 8,2 280.084 8,2
2013 47.908 8,3 302.491 8,2
2014 51.692 7,9 326.388 7,9
2015 55.724 7,8 351.846 7,8
2016 59.904 7,5 378.234 7,5

87
FinlandTelivo
SwedenSwedish Railways
PolandTelenergo, PKP
GermanyO-tel-O, CNS,CNI/DBKom
AustriaTele.ringUTA Telecom
HungaryPantel
NorwayEnitel
NetherlandsEnerTel, Telfort
IrelandCIE/Esat, ESB/BT
UKEnergis, ScottishTelecom, BRT,Fibreway
FranceCegetel, EDFSNCF TD
PortugalEDP/Trans-Gas Spain
Retevision/Endesa
SwitzerlandDIAXNewtelco
ItalyENELAlbacom
Figure 3.4: Key utility operator ventures in Europe [76]
This joint structure triggers the extensive employment of PLC technology for a more
cost effective and ubiquitous communication infrastructure. Furthermore, for those
power utilities that look forward to participate in telecom services directly, can
commercially make use of PLC to have network access to telecom operators.
3.3.2.7 The significance of power line in telecommunications
The PLC can be a solution to the bottleneck of local loop or last mile to the customer
problems that telecommunication sector faces. The PLC can help the development of
telecom services over a high speed communication medium and can gain the upper
hand on the other alternatives such as copper wires, cable networks or fiber

88
networks. There are several reasons why copper wires and cable networks could not
accomplish the high speed information network.
a) The limitations of existing copper wire infrastructure of the national telecom
operator: This infrastructure can only support one or two lines of basic telephony.
These networks can support at most the ISDN with some network upgrades. This is
insufficient for high speed interactive services without a considerable amount of
capital investment.
b) Similarly the cost of additional investment required to construct an alternative
network for high speed interactive services is also drastic.
To sum up; presently the internet services offer to public is limited to slow speed and
poor quality, employing the telephone wires and cable networks. Moreover, the
limited capacities and inadequate availability of these networks damage the
development of new interactive applications and value added services. As a result of
all the factors described above, the PLC investments can lead to very optimistic and
promising results in means of energy and telecommunication applications [72].
3.3.2.8 Conclusion
The electronic power markets, which serve the small and medium size customers to
trade electricity directly with power pools, compose faster acting market structures
that can react quickly to price changes in rapidly changing conditions. Note that for
small and medium scale customers to benefit from these agents, the local
computation and communication equipment is supposed to be relatively inexpensive.
Only by this way, the power line communication that has the highest potential of
reaching the “last mile” customers will overcome the broadband communication
technologies despite its obviously limited bandwidth. As such, power line
communication can be the most favorable communication alternative for power
markets.
89
With the deployment of a PLC network with low cost network nodes, utility
companies will have the opportunity to enhance their basic service with
communication aspects of power line. Power line communications operating at
higher data rates will help the utility companies to develop some added value
services such as energy management, telemanagement and broadband internet
access.
After the adaptation of deregulated market rules, the real-time information from the
meters will be crucial resources for the utility companies to compete for customers
who will look for additional benefits from the utility companies such as saving plans,
security and energy management. This competition will be similar to the competition
that is present between the GSM providers today. Both the utility companies and the
customers, who can make informed decisions about their consumptions, will reap
lasting benefits from a high speed, bidirectional, secure and reliable PLC network.
3.3.3 Remote Detection of Illicit Electricity Usage via Power Line
Communications
3.3.3.1 The illicit utilization in Turkish Electricity Market
In the previous section, the benefits of PLC for automated electronic trade were
explained. The reregulation, competitive open market conditions and varying
customer profiles triggered Automatic Meter Reading (AMR) applications in the
energy supply sector. As stated before, PLC with the ”last mile connectivity“
advantage has many service possibilities to offer to customers without additional
investment for infrastructure. The additional benefits of AMR systems using PLC are
monitoring of real time energy consumption via remote readings and the detection of
illicit electricity usage. [77]
The illicit energy utilization is a major problem of Turkey for years. According to the
statements of Energy and Natural Resources Ministry, 19% of total electricity
consumption in Turkey was illegal as of year 2003. This amount is almost 16 percent

90
as of end of 2008. Considering the frequent blackouts and the inadequate power
investments in the recent years, prevention of the illicit utilization of electricity is an
unavoidable precaution for Turkish power market. Considering the privatization of
distribution sector, the legal legislations for the sake of preventing the illicit
electricity usage are becoming more important recently. This has been emphasized in
a lot of press statements of the Energy and Natural Resources Ministry in the last
years. The deputy director of TEDAŞ (Turkish electrical Distribution Company)
stated that unless Turkey can make use of the energy investments executed with
limited resources in a more efficient manner, the energy prices will continue to rise.
[78] As of September 2006, the debt of municipalities to TEDAŞ was 2,710 billion
YTL, the debt of industrial organizations was 325 million YTL, the government
offices’ debt was 1,286 billion YTL, the debt of the residences was 1,175 billion
YTL, and the debt of business establishments was 817 million YTL. As the debt of
the other parties and organizations are added, the total debt adds up to 8,350 billion
YTL. [79]
In addition to these debt figures the illicit utilization of electricity is around %17 as
of 2007. Apart from other losses, the illicit utilization not only threatens the current
national economic situation, but also makes it difficult to make plans and predictions
about energy consumption (and consequently the amount of investment required) in
the following years. Until now, the methodological precautions such as manual
reading, optical reading of the energy meters, the creditable utilization of electricity
and the legal precautions such as intervention of government forces did not yield
successful results.
PLC comes into scene at this stage, offering a relatively inexpensive, reliable and
widespread last-mile solution to monitor the consumption values and prevent the
illicit electricity utilization.

91
3.3.3.2 Detection of Illegal Electricity Utilization
3.3.3.2.1 The Methods of Illicit Utilization
The following are some common examples for illicit utilization: [79]
i) Mechanical objects: The illicit user can place some mechanical objects to
reduce the revolution speed of the meter disk which is used to measure the
consumption. By this way the disk speed is reduced and the recorded consumption is
undermined.
ii) A fixed magnet: A fixed magnet can be used to manipulate the
electromagnetic field of the current coils. The recorded energy is also altered as it is
a proportion of the electromagnetic field.
iii) Bypassing the line with an external phase: An external phase can be used to
bypass the mains line to obtain measurement-free energy. [80]
iv) Switching the energy cables at the meter connector box: The current passing
through the current coil is blocked. No consumption is recorded.
All four methods can be applied to electromechanical meters. However, only the last
two are valid for the digital meters. The following system offers a detection and
control system to solve this problem.
3.3.3.2.2 AMR, Detection and Control System
The proposed detection and control system is schematized in Figure 3.5. The low
voltage side (220 VAC) of the distribution transformer is integrated with an AMR
system via PLC technology. The transmission is executed among the host PLC unit
and two PLC modems for each customer. In Figure 3.5, the host plc modem is
located adjacent to the distribution transformer. The modems labeled PLC1A …
PLC1N are employed for AMR functions. The primary function of these modems is
to communicate with each other and to transmit the data measured in the kWh meters
to the host PLC unit. In addition to those, in the connection point of the mains line

92
and the customer premise line, another PLC modem, labeled as PLC1B … PLC1N
and an energymeter chip are installed for each customer. The illicit utilization is
determined by comparison of the two consumption data from the PLC modems next
to the energymeter (PLCnA) and the PLC modems in the connection point (PLCnB).
This connection point is closed to interference as it is normally underground or in air
[81].
Figure 3.5: The schematical illustration of detection system of illegal electricity
usage [79]

93
Figure 3.6: Illegal detector system for one subscriber [79]
As stated in the Chapter 1, power line communication is realized according to the
CENELEC EN-50065-1 standard. Remember that, the frequency band between 3 –
95 kHz is allocated to the usage of electricity suppliers and 95 – 148.5 kHz is
allocated to the consumer utilization. Basically, the signaling level for PLC is limited
to 116 dBµV (referred as Class 116 equipment) and for particular applications such
as industrial appliances, the signaling level is restricted to 134 dBµV (Class 134
equipment). The recorded data in kWhmeter of each customer is transferred to the
host PLC unit via PLC modems coded PLCnA located at the customer premise. On
the other side, the energymeter chips assembled in the connection points of the mains
line and the customer line also read the energy consumption in kWhs and transmit
these data to the host PLC unit via PLC modems coded as PLCnB. Eventually; the

94
host PLC unit compares two corresponding data for each customer (one from the
AMR modem called PLCnA and one from the PLC modem in the connection point
referred as PLCnB) and generates an error signal if these two data do not match. In
case of inconsistency of these two data, an illicit utilization is proven. Following the
detection, the related customer’s IP address and error signal are combined and
transmitted to the central control unit. Optionally, a contactor can be added to the
system to remotely turn off the energy flow to the illicit user [82].
3.3.3.2.3 The Overview of the Proposed Detector System
The proposed AMR system includes PLC nodes, energymeters, control logic parts,
and the system software. The host unit modem and the target modems (PLCnA’s and
PLCnB’s) are employed for bidirectional communication between the host station,
the customer premises and the control stations at the connection points of the mains
line and customer line.
In the connection points, the energy meters are composed of energy meter chip and
related circuit elements. The host PLC unit includes control and logic units to
compare the dual data and generate error signal in case of inconsistency. The system
software is composed of an assembler program for the microcontroller and operating
software for executing the system management that is included in a
PC in the main system center.
To sum up the main functions of the proposed system is as follows:
1) An energy meter is installed in the connection point between the customer
line and the mains power line.
2) Host PLC unit is installed in the distribution transformer’s vicinity and the
transmission data packet format is designed accordingly to meet the system
requirements.

95
3) Two PLC modems are allocated for each customer. One of them is for the
AMR data transfer and one is for the transfer of data from the energymeter chip in
the connection point.
4) The related address of the each AMR module and each energymeter are
defined at the host modem’s logic controller.
5) Operating software registers every customer in every subnetwork by using the
number, address, billing and etc.
6) The logic unit of the host compares the two consumption values from the
energymeter and AMR module and generates an error signal if necessary.
7) The proposed system is for a single distribution power network with a single host
PLC unit. This system should be repeated for several host PLC units of the
corresponding distribution transformers to form a wider power network. The host
units of the different distribution transformers are supposed to be connected to each
other and the main center station via power lines, fiber optical cables or RF links
[84].
The cost of the system subnetwork system including PLC modems, energymeter
chips, PLC modems and the energy meters is approximately $20-25. To sum up,
considering the total amount of economical loss resulting from illicit utilization, the
proposed PLC based AMR system is an economical and reliable solution to prevent
illicit utilization and obtain real time consumption data of the customers [85].
3.3.4 Broadband over Power Line (BPL)
Traditionally, power line carrier is a communication method that uses the existing
infrastructure to send information in the carrier signals over the power line. Power
lines are extensively used by utility companies, on the order of transmission
frequencies of 10’s of kHz, for the purpose of controlling the switches and relays on
electric power transmission system. In the recent years, by the help of digital signal
processing (DSP) techniques, Broadband over Power Line transmissions make use of
digitally modulated carriers in the frequency range of 2 - 80 MHZ. PLC has used for
pure communication applications rather than the limited traditional usage as control

96
medium of home automation or utility protection systems. Broadband over Power
Lines (BPL) which is also called power-line internet or power band is described as
the usage of PLC to provide broadband internet access over power line cables. The
ease of usage is a main advantage of the application. A consumer only needs to plug
a BPL modem into an outlet in an equipped building to access to high speed Internet.
Moreover, as emerging PLC modem technologies come into scene, the data transfer
over power line in the home and office at the speed of more than 1 Mbps is becoming
available. Thus, PLC has become a competitor of Internet communication medium
against traditional phone line modems, digital subscriber line (DSL) and wireless
Internet.
In the PLC modem market, Inari recently introduced a high rate home networking
solution using high data rate PLC communication for Internet, PC and printer sharing
for home and small office/home office (SOHO). Inari’s design employs 350 kb/s
power line modems. The company also introduced a new power modem with 1 Mb/s
speed. On the other hand, an Israeli company Itran Communications has recently
introduced a 10 Mb/s PLC modem by the end of this year. Obviously, the data
transfer demand and availability of the Internet is rising and the PLC modem should
be able to meet higher frequency requirements. For the communication rates over 1
Mb/s, the low frequency band is evidently inadequate.
A communication device can transmit the data over a band of the spectrum around
the nominal frequency which called as bandwidth. Sending information at a higher
rate requires a wider bandwidth. The channel capacity or the bit per second (b/s) rate
represents the relationship between the bandwidth needed and the data rate that can
be attained within the band. To meet the channel capacity of 1 Mb/s rate, PLC
applications should use higher than a 2-3 MHz high frequency band [86].
In the United States, the various application fields of BPL are residential BPL, BPL
on 120/240 V power lines, BPL on 1,000V to 40,000V power lines. The topology of
BPL illustrated in Figure 3.7 mainly consists of the following elements: (1) PC, (2)
modem, (3) transition from the residential or commercial power line to the a single

97
phase of the medium voltage system that supply the residential or commercial
premise (4) injector (5) extractor (6) repeaters (7) transition from the single phase of
MV line to the fiber optical link.
Figure 3.7: Basic BPL-System [87]
The connection of the internet backbone to the MV single phase is established by the
BPL injector. Fiber optic lines that are feed in from the BPL service area are
employed for the connection between the internet backbone and the injectors. The
three phase MV lines are initiated from the distribution substations and one or more
of three phases can be used to service the customers. The attenuation, distortion and
noise are the most important problems that jeopardize the signal strength and the
reliability of the power lines. The repeaters are occupied between the BPL injectors
and the BPL extractors to cover the attenuation and losses. The extractors are the
interfaces between the MV infrastructure and the customer’s local area network,
modem or PC. BPL extractors are conventionally located at each low voltage
distribution transformer, feeding the customer premises or residences.
98
Orthogonal Digital Frequency Multiplexing (OFDM) is the conventional digital
modulation method for BPL applications. In the context of OFDM, multiple carrier
frequencies that are orthogonal to each other are used to digitally modulate the data.
As a property of orthogonality, the correlation of the carrier frequencies is zero. The
BPL modem on the customer side, converts the serial data stream into successive
parallel streams that digitally modulate one of a group of orthogonal carriers. There
are two solutions to transmit these modulated orthogonal carriers from the LV line to
the MV phase line. For this purpose, the first method is an inductive coupler,
bypassing the transformer. The alternative method is placing a Wi-Fi transponder
and a modem next to the PC, transmitting the data signal to a transponder on the
utility pole that is connected to the phase through and inductive coupler. As indicated
before, the repeaters are also employed to stimulate an amplified BPL signal to
surmount the disturbing affects such as noise, losses and attenuation. The BPL
service provider controls the amplitude, the orthogonal carriers utilized and notched
out signal components of the BPL signal [87].
The benefits of this new technology to the Turkish electricity and
telecommunications markets can be summarized under two main titles:
1) Greater competition and evidently lower prices in the Turkish broadband market:
BPL can motivate DSL and cable operators for higher transmission quality and
higher market penetration [88].
2) Ability to offer broadband access to rural and country areas without DSL, cable,
wireless and fiber optic internet access: The extensive infrastructure that is already
present will allow these people in remote locations to have internet access with little
equipment investment.
There are some major disadvantages of BPL over DSL and cable. The most
important ones are unstable physical characteristics of the electricity network, the

99
lack of IEEE standards and relatively limited bandwidth compared to cable, DSL and
wireless.
3.3.5 Existing and Foreseeable Complications of PLC Applications in Turkey
There are several reasons why the PLC employment has been limited to narrow band
applications such as automatic meter reading in Turkey.
a) PLC technology is in the development stage of its life cycle. It is still very
young and the capabilities need further improvement. Only in the recent years,
complex modulation techniques have been developed to attain high speed services.
b) For every communication medium standardization and interoperability is
crucial for further development with the contributions from different technology
developing companies. The CENELEC standards that restrict the frequency of PLC
application to the upper limit of 148 kHz are not enough for the development of
modern voice or data systems. This limitations discouraged lots of independent
researchers and technology companies to invest for higher value PLC systems.
c) As stated above, PLC applications was limited to narrow band applications.
The main reason for this was to be able to reduce the operational costs of utility
supply. Moreover, for this kind of limited applications, there exists some other
obstacles such as continuous market, legal and technical uncertainties [72].
Indicating the potential complications, let us focus more on the automatic meter
reading (AMR) which is the first widespread application area for PLC. It was stated
before that after the reregulation (or deregulation as called in some other literature),
automatic meter reading has become an important service for distribution companies.
The measurement intervals were fixed around 0.5 – 1 hour and the utility companies
made their own experiments in limited bandwidth and without interoperability
obtained. Still, the results were satisfactory. The uncertainty was mainly resulting
from the following factors: [89]

100
• The vague effects of future reregulation in metering market
• The uncertainties about information security. This information will be
protected and limited to the distribution company.
• The return of investment of added value services such as AMR should be
carefully calculated for a cost - benefit analysis. Bundled services rather than
singular applications can be more effective in means of adoption and
penetration of PLC.
The implementation of bundled PLC applications require integration of relatively
distant disciplines such as telecommunications, power engineering, advanced
software applications, related hardware and market research. These disciplines are
different from core competencies of telecommunication and electricity distribution
business. Thus, telecom and utility companies should make use of external
collaborations with their experienced counterparts in Europe [90].
So as to say, the relatively cumbersome adaptation process of PLC should not
discourage the potential investors. The penetration rates of the existing
communication technologies were not rapid either. For the fastest spreading
technology, Internet, it took five years to reach 50 million people worldwide. For
broadcasting radio system the same figures were reached in 38 years and for TV it
took 13 years. In conclusion, the PLC can follow this pattern in means of expansion.
The expected combined efforts of telecommunications and utility companies after the
completion of privatization process and the higher adaptation capabilities of the
Turkey’s young population are promising factors for effective implementation of
PLC.
3.4 CONCLUSION
PLC initiates a lot of new business opportunities related to added value services for
both the energy and telecommunication sectors.

101
The power lines are basic components of the rising Information Society for two main
reasons:
a) Power line as electricity carrier: It is self-evident that the primary purpose of
the power lines is to supply electricity. In the same way, all equipments and
functions of the Information Society necessarily depend on a cost-effective
and reliable electricity grid.
b) Power line as information carrier: As we stated several times before, latest
advance in telecommunications enabled the power lines to be large-scale,
moderate speed, reliable information carriers under the name of Power Line
Communication (PLC). PLC offers the power line as an Information Society
telecommunications infrastructure along with the well known alternatives
such as copper wires, fiber optical cables, wireless networks and satellite
networks.
Making a brief SWOT analysis, the PLC has some obvious and unique strengths to
be important elements of the future Information Society Infrastructure.
3.4.1 Strengths
• Ubiquity: The low voltage power network is already a widespread networked
infrastructure reaching out to billions of private and business premises.
Crossing the boundaries of the buildings, PLC accesses the wall outlets, all
electrical appliances and industrial equipments.
• Last mile connectivity: Considering its alternatives in means of data
communication, last mile connectivity is not a uniquely distinguishing
characteristic of PLC. Still, PLC offers permanent access, always online and
bidirectional connection to the customers.
• Strong growth potential in means of data transmission based services:
Although it is a newly developing technology in our country, with limited
number of examples, PLC is a promising technology in means of telecom
capabilities and commercial equipment cost reductions. The already achieved

102
transmission speeds support innovative applications. The value added
services described throughout this thesis work is achievable around kbps
range. This is considerably attainable limit, considering that the current PLC
speeds are on the order of 1 Mbps and speeds up to 100 Mbps are foreseeable
in the near future. [91]
3.4.2 Opportunities
There are various driving factors originating from related business areas of PLC in
telecommunications and electricity sectors.
• Privatization and liberalization of electricity supply sector triggering
investment to increase efficiency in transmission and distribution business.
• The relatively flat growth and net margins are compelling the power
utilities to offer more value added energy services. The great portion of these
value added services are the related to communication technologies.
• PLC is the most cost effective and reliable solution for the local access
and availability problems in the telecom service infrastructure. For
developing countries such as Turkey, PLC can improve coverage and density
in a cost effective and speedy way.
• Besides the AMR and control benefits, PLC can offer high speed access
and broadband applications to support the development of interactive
information era.
Moreover the services listed below can be offered through PLC in combination with
the telecom and energy aspects in order to expand the service range and enrich the
individual choices.
• Energy services in the recently expanding sector boundaries and features.
Some examples are automatic meter reading, remote billing, demand side
management, remote control and distribution automation.

103
• PLC based telecommunication services such as broadband over PLC, PL
based telephony, voice and video transfer services.
• Added value services beyond the current sector boundaries such as PLC
based energy and equipment cost saving services, agent enabled personal
comfort services, smart home automation and security applications,
content oriented electronic services in electronic commerce, education,
information and entertainment.

104
CHAPTER 4
ADVANTAGES AND DISADVANTAGES OF PLC TECHNOLOGY AS
COMPARED TO ALTERNATIVE COMMUNICATION MEDIA
4.1 INTRODUCTION
As stated before, the power line carrier communication is a method of data
transmission using power lines as the communication media. Recently, PLC has
become a flexible communication alternative to implement low cost, reliable,
widespread and highly accessible network in the domestic environment. PLC can
provide new information services in energy and telecom [92].
On the other hand, PLC is still a developing and evolving method, targeting the
employment of the electricity power lines for data transmission. Needless to say, for
a communication technology to be favorable, the geographical coverage and the
maximum number of users it reaches are important criterions. PLC is one step ahead
in this manner compared to wire, cable, fiber, wireless and satellite solutions. As
stated before, power grid reaches every customer and industrial premise and the
coverage of this wiring cannot be compared with any other communication media
such as copper PSTN or cable TV network. As a result, PLC offer mass provision of
local access at a reasonable investment and utilization cost. PLC is highly attractive
compared to other local access technologies in terms of capital expenditure and
implementation requirements. Moreover PLC offers various distinguishing added
value services such as automatic meter reading, energy management, home
automation etc. [72], [93].

105
The listed features of PLC technology are important for the integration and
incorporation of telecommunication and energy businesses. PLC can introduce a
great variability of new information dependent services to the electricity distribution
market.
4.2 COMPARATIVE ANALYSIS OF PLC WITH THE ALTERNATIVE
COMMUNICATION MEDIA
PLC competes with different communication technologies such as PSTN, LAN
systems, radio based systems (DECT, GSM, ISM-band modems) and wireless LAN.
All of these technologies are successfully implemented in the related fields and they
reached to economies of scale as a result of the large scale production. Still some
radio based systems, such as GSM, require an infrastructure which makes the system
relatively expensive compared to others. Thus, the PLC applications over the LV
mains line, can take the advantage of its cost effectiveness and ubiquity for the cases
where radio based systems are unfeasible or expensive [94], [95].
So as to say, various communication technologies offer different solutions for the
coverage and local access issues. The market is expected to be a combination of all
these technologies operating simultaneously and methodically. Figure 4.1 illustrates
a hypothetical model for the integration of these communication media.

106
UtilitySale company
Info-kiosks
Utility communicationnetworks
Low voltage gridLan radioIR-technology
Municipal communication networks
Internet - other networks
UtilityGrid company
Municipal
Customers
Figure 4.1: The integrated energy distribution market infrastructure (source:
EnerSearchAB) [72]
Additionally, Figure 4.2 demonstrates a state-of-the-art comparison of PLC and other
candidate technologies for local access infrastructures and services.

107
Copper / PSTN
+ Mature and robust+ Good installed base
+ Wide choice of product+ Easy to install / use+ Relatively cost effective
– Relatively slow– On demand only
ISDN
+ Mature and robust+ Widely available
– Expensive for consumer
market– On demand only
Cable Modems
+ Excellent performance+ Permanently on line
– Limited geographical coverage
– Currently only available in limited trials– Contention based
Copper / ADSL-Lite
+ Good Performance+ Currently at the trial stage
+ Permanently on line
– Immature– Length of local loop affects performance
PLT
+ Good Performance+ Permanently on line
+ Good geographical coverage
– Still at the developmental stage– No installed base
– Distance limited– Possible problems in meshed power networks
Figure 4.2: The comparison between PLT and other relevant technologies for the
provision of Information Society access infrastructure and services (source: Mason
Communications Ltd) [72]
However, comparing these communication media should not be constrained to the
state of the art today. The ease of development and the possible upgrade and
improvement paths are also crucial.

108
CustomerBandwidth
Broadband
> 1 Mbps
Wideband
128 kbps–1 Mbps
Midband up to
128 kbps
Multi-line
telephony(minimum data)
Telephony
(minimum data)
Introduction of
ADSL
Introduction of
cable modems
Introduction of
broadband radio
Requiresadditional build
Requiresadditional build
Requiresadditional build
– – –
+
+
+
++++
COPPER /
PSTN
CABLE TV
NETWORKS
FIXED RADIO
(WLL)
PLT
1) 2) 3)
4 )
1) Copper twisted pair2) Hybrid fibre coax with copper termination for telecoms
3) NORTEL proximity-1 radio system
4) Based on an OFDM implementation protocol
Requires
compression ?
Figure 4.3: Comparison of access technology upgrade paths (source: Spectrum) [72]
Note that, considering the capital expenditure and implementation requirements;
PLC is considerably favorable compared to other local access technologies. In
addition, PLC can offer gradually increasing bandwidth availability to the market as
the demand increases in time.
4.3 THE SWOT ANALYSIS FOR PLC
4.3.1. Strengths and Weaknesses
The most noteworthy strengths of PLC can be listed as follows:
109
• PLC offers a permanent online connection without the burden of extra
employment costs which is still valid for most conventional switched
systems.
• PLC requires no additional wiring.
• PLC offers easy installation and expansion. The terminal of the
communication systems are already connected to power lines, by just putting
power plugs to the new outlets, new terminals can be added to the system or
the existing ones can be repositioned.
• PLC provides reasonable performance and good geographical coverage.
• PLC provides bidirectional data communication with a relatively inexpensive
infrastructure investment.
• The PLC infrastructure is ubiquitous and has an attractive upgrade path
• PLC is unique in such a way that it provides both telecom and value added
energy services concurrently.
• The low level of output power transmitted complies with the electromagnetic
compatibility criteria. This low power level is in line with the environmental
constraints for in house applications.
On the other hand some of the remarkable weaknesses of the PLC are:
• Since the power wiring system was originally intended for transmission of
AC power, the power wire circuits have only a limited ability to carry higher
frequencies.
• Inferior and unstable transmission characteristics causes serious degradation
of error performance
• PLC is still at the development stage, there are not a wide range of installed
customer bases. Report on the transmission of data over the electricity power
lines
• Although PLC has a wide coverage, the distance it can transmit the data
uninterruptedly is limited compared to its competitor technologies.
• Impedance of power line is usually lower than that of the connected
equipment. Impedance mismatch causes transmission losses.

110
• Power line channel transmission can experience some possible problems in
case of very heavy power fluctuations or cutoffs. Furthermore, during the day
time, LV network exhibit problematic conditions such as very low impedance
values and high noise levels. That’s why night conditions of PLC propagation
make it feasible, in contrast to the conditions observed in the early hours of
the evening or midday.
• Allowed frequency range is narrow (3-148.5 kHz). Still PLC offers
acceptable bandwidth, considering the low investment costs.
• As a result of the electromagnetic compatibility limits defined for different
communication media, PLC network are limited with a specific signal power.
Due to these limitations, PLC network become more sensitive to disturbances
from the electrical supply network and the network environment itself.
Besides, the error handling mechanisms employed to solve this problem, uses
a part of the transmission capacity and decreases the data transmission rate.
Consequently, there exists a trade-ff between the QoS (Quality of Service)
requirements for the PLC and decreased data rates. This trade-off is a
considerable disadvantage of PLC in its competition with the other access
technologies such as DSL or cable TV.
• Non whiteness of the PLC noise complicated the modeling of power line
noise. Defining counter measures for the noise is difficult because a new
model has to be developed to express the PLC noise model. Statistical
behavior of the man-made noise is different form the stationary white
Gaussian noise which is usually used as a basis to design communication
system models.
To sum up, PLC is a remarkable candidate for the last mile local access technology.
However, the integration and concurrent functioning of the different local access
technologies is more probable as each technology provides various trade-offs among
coverage, bandwidth, noise immunity and investment and operation cost. For PLC to
differentiate, it should be positioned as an interoperable and standardized local
access strategy, making use of its continuous online availability and coverage
advantages.

111
4.3.2 Opportunities for the Utility Companies
4.3.2.1 Higher Availability and Growth in Access Network
The utility company takes the advantage of a reliable and suitably scaled access
technology by implementing PLC. For example the NORWEB, that is the pioneer
company for the development of Digital Power Line Commutations in UK, has
benefited the high bandwidth data access over the same physical cabling as that used
for electricity distribution. The PLC turns the already existing cable infrastructure to
an Intranet by providing a Local Area Network to the private or industrial customer.
Moreover, with the added benefits of the PLC technology, this network functions
over the internal building wiring, generating a ubiquitous high bandwidth data
infrastructure for the communication of PLC based electricity distribution network.
Some emerging applications are a network of computers plugged into the mains line,
forming a high bandwidth data network. All end devices connected to this network
such as TV sets, PCs, domestic home appliances or building control monitoring
systems will be able to access the data transmitted over the network. Furthermore,
automatic meter reading also benefits from the same network [96].
On the utility side, PLC enables the companies to offer new tariffs, prompting the
customer for the sensible usage of energy by linking smart meters, programmable
controllers and intelligent demand-supply management devices. Moreover, with the
aid of the additional monitoring through AMR, the utility company can control the
power distribution peaks. Needless to say, PLC contributes the utility company to
retain its customer profile after the introduction of distribution market deregulations
over the next years [97].
4.3.2.2 New Value Added Services
With the increasing availability and employment of the information services such as
internet, more companies are appreciating the benefits of multimedia electronic
services especially in the customer services area. This new relationship concept

112
brings together the openness and competition, extending the limited transactional
relationship between the customer and the company to an open and competitive
environment. Companies, which begin to consider their customer service as their
main marketing tool, are attaching more importance on multimedia and
communications technology to employ automated and online customer service
provisions. By this way the call center operators are filtered and the power is given
directly to the customer. Supported by multimedia applications with sufficient data
rates, customers can connect directly to the utility company and can receive up to
date account statements, monitor their real time consumption, and electronically pay
their invoices that they receive in the preferred format. The market surveys point out
that the customer do not have loyalty to the printed invoices or bills but they would
prefer the employment of an electronic data transfer technology. So as to say, by
implementing PLC based applications, the utility companies not only grow their core
business but also benefit form the online services as a marketing advantage for the
company [96].
The online customer services offered via the PLC infrastructure assists the company
to benefit from the one to one marketing relationships depending on the customers’
preferences and profile. The multi utility approach provides a set of services for the
fulfillment of customer needs. The smart cards’ capacity can be used to store the user
information and to enable the customers to reach their utility accounts through a PIN
number. The user interface employed can also serve the user with online graphical
displays of historical information about the account usage and profile. This is
beneficial both for the utility company and the user. The utility company can make
good predictions about the future usage profile of the customer by the use of the
historical data and the customers can keep track of their short term and long term
usage by the help of the historical data.
Furthermore, the proposed PLC systems can be examples for the effective transfer of
directed and up to date advertising or responses to service problems of the customers.
After the distribution market utilization by the employment of the multi utility
environment, the customer can also benefit from the comparative analysis of a utility

113
with the competing utilities. Moreover, cross marketing for other services can be of
additional value to the customer loyalty. Finally, as stated several times in the
previous chapters, AMR is employed for the transmission of meter reading values to
the utility and also is efficacious for the customer to monitor their charges
continuously. The customers do not have to wait to receive the bill to envisage their
monetary burden. For all of these added value services to function properly, the
employment of appropriate interface technology and the adaptation of the customers
are key issues.
4.4 Business Aspects of PLC in the Scope of Telecommunications and Energy
Markets.
PLC opens up new business opportunities for electricity and telecom industries due
to its technical and economical advantages in means of ubiquity, last mile
connectivity, strong growth potential of information services and cost effectiveness.
Various business and technology factors in the telecom and electricity sectors affect
the PLC development through the continuous evolution of electricity business.
Especially in Europe, privatization, liberalization and competition have required
fundamental changes in corporate structure, organizational culture and the market.
Considering the utility monopolies these businesses deliver, low risk, stable and high
quality revenue streams. Thus, the demand for technology development and the
market innovation has been limited for the past decades. However, the growing
competition driven by the privatization has pushed the companies to invest in
technological developments and develop business strategies to differentiate their
service and gain competitive advantages in the evolving market [71], [98].
While these changes are occurring in the energy markets, even more drastic
developments are taking place in the telecommunications industry leading to greater
competition among the participating companies. As a result of these changes, the
utilities are trying to make use of the capabilities of power line communication to

114
reduce telecom network costs and increase service availability and reach.
Furthermore, the power utilities that do not directly enter to the telecommunications
sector are seeking for ways to utilize PLC technologies by providing network access
to telecom operators.
The current development of PLC occurs under the conditions of changing business
sector boundaries, increasing competition, altered business regulations, reorganized
financial institutes and redesigned global markets. Consequently, the current
technical capabilities, especially the bandwidth, of the PLC technology is not limited
by the physical capabilities of the power line, but rather with the boundaries defined
by the regulatory authorities aiming to prevent the interference with other networks.
Over the past decades the bottleneck of local last mile access to the customer and the
limitations in geographical availability, restricted the potential developments in the
telecom services. The limited transmission capacity of the existing copper local
network has limited the possibility of connecting all residential and commercial
customers to a high speed information network. Besides, the cost of establishing an
alternative high speed local access network was considerably high. Despite the high
speed interactive capabilities of the copper telephony systems, cable TV networks or
radio systems, the service or capacity that can be offered by these services in the
local network environment were restricted.
On the other hand, PLC supplies a permanent on-line connection through a
bidirectional symmetric communication accompanied by a reliable performance and
very satisfactory geographical coverage. However, it should be noted that the PLC is
still in the development stage and its applications are limited to narrow band
applications such as SCADA based remote metering and telemetry. Moreover, there
is not a widespread network of installed customer database and the commercial
incentives to exploit PLC infrastructure are not defined. So as to say, the capabilities
of PLC are still immature and need development.

115
As stated before, PLC is an alternative communication solution for the transmission
of various shared service alternatives. PLC is a shared medium similar to all the other
cable systems. Besides, DSL is a point to point connection with a lot of end users. To
sum up, the data transmission from the data centre to the vicinity of customer
premises can be supplied by traditional telecommunication methods or optical fiber.
Then, the transmission from the vicinity of the customer premises to the end user can
be supplied through various methods. At this point, PLC is the alternative to various
access solutions such as DSL or cable modem. Alternatively, some designs use
ordinary telecommunication solutions to transmit the signal to the point just before
the substation or just before the distribution transformer. Another design is to employ
PLC for aggregate signals but to use the wireless technology for the last mile to the
end user.
Above all, the upgrade path for PLC is favorable compared to the other local access
technologies by means of capital expenditure and implementation requirements.
Consequently, PLC is significant last mile local access technology. Still, it should be
remembered that PLC is a part of the complimentary technologies that offer different
compromise between the bandwidth, noise immunity, reach and cost. For PLC to
make use of its competitive advantages, it must be positioned by employing a well
defined local access strategy, highlighting the benefits of it considering the
geographic concentrations of users requiring common utility services.

116
CHAPTER 5
PLC SYSTEMS CHARACTERISTICS
5.1 IMPEDANCE
5.1.1 Power Line Impedance Characteristics
As stated before, the quality of signal transmission in power lines is significantly
affected by noise and attenuation. The power line impedance that is frequency
dependent and varies between a few Ohm to a few kOhm is another parameter that
influences the signal quality in PLC [104].
The medium of the electromagnetic field is non homogenous and power line has
various loads with different impedances connected to the line at different times.
Thus, the power line impedance cannot be represented by a uniform distributed line
or cable model. As a result, the channel impedance is continuously fluctuating. The
overall resulting impedance of the line is the combination of all the network
impedance and parallel connected loads. Therefore, the small impedances are
important for determining the overall impedance and the resultant network
impedances are difficult to predict. In most of the cases, the output and input
impedances of the transmitter and receiver in a PLC system are suitably low to match
the channel impedance. However, as the resulting network impedance is highly
fluctuating, maximum power transfer is difficult to attain, resulting in the challenges
for designing a coupling network.

117
CENELEC SC105A Working Group 4 points out this issue by implementing
network impedance measurements in three European countries: France, Germany
and Italy. These measurements and the results are considered to be representative of
similar measurements for the low voltage distribution networks of the other EEC
member countries. According to these studies, it was found out that the low voltage
distribution network impedance values are rarely over 20 ohms in the frequency
range of 3 to 148.5 kHz specified by EN 50065. In fact %90 of the impedance values
of the low voltage distribution network was in the range of 0.5 to 10 Ω. Besides, the
most frequently measured low voltage distribution network impedance values were
in the order of 5 Ω. At some specific frequencies, there are peaks in the power line
impedance characteristic. At these peaks, power line behaves like a parallel resonant
circuit. Obviously, the results depend on the location over the power line in which
the impedance is measured. Although the low voltage distribution network has a
complex tree structure of phase and neutral conductors and earth lines with the power
supply located at the root of the tree and the consumer loads distributed on the
branches, still the impedance characteristics are highly variable. The reason for that
is the fact that the actual physical layout of the low voltage distribution network
varies considerably for different consumer loads that include household electrical
devices, cookers, fridges, HIFI and other electrical equipment. As a result, the
impedance of any cables, lines or devices is not negligible by comparison. So as to
say, the transmission bandwidth is limited by the load characteristics, location
(residential or industrial), the choice of modulation system and the data rate.
To sum up, several parameters such as characteristic impedance of the line, the
network topology and the impedance characteristics of the connected loads affect the
overall net impedance of the system. In order to decrease the attenuation impedance
matching is targeted in conventional communication channels. Impedance matching
is straight forward for a typical antenna or a coaxial cable, the characteristic
impedance of which is defined in a wide range independent of frequency.
However for a power line channel the characteristic impedance in highly variable.
For example, as a result of the impedance characteristic of the power line, several

118
hundred watts of transmission power would be required to inject allowed signal
amplitude into the network at 10 kHz. On the other hand, a signal in the order of
watts might be enough to do the same injection at 90 kHz. For a power line system,
access impedance typically increases with increasing frequency. In addition to the
time variance and frequency dependence properties, power line also varies
significantly with location. At the low voltage side of a distribution transformer the
impedance values are 10 – 20 times greater than those at a normal outlet of a
building [15].
5.1.2 The residential power line impedance
The residential impedance is a crucial point for the PLC system design. The
residential impedance is determined by the characterization of the distribution
transformer secondary windings and the entrance cables, house wiring and electric
loads.
Figure 5.1 illustrates the frequency response of a typical power line examined by the
Nicholson and Malack.

119
Figure 5.1: Power Line Impedance Measurements by Nicholson and Malack [103]
Nicholson and Malack measured the power line impedance throughout the frequency
range from 20 kHz to 30 MHz and stated that the power line impedance increased
from 10 ohms to 25 ohms in the frequency range between 100 Hz to 450 Hz [103].
In addition, Vines‘s studies partially confirms the results of the studies of Nicholson
and Malack for the frequencies up to 20 kHz [105]. Vines feeds the voltage signal to
the line via a bandpass filter at the frequency of interest and measures the voltage and
current values. Vines’s method is interesting because there is no need for the
presence of a mains power signal (60 Hz in this case) and this simplifies the test set
up. The presence of the 60 Hz signal causes some harmonic distortions but has no

120
significant effect on the frequencies in the order of several kHz. For different types
of cables, Vines reports frequencies between 70 Ω to 100 Ω.
Vines’s studies and some other studies indicate that the residential power line can be
simply modeled as distributed impedance with a characteristic value of
c
LZ
C= for L in mH/foot and C in mC/foot (5.1)
The 120 and 240 kV residential power circuits show an inductive behavior as the
impedance increases with increasing frequency. According to Figure 5.3, the power
line impedance is between 5 to 32Ω at 100 kHz.
Likewise, the affect of household loads on the overall residential impedance is
covered in Vines’s study. He states that the impedance of most electrical loads,
except the high resistive loads, is high compared to the unloaded power line
impedance. In addition; some loads cause resonance with the power line impedance
at frequencies above 40 kHz, which is worth considering as the protocols of interest
cover the frequency range above 100 kHz. Furthermore, the EMI filtering of the
switched mode power supplies (SMPS) cause problems as the capacitors used for
these filters bypass the transmitted signal and PLC nodes should not be connected to
these points [105].
5.1.3 Load Impedance Measurements
In his study of “Performance analysis of FSK Power Line Communications Systems
over the Time Varying Channels: Measurement and Modeling”, Hakki Cavdar
investigated the impedance and attenuation characteristics of power line channels
[85].
Load impedances are highly time variable. The studies of J. Huloux and L. Hanus[
106], G. Platt and B. Cook [107], J. A. Malack and J. R. Engstrom [108] are some of
the studies on load impedances for PLC applications. According to those

121
measurements the impedances of residential power circuits increase with frequency
and change between 1.5 to 80 Ω at 100 kHz.
Table 5.1 is the list of measurements for some typical loads in Turkish homes in the
frequency range between 50 – 200 kHz.
Table 5.1: Impedances of typical electric household appliances in Turkey [85]
This measurements show that home appliances impedances changes with the
frequency in a non linear fashion. So it is difficult to come up with an explicitly
frequency dependent formula or equation for the home appliances. The impedance
should be determined at the specific link frequency. At the same time, industrial and
commercial power utilization varies during the day. The load changes during a
period of time are called diversity. In addition to the daily variations, the weekly and
seasonal diversity should also be taken into consideration for load impedance
estimations. As a result of these kinds of fluctuations, the probable errors in the

122
control signals may cause system errors. Real impedances are calculated using the
load diversity of the power systems.
5.2 ATTENUATION
5.2.1 Power Line Attenuation Characteristics
The transport of the electrical energy from the power station to consumer premises is
executed in three voltage levels referred as high, medium and low voltage levels. The
high voltage level, which covers the range between 380 kV and 110 kV, is used for
the transmission of electrical energy from the power stations to the high voltage
transformer substations close to urban or industrial locations. The medium voltage
network is employed for energy distribution between the high voltage transformers
substations and the medium voltage transformer substations near the customers. At
the medium voltage transformer substations the voltage is reduced to 0.4 kV and
distributed to customer premises. On the other hand, most of the industrial
customers’ premises are fed directly from the medium voltage network. Medium
voltage network can be composed of overhead or underground cables. The most
widely used network topology is a radial net or open ring network. (See Figure 5.2)
Radial network is simpler and easier to assemble. On the other hand, open ring
network offers a higher reliability [109].

123
Figure 5.2: Open ring net [110]
Figure 5.3: The general construction of coaxial cable from inside to outside [110]
Depending on several factors such as the consuming statistics and the geographical
location, the distance between two medium voltage transformer substations is around
several hundred or thousand meters. In figure 5.3, the cross sectional view of a
coaxial single core cable is illustrated. The core of the cable is composed of one or
more copper or aluminum wires with cross sectional areas between 35 mm2 to
500mm2. The semi conducting insulation, which separates the screen from the
conductor, is used to limit the electrical field. The screen is composed of semi-
conducting material and copper wires. The screen, which is connected to the ground,
carries charging current, leakage current and ground fault current. The cable is
protected against mechanical stress and corrosion by the outer sheath.
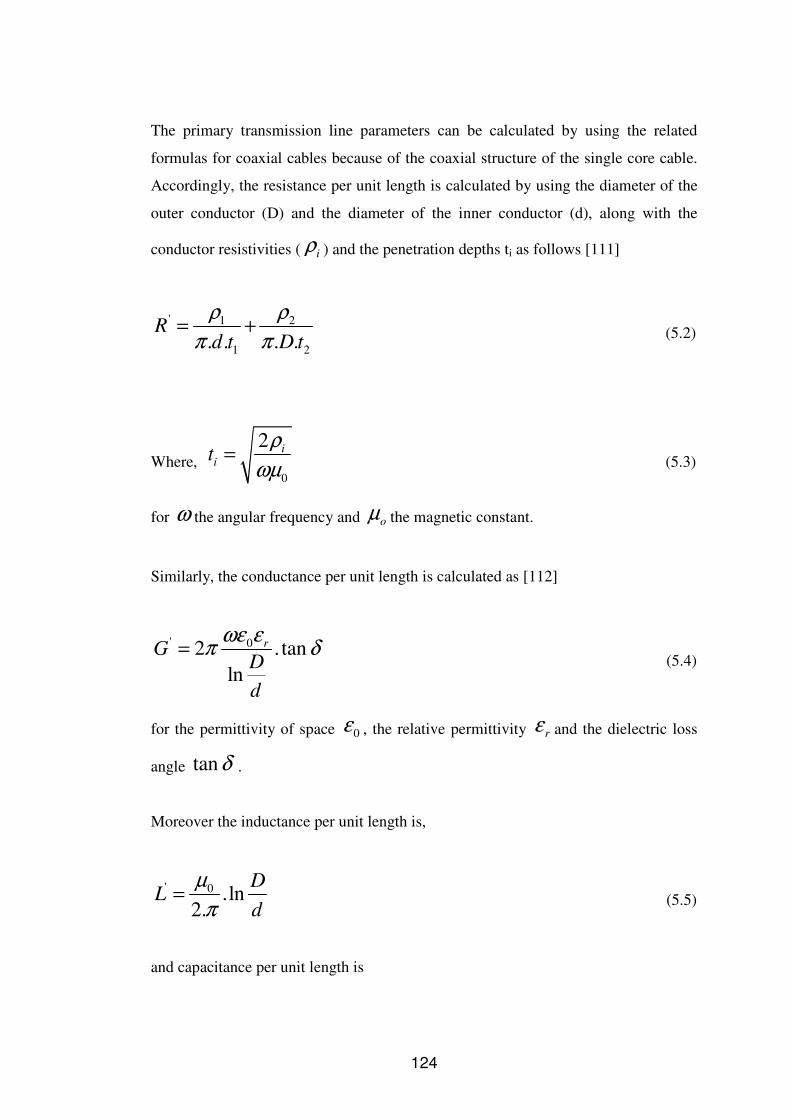
124
The primary transmission line parameters can be calculated by using the related
formulas for coaxial cables because of the coaxial structure of the single core cable.
Accordingly, the resistance per unit length is calculated by using the diameter of the
outer conductor (D) and the diameter of the inner conductor (d), along with the
conductor resistivities ( iρ ) and the penetration depths ti as follows [111]
' 1 2
1 2. . . .R
d t D t
ρ ρ
π π= + (5.2)
Where, 0
2 ii
tρ
ωµ= (5.3)
for ω the angular frequency and oµ the magnetic constant.
Similarly, the conductance per unit length is calculated as [112]
' 02 .tanln
rGD
d
ωε επ δ=
(5.4)
for the permittivity of space 0ε , the relative permittivity rε and the dielectric loss
angle tanδ .
Moreover the inductance per unit length is,
' 0 .ln2.
DL
d
µ
π= (5.5)
and capacitance per unit length is

125
' 02
ln
rCD
d
πε ε=
(5.6)
Furthermore, the secondary transmission line parameters characteristic impedance
Lz
and the propagation coefficient γ
can be derived from the primary transmission
line parameters as follows: [112]
' '
' '
. .
. .L
R j LZ
G j C
ω
ω
+=
+ and
' ' ' '.( . . ).( . . )R j L G j Cγ ω ω= + + (5.7)
Several types of power line cables were measured by to determine their
characteristics. Measurements were carried out using a network analyzer with input
impedance of 50 Ω. To come up with a formula, the open circuited and short
circuited cable impedances were measured.
The input impedance of an open circuited transmission line can be expressed as [112]
.cot ( . )ino L
Z Z anh lγ= (5.8)
Whereas, the input impedance of a short circuit transmission line is
. t ( . )ins L
Z Z anh lγ= (5.9)
Using the short and open circuit input impedances, the characteristic impedance can
be calculated as [112].
.L ino insZ Z Z= (5.10)
And the propagation coefficient is derived as
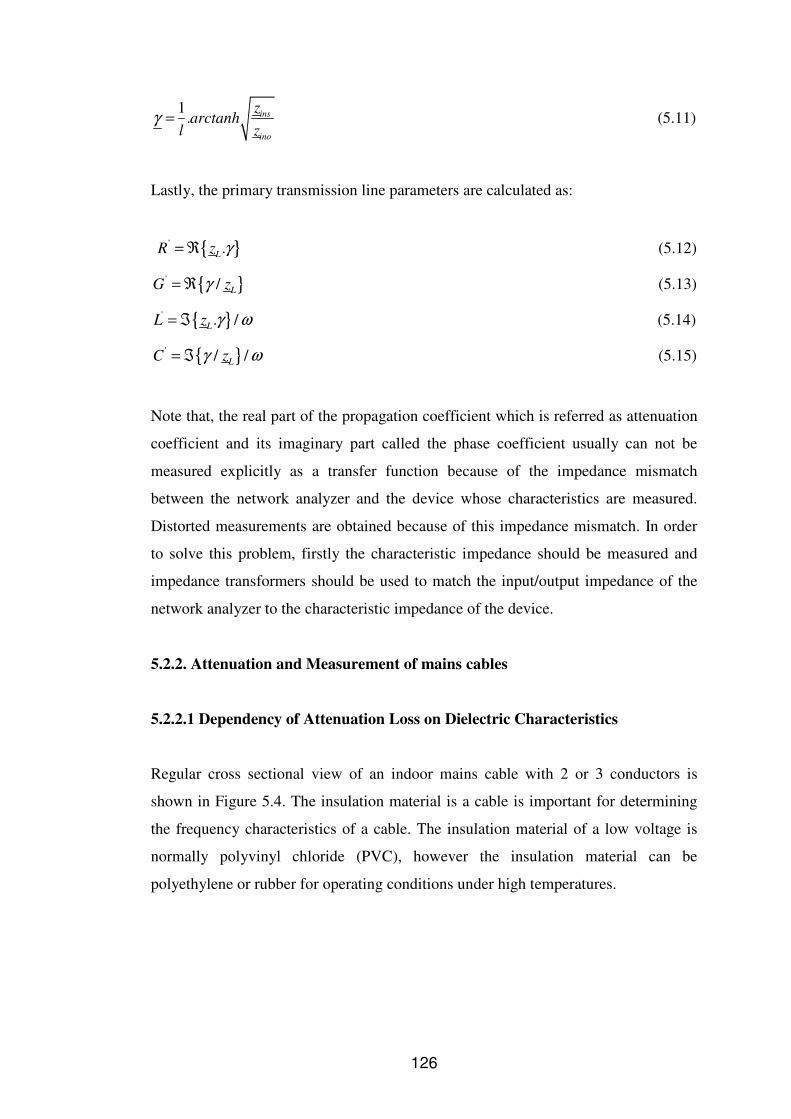
126
1. ins
ino
zarctanh
l zγ = (5.11)
Lastly, the primary transmission line parameters are calculated as:
' .LR z γ= ℜ (5.12)
' / LG zγ= ℜ (5.13)
' . /LL z γ ω= ℑ (5.14)
' / /LC zγ ω= ℑ (5.15)
Note that, the real part of the propagation coefficient which is referred as attenuation
coefficient and its imaginary part called the phase coefficient usually can not be
measured explicitly as a transfer function because of the impedance mismatch
between the network analyzer and the device whose characteristics are measured.
Distorted measurements are obtained because of this impedance mismatch. In order
to solve this problem, firstly the characteristic impedance should be measured and
impedance transformers should be used to match the input/output impedance of the
network analyzer to the characteristic impedance of the device.
5.2.2. Attenuation and Measurement of mains cables
5.2.2.1 Dependency of Attenuation Loss on Dielectric Characteristics
Regular cross sectional view of an indoor mains cable with 2 or 3 conductors is
shown in Figure 5.4. The insulation material is a cable is important for determining
the frequency characteristics of a cable. The insulation material of a low voltage is
normally polyvinyl chloride (PVC), however the insulation material can be
polyethylene or rubber for operating conditions under high temperatures.

127
Figure 5.4: Cross sections of typical indoor power cables [113]
The dielectric characteristic of PVC depends on temperature, frequency and the
composition of the insulation material. So it is not logical to attempt defining the
explicit dielectric characteristics of PVC. Figure 5.5 gives a brief idea about the
relationship between relative electric constant, frequency and temperature.
Figure 5.5: Relationship of the relative dielectric constant with frequency and
temperature [114]
Some proportion of the power injected by the transmitter does not reach to the
receiving end because of the non ideal characteristics of conductors and insulation

128
materials. At the frequencies of interest for PLC, the primary causes of loss and
attenuation for low voltage (220 V) power cables are the resistive losses, dielectric
losses and coupling losses. [114]. Referring to Jero’s studies, the transmission line
theory indicates that the PLC cable can be modeled by distribute parameters R, C, L
and G as follows:
Figure 5.6: A distributed transmission line model. [115]
When the signal is fed between the two conductors, most of the electric field is
confined between the conductors. Then according to Manfred and Klaus’s study, the
resistance per unit length is determined by the skin effect [116]. R is proportional to
f and G is proportional to f. Following that the characteristic impedance (ZL) and
the propagation constant (γ) are calculated as;
/L
R jwlZ Z Y
G jwC
+= =
+ (5.16)
( )( )R jwL G jwC jγ α β= + + = + (5.17)
Considering a real transmission line the effects of R and G on the attenuation is much
smaller than the effect of L and C, i.e. R<<wL and G<<wC which leads to

129
L
LZ
C= (5.18)
1
2 2 2 2 L
L
R C G L R GZ
L C Zα = + = + (5.19)
1 2 3k f k f jk fγ = + + (5.20)
Note that, the attenuation loss (α) which is the real part of the propagation loss, is
proportional to a function of f and f . Table 5.2 below shows the measured
attenuation for a bundle of indoor mains cables for a length of 20 meters.
Table 5.2 Types and sizes of the measured cables [113]

130
Figure 5.7: Attenuation of the measured mains cables [113]
In Figure 5.7, note that the fluctuation at the high frequency between 10 to 100 MHz
is caused by impedance mismatching of coupling circuit. It is observed that the
maximum attenuation difference among the mains cables is 4 dB at 100 MHz.
5.2.2.2 Attenuation characteristics modeling and measurements for mains cables
A tone signal injected to the power line at appropriate frequency through a coupling
circuit is a usual cause of attenuation. In the frequency band of interest, the
measurements can be conducted by applying a sinusoidal sweep signal, transmitted
through a twisted low voltage line. Attenuation is calculated from the relationship
between the received and transmitted signal by using a FFT based software. The real
part of the transfer function reveals the attenuation. Additional attenuation, on the

131
order of 20 dB, due to the coupling between phases (cross coupling) can occur. There
are various measurements about the modeling the signal attenuation as a function of
the variables that are mentioned in the introduction of this chapter (location, time,
frequency, user access, load characteristics, voltage level and cable layout) [3]
Figure 5.8: The transfer function of low voltage line versus frequency [3]
According to Hooijen’s model presented in “On the channel capacity of the
residential power circuit used as a digital communications medium”, the attenuation
frequency is independent but varies within the range between 40 dB/km and 100
dB/km.
Based on IEC’s Technical Report 1334-1-4, the attenuation is simply modeled as
follows
12.6 0.055( 100) 0.25( 60)A d f= + − + − dB (5.21)
Note that the attenuation increases with a slope of 0.25 dB/kHz for frequencies
between 60 kHz and 90 kHz. Moreover distance in meters contributes to the increase
of attenuation with a slope of 55 dB/km for distances between 100 and 550 km.
Furthermore the time of the day has some effect on the fluctuation of attenuation.
Night time attenuation usually exceed the day time [6].
132
For a typical low voltage distribution system, power conductors are arranged in a star
shaped topology. A circuit breaker usually feeds 10 to 20 lines and each line supplies
8 to 10 outlets. The branches in the line are permitted but not common. In the case
that the loads are connected to outlets, stubs occur. If extension cables are used these
stubs can become very long. For lengths of stubs being less than 100 meters, no nulls
are formed at frequencies less than 500 kHz. The absence of nulls points out to a
considerably flat attenuation characteristic for low voltage PLC frequency of interest
(100 to 450 kHz). In this case, there is no need for channel equalization.
In addition to the almost flat and constant attenuation of the power conductors, high
attenuation that can obstruct the data transmission significantly is observed in some
frequencies. This type of attenuation is mainly caused by quarter wavelength
transmission line stubs.
Dostert indicates a 15 dB mean attenuation for a typical single phase indoor cable
and 50 dB for external power lines for frequencies below 150 kHz up to 0.7 mile
cable lengths. He states that the in some cases the interference signal level exceeds
the transmission signal because of the signal level limitations. He indicates that these
unreliable data links are also a consequence of poor performance of narrowband
modulation techniques. Dostert proposes a frequency hopping spread spectrum
(FHSS) communication technique to solve this problem [117]. Similarly, Chaffanjon,
Duval, Menuier and Pacaud state in their studies that an attenuation of 60 dB may be
observed at the end of 100m of overhead line in towns, while in rural zones the level
of propagation attenuation may be in the order of 20 dB at the end of 500m of
twisted overhead line [118], [119], [120].
On the other hand, Hanson measured the signal attenuation in the Engineering
Building of the University of Saskatchewan and found out that the attenuation was
on the order of 15 or 20 dB at a separation of 4m between the outlet and ranged from
35 dB to 40 dB at a separation of 23m.

133
5.2.3 In-home signal strength measurements for signal attenuation
Signal attenuation for in home electrical line is crucial for the home automation
systems design. According to the study of Hakki Cavdar’s study, the attenuation
measurements are done between some room of a typical house such as kitchen,
bedrooms, living room, bathroom and hall. [85] Power is delivered through the
connectors located at the walls between the corresponding divisions of the house. In
Table 5.3, the connector numbers for each branch are indicated in the parentheses.
The distances for the power line measurements of Table 5.3 are between 6 – 30 m.
Table 5.3: Attenuation levels between the divisions of homes (in decibels) [85]
5.2.4 Interhome signal strength measurements for signal attenuation
For relatively long distance communication applications such as automatic meter
reading, remote control of home appliances and wireless ring networks, the
interhome signal measurements are important. For the Turkish electricity grid,
interhome signal measurements can be divided into two categories: the measurement

134
between the flats of an apartment and the measurements between single homes using
the same phase of a power line. According to the studies of Hakki Cavdar, the
distances between the signal homes that share the same phase vary between 5 to
1500 m. Hakki Cavdar points out that the attenuation for the interflat signals is
between 10 – 25 dB and the attenuation for the single houses that are 200 – 1000 m
distant from each other, the attenuation varies between 40 – 60 dB [85]. Again the
load diversities should be taken into account for complete understanding of signal
attenuation.
5.3 CONCLUSION
Power communication lines characteristically have low characteristic impedance and
high signal attenuation. Typically, every transmitted signal is subject to attenuation
over the power supply on the way to the receiver. Attenuation values depend on
individual properties of the power line such as total length of the link, frequency,
location and time. In power lines attenuation can be as large as 90 dB. Average
fluctuations with time are around 20 dB.
Attenuation and time related distortions degrade the efficient and reliable data
transmission over the power network. Stable and high frequency carrier signals of
considerably adequate power level are need for data transmission in the vicinity of
noise between the required terminals. However, there is a trade-off between the
increased levels of data transmission and radiation of the high frequency
communication signals. The power levels should be limited to prevent counterfeit
emissions from the high frequency transmitting equipment. There are internationally
agreed maximum power levels for spurious emissions from high frequency
transmitting equipment. These standards should be taken as a basis when designing
the equipments in order to diminish the risk of interference to other occupants of the
high frequency spectrum.

135
CHAPTER 6
NOISE AND DISTURBANCES IN THE POWER LINE NETWORK
6.1 INTRODUCTION
Noise and disturbances in the electrical grid can be roughly classified as follows:
i) Waveshape disturbances
a. Over-voltages, both persistent (>2 seconds) or surges (<2 seconds).
b. Under-voltages, both persistent or surges.
c. Outages.
d. Frequency variations.
e. Harmonic Distortions
f. Interharmonic Distortions
ii) Superimposed disturbances
a. Persistent oscillations, either coherent or random.
b. Transient disturbances, both impulse and damped oscillations
The waveshape disturbances have limited effects on the PLC systems. Transceivers
are usually able to decompose minor overvoltage and undervoltage disturbances.
Evidently, when overvoltages occur, total line outages make information
transmission impossible. However, sometimes the outage of a particular device may
not affect the performance of the entire domestic PLC system. The harmonic
disturbances are much frequented sources of noise. The triacs or silicon controlled
rectifiers such as light dimmers or photocopiers are examples for the sources

136
harmonic and interharmonic noise. The typical spectrum of this type of noise
includes a series of harmonics of the system frequency. As the order of lower
harmonics between 3 to 10 kHz is lower than the PLC transmission frequencies, they
have no direct impact on the PLC receivers. However, these harmonics produce a
resonance source in the PLC system and affect the overall PLC system operation by
resulting in the saturation of PLC components with ferromagnetic cores. As a result
of this saturation, local harmonics are generated in the PLC frequency range. Still, it
is good to know that the harmonic disturbances occur at frequencies below PLC
transmission range defined by the regulations [124].
On the other hand, since many PLC systems depend on the system frequency sine
wave (carrier wave) for the system synchronizing the transmitter and the receiver, the
frequency fluctuations and variations in the carrier wave may cause transmission
errors. Abandoning the dependence on main carrier for synchronization between the
transmitter and the receiver can solve this problem. Additionally, the interharmonic
noise is the type of noise with a frequency at the noninteger multiple of the power
system frequency. The modulation schemes that can avoid these interharmonics can
be employed to filter out these noise components by using accurate notch filtering
[105], [125], [126].
The persistent oscillations include the noise type with a smooth spectrum. This type
of noise is usually caused by universal motor. The transient disturbances are impulse
noises and the non synchronous noises. The impulse noise is generally caused by
switching devices. It affects the whole frequency range for a short period of time and
can be eliminated by using error correcting codes. The non synchronous noise occurs
at frequencies other than the system frequency. The different standards of television
and computer scanning with different radiated noise components are the examples
for this type of noise. The non synchronous noise can be eliminated by avoiding the
transmission at certain frequencies and by using a frequency diverse modulation
scheme that can avoid the non synchronous noise at any foreseen frequencies.

137
Looking at the big picture, the noise in power lines can be discussed starting from the
producer to the very end user. So the journey from the output terminals of a
generator to the power plug of a consumer premise is a long path that is worthy of a
detailed analysis work.
Power line is not a standard communication medium. As a result of the primary
function of the power lines, they are not designed for communication in the first
place and their corrupted communication characteristics complicates the design of
detailed model for PLC as compared to the explicitly identified models for other
communication media like coax or optical cables.
Moreover, the power line channel impedance fluctuates with the frequency in a range
of a few Ohm to few kOhm. Also, the load conditions change rapidly. The
discontinuities in branch cables cause reflections and echoes. The impedance
characteristic of the power line conveys some peaks at some frequencies. This effects
lead to a multipath environment propagation and leads to deep narrowband notches
in the frequency response.
Considering the PLC applications in HV and LV side of the transmission and
distribution system, the noise in power line should be studies both on the HV side
and the LV side.
6.2 NOISE IN HIGH VOLTAGE PLC SYSTEMS
In case of HV PLC applications, the Signal to Noise ratio (SNR) of a power line
significantly suffers from the unsteady conditions of weather and rippled frequency
characteristics. Noise in HV PLC channel can be divided into two main categories:
1. Noise at normal (stationary) operation: Major sources of this type of noise are the
thermal agitation of conductors, static discharges and corona, and noise due to
interference with other PLC communication systems and radio stations.

138
2. Noise at transient and emergency operation: Most important causes of this type of
noise are power line faults, circuit breaker and isolator operation and lightning
discharge. During normal operation the most dominant noise source is corona.
Burcascano, Cristina, D’Amore studied the corona noise in HV power lines by
identifying the power spectral density and Gaussian noise voltage with variable root
mean square value in the time domain [127]. As a result, it can be stated that a HV
power line is itself a noise source due to corona discharges. In other literature
transient noise and emergency operation (circuit breaker and relay operations) and
strong asynchronous impulses in HV power lines are also revised [128].
In summary, the fundamental noise types in HV power lines comprise corona
discharge, static discharges, lightning, power factor correction banks and circuit
breaker operation. The major parts of these noises are eliminated by medium-to-low
voltage transformers on the low voltage side, so the most common interference in
low voltage domestic networks can be attributed to the various household devices
and office equipment connected to the network. In rest of this chapter of the thesis
work, the noise models, characteristics and measurements of noise on the low
voltage side of the power line will be studied.
6.3 NOISE IN LOW VOLTAGE PLC SYSTEMS
For many years low voltage power lines have been a communication medium in low
bit-rate applications such as automation of power distribution and automatic meter
reading. Nowadays also some other benefits such as internet access, home
networking and local area networks have captured attention to the power line
communication [3].
The major advantage of power lines is that they are easy to access through pre-
installed and abundant infrastructures of wires and wall outlets in existing buildings
[129].

139
Moreover the recent developments in telecommunications and digital signal
processing enable the producers to solve the existing problems of PLC applications
with limited amount of new investment [3], [130].
Clearly determining the characteristics of a communication channel is important for
data transmission over any communication medium. Noise characteristics,
attenuation and frequency response are the most important characteristics. Another
important problem is the matching the input impedance of the power line as seen by
a PLC transmitter in order to couple the transmitter power to the power line [131].
Moreover, there are various ambiguities that originate from the unstable and
unpredictable aspects of PLC applications such as location (industrial zone or urban
area, indoor or outdoor), time, frequency, user access, load characteristics, voltage
level (low or medium) and cable layout (overhead or underground) [132]
6.3.1. Operating Environment of Low Voltage Power Lines
Operating environment of any communication technology determines the evaluation
process of it. This fact, that is valid for power line communication, is usually ignored
by most textbooks and literature. There are some common practices and assumption
for communication systems, which should somehow be modified to be applied to
power line analysis [133].
In most of the communication system models, the superposition principle is
benefited to obtain a result. These systems, for which superposition principle applied,
are modeled as the addition of stationary and impulse noises. Noise at the receiver
side is regarded as the addition of the background noise and the appliance noises.

140
Figure 6.1: Illustration of modeling for total receiver noise for a system that
superposition principle applies to [134]
For a system designer, the important point is the amount of noise reaching the
receiver or the receiver’s signal to noise ratio (SNR). Si is the noise power spectrum
for the ith noise source and Hi(f) is receiver noise spectrum for the ith source, in other
words: the transfer function between the ith noise source and the receiver. As the
appliances operate independently and the resulting noise signals of the corresponding
noise sources are not correlated, the superposition principle is used. The aggregate
noise spectrum in the receiver side can be expressed as [134]
2
_1
( ) ( )* ( )N
rx appliance i i
i
S f S f H f=
= ∑ (6.1)
Consequently, the total noise in the receiver side is the summation of the
corresponding appliance noises and the background noise [135].

141
_( ) ( ) ( )rx background rx appliance
S f S f S f= +
2
1
( ) ( ). ( )N
background i i
i
S f S f H f=
= + ∑ (6.2)
However the main two conditions of this principle, which are linearity and time
invariance, are not applicable for the power line networks. An example for
nonlinearity comes into scene when a packet’s signal voltage adds up to the AC
mains voltage and causes power supply diodes to turn on and off at the packet carrier
frequency. Similarly, the time dependent impedance variation at a point of a power
line network, resulting from the appliances alternately drawing and not drawing
power from the network at twice the AC line frequency, is an example for time
variance of the power line system.
One other ambiguity is the assumption that wiring capacitance dominates signal
propagation effects. For the case of the termination or load impedance is greater than
the characteristic impedance of the wire, it can be assumed that wire capacitance is
dominant. However, power lines are often loaded with impedances considerably
below the characteristic impedance of the wire and this violates the validity of the
assumption above. Capacitors used in TV sets and computers to meet the
electromagnetic emission regulations, resistive heating elements such as space
heaters and cooking ovens are examples of loads with low network impedance at the
communication frequencies. Comparing the entries of Table 6.1, one can observe
that the impedance of the mentioned devices is approximately an order of magnitude
below the characteristic impedance of power wiring.
Table 6.1: Power wire characteristics [14]

142
Table 6.2: Low impedance power line loads [14]
In order to model the attenuation with a full transmission model, the high frequency
models of the specified loads are needed. However, there is a first order
approximation that can be used to simplify the impedance characteristics. For a
single line communication if the wire runs less than 1/8 of wavelength, then the wire
inductance dominates the low impedance loads. For this case, the actual attenuation
can be modeled by a lumped model conveying solely a wire inductance and low
impedance loads.
In addition to all these facts, noise in power line communication is not Gaussian, nor
stationary, nor white. As a result the PLC channels do not match any usual noise
modeling techniques [136].
6.3.2 Classification of Noise in Low Voltage Power Lines
As stated before, the low voltage power lines (LVL) are the transmission lines that
contain all the devices and equipment connected to the secondary part of a
distribution transformer. There are various definitions in different sources about
noise classifications of low voltage power lines. Taking Hooijen’s classification as a
basis for the frequency range below 200 kHz, the additive noise in power line
communication channels can be abstracted under five categories [136]. Brief
descriptions of them are given below. They will be detailed further in the following
topics of this chapter.
1. Colored Background noise: Background noise has a relatively low power spectral
density. The spectral power density of the noise decays for higher frequencies. This
type of noise, that is primarily a summation of several noise sources with low power,

143
fluctuate with time. Colored background noise is sometimes referred as Additive
Colored Gaussian Noise (ACGN) [137]
2. Periodic impulsive noise synchronous to the mains frequency (harmonic noise):
This type of noise will be referred as harmonic noise during this chapter. When the
system is switched on and off at 50 Hz, harmonic noise is created at the higher
harmonics of 50 Hz. Obviously, harmonic noise is created by devices switching
periodically to the system frequency, resulting in a train of impulses in the time
domain or noise at the higher harmonics of the system frequency [138]
Figure 6.2 Strong noise synchronous to power frequency measured at the suburban
location [139]
Figure 6.2 above is the example for harmonic noise in a suburban location. The
harmonic noise is concentrated between 60 to 95 kHz. In addition to the harmonic

144
noise occurring in every 0.02s, which is the primary harmonic cycle for a system
frequency of 50 Hz, noise pulse are recorded in every 0.015s, corresponding to a
frequency of 66.7 Hz. This second noise type that occur at a noninteger multiple of
the system frequency is referred as interharmonic noise.
The duration and interarrival time of harmonic noise are worth investigating. They
mainly have a short duration of several microseconds and a PSD decreasing with
frequency. Many appliances generate noise synchronously to the instantaneous value
of the mains voltage. The primary source of this kind of noise is switching actions of
rectifier diodes, found in many electrical appliances and energy-saving devices,
operating synchronously with the mains frequency [130]. Therefore, there is still a
lot to benefit from a model which identifies the statistics of the instantaneous value
of the noise [134]
3. Asynchronous impulsive noise: This type of impulse noise is totally asynchronous
and random with amplitude much higher than the magnitude of the background
noise. One must distinguish between the repeating impulses caused by devices
switching synchronously with the mains frequency and the asynchronous impulsive
noise which is a stand-alone event. Principally, any device interrupting electrical
current at the mains frequency might cause asynchronuous impulsive noise with
comparatively high amplitude and short duration [115]
The main sources are the switching transients, electric motors and silicon controlled
rectifiers (SCR’s) [140]. The most disrupting devices are those that operate for a long
duration of time such as SCR’s in light dimmers. Another example are the
commutators such as electric drill motors that make and break contact throughout the
operating period of the device and cause high amplitude broadband impulse noise
components. Figure 6.3 shows the asynchronous impulsive noise examples for an
electric drill and a silicon controlled rectifier (SCR) in a light dimmer.

145
Figure 6.3: The asynchronous impulsive noise examples caused by an electric drill
and a silicon controlled rectifier (SCR) respectively [113]
The disconnections of elements of the mains line can also cause asynchronous
impulses. Their duration is some microseconds up to a few milliseconds (typically
but not necessarily less than 100 µs). The PSD of this type of noise can rise 50 dB
above the background noise and the interarrival time is random.
4. Periodic impulsive noise asynchronous to frequency: This is a rarely observed
kind of noise and in some literature it is classified under asynchronous impulsive
noise as it does not synchronize with the mains frequency and its source _ usually

146
switching power supplies (switch-mode power supplies)_ is not clearly identified in
most of the observations. The repetition range changes between 50 Hz to 200 kHz
which leads to a spectrum of discrete lines with a frequency range depending on the
repetition rate.
5. Narrow band noise: Narrow band noise, as implied from the name, is the type of
noise that occurs in a narrow section of the frequency band. This type of
interferences can rise up to 30 MHz. The source is generally ingress of broadcast
stations in the medium and shortwave broadcast bands i.e. sinusoidal signals with
modulated amplitudes caused by ingress of radio broadcasting. Some examples are
broadcast, commercial, military, citizens band and amateur radio stations. This type
of noise is frequency specific and may possess differential and/ or common mode.
Their perturbation is comparatively stationary. They are not easy to identify and they
vary during the day time. Due to the extension of the mains, narrow band noise can
have noteworthy effects.
The propagation of radio signals operating between 1 and 30 MHz is a problem for
all communication media. Paul A. Brown explains this problem with an example of
UK medium wave broadcast stations operating in the 0.5 to 1.5 MHz range [140]. He
explains that these broadcast stations can be received with relatively stable levels of
quality during the day time. On the other hand, during the night and twilight, the
more distant broadcast stations that share the same spectrum begin to dominate as the
ionosphere alters the skip distance and the quality diminishes. Nevertheless, ingress
originating from the military (aeronautical and maritime fixed and mobile) and
commercial sources is less problematic due to their relatively low power levels and
limited bandwidth. Moreover, citizens band and amateur radio stations do not create
considerable disturbances as they are frequency specific and are localized despite
their comparatively high signal levels.
Sodium street lights are another source of narrowband noise especially during the
warm up period which may last for 2-3 minutes. Nowadays, also some energy
efficient lighting devices that have recently entered the market create narrowband

147
disturbance at some specific portions of high frequency spectrum. Commonly, the
propagation mode of the devices that cause narrowband noise is the differential mode
between the line and neutral conductors.
6.3.3. THE DETAILED ANALYSIS OF NOISE TYPES
6.3.3.1 Background noise
Background noise can basically be defined as the portion of the noise that remains
after subtracting all other types of noise measurement at a certain location.
Background noise which exists permanently on the power line has a frequency
dependent power spectrum density [135].
The Hooijen’s measurements and model in his paper “A Channel Model for the Low-
Voltage Power Line Channel; Measurement and Simulation Results” are the most
detailed and commonly accepted studies about background noise. In this paper
Hooijen makes experiments about the background noise characteristics of the power
line in different locations and different times of the day.
Hooijen performs his measurements depending on the residential power circuit
illustrated in Figure 6.4 below.

148
Figure 6.4: Residential power circuit that Hooijen uses in his measurements [139],
[141]
Firstly, he states that the coherence time of spectra significantly differs between
locations and as a function of the time of the day. During night time when the human
activity is relatively low, noise levels are around 90 dB(W/Hz) at 9 kHz and -125
dB(W/Hz) at 95 kHz. At the night time the background noise levels are observed to
be almost stationary in time. On the other hand, during the day the noise levels are
more unpredictable and fluctuating, varying up to 15 or 20 dB above or below the
average value over the frequency of interest. Another interesting observation was
that the more the noise curve deviates from the average value the less it takes to go
back to average. This fluctuation also depends on location. In rural areas, the
fluctuation took place within minutes, whereas in urban areas the fluctuations lasted
for several hours.
The distribution of the noise spectra measured at the urban location is as follows;

149
Figure 6.5: Distribution of all noise spectra measured at the urban location of
measurement [139]
Studying 700 different spectra measured at different times, Hooijen approximates the
background noise at a certain location at an arbitrary time for a frequency between
the frequency range of 9 to 95 kHz as [138], [142]
[ ]5( 3,95*10 )( ) 10 /K fN f W Hz
−−= (6.3)
Hooijen points out that K is a slowly varying Gaussian random variable with mean,
µ= -8.64, and standard deviation, σ=0.5. The best case is calculated for K=µ-2σ,
when only background noise is present. For the worst case, K= µ+2σ and apart from
the background noise, the contributions of the other noise types are also considered.

150
However, for the following analysis, the contributions from other noise types are
neglected as they occupy only a narrow portion of the frequency band and time
period compared to the always existing, ever present and wide band background
noise. Also, for most of the cases, these noise types are much weaker compared to
the worst case background noise.
Then, using 2K µ σ= ± , (6.4)
5( 9,64 3,95*10 ),( ) ( ) 10 f
best background bestN f N f
−− −= = (6.5)
5( 7,64 3,95*10 ),( ) ( ) 10 f
worst background worstN f N f
−− −= = (6.6)
For an PLC based RPC modem that transmit 25 W, the received signal power at a
distance d from the transmitter is
[ ]0,004*, ( ) 25*10 d
re bestS d W−= (6.7)
[ ]0,010*, ( ) 25*10 d
re worstS d W−= (6.8)
Similarly, the background noise RMS voltage in a low voltage power line for phase-
to-neutral coupling, can be modeled by two envelope equations a function of
frequency [6].
Worst Case: 20,001 0, 25 40( )
n kHz kHzV f f dBV= − − (6.9)
Best Case: 20,001 0,25 52( )
n kHz kHzV f f dBV= − − (6.10)
For fkHz denoting the frequency in kHz in the range of 0-250 kHz and the
measurement bandwidth chosen as 500 Hz, the frequency bands represented are
plotted in Figure 6.6 [138], [142].

151
Figure 6.6: Background noise level of a low voltage power line [3]
The prediction by (6.3) and the worst and best case approximations in (6.9), (6.10)
are compared in Figure 6.7. It is interesting to see that the 20 dB difference persists
between the best and worst case approximations, throughout the frequency range
specified.

152
_________o worst case according to (6.9)
_________* best case according to (6.10)
-------------o worst case according to (6.3) (K=µ+2σ)
-------------* best case according to (6.3) (K=µ-2σ)
Figure 6.7: Comparison of noise PSD versus frequency [3]

153
6.3.3.2 Impulsive noise
Impulse noise is defined as eventual short time perturbations. Impulsive noise
duration is usually observed to be lower than 100µs [3], [143]. There is no
conventional model for impulse noise characteristics. In most of the literature the
noise models for telephone networks are used to model impulsive noise
characteristics [144] – [147].
In these works, usually Laplace probability density function (PDF) is employed to
estimate the impulse magnitude and as a result of laboratory measurements, impulse
magnitudes are observed to be approximately 10 dB to 40 dB above the average
background noise level. These levels of noise have strong destructive effects on bit
transmission, causing potential failures in communication [145].
Hooijen approximates the time duration of impulse by a double lognormal PDF,
which originates for the corresponding noise models for telephony networks [139].
The mean value was reported to be 100 µs, still the time and location dependency
was mentioned as a parameter that should be considered. Although the impulses
originate from various and uncorrelated sources, interarrival time which is inversely
related to the frequency of occurrence can be modeled by the Poisson distribution as
f1(t) ≈ λe-λt for λ being the mean frequency of occurrence of the impulse noise for
0 0,5λ≤ ≤ impulses per second [142].
The impulsive noise will be investigated under three sections: asynchronous
impulsive noise, periodic impulsive noise synchronous to the system frequency
(harmonic noise) and the periodic impulsive noise asynchronous to the system
frequency.
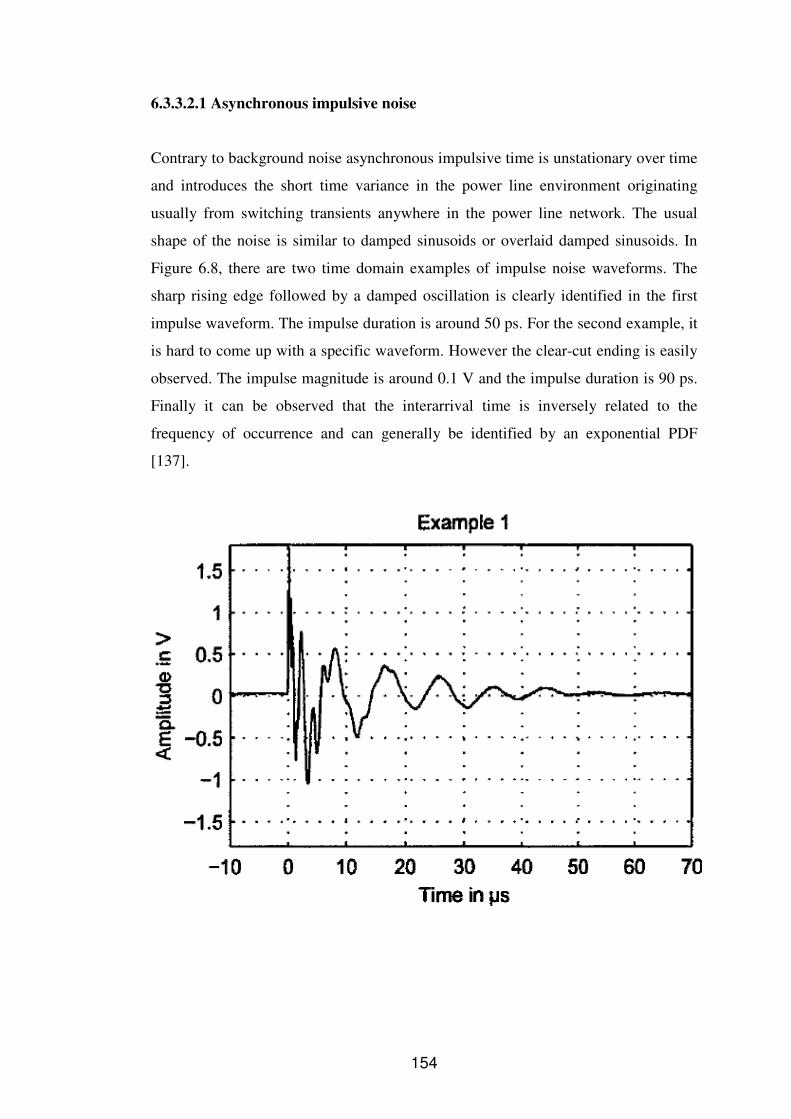
154
6.3.3.2.1 Asynchronous impulsive noise
Contrary to background noise asynchronous impulsive time is unstationary over time
and introduces the short time variance in the power line environment originating
usually from switching transients anywhere in the power line network. The usual
shape of the noise is similar to damped sinusoids or overlaid damped sinusoids. In
Figure 6.8, there are two time domain examples of impulse noise waveforms. The
sharp rising edge followed by a damped oscillation is clearly identified in the first
impulse waveform. The impulse duration is around 50 ps. For the second example, it
is hard to come up with a specific waveform. However the clear-cut ending is easily
observed. The impulse magnitude is around 0.1 V and the impulse duration is 90 ps.
Finally it can be observed that the interarrival time is inversely related to the
frequency of occurrence and can generally be identified by an exponential PDF
[137].

155
Figure 6.8: Time domain signal of two impulse events REF an analysis of the
broadband noise scenario in powerline networks [137]
Some other considerable aspects of types of impulse noise are the impulse energy
and the impulse power. Taking interarrival time tarr and the impulse width tw, and
using the time domain signal waveform nlmp (t), the impulse energy is calculated as
Eimp [137]
arr
2( )w
arr
t t
imp imp
t
E n t dt
+
= ∫ (6.11)
As seen above, the impulse energy is affected by impulse width as well as the signal
waveform and course. That is why in order to compare the impact of an impulse
noise with that of a background noise, the mean power of the noise is more
appropriate. The impulse power can similarly be calculated as; [137]

156
arr
21( )
w
arr
t t
imp imp
w t
P n t dtt
+
= ∫ (6.12)
The mean power of a sample of a background noise signal n(t) over an observation
time TB is;
2
0
1( )
BT
N
B
P n t dtT
= ∫ (6.13)
The impulse energy and impulse power are the two explanatory measures of the
asynchronous impulsive noise effects on a channel. The mean power distributions of
background and impulse waveforms draw a picture of the dynamic change of the
noise scenario during an impulse event.
Moreover, it is interesting to observe that the instantaneous noise amplitude of
asynchronous impulsive noise is positively related with the absolute instantaneous
voltage of the power line. Switching devices in some appliances such as thyristors,
emit asynchronous impulsive noise when they turn on. This type of noise occurs at
different timings for different appliances. However the noise amplitude is larger
when the thyristors commutate under higher instantaneous voltage as seen in Figure
6.9.

157
Figure 6.9: The amplitude of the instantaneous asynchronous impulsive noise
increases with the absolute instantaneous value of the power line voltage [148]
6.3.3.2.2 Periodic impulsive noise synchronous to the mains frequency
(harmonic noise)
The major sources of this type of noise are the switching power supplies, power
converters, and silicon controlled rectifiers that switch on and off at system
frequency, generating noise waveforms at the higher harmonics of the system
frequency [137].
The odd harmonics are usually monitored to be more dominant. Depending on the
energy of the individual impulses, periodic impulsive noise usually causes
destruction of one or several coincident bits during transmission. Besides, for phase
angle control devices such as light dimmers, impulsive noise synchronous at twice
the power line frequency can usually be observed. When this type of noise occurs,
the bit error rate increases drastically. The solution may be choice of a more
appropriate coding technique [105], [138], [142].
Another important point is that, some relatively old studies indicated that this type of
noise attenuates very fast as frequency increases, becoming harmless at the

158
frequencies of interest. However practical experiments prove the opposite. The
dimmers generate both odd and even harmonics of 50 Hz that can severely disturb
the PLC network [105], [149], [150].
In order to get a more detailed understanding of the periodic impulsive noise in
power line conductors, the following experiment was carried out in
Telecommunication Research Laboratories (TR Labs) of University of Saskatchewan
[151].
Figure 6.10: Noise in the 50 – 500 KHz range [152]
The noise bursts are observed during each half cycle of the system frequency (60 Hz
in this case). The first burst is at the zero crossing when the fluorescent lights are
extinguished are reignited. The second and third bursts occur when the power supply
rectifiers begin and stop conducting. What makes this noise synchronous is the fact

159
that the noise burst stay in fixed positions relative to the 60 Hz zero crossings in each
cycle. In other words, noise synchronous to power system frequency can be
considered as a train of noise impulses in the time domain, arriving in every
1/k*fsystem seconds, with k an integer, usually k=1 or k=2. The spectrum of this type
of noise is composed of a series of harmonics of the k*fsystem fundamental
component.
6.3.3.2.2.1 Byte Errors Originating From the Impulsive Noise Synchronous to
the System Frequency
Depending on the energy of the individual impulses, periodic impulsive noise
synchronous to the system frequency usually causes destruction of one or several
coincident bits during transmission. Furthermore, the synchronous impulsive noise
that occurs at twice the system frequency can increase bit error rate drastically.
A measurement system composed of half duplex 60 kb/s FSK modems with mark
and stop frequencies at 150 and 250 kHz respectively was established to investigate
the time slot quality and the transmission errors originating from the noise in power
line channels [152], [153]. Asynchronous transmission was used so that the clock
recovery of receivers is not an issue to be considered. The transmitter and receiver
microcontroller was utilized for 10-bit universal asynchronous receive transmit
(UART) serial data communication. The data block of the UART was composed of a
start bit, an 8-bit information byte and a stop bit.
Firstly, the transmitted data was kept constant and the same data was sent several
times from receiver to transmitter in order to study the quality of transmission. As the
sent data packet is constant and known by the receiver, the correctness of the data
was checked easily. The microcontroller in the receiver was programmed to set an
output pin to high (+5V), if an error in any byte is received. If the data is correctly
received, the output of the microcontroller remained low. The output of the
microcontroller was connected to an oscilloscope set and the sensitivity was set to 1
V/div.

160
Clearly, the received signal & noise and the byte errors traces (second and third
traces) indicate that the byte errors occur simultaneously with the noise bursts.
Figure 6.11: Synchronous noise and errored timeslots [152]
In order to investigate the transmission characteristics of the line and apply the time
transmission protocol, the power line cycle which has a period of 16.67 ms (for a
system frequency of 60 Hz) was divided into 16 intervals. Each time interval
corresponds to approximately 1 ms. The microcontrollers were synchronized with the
60 Hz power line zero crossings. The errors were recorded in each cycle and the bit
for the byte errors was set to high in case of an error in that timeslot in the previous
cycle. The trace corresponding to the timeslot errors uses the averaging function of
the oscilloscope to calculate the average number of timeslot errors.

161
6.3.3.2.2.2 Timed Transmission Protocol and the Resulting Time Slot Quality
6.3.3.2.2.2.1 Master-Slave and Channel Identification
The timed transmission protocol aims to calculate the predictable error
characteristics and increase the efficiency of the power line channel. The proposed
model uses a protocol with one master and up to 15 slaves. The master controls all
the data transfer and slaves do not transmit without the permission of the master. The
carrier sensing and collision detection algorithms are unnecessary in this case as the
master controls all the data traffic. The purpose of this protocol is to able to
determine, control and communicate the timeslot quality information and increase
the system efficiency. This is achieved by the centralized communication
architecture composed of the master and slaves. A threshold is determined for the
number of errors in a timeslot. Each slave monitors the data number of errors in the
data they receive and they store this information in their timeslot tables. If the
number of errors exceeds a predefined limit, the slaves identify this time slot as
BAD. The timeslot information refreshed every 10 seconds by the polling operation
of the master. During this polling operation, slaves respond to the master with a
request to send (RTS) and/or information on BAD timeslots. When the slave
completes the polling operation for all the slaves, it finds the intersection of the
GOOD timeslots which is the candidate timeslot for a lossless communication. Note
that, if a timeslot is identified to be BAD by at least one slave, this timeslot is marked
as BAD in the master timeslot table which is later broadcast to all the slaves.
Following that, the master begins to give clear to send (CTS) command to slaves that
requested channel access with the RTS. The CTS specifies a number of power cycles
the slaves are given permission to communicate and the slaves can only have channel
access in the GOOD timeslots in these power line cycles. On the other hand, the
master broadcast special “check” packets in the BAD power cycles and continues to
refresh the information to detect the GOOD and BAD timeslots [154]. Figure 6.12
below exemplifies the algorithm with the master and two slaves.

162
Figure 6.12: The master and slave polling algorithm [152]
As expected, there is no master table and no information about the channel in the
beginning. So the master broadcasts “check” packets to all the slaves for 10 seconds
and slaves screen the quality of reception. Then the master polls each slaves and
collect the slot quality (SQ) and/or request to send (RTS) from the slaves. As the
polling command is critical to decide the quality of communication for the following
cycles, the master sends polling commands during all 16 timeslots of one full cycle.
Furthermore, the master demands to receive at least two successful transmissions to
make certain of the GOOD and BAD timeslots. The algorithm is completed when the
master composes the master timeslot, broadcasts it to all the slaves and begins to
send out CTS. After 10 seconds, the master begins to poll each slave again.
6.3.3.2.2.2.2 Packet Data Transmission
In the case that the message length exceeds one timeslot, acknowledge (ACK)
strategy is employed. If the message is to be sent over a series of timeslots, the
timeslot following the data transmission is used for sending an ACK message. A
similar protocol called stop and wait protocol is studied by Zheng and Akhtar [155].
In this protocol, after sending the message, the sender stops and waits for an
acknowledgement from the receiver. If acknowledgement is not received in the next

163
timeslot, the packet is retransmitted. However, duplicate retransmission can occupy
the channel unnecessarily. To prevent this problem, a sequence bit is used in the
packet against duplicate transmissions. If the packet sent is a retransmitted one, the
sequence bit is kept constant. If the packet is a new one, the sequence bit is toggled.
The receiver detects the sequence bit and if the sequence bit is the same for the two
packets received, the receiver ignores the retransmission. This is possible if an ACK
packet is lost.
Figure 6.13: The packet format [152]
The packet format is demonstrated. The first 8 bits are error checking bits (an 8-bit
CRC). Then the bits for destination, source and type information follows
respectively. For the transmission protocol, the packets cover one millisecond
timeslots. As a result the data rate determines the number of bits transmitted per
packet. For the design explained above, the data rate is 60 kb/s, consequently 60 bits
(32 overhead and 28 data bits) are transmitted per packet. 28/32 is not a good data to
overhead ratio however data rates can be increased via a more efficient modulation.
6.3.3.2.2.3 Protocol Performance
Ackerman, Dodds and Mc Crosky performed a test to relate the transmission
efficiency with the number of slots used. For the case, all the 16 timeslots are used
and no data error occurs, then the efficiency is 1.0. If only the half of the channel is
used and again no data error occurs, then the efficiency is 0.5. In practice, when the
noisy time slots are employed, the data errors lead to lower efficiency. The test was
initially performed without a timed transmission protocol. The two cases studies
were for message lengths of 5 and 15. An additional byte was allocated for ACK.
The principle is that in the beginning only the low error ratio timeslots were used and
the high error ratio timeslots were employed only after all timeslots were spent.

164
Figure 6.14: Efficiency vs. timeslots used [152]
The Figure 6.14 demonstrates the efficiency vs number of time slots used for
message lengths of 5 and 15. Note that there is a minor deviation from the ideal case
until the high error ratio timeslots are benefited. When the high error ratio timeslots
are employed, the probability of corruption increases. Moreover, the corruption is
more dominant for the longer message as the probability of employing the bad
timeslots is higher. In conclusion, when the number of timeslot (the probability of
bad timeslots occupied) increases, the efficiency decreases.
6.3.3.2.2.3.1 Identification of Bad Time Slots
In order to investigate the accuracy of detection of the noisy (BAD) timeslots, a test
was performed under the effect of noises originating from power supply rectifiers
and a lamp dimmer.

165
Figure 6.15: Lamp dimmer in the dim position [156]
The first trace is the 60 Hz mains signal. The one below is the GOOD/BAD timeslots
identified according to the third trace which is the received signal including the
noise. These traces were taken after the master and slave were given sufficient time
to detect BAD timeslots and develop a timeslot table. Two BAD time slots
corresponding to the noise caused by the lamp dimmers were detected [144]
6.3.3.2.2.3.2 Performance with two bad time slots
Data throughput is commonly used to determine the efficiency of a communication
protocol. The throughput is the ratio of the data received to the transmission capacity
of the channel. In this case, the ACK packet that the receiver responds back is also
considered for the messages of all lengths. ACK packet apparently limits the
throughput by occupying a packet for data packet transmitted. Thus, a message of

166
length one timeslot has a throughput of 0.5 if no errors occur. If the message length
increases the throughput gradually approaches 1.0. For each data error, the receiver
asks for a retransmission and the throughput decreases.
Figure 6.16 Throughput vs. message length (2 BAD slots) [156]
The Figure 6.16 above illustrates the throughput vs. message lengths for 4 different
cases. For an ideal channel, there are no data errors and all timeslots are used. For the
case that, two timeslot are noisy and the remaining ones are GOOD, the throughput
is 14/16=87.5 %. The channel for two bad timeslots in a cycle is called ideal adapting
channel. However, in a practical channel, GOOD timeslots, that are eligible to be
used for transmission, will have some noise and data retransmission will be required
which reduces the throughput. Without adapting, the throughput peaks at 0.65 for
message length of 5 and as the message length is increased, the throughput decreases
steeply. For the actual adapting case, the throughput maintains a rather stable pattern
even for longer message lengths.
The adaptation to changing noise conditions is also important for the performance at
the timed transmission algorithm. A lamp dimmer is used to exhibit the adaptation

167
capability of the protocol to changing noise conditions. In the Figure 6.17, it was
expressed that the two of the four disturbances were due to a lamp dimmer placed in
the low position. In the Figure 6.18, the noise characteristics of the channel were
transformed as the lamp dimmer was adjusted to high position. The algorithm
successfully detected the new condition as the master and slave reassessed the
timeslot quality and reorganized the master timeslot table. As a result, the two of the
BAD timeslots are placed in different positions.
Figure 6.17: Lamp dimmer in the dim position [156]

168
Figure 6.18: Lamp dimmer in the bright position [156]
6.3.3.2.2.3.3 Performance with Four Bad Timeslots
The performance for four bad time slots was studied with a similar test hardware
implemented with the lamp dimmer. The ideal, adapting and non adapting
throughput characteristics are demonstrated in Figure 6.19. For the non-adapting
case, the throughput characteristic reaches a peak of 0.5 at a message length of 3 and
declines sharply afterwards. The adapting algorithm improves the throughput
characteristic with a peak of 0.7 and maintains a consistent throughput through the
range of message lengths. For the case of four timeslots, the difference between the
ideal channel curve and the adapting channel curve is higher than the case for the two
timeslots. This is a result of the fact that for the case with four time slots, only 12/16
of the channel capacity is utilizable.

169
Figure 6.19: Throughput vs. Message Length [156]
6.3.3.2.2.4 Optimum Error Threshold
Optimum error threshold is defined as the limit for the percentage of errors to
determine whether a timeslot is GOOD or BAD. Considering only one timeslot is
causing all the errors, the rest of the channel (15/16) is employable. For short
messages that each timeslot only once in every transmission, a BAD timeslot is
expected to have a success rate higher than 15/16 in order to be considered as
GOOD. Then the threshold for this case is 1 – 0.9375 = 6.25%. Likewise, for two
BAD timeslots, threshold is 6.7%. If the message is longer and uses each timeslot
twice, then the one BAD timeslot error threshold is 1 – (0.9375)*(0.9375) = 3.2%.
Consequently, for the case that all the errors are caused by a single timeslot and all
other timeslot being error free, the equation of error threshold to determine a timeslot
bad is as follows; [152]

170
#( )
1# 11 ( )
#
GOOD
messagelenght
opt
GOODTh
GOOD
+−= − (6.13)
For error rate above this, the timeslot is marked as BAD; for an error rate below this,
the timeslot is determined to be GOOD.
6.3.3.2.3 Periodic impulsive noise asynchronous to mains frequency
As stated before, periodic impulsive noise asynchronous to frequency is not a very
common kind of noise and most literature classify this type of noise under
asynchronous impulsive noise as it does not synchronize with the mains frequency
and its source _ usually switching power supplies (switch-mode power supplies)_ is
not clearly identified for most of the cases.
Switching power supplies are used in various electronic devices such as PCs and
electronic fluorescent ballasts and they inject a noise rich in the harmonics of the
switching frequency to mains line. As the switching frequency of power supplies is
different from the system frequency, the resulting harmonics of the switching power
supply frequency is asynchronous to the mains frequency. The repetition range
changes between 50 Hz to 200 kHz which leads to a spectrum of discrete lines with a
frequency range depending on the repetition rate [157].
Figure 6.20 is a common example of periodic impulsive noise that occurs due to the
switching power supplies. Those semi-deterministic periodic pulses, that are periodic
during a certain interval of time with a frequency around several hundreds of kHz,
can be identified in certain phases of the cycle.
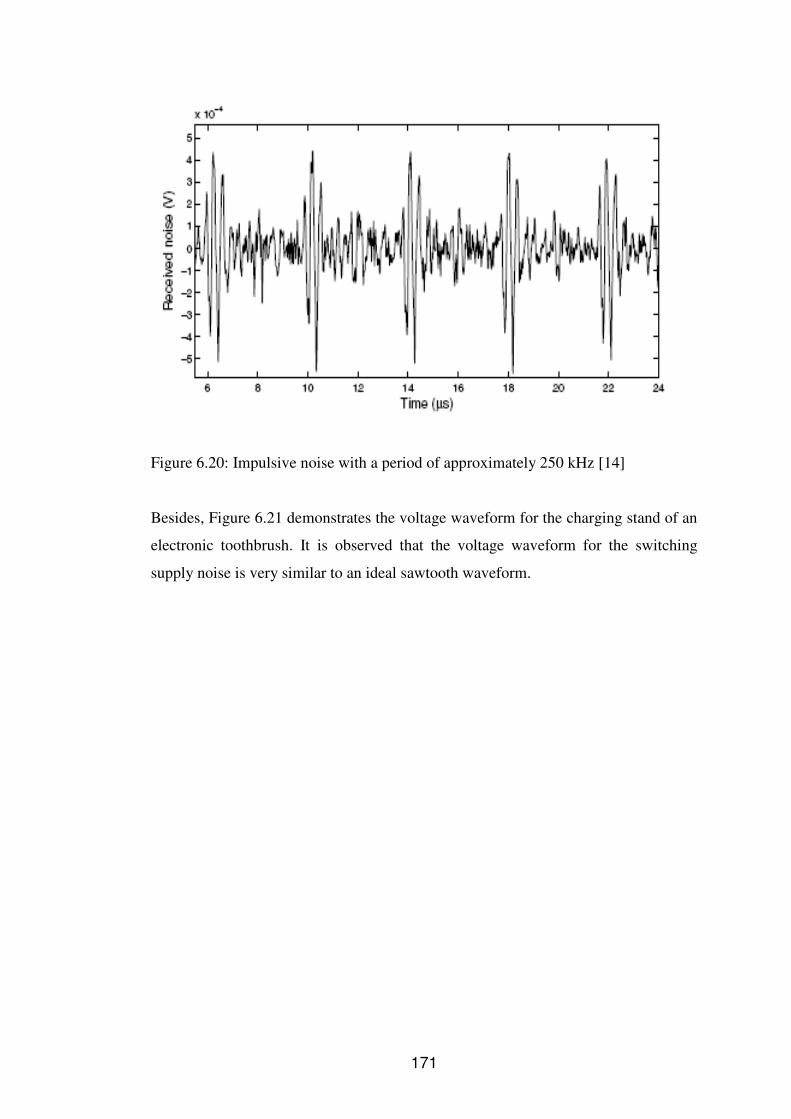
171
Figure 6.20: Impulsive noise with a period of approximately 250 kHz [14]
Besides, Figure 6.21 demonstrates the voltage waveform for the charging stand of an
electronic toothbrush. It is observed that the voltage waveform for the switching
supply noise is very similar to an ideal sawtooth waveform.

172
Figure 6.21: Noise from electric toothbrush charging stand [14]
Other examples for periodic impulsive noise asynchronous to frequency are power
line intercoms and baby monitors. These devices operate between 150 kHz to 400
kHz and they inject signals of several volts peak to peak on the power line. Figure
6.22 shows the voltage spectrum of a power line intercom.
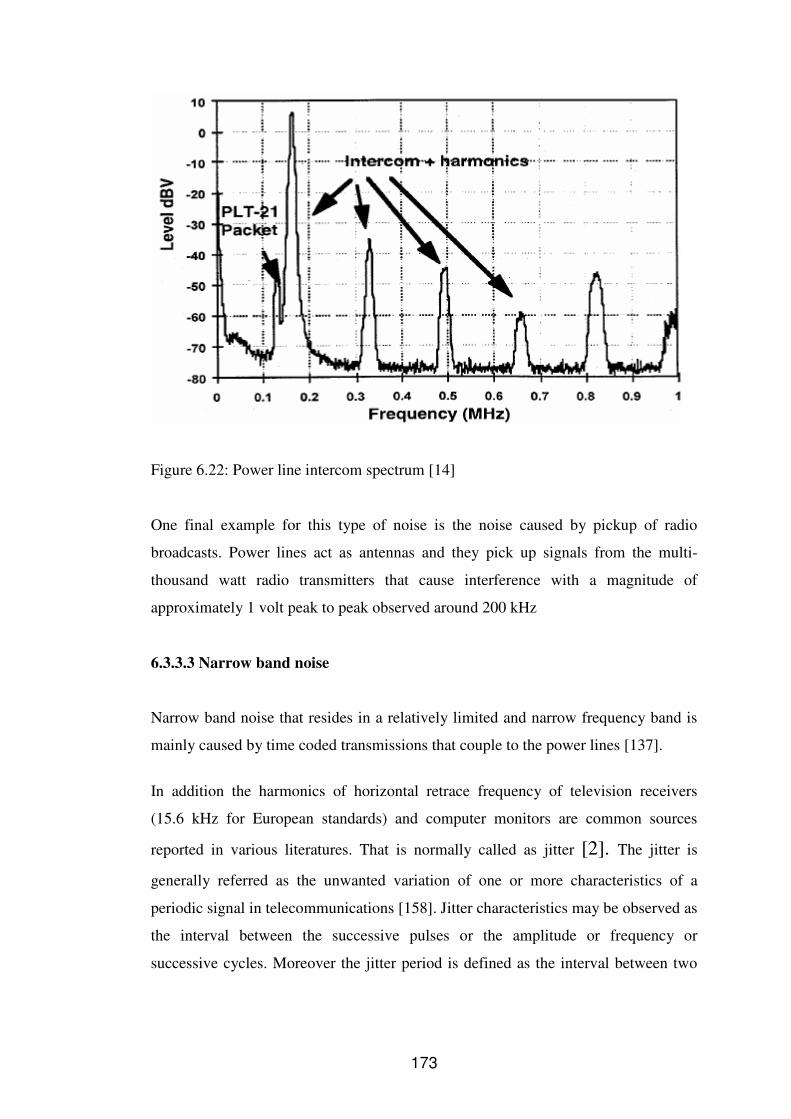
173
Figure 6.22: Power line intercom spectrum [14]
One final example for this type of noise is the noise caused by pickup of radio
broadcasts. Power lines act as antennas and they pick up signals from the multi-
thousand watt radio transmitters that cause interference with a magnitude of
approximately 1 volt peak to peak observed around 200 kHz
6.3.3.3 Narrow band noise
Narrow band noise that resides in a relatively limited and narrow frequency band is
mainly caused by time coded transmissions that couple to the power lines [137].
In addition the harmonics of horizontal retrace frequency of television receivers
(15.6 kHz for European standards) and computer monitors are common sources
reported in various literatures. That is normally called as jitter [2]. The jitter is
generally referred as the unwanted variation of one or more characteristics of a
periodic signal in telecommunications [158]. Jitter characteristics may be observed as
the interval between the successive pulses or the amplitude or frequency or
successive cycles. Moreover the jitter period is defined as the interval between two
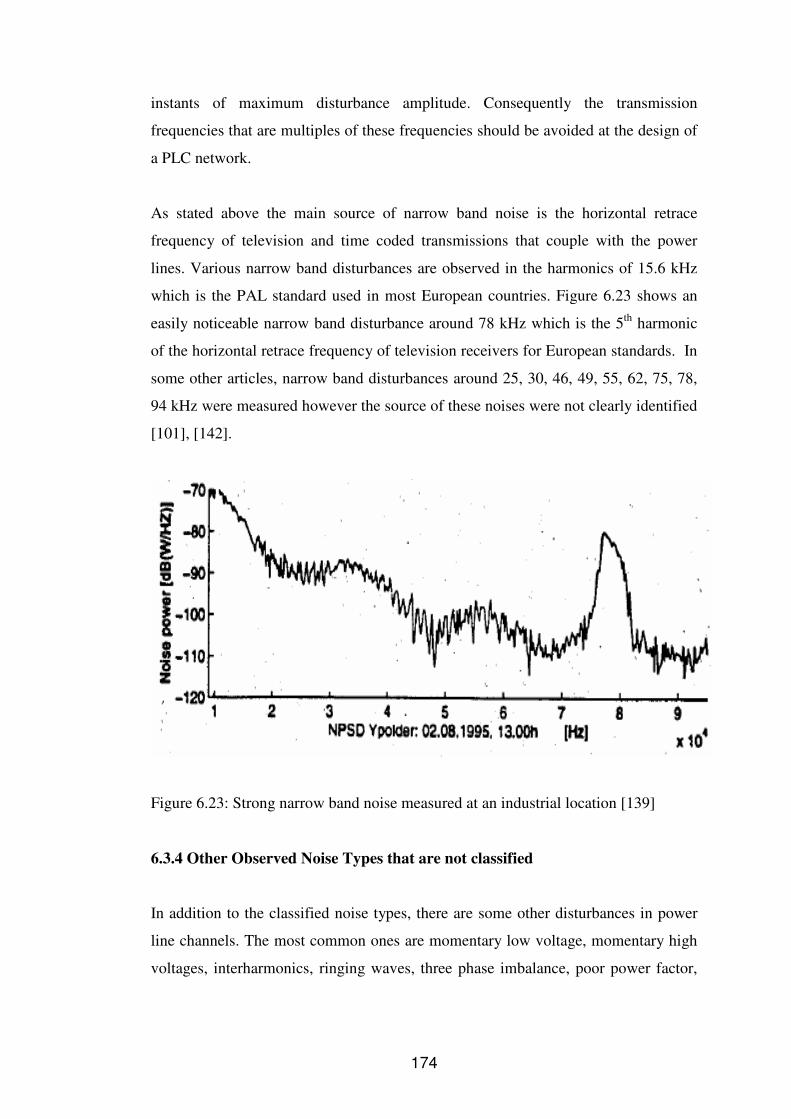
174
instants of maximum disturbance amplitude. Consequently the transmission
frequencies that are multiples of these frequencies should be avoided at the design of
a PLC network.
As stated above the main source of narrow band noise is the horizontal retrace
frequency of television and time coded transmissions that couple with the power
lines. Various narrow band disturbances are observed in the harmonics of 15.6 kHz
which is the PAL standard used in most European countries. Figure 6.23 shows an
easily noticeable narrow band disturbance around 78 kHz which is the 5th harmonic
of the horizontal retrace frequency of television receivers for European standards. In
some other articles, narrow band disturbances around 25, 30, 46, 49, 55, 62, 75, 78,
94 kHz were measured however the source of these noises were not clearly identified
[101], [142].
Figure 6.23: Strong narrow band noise measured at an industrial location [139]
6.3.4 Other Observed Noise Types that are not classified
In addition to the classified noise types, there are some other disturbances in power
line channels. The most common ones are momentary low voltage, momentary high
voltages, interharmonics, ringing waves, three phase imbalance, poor power factor,

175
and notches. All of these disturbances may cause some power quality problems in the
system [159].
Momentary low voltage may have two major effects on the power line channel. If the
voltage goes too low for some period of time, the metering nodes may reset and lose
communications with the host. In this case, either retransmission is initiated or if the
cut off is more than the tolerable duration, the actual data in the process of
transmission could be lost. As a result, the metering units should be resistant to long
periods of low or no voltage without losing its memory and should be able to initiate
self-restarting and retransmission procedures when necessary. The momentary high
voltages have similar effects to the system and may also be harmful to the
components of the device. Therefore, the device components should be able to
withstand possible surges on the distribution system. Furthermore, interharmonics,
which are the frequencies corresponding to the non-integer multiples of the power
frequency, should be taken into consideration. If the magnitudes of the harmonics
and the interharmonics are high enough in the transmission frequency band of the
system, data could be lost or sent incorrectly. Consequently, the PLC based AMR
devices and host computers should be able to discern the waveform signatures of
their devices and the system devices that produce harmonics and interharmonics.
In addition to the sources of harmonic noise, the following are some major sources of
harmonics and interharmonics: [160]
• Rotating AC Machines
• Fluorescent Lighting
• Glow Discharge Lighting
• Static VAR Compensators
• Static Watt Compensators
• Overexcited Transformers
• Transformer Magnetizing Current
• Adjustable Frequency Controls, Drives
• Adjustable Speed Controls/Drives
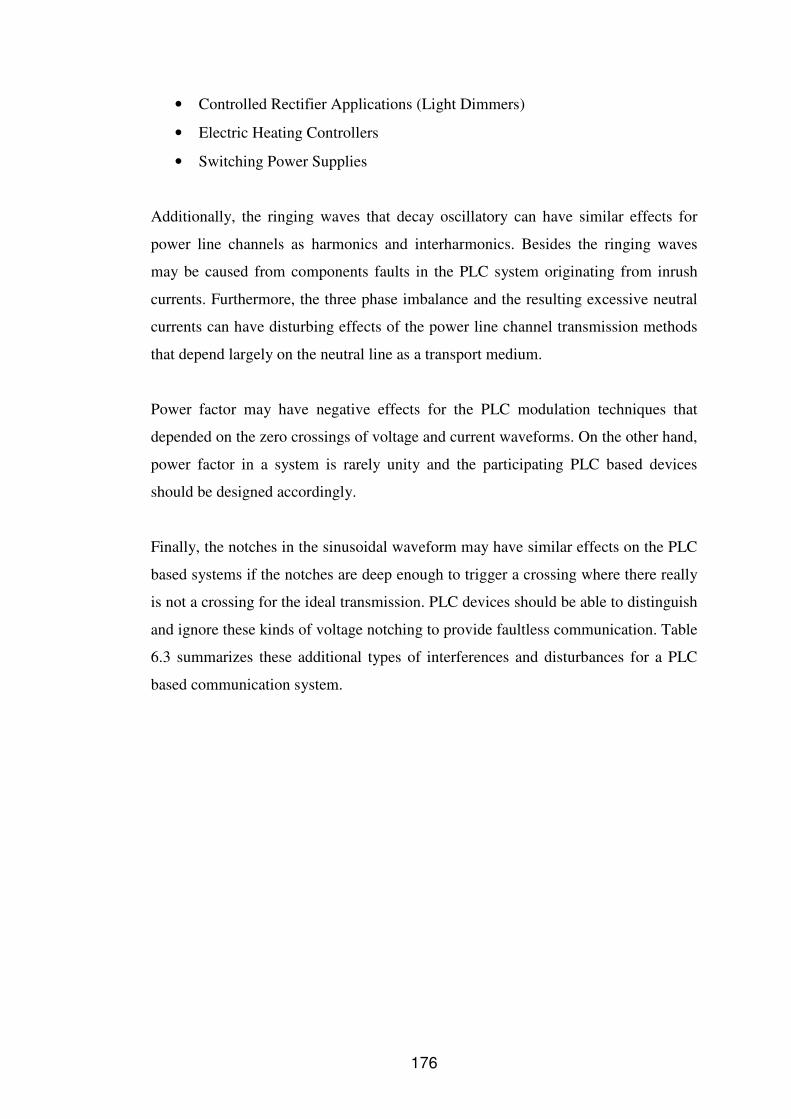
176
• Controlled Rectifier Applications (Light Dimmers)
• Electric Heating Controllers
• Switching Power Supplies
Additionally, the ringing waves that decay oscillatory can have similar effects for
power line channels as harmonics and interharmonics. Besides the ringing waves
may be caused from components faults in the PLC system originating from inrush
currents. Furthermore, the three phase imbalance and the resulting excessive neutral
currents can have disturbing effects of the power line channel transmission methods
that depend largely on the neutral line as a transport medium.
Power factor may have negative effects for the PLC modulation techniques that
depended on the zero crossings of voltage and current waveforms. On the other hand,
power factor in a system is rarely unity and the participating PLC based devices
should be designed accordingly.
Finally, the notches in the sinusoidal waveform may have similar effects on the PLC
based systems if the notches are deep enough to trigger a crossing where there really
is not a crossing for the ideal transmission. PLC devices should be able to distinguish
and ignore these kinds of voltage notching to provide faultless communication. Table
6.3 summarizes these additional types of interferences and disturbances for a PLC
based communication system.

177
Table 6.3: The most common disturbances and power quality issues that are not
classified conventional noise types in low voltage PLC systems [160]
Selected Characteristics of Power Quality Issues
Issue Duration Frequency
Characteristics
Occurrence Typical Causes
Momentary
Low Voltage
(Sags)
Transient Low Frequency
Components
In Networked
Systems or
in Radial
Systems Fed
by
Networked
Systems
Remote Faults
Momentary
High Voltage
(Spikes, Swells)
Transient High Frequency
Components
Due to
Lightning, and
Inductive
Circuit
Switching
Lightning,
Switching,
Improper
Grounding
Harmonics Steady
state
Generally
Confined to Odd
Integer Multiples
of the
Power Frequency,
Usually
Third, Fifth,
Seventh,
Eleventh, and
Thirteenth
Harmonics
In Load
Currents for
Solid
State Switched
Loads (For
Example,
Adjustable
Speed Drives,
Compact
Fluorescent
Lamps)
Solid State
Switched
Loads,
Nonlinear loads,
Adjustable
speed drives,
Rectifiers,
Inverters,
Fluorescent
lamps
Interharmonics Steady
state
Non-integer
Multiples of the
Power Frequency
In Load
Currents for
Devices as a
Solid State
Switched
Loads with
178
Result of
Asynchronous
Switching,
Non-Linear
Effects and
Aperiodicity
Problems,
Adjustable
Frequency
or other Control
Malfunction
Ringing Waves
(Decaying
Oscillatory)
Transient A Transient High
Frequency
(For Example, -
17"
Harmonic)
Capacitor
Switching,
Transformer
Energization
Inrush Current,
Shunt
Capacitors
Three Phase
Unbalance,
Neutral Current
Steady
state
Power Frequency
Three-phase
Systems
Unbalanced
Load,
Improper
Grounding,
Unbalanced
Voltage Supply
Poor Power
Factor
Steady
state
Power Frequency Power System
Where
Reactive
Power is
Either
Too Far
Leading or
Lagging
Either Too
Much
Reactive Power
from
Correction
Devices or
Too Little
Reactive
Power from
Customer
Equipment
Notches in
Sinusoidal
Wave
Steady
state
High Frequencies Due to
Switching of
Inductive
Circuits Using
Adjustable
Speed
Drives

179
Solid State
Switches
Radio frequency Steady
state
High-frequency
(e.g., f > 500
kHz) sinusoidal
signals
of typically low
amplitude
impressed on the
power
frequency
Radio
transmitters
6.3.5 Power Line Coupling
In order to avoid impedance mismatch and obtain galvanic isolation and voltage
scaling, power line coupling methods should be employed for the connections
between the power line and the measurement device. The benefits of line coupling
will be analyzed in detail in Chapter 7 where the experimental results are described.
In general, there are two different types of signal coupling for power lines:
differential or line to neutral mode [14], [102], [161].
Obviously, the line to neutral method can be used if the neutral line is available,
which is not always the case for residential applications. Line to neutral coupling, or
common mode in some literature, makes use of the ground wire as the second
terminal. This method is favorable in the sense that the neutral line, which is the
return path for the entire noise component in the power line, has less attenuation and
less noise. Still, this method has some potential dangers and may suffer from some
safety regulations. Consequently, most producers use the first method, differential
coupling [162].

180
Additionally, the signal transfer between the two phases should be investigated.
Considering the fact that, the interwiring capacitance is negligible and that the
distribution transformer is not designed for the high frequencies used for power line
communication, other methods of signal transfer should be put into practice. The first
solution is a sizable load connected between the terminals L1 and L2 to increase the
signal transfer rate. However, the reliability of the system can not depend on the
presence of such loads as they may not be always connected to the system. Thus, a
different solution should be employed. A capacitor selected according to the used
frequency would be an appropriate solution. However, this method is not favorable if
there are communication nodes operating between the two lines because the
capacitor will shunt the voltage signal to be sent or received by this node. The typical
solution to this situation is illustrated in Figure 6.24. This coupling circuit has a fairly
low attenuation path of approximately 3 dB for the signal transmitted between the
phases.
Figure 6.24: Recommended Phase Coupling Circuit [2]
Usually the method for injecting the signal at the desired frequency is to capacitively
couple the transceiver’s output to the power line. The transformer is utilized for
safety reasons. In addition, some manufacturers use nonisolated circuits to decrease
the transfer loss. Considering that the transformers inductance and the related
capacitance for an LC circuit, the transformer’s inductance should be calculated in
such a way that the resulting LC circuit behaves as a high pass filter for the

181
transmitted signal. An additional isolation is required to minimize the attenuation due
to the different loads connected to the power line (especially the switching power
supplies that has EMI filtering). For this purpose, at the frequency of interest, the
inductance of the power line is usually sufficient as the line impedance is about 10 Ω
per 100 feet. Thus, moving the node a few meters away from the load is enough to
solve the problem.
The Figure 6.25 below is a generic topology that is employed to couple the
communication circuit to the power line. The different protocols of different
manufacturers use the variations of this topology.
Figure 6.25: Transformer Isolated Coupling Circuit for Power Line Communications
[2]
As the X-10 protocol uses the zero crossing detection, additional circuitry is used to
perform the task. Figure 6.26 is the proposed coupling circuit for the X-10 protocol
[163].

182
Figure 6.26: Power Line Coupling Circuit found in X-10 Devices [2]
On the other, Intellon that uses CEBus protocol proposes a power amplifier to boost
the spread spectrum signal before coupling it to the power line [164]. Amplifier
produces a 6Vp-p into a 10Ω load and in this way increases the performance under
low line impedance conditions. The CEBus protocol uses the frequency spectrum
from 100 to 400 kHz. Thus, a bandpass filter must be added to the coupling circuit.
On the other hand, a wide frequency window makes the system more vulnerable to
noise interference and the filter design specifications become more demanding.
However, as the spread spectrum technology uses only a portion of the signal for
detection, the receiver becomes more resistive to these kinds of impairments. Figure
6.27 shows the coupling circuit for a CEBus device designed by Intellon.

183
Figure 6.27: Power Line Coupling for CEBus Devices suggested by Intellon Corp [2]
The power line transceivers of the LonWorks network function on a narrower
frequency band compared to the CEBus devices. Figure 6.28 is the demonstration of
the power line coupling circuit of the Echelon’s PLT-21 transceiver [164].
Figure 6.28: Coupling Circuit for LonWorks PLT-21 Transceiver

184
Capacitors C1 and C2 are supposed to have low impedance values for the
transmission frequency band of 125 – 140 kHz. As the output impedance of the
transceiver is around 1 Ω, the capacitors are selected to have impedance of the same
order at the frequency of interest to minimize the overall output impedance of the
circuit. However this condition entails a large capacitance value and the C1 that is
connected to the power line might need to be expensive for volume protection. Again
the transformer’s inductance and the capacitor form a LC circuit with C1. This series
resonant circuit should be tuned accordingly to the frequency of the transceiver. On
the other hand, the RLC circuit formed by R2, L2 and C4 is necessary when the
power line node includes triacs and SCR’s or operates below 12 Vdc. Moreover, the
capacitor C3 regulates the overvoltages that may result from system transients.
6.4 CONCLUSION
In this chapter, the noise types for power line communication channels are
investigated. The conventional classification is presented, accompanied by other
types of disturbance and interferences that are commonly observed.
The conventional classification includes (colored) background noise, asynchronous
impulsive noise, periodic impulsive noise synchronous to the system frequency
(harmonic noise), periodic impulsive noise asynchronous to the system frequency
and the narrow band noise. The (colored) background noise, narrowband noise and
the periodic impulsive noise asynchronous to system frequency are usually
summarized as background noise in most literature. The root mean square (rms) of
these three types of noises usually varies slowly over time. These three types of noise
are mostly stationary over periods of seconds, minutes or even hours. The other two
types of noise, asynchronous impulsive noise and periodic impulsive noise
synchronous to mains frequency (harmonic noise) are time variant. Their PSDs are
considerably higher and they cause bit errors in transmission. To sum up, in most
cases the power-line noise can be considered as a superposition of the background
noise and the impulsive noises from all nearby appliances. Further detail will be

185
given about these noise types and the theoretical studies will be verified with
experiments in the following chapter.
186
CHAPTER 7
EXPERIMENTAL RESULTS OF THE CLASSIFIED NOISE TYPES FOR
POWER LINE CHANNEL
7.1 EXPERIMENTAL SETUP
For the purpose of conducting the laboratory experiments and verifying the
theoretical studies in the preceding chapters, two separate experiments were carried
out in METU, Electrical and Electronics Engineering Department, Electrical
Machines and Drives Laboratory and R&D Laboratories of MAKEL facilities in
Hadımköy.
In both of the experimental setups, single phase voltage of the mains line was
observed and logged. Measurements were made between the phase and neutral using
the nearest socket to the incoming mains cable to the laboratory. All sources of
locally generated interference were either suppressed or switched off during the
measurement period. The interference measured was either generated in laboratory
building and adjacent buildings and then transmitted by the network, or in the case of
broadcast signals, picked up by the network and the wiring of all the buildings
connected to it. The mains voltage was initially measured without any devices
connected in order to identify the background noise. Then various noise sources were
connected one by one and related waveforms were logged both using a spectrum
analyzer and two different data acquisition devices. The experimental system
diagram is illustrated in Figure 7.1.

187
Figure 7.1: Schematic representation of the measurement setup used for the noise
measurement.
The schematic in Figure 7.1 is applicable for field testing. In the laboratory
experiments, slight changes are made on the design. In the experiments conducted in
METU laboratories, the time domain data of voltage was logged by using a digital
oscilloscope, Lecroy 6050A. Logged data was both processed in the time domain to
observe the instantaneous changes and transferred to PC to be converted to frequency
domain for further analysis.
During the experiments in MAKEL laboratories, first online characteristics in
frequency domain were observed by using a spectrum analyzer, Agilent N9320A.
Following that mains voltage data was logged to a digital data acquisition device
Wavebook with a resolution of 16 bits, via a high impedance voltage probe. Digital
data was transferred to PC and converted to frequency domain to be analyzed
accordingly. Below are the technical specifications of data acquisition devices used
throughout the experiments; Wavebook 516E and Lecroy 6050A.
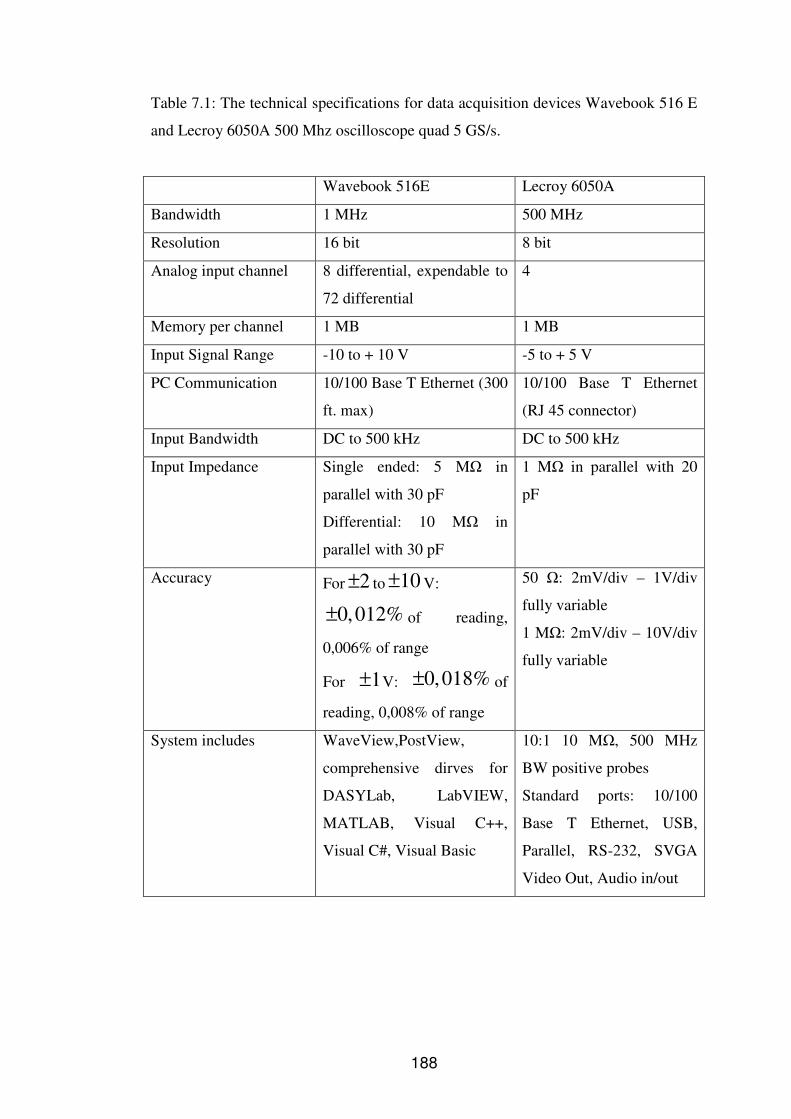
188
Table 7.1: The technical specifications for data acquisition devices Wavebook 516 E
and Lecroy 6050A 500 Mhz oscilloscope quad 5 GS/s.
Wavebook 516E Lecroy 6050A
Bandwidth 1 MHz 500 MHz
Resolution 16 bit 8 bit
Analog input channel 8 differential, expendable to
72 differential
4
Memory per channel 1 MB 1 MB
Input Signal Range -10 to + 10 V -5 to + 5 V
PC Communication 10/100 Base T Ethernet (300
ft. max)
10/100 Base T Ethernet
(RJ 45 connector)
Input Bandwidth DC to 500 kHz DC to 500 kHz
Input Impedance Single ended: 5 MΩ in
parallel with 30 pF
Differential: 10 MΩ in
parallel with 30 pF
1 MΩ in parallel with 20
pF
Accuracy For 2± to 10± V:
0,012%± of reading,
0,006% of range
For 1± V: 0,018%± of
reading, 0,008% of range
50 Ω: 2mV/div – 1V/div
fully variable
1 MΩ: 2mV/div – 10V/div
fully variable
System includes WaveView,PostView,
comprehensive dirves for
DASYLab, LabVIEW,
MATLAB, Visual C++,
Visual C#, Visual Basic
10:1 10 MΩ, 500 MHz
BW positive probes
Standard ports: 10/100
Base T Ethernet, USB,
Parallel, RS-232, SVGA
Video Out, Audio in/out
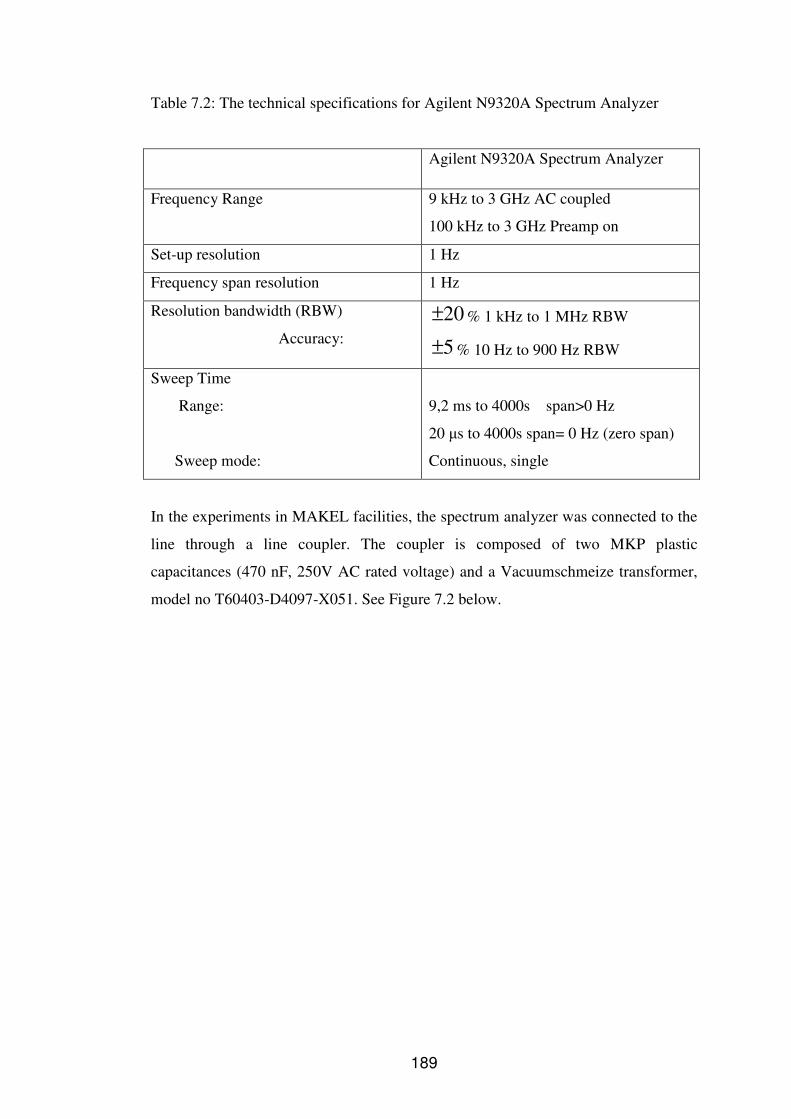
189
Table 7.2: The technical specifications for Agilent N9320A Spectrum Analyzer
Agilent N9320A Spectrum Analyzer
Frequency Range 9 kHz to 3 GHz AC coupled
100 kHz to 3 GHz Preamp on
Set-up resolution 1 Hz
Frequency span resolution 1 Hz
Resolution bandwidth (RBW)
Accuracy:
20± % 1 kHz to 1 MHz RBW
5± % 10 Hz to 900 Hz RBW
Sweep Time
Range:
Sweep mode:
9,2 ms to 4000s span>0 Hz
20 µs to 4000s span= 0 Hz (zero span)
Continuous, single
In the experiments in MAKEL facilities, the spectrum analyzer was connected to the
line through a line coupler. The coupler is composed of two MKP plastic
capacitances (470 nF, 250V AC rated voltage) and a Vacuumschmeize transformer,
model no T60403-D4097-X051. See Figure 7.2 below.

190
Figure 7.2: The photograph of the line coupler used for the experiments in MAKEL’s
R&D Laboratories.
To power
line
To measurement
device
C1
C2
T1
Neutral
Line
L1
Figure 7.3: The schematical representation of the coupling circuit used [113].
The coupling circuit shown in Figure 7.3 is used as an interface between the power
line and the spectrum analyzer. This is a transformer isolated, differential mode,
coupling circuit, and isolates the connected device from the power-line. The line

191
coupler is used to inject the carrier signal to the power line. It is composed of the
isolation transformer, capacitors and diodes. The combination acts as a high pass
filter circuit. Coupler simply blocks the nominal 50 Hz power signal component and
fulfills the over-voltage protection and impedance matching function in addition to
its regular voltage scaling mission. The high pass filter design effectively removes
the 50 Hz signal and its harmonics, but also other spectral components with low
frequencies [159], [165], [166], [167].
Furthermore, the coupling unit, which was connected directly between the phase to
neutral and the measurement device, provides high-pass type galvanic isolation
between mains and measurement devices. Galvanic isolation is the principle of
isolating functional sections of electric systems so that charge-carrying particles
cannot move from one section to another, i.e. there is no electric current flowing
directly from one section to the next. Energy and/or information can still be
exchanged between the sections by other means, however, such as by capacitance,
induction, electromagnetic waves, optical, acoustic, or mechanical means. The
coupling circuit allows transmitting and receiving high frequency signals and also
blocks and isolates the analyzer input from the 50 Hz components on the mains
wiring. The coupling circuit is composed of a broadband transformer and capacitors
with device models and specifications stated before. This design behaves as a high-
pass (LC) filter, avoiding the triggering on low frequency impulse response and
passing only the higher frequency signals of interest to the spectrum analyzer.
Additionally, on the primary side of the transformer, two Zener diodes are placed in
opposite directions for the overvoltage protection in both directions.
Two different filters are used for CENELEC A and CENELEC B frequencies.

192
Filter 1
For C1=C2=470 nF and L1= 3,9mH the cut off frequency is 3 kHz. The cutoff
frequency is the frequency for which the transfer function magnitude is -3dB. The
squared magnitude of the frequency response of Filter 1 is shown in Figure 7.4
Figure 7.4: The squared magnitude of the frequency response of the Filter 1.
Filter 1 has a flat frequency response above 10 kHz and is suitable for the
measurements in CENELEC A band which is limited to the frequency band between
9 to 95 kHz.
Filter 2
For C1=C2=220 nF and L1= 1mH the cut off frequency is 25 kHz. The squared
magnitude of the frequency response of Filter 2 is shown in Figure 7.5
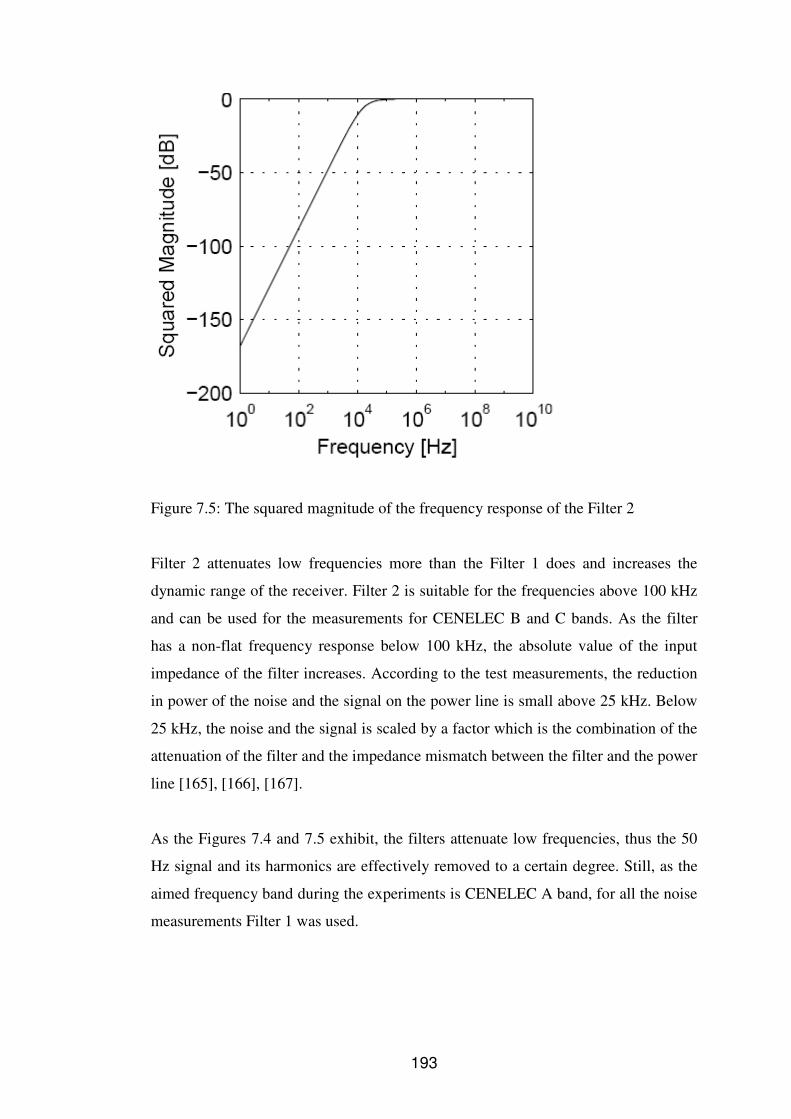
193
Figure 7.5: The squared magnitude of the frequency response of the Filter 2
Filter 2 attenuates low frequencies more than the Filter 1 does and increases the
dynamic range of the receiver. Filter 2 is suitable for the frequencies above 100 kHz
and can be used for the measurements for CENELEC B and C bands. As the filter
has a non-flat frequency response below 100 kHz, the absolute value of the input
impedance of the filter increases. According to the test measurements, the reduction
in power of the noise and the signal on the power line is small above 25 kHz. Below
25 kHz, the noise and the signal is scaled by a factor which is the combination of the
attenuation of the filter and the impedance mismatch between the filter and the power
line [165], [166], [167].
As the Figures 7.4 and 7.5 exhibit, the filters attenuate low frequencies, thus the 50
Hz signal and its harmonics are effectively removed to a certain degree. Still, as the
aimed frequency band during the experiments is CENELEC A band, for all the noise
measurements Filter 1 was used.

194
The analyzer’s settings were carefully chosen to obtain data that provided sufficient
details to enable the wanted signals to be identified from the background noise and
other interference. This was achieved by first choosing the bandwidth and the
frequency span. The frequency span and the resolution bandwidth were considered
together as they were both dependent on the signals under investigation, broadcast
radio carriers that were the most frequent and highest level of interference observed.
A resolution bandwidth of 1 kHz was selected, as this matched the sample spacing
chosen to suit the 150 kHz span and contained the required detail.
For all the experiments, firstly, no device was connected to the line to measure the
background noise. The power source of the measurement devices were connected to
a phase different from the observed phase. Then the noise sources were connected
separately and individually at different times to measure the related noise
characteristics. The measurement was made about the voltage and the power
spectrum densities of the noise emitted by individual electrical appliances.
Figure 7.6: A schematic of the measurement setup for Agilent N9320A spectrum
analyzer.
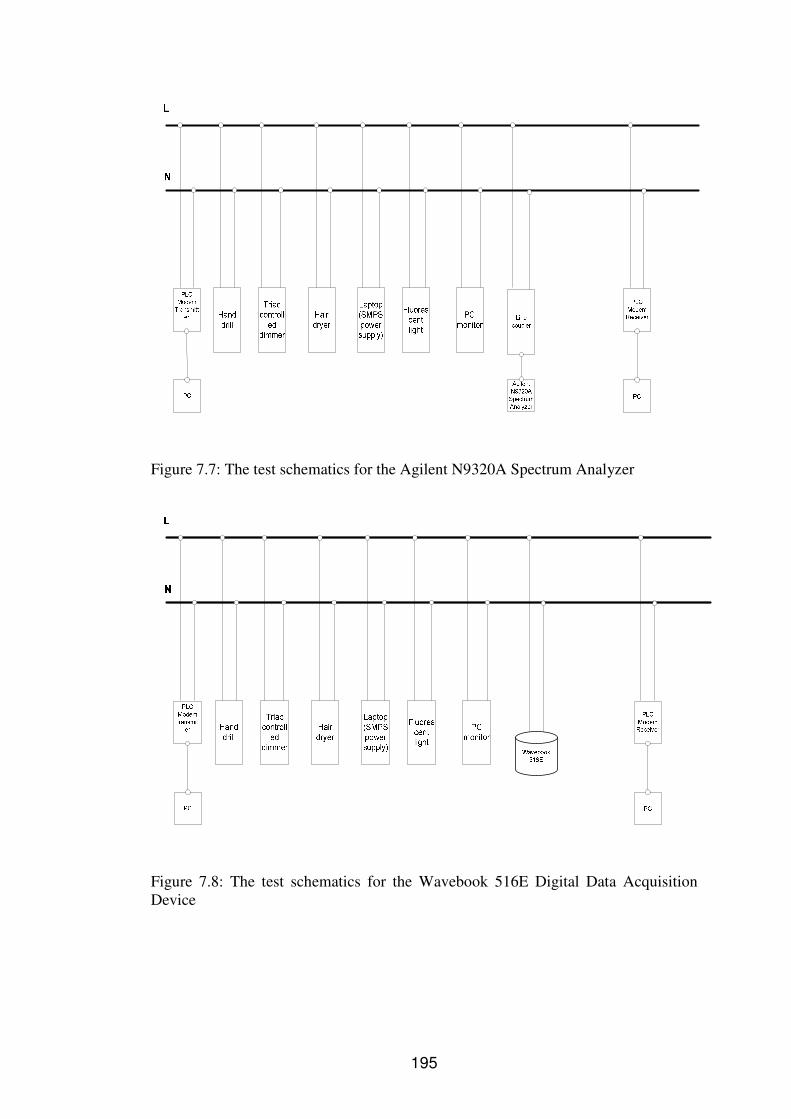
195
Figure 7.7: The test schematics for the Agilent N9320A Spectrum Analyzer
Figure 7.8: The test schematics for the Wavebook 516E Digital Data Acquisition Device
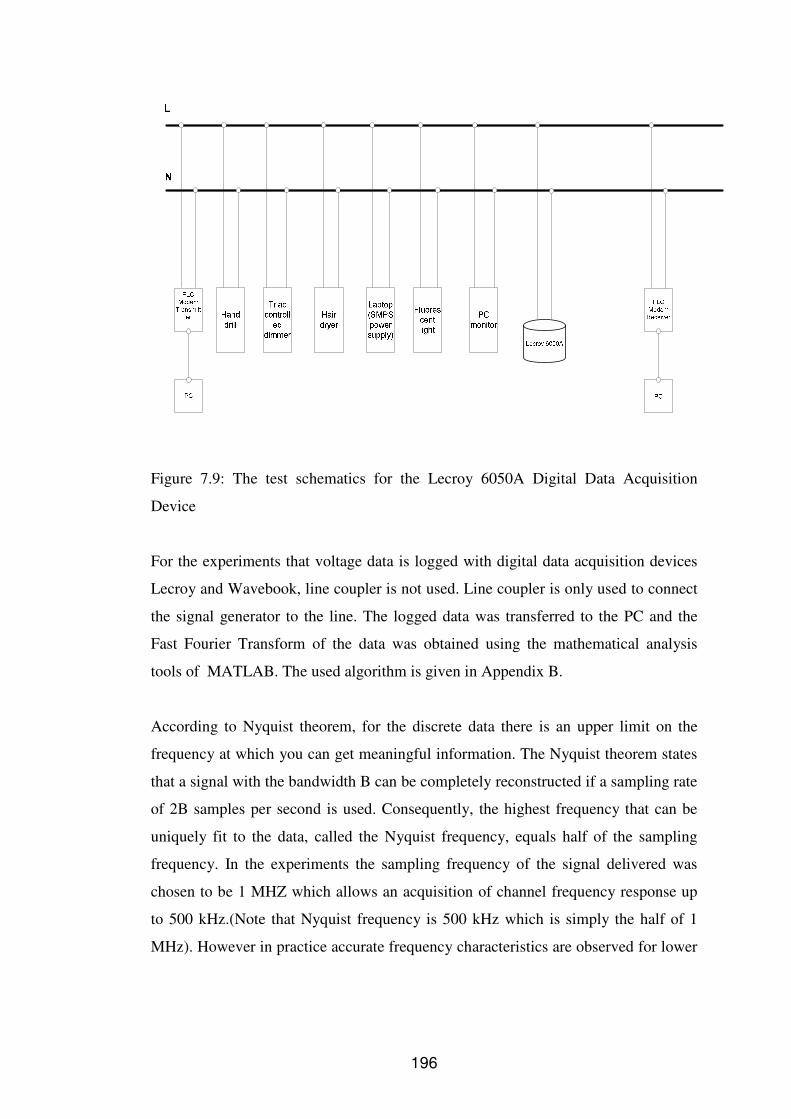
196
Figure 7.9: The test schematics for the Lecroy 6050A Digital Data Acquisition
Device
For the experiments that voltage data is logged with digital data acquisition devices
Lecroy and Wavebook, line coupler is not used. Line coupler is only used to connect
the signal generator to the line. The logged data was transferred to the PC and the
Fast Fourier Transform of the data was obtained using the mathematical analysis
tools of MATLAB. The used algorithm is given in Appendix B.
According to Nyquist theorem, for the discrete data there is an upper limit on the
frequency at which you can get meaningful information. The Nyquist theorem states
that a signal with the bandwidth B can be completely reconstructed if a sampling rate
of 2B samples per second is used. Consequently, the highest frequency that can be
uniquely fit to the data, called the Nyquist frequency, equals half of the sampling
frequency. In the experiments the sampling frequency of the signal delivered was
chosen to be 1 MHZ which allows an acquisition of channel frequency response up
to 500 kHz.(Note that Nyquist frequency is 500 kHz which is simply the half of 1
MHz). However in practice accurate frequency characteristics are observed for lower

197
frequencies than the Nyquist frequency. Hence frequency response with required
accuracy can be observed properly between 9 kHz and 148.5 kHz.
As a measure of the noise level indicated in frequency domain, the power spectrum is
analyzed as it describes how the power of a signal is distributed in the frequency
domain. To estimate the power spectrum of a signal, N samples are taken in the time
domain at a sample rate of Fs samples per second during N/Fs seconds.
Thus, resolution of the frequency response (FR) is determined via the number of
samples in the data as given in
FR = 1/ total sampling time (7.1)
For the measurements with the digital data acquisition devices, time domain data is
logged with 1M sample/second for 5 seconds which corresponds to 5M samples
leading to a resolution of 0.2 Hz in the frequency response.
Noise can be studied both in the frequency domain and time domain. In order to
calculate the duration and interarrival time of impulses, the measured data is
observed in time domain. On the other hand the frequency domain gives a clear
picture of the PSD of the data which is meaningful for the observation of background
noise. As discussed in Chapter 6, all the electronic and electrical equipment
connected to the power line should be taken into account in noise measurements.
Some of these devices generate background noise while others such as light dimmers
inject impulse noise. Switching devices are main cause of harmonic noise. Also there
are deterministic noises that are induced from the environment onto the power lines
because power lines act as antennas due to their length. One example of that kind of
noise is radio stations transmitting at medium and short wave bands.
Noise sources can be associated to every load whose power spectral densities (PSD)
have been measured. During the experiments, 5 different appliances have been
analyzed. The noise characteristics of a dimmer, laptop, monitor, drill, florescent

198
lamp and hair drier were observed. All the devices are located to an equal distance
from the source and the observation point, as their influence on the received noise
depends considerably on how close to the signal path they are [168].
7.2 NOISE MEASUREMENT TECHNIQUES
The noise accessible models stated in the literature usually depend on empirical
measurements as it is very difficult to come up with noise models through solely
analytical derivation. There are mainly two approaches for noise measurements;
frequency-domain approach or time-domain approach.
The frequency-domain approach is based on the measurement of noise frequency
spectrum in the frequency domain either using a spectrum analyzer or using
conversion techniques such as fast Fourier transform or discrete time Fourier
transform [169]. On the other hand, time-domain approach depends on real-valued
noise waveforms in the time domain.
Considering the existing literature, the background noise is mostly modeled in the
frequency domain, while the impulsive noise is characterized in both the frequency
domain and time domain.
The background noise can be modeled by using two models in the frequency domain.
The most widely-recognized one is spectrum fitting. In this model the voltage
spectrum density or the measured noise PSD is explicitly expressed as function of
frequency. This model usually yields a good approximation for the average noise
spectrum but still lacks any information on the random behavior of the noise at each
individual frequency. To cover this defect, statistical analysis methods are promoted.
In this model’s context, the background noise variation at each frequency is fitted
into certain probability density functions. The aim of statistical analysis methods is to
identify the statistical characteristics of the noise at a specific frequency by using the
PDFs of the waveforms and the corresponding statistical parameters of mean and
standard deviation.
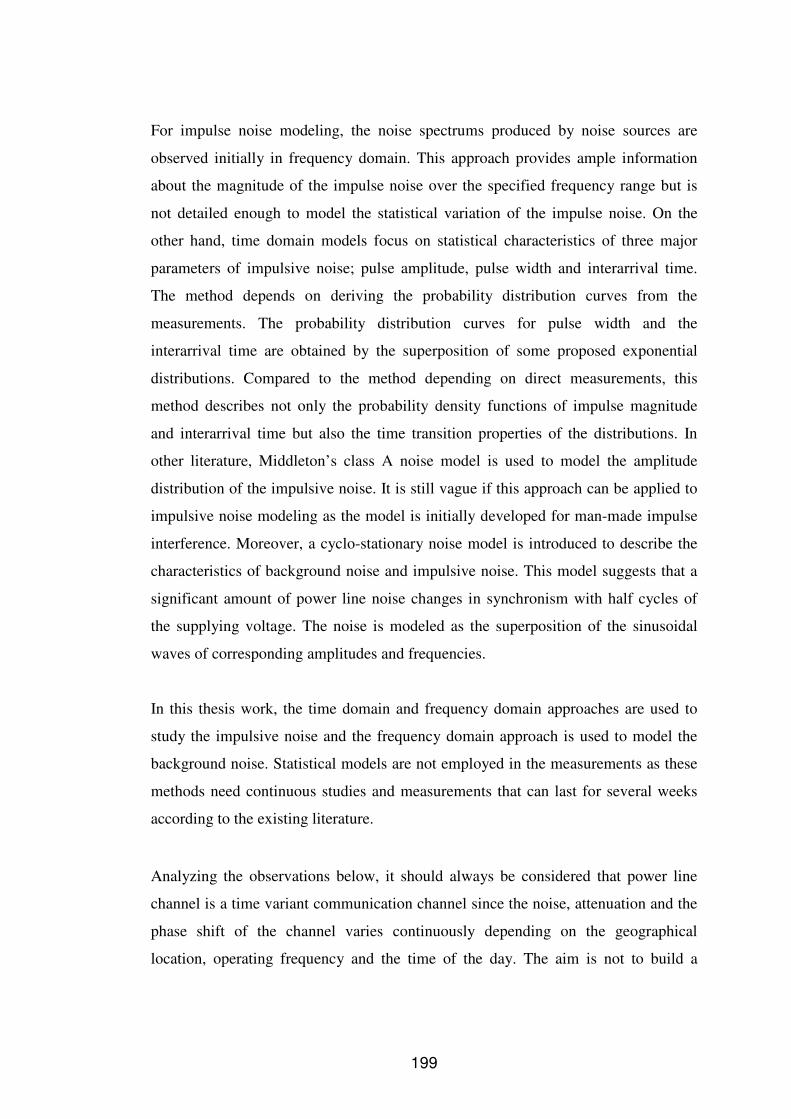
199
For impulse noise modeling, the noise spectrums produced by noise sources are
observed initially in frequency domain. This approach provides ample information
about the magnitude of the impulse noise over the specified frequency range but is
not detailed enough to model the statistical variation of the impulse noise. On the
other hand, time domain models focus on statistical characteristics of three major
parameters of impulsive noise; pulse amplitude, pulse width and interarrival time.
The method depends on deriving the probability distribution curves from the
measurements. The probability distribution curves for pulse width and the
interarrival time are obtained by the superposition of some proposed exponential
distributions. Compared to the method depending on direct measurements, this
method describes not only the probability density functions of impulse magnitude
and interarrival time but also the time transition properties of the distributions. In
other literature, Middleton’s class A noise model is used to model the amplitude
distribution of the impulsive noise. It is still vague if this approach can be applied to
impulsive noise modeling as the model is initially developed for man-made impulse
interference. Moreover, a cyclo-stationary noise model is introduced to describe the
characteristics of background noise and impulsive noise. This model suggests that a
significant amount of power line noise changes in synchronism with half cycles of
the supplying voltage. The noise is modeled as the superposition of the sinusoidal
waves of corresponding amplitudes and frequencies.
In this thesis work, the time domain and frequency domain approaches are used to
study the impulsive noise and the frequency domain approach is used to model the
background noise. Statistical models are not employed in the measurements as these
methods need continuous studies and measurements that can last for several weeks
according to the existing literature.
Analyzing the observations below, it should always be considered that power line
channel is a time variant communication channel since the noise, attenuation and the
phase shift of the channel varies continuously depending on the geographical
location, operating frequency and the time of the day. The aim is not to build a
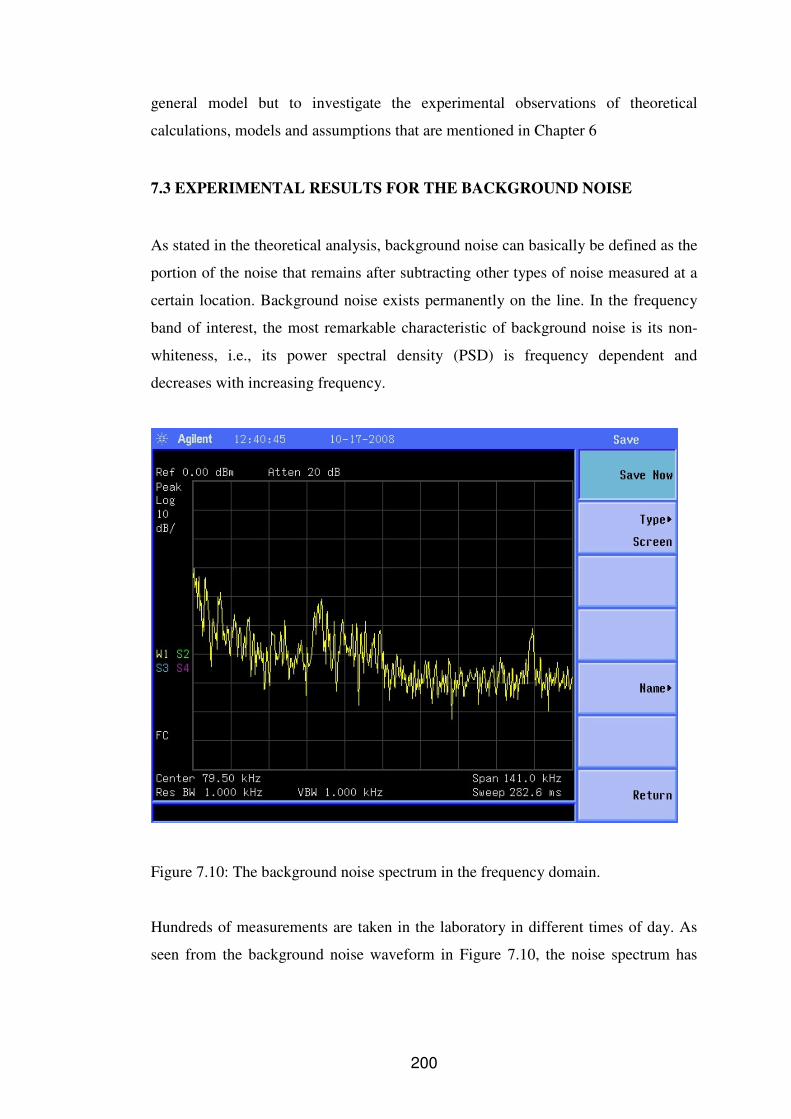
200
general model but to investigate the experimental observations of theoretical
calculations, models and assumptions that are mentioned in Chapter 6
7.3 EXPERIMENTAL RESULTS FOR THE BACKGROUND NOISE
As stated in the theoretical analysis, background noise can basically be defined as the
portion of the noise that remains after subtracting other types of noise measured at a
certain location. Background noise exists permanently on the line. In the frequency
band of interest, the most remarkable characteristic of background noise is its non-
whiteness, i.e., its power spectral density (PSD) is frequency dependent and
decreases with increasing frequency.
Figure 7.10: The background noise spectrum in the frequency domain.
Hundreds of measurements are taken in the laboratory in different times of day. As
seen from the background noise waveform in Figure 7.10, the noise spectrum has

201
relatively large values at low frequencies and smaller values at high frequencies.
However the instantaneous noise spectrums are observed not to change significantly
over time. The noise amplitude spectrum defines the general characteristic of the
noise with respect to time. The maximum amplitude of the background noise is
observed to reach 70 dB(µV) and the average levels of decrease was around 40
dB/(decade), between 14 kHz and 140 kHz. The average absolute noise levels were
around 70 dB(µV) at 9 kHz and 40 dB(µV) at 95 kHz. The average absolute noise
level was observed to decrease to 30 dB(µV) around 150 kHz.
For the measurements in MAKEL facilities, each record has a length of 5 sn in the
frequency range between 9 - 150 kHz. It was observed that the typical run starts at
low frequencies up to 20 kHz and above 20 kHz, the power density was decaying
steadily as the frequency increases. Finally, around 150 kHz, a decay of almost 30
dB was monitored when compared to 20 kHz.
Note that for the Hooijen’s studies, it was stated that the PSD of the background
noise decayed with increasing frequency with a slope of 20-25 dB/decade for indoor
environment, and 35 dB/decade for outdoor environment.
7.4 EXPERIMENTAL RESULTS FOR THE APPLIANCE NOISE
In order to measure the remaining four types of noise, electrical appliances are
connected to the power line and the noise spectrums induced by these appliances are
measured and recorded. The measurement procedure is summarized in two steps.
First the background noise of the mains line is measured without any appliances
connected. Secondly, an appliance is connected between the phase and the neutral to
measure the combined effect of background and appliance noise. It should be kept in
mind that noise spectrum calculated in this measurement is the power spectrum and
the different sources combine in terms of their power and not amplitude as the noises
are noncoherent.

202
In the Figure 7.11, the rms magnitudes of noise voltage values of various electric
appliances are listed. It can be observed that the power line noise effect decreases
with the increasing frequency. The cleaner, the air conditioner and the rice cooker are
the equipments with the highest average noise values. The cleaner’s average noise
value is very large as the noise is generated through all the frequency band of
interest. Note that, the equipment which involves a motor such as cleaner, drier,
washing machine and the built-in equipment with the inverter circuit such as air
conditioner and fluorescent light have relatively lower average noise levels.
Figure 7.11: The rms magnitudes of noise voltage values of various electric
appliances
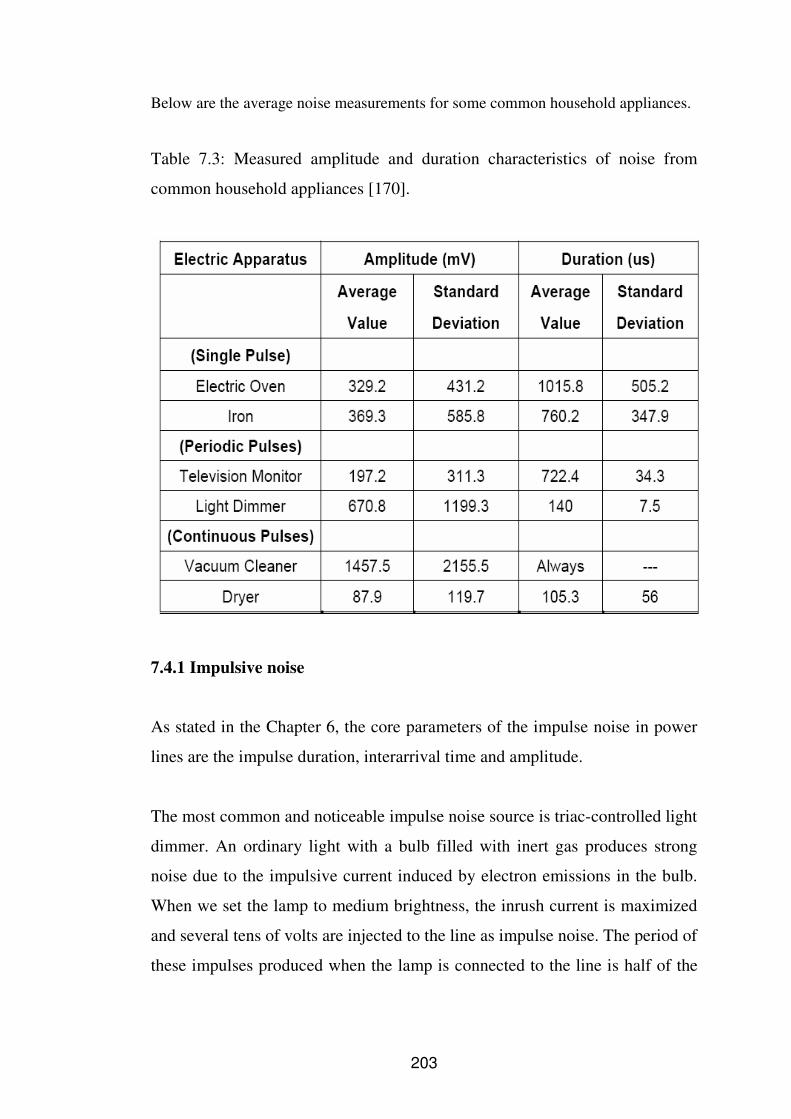
203
Below are the average noise measurements for some common household appliances.
Table 7.3: Measured amplitude and duration characteristics of noise from
common household appliances [170].
7.4.1 Impulsive noise
As stated in the Chapter 6, the core parameters of the impulse noise in power
lines are the impulse duration, interarrival time and amplitude.
The most common and noticeable impulse noise source is triac-controlled light
dimmer. An ordinary light with a bulb filled with inert gas produces strong
noise due to the impulsive current induced by electron emissions in the bulb.
When we set the lamp to medium brightness, the inrush current is maximized
and several tens of volts are injected to the line as impulse noise. The period of
these impulses produced when the lamp is connected to the line is half of the

204
AC cycle. Using a high pass filter to eliminate the system frequency, the
typical stand alone impulse noise shape that is observed in the experiments is
represented in Figure 7.12.
Figure 7.12: Impulsive noise for triac-controlled light dimmer
In the experiments performed in MAKEL facilities, an analog spectrum analyzer is
used rather than a FFT based device. By choosing a proper analyzer bandwidth and
sweep-time, it was possible to distinguish between the impulse noise and narrow
band interference. The estimation for the recordings performed was made with
periods of 20ms, according to the 50 Hz European AC cycle). A second data
acquisition to be analyzed was performed about 500 ms after the previous one to
check the stability of the channel frequency response after the impulsive noise. The
acquisition time was kept long enough to avoid the disturbing effect of a long
impulsive noise.
7.4.1.1 Asynchronous impulsive noise and periodic impulsive noise
asynchronous to system frequency
The asynchronous impulsive noise and the periodic impulsive noise
asynchronous to system frequency are investigated over the same experiment.

205
Figure 7.13 below is the voltage spectrum for the start up of the triac
controlled dimmer. An asynchronous impulsive noise is clearly observed
around 93.5 kHz.
Figure 7.13: The transient asynchronous impulsive noise for the triac
controlled dimmer.
After the start up, when the dimmer voltage spectrum reaches the steady state,
the Figure 7.14 below is the representation of the periodic impulsive noise
caused by the triac controlled dimmer. In steady state, the dimmer produces a
periodic impulsive noise. The dimmer was observed to produce approximately

206
a mean noise of 25-30dB(µV) over the background noise throughout the
frequency band of interest.
Figure 7.14: The steady state voltage spectrum of the asynchronous periodic
impulsive noise for the triac controlled dimmer.
Then the defining parameters of impulse noise are used to analyze the
measurements.
• Impulse width: The impulses were observed to last for much less than
12.5 ms which is the approximate impulse width for Hooijen’s

207
measurements. Among the 120 worst case, the mean time between
occurrence was calculated to be 2.6 ms.
• Impulse interarrival time: Interarrival time was observed only in one
location in METU laboratories. Studied literature indicates that the
number of impulses that occur per unit of time is highly frequency
dependent. As the measurements are performed only in one location,
the observed characteristics are not detailed enough to enlighten the
reader about the location dependency of impulse interarrival time.
Besides, the measurements were performed during day time in the
weekend. As a result, the time dependency of the impulse interarrival
time was not clearly identified either. However, the obtained spectrums
were detailed and explanatory enough to state the fact that the
probability of occurrence of a noise impulse is independent from the
occurrence of another impulse. The worst case for the interarrival time
was measured as 2.7 ms and the mean time for the impulse interarrival
time was measured as 17s. Moreover the impulsive noise characteristics
that are observed during the experiments had strong peaks
• Impulse duration: As a result of hundreds of measurements, the
duration for the impulse noise sample ranged between several
microseconds up to a few milliseconds. On average the spectral density
of the impulsive noise was in the order of 30 dB above the background
noise. Figures 7.15 and 7.16 are the examples of asynchronous
impulsive noise in the ms and µs respectively.
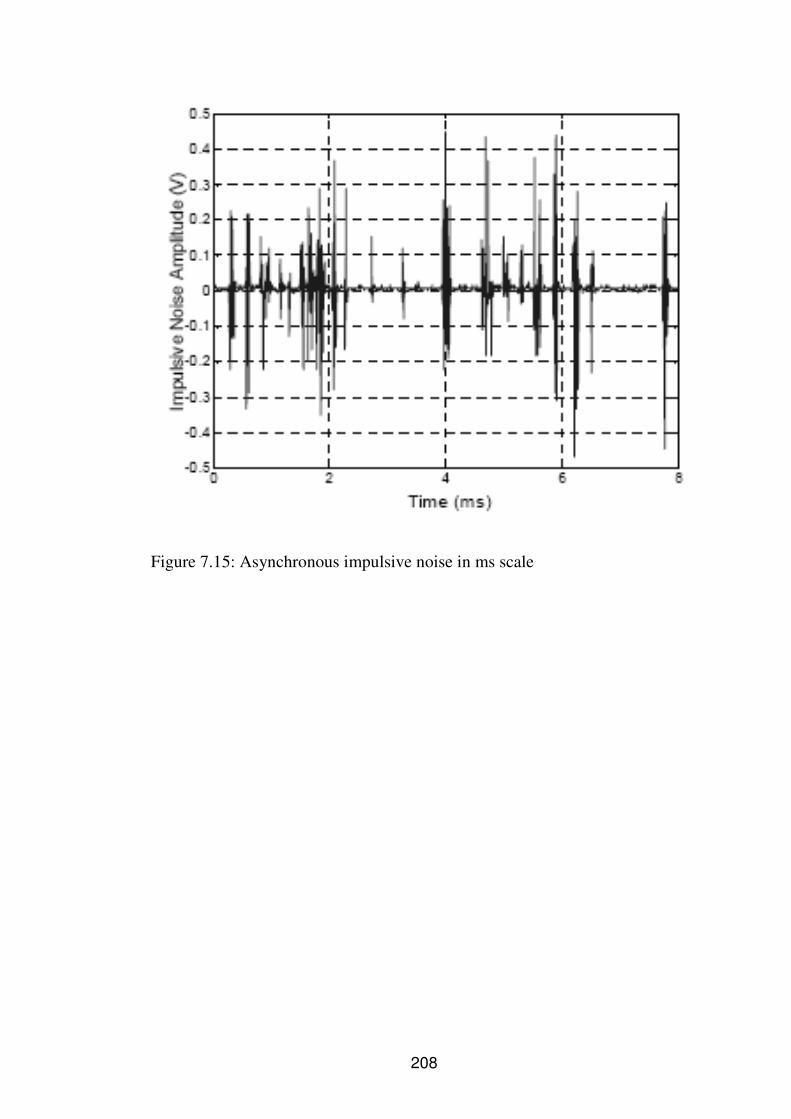
208
Figure 7.15: Asynchronous impulsive noise in ms scale

209
Figure 7.16: Asynchronous impulsive noise in µs scale
Moreover, at the startup, a 1800W industrial dryer machine was observed to
cause asynchronous impulsive noise as seen in Figure 7.17.

210
Figure 7.17: The transient impulsive noise for the startup of the industrial
dryer.
The industrial dryer did not have significant effect on the voltage spectrum of
the power line in the steady state.
7.4.1.2 Impulsive noise synchronous to the system frequency (Harmonic
noise)
As stated in previous chapter, the major sources of this type of noise are the
switching power supplies, power converters, and silicon controlled rectifiers that
switch on and off at system frequency.
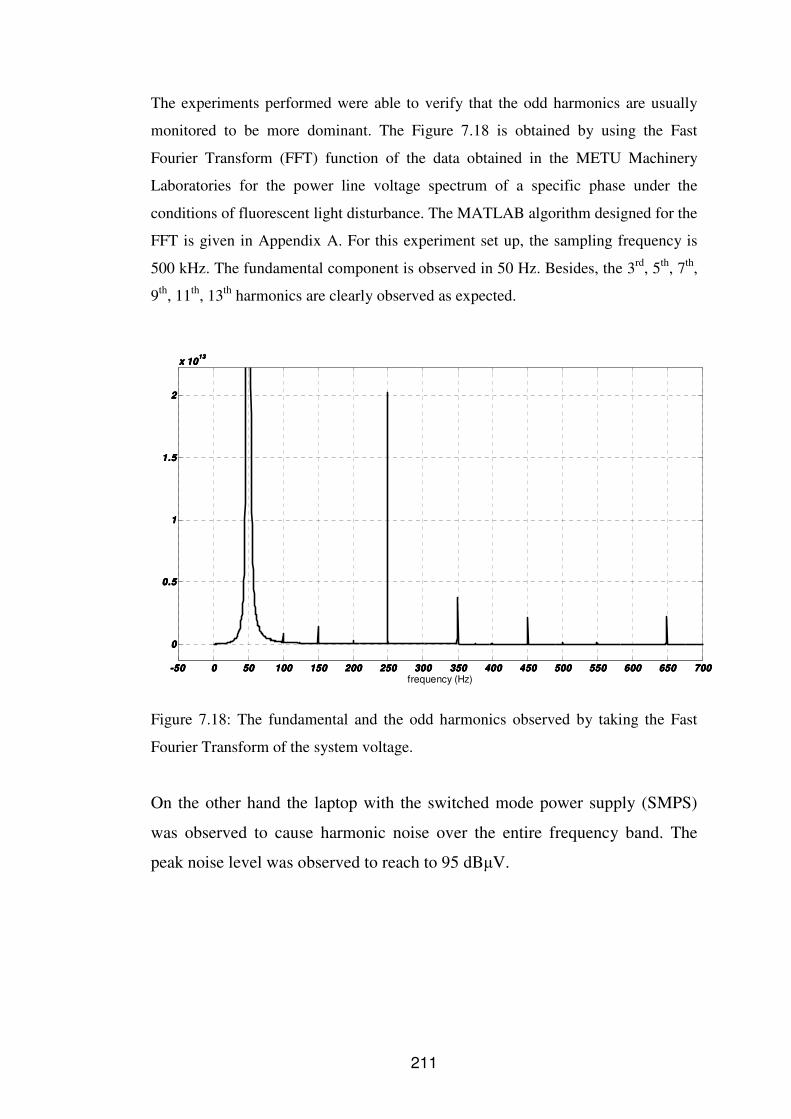
211
The experiments performed were able to verify that the odd harmonics are usually
monitored to be more dominant. The Figure 7.18 is obtained by using the Fast
Fourier Transform (FFT) function of the data obtained in the METU Machinery
Laboratories for the power line voltage spectrum of a specific phase under the
conditions of fluorescent light disturbance. The MATLAB algorithm designed for the
FFT is given in Appendix A. For this experiment set up, the sampling frequency is
500 kHz. The fundamental component is observed in 50 Hz. Besides, the 3rd, 5th, 7th,
9th, 11th, 13th harmonics are clearly observed as expected.
-50-50-50-50 0000 50505050 100100100100 150150150150 200200200200 250250250250 300300300300 350350350350 400400400400 450450450450 500500500500 550550550550 600600600600 650650650650 700700700700
0000
0.50.50.50.5
1111
1.51.51.51.5
2222
x 10x 10x 10x 1013131313
frequency (Hz)
Figure 7.18: The fundamental and the odd harmonics observed by taking the Fast
Fourier Transform of the system voltage.
On the other hand the laptop with the switched mode power supply (SMPS)
was observed to cause harmonic noise over the entire frequency band. The
peak noise level was observed to reach to 95 dBµV.

212
Figure 7.19: The voltage spectrum for the laptop with the switched mode power
supply
7.4.2 Narrow band noise
One of the main sources of this noise was reported to be the horizontal retrace
frequency of television. This frequency is 15.6 kHz for the PAL standard used in the
most European countries and some narrow band disturbances are observed at
harmonics of this frequency. Time coded transmissions can also cause narrow-band
noise by coupling to the power lines. Narrow band disturbances were observed at 25
kHz, 32 kHz, 46 kHz, 49 kHz, 55 kHz, 62 kHz, 75 kHz, 78 kHz and 94 kHz.
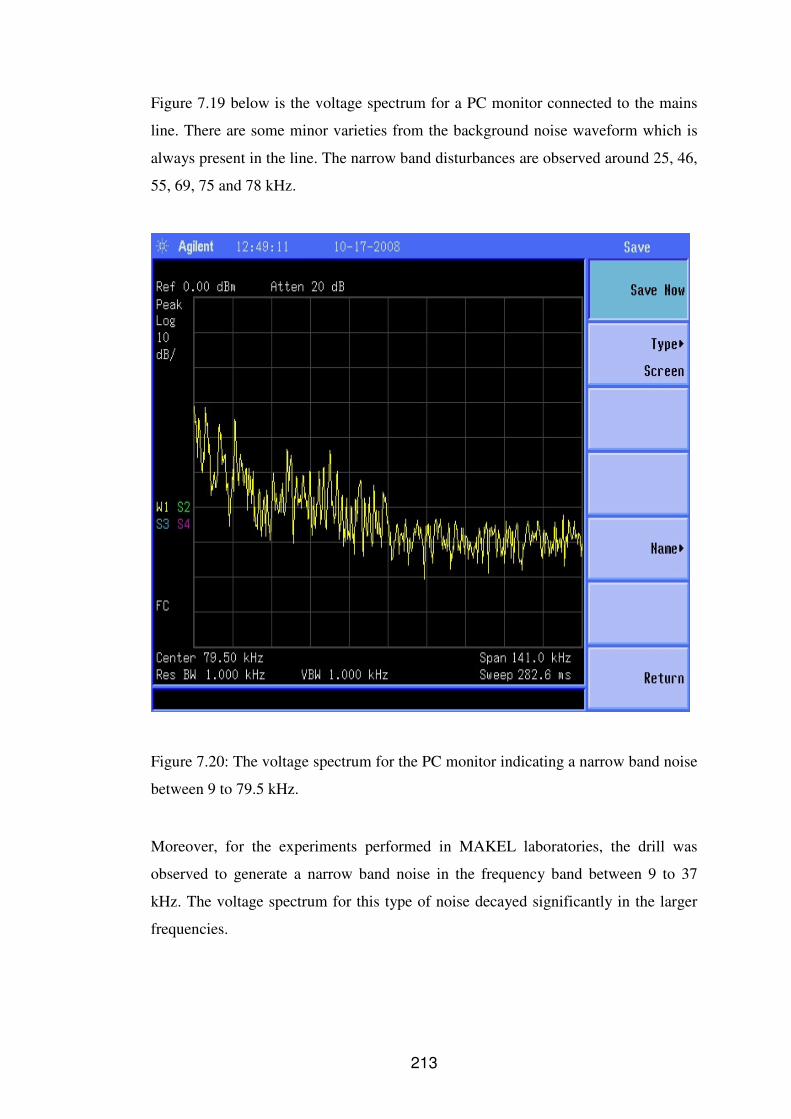
213
Figure 7.19 below is the voltage spectrum for a PC monitor connected to the mains
line. There are some minor varieties from the background noise waveform which is
always present in the line. The narrow band disturbances are observed around 25, 46,
55, 69, 75 and 78 kHz.
Figure 7.20: The voltage spectrum for the PC monitor indicating a narrow band noise
between 9 to 79.5 kHz.
Moreover, for the experiments performed in MAKEL laboratories, the drill was
observed to generate a narrow band noise in the frequency band between 9 to 37
kHz. The voltage spectrum for this type of noise decayed significantly in the larger
frequencies.

214
Figure 7.21: The voltage spectrum for the hand drill indicating a narrow band noise
7.5 Conclusion
As stated before, despite the fact that power line channel is corrupted by high
background noise, almost unpredictable impulse noise and high attenuation, PLC has
been gaining a great interest for the applications such as AMR (automatic meter
reading) and SCADA (supervisory control and data acquisition), home automation
and internet access. However, presently there are some technical and regulatory
aspects that limit the data rate transmitted. Currently, by the use of CENELEC norm
EN 50065, the frequency band between 3 kHz and 148.5 kHz is allocated for various
access protocols for different categories of users. Limits for the terminal output
voltage in the operating band and for limits for conducted and radiated disturbance

215
are identified. Likewise, the noise and attenuation characteristics in low and medium
voltage power lines are defined by an IEC standard. The experimental studies that
are made in this thesis work are restricted to the frequency bands allowed by these
standards. On the other hand there, due to great pressure from the producers in the
market and in the light of the promising studies for power line transmission in high
frequencies, there are ongoing efforts for modeling the power line channel up to 30
MHz for high data rate communications. In addition, to the regulatory problems, due
to some technical obstacles such as varying line impedances, significant noise and
high attenuation, currently the data transmission is limited to low data rates in the
range of a few kbits.
During the experiments, a coupling circuit was used to isolate the 50 Hz signals from
the communication signals. Primarily, the coupling circuit was used to couple the
communication signals to and to extract them from the power line. The coupling
circuit has a nearly flat frequency response with negligibly small insertion loss in the
frequency band of interest. The sampled data was analyzed by using PostView and
the Wavebook’s special software in the time and frequency domain. Also the time
domain data obtained over the data acquisition devices (Lecroy and Wavebook) was
converted to frequency domain by using FFT functions of MATLAB. The output of
the Agilent spectrum analyzer was logged in the laptop in the JPEG format.
The last two chapters of this thesis work presents a review of common noise types
for the low-voltage power lines and aims to verify the results of these theoretical
studies and parameters with the indoor noise measurements
To increase the reliability of digital communications on power lines, more research is
needed on modeling of the power line channel. The ultimate purpose of similar
studies should be to obtain a more refined and realistic power line channel model by
using theoretical and experimental results and to cover frequency ranges up to 450
kHz to communicate at higher data rates.

216
CHAPTER 8
CONCLUSION
8.1 Experimental results and Conclusion
PLC that is studied in this thesis work as a method for sending the data through
existing electric cables alongside electrical current enables the conversion of the
electricity distribution grid, which is the widest existing cable network in the world,
into a data transmission network. The power line channel communication has
recently become a flexible way to implement reasonable cost, reliable, and widely
accessible networks in the domestic environment. The technology opens up new
opportunities for the mass provision of last-mile local access. It can furthermore
provide new information services in both the energy and telecom sectors. Being a
bidirectional communication system, PLC provides opportunities for tariff
management and remote load control as well as automatic meter reading. So as to
say, PLC offers cost effective and dependable solutions for industrial control and
home automation applications such as control of intelligent household appliances,
remote monitoring of alarms and air conditioning systems etc. More importantly,
PLC offers all these added value services without significant additional infrastructure
investments.
The PLC offers a permanent connection as well as symmetric and bidirectional
communication. It has good performance and excellent geographical coverage. It is
also relatively economical because of its available infrastructure. This technology is
highly attractive compared to other local access technologies in terms of capital
expenditure and implementation requirements.
217
The main characteristics of the PLC that are emphasized through this thesis work can
be summarized as follows:
• The CENELEC standard EN-50065-1 defines the frequency bands, signaling
levels, power limits and other procedure for power line communication in
Europe. Briefly, 3 – 95 kHz is allocated for the use of electricity suppliers
and 95 – 148,5 kHz is reserved for consumer use.
• For the frequency band between 95 and 148,5 kHz, the signal level is
restricted to 116 dBV (class 116 equipment) for general use and the signal
level is limited to 134 dBV (class 134 equipment) for industrial applications.
• The modulation types are not studied in details during this thesis work. The
candidate modulation types are briefly mentioned. They are FSK, ASK and
spread spectrum.
• Load variability, impedance variations and attenuation are some other
important problems of PLC that complicate the data transmission.
• Interoperability and standardization are also urgent requirements for the
healthy research and development activities of PLC. The internationally
common standards are necessary to enable the component manufactures and
system developers to contribute to communication and control applications of
PLC similar to those of Global System for Mobile Communications (GSM),
Universal Mobile Telecommunications Systems (UMTS), Internet etc. The
collection of data from all around the world in a standardized manner is also
beneficial for common standard system design and equipment
standardization. Obviously, different countries have different standards of
power grid network. Voltage level, line frequency and power distribution
architecture can be considerably different. Still, the standardization and
interoperability guarantee the international viability.

218
So as to say, power lines and their associated networks are not originally designed
for communication purposes, making the accurate transfer of communication signals
difficult. Noise levels in the networks are often excessive; cable attenuation in the
systems at the frequencies of interest is often very large; important channel
parameters such as impedance and attenuation are hard to predict due to their
unpredictable nature. Still, the development of the technology has gone through a
long path to reach today’s state. The power line carrier channel (PLCC) technology
now applies much higher frequencies and substantially reduces the noise levels.
In the scope of the thesis, the first 5 chapters are allocated to a comprehensive
investigation about the methodology used for the power line communication based
automatic meter reading applications, the power line channel communication
applications in European and Turkish markets, the advantages and disadvantages of
power line communication compared to its rival technologies and the
characterization and modeling of power line communication methods.
In the last two chapters of the thesis work, the noise types classified in the literature
are investigated in details. The power line channel, in a way similar to other
communication media such as RF, operates in a noisy environment with various
noise sources appearing concurrently. Motors, switch-mode power supplies,
fluorescent ballasts are examples of sources that generate impulse and background
noises. Moreover, these sources contribute to a time varying environment in means
of both impedance and attenuation.
In Chapter 6, the noise types are studied in detail. The identified noise types are
background noise, impulsive noise, harmonic noise and narrowband noise. In
Chapter 7, the measurements and observations for the theoretically defined noise
types are verified via experiments in METU EE Machinery and Drives Laboratories
and R&D laboratories of MAKEL in Hadımköy.

219
During these experiments, the background noise was permanently and extensively
monitored for all instances of measurement. The background noise was illustrated in
frequency domain by using the digital output of the Agilent spectrum analyzer in a
predefined frequency range. The background noise was observed to decay slightly
more rapidly compared to the rate of decay for the indoor low voltage power cables,
represented in the theoretical studies. The average rate of decrease was measured to
be around 40 dB/decade in the frequency band of interest (9 - 150 kHz) whereas for
the theoretical studies the rate of decay was on the order of 25 dB/decade for indoor
low voltage power cables. Besides, the average magnitude of the background noise
measured in the experiments was higher than the theoretical studies.
The remaining 4 noise types were classified under appliance noise as their presence
during the experiments was attributed to and verified through the existence of an
appliance connected parallel to the power line. The impulsive noise was classified
under three titles; asynchronous impulsive noise, periodic impulsive noise
synchronous to the system frequency (harmonic noise), periodic impulsive noise
asynchronous to system frequency.
The asynchronous impulsive noise was clearly determined at the start up of a
triac controlled light dimmer connected parallel to the power line. In the
steady state of the triac controlled dimmer, periodic impulsive noise
asynchronous to the system frequency was observed with a mean magnitude
of 25 – 30 dBµV. Impulse strength is typically 10 dB above the background
noise level and can exceed 40 dB. Impulse strength depends on which noise
sources are present as well as on the proximity of these noise sources to the
receiver. Furthermore, the three defining parameters of impulsive noise were
measured during the experiments; impulsive width, impulse interarrival time
and impulse duration. The observed impulse width was usually in tolerable
proximity of the theoretical values. Finally, the impulse interarrival time
exhibited a wide variability with an average impulse magnitude of 30 dB

220
above the background noise. Again, this result for the interarrival time was in
line with the theoretical provisions.
The harmonic noise was the most clearly observed noise type during the
experiments as the waveform for the harmonic noise was very close to the
theoretically foreseen waveform. Converting the data logged to the digital data
acquisition device (Lecroy 6050A) into the frequency domain by using the
Fast Fourier Transform (FFT) function of the MATLAB, the fundamental
component and the odd (3rd, 5th, 7th, 9th, 11th, 13th) harmonics of the signal
were explicitly monitored. Unfortunately, the experimental results obtained
were inadequate in means of differentiating the narrow band noise evidently
from the background noise. Particularly, the hand drill showed a narrow band
disturbance over a limited frequency band. Because noise, as well as wanted
signals, was subjected to attenuation, noise sources close to the receiver were
observed to have the greatest effect on the received noise structure, mainly
when the network attenuation is large. Additional studies over a wider
frequency band are needed to identify narrowband noise more evidently.
Finally, some noise sources were observed to increase the background noise power,
others to increase the impulse noise power, and some others to increase the power of
both noise types.
Note that, all of the measurements were carried out in a laboratory
environment for indoor power cables over the frequency range 9-150 kHz.
Since intensive measurements are needed to be able to reach conclusive
results, the results presented here should be taken as preliminary.
The last two chapters of this thesis work presents a review of the conventional
noise types for the low voltage power lines and aims to verify the results of
these theoretical studies and parameters with the indoor noise measurements.
In order to increase, the reliability of digital communications on power lines,

221
more research is needed on modeling of the power line channel. The ultimate
purpose of the similar studies should be to obtain a more refined and realistic
power line channel model by using theoretical and experimental results and to
cover frequency ranges up to 450 kHz to enable the reliable communication at
higher data rates.
Despite the fact that PLC still has considerably disadvantageous characteristics such
as continuously fluctuating and unpredictable impedance that jeopardize proper line
coupler design, high attenuation and highly destructive noise along the frequency of
interest, there are some methods to avoid the observed disturbances in the power line
communication network as a result of the experimental studies performed. Finally,
the following methods can be proposed to facilitate improved power line channel
performance and reliability.
8.2 Recommendations
A) Using PLC line to transfer meter consumption and power simultaneously, the
signal collision is probable. Therefore it is recommended to use powerful filters at
system line to ignore 50 Hz harmonics. A high pass filter similar to the filter used in
the experiments performed helps a lot. The production of a range of filters for
different applications on the power network to provide robust connectivity for
devices will be essential as these systems advance. In addition, filters function to
overcome the variable impedance of the low voltage mains line. Besides, the DC and
AC signals should be coupled by using capacitor and inductor respectively.
B) Noisy resources should be eliminated to transmit data correctly. Power supplies
used in the system are major sources of noise, so a power supply with lower noise
seems to be necessary. A switching power supply with powerful 50 Hz harmonics
elimination is an appropriate choice. In addition to the noise sources investigated in
Chapter 7, universal motors operating into a 50 Hz power circuit generate a flat noise
spectrum that can be up to 30 dB above the background noise for a large motor.
Similarly, incandescent light dimmers produce 50 Hz harmonic noise. The level of

222
phase to neutral noise produced can be up to 40 dB above normal background noise
at 10 kHz for 400 W of lighting. Besides, appliances with dc motors can generate
noise similar to that generated by universal motors. On the other hand, the residential
background noise consists of random, spectrally smooth noise combined with 50 Hz
harmonic noise and narrowband noise from TV receivers or video.
C) It is possible to increase transmitting signal amplitude to increase transmission
distance range by varying elements of the PLC modem driver circuit but note that
this should not harm the receiving modem in short distances. Actually, signal
distance range and transmission distance should be compromised. PLC signal
distance range depends on consuming load and line quality.
D) Impedance matching and appropriate coupling are very important. Usually
impedance of power cables is resistive in 10-60 Ω range; as a result, coupler input
impedance should be resistive and equal to the line impedance at carrier frequency.
There are various methods to couple system units. The choice of capacitor and
inductor is crucial. The design must be based on the followings:
• Appropriate choice of Ceq value for the coupling circuit to block power line
frequency, considering high impedance at mains frequency (50 Hz for the
experiments performed)
• Coupling capacitor and inductor resonance at desired carrier frequency to
prepare resistive impedance, powerful filtering and elimination of power
signal harmonics.
Besides, a distribution transformer present in the transmission path will cause heavy
losses because of its low impedance. When transmitting from a distribution
transformer, heavy coupling losses should be taken into account.
E) In high interfering places, power level repeaters can be used to transmit at low
level power. However, using redundant repeaters can cause a reduction in
transmitting power.
223
F) Considering the major application area of PLC to be AMR, there are some brief
implications about AMR. Compromising should be considered to make an AMR
system. Obviously, a modern one is more expensive than the conventional reading
system, but the new AMR system can increase reliability as well as speed. In
addition, calculation of different issues such as demand, tariff and load profile is
possible to optimize power consumption. Finally, consumption optimization,
accurate
calculation of power consumption charge by applying tariff in day long and semi -
yearly, demand calculation in a period and energy storage by informing the
consumers are fundamental reasons to use AMR system in spite of the high
construction cost.
8.3 Future Work
The trend of the future in PLC is expected to witness improvements in the areas of
equipment design, transmission efficiency, and applications. It is anticipated that
these improvements will be of an evolutionary nature rather than of a revolutionary
one.
A) For electronic equipment, the equipment designs should be improved with
sophisticated integrated circuits. By this way, smaller, less costly, more reliable and
versatile equipment can be developed
B) For the transmission equipment, the transmitter and amplifiers with higher power
outputs should be developed in order to be used for applications requiring greater
signal strength. This can further be supported with improvements in transmitter
frequency and reliability.
C) For the receiving equipment, obviously, the transmitted signal should be more
effectively separated from the incoming noise and extensive noise monitoring should
be employed. Moreover, the circuits available in integrated form should contribute to

224
new types of signal discriminators and demodulators. Lastly, large scale digitally
integrated circuits should be used, increasing the use of logic in the receivers to
improve their overall security and dependability as well as to reduce the cost of
receiver and transmitter designs.
D) In the case of system improvements, the limitations in the range of PLC channels
are due to insufficient SNRs (signal to noise ratio) at the carrier receivers. The signal
levels that couple to the line should be raised to increase the range. However, the
improvements in the signal levels are considerably limited because of the high cost
of increasing the power significantly above the 100 W level. In order to accomplish
the increase in signal levels, the coupling efficiency can be improved with
intrabundle channels which utilize insulated wires in one line phase for the
transmission of carrier signals. Besides, a separately suspended coaxial cable can be
employed for the exclusive use of carrier communications. Finally, some other
possible actions are the usage of more efficient shielded signal cables such as
improved coaxial cable, triaxal cable, and video cable pairs.
E) In the case of PLC applications, the present applications are expected to be
improved to function above 300 kHz. On the HV side of utility services, more
complicated protective relaying systems can be integrated with PLC applications for
the digital transmission of digitally encoded information for data and control
purposes. On the LV side, automatic meter reading, revenue billing, selective load
shedding and control of distribution system operations are the promising application
areas for PLC.
F) The noise types observed in the low voltage power line network should be
modeled separately and more realistically. A possible way to implement this is to
develop a laboratory model that can be used to represent the LV section of the power
distribution network. Noise and cable attenuation measurements can be performed
using this laboratory set up to obtain realistic data for modeling. This should take
into the account that different cables in the LV distribution network have different

225
attenuation factors due to their difference in diameter and the materials for their
dielectrics.
G) A significant barrier to automatic meter reading using power line carrier
technology is regulation standards. In order to implement the system successfully it
is important to understand and revise the current standards and regulations that are
related to power systems, frequency spectrum allocation, and telecommunication.
Closer studies should be carried out on those aspects.
H) The impedance conditions of the network, the protocols for different services, the
vulnerability to communication interference, the production of equipment with
impedance in a specified range and investigation for the disturbance of signal
transmission with other systems of communication are some other critical areas of
development for the lossless transmission of data.
I) The standardization of the meter ID is important for electrical utilities that provide
AMR services. When the meter ID is standardized, this network parameters can be
made more relative with the power distribution grid information, such as indicating
the phase a meter belongs, LV section and branch the meter is located. This will
bring a greater convenience for the utilities since they can easily and quickly locate
any meter installed in the AMR network.
J) The high degree of automation, the concept of electronic power markets, the
necessity of detailed observation platforms for the management and control demands
a reliable and secure communication system. This system must allow for
communication to and between large numbers of nodes in broadcast applications.
Making use of the grid as communication means gives automatically the access to a
highly distributed communication channel. Power line communication technology is
a major candidate for these control and automation applications. For this purpose,
issues such as dependability, security, protection against intrusion and similar issues
must be examined.

226
K) In addition, in future work it might be interesting to investigate the influence of
narrowband noise and synchronous noise on the system performance. Adaptive
loading is able to mitigate these types of noise sources just by switching off the
affected tones. However the poor bandpass filtering properties of the FFT may cause
problems when the interfering frequency doesn't fall on the FFT's grid. The use of
windowing techniques in the time domain to improve the frequency behavior of the
FFT is one option. On the other hand, the destructive influence of impulse noise
cannot be overcome with simple improved bit loading strategies. Some kind of
forward error correction should be combined with multicarrier modulation in order to
provide frequency and time diversity.
L) Moreover, the statistical behaviors of different types of noise such as amplitude
characteristics of background noise and short wave radio disturbances and also
number, frequency and amplitude of narrowband disturbances can be studied by
software and hardware simulations. Moreover, the measurements presented in this
thesis work for the interarrival time and impulse width should be improved by the
detailed analysis of sophisticated coding schemes and frequency of bit and burst
errors. Moreover, the measurement and parameter determination of noise waveforms
at many locations, the construction of a database of power line noise, and the
establishment of a standard set of parameters are important areas of investigation for
Turkish low voltage power line network.
Last but not the least important possible solution to avoid the disturbances and noises
described might be to increase the operating frequency of the PLC system. Because
of the wide geographical coverage of reticulation networks, coordinating bodies have
formulated specifications to restrict the bandwidth and power levels of
communications signals, in order to limit interference with other users of low
frequency radio communications. Considering all the disturbances described a higher
utilization of the radio frequency spectrum or selection of a higher frequency band in
the order of 10 MHz to 100 MHz can help to avoid the major disturbances described
throughout this thesis work. The noise elimination provided by the selection of

227
higher frequencies can be supported by usage of advance modulation techniques,
such as orthogonal frequency division multiplexing (OFDM) to improve the data
transmission performance. However, another problem arises in this case. At these
frequencies the power lines will act as antennas, causing additional interferences
with the radio waves and other communication media. The additional problems with
operating in higher frequencies are due to the power requirements, considerable
variation in the impedance of the power line and disturbance to other transmission
carriers. Moreover, around these frequencies, signal attenuation on the channel was
shown to be a summation of coupling losses and line losses, both of which can be
very high, making it very difficult to transmit over distances of more than 500 m.
[136]
Power line carrier communication is a recent and rapidly evolving technology,
targeting at the utilization of the electricity power lines for the transmission of data.
The power line carrier communication offers a multitude of new information
services, both in the energy and telecom sectors. As stated throughout the thesis,
PLC technology has a number of important strengths and several main weaknesses.
However, the upgrade path for the PLC technology makes it highly attractive
compared to other local access technologies in terms of capital expenditure and
implementation requirements. Since the PLC technology has not reached to the point
of maturity and does not have a strong customer base, the technology requires further
expansion. Also, the economy of certain low data rate applications such as automatic
meter reading, encourage the development of simple signaling schemes with lower
complexity and better performance than current low end solutions. However, it is
still an open question whether wide band signaling schemes can be developed for
power channel.
To sum up, in the last seven decades there have seen considerable developments in
utilizing the low voltage network for the dual purpose of supplying power and data
communication services for utilities, third parties and customers. Still, it should be
noted that PLC is an evolving technology in its early stages of development and
other communication media such as GSM, GPRS, Ethernet protocol 802.11b, and

228
direct fiber are more dependable and sustainable despite their disadvantages in means
of cost and ubiquity. The power line is limited in frequency range until megahertz
transmission is commonly implemented; therefore interfacing into hybrid network
with radio, telephone, wireless, GSM, GPRS and fiber systems must be considered to
provide a fully integrated communications system for a wider range of services.
Finally, it is important to note that although general rules apply, each power ine
communication application needs special attention, individual design and testing to
ensure optimal performance.

229
REFERENCES
[1] Diane J. Cook, Sajal K.Das, “Smart environments: Technologies, Protocols,
and Applications” Wiley-IEEE, pp. 52-55, March 2005
[2] Luis F. Montoya, “Power Line Communications Performance Overview of
the Physical Layer of Available protocols”, IEEE Member University of
Florida Gainesville, Florida,1999
[3] E. Yavuz, F, Kural, N. Coban, B . Ercan and M. Safak, “Modelling of Power
Lines for Digital Communications”, IEEE Transactions on Industry
Electronics, 1999
[4] EN 50065-1 Technical Report on “Signalling on low voltage electrical
installations in the frequency range 3 kHz to 148.5 kHz”, Part 1 : General
Requirements, frequency bands and electromagnetic disturbances, January
1994
[5] Dostert, Klaus, “Powerline Communications”, Prentice Hall PTR, NJ 07458,
2001
[6] The Technical Report of IEC 1334-1-4, “Distribution automation using
distribution line carrier systems - Part 1: General considerations - Section 4:
Identification of data transmission parameters concerning medium and low -
voltage distribution mains”, 2001
[7] European Standard Final Draft, “Home and Building Electronic Systems”,
CENELEC, Brussels, prEN 50090-2-2, March 1995

230
[8] The Technical Report of IEC 1334-1-4, “Distribution automation using
distribution line carrier systems” - Part 1: General requirements, frequency
bands and electromagnetic disturbances, 2001
[9] European Standard Final Draft “Signalling on low-voltage electrical
installations in the frequency range 3 kHz to 148.5 kHz” prEN 50065-1,
CENELEC, Brussels, 1999.
[10] Monticelli, D.M., and Wright, M.E., “A Carrier Current Transceiver IC for
Data Transmission Over the AC Power Lines”, IEEE Journal of Solid-State
Circuits, Vol. SC-17, No.6, December 1982
[11] European Standard Final Draft, “Signalling on Low Voltage Electrical
Installations in the Frequency Range 3 kHz to 148.5 kHz”, prEN 50065-1,
CENELEC, Brussels, 1991
[12] Tobias Giebel, Hermann Rohling, “Regulatory aspects of OFDM based
power line applications”, Department of Telecommunications, Technical
University of Hamburg, 2001
[13] IEC-CISPER 22, “In Limits and methods of measurement of radio
disturbance characteristics of information technology equipment”, EN 55022,
1994
[14] Phil Sutterlin and Walter Downey, “A Power Line Communication Tutorial –
Challenges and Technologies”, Echelon Corporation, 2000
[15] Klaus M. Dostert, “Telecommunication over the Power Distribution Grid -
Possibilities and Limitations”, IEEE Transactions on Industry Applications,
vol. 39, May/June 2003

231
[16] K. W. Louie, A. Wang, P. Wilson, and P. Buchanan Manitoba, “Discussion
on power line carrier applications”, HVDC Research Centre, 2001
[17] Cullen A., Kuurstra J. and Piercy K., “Power Distribution Grid
Communication System”, United States Patent No. 6157292R, December 5,
2000
[18] Akkermans, H., Healey, D. and Ottosson, H, “The Transmission of Data over
the Electricity Power Lines”, IEEE Transactions on Industry Applications,
vol. 9, July 2003
[19] K. W. Louie, A. Wang, P. Wilson, and P. Buchanan Manitoba, “Discussion
on Power Line Carrier Applications, Part 2”, HVDC Research Centre,
December 2000
[20] http://en.wikipedia.org/wiki/Automatic_meter_reading
[21] Tan S.Y., M. Moghavvemi, “PIC Based automatic meter reading and control
over the low voltage distribution network”, IEEE Transactions on Industry
Applications, vol. 8, July 2003
[22] Dr. John Newbury, “Technical Developments in Power Line
Communications”, IEEE Transactions on Industry Applications, June 1998
[23] Soodeh Haghgoo 1, Hasan Monsef, “Commissioning of an AMR Prototype
System by PLC Technology”, ”, IEEE Transactions on Industry Applications,
February 2000
[24] K. Shirai, Y. Matsushita, H. Ishikawa, A. Takahashi, “Remote automatic
meter reading system and its applications”, Nec. Res. Dev. , vol.42, pp.50- 60,
1976

232
[25] C. Nunn, K. Sullivan, "An Advanced Power Line Carrier System for AMR,
DSM, DA & Non-Utility Applications", CIRED 97, Conference Publication
No. 438, IEEE, 2-5 June 1997
[26] http://en.wikipedia.org/wiki/CSMA/CD
[27] Jiang-Whai Dai and Kwang-Cheng Chen, "Randomly Addressed Polling with
Imperfect Physical Transmission" Department of Electrical Engineering,
National Tsing Hua University, Taiwan 30043, R.O.C., IEEE, pp. 262-266,
June 1996
[28] Richard Newman, “Protecting Domestic Power Line Communications”, IEEE
Transactions on Industry Applications, pp 1-11, July 2006
[29] Kevin Wade Ackerman, Timed Power Line Data Communication, ”, IEEE
Transactions on Industry Applications, March 1997
[30] Tom Coffey John Griffin Benjamin Moore, “A media access control protocol
for a power line local area network”, ”, IEEE Transactions on Industry
Applications, June 2000
[31] Halid Hrasnica, Abdelfatteh Haidine, Ralf Lehnert, Reservation MAC
Protocols for Powerline Communications, IEEE Conf. Records, pp. 1703-
1707, September 2001.
[32] M. Propp & D. Propp, “Token Passing Network for Power Line
Communications”, AIEEE Transactions on Consumer Electronics, Number 2,
May 1991
[33] S.Sundersan et al, “A Distributed MAC For OFDM Based Power Line
Communication Networks”, IEEE Conf. Records, pp 1-6, Feb 2001

233
[34] J. A. Bucklew, “Analysis of access protocols for and automatic meter reading
system”, Comput. Commun, vol.11, pp. 12-19, 1988
[35] K. Dostert, “Analysis and simulation of noise in power line communication
systems”, IEEE Conf. Records, September 2000
[36] Charles Pollard, “A Power Line Communication System based on Discrete
Multi-Tone Modulation”, IEEE Transactions on Industrial Applications, pp
1-3, Jun 2000.
[37] M. Surratt, “Integration of cebus with utility load management and automatic
meter reading”, IEEE Trans. Consum. Electr, vol.37, pp. 406-412, 1991.
[38] Intellon High Speed Power Line Communications [online] Available:
http://www.intellon.com
[39] HomePlug 1.0 standard, [online] Available: http://www.homeplug.org
[40] Tom Coffey, John Griffin, Benjamin Moore, “A media access control
protocol for a powerline local area network”, IEEE Transactions on
Industrial Electronics, Jan 1998
[41] “Ampmeter: A Cost Efficient Turnkey Remote Metering Solution”, Amplex
website.
[42] Al Lutz, “Enhance profits with advanced PLC AMR system” Metering
International Issue No 223, Jan 1999
[43] Eckhard Wenker, “Demand Side Management using DLC Communication”,
IEEE Transactions on Industrial Electronics, February 2000

234
[44] Campbell, D. and Holmes S., “Communicating With Domestic Electricity
Meters”, The 6th International Conf. On Metering Apparatus and Tariffs for
Electricity Supply, April 1990, pp. 129-133.
[45] Dan Xu and Mingsheng Tang, “Optimal Topology Discovery for Automatic
Meter Reading Using Powerline Carrier”, IEEE Transactions on Industrial
Electronics, Feb 1999
[46] B. Nilsson, P. Dokopoulos, G. Papagiannis, D. Tampakis, N. Lettas, G.
Bianconi, G. Fabozzi, “PLC-Based Electrical Energy Consumption
Management System. Preliminary Field Test Results”, IEEE Transactions on
Industrial Electronics, January 2001
[47] Leon-Garcia, A. and Widjaja, I., “Communication Networks: Fundamental
Concepts and Key Architectures”, McGraw-Hill Companies Inc., 2000
[48] http://www.its.bldrdoc.gov/fs-1037/dir-002/_0153.htm
[49] Englert, B., Rudolph, L. and Shvartsman, A., “Developing and Refining an
Adaptive Token-Passing Strategy”, 21st International Conference on
Distributed Computing Systems, , pp. 597 –605, April 2001
[50] “ANSI/IEEE Std 802.4-1990, Part 4: Token-Passing Bus Access Method and
Physical Layer Specifications, International Standard ISO/IEC 8802-4”,
published by the Institute of Electrical and Electronics Engineers, 1990
[51] Cisco Official Website, Chapter 46 of the Internetworking Technologies
Handbook, http://www.cisco.com
[52] Paul Fuchs, Thomas Schaub, “DLMS User Association - Co-ordination
between Applications and Channels”, IEEE Transactions on Industrial
Electronics, Feb 2001
235
[53] SOMOGYI Tibor, “DLMS - the Application Protocol for communicating
meters”, IEEE International. Symposium on Power Line Communications
Records, July 2002
[54] The Technical Report of IEC 1334-4-42, “Distribution automation using
distribution line carrier systems”, January 2001
[55] Preceedings: Conference on "European Home Systems – Das intelligente
Haus wird Wirklichkeit"; TU Braunschweig, SGS-Thomson Microelectronics
& ATICON, Home Automation GmbH; Braunschweig; December 1995
[56] Gerrit Telkamp, “A Low-Cost Power-Line Node for Domestic Applications”,
IEEE International. Symposium on Power Line Communications Records,
July 1999
[57] EN50065-1, "Signalling on low-voltage electrical installations in the
frequency range 3 kHz to 148.5 kHz" published by CENELEC, Genevre; July
1993
[58] EUREKA project "Integrated Home Systems", ESPRIT project 243 1 "Home
Systems"; ESPRIT project 5448 "Integrated Interactive Home”
[59] Ludwig BRACKMANN, "Power-Line Applications, with European Home
Systems (EHS)", Intl. Symposium on Power-Line Communication and its
Applications, Essen; April 1997
[60] Dettmer, “Meter power”, IEEE Review, June 1992
[61] D. C. Yeung and F. Allen Morgan, “Utilities and two way customer
communication systems”, IEEE Communications Magazine, April 1995

236
[62] “Public utilities viable ways to read a meter from afar,” Computing,The
Magazine, Oct. 4, 1984.
[63] John Newbury and William Miller, “Multiprotocol Routing for Automatic
Remote Meter Reading Using Power Line Carrier Systems” Intl. Symposium
on Power-Line Communication and its Applications, April 2002
[64] “The DLMS Standard” CEN/TC/294/WG2 N.62E, Nov. 1996
[65] Petri Oksa, Mikael Soini, Lauri Sydänheimo, Markku Kivikoski,
“Considerations of Using Power Line Communication in the AMR System”,
Intl. Symposium on Power-Line Communication and its Applications, April
2002
[66] A.D. Craig, P.M. Moore, C.D. Long, “Experience with a High Speed MV/LV
Power Line Communications System for Remote Metering, Load Control and
Network Automation”, Intl. Symposium on Power-Line Communication and
its Applications, April 1999
[67] Echelon Corporation Official Website, [Online. Last Update Sept 2003],
URL:http://www.echelon.com
[68] Klaus Dostert, “RF-Models of the Electrical Power Distribution Grid”, Intl.
Symposium on Power-Line Communication and its Applications, 2002
[69] R. A. Arrington, “Load management and automatic meter reading through the
use of power-line carrier”, Electr. Power Syst. Res, vol.4 pp.85-104, 1981.
[70] Hans Akkermans and Fredrik Ygge, “Smart Software as Customer Assistant
in Large-Scale Distributed Load Management”, in Proceedings DistribuTech
DA/DSM 97 Europe, Amsterdam, The Netherlands, October 14-16, 1997

237
[71] Fredrik Ygge, “Power Line Communication as a Means for Electronic Power
Markets”, EnerSearch AB, 2000
[72] Hans Akkermans, AKMC, The Netherlands David Healey, Spectrum, United
Kingdom Hans Ottosson, EnerSearch, Sweden, “Report on the transmission
of data over the electricity power lines”, 2001
[73] http://www.enerjiplatformu.org
[74] http://www.izto.org.tr/nr/rdonlyres/7475bda1-95b7-4855-b351
9adce4362afe/7090/elektrik_nkilic.pdf
[75] http://www.radikal.com.tr/haber.php?haberno=209387&tarih=07/01/2007
[76] ABN-AMRO web site. www.abnamro.com
[77] K. Sridharan and N. N. Schulz, “Outage management through AMR systems
using an intelligent data filter”, IEEE Trans. Power Delivery, vol. 16, pp.
669-675, 2001
[78] Z. Aktas and O.N. Dogan, “Illegal electricity usage causing severe damage to
system”, Newspaper of Turkish Daily News, 19 March 2007 Ankara, Turkey
[79] I. H. Cavdar, “A Solution to Remote Detection of Illegal Electricity Usage via
Power Line Communications”, IEEE Trans. Power Delivery, 2002
[80] AL Lutz, “Enhance profits with advanced PLC AMR system”, Metering
International, http://www.metering.com/archive/003/18_1.htm
[81] J. Newbury and W. Miller, “Multiprotocol routing for automatic remote meter
reading using power line carrier systems”, IEEE Trans. Power Delivery, vol.
16, pp.1-5, 2001

238
[82] T. Y. Lim and T. W. Chan, “Experimenting remote kilowatthour meter
reading through low-voltage power lines at dense housing estates,” IEEE
Trans. Power Delivery, vol. 17, pp.708-711, 2002
[83] N. Miura, H. Sato, H. Narita and M. Takaki, “Automatic meter reading
system by poweline carrier communications”, IEEE Proceedings, vol.137 pp.
25-31, 1990.
[84] S. Mak and D. Radford, “Design considerations for implementation of large-
scale automatic meter reading systems,” IEEE Trans. Power Delivery, vol.10,
pp.97-103, 1995
[85] I. H. Cavdar, “Performance analysis of FSK power line communications
systems over the time-varying channels: measurements and modeling”, IEEE
Trans. Power Delivery, 1999
[86] A. Patrick, J. Newbury and S. Gargan, “ Two-way communications systems
in the electricity supply industry” IEEE Trans. Power Delivery, vol.13,
pp.53-58, 1998
[87] Lawrence S. Cohen, Jean W. de Graaf Arthur Light Frank Sabath, “Code of
Federal Regulations Section 47, Part 15 47CFR15 or FCC Part The
Measurement of Broad Band over Power Line Emissions”
[88] Ebru Tuncay, “Elektrik prizinden ADSL’e rakip internet baglantısı”, Referans
Gazetesi, 20.10.2008
[89] A Survey Done by MORI, “IBM Utility and Energy Services: Customer
Expectations for a Competitive European Environment – Deregulation
Challenges for Utility Suppliers and Commercial Users”, Report issued by
IBM, October 1997.

239
[90] Michael Arzbergerl, Klaus Dostert, Torsten Waldeck, Manfred Zimmermann
“Fundamental Properties of the Low Voltage Power Distribution Grid”,
[91] Dr. John Newbury, “Power Line Communication Development”, Intl.
Symposium on Power-Line Communication and its Applications, 2001
[92] Junior Isles, “Distributing a Message – Electricity Companies Get Ready to
Make Waves in the Telecomms Business”, Power Engineering International,
Volume 6, Issue 1 (January/February 1998), pages 54-58. ISSN 1069-4994
(cf. also http://www.penwell.com)
[93] Martin Harris, “Power Line Communications - A Regulatory Perspective”,
MIEE Office of Telecommunications, 2001
[94] Gerd Bumiller, “System Architecture for Power-Line Communication and
Consequences for Modulation and Multiple Access”, Intl. Symposium on
Power-Line Communication and its Applications, 2003
[95] Dr. Michael Propp, “The Powerline as a Reliable Multimedia-Capable Home
Network”, Adaptive Networks Inc., 2004
[96] N Linge N M Blackle and P Brown, “Interactive on line customer service
applications for delivery over the power line infrastructure”, Intl. Symposium
on Power-Line Communication and its Applications, 2002
[97] Paul Hunt, “Communication Media for AMR – Which Technology is the
Most Appropriate”, Metering International, issue 1, 1998, pages 15-19. (cf.
also http://www.metering.com)
[98] John Surrey, “The British Electricity Experiment – Privatisation: the record,
the issues and the lessons”, Earthscan Publications Ltd., London, UK, 1996

240
[99] L. M. Faulkenberry and W. Coffer, Englewood Cliffs, “Electrical Power
Distribution and Transmission”, NJ: Prentice-Hall, 1996
[100] J. Newbury and K. T. Morris, “Power line carrier systems for industrial
control applications”, IEEE Trans. Power Delivery, vol. 14, pp. 1191–1196,
Oct. 1999
[101] M.M. Forti and L.M. Millanta, “Power-Line Impedance and the Origin of the
Low- Frequency Oscillatory Transients”, IEEE Transactions on
Electromagnetic Compatibility, Vol. 32, No. 2, pp87-97, May 1990
[102] Ferreira and Hooijen, “Power Line Communications: An Overview”, Intl.
Symposium on Power-Line Communication and its Applications, 2004
[103] J.R. Nicholson and J.A. Malack, “RF Impedance of Power Lines and Line
Impedance Stabilization Networks in Conducted Interference
Measurements”, IEEE Transactions on Electromagnetic Compatibility, Vol.
EMC-15, no. 2, pp84-86, May 1973
[104] Holger Philipps, “Modelling of Powerline Communication Channels”, Intl.
Symposium on Power-Line Communication and its Applications, 2005
[105] R. M. Vines, H. J. Trussell, L. J. Gale and J. B. O'Neal, “Noise on residential
power distribution circuits” IEEE Trans. Electromagnetic Compatibility,
vo1.26, no.4, pp. 161-168 November 1984
[106] J. Huloux and L. Hanus, “ST7537 power line modem application,” SGS
Thomson Microelectronics, Applicat. Note AN655/0994, 1995
[107] G. Platt and B. Cook, “Domestic power line carrier communications,” in
Elect. Eng. Final Year Project. Newcastle, Australia: Univ. Newcastle, 1999

241
[108] J. A. Malack and J. R. Engstrom, “RF impedance of United States and
European power lines,” IEEE Trans. Electromagn. Compat., vol. EMC-18,
pp. 36–38, Feb. 1976
[109] Dostert, K. and Zimmermann, M., “A Multipath Model for the Powerline
Channel”, IEEE Transactions on Communications, Vol. 50, No. 4, April
2002
[110] Christian Hensen, Dr. Wolfgang Schulz, Sascha Schwane, “Characterisation,
Measurement and Modelling of Medium Voltage Power-Line Cables for
High Data Rate Communication”, Intl. Symposium on Power-Line
Communication and its Applications, 2004
[111] E.W.G. Bungay, D. McAllister, “Electric Cables Handbook”, BSP
Professional Books, Oxford, 1990
[112] Tom Nakura, Makoto Ikeda, and Kunihiro Asada, “Theoretical Study of
Stubs for Power Line Noise Reduction”, Intl. Symposium on Power-Line
Communication and its Applications, 2003
[113] Er Liu, Yangpo Gao, Osama Bilal and Timo Korhonen, “Broadband
Characterization of Indoor Powerline Channel”, Intl. Symposium on Power-
Line Communication and its Applications, 2001
[114] Jero A., “Applicability of Powerline Communications to Data Transfer of On-
line Condition Monitoring of Electrical Drives,” Doctor thesis, Lappeenranta
University of Technology, ISBN 951-764-783-2
[115] Manfred Z., Klaus D., “Analysis and Modeling of Impulsive Noise in Broad-
band Powerline Communications,” IEEE trans. Electromagnetic
compatibility, Vol. 44, pp. 249-258, Feb. 2002.
242
[116] Manfred, Klaus, “A Multi-path Signal Propagation Model for the Power Line
Channel in the High Frequency Range”, Intl. Symposium on Power-Line
Communication and its Applications, 2005
[117] Dostert, K., Gebhardt, M. and Weinmann, F., “Physical and Regulatory
Constraints for Communication over the Power Supply Grid”,
Communications Magazine, IEEE, Vol. 41, Issue 5, May 2003, p(s): 84 –90
[118] G. Duval, "Applications of PLC at Electriciti de France", PLC'97 Essen, 2-4
April 1997
[119] Daniel CHAFFANJON, “A Real Knowledge of Propagation: the Way of
Efficiency and Reliability Making PLC Generalization Feasible”, Intl.
Symposium on Power-Line Communication and its Applications, 2001
[120] G. Duval, "Low Voltage Network Models to the Analysis of Unexpected
Phenomena in PLC Communications", Proc. 1998 International Symposium
on Power-line Communications and its Applications, Tokyo, Japan, 1998
[121] Echelon Corp., “LonWorks PLT-21 Power Line Transceiver User’s Guide”,
Version 2, 1997
[122] Intellon Corp., “CEBus Power Line Test Bed”, Application Note #0067,
March, 1997
[123] J.P. Rhode, A.W. Kelley and M.E. Baran, “Complete Characterization of
Utilization-Voltage Power System Impedance Using Wideband
Measurement”, IEEE Transactions on Industry Applications, Vol. 33, No. 6,
pp1472-78, November/December 1997

243
[124] Mauro Tucci, Marco Raugi, Luciano Capetta, Carlo Tornelli, Romano
Napolitano, “A Fuzzy-Logic model for impulsive noise in PLC”, Intl.
Symposium on Power-Line Communication and its Applications, 2000
[125] A. A. Smith, Jr., “Power line noise survey”, IEEE Trans. Electromagnetic
Compatibility, vo1.14, pp.31-32, Feb. 1972
[126] E. Del Re, R. Fantacci, S. Morosi, R. Seravalle, G. Pieraccioli, “Orthogonal
Direct Sequence Code Division Multiple Access For Broadcast
Communications on Power Lines”, Intl. Symposium on Power-Line
Communication and its Applications, 2001
[127] P.Burcascano, S.Cristina, M.D’Amore, “Digital Generator of Corona Noise
on Power Line Carrier Channels”, Intl. Symposium on Power-Line
Communication and its Applications, 2001
[128] Zhanqing Yu, Jinliang He, Rong Zeng, Bo Zhang, Shuiming Chen,
“Experimental Research on EMI of PLC System of ±500-kV HVDC
Converter Station”, Intl. Symposium on Power-Line Communication and its
Applications, 2005
[129] T. Esmailian, R. Kschischang, P. G. Gulak, “Characteristics of In-building
Power Lines at High Frequencies and their Channel Capacity”, Intl.
Symposium on Power-Line Communication and its Applications, 2005
[130] Masaaki Katayama, Senior Member, IEEE, Takaya Yamazato, Member,
IEEE, and Hiraku Okada, Member, IEEE, “A Mathematical Model of Noise
in Narrowband Power Line Communication Systems” Intl. Symposium on
Power-Line Communication and its Applications, 2004

244
[131] Zhenchao Wang, Huiran Hou and Yutao Gan, “Feature Extraction of the
Noise in L-PLC”, Intl. Symposium on Power-Line Communication and its
Applications, 2003
[132] Khan Md. Rezaul Hoquel, Luca debiasi2, Francesco G.B. De Natalel,
« Performance analysis of MC-CDMA Power Line Communication system”,
Intl. Symposium on Power-Line Communication and its Applications, 2005
[133] Srinivas Katar, Brent Mashburn, Kaywan Afkhamie, “Channel Adaptation
based on Cyclo-Stationary Noise Characteristics in PLC Systems”, Intellon
Corporation, 2001
[134] H. Meng, Y. L. Guan, Member, IEEE, and S. Chen, Senior Member, IEEE,
“Modeling and Analysis of Noise Effects on Broadband Power-Line
Communications”, Intl. Symposium on Power-Line Communication and its
Applications, 2004
[135] H. Meng, S. Chen, Y. L. Guan, C. L. Law, P. L. So, E. Gunawan, and T. T.
Lie, “Modeling of transfer characteristics for the broadband power line
communication channel,” IEEE Trans. Power Delivery, vol. 19, no. 3, pp.
1057–1064, Jul. 2004
[136] Hooijen, O.G., “A Channel Model for the Residential Power Circuit Used as
a Digital Communications Medium”, IEEE Transactions on Electromagnetic
Compatibility, Vol. 40, pp. 331-336, No. 4, November 1998
[137] Manfred Zimmermann, Klaus Dostert, “An Analysis of the Broadband Noise
Scenario in Powerline Networks” Intl. Symposium on Power-Line
Communication and its Applications, 2004

245
[138] Hooijen, O.G, “On the Channel Capacity of the Residential Power Circuit
used as a Digital Communications Medium”, IEEE Communications Letters,
Vol. 2, No. 10, October 1998
[139] Olaf G. Hooijen, “A Channel Model for the Low-Voltage Power-Line
Channel; Measurement- and Simulation Results”, Intl. Symposium on Power-
Line Communication and its Applications, 2001
[140] Paul A Brown, “Some Key Factors Influencing Data Transmission Rates in
the Power Line Environment When Utilising Carrier Frequencies above 1
MHz”, Intl. Symposium on Power-Line Communication and its Applications,
1999
[141] Dostert, K.M., “Frequency-Hopping Spread-Spectrum Modulation for Digital
Communications over Electrical Power Lines”, IEEE Journal on Selected
Areas in Communications. Vol. 8, No. 4, May 1990
[142] O. G. Hooijen, Shaker Verlag, “Aspects of Residential Power Line
Communications”, In Applied Power Electronics Conference Records, 1998
[143] M.H.L. Chan and R.W. Donaldson, “Amplitude, width and interarrival
distribution for noise impulses on intrabuilding power line communication
networks”, IEEE Trans. Electromagnetic Compatibility, vo1.31, no.3, pp.
320-323, 1989
[144] Y. H. Chew, T.T. Tjhung, T. He and C.C. KO, “Estimation of BER
performance over an impulse noise channel”, Electronics Letters, vo1.35,
no.4, pp. 273-274, 18 February 1999
[145] L.F. Lind, N. A. Mufti, “Efficient method for modelling impulse noise in a
communication system”, Electronics Letters, vo1.32, no. 16, pp. 1440-1441,
IS' August 1996.

246
[146] W. Henkel and T. Kessler, “Statistical description and modelling of impulsive
noise on the German telephone network”, Electronics Letters, vo1.30, no.12,
pp.935-936, June 1994
[147] W. Henkel, T. Kessler, and H. Y. Chung, “Coded 64-CAP ADSL in an
impulse-noise environment - modelling of impulse noise and first simulation
results”, IEEE Journal Selected Areas Communications, vol.13, no. 9,
pp.1611-1621, December 1995
[148] Hisashi NIWA, Masaaki KATAYAMA, Takaya YAMAZATO, Akira
OGAWA and Noriyuki ISAKA, “A Spread-Spectrum System with Dual
Processing Gains Designed for Cyclic Noise in Power Line
Communications”, Intl. Symposium on Power-Line Communication and its
Applications, 2002
[149] R.M. Vines, H.J. Trussel, K.C. Shuey and J.B. O’Neal, “Impedance of the
Residential Power-Distribution Circuit” IEEE Transactions on
Electromagnetic Compatibility, Vol. EMC-27, No. 1, pp6-12, February 1985
[150] J.B. O’Neal, “The Residential Power Circuit as Communication Medium”,
IEEE Transactions on Consumer Electronics, Vol. CE-32, No. 3, pp567-577,
August 1986
[151] J.B. O’Neal, “The Residential Power Circuit as Communication Medium”,
IEEE Transactions on Consumer Electronics, Vol. CE-32, No. 3, pp 562-567,
August 1986
[152] Kevin Ackerman David Dodds Carl McCrosk, “Protocol to Avoid Noise in
Power Line Networks”, Intl. Symposium on Power-Line Communication and
its Applications, 2002

247
[153] Motorola, MC68360 Quad Integrated Communications Controller User’s
Manual.
[154] David E. Dodds, Kevin W. Ackerman and Jack S. Hanson, "Power Line
Communication Using Timed Transmission", IEEE Consumer
Communications and Networking Conference-CCNC 2004, Jan 5-8 Las
Vegas, USA., Poster #9
[155] Youlu Zheng, Shakil Akhtar, “Networks for Computer Scientists and
Engineers”, Oxford University Press, New York, NY, 2002
[156] Kevin Wade Ackerman, “Timed Power Line Data Communication”, Thesis
Submitted to the College of Graduate Studies and Research in Partial
Fulfillment of the Requirements for the Degree of Master of Science in the
Department of Electrical Engineering University of Saskatchewan
[157] V. Degardin, M. Lienard, P. Degauque, “Impulsive Noise on Indoor Power
lines: Characterization and Mitigation of its Effect on PLC Systems”, Intl.
Symposium on Power-Line Communication and its Applications, 2005
[158] http://en.wikipedia.org/wiki/thejitter
[159] G. Avril, F. Gauthier, F. Moulin' A. Zeddam, F. Nouvel, “Characterization of
Time Variation of the Powerline Channel Frequency Response
Simultaneously with Impulsive Noise” Intl. Symposium on Power-Line
Communication and its Applications, 2001
[160] Cameron L., Smallwood P.E. Member IEEE “Power Quality Issues Relating
to Power Line Carrier Automated Meter Reading Technology”, Intl.
Symposium on Power-Line Communication and its Applications, 2003
[161] LonUsers International Conference Proceedings, Echelon Corp., May 1997
248
[162] Jan Lundgren, Trond Ytterdal, Putrik Eriksson, Bengt Oelmunn, Munir
Abdullu, Muttias O'Nils, “A Power Line Noise Coupling Estimation
Methodology for Architectural Exploration of Mixed Signal Systems”, Intl.
Symposium on Power-Line Communication and its Applications, 2002
[163] D.R. Thompson, Intellon Corp, “SSC P200 (P300) Hardware Design
Reference”, United States Patent No. 5,005,187, April2, 1991
[164] Echelon Corp., “LonWorks PLT-21 Power Line Transceiver User’s Guide”,
Version 2, 1997
[165] L. Selander, T. I. Mortensen, G. Lindell, "Load Profile and Communication
Channel Characteristics of the Low Voltage Grid", Proc. DistribuTECH
DA/DSM Europe 98, London, U.K., 1998
[166] L. Selander, T. I. Mortensen, “Technical and Commercial Evaluation of the
IDAM System in Ronneby, Sweden", Proc. NORDAC-98, Bålsta, Sweden,
1998
[167] G. Lindell, L. Selander, "On Coding-, Diversity- and Receiver Strategies for
the Powerline Communication Channel", Proc. 3rd International Symposium
on Power-line Communications and its Applications, Lancaster, UK, 1999
[168] F. J. Caiiete Corripio: L. Diez del Rio, J. T. Entrarnbasaguas Muiioz, “A
Time Variant Model for Indoor Power-Line Channels”, Intl. Symposium on
Power-Line Communication and its Applications, 2002
[169] G. Proakis, D.G. Manolakis, "Digital Signal Processing Principles,
Algorithms,and Applications", Macmillan Publishing Company, 1992

249
[170] Marubayashi, G. and Tachikawa, S. “Spread Spectrum Transmission on
Residential Power Line”, IEEE Conference on Spread Spectrum Techniques,
January 1996, pp 1082-1086
Related Documents


