COMMUNICATIONS & STRATEGIES, no. 52, 4 th quarter 2003, p. 271. Analysis of Competition and Market Structure of Basic Telecommunication Services in India Piyush JAIN & Varadharajan SRIDHAR Information Technology & Systems Group Indian Institute of Management Telecommunication growth, being a complex and dynamic techno- economic phenomenon, is the integrated interaction of a large number of technical, social and economic forces (MIKEROV, 1998). CRONIN et al (1991) confirmed the existence of a feedback process whereby economic activity and growth stimulates demand for telecommunication services. Territories vary greatly in their level and distribution of income and industrial structure, especially in developing countries such as India. Income patterns decide disposable income levels and hence purchasing power levels for communication services. Population density, demographic shifts (joint to nuclear families, rural/hills to urban/planes), customer behavior patterns and network externalities have a significant influence over growth and demand for services (DUTTA, 2001). Since government or government owned monopolies previously catered for telecommunication needs in most of the developing countries, the telecom regulatory structure is relatively new. In India the Telecom Regulatory Authority of India (TRAI) was only set up in 1996 after the introduction of a National Telecom Policy in 1994 (NTP94). The licensing mechanism, tariffs, tax structures and interconnection schemes are still evolving and thus create uncertainty in terms of the evolution and growth of various telecommunication services. However, being green field projects, most of the new entrants in developing countries are embracing the latest technologies, which have reduced the cost of providing services while increasing the variety of services on offer. For example, in India most Basic Telecom Operators (BTOs) have started adopting wireless technologies as access solutions, thus reducing the per line cost by almost 3 times that of wireline access solutions.

Welcome message from author
This document is posted to help you gain knowledge. Please leave a comment to let me know what you think about it! Share it to your friends and learn new things together.
Transcript
COMMUNICATIONS & STRATEGIES, no. 52, 4th quarter 2003, p. 271.
Analysis of Competition and Market Structure of Basic Telecommunication Services in India
Piyush JAIN & Varadharajan SRIDHAR Information Technology & Systems Group
Indian Institute of Management
Telecommunication growth, being a complex and dynamic techno-economic phenomenon, is the integrated interaction of a large number of technical, social and economic forces (MIKEROV, 1998). CRONIN et al (1991) confirmed the existence of a feedback process whereby economic activity and growth stimulates demand for telecommunication services. Territories vary greatly in their level and distribution of income and industrial structure, especially in developing countries such as India. Income patterns decide disposable income levels and hence purchasing power levels for communication services. Population density, demographic shifts (joint to nuclear families, rural/hills to urban/planes), customer behavior patterns and network externalities have a significant influence over growth and demand for services (DUTTA, 2001).
Since government or government owned monopolies previously catered for telecommunication needs in most of the developing countries, the telecom regulatory structure is relatively new. In India the Telecom Regulatory Authority of India (TRAI) was only set up in 1996 after the introduction of a National Telecom Policy in 1994 (NTP94). The licensing mechanism, tariffs, tax structures and interconnection schemes are still evolving and thus create uncertainty in terms of the evolution and growth of various telecommunication services.
However, being green field projects, most of the new entrants in developing countries are embracing the latest technologies, which have reduced the cost of providing services while increasing the variety of services on offer. For example, in India most Basic Telecom Operators (BTOs) have started adopting wireless technologies as access solutions, thus reducing the per line cost by almost 3 times that of wireline access solutions.
272 COMMUNICATIONS & STRATEGIES no. 52
In this paper we analyse the evolving market structure and dynamics of basic telecom services in India and build a techno-economic model representing the various factors affecting basic telecom services. System dynamics methodology is applied to this model to simulate growth in the subscriber bases of various service providers in different service areas of the country under duopoly competition. These techno-economic simulations replicate the conditions of telecommunications technology and the economic environment of the target market so that growth in telecom services can be investigated and monitored by researchers, planners and service providers. Once calibrated, such models can be used to determine the effect of variations in model parameters on different outcome variables, especially growth in the number of subscribers to basic telecom services.
The rest of the paper is structured as follows. We discuss the evolution of basic telecom services in India, and examine the penetration of telecom services and addresses universal access issues. Then we discuss the movement from a tariff regime to competitive pricing, and we elaborate on the factors affecting the oligopoly market in basic telecom services. We present a causal model that describes the growth of basic telecom services in India. We conclude by presenting simulation results generated by the proposed model and draw general conclusions regarding the use of such modelling exercises.
Basic telecom services in India: an evolution from natural monopoly
The local telecommunication service (also referred to as the basic telecom service) is the term used to describe the provision of local access networks (normally referred to as the "last mile" connection) over relatively short distances. Each customer of the Basic Telecom Operator (BTO) normally has at least one last mile connection to the nearest exchange, which is used to switch local, national long distance and international calls to the appropriate networks.
The basic telecom service was always provided by a "natural monopoly" operator in most countries until recently. The primary reasons for these natural monopolies in telecommunication services were the huge fixed and sunk costs associated with investment that make duplication of the local loop uneconomical, the network harmonisation that is required for co-ordination and optimal utilization of various resources at interconnection points and the
P. JAIN & V. SRIDHAR 273
obligation to provide universal services. There are also certain strategic considerations such as the tendency of the governments to retain monopoly control over their naional telecom infrastructure so that resources can be mobilized against any threat to their sovereignty.
The natural monopoly factor is more pervasive and long lasting, particularly in the rural telecom market due to its small size, low revenue potential and slow growth prospects. Serving only limited rural localities may not be economically feasible for service providers. Furthermore, a rural population has a limited capacity to pay for services due to the economic backwardness of rural areas. This results in a two way problem: since economies of production are not fully realized, services cannot be provided at the lowest cost, yet since the paying capacity of the target consumer group is low, higher prices cannot be charged for services.
About 73% of the global basic telecom markets were monopolies at the beginning of 1999 (Info Dev, 2000). Most nations followed a government owned monopoly PTT (Post, Telephone & Telegraph) operator model to start with. India continued to operate under the colonial legacy of the Indian Telegraph Act 1885, with telecoms remaining the exclusive domain of the state until the mid 1990s. Monopolies tend to restrict output, charge unnecessarily high tariffs, operate with bureaucracy and inefficiency and enjoy vast power. Liberalisation, on the other hand, can mitigate these undesirable characteristics and if wide spread competition can be developed and maintained, it can be expected to provide demonstrably superior results (MELODY, 2000). The same reasons for turning to privatisation and liberalisation apply to all countries. At the heart of the common ground is the dawning realization that telecoms are not a luxury and that it is difficult to conceive of such a vast infrastructure without private sector capital (CHOWDARY, 1998).
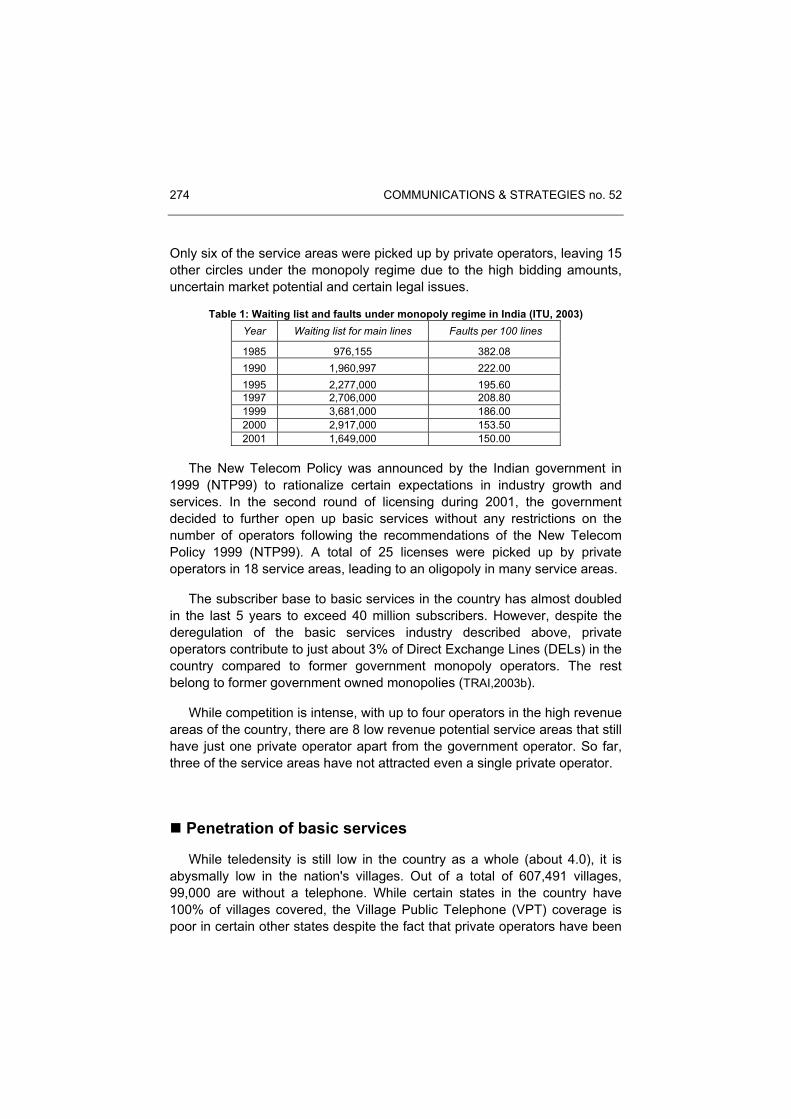
The Indian government also felt the need to include more operators, especially in the basic telecom services marlet mainly due to two factors: (i) the continuing increase in the waiting line of subscribers indicating a supply-demand gap and (ii) the continued poor quality of the service provided by the government operator. The trends in the above factors are illustrated in table 1.
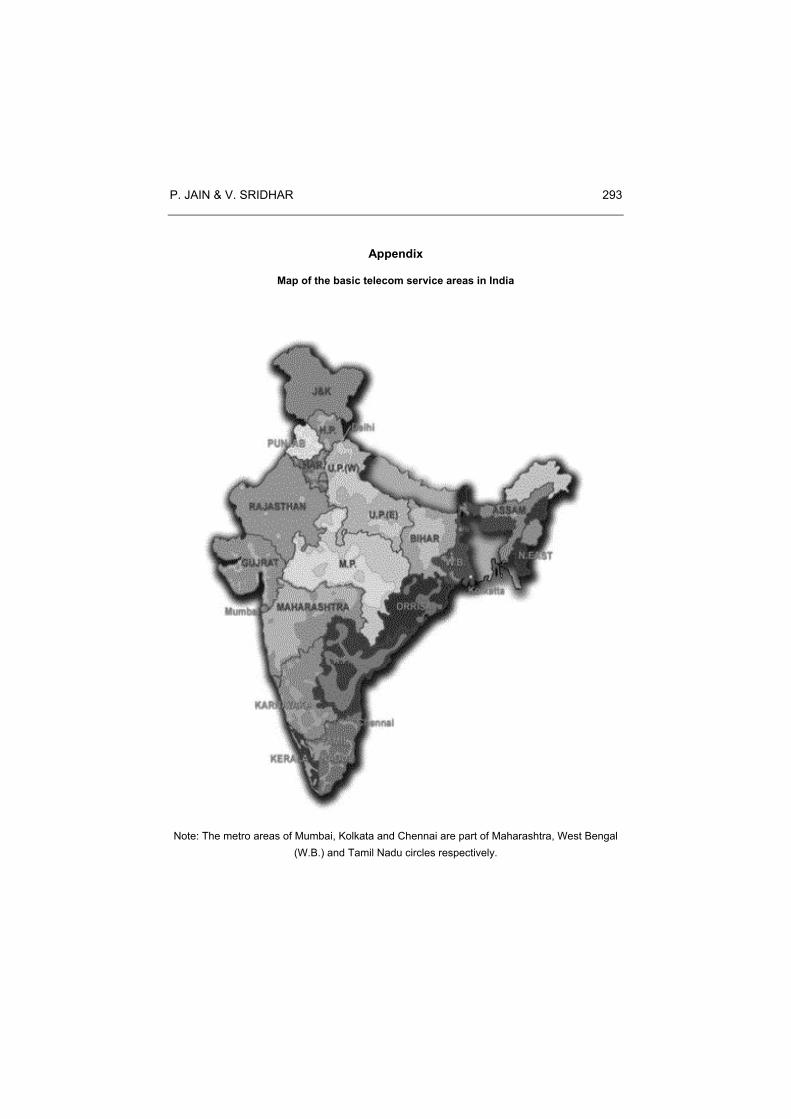
With the introduction of the National Telecom Policy in May 1994 (NTP94), basic telecom services were opened up as a duopoly market for private operators. Twenty-one service areas known as "circles" were formed for giving licenses. A map of the service areas is presented in the Appendix.
274 COMMUNICATIONS & STRATEGIES no. 52
Only six of the service areas were picked up by private operators, leaving 15 other circles under the monopoly regime due to the high bidding amounts, uncertain market potential and certain legal issues.
Table 1: Waiting list and faults under monopoly regime in India (ITU, 2003) Year Waiting list for main lines Faults per 100 lines
1985 976,155 382.08 1990 1,960,997 222.00 1995 2,277,000 195.60 1997 2,706,000 208.80 1999 3,681,000 186.00 2000 2,917,000 153.50 2001 1,649,000 150.00
The New Telecom Policy was announced by the Indian government in 1999 (NTP99) to rationalize certain expectations in industry growth and services. In the second round of licensing during 2001, the government decided to further open up basic services without any restrictions on the number of operators following the recommendations of the New Telecom Policy 1999 (NTP99). A total of 25 licenses were picked up by private operators in 18 service areas, leading to an oligopoly in many service areas.
The subscriber base to basic services in the country has almost doubled in the last 5 years to exceed 40 million subscribers. However, despite the deregulation of the basic services industry described above, private operators contribute to just about 3% of Direct Exchange Lines (DELs) in the country compared to former government monopoly operators. The rest belong to former government owned monopolies (TRAI,2003b).
While competition is intense, with up to four operators in the high revenue areas of the country, there are 8 low revenue potential service areas that still have just one private operator apart from the government operator. So far, three of the service areas have not attracted even a single private operator.
Penetration of basic services
While teledensity is still low in the country as a whole (about 4.0), it is abysmally low in the nation's villages. Out of a total of 607,491 villages, 99,000 are without a telephone. While certain states in the country have 100% of villages covered, the Village Public Telephone (VPT) coverage is poor in certain other states despite the fact that private operators have been
P. JAIN & V. SRIDHAR 275
operating in these states for quite some time. While the government operator continues to take responsibility for improving rural tele-density, contributing 11 million rural DELs, contributions from private operators stand at just about 3,400 DELs (TRAI, 2003b). Hence market competition and the entry of private operators have not fulfilled the objective of universal access in India, especially in rural and remote parts of the country.
Two solutions are emerging to address the problems evoked above: one is a solution based on wireless local loop technology and the other is a policy solution based on a Universal Service Obligation (USO) fund. We describe the status of the implementation of these solutions and the progress made with them below.
Technology convergence
Traditionally basic services were provided using the copper-based wired local loop connecting the subscriber to the end office of the Public Switched Telephone Network (PSTN). In India, the cost of the wired local loop is estimated to be between Rs. 15,000 to Rs. 25,000 and is touted as one of the main hurdles to implementing cost-effective local loop access, especially in rural and remote areas. An indigenous cost-effective Wireless Local Loop (WLL) technology called corDECT, an enhancement of Digital Enhanced Cordless Telephony (DECT), has been developed by one of the premier technology institutes in India (JHUNJHUNWALA, 2000). Apart from reducing the per line cost to Rs. 12,000 – Rs. 15,000, corDECT has been recognized as the most cost-effective technology for providing both voice and internet connectivity in developing countries by the United Nations Development Programme (Business Line,2001). corDECT was adopted by some telcos including the former monopoly operator in India to provide connectivity in certain rural areas of the country.
In the year 2000, BTOs approached the government with a proposal suggesting that they could provide local access loop at much lower cost using Code Division Multiple Access (CDMA) technology. CDMA, developed as a competing technology to Global Systems for Mobile (GSM) for providing cellular services by QualComm in the USA, has found acceptance in emerging markets. BTOs argued that its quick deployment along with high spectral efficiency and per line costs of less than Rs. 10,000 made CDMA a far better alternative than wired access loop for certain areas of the country.
276 COMMUNICATIONS & STRATEGIES no. 52
The technology, which is mainly being developed for cellular services, also offers subscriber mobility.
In January 2001, India's industry policy maker, the Department of Telecommunications (DoT), released guidelines for offering licenses to BTOs wishing to offer limited mobility. According to the guidelines: "A Basic Service Operator shall be allowed to provide mobility to its subscribers with Wireless Access Systems limited within the local area i.e. Short Distance Charging Area (SDCA) in which the subscriber is registered (also known as Wireless Local Loop with Mobility (WLL(M)). While deploying such systems, the operator has to follow the numbering plan of the relevant Short Distance Charging Area (SDCA) and should not be able to authenticate and work with this subscriber terminal equipment in SDCAs where it is not registered. The system should also be engineered so as to ensure that the handover of subscriber does not take place from one SDCA to another SDCA while communicating" (DoT, 2001). Subsequent to the above announcement, BTOs have started deploying CDMA 2000 1X technology, which can provide voice as well as high speed data connectivity. With these offerings the basic service becomes very similar to the services being provided by cellular operators. The subscriber base of wireless local loop services has already exceeded 2 million in the country. The number of wireless subscribers including cellular subscribers in certain metropolitan areas is almost equal to wireline subscribers. It is expected that wireless subscribers will cross the wireline subscribers in India by 2007 (ET, 2003a).
In view of the above developments resulting from technological convergence, the telecom regulator TRAI has issued a discussion paper on unified licensing for both basic and cellular services, to bring in competition and reduced prices for the consumers (TRAI, 2003c). This may make it possible to avoid the duplication of infrastructure and to build efficiencies through the synergy of both basic and cellular networks in the country.
Universal service obligation fund
Although the license agreement specifies roll-out obligations for private BTOs, in terms of the coverage of rural areas, these conditions have not been met. The main reason for this is the high cost of providing access and the low revenue potential in these areas of the country. Although the cost per access line has been reduced by deploying wireless technologies as mentioned, the lower level of disposable income in rural areas means that
P. JAIN & V. SRIDHAR 277
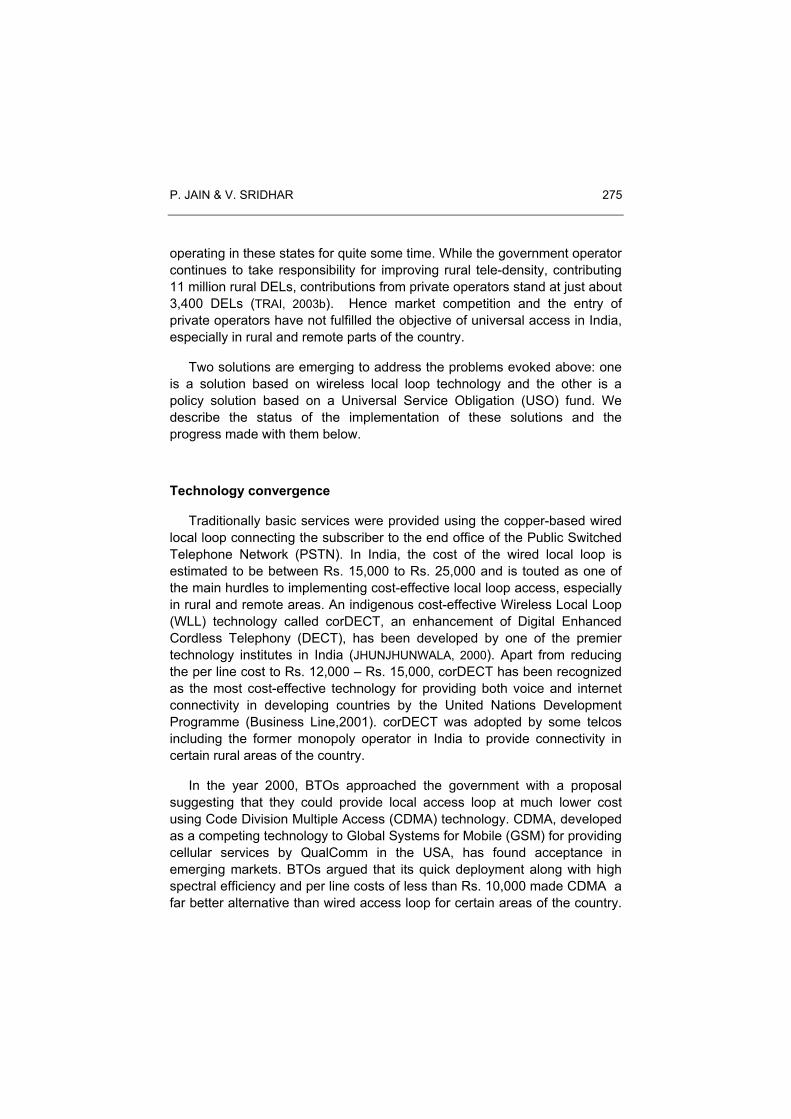
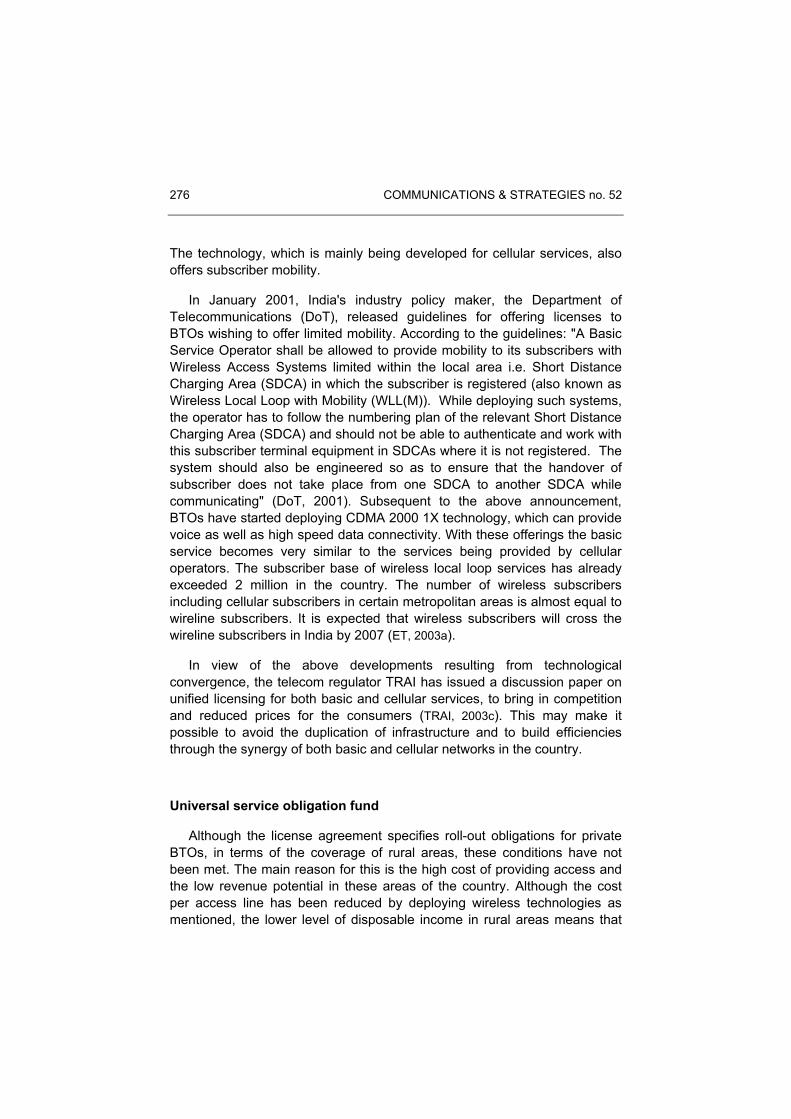
revenue potential remains low. Table 2 gives the annual household income in rural areas of the country (BERRY & SHUKLA, 2003) and affordable telecom expenditure, assuming that the rural households can spend a maximum of 6% of their income on telecom related services (JHUNJHUNWALA, 2000). The existing average annual rentals fixed by the regulator TRAI for rural DELs is about USD 28, which over 50% of households can afford. However, TRAI has estimated that cost based monthly rental is more than USD 100 (TRAI, 2003a), and hence affordable by only less than 4% of rural households.
Thus to bring the standard price of basic services with in everyone's reach, especially in rural areas, and to provide incentives for private BTOs to fulfill their licensing obligations in covering rural areas, NTP99 envisaged charging a Universal Service Levy (USL), at a prescribed percentage of the revenue (5% currently) earned by the operators holding different types of licenses as a contribution towards the Universal Service Obligation (USO) fund. Basic service providers who fulfill their USO for rural and remote areas will be reimbursed the net cost of providing the universal service from the funds collected by way of USL. The USO fund is now worth over USD 350 million and the government is in the process of providing statutory status to the USO fund for effective distribution amongst BTOs (ET, 2003b).
Table 2: Income and affordability of telecom services in rural India Annual household income
(USD) Affordable telecom expenditure
(in USD) % of households
>1920 >115 1.5 1440 - 1920 86 – 115 2 960 - 1440 58 - 86 7 480 – 960 29 – 58 24 360 – 480 22 - 29 21 240 – 360 15 – 22 18.5
<240 <15 26
Pricing of basic services
There are two possible alternatives for pricing any telecommunications service: (i) socially desirable pricing and (ii) cost based pricing (SRIKUMAR et al., 2001). The principle of socially desirable pricing, which forms the basis for basic telecom pricing strategies in most developing countries, is to charge customers only as much as they are able to pay. Such a strategy dictates that the price of basic telephone services should be low and usually not related to the cost of provisioning services. Rental and usage charges are
278 COMMUNICATIONS & STRATEGIES no. 52
normally cross-subsidised by the more expensive business, long distance and international long distance services. In a cost-based pricing structure, tariffs are based on the cost of the network elements in providing service. Fixed charges, known as rentals, recover the capital costs of the infrastructure required to build the network. Variable charges, known as usage charges, recover operation, maintenance, administrative and interconnection charges, distributed based on minutes of usage. Until recently, Indian subscribers were paying very high long distance and international call charges to cross subsidize basic services. Cross subsidization was possible during the monopoly regime when the government operator was providing local, national and international services. With the entry of private operators and the incorporation of different licensing schemes for different services, it has become increasingly difficult to sustain the socially desirable pricing scheme.
In its recent Telecommunication Interconnection Usage Charges (IUC) regulation, TRAI tried to marry the two pricing schemes mentioned above (TRAI, 2003a). According to this regulation, an Access Deficit Charge (ADC) of about USD 4.50 per DEL per month is computed that is to be paid to the BTOs to cover the deficit between the cost based monthly rental and average monthly rental tariff. ADC is applicable only for BSOs who offer fixed line service and is charged only for long distance calls. As per TRAI (2003a), the rental tariff for wireline services varies from USD 1.50 to 6 per month depending on the capacity of the exchange to which a DEL is connected. TRAI has recognized the long-term impact of cross subsidization and has indicated that ADC will eventually be phased out.
Quality as a differentiator in an oligopoly market
In an oligopoly market, quality is a vital factor in determining the overall competitive performance of service providers. Quality offers a strategic advantage in a duopoly competitive situation. Rivals must offer better quality than their competitors in the market place to gain a 'first mover advantage' over rivals. One strategy that has been related to success in service industries such as telecoms is the delivery of a high quality of service (THOMPSON, DESOUZA et al., 1985).
Quality may be connected with a number of features of the firm and its products and/or services. Quality products can be generally defined as those that consistently meet the requirements of functionality, design, market price
P. JAIN & V. SRIDHAR 279
and availability to the customer and of lower costs to the firm with fewer acceptable defects and with proper maintenance possibilities (SICE et al., 2000). PARASURAMAN et al. (1988) suggests that customers do not perceive quality as a one-dimensional concept. They stress that customers assessment of quality include perception of multiple factors. Models examining product differentiation in a quality conscious oligopoly market have been developed by SHAKED & SUTTON (1981) and GABSZEWICZ et al., (1981).
ZEITHAML & BITNER (2000) illustrate that service quality is a part of overall customer satisfaction and has the following six dimensions: reliability (ability to perform the promised service dependably and accurately), responsiveness (willingness to help customers and provide prompt service), assurance (knowledge and courtesy of employees and their ability to inspire trust and confidence), empathy (caring, individual attention to customers) and tangibles (physical facilities, equipments). While some of the above such as reliability and tangibles can be objectively measured, responsiveness, assurance and empathy depend on customers' perceptions and can be subjective. Since perceptions are always considered relative to expectations and expectations are dynamic and ever changing, evaluation of quality shifts over time even in the same cultural, economic and social environment. What is considered as quality or satisfactory to customers today may be different tomorrow.
Based on the theoretical framework measuring quality suggested above, we propose that the customers of basic telecom service, experience different levels of price, telecom service quality and customer service quality from service providers. Features of telecom service quality include: the types and variety of services being provided, call completion rate, call dropping percentage, accumulated network down time, dial tone delay, reported fault incidence rate, grade of service, coverage, network performance, reliability, and availability. These features depend upon the quality and amount of telecom infrastructure deployed by service providers and can be objectively measured. Customer service quality, on the other hand, is based on customers' perceptions regarding customer care, help services, billing and supplementary services, experience with fault repairs, average time to attend customer complaints, repair time taken, responsiveness, empathy, assurance and the courtesy of service personnel. Hence we postulate that the overall quality / satisfaction level is a function of price, telecom service quality and customer service quality and is a determinant of competitiveness in an oligopoly market.
280 COMMUNICATIONS & STRATEGIES no. 52
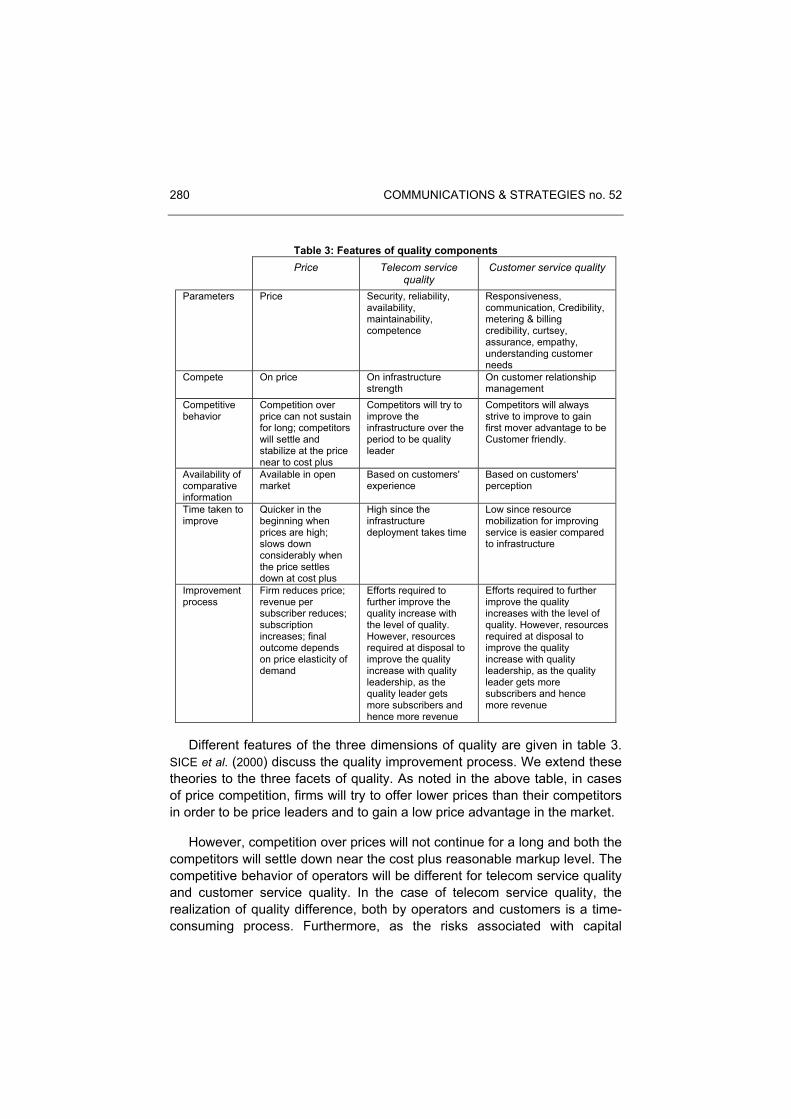
Table 3: Features of quality components Price Telecom service
quality Customer service quality
Parameters Price Security, reliability, availability, maintainability, competence
Responsiveness, communication, Credibility, metering & billing credibility, curtsey, assurance, empathy, understanding customer needs
Compete On price On infrastructure strength
On customer relationship management
Competitive behavior
Competition over price can not sustain for long; competitors will settle and stabilize at the price near to cost plus
Competitors will try to improve the infrastructure over the period to be quality leader
Competitors will always strive to improve to gain first mover advantage to be Customer friendly.
Availability of comparative information
Available in open market
Based on customers' experience
Based on customers' perception
Time taken to improve
Quicker in the beginning when prices are high; slows down considerably when the price settles down at cost plus
High since the infrastructure deployment takes time
Low since resource mobilization for improving service is easier compared to infrastructure
Improvement process
Firm reduces price; revenue per subscriber reduces; subscription increases; final outcome depends on price elasticity of demand
Efforts required to further improve the quality increase with the level of quality. However, resources required at disposal to improve the quality increase with quality leadership, as the quality leader gets more subscribers and hence more revenue
Efforts required to further improve the quality increases with the level of quality. However, resources required at disposal to improve the quality increase with quality leadership, as the quality leader gets more subscribers and hence more revenue
Different features of the three dimensions of quality are given in table 3. SICE et al. (2000) discuss the quality improvement process. We extend these theories to the three facets of quality. As noted in the above table, in cases of price competition, firms will try to offer lower prices than their competitors in order to be price leaders and to gain a low price advantage in the market.
However, competition over prices will not continue for a long and both the competitors will settle down near the cost plus reasonable markup level. The competitive behavior of operators will be different for telecom service quality and customer service quality. In the case of telecom service quality, the realization of quality difference, both by operators and customers is a time-consuming process. Furthermore, as the risks associated with capital
P. JAIN & V. SRIDHAR 281
investment and upgrading technology to improve telecom service quality are higher, it will take firms longer to improve quality. Even after making decisions to invest, the mobilisation of resources such as capital, manpower, technology and equipment will be slower. However, customers' perception of service quality is a relatively quicker process and hence will help firms in making improvement decisions faster. As improvement in customer service quality does not involve the amounts of effort and resources required by infrastructure development, the mobilization of resources should be rapid enough to jump ahead of others in a short period.
Quality levels of Indian basic telecom operators
In India, the telecom regulator, TRAI, has been conducting periodic studies with the objective of evaluating customer satisfaction and telecom service providers' performance levels (TRAI 2003d). The authority also broadly uses some of the aspects we have outlined above in their study to determine the quality of service offered by different service providers.
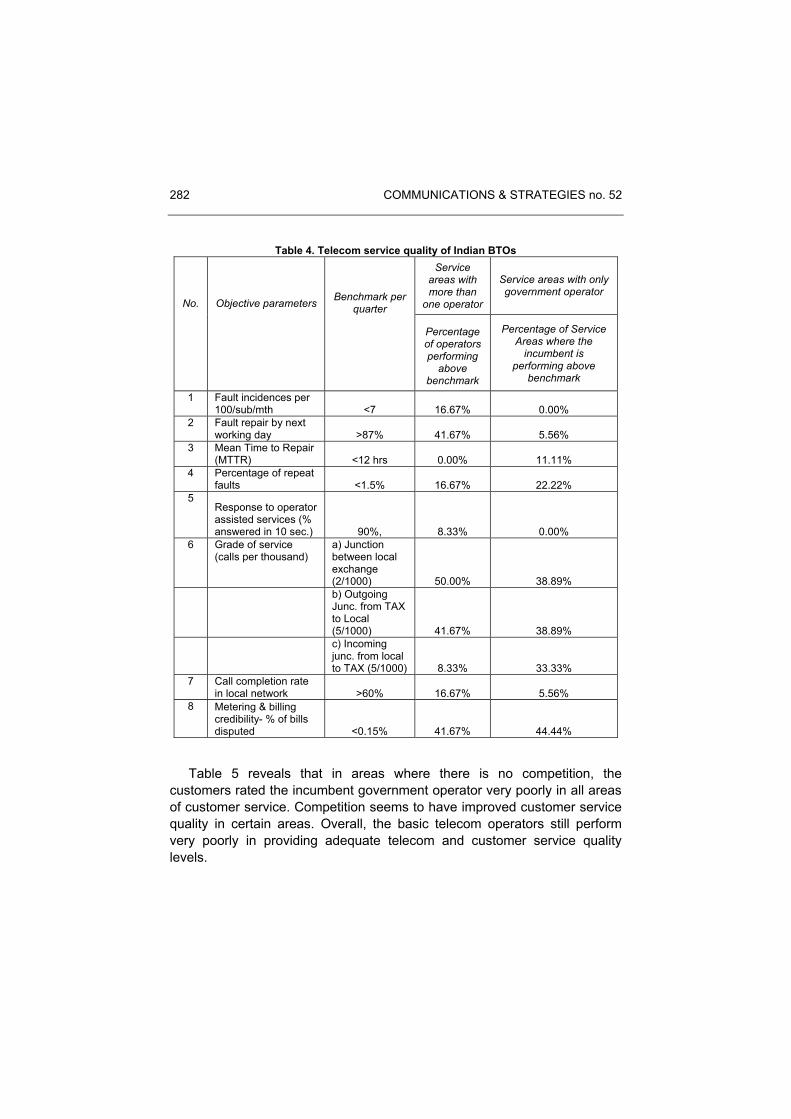
Selective objective parameters used for evaluating telecom service quality are presented in table 4. Table 4 also gives the benchmark performance level for each parameter set by the regulator and the number of service providers who meet and fail to meet the specified benchmark levels. In areas where only the government incumbent operator is providing services, the number of service areas in which the incumbent is performing better than the benchmark level is also indicated. An analysis of the table reveals that the telecom service quality offered by BTOs is poor, even in areas where there is competition. The only parameter in which competition has brought about a substantial improvement is the percentage of fault repairs by the next working day. The grade of service offered is still very poor with only about half of the operators providing a grade of service of 99.8% at a local exchange level.
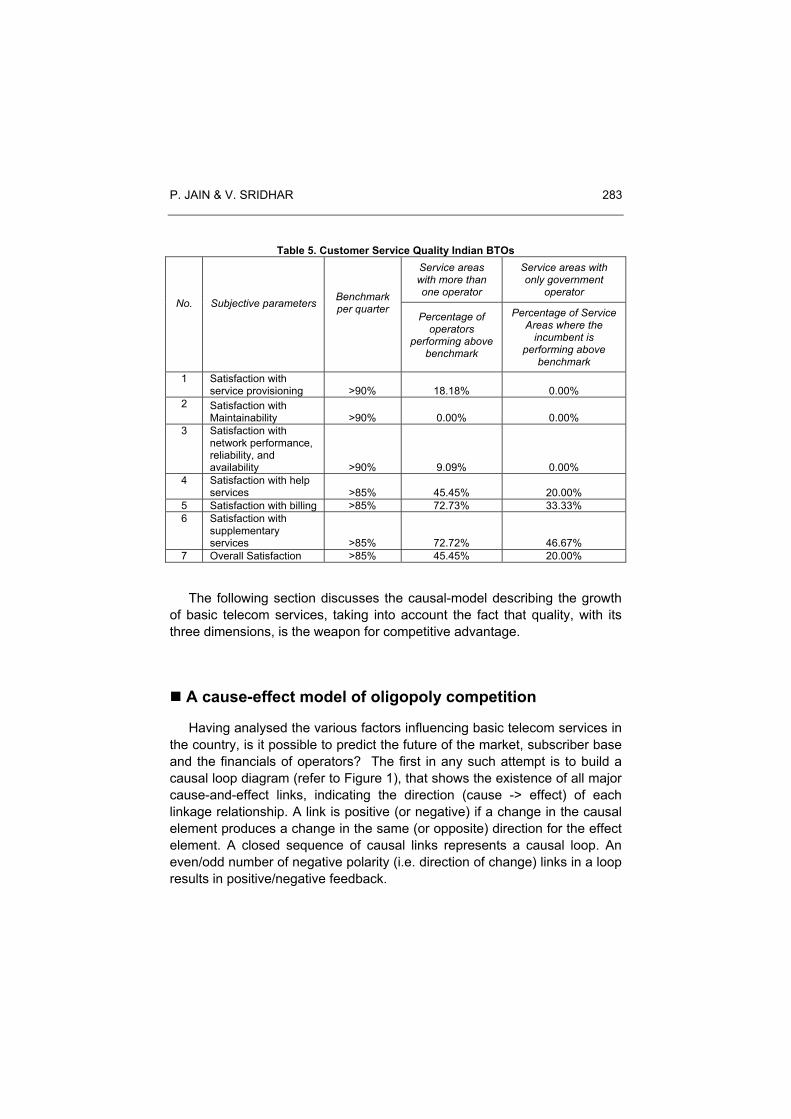
TRAI also conducted a questionnaire-based survey to assess the perceptions of customer service quality of the various operators. A select set of these subjective parameters along with performance benchmark and the number of operators satisfying the benchmark levels are given below in table 5.
282 COMMUNICATIONS & STRATEGIES no. 52
Table 4. Telecom service quality of Indian BTOs Service
areas with more than
one operator
Service areas with only government operator
No. Objective parameters
Benchmark per quarter
Percentage of operators performing
above benchmark
Percentage of Service Areas where the
incumbent is performing above
benchmark
1 Fault incidences per 100/sub/mth <7 16.67% 0.00%
2 Fault repair by next working day >87% 41.67% 5.56%
3 Mean Time to Repair (MTTR) <12 hrs 0.00% 11.11%
4 Percentage of repeat faults <1.5% 16.67% 22.22%
5 Response to operator assisted services (% answered in 10 sec.) 90%, 8.33% 0.00%
6 Grade of service (calls per thousand)
a) Junction between local exchange (2/1000) 50.00% 38.89%
b) Outgoing Junc. from TAX to Local (5/1000) 41.67% 38.89%
c) Incoming junc. from local to TAX (5/1000) 8.33% 33.33%
7 Call completion rate in local network >60% 16.67% 5.56%
8 Metering & billing credibility- % of bills disputed <0.15% 41.67% 44.44%
Table 5 reveals that in areas where there is no competition, the customers rated the incumbent government operator very poorly in all areas of customer service. Competition seems to have improved customer service quality in certain areas. Overall, the basic telecom operators still perform very poorly in providing adequate telecom and customer service quality levels.
P. JAIN & V. SRIDHAR 283
Table 5. Customer Service Quality Indian BTOs Service areas with more than one operator
Service areas with only government
operator No.
Subjective parameters
Benchmark per quarter
Percentage of
operators performing above
benchmark
Percentage of Service Areas where the
incumbent is performing above
benchmark 1 Satisfaction with
service provisioning >90% 18.18% 0.00% 2 Satisfaction with
Maintainability >90% 0.00% 0.00% 3 Satisfaction with
network performance, reliability, and availability >90% 9.09% 0.00%
4 Satisfaction with help services >85% 45.45% 20.00%
5 Satisfaction with billing >85% 72.73% 33.33% 6 Satisfaction with
supplementary services >85% 72.72% 46.67%
7 Overall Satisfaction >85% 45.45% 20.00%
The following section discusses the causal-model describing the growth of basic telecom services, taking into account the fact that quality, with its three dimensions, is the weapon for competitive advantage.
A cause-effect model of oligopoly competition
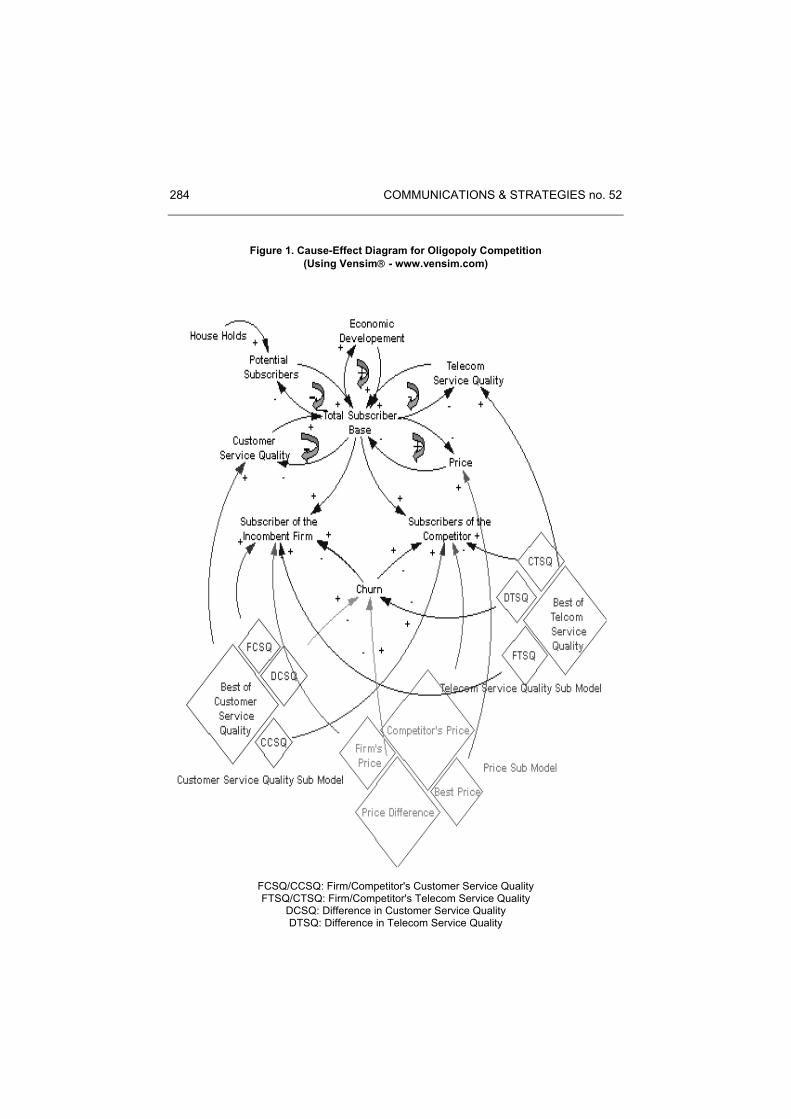
Having analysed the various factors influencing basic telecom services in the country, is it possible to predict the future of the market, subscriber base and the financials of operators? The first in any such attempt is to build a causal loop diagram (refer to Figure 1), that shows the existence of all major cause-and-effect links, indicating the direction (cause -> effect) of each linkage relationship. A link is positive (or negative) if a change in the causal element produces a change in the same (or opposite) direction for the effect element. A closed sequence of causal links represents a causal loop. An even/odd number of negative polarity (i.e. direction of change) links in a loop results in positive/negative feedback.
284 COMMUNICATIONS & STRATEGIES no. 52
Figure 1. Cause-Effect Diagram for Oligopoly Competition (Using Vensim - www.vensim.com)
FCSQ/CCSQ: Firm/Competitor's Customer Service Quality FTSQ/CTSQ: Firm/Competitor's Telecom Service Quality
DCSQ: Difference in Customer Service Quality DTSQ: Difference in Telecom Service Quality
P. JAIN & V. SRIDHAR 285
To get an integrated view of the model, we start with the main variable - Total Subscriber Base i.e. subscribers to the basic telecommunication services in a circle/area, which represents growth in telecommunication services. Potential subscribers are the households willing and capable of subscribing to basic telecom services. An increase in the number of households increases the number of potential subscribers. The relation has been represented with the positive causal linkage. As potential subscribers subscribe to the service there is a natural depletion of the potential subscriber base. This bi-directional relationship forms a loop with negative polarity i.e. a negative feedback loop. As the economic development of the service area increases, the disposable income of the households increases and hence more will subscribe to the telecom service. A reverse causality also exists between economic development and telecommunication penetration levels (HARDY, 1980). As the telecom subscriber base increases, it boosts the economic development of the area. This bi-directional relationship forms a positive feedback loop.
An increase in the number of subscribers causes a decline in the customer services offered, leading to a decrease in customer service quality. However, the customer service obtained by the subscriber is determined by the best of the service offered by the firms in the market place. To attain a competitive advantage, service providers will strive to improve their service performance to keep pace with the increase in the subscriber base, by improving customer interfaces, relationship management and metering and billing standards. This bi-directional relationship forms the negative feedback loop. Similarly, with increases in the subscriber base and hence a corresponding increase in the amount of information traffic and the frequency of requests for connection establishment, telecom service quality deteriorates due to a congestion effect. However, as with customer service quality, service providers will increase telecom service quality by setting up more switching infrastructure and enhancing the quality of access loops and trunks, which will, in turn, lead to growth in the subscriber base.
The price of services also plays an important role in determining the growth of services especially in developing countries like India, where price elasticity of demand for telecommunication services is very high. Increases in rental and subscription charges shows its negative effect on subscriber levels in the service area. However, as service providers gain experience and pick up more and more subscribers, the prices for services in general should decrease due to the effects of economies of scale. This bi-directional relationship is represented by the positive feedback loop.
286 COMMUNICATIONS & STRATEGIES no. 52
In this model we have represented duopoly market conditions featuring a firm, the incumbent and a competitor, the new entrant. The total subscriber base in a service area is distributed between the firm and the competitor in the market. However, the proportion of subscribers who opt for the firm/competitor is determined by the level of price, customer service quality and telecom service quality offered by the firm/competitor. While an increase in the price of the service by the firm/competitor reduces the subscriber base of firm/competitor, an increase in the customer and/or telecom service quality provided by the firm/competitor increases the subscription base of the firm/competitor. The above processes are represented in the causal loop diagram with linkages of appropriate polarity.
In a competitive market, "churn" of subscribers amongst the service providers happens. In an evolving market such as India, the churn rate is very high (close to 4-6% per month), as witnessed for cellular services (ET, 2003c). Customers' perception of differences in price, customer service quality and telecom service quality determines the churn rate between the firm and the competitor. When churn is in favor of the firm/competitor, firm's/competitor's subscriber base grows and there is a corresponding decrease in the subscriber base of competitor/firm. To succeed in a duopoly, service providers must continuously offer better quality than their competitor(s).
The above model provides a synergistic view of the competitive basic telecom services market. While the parameters of the model and the cause-effect relationships are in general applicable to basic telecom services in any country, the values and functional forms of the model parameters can vary from country to country. For example, the growth in economic development index, number of households and infrastructure development for India, rely on data collected from various sources (Economic Survey, 2003; NATRAJAN, 1998) and incorporated in the simulation model. The relative market position of the former monopoly government operator has been incorporated using previous data. These differ across countries and hence the impact of the various parameters on the final outcome variable, viz. growth in the subscriber base, will be different across countries.
Techno-economic simulations of the above model can be used to replicate the conditions of the telecommunications technology and the economic environment of the target market so that growth in telecom services can be investigated and monitored by researchers, planners and managers. Once calibrated, such models can be used to determine the effect of variation of model parameters on different outcome variables,
P. JAIN & V. SRIDHAR 287
especially growth in the subscriber base for basic telecom services. The following section presents a simulation exercise we carried out with the above model and its validity.
Simulation results and conclusions
The duopoly model based on the above cause-effect feedback model has been developed using ithink® (http://www.hps-inc.com) system dynamics software. The model was calibrated for one of the service areas (the "Andhra Pradesh" circle) where a duopoly market has existed since 1999. DELs (Direct Exchange Lines) details have been taken as an indicator for the growth of basic telecommunication services.
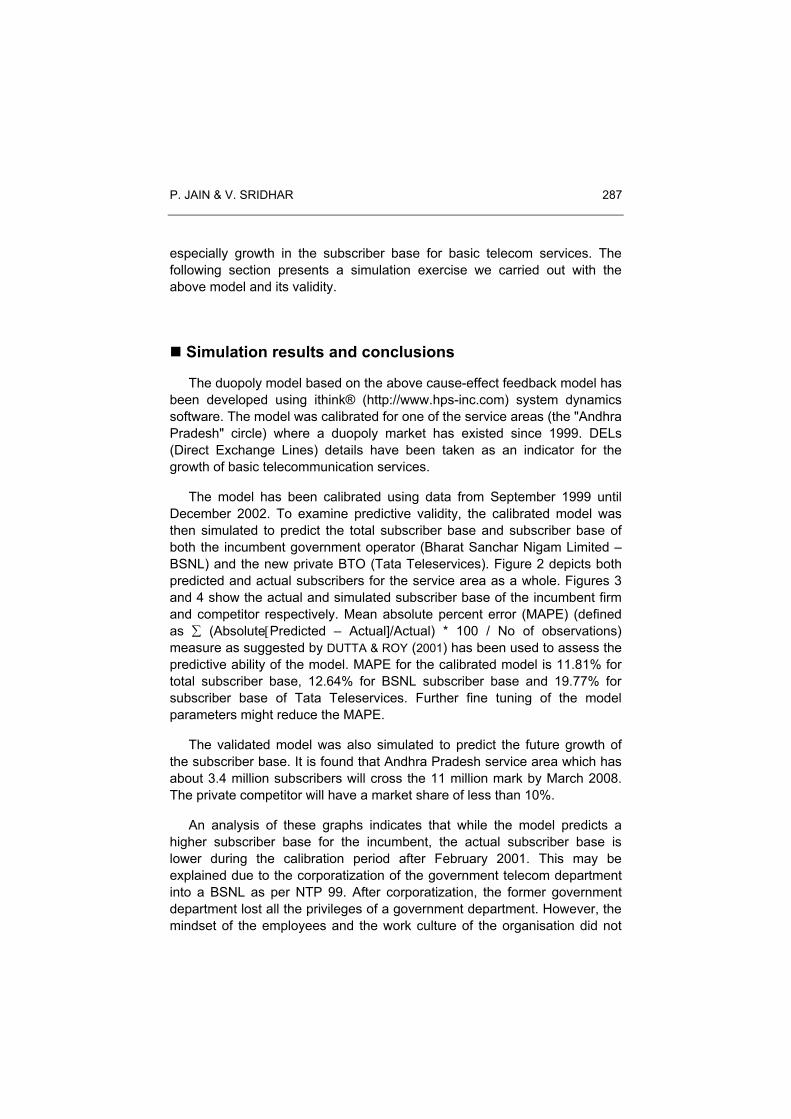
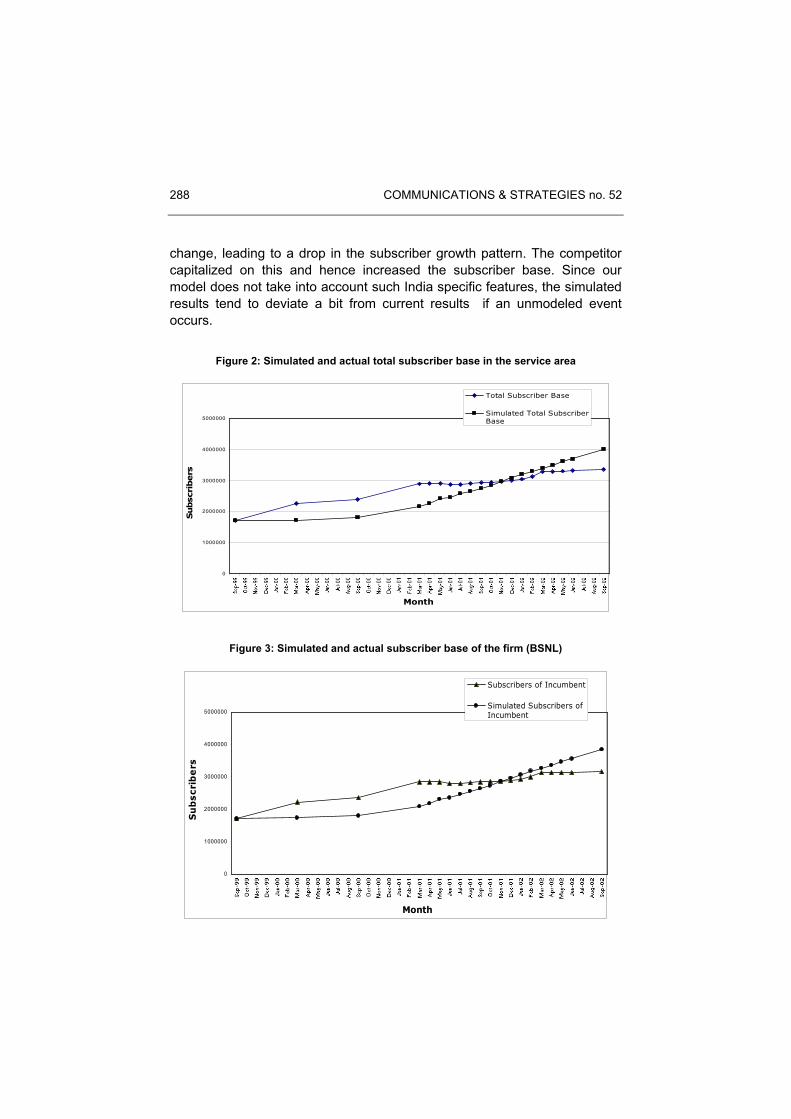
The model has been calibrated using data from September 1999 until December 2002. To examine predictive validity, the calibrated model was then simulated to predict the total subscriber base and subscriber base of both the incumbent government operator (Bharat Sanchar Nigam Limited – BSNL) and the new private BTO (Tata Teleservices). Figure 2 depicts both predicted and actual subscribers for the service area as a whole. Figures 3 and 4 show the actual and simulated subscriber base of the incumbent firm and competitor respectively. Mean absolute percent error (MAPE) (defined as ∑ (Absolute[Predicted – Actual]/Actual) * 100 / No of observations) measure as suggested by DUTTA & ROY (2001) has been used to assess the predictive ability of the model. MAPE for the calibrated model is 11.81% for total subscriber base, 12.64% for BSNL subscriber base and 19.77% for subscriber base of Tata Teleservices. Further fine tuning of the model parameters might reduce the MAPE.
The validated model was also simulated to predict the future growth of the subscriber base. It is found that Andhra Pradesh service area which has about 3.4 million subscribers will cross the 11 million mark by March 2008. The private competitor will have a market share of less than 10%.
An analysis of these graphs indicates that while the model predicts a higher subscriber base for the incumbent, the actual subscriber base is lower during the calibration period after February 2001. This may be explained due to the corporatization of the government telecom department into a BSNL as per NTP 99. After corporatization, the former government department lost all the privileges of a government department. However, the mindset of the employees and the work culture of the organisation did not
288 COMMUNICATIONS & STRATEGIES no. 52
change, leading to a drop in the subscriber growth pattern. The competitor capitalized on this and hence increased the subscriber base. Since our model does not take into account such India specific features, the simulated results tend to deviate a bit from current results if an unmodeled event occurs.
Figure 2: Simulated and actual total subscriber base in the service area
0
1000000
2000000
3000000
4000000
5000000
Month
Subscribers
Total Subscriber Base
Simulated Total SubscriberBase
Figure 3: Simulated and actual subscriber base of the firm (BSNL)
0
1000000
2000000
3000000
4000000
5000000
Month
Subscribers
Subscribers of Incumbent
Simulated Subscribers ofIncumbent
P. JAIN & V. SRIDHAR 289
Figure 4: Simulated and actual subscriber base of the competitor (Tata Teleservices)
0
100000
200000
300000
Sep-99 Jan-00 M ay-00 Sep-00 Jan-01 M ay-01 Sep-01 Jan-02 M ay-02 Sep-02
Month
Subscribers
Subscribers of Competitor
Simulated Subscribers ofCompetitor
Another important lesson from this growth model is that the incumbent has a very large subscriber base and will continue to dominate the basic telecom services in India. Service area specific licensing does not provide sufficient scale economies for smaller operators to provide basic services against the large government operator. Only private operators who have nation-wide presence will be able to attain even financial closures of their projects. Currently in India only one such private operator has got near nation-wide basic telecom license, and even this service provider is finding it tough to attract the limited potential subscriber base in the country. Moreover, the government operator having over more than 40 million subscribers could arm-twist the new entrants on interconnection issues. If the government really wants to introduce sustainable competition, it may have to resort to unified licensing as opposed to sector-specific licensing. Recently the Indian government and the regulator have announced the possibility of introducing unified licensing (TRAI, 2003c). Communications Convergence Bill (CCBill, 2003), which is yet to be enacted in Indian parliament, has also proposed a new unified licensing scheme to provide a sustainable and competitive telecom environment in India.
Thus this model can be used to study the impact of variation of model parameters on the growth of basic telecommunication services, market share of both the operators in the service area. The same can be used as policy debate and decision support tool for all the stakeholders (the regulator, the incumbent, and the new entrants) to establish and oversee a
290 COMMUNICATIONS & STRATEGIES no. 52
healthy competitive operating environment, that can provide comprehensive service offerings and optimal prices for consumers.
The Indian telecom industry is witnessing a shift from an era of total monopoly to duopoly and even oligopoly in certain service areas. Researchers, academicians, regulators and telecom managers need to understand the complex dynamics of this transition phase of the Indian telecom industry to make future investment and/or to make sound policy decisions. The causal feedback model proposed in this research encapsulates all of the relevant techno-economic variables affecting the basic telecommunication industry. The model validates to reality and can be used as a decision support tool to analyse the effect of different variables on subscriber growth. We plan to calibrate the model for more service areas to turn it into a robust decision/policy support tool.
P. JAIN & V. SRIDHAR 291
References
BERRY S. & SHUKLA R.K. (2003): "NCAER's Market Information Survey of Households", Economic and Political Weekly, January 25th, 350-361.
Business Line (2001): UNDP pat for India's Tech Initative.
CHOWDARY T. H. (1998): "Telecom liberalization and competition in developing countries", Telecommunications Policy, 22(4/5), 259-265.
Communication Convergence Bill (CCBill) (2003): Retrieved from: http://164.100.24.208/ls/committeeR/Communication/39.pdf. On October 10th 2003.
CRONIN F.J., PARKER E.B., COLLERAN E.K. & GOLD M.A. (1991): "Telecommunications infrastructure and economic growth: An analysis of causality", Telecommunications Policy, 15(6), 529-535.
Department of Telecommunications (DoT) (2001): Guidelines for Issue of License for Basic Service, Retrieved from http://www.dotindia.com on September 28th, 2003.
DUTTA A. (2001): "Business Planning for Network Services: A Systems Thinking Approach", Information Systems Research, l2(3), 260-283.
DUTTA A. & ROY R. (2001): "The Mechanism of Internet Diffusion in India: Lessons for Developing Countries", Proceedings of International Conference on Information Systems-2001, New Orleans, USA.
Economic Survey (2003): Government of India Publication.
Economic Times (ET) : - (2003a): "Cell Trumps Landlines in Delhi", August 4, Retrieved from: http://www.economictimes.com/ on August 4th, 2003. - (2003b): "Changes to Telegraph Act Cleared", July 11,Retrieved from: http://www.economictimes.com/ on August 11th, 2003. - (2003c): "Cellcos face the churn as competition intensifies", August 22nd, Retrieved from: http://www.economictimes.com/ on August 22nd, 2003.
GABSZEWICZ J., SHAKED A., SUTTON J. & THISSE J. (1981): "International Trade in Differentiated Products", International Economic Review, 22(3): 527-534.
HARDY & ANDREW (1980): "The role of the telephone in economic development", Telecommunications Policy, 4(4): 278-286 (Abstract).
InfoDev (2000): Telecommunications Regulation Handbook, Retrieved from: http://www.infodev.org/projects/314regulationhandbook/index.htm, on March 3rd, 2003.
International Telecommunications Union (ITU) (2003): Yearbook of Statistics, ITU, Geneva, Switzerland, March.
292 COMMUNICATIONS & STRATEGIES no. 52
JHUNJHUNWALA A. (2000): "Unleashing Telecom and Internet in India", India Telecom Conference, Asia/Pacific Research Center, Stanford University, Retrieved from: http://www.tenet.res.in/papers/unleash.html, March 3rd, 2003.
MELODY W.H. (2000): "Shaping Liberalized Telecom Markets", Telecommunications Policy, 24, 803-806.
MIKEROV I. & SOTO O.G.(1998): "Modeling And Selecting Best Access Networks", Alcatel Telecommunication Review, Second Quarter, 144-145.
NATRAJAN I.(1998): Indian Market Demographics Report-1998, NCEAR.
PARASURAMAN A., V. A. ZEITHAML et al. (1988): "SERVQUAL: A Multiple-Item Scale for Measuring Consumer Perceptions of Service Quality", Journal of Retailing, 64(Spring 1988): 5-17.
SHAKED A. & SUTTON J. (1981): "Heterogeneous Consumers and Product Differentiation in a Market for Professional Services", European Economic Review, 16(2): 159-177.
SICE P., E. MOSEKILDE et al. (2000): "Using System Dynamics to analyze interactions in duopoly competition", System Dynamics Review, 16: 2.113-133.
SRIKUMAR K., P. JAIN et al. (2001): "Cellular Pricing: Greener or Leaner", Voice & Data, 8(5): 74-77.
Telecommunications Regulatory Authority of India: - (2003a): "The Telecommunication Interconnection Usage Charges Regulation", Retrieved from: http://www.trai.gov.in on April 29th, 2003. - (2003b): "Indian Telecommunications Industry Performance Indicators 2002-2003", Retrieved from: http://www.trai.gov.in on August 4th, 2003. - (2003c): "Consultation paper on Unified Licensing for Basic and Cellular Services", Retrieved from: http://www.trai.gov.in on August 1st, 2003. - (2003d): "Survey Conducted by Telecommunication Regulatory Authority of India to assess QoS provided by BSOs/CMSOs- Summarized results Oct-Dec 2001", Retrieved from: http://www.trai.gov.in on August 4th, 2003.
THOMPSON P., G. DESOUZA et al. (1985): The Strategic Management of Service Quality, Cambridge, MA: The Strategic Planning Institute.
ZEITHAML V. A. & M. J. BITNER (2000): Service Marketing: Integrating Customer Focus Across the Firm, New Delhi, Tata McGraw-Hill Publishing Co Ltd.
P. JAIN & V. SRIDHAR 293
Appendix
Map of the basic telecom service areas in India
Note: The metro areas of Mumbai, Kolkata and Chennai are part of Maharashtra, West Bengal (W.B.) and Tamil Nadu circles respectively.
Related Documents