Analysis of CD31 as a T-cell thymic proximity marker Nienke Vrisekoop 1 , José A.M. Borghans 1 , Anne Bregje de Boer 1 , Erik Mul 2 , Neeltje Willems 1 , Sigrid A. Otto 1 , Kiki Tesselaar 1 and Frank Miedema 1 1 Department of Immunology, University Medical Center Utrecht, Utrecht, The Netherlands; 2 Department of Clinical Viro-Immunology, Sanquin Research and Landsteiner Laboratory, Academic Medical Center, University of Amsterdam, Amsterdam, The Netherlands Chapter

Welcome message from author
This document is posted to help you gain knowledge. Please leave a comment to let me know what you think about it! Share it to your friends and learn new things together.
Transcript
Analysis of CD31 as a T-cell thymic
proximity marker
Nienke Vrisekoop1, José A.M. Borghans1, Anne Bregje de Boer1, Erik Mul2, Neeltje
Willems1, Sigrid A. Otto1, Kiki Tesselaar1 and Frank Miedema1
1Department of Immunology, University Medical Center Utrecht, Utrecht, The
Netherlands; 2Department of Clinical Viro-Immunology, Sanquin Research and
Landsteiner Laboratory, Academic Medical Center, University of Amsterdam,
Amsterdam, The Netherlands
Chapter
Chapter 7
90
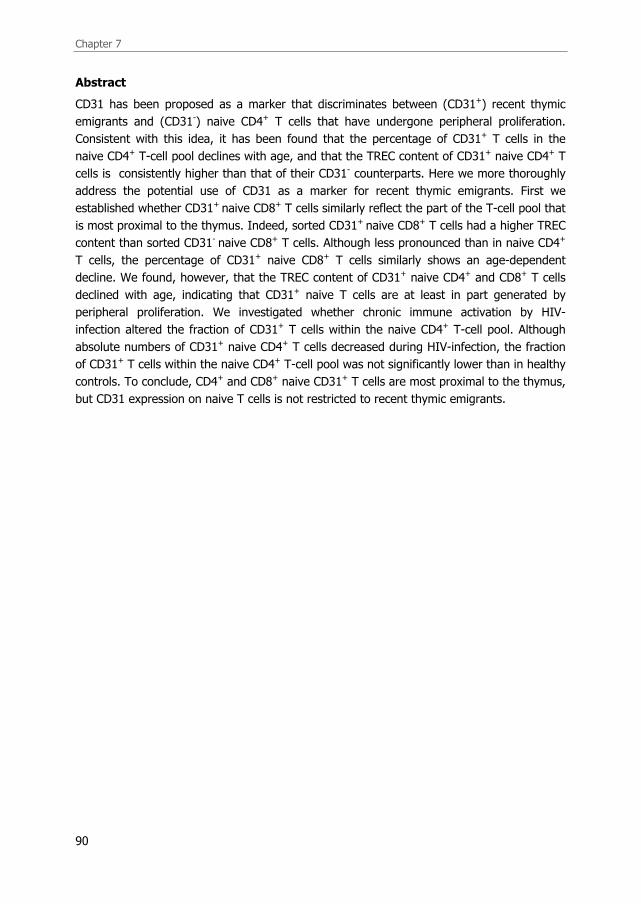
Abstract
CD31 has been proposed as a marker that discriminates between (CD31+) recent thymic
emigrants and (CD31-) naive CD4+ T cells that have undergone peripheral proliferation.
Consistent with this idea, it has been found that the percentage of CD31+ T cells in the
naive CD4+ T-cell pool declines with age, and that the TREC content of CD31+ naive CD4+ T
cells is consistently higher than that of their CD31- counterparts. Here we more thoroughly
address the potential use of CD31 as a marker for recent thymic emigrants. First we
established whether CD31+ naive CD8+ T cells similarly reflect the part of the T-cell pool that
is most proximal to the thymus. Indeed, sorted CD31+ naive CD8+ T cells had a higher TREC
content than sorted CD31- naive CD8+ T cells. Although less pronounced than in naive CD4+
T cells, the percentage of CD31+ naive CD8+ T cells similarly shows an age-dependent
decline. We found, however, that the TREC content of CD31+ naive CD4+ and CD8+ T cells
declined with age, indicating that CD31+ naive T cells are at least in part generated by
peripheral proliferation. We investigated whether chronic immune activation by HIV-
infection altered the fraction of CD31+ T cells within the naive CD4+ T-cell pool. Although
absolute numbers of CD31+ naive CD4+ T cells decreased during HIV-infection, the fraction
of CD31+ T cells within the naive CD4+ T-cell pool was not significantly lower than in healthy
controls. To conclude, CD4+ and CD8+ naive CD31+ T cells are most proximal to the thymus,
but CD31 expression on naive T cells is not restricted to recent thymic emigrants.

Analysis of CD31 as a thymic proximity marker
91
Introduction
The contribution of the thymus to the maintenance of the T-lymphocyte pool during ageing,
and to immune reconstitution in T-cell depleted patients continues to be debated. This is
largely due to the fact that there is still no reliable and unambiguous marker for thymic
output. Although thymic CT scans have shown that thymic volume correlates with naive
CD4+ T-cell counts in healthy and HIV-infected individuals [1], they do not provide a
quantitative means to measure thymic output and cannot be used for frequent or large scale
longitudinal monitoring. Alternatively, increases in naive T-cell numbers during immune
reconstitution have been used to measure thymic output. However, since naive T cells can
divide while retaining their naive phenotype [2,3], increases in naive T-cell numbers may
reflect peripheral proliferation rather than thymic output.
Another method that is widely used to determine thymic output is the measurement of T-
cell receptor excision circles (TRECs). Since these T-cell receptor excision products are only
formed during T-cell receptor rearrangement in the thymus, they have been interpreted as a
direct marker for thymic output [4]. However, since TRECs are not duplicated during T-cell
proliferation, the average number of TRECs per T cell (referred to as TREC content) declines
upon T-cell division. Although measuring increases in absolute numbers of TRECs per ml
blood in a depleted situation is a useful indication for thymic output, the interpretation of
absolute TREC numbers is hampered by T-cell death and the longevity of T cells. Thus
caution should be taken when using TRECs as a direct marker for thymic output [5,6].
Furthermore, additional phenotypic and functional analysis of TREC+ T cells is impossible.
Recently Kimmig et al. [2] proposed CD31 to be a marker that can be used to discriminate
between recent thymic emigrants and naive CD4+ T cells that have undergone peripheral T-
cell proliferation. Since CD31 is known to be down-regulated upon CD4+ and Jurkat T-cell
stimulation [7,8], it was suggested that upon interaction with self-peptides presented by
MHC, CD31+ naive CD4+ T cells divide and down-regulate CD31 expression while retaining
the naive phenotype. Indeed, CD31- T cells had a gene expression profile characteristic of
recent TCR engagement and the TREC content of CD31- naive CD4+ T cells was found to be
consistently reduced compared to that of CD31+ naive CD4+ T cells [2]. Furthermore, CD31+
naive CD4+ T cells were shown to have a polyclonal T-cell receptor Vβ repertoire compared
to the more oligoclonal repertoire of CD31- naive CD4+ T cells [9].
In contrast to CD4+ T cells, CD31 is not down-regulated on memory CD8+ T cells [10].
Nevertheless, CD31 could be used as a thymic proximity marker for naive CD8 T cells if the
TREC content of CD31+ naive CD8 T cells exceeds that of CD31- naive CD8 T cells.
CD31, also known as platelet-endothelial cell adhesion molecule (PECAM-1), is a
transmembrane glycoprotein and a member of the Ig superfamily [11]. Homophilic as well
as heterophilic interactions (with CD38 and integrins) have been described for CD31
[12,13]. CD31 contains an ITIM motif on the intracellular part which has been proposed to
suppress apoptosis of T cells [14] and to dampen TCR signalling through the ITAM motif on
the TCR [15,16]. Other proposed functions of CD31 are related to cellular adhesion
[12,17,18]. On T cells, CD31 is expressed from the double positive thymocyte stage onward

Chapter 7
92
[10,19]. With age, both the fraction of CD31+ cells within the naive CD4+ T-cell pool and the
absolute number of CD31+ naive CD4+ T cells decrease [2,9].
If CD31+ naive T cells are indeed exclusively thymus derived, CD31 could finally be the tool
to unambiguously assess the role of thymic output. Indeed recent studies have begun to
use CD31 to determine the role of the thymus in long-term immune reconstitution after
hematopoietic stem cell transplantation [20] and to assess thymus function in relapsing-
remitting multiple sclerosis [21] and immuno-suppressed kidney transplant patients [22]. An
additional advantage of CD31 as a marker for recent thymic emigrants would be that sorting
of CD31+ T cells would allow for additional functional analyses of purified recent thymic
emigrants.
Although the lower TREC content of the naive CD31- CD4+ T cell subset shows that these
cells have gone through more rounds of division since they emigrated from the thymus than
CD31+ T cells, this does not imply that naive CD31+ T cells are exclusively formed by the
thymus. We therefore investigated in further detail the robustness of CD31 as a marker for
thymic output. The second goal of this study was to investigate the dynamics of the CD31+
and CD31- naive CD4+ T-cell pools during progressing stages of HIV infection. We
hypothesized that chronic immune activation would lead to accelerated maturation of the
naive T-cell pool and thereby to a reduction in the fraction of CD31+ cells within the naive
CD4+ T-cell pool.
Together, these studies on the dynamics of CD31+ naive T cells provide new insights into
the nature of this naive T cell population and into the use of CD31 as a recent thymic
emigrant marker. Although CD4+ and CD8+ naive CD31+ T cells are most proximal to the
thymus, CD31+ naive T cells divide without the loss of CD31 expression and therefore do
not strictly represent recent thymic emigrants.
Materials and methods
Blood samples
Peripheral blood mononuclear cells (PBMC) were acquired by Ficoll-Paque density gradient
centrifugation from heparinized blood or buffycoats. Blood bank donors of different ages
were used as controls. Samples from HIV-infected patients were partly derived from the
Amsterdam Cohort Studies on HIV and AIDS and from patients who were treated at the
Amsterdam Medical Center [30]. Fractions CD31+ within naive CD4 T cells were measured in
61 HIV-infected individuals and 15 individuals who had progressed to AIDS. AIDS was
defined as a CD4 T-cell count level below 200 cells/µl. Furthermore, we longitudinally
determined the fraction CD31+ within naive CD4 T cells in 11 individuals over
seroconversion and in 18 patients longitudinally during HIV disease progression. None of the
HIV-infected patients had ever been treated at the time of sampling.

Analysis of CD31 as a thymic proximity marker
93
Flow cytometry and cell sorting
To measure the fraction of CD31+ T cells within the naive CD4+ and CD8+ T-cell population,
cryopreserved PBMC were thawed and incubated with monoclonal antibodies (mAb) to
CD45RO-FITC (Caltag), CD31-PE, CD4- or CD8-PERCP (BD) and biotinylated CD27 (Sanquin
Reagents). After washing, cells were incubated with anti-Streptavidin-APC (BD), after which
cells were fixed using Cellfix (BD) and analyzed on a FACSCalibur (BD) with Cellquest
software. For Annexin V staining and cell sorting CD27 was omitted, in which case cells were
stained as described above in a parallel sample to check for the absence of CD27- T cells
within the CD4+CD45RO- population. Apoptosis was measured by FACS analysis using mAb
to CD31-PE, CD4-PERCP and CD45RO-APC (BD), after which cells were washed and stained
with Annexin V-FITC (Bender MedSystems, Vienna, Austria) according to manufacturer’s
protocol. To purify CD4+CD45RO-CD31+ and CD4+CD45RO-CD31- cells, cryopreserved PBMC
were thawed and stained with mAb to CD45RO-FITC, CD31-PE and CD4-PERCP. To purify
CD8+ CD45RO-CD27+CD31+/ CD45RO-CD27+CD31-/ CD45RO+CD31+ and CD45RO+CD31-
cells, cryopreserved PBMC were thawed and stained with mAb to CD45RO-FITC, CD31-PE,
CD8-PERCP and CD27-APC. The specified cell fractions were isolated by cell sorting on a
MoFlow high speed cell sorter or a FACSAria (BD).
TREC analysis
After cell sorting, DNA was isolated using the QIAamp Blood Kit according to manufacturer’s
instructions (Qiagen, Hilden, Germany). Signal joint T-cell receptor excision circle (TREC)
numbers were quantified using real-time PCR as previously described [5,31]. The number of
Sj TREC copies present in a given cell population was calculated by including a dilution
series of a Sj standard [5] in each PCR experiment. By applying the Ct-value (the minimal
number of cycles necessary to exceed threshold values) to the standardization curve, the Sj
TREC content could be calculated for each sample. To normalize for input DNA, the number
of Cα constant regions that remain present on the TCR genome despite TCR
rearrangements was determined in every sample tested. From the average TREC content as
measured per µg DNA, the TREC content per cell was calculated by dividing the TREC
content by 150.000 (assuming that 1 µg DNA corresponds to 150.000 cells).
Mathematical model of CD31+ and CD31- naive CD4+ T cell population dynamics
In the model, CD31+ naive T cells (Np) are generated by thymic output, which decreases
exponentially with age (αe-vt), and disappear by density-dependent death (at rate d), by
transition to the CD31- naive T-cell population (at rate m) and by direct activation into the
memory T-cell pool (at rate ap). Since our TREC analyses (Figure 1B) show that CD31+ naive
T cells do divide and remain CD31+, CD31+ T cells in the model are also formed by T-cell
proliferation (at rate pp). CD31- naive T cells are generated when CD31+ T cells lose their
CD31 marker (at rate m) and by T-cell proliferation within the CD31- T cell pool (at rate pn),
and are lost by density-dependent death (at rate d) and by activation into the memory pool
(at rate an). The total numbers of TRECs in the CD31+ (Tp) and the CD31- (Tn) naive T-cell

Chapter 7
94
pools change by the same processes except T-cell proliferation. Assuming that CD31- T cells
cannot revert to CD31+, the model is described by the following differential equations:
dNp/dt = αe-vt + ppNp - dNp - mNp - apNp
dNn/dt = mNp + pnNn - dNn - anNn
dTp/dt = cαe-vt - dTp - mTp - apTp
dTn/dt = mTp - dTn - anTn where c is the average number of TRECs per recent thymic emigrant, and density-
dependent death is modelled by a simple linear increase of the death rate: d = ε(Np+Nn). A
homeostatic term is required to obtain a TREC decline with age [28]. Since T-cell
proliferation rates do not change with age [32], we chose for a density-dependent death
term. TREC contents were calculated by dividing the total number of TRECs in the CD31+
(Tp) or CD31- (Tn) naive T-cell pool by the number of CD31+ (Np) or CD31
- (Nn) naive T
cells.
Statistical analysis
Normality of the data was tested using the Shapiro-Wilk W test for normality. Based on the
outcome of this test, correlations were calculated using Pearson’s (Rp) or Spearman’s rank
correlation coefficients (Rs). The Mann-Whitney U test was used to determine differences
between group characteristics. Differences between the TREC content within CD31+ and
CD31- naive CD4+ T cells were analysed using the Wilcoxon signed rank test. We tested if
there was a significant difference between the rate of TREC loss in CD31+ and CD31- naive
T cells using a linear model including an interaction term between age and group (CD31+ vs.
CD31-).
Results
Characteristics of CD31+ naive CD8+ T cells
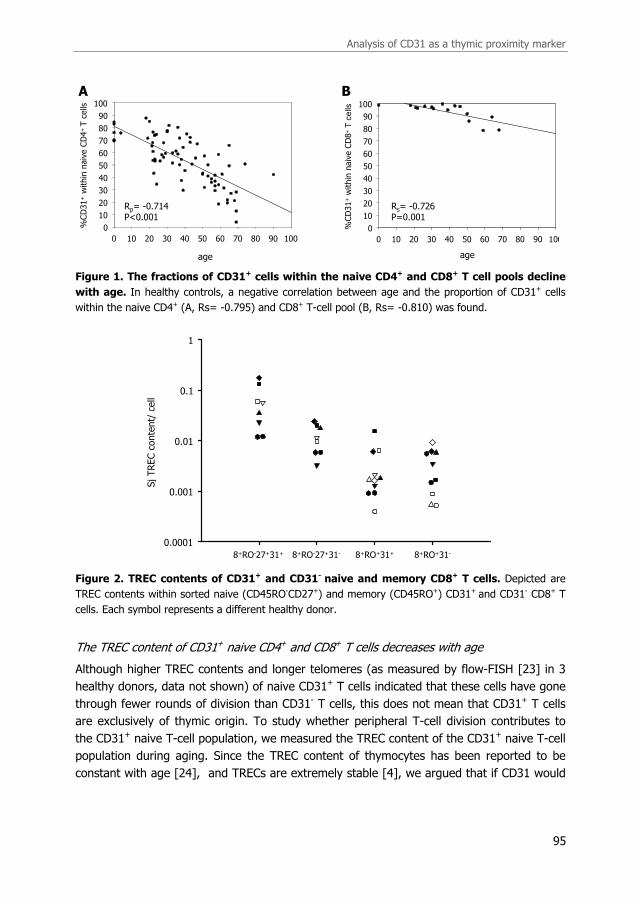
In line with Kimmig et al. [2], we found that the fraction of CD31+ T cells within the naive
CD4+ T-cell pool decreased significantly with age in healthy individuals (Figure 1A, Rp=-
0.714, p<0.001), and that CD31+ naive CD4+ T cells in healthy individuals had a higher
TREC content than their CD31- counterparts (p<0.001). The percentage CD31+ in naive
CD8+ T cells also declined during aging, although to a lesser extent than found in the naive
CD4+ T cell pool (Figure 1B, Rs=-0.726, p=0.001). Similar to CD4 T cells, sorted CD31+
naive CD8 T cells always had a higher TREC content than CD31- naive CD8+ T cells (Figure
2, p=0.008). We also determined if the difference in TREC content was sustained in sorted
CD31+ and CD31-CD45RO+ memory CD8+ T cells, this was however not the case (Figure 2,
p=0.625).
Analysis of CD31 as a thymic proximity marker
95
Figure 1. The fractions of CD31+ cells within the naive CD4+ and CD8+ T cell pools decline
with age. In healthy controls, a negative correlation between age and the proportion of CD31+ cells
within the naive CD4+ (A, Rs= -0.795) and CD8+ T-cell pool (B, Rs= -0.810) was found.
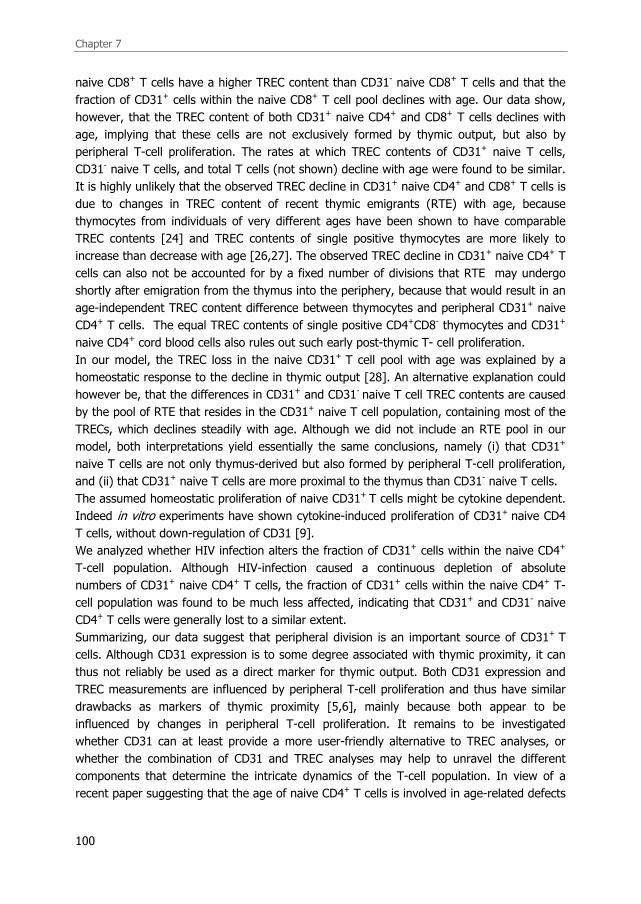
Figure 2. TREC contents of CD31+ and CD31- naive and memory CD8+ T cells. Depicted are
TREC contents within sorted naive (CD45RO-CD27+) and memory (CD45RO+) CD31+ and CD31- CD8+ T
cells. Each symbol represents a different healthy donor.
The TREC content of CD31+ naive CD4+ and CD8+ T cells decreases with age
Although higher TREC contents and longer telomeres (as measured by flow-FISH [23] in 3
healthy donors, data not shown) of naive CD31+ T cells indicated that these cells have gone
through fewer rounds of division than CD31- T cells, this does not mean that CD31+ T cells
are exclusively of thymic origin. To study whether peripheral T-cell division contributes to
the CD31+ naive T-cell population, we measured the TREC content of the CD31+ naive T-cell
population during aging. Since the TREC content of thymocytes has been reported to be
constant with age [24], and TRECs are extremely stable [4], we argued that if CD31 would
age
0 10 20 30 40 50 60 70 80 90 100
%CD31+within
naiveCD4+ T cells
0
10
20
30
40
50
60
70
80
90
100
age
0 10 20 30 40 50 60 70 80 90 100
%CD31+within
naiveCD8
+T
ce
lls
0
10
20
30
40
50
60
70
80
90
100
A B
Rp= -0.714P<0.001
Rs= -0.726P=0.001
8+RO-27+31+ 8+RO-27+31- 8+RO+31+ 8+RO+31-
SjTREC content/ cell
0.0001
0.001
0.01
0.1
1

Chapter 7
96
be a true marker for thymic output and every CD31+ T cell that divides becomes CD31-, the
TREC content of CD31+ naive T cells should remain constant with age.
The TREC content of CD31+ naive CD4+ T cells in cord blood was found to be in the same
range of TREC contents of CD4+CD8- single-positive thymocytes (p=0.556), suggesting that
cord blood CD31+ naive CD4+ T cells had not markedly proliferated since they emerged from
the thymus. However with age, the TREC contents of CD31+ naive CD4+ T cells (Figure 3A
left panel, Rs=-0.795, p<0.001), as well as CD31+ naive CD8+ T cells (Figure 3A right panel,
Rs=-0.810, p=0.015) declined significantly. The slopes of the TREC content decline with age
were not statistically different between CD31- and CD31+ naive T cells (p=0.270 and
p=0.262, respectively for CD4+ and CD8+ T cells). To investigate the implications of this
parallel decline for the dynamical properties of CD31+ and CD31- naive T cells, we extended
a previously developed model for T-cell and TREC dynamics [5], now distinguishing CD31+
and CD31- T cells (see materials and methods). The model demonstrates that a parallel
decline in TREC contents of CD31+ and CD31- T cells, as was experimentally observed, puts
a lower bound on the proliferation rate of CD31+ T cells: the larger their proliferation rate,
the more parallel the TREC declines of CD31+ and CD31- T cells (Figure 3B, upper and lower
left panels). If we consider the extreme situation where CD31+ naive T cells proliferate much
faster than CD31- naive T cells, the TREC declines are comparable, but the higher TREC
content in CD31+ compared to CD31- naive T cells which we consistently found, is lost
(Figure 3B, lower right panel). As we observed nearly parallel declines, these analyses thus
show that T-cell proliferation adds significantly to the size of the CD31+ T-cell pool, implying
that CD31 cannot be used to reliably measure thymic output. Using a similar proliferation
rate for CD31+ and CD31- naive T cells (upper right panel from Figure B), the model mimics
the decline in the fraction of CD31+ cells within the naive CD4+ and CD8+ T-cell pools with
age (Figure 3C) provided that thymic output declines with age. Of note, the higher fraction
CD31+ naive CD8+ T cells was attained by decreasing the fraction CD31+ T cells that transit
to the CD31- naive T-cell population, which resulted in slightly lower CD31+ and CD31- naive
CD8 T cells TREC contents compared to CD31+ and CD31- naive CD4+ T cells in the model.
CD4
Age (years)
cordblood
10 20 30 40 50 60 70 80
SjTREC content/ cell
0.0001
0.001
0.01
0.1
1CD8
Age (years)
10 20 30 40 50 60 70 80
SjTREC content/ cell
0.0001
0.001
0.01
0.1
1
cordblood
A
Naïve CD31+ CD4+ T cells
Naïve CD31- CD4+ T cells
CD4+CD8- thymocytesNaïve CD31+ CD8+ T cells
Naïve CD31- CD8+ T cells CD4-CD8+ thymocytes

Analysis of CD31 as a thymic proximity marker
97
1
0.1
0.01
0.001
0.0001
CD4
TR
EC
conte
nt
1
0.75
0.5
0.25
0
806040200
Age (in years)
%C
D31+
in n
aiv
e
CD8
806040200
Age (in years)
B
C
1
0.1
0.01
0.001
0.0001
TR
EC
conte
nt
1
0.1
0.01
0.001
0.0001
806040200
Age (in years)
TR
EC
conte
nt
806040200
Age (in years)

Chapter 7
98
Figure 3. CD31+ naive T cells are not exclusively of thymic origin. (A) TREC contents of sorted
CD31+ (grey circles, Rs=-0.795 and p<0.001) and CD31- (white circles, Rs=-0.816 and p<0.001) naive
CD4+ T cells as well as TREC contents of sorted CD31+ (grey squares, Rs=-0.810 and p=0.015) and
CD31- (white squares, Rs=0.690 and p=0.058) naive CD8+ T cells from healthy blood bank donors
decreased with aging. Single positive CD4+CD8- thymocytes (black circles) had comparable TREC
contents as sorted CD31+ cord blood CD4+ T cells (p=0.556). Black squares denote single positive CD4-
CD8+ thymocytes. (B) Simulation results of the mathematical model for the dynamics of CD31+ and
CD31- TREC contents with age. Upper left panel: TREC decline of CD31+ (thick line) and CD31- (thin
line) naive T cells with age in healthy individuals without proliferation within the CD31+ naive T cells.
Parameters: α = 109 cells/day, v = 0.1/year, c = 1, ε = 9.1·10-16 (ref 5), pp = 0, pn = 0.0005/day, m =
0.0001/day, ap = an = 0.0004/day. Upper right panel: Insufficient proliferation of CD31+ T cells causes
deviations between the TREC declines of CD31+ and CD31- naive T cells. Parameters as in upper left
panel, except for pp = 0.0002/day. Lower left panel: If there is sufficient proliferation of CD31+ T cells,
the TREC contents of CD31+ and CD31- naive T cells decline in a parallel fashion. Parameters as in
upper left panel, except for pp = pn = 0.0005/day. Lower right panel: If we introduce higher
proliferation of CD31+ than CD31- naive T cells, TREC declines run parallel, but the TREC content of
CD31+ naive T cells is as low as the TREC content of CD31- naive CD4+ T cells. Parameters as in upper
left panel, except for pp = 0.002/day. (C) If we consider the parameters from the lower left panel in B,
which best described the data, the model predicted a loss of fraction CD31+ within naive CD4+ T cells
with age (lower left panel), provided that thymic output declines with age. The higher fraction CD31+
naive CD8+ T cells (lower right panel) was achieved by decreasing the fraction CD31+ T cells that transit
to the CD31- naive T-cell population (m=0.00001) and resulted in slightly lower CD31+ and CD31- naive
CD8 T-cell TREC contents (upper right panel).
Dynamics of CD31+ and CD31- naive CD4+ T cells during HIV infection
During HIV infection the percentage of proliferating naive T cells is increased [5,25]. We
studied whether this was reflected in the percentage of CD31+ naive CD4+ T cells in HIV
infection and during progression to AIDS. Cross-sectional analysis however showed that
HIV-infected individuals did not have significantly lower fractions of CD31+ cells within the
naive CD4+ T cell pool compared to age-matched healthy individuals (Figure 4A, p=0.84). In
patients with AIDS, the fraction of CD31+ T cells in the naive CD4+ T-cell pool did have the
tendency to be reduced compared to healthy adults (Figure 4A, p=0.069). As the fraction of
CD31+ cells in the naive CD4+ T-cell population appeared to change in the course of HIV
infection, we performed longitudinal analyses both pre- and post-seroconversion, including 2
patients who developed AIDS (Figure 4B). Although the fraction of CD31+ cells within the
naive CD4+ T-cell pool was found to significantly decrease over seroconversion (p=0.042),
only six out of the eleven patients studied showed a clear decline. No statistical difference in
the fraction CD31+ naive CD4+ T cells was found during chronic HIV-infection (p=0.530).
Absolute numbers of CD31+ naive T cells did consistently decrease during HIV disease
progression. Thus, although CD31+ naive CD4 T cells are depleted during HIV infection, this
depletion does not seem to be subset specific.

Analysis of CD31 as a thymic proximity marker
99
Figure 4. CD31+ T cells within the naive CD4+ T-cell pool during HIV infection. (A) The
proportion of CD31+ cells within the naive CD4+ T-cell pool of HIV-infected patients and individuals with
AIDS are compared to healthy age-matched individuals. (B) The fraction CD31+ cells within the naive
CD4+ T-cell pool and absolute numbers of CD31+ naive CD4+ T cells measured longitudinally before and
1 and 5 years after HIV seroconversion (black circles). Grey circles and dotted lines denote 2 patients
suffering from AIDS. Healthy age-matched controls are depicted by white circles.
Discussion
CD31 has recently been used as a marker to identify recent thymic emigrants within the
naive CD4+ T-cell pool [2,20-22]. Here we show that in analogy to CD4+ T cells, CD31+
0
20
40
60
80
100
healthy HIV AIDS
%CD31+within
naiveCD4+T cells
p=0.069
p=0.840 p=0.112
A
0
20
40
60
80
100
healthy HIV AIDS
%CD31+within
naiveCD4+T cells
p=0.069
p=0.840 p=0.112
A
0
20
40
60
80
100
%CD31+ within naive CD4+ T cells
health
y
pre
5 yr
1 yr
0
100
200
300
400
500
600
700
pre
5 yr
1 yr
Absolute CD31+ naive CD4+ T cells
p=0.148n=8
p=0.042n=11
p=0.530n=18
p=0.031n=6
p=0.023n=8
p<0.001n=17
B
Chapter 7
100
naive CD8+ T cells have a higher TREC content than CD31- naive CD8+ T cells and that the
fraction of CD31+ cells within the naive CD8+ T cell pool declines with age. Our data show,
however, that the TREC content of both CD31+ naive CD4+ and CD8+ T cells declines with
age, implying that these cells are not exclusively formed by thymic output, but also by
peripheral T-cell proliferation. The rates at which TREC contents of CD31+ naive T cells,
CD31- naive T cells, and total T cells (not shown) decline with age were found to be similar.
It is highly unlikely that the observed TREC decline in CD31+ naive CD4+ and CD8+ T cells is
due to changes in TREC content of recent thymic emigrants (RTE) with age, because
thymocytes from individuals of very different ages have been shown to have comparable
TREC contents [24] and TREC contents of single positive thymocytes are more likely to
increase than decrease with age [26,27]. The observed TREC decline in CD31+ naive CD4+ T
cells can also not be accounted for by a fixed number of divisions that RTE may undergo
shortly after emigration from the thymus into the periphery, because that would result in an
age-independent TREC content difference between thymocytes and peripheral CD31+ naive
CD4+ T cells. The equal TREC contents of single positive CD4+CD8- thymocytes and CD31+
naive CD4+ cord blood cells also rules out such early post-thymic T- cell proliferation.
In our model, the TREC loss in the naive CD31+ T cell pool with age was explained by a
homeostatic response to the decline in thymic output [28]. An alternative explanation could
however be, that the differences in CD31+ and CD31- naive T cell TREC contents are caused
by the pool of RTE that resides in the CD31+ naive T cell population, containing most of the
TRECs, which declines steadily with age. Although we did not include an RTE pool in our
model, both interpretations yield essentially the same conclusions, namely (i) that CD31+
naive T cells are not only thymus-derived but also formed by peripheral T-cell proliferation,
and (ii) that CD31+ naive T cells are more proximal to the thymus than CD31- naive T cells.
The assumed homeostatic proliferation of naive CD31+ T cells might be cytokine dependent.
Indeed in vitro experiments have shown cytokine-induced proliferation of CD31+ naive CD4
T cells, without down-regulation of CD31 [9].
We analyzed whether HIV infection alters the fraction of CD31+ cells within the naive CD4+
T-cell population. Although HIV-infection caused a continuous depletion of absolute
numbers of CD31+ naive CD4+ T cells, the fraction of CD31+ cells within the naive CD4+ T-
cell population was found to be much less affected, indicating that CD31+ and CD31- naive
CD4+ T cells were generally lost to a similar extent.
Summarizing, our data suggest that peripheral division is an important source of CD31+ T
cells. Although CD31 expression is to some degree associated with thymic proximity, it can
thus not reliably be used as a direct marker for thymic output. Both CD31 expression and
TREC measurements are influenced by peripheral T-cell proliferation and thus have similar
drawbacks as markers of thymic proximity [5,6], mainly because both appear to be
influenced by changes in peripheral T-cell proliferation. It remains to be investigated
whether CD31 can at least provide a more user-friendly alternative to TREC analyses, or
whether the combination of CD31 and TREC analyses may help to unravel the different
components that determine the intricate dynamics of the T-cell population. In view of a
recent paper suggesting that the age of naive CD4+ T cells is involved in age-related defects

Analysis of CD31 as a thymic proximity marker
101
of the immune system [29], CD31 might be useful to identify the naive T-cell subset that
contains the youngest subpopulation of the naive T-cell pool.
Acknowledgements
This research has been funded by AIDS Fonds Netherlands (grants 7010 and 7011) and the
Netherlands Organization for Scientific Research (NWO, grant 916.36.003). The Amsterdam
Cohort Studies on HIV infection and AIDS, a collaboration between the Amsterdam Health
Service, the Academic Medical Center of the University of Amsterdam, Sanquin Blood Supply
Foundation and the University Medical Center Utrecht, part of the Netherlands HIV
Monitoring Foundation, which is financially supported by the Netherlands National Institute
for Public Health and the Environment. We thank Rob de Boer and Mette D. Hazenberg for
critical reading of the manuscript.
References
1. McCune JM, Loftus R, Schmidt DK, et al. High prevalence of thymic tissue in adults with human
immunodeficiency virus-1 infection. J Clin Invest 1998; 101:2301-8.
2. Kimmig S, Przybylski GK, Schmidt CA, et al. Two subsets of naive T helper cells with distinct T
cell receptor excision circle content in human adult peripheral blood. J Exp Med 2002; 195:789-
94.
3. Schonland SO, Zimmer JK, Lopez-Benitez CM, et al. Homeostatic control of T-cell generation in
neonates. Blood 2003; 102:1428-34.
4. Douek DC, McFarland RD, Keiser PH, et al. Changes in thymic function with age and during the
treatment of HIV infection. Nature 1998; 396:690-5.
5. Hazenberg MD, Otto SA, Cohen Stuart JWT, et al. Increased cell division but not thymic
dysfunction rapidly affects the TREC content of the naive T cell population in HIV-1 infection.
Nature Med 2000; 6:1036-42.
6. Hazenberg MD, Borghans JA, De Boer RJ, Miedema F. Thymic output: a bad TREC record. Nat
Immunol 2003; 4:97-9.
7. Zehnder JL, Hirai K, Shatsky M, McGregor JL, Levitt LJ, Leung LL. The cell adhesion molecule
CD31 is phosphorylated after cell activation. Down-regulation of CD31 in activated T
lymphocytes. J Biol Chem 1992; 267:5243-9.
8. Demeure CE, Byun DG, Yang LP, Vezzio N, Delespesse G. CD31 (PECAM-1) is a differentiation
antigen lost during human CD4 T-cell maturation into Th1 or Th2 effector cells. Immunol 1996;
88:110-5.
9. Kohler S, Wagner U, Pierer M, et al. Post-thymic in vivo proliferation of naive CD4+ T cells
constrains the TCR repertoire in healthy human adults. Eur J Immunol 2005; 35:1987-94.
10. Stockinger H, Schreiber W, Majdic O, Holter W, Maurer D, Knapp W. Phenotype of human T
cells expressing CD31, a molecule of the immunoglobulin supergene family. Immunol 1992;
75:53-8.
11. Newman PJ, Berndt MC, Gorski J, et al. PECAM-1 (CD31) cloning and relation to adhesion
molecules of the immunoglobulin gene superfamily. Science 1990; 247:1219-22.
12. Piali L, Hammel P, Uherek C, et al. CD31/PECAM-1 is a ligand for alpha v beta 3 integrin
involved in adhesion of leukocytes to endothelium. J Cell Biol 1995; 130:451-60.
13. Deaglio S, Morra M, Mallone R, et al. Human CD38 (ADP-ribosyl cyclase) is a counter-receptor of
CD31, an Ig superfamily member. J Immunol 1998; 160:395-402.

Chapter 7
102
14. Gao C, Sun W, Christofidou-Solomidou M, et al. PECAM-1 functions as a specific and potent
inhibitor of mitochondrial-dependent apoptosis. Blood 2003; 102:169-79.
15. Newton-Nash DK, Newman PJ. A new role for platelet-endothelial cell adhesion molecule-1
(CD31): inhibition of TCR-mediated signal transduction. J Immunol 1999; 163:682-8.
16. Newman DK, Hamilton C, Newman PJ. Inhibition of antigen-receptor signaling by Platelet
Endothelial Cell Adhesion Molecule-1 (CD31) requires functional ITIMs, SHP-2, and p56(lck).
Blood 2001; 97:2351-7.
17. Tanaka Y, Albelda SM, Horgan KJ, et al. CD31 expressed on distinctive T cell subsets is a
preferential amplifier of beta 1 integrin-mediated adhesion. J Exp Med 1992; 176:245-53.
18. Muller WA, Weigl SA, Deng X, Phillips DM. PECAM-1 is required for transendothelial migration of
leukocytes. J Exp Med 1993; 178:449-60.
19. Tenca C, Merlo A, Zarcone D, et al. Death of T cell precursors in the human thymus: a role for
CD38. Int Immunol 2003; 15:1105-16.
20. Muraro PA, Douek DC, Packer A, et al. Thymic output generates a new and diverse TCR
repertoire after autologous stem cell transplantation in multiple sclerosis patients. J Exp Med
2005; 201:805-16.
21. Duszczyszyn DA, Beck JD, Antel J, et al. Altered naive CD4 and CD8 T cell homeostasis in
patients with relapsing-remitting multiple sclerosis: thymic versus peripheral (non-thymic)
mechanisms. Clin Exp Immunol 2006; 143:305-13.
22. Nickel P, Kreutzer S, Bold G, et al. CD31+ naive Th cells are stable during six months following
kidney transplantation: implications for post-transplant thymic function. Am J Transplant 2005;
5:1764-71.
23. Plunkett FJ, Soares MV, Annels N, et al. The flow cytometric analysis of telomere length in
antigen-specific CD8+ T cells during acute Epstein-Barr virus infection. Blood 2001; 97:700-7.
24. Jamieson BD, Douek DC, Killian S, et al. Generation of functional thymocytes in the human
adult. Immunity 1999; 10:569-75.
25. Hazenberg MD, Cohen Stuart JWT, Otto SA, et al. T cell division in human immunodeficiency
virus (HIV-1)-infection is mainly due to immune activation: a longitudinal analysis in patients
before and during highly active anti-retroviral therapy. Blood 2000; 95:249-55.
26. Dion ML, Poulin JF, Bordi R, et al. HIV infection rapidly induces and maintains a substantial
suppression of thymocyte proliferation. Immunity 2004; 21:757-68.
27. Van den Dool C, De Boer RJ. The Effects of Age, Thymectomy, and HIV Infection on {alpha}
and beta TCR Excision Circles in Naive T Cells. J Immunol 2006; 177:4391-401.
28. Dutilh BE, De Boer RJ. Decline in excision circles requires homeostatic renewal or homeostatic
death of naive T cells. J Theor Biol 2003; 224:351-8.
29. Haynes L, Eaton SM, Burns EM, Randall TD, Swain SL. Newly generated CD4 T cells in aged
animals do not exhibit age-related defects in response to antigen. J Exp Med 2005; 201:845-51.
30. Sankatsing SU, Jurriaans S, van Swieten P, et al. Highly active antiretroviral therapy with or
without mycophenolate mofetil in treatment-naive HIV-1 patients. AIDS 2004; 18:1925-31.
31. Pongers-Willemse MJ, Verhagen OJHM, Tibbe GJM, et al. Real-time quantitative PCR for the
detection of minimal residual disease in acute lymphoblastic leukemia using junctional region
specific TaqMan probes. Leukemia 1998; 12:2006-14.
32. Wallace DL, Zhang Y, Ghattas H, et al. Direct measurement of T cell subset kinetics in vivo in
elderly men and women. J Immunol 2004; 173:1787-94.
Related Documents