Analysis of causes of structural failures of buildings using TQC tools Agnieszka Czajkowska 1,* 1 Kielce University of Technology, Kielce, Poland Abstract This paper analyses structural failures of buildings over a period of ten years. Particular attention was paid to the analysis of structural failures caused by human mistakes. The analysis was performed according to two criteria: the stage of the building's life cycle and the type of works conducted in the area of the building site. The analysis was performed using a quality management tool (histogram and Pareto-Lorenza diagram), which allowed for identification of the causes responsible for the highest number of events. The analysis showed that three causes account for 64,61% of the structural failures that occurred. 1 Introduction According to Article 73 of the Construction Law, a structural failure of building means unintentional, violent destruction of a building or its parts and structural components of scaffoldings, shape-forming components, sheet piling and excavation support. [1-3] Structural failures of buildings are often tragic. However, a damage to an embedded component of a building that can be repaired or replaced, damage to or destruction of building equipment connected to buildings, and installation failure are not considered a structural failure. The District Building Supervision Inspector is responsible for qualification of a structural failure in case of sudden destruction of the building (structure) or its parts (even without fatalities), organizing a commission and an investigation in order to explain the causes and consequences of the damage during the accident [4]. In general, the causes of structural failure can be divided into: − direct and indirect, − technical, organizational, social, − random, such as wind, precipitation, earthquakes and quakes caused by human activity at different stages of the building’s life cycle. The paper reviews the causes of structural failures in 2007-2017. Next, the causes of structural failures which were not related to the so-called random events in 2013-2017 were discussed. The aim of the analysis was to identify human mistakes which are most responsible for structural failures. The tools / methods used belong to the group of methods used in TQC [5]. They are used to collect and process information, to supervise and improve. They are used to graphically visualize the phenomenon and analyze the problem. * Corresponding author: [email protected] ,0 (2019) https://doi.org/10.1051/matecconf /201928 MATEC Web of Conferences 284 4 ICSF 2019 08002 0 80 2 © The Authors, published by EDP Sciences. This is an open access article distributed under the terms of the Creative Commons Attribution License 4.0 (http://creativecommons.org/licenses/by/4.0/).

Welcome message from author
This document is posted to help you gain knowledge. Please leave a comment to let me know what you think about it! Share it to your friends and learn new things together.
Transcript
Analysis of causes of structural failures of buildings using TQC tools
Agnieszka Czajkowska1,*
1Kielce University of Technology, Kielce, Poland
Abstract This paper analyses structural failures of buildings over a period
of ten years. Particular attention was paid to the analysis of structural
failures caused by human mistakes. The analysis was performed according
to two criteria: the stage of the building's life cycle and the type of works
conducted in the area of the building site. The analysis was performed
using a quality management tool (histogram and Pareto-Lorenza diagram),
which allowed for identification of the causes responsible for the highest
number of events. The analysis showed that three causes account for
64,61% of the structural failures that occurred.
1 Introduction
According to Article 73 of the Construction Law, a structural failure of building means
unintentional, violent destruction of a building or its parts and structural components of
scaffoldings, shape-forming components, sheet piling and excavation support. [1-3]
Structural failures of buildings are often tragic. However, a damage to an embedded
component of a building that can be repaired or replaced, damage to or destruction of
building equipment connected to buildings, and installation failure are not considered
a structural failure.
The District Building Supervision Inspector is responsible for qualification of a
structural failure in case of sudden destruction of the building (structure) or its parts (even
without fatalities), organizing a commission and an investigation in order to explain the
causes and consequences of the damage during the accident [4].
In general, the causes of structural failure can be divided into:
− direct and indirect,
− technical, organizational, social,
− random, such as wind, precipitation, earthquakes and quakes caused by human activity
at different stages of the building’s life cycle.
The paper reviews the causes of structural failures in 2007-2017. Next, the causes of
structural failures which were not related to the so-called random events in 2013-2017 were
discussed. The aim of the analysis was to identify human mistakes which are most
responsible for structural failures. The tools / methods used belong to the group of methods
used in TQC [5]. They are used to collect and process information, to supervise and
improve. They are used to graphically visualize the phenomenon and analyze the problem.
* Corresponding author: [email protected]
, 0 (2019) https://doi.org/10.1051/matecconf /201928MATEC Web of Conferences 284 4
ICSF 201908002080 2
© The Authors, published by EDP Sciences. This is an open access article distributed under the terms of the CreativeCommons Attribution License 4.0 (http://creativecommons.org/licenses/by/4.0/).

The results from the analyzes are the starting point for diagnosis and prevention [5, 6].
They can be used in many areas of life.
TQC tools are mainly used for [5, 7]:
− creating ideas,
− description and analysis,
− identifying threats and problems,
− identification and analysis of causes
− identification and choice of solutions,
− implementation and evaluation of effectiveness.
The quality management tool (Histogram and Pareto chart) was used for the purpose.
2 Causes of structural failures
2.1 Classification of causes of structural failures
Structural failures are mostly related to random events such as heavy rains, excessive snow,
fires, gas explosions, paraseismic vibrations, etc. Accidents not related to random factors
account for from 12 to even 60% of all accidents. In order to evaluate the extent of a
construction disaster, it should be linked to the damage it caused. By definition, a structural
failures of buildings with the severity of the damage and always involves physical or non-
physical loss. The analysis of the causes of structural failures is aimed at reducing or
completely eliminating the factors leading to a construction accident.
Figure 1 presents data on the frequency of structural failures over a period of ten years
in Poland. The data were derived from the reports of the Central Office of Construction
Supervision (COCS) [8]. The incidence of structural failures is presented in the form of a
histogram. This chart is considered one of the seven basic tools of total quality
management (TQM).
0
200
400
600
800
1000
1200
2007 2008 2009 2010 2011 2012 2013 2014 2015 2016 2017
Nu
mb
er
of
stru
ctu
ral
failu
res
Years
Structural failures due to human mistakes Structural failures caused by random causes
Fig. 1. Structural failures caused by human mistakes and structural failures caused by random causes
[COCS report].
, 0 (2019) https://doi.org/10.1051/matecconf /201928MATEC Web of Conferences 284 4
ICSF 201908002080 2
2
The analysis shows that structural failures that are not the result of human mistakes
constitute 12-60% of all. The structural failures caused by random events was the highest in
2008 (over 1000), while the structural failures resulting from human mistakes were the
highest in 2010.
In 2013, structural failures caused by human mistake were more than resulting from
random events. We have a greater influence on the causes of structural failures resulting
from human guilt than those resulting from random events.
In order to eliminate the causes of structural failures, the human side should only take into
account those associated with:
− Building contractors (construction, assembly),
− Non-construction contractors (other industries),
− Designers,
− Manufacturers of materials and prefabricates,
− Users.
In the analysis we omit other random factors and exceptional loads, such as: rain, snow,
hurricane etc.
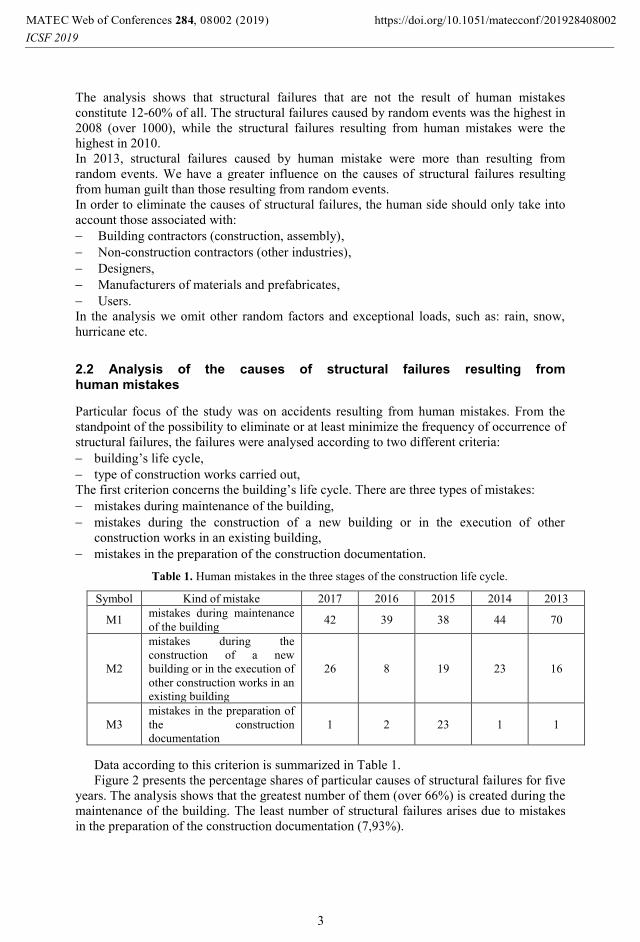
2.2 Analysis of the causes of structural failures resulting from human mistakes
Particular focus of the study was on accidents resulting from human mistakes. From the
standpoint of the possibility to eliminate or at least minimize the frequency of occurrence of
structural failures, the failures were analysed according to two different criteria:
− building’s life cycle,
− type of construction works carried out,
The first criterion concerns the building’s life cycle. There are three types of mistakes:
− mistakes during maintenance of the building,
− mistakes during the construction of a new building or in the execution of other
construction works in an existing building,
− mistakes in the preparation of the construction documentation.
Table 1. Human mistakes in the three stages of the construction life cycle.
Symbol Kind of mistake 2017 2016 2015 2014 2013
M1 mistakes during maintenance
of the building 42 39 38 44 70
M2
mistakes during the
construction of a new
building or in the execution of
other construction works in an
existing building
26 8 19 23 16
M3
mistakes in the preparation of
the construction
documentation
1 2 23 1 1
Data according to this criterion is summarized in Table 1.
Figure 2 presents the percentage shares of particular causes of structural failures for five
years. The analysis shows that the greatest number of them (over 66%) is created during the
maintenance of the building. The least number of structural failures arises due to mistakes
in the preparation of the construction documentation (7,93%).
, 0 (2019) https://doi.org/10.1051/matecconf /201928MATEC Web of Conferences 284 4
ICSF 201908002080 2
3

M1 66,01%
M2 26,06%
M3 7,93%
Fig. 2. Structural failures caused by human mistakes at the main stage of the construction life cycle.
The second criterion is the occurrence of structural failures while carrying out works on
the building site. We take it into account type of works conducted in the area of the
building site.
We analyze three areas of structural failures here:
− mistakes while carrying out works in an existing building,
− mistakes during the construction of a new building,
− mistakes during the demolition of the building.
The number of failures created during the construction works for 2013 ÷ 2017 is
presented in Table 2 and Figure 3.
Table 2. Failures occurred while carrying out works in a construction facility.
Symbol Kind of mistake 2017 2016 2015 2014 2013
M1 mistakes while carrying out
works in an existing building 22 10 20 61 11
M2
Mistakes during the
construction of a new
building
10 7 6 37 4
M3 Mistakes during the
demolition of the building 5 1 4 11 4
The analysis of the Figure 3 shows that over 58% of all structural failures in 2013-2017
were caused by human mistakes while carrying out works in an existing building. Over
30% of structural failures are caused by mistakes during the construction of a new building.
, 0 (2019) https://doi.org/10.1051/matecconf /201928MATEC Web of Conferences 284 4
ICSF 201908002080 2
4

M1 58,22%
M2 30,05%
M3 11,74%
Fig. 3. Structural failures occurred while carrying out works in a construction facility.
The data from the Central Office of Construction Supervision (COCS) for the period of
five analyzed years shows that thirteen most common causes are responsible for structural
failures. They are listed in Table 3.
Table 3. Causes of a structural failures in 2013-2017
Areas The
cause
symbol
Causes of a structural failures Years
2013 2014 2015 2016 2017
Mistakes
during
use
C1 Poor technical condition of the
building
42 32 32 28 26
C2 Failure to inspect the building 16 11 6 13 19
C3 Failure of the owner or manager to
take the required actions resulting
from the inspection of the building
4 3 2 4 2
C4 Failure of the owner or manager to
perform the required actions
resulting from other technical studies
2 1 4 1
C5 Use of a building object contrary to
its original purpose
1 3 2 1 1
C6 Failure of the owner or manager to
meet the required obligations
resulting from the actions of the
building control authorities
1 1 10 4 1
C7 Other mistakes during use 0 10 0 0 9
Mistakes
when
building
a new
facility
C8 Failure to comply with technology 5 15 12 5 20
C9 Violation of duties by participants in
the construction process
7 20 13 4 14
C10 Deviations from the construction
project
0 1 0 2 1
C11 Other circumstances 4 6 5 2 3
C12 Non-compliance with regulations
regarding the use of construction
products
0 0 0 1 0
C13 Mistakes in the documentation 1 1 1 2 1
, 0 (2019) https://doi.org/10.1051/matecconf /201928MATEC Web of Conferences 284 4
ICSF 201908002080 2
5

2.3 Identification of the causes of structural failures over five years using the Pareto - Lorenzo diagram
Pareto analysis is suitable for organizing and analyzing previously collected data. It is used
when our goal is, for example, to counteract negative phenomena with the highest
frequency of occurrence. Pareto-Lorenz diagram is based on the empirical regularity found
that in nature, technology, human activity, assumes that 20-30% of the causes decides
usually about 70-80% effects [5, 7, 9-10]. Pareto-Lorenz method (ABC method or 80-20
principle) is one of the techniques that determines the measures improving the processes
and the product quality by identifying the most important features (events, causes) affecting
the quality [10-12]. Pareto-Lorenz diagram (Figure 4) is used to transmit a specific validity
to factors causing the problem.
The table 4 shows the thirteen most common causes of structural failures. The
percentages of occurrence of particular causes were calculated. Then cumulative shares
were calculated.
On the basis of the data contained in Table 4 there was prepared Pareto – Lorenz
diagram (Figure 4).
Table 4. Causes of structural failures with the frequency of occurrence
The
symbol
of the
cause
Number Percentage
fraction
The
cumulative
frequency
[%]
C1 160 36.53 36.53
C2 65 14.84 51.37
C9 58 13.24 64.61
C8 57 13.01 77.63
C11 20 4.57 82.19
C7 19 4.34 86.53
C6 17 3.88 90.41
C3 15 3.42 93.84
C4 8 1.83 95.66
C5 8 1.83 97.49
C13 6 1.37 98.86
C10 4 0.91 99.97
C12 1 0.23 100
Sum 438 100 -
, 0 (2019) https://doi.org/10.1051/matecconf /201928MATEC Web of Conferences 284 4
ICSF 201908002080 2
6

0
25
50
75
100
C1 C2 C9 C8 C11 C7 C6 C3 C4 C5 C13 C10 C12
Pe
rce
nta
ge fr
acti
on
[%
]
The symbol of the cause of a structural failure
64,61%
Fig. 4. Pareto – Lorenz diagram for cause of the structural failures.
The analysis of Pareto - Lorenz (Figure 4) stated, that three causes are responsible for
64,61% of mistakes (structural failures). Action must be taken to eliminate the three main
causes: C1 - Poor technical condition of the building, C2- Failure to inspect the building, C9
- Violation of duties by participants in the construction process. The analysis shows that
over 50% of structural failures are related to the technical condition of the building and the
lack of control of the building (C1, C2). The purpose of limiting structural failures should be
to carry out more control of the technical condition of buildings and sanctions, which
forced the owners to maintain good technical condition of the buildings.
3 Conclusion
The paper analyses structural failures that occurred in Poland in the last decade. Particular
focus was on the structural failures affected by engineers, designers, contractors and users.
It is impossible to stop the structural failures, but humans can prevent from making
mistakes during the design, construction and the use of the building. The analysis shows
that the most structural failures arise a result:
− mistakes during maintenance of the building (66.01%),
− mistakes while carrying out works in an existing building (58.22%),
− three causes are responsible for 64,61% of construction accidents (C1, C2, C3),
− through the fault of users (C1, C2) - 51.37%.
According to the Pareto - Lorenza analysis, the most common cause is poor technical
condition of the building. The emphasis should be placed on more conscientious and
perhaps more frequent inspections of the technical condition of the building. In accordance
with Article 61 of the Construction Act, the owner or manager of a building is obliged to
use the building in accordance with its intended use and environmental protection
requirements and to maintain it in a proper technical and aesthetic condition. Required are
measures that will force the owners of buildings to take care of the good technical condition
of the buildings.
, 0 (2019) https://doi.org/10.1051/matecconf /201928MATEC Web of Conferences 284 4
ICSF 201908002080 2
7

References
1. S.M. Wierzbicki, The role of the expert in the case of building domage
(Proceedings of XXV Scientific-Technical Conference on Structural Failures,
Szczecin-Międzyzdroje, 2011) [in Polish]
2. M. Boryczko, Administration proceedings conducted by the building supervision
authority in situation of building objects risk (Proceedings of XXVII
Scientific-Technical Conference on Structural Failures, Szczecin-Międzyzdroje, 2015)
[in Polish]
3. Document: Act of 7 July 1994 r. – Construction Act (Journal of Laws 2010r., No. 243,
pos. 1623 with further amendments) [in Polish]
4. L. Runkiewicz, Przegląd Budowlany, 9, pp. 44-49 (2008) [in Polish]
5. J.J. Dahlagaard, K. Kristensen, G.K Kanji, Fundamentals of Total Quality
Management (Taylor & Francis e-Library, 2007)
6. Z. Hoque, Crit. Perspect. Account., 14(5), pp. 553-566 (2003)
7. J. Łuczak, A. Flejszman-Matuszak., Methods and techniques of quality management.
Knowledge compendium (Quality Progress, 2007) [in Polish]
8. Document: Reports of Central Office of Construction Supervision (Department of
Inspection and Building Control, 2007-2017) [in Polish]
9. A. Hamrol, W. Mantura, Quality management. Theory and practice
(PWN, Warszawa, 1998) [in Polish]
10. A. Czajkowska, R. Stasiak – Betlejewska, Determinants of the Machining Process in
the Steel Industry (Proceedings of 25th Anniversary International Conference On
Metallurgy And Materials), Brno, Czech Republic, 2016)
11. M. Urbaniak, Management by quality, (WSB, Poznań, 2001) [in Polish]
12. R. Reed, D.J. Lemak, N.P Mero, J. Qual. Manag. 5(1), pp. 5-26, 2000
, 0 (2019) https://doi.org/10.1051/matecconf /201928MATEC Web of Conferences 284 4
ICSF 201908002080 2
8
Related Documents


