Master of Science Thesis KTH School of Industrial Engineering and Management Energy Technology EGI-2012-70MSC Division of xxx SE-100 44 STOCKHOLM Analysis of Building Envelops to Optimize Energy Efficiency as per Code of Practice for Energy Efficient Buildings in Sri Lanka -2008 Epa Arachchillage Ushani Chamikala Epa Kumari

Welcome message from author
This document is posted to help you gain knowledge. Please leave a comment to let me know what you think about it! Share it to your friends and learn new things together.
Transcript

Master of Science Thesis
KTH School of Industrial Engineering and Management
Energy Technology EGI-2012-70MSC
Division of xxx
SE-100 44 STOCKHOLM
Analysis of Building Envelops to
Optimize Energy Efficiency as per
Code of Practice for Energy Efficient
Buildings in Sri Lanka -2008
Epa Arachchillage Ushani Chamikala Epa
Kumari

i
Master of Science Thesis EGI-2012-70MSC
Analysis of Building Envelops to Optimize Energy
Efficiency as per Code of Practice for Energy
Efficient Buildings in Sri Lanka -2008
Epa Arachchillage Ushani Chamikala Epa Kumari
Approved
Examiner
Dr. Jaime Arias
Supervisor
KTH: Dr. Jaime Arias
OUSL: Prof. Rahula
Attalage
Commissioner
Contact person
Abstract
Residential and commercial buildings consume approximately 20% of the global energy generation. This
value is continuously growing and the governments across the globe have realized the importance of
regulating the building construction to optimize the energy utilization. Energy efficient building codes
have been developed to optimize the energy efficiency in buildings. OTTV (Overall Thermal Transfer
Value) is a key parameter for evaluating energy efficiency of building envelops in the present building code
of Sri Lanka. In this research, the prescriptive requirements mentioned in the building code for the
building envelops to optimize the energy efficiency of five (05) commercial buildings has been analyzed.
The indoor climate was modeled and the annual cooling energy variation with Overall Thermal Transfer
Value was studied using “DesignBuilder” software. A cost benefit analysis was carried out for enhanced
energy efficiency building envelops applications. It was attempted to develop a general relationship
between the OTTV and annual cooling energy requirement for each building. It has been observed that a
second order polynomial relationship with R2 of 0.861 exists for RDA building, linear relationship with R2
of 0.838 exists for AirMech building. However a specific relationship could not be observed for BMICH,
SLSI and WTC buildings. The impact on cooling energy requirement from envelop parameter
modification is unique for each building. In some instances the reduction of OTTV has not resulted in
any reduction of the cooling energy requirement. There is a combined effect from each building
component which affects the final cooling energy requirement. A simulation based technique to be used
to find the optimum building envelops design.

ii
Table of Contents
1 Introduction ............................................................................................................................... 1
1.1 Background .................................................................................................................................................. 1
1.2 Problem statement ...................................................................................................................................... 2
1.3 Objectives ..................................................................................................................................................... 3
2 Literature Review ....................................................................................................................... 4
2.1 History of building codes in the world .................................................................................................... 4
2.2 Types of regulations.................................................................................................................................... 4
2.2.1 Prescriptive type regulations ............................................................................................................ 4
2.2.2 Trade-off type regulations ................................................................................................................ 5
2.2.3 Model building type regulations ...................................................................................................... 5
2.2.4 Energy frame type regulations ......................................................................................................... 5
2.2.5 Performance type regulations .......................................................................................................... 5
2.3 Code of Practice for Energy Efficient Buildings in Sri Lanka – 2008 ................................................ 6
2.3.1 External wall with/without Fenestration (Facades) ...................................................................13
2.3.2 Roofs ..................................................................................................................................................13
2.3.3 Area Weighted Cumulative Overall Thermal Transfer Value (OTTV) ..................................14
2.4 Introduction of OTTV as a building code parameter .........................................................................15
2.5 Previous studies on OTTV ......................................................................................................................15
2.6 Overview of DesignBuilder software as a simulation tool .................................................................16
3 Methodology ............................................................................................................................ 18
3.1 Identification of five (05) office buildings in Colombo, Sri Lanka ...................................................18
3.2 Collection of data for calculation of the building envelop properties ..............................................19
3.3 Modeling of indoor climate .....................................................................................................................19
3.3.1 Building 1: Project Office of Greater Colombo Urban Transport Development Project ...21
3.3.2 Building 2: Wing 4 G of Bandaranayke Memorial International Conference Hall ...............24
3.3.3 Building 3: Air- Mech Engineering Office ...................................................................................27
3.3.4 Building 4: Sri Lanka Standards Institute (SLSI) ........................................................................30
3.3.5 Building 5: World Trade Centre (WTC) .......................................................................................34

iii
4 Analysis of Results ................................................................................................................... 37
4.1 Analysis of Simulation Results ................................................................................................................37
4.2 Cost benefit analysis for enhanced energy efficiency building envelops applications ...................38
4.2.1 Building 1 (RDA) .............................................................................................................................39
4.2.2 Building 2 (BMICH) ........................................................................................................................40
4.2.3 Building 3 (Air-Mech) .....................................................................................................................41
4.2.4 Building 4 (SLSI) ..............................................................................................................................42
4.2.5 Building 5 (WTC) .............................................................................................................................43
4.3 Summary of the optimum building envelops models .........................................................................43
5 Discussion and Conclusion ..................................................................................................... 45
6 Bibliography ............................................................................................................................ 49
ANNEXURE 1: Calculation of OTTV and annual cooling energy of buildings………………………...51
ANNEXURE 2: Cost of Building Materials …………………………………………………………..106

iv
Index of Tables
Table 2-1: Maximum U-values for facades with or without fenestration ............................................................................13 Table 2-2: Maximum U-Factor values for roofs ...............................................................................................................14 Table 3-1: Assumptions and data used for buildings simulation .......................................................................................20 Table 3-2: Absolute and percentage reduction of OTTV and annual cooling energy with modifications of building 1 .........23 Table 3-3: Absolute and percentage reduction of OTTV and annual cooling energy with modifications of building 2 .........26 Table 3-4: Absolute and percentage reduction of OTTV and annual cooling energy with modifications of building 3 .........29 Table 3-5: Absolute and percentage reduction of OTTV and annual cooling energy with modifications of building 4 .........32 Table 3-6: Absolute and percentage reduction of OTTV and annual cooling energy with modification of building 5 ...........35 Table 4-1: Building modifications resulted to increase of annual cooling energy ...................................................................37 Table 4-2: Relationship between OTTV and annual cooling energy ..................................................................................37 Table 4-3: LCC for different modifications of building 1 ..................................................................................................39 Table 4-4: LCC for different modifications of building 2 ..................................................................................................40 Table 4-5: LCC for different modifications of building 3 ..................................................................................................41 Table 4-6: LCC for different modifications of building 4 ..................................................................................................42 Table 4-7: LCC for different modifications of building 5 ..................................................................................................43 Table 4-8: Recommended modification for buildings ..........................................................................................................43 Table 5-1: Variation of OTTV and specific annual cooling energy requirement with modification for buildings .................45

v
Index of Figures
Figure 1-1: Share of electricity consumption in Sri Lanka .................................................................................................. 1 Figure 2-1: Exterior and semi-exterior building envelop ..................................................................................................... 7 Figure 2-2: Schematic showing three modes of heat transfer of an exterior envelop element .................................................... 7 Figure 2-3: Nomenclature for conduction in plane walls ...................................................................................................... 8 Figure 2-4: Thermal radiation effects of wall .....................................................................................................................10 Figure 2-5: Climatic zones of Sri Lanka .........................................................................................................................12 Figure 2-6: Input/output to the DesignBuilder software ...................................................................................................17 Figure 3-1: Layout diagram of the existing building 1 ......................................................................................................22 Figure 3-2: Variation of the annual cooling energy with the OTTV of the building 1 .......................................................24 Figure 3-3: Layout diagram of the existing building 2 ......................................................................................................25 Figure 3-4: Variation of the annual cooling energy with the OTTV of the building 2 .......................................................27 Figure 3-5: Layout diagram of the existing building 3 ......................................................................................................28 Figure 3-6: Variation of the annual cooling energy with the OTTV of the building 3 .......................................................30 Figure 3-7: Layout diagram of the existing building 4 ......................................................................................................31 Figure 3-8: Variation of the annual cooling energy with the OTTV of the building 4 .......................................................33 Figure 3-9: Variation of the annual cooling energy with the OTTV of the building 4 (after removing two data points) ......33 Figure 3-10: Layout diagram of the existing building 5 ....................................................................................................34 Figure 3-11: Variation of the annual cooling energy with the OTTV of the building 5 .....................................................35 Figure 3-12: Variation of the annual cooling energy with the OTTV of the building 5(after removing two data points) .....36 Figure 5-1: Variation of specific annual energy consumption Vs OTTV for buildings ......................................................46

vi
Nomenclature
OECD Organization for Economic Cooperation and Development SLSEA Sri Lanka Sustainable Energy Authority
U.S United Status
OTTV Overall Thermal Transfer Value W/m2
U Overall heat transfer Coefficient W/m2.0C
R Unit thermal resistance m2.0C/W
CEB Ceylon Electricity Board
EEBC Code of Practice for Energy Efficient Buildings in Sri Lanka 2008
ASHRAE American Society of Heating, Refrigerating and Air-Conditioning Engineers
IHG Internal Heat Gains
DLG Double Layer Glazing
LKR Sri Lankan Rupees

1
1 Introduction
This chapter provides an introduction to the research. There are three subsections to this introduction,
namely; background, problem statement and objectives. The background section describes the global
energy utilization in building sector and importance of the energy efficient building regulations. The
problem statement focuses some issues identified in the “Code of Practice for Energy Efficient Buildings
in Sri Lanka -2008”. The objectives of the research scope are mentioned in the third part.
1.1 Background
According to the International Energy Outlook 2010, residential and commercial buildings consume
about one fifth of the world’s total energy delivered. It is projected that the energy need growth rate
among residential and commercial sector of non-OECD nations from 2007 to 2035 are 1.9 percent per
year and 2.7 percent per year respectively [U.S. Energy Information Administration, 2010]. In both these
sectors energy goes for the building systems of different nature. This includes energy used for controlling
the climate in buildings, energy used for appliances, lighting and other installed equipment.
As far as the national level electricity consumption is concerned, the use of electricity in buildings
accounts for a large share of the total national energy consumption. Commercial sector, under which large
scale buildings are there, contributes to 24% of the consumption, and the consumption of the domestic
sector is 40% .Total annual electricity consumption in 2010 is 9208 GWh [Sri Lanka Sustainable Energy
Authority, 2010].
Figure 1-1: Share of electricity consumption in Sri Lanka (Sri Lanka Sustainable Energy Authority, 2010)
Building materials and technologies, and building practices have evolved through ages. Housing and
building conditions reflect the living standards of the society. People spend significant amount of time of
Domestic40%
Industrial34%
Commercial24%
Religious1%
Street lighting1%

2
their life in indoors and the condition of the built environment mainly affect to the comfort, health and
productivity of occupants.
In a large scale building, air conditioning is the highest share of electricity load and lighting also
contributes to a significant portion. A significant amount of energy wasted due to the inefficient design,
equipments and inappropriate behavior of occupants.
As such, in the light of the current energy crisis, any positive changes in this sector targeting the efficient
use of energy would have a significantly positive impact on the overall energy consumption of the country.
Buildings are designed for many decades and inefficient buildings consume more energy basically for
space conditioning and lighting. It has been realized that the life cycle cost of a building can be drastically
reduced through better planning and designing. Introduction of energy efficient measures during initial
state may involve no or least cost as an example consideration of building orientation, size and orientation
of windows, selection of construction materials, introduction of natural ventilation and passive design
techniques, installation of efficient equipments etc. But it reduces the lighting, ventilation and cooling or
heating energy during operation. Improvement of energy efficiency of a building at the planning stage is
relatively simple and cost effective while improvements after the construction are much more difficult.
Building codes or energy standards introduce minimum energy performance standards for new buildings
and retrofits. Energy efficiency requirements in building codes or energy standards for new buildings are
therefore among the most important single measures towards improving energy efficiency.
1.2 Problem statement
Code of Practice for Energy Efficient Buildings in Sri Lanka – 2008 has introduced by the Sri Lanka
Sustainable Energy Authority (SLSEA) in year 2009. It has defined the minimum energy performance
standards under five elements namely; lighting, ventilation and air conditioning systems, building envelops,
service and water heating and electrical power distribution [Sri Lanka Sustainable Energy Authority, 2009].
At the moment the Code is in implementation phase and it is practiced by professionals and building
constructors in voluntary basis. Although the SLSEA has defined these minimum energy performance
values, those have not been verified yet.
Building envelop refers to the external elements of the building namely roof, wall, floors and fenestration.
External heat gains and losses of the building are occurred through the envelop. Therefore the properties
of the envelop materials directly affect to the thermal and visual comfort of the occupants as well as the
energy consumption of the building. The building envelop is one of the major element which has huge
potential to reduce the life cycle cost by proper design during the design phase. This research is focused in
finding solutions to following problems of building envelop section of the Code.
1. The impact of the minimum energy performance standards (prescribed in the building code for the
building envelops) to the building energy efficiency has not been verified.
2. The incremental cost benefit of prescriptive parameters vs energy efficiency has not been quantified.
3. There is no general guideline /grading system for building envelops design based on energy efficiency.

3
1.3 Objectives
The objectives of the research are as follows. These objectives were defined with the view of limiting the
scope of the research to achieve specific target within the available time and resources.
1. Analyze the prescriptive requirements mentioned in the building code for the building envelops to
optimize the energy efficiency of commercial buildings.
2. Modeling of indoor climate and study the cooling energy variation with Overall Thermal Transfer
Value, using “DesignBuilder” software.
3. Carry out a cost benefit analysis for enhanced energy efficiency building envelops applications.
4. Provide general guidelines / recommendations for building envelop design which could be useful to
policy makers.
This chapter provided an introduction to the research project including background, problems to be
solved in this research and the objectives.

4
2 Literature Review
This chapter covers the literature review carried out as a part of the research. The objective of the
literature review was to obtain an in depth understanding of the previous studies carried out in this subject
area. This chapter includes history and overview of the building codes in the world, types of regulations
used for improvement of energy efficiency in buildings, introduction of a code of practice for energy
efficient buildings in Sri Lanka, overview of overall thermal transfer value and overview of the
“DesignBuilder” software.
2.1 History of building codes in the world
Building codes or standards are used from several years ago addressing mainly the occupants' health and
safety. First introduction of insulation requirements for U values, R values and specific insulation
materials or multi glazing was in Scandinavian countries in late 1950s. But in many countries energy
efficient building codes has been introduced and used, specially during the oil crisis in 1970s. [Jens
Laustsen, 2008].
Some of the examples for energy codes available in the world;
1. America - ANSI/ASHRAE/IESNA Standard 90.1-2004 “Energy Standard for Buildings Except
Low-Rise Residential Buildings”
2. Malaysia – Code of Practice on Energy Efficiency and Use of Renewable Energy for Non-
Residential Buildings
3. Philippines – The National Building Code of Philippines
4. India – Energy Conservation Building Code
2.2 Types of regulations
There are different types of energy efficiency regulations which are used in the building codes. Each type
use different approach to achieve the ultimate objective of energy conservation. Basic types are as follows;
1. Prescriptive
2. Trade-off
3. Model building
4. Energy frame
5. Performance
2.2.1 Prescriptive type regulations
In this method, energy efficiency requirements are set for each building part and each part of the
equipment system. As an example, it sets thermal transfer value (U values) or thermal resistance value (R
values) for each element of the building envelop, visual transmittance values for fenestrations, the number
and size of windows or window to wall ratio, coefficient of performance of air conditioners, pumps, fans
etc. In the prescriptive method, it is required to meet each and every individual component with its
specific value [Jens Laustsen, 2008].

5
2.2.2 Trade-off type regulations
In trade-off method it is sets energy efficiency requirements for each component of the building as similar
to the prescriptive method. But there is flexibility to trade-off between different components, so some
values are better and some are worse than the requirements [Jens Laustsen, 2008].
2.2.3 Model building type regulations In this method, it sets the energy efficiency values for each building part and each part of the equipment.
According to the clearly defined calculation method, a building model is developed with the same shape
and characteristics of the actual building are calculated with the energy efficiency set values. Then the
characteristic of the actual building is calculated with the actual values for the individual building parts and
systems, following the same calculation method. Finally the results of the calculation of two buildings are
compared and the actual building must perform as well or better than the model building.
This method offer more freedom and flexibility than prescriptive method. It can replace expensive
systems with more cost effective energy efficient techniques [Jens Laustsen, 2008].
2.2.4 Energy frame type regulations
In Energy Frame method, the overall performance of the building is considered rather than the
performance of individual elements. It sets the values for a building’s maximum energy loss. This is
usually set as a value per m² of building area or as a combination. The building energy loss is calculated
using U-values, temperature, surface and heat gains from sunlight etc according to the specified methods
and set of equations. This method offers the freedom to builder to build parts of the buildings that are
less energy efficient when other parts are made better than typical constructions. As long as the overall
value is met, the building is approved [Jens Laustsen, 2008].
2.2.5 Performance type regulations
In energy performance method, a total requirement for the building is set based on a building’s overall
consumption of energy or fossil fuel or the building’s implied emissions of greenhouse gas. This is usually
set as an overall value, consumption per m² of building area or a mixture, for different types of use or
different types of buildings etc.
The calculations are much comprehensive and it is required to use an advanced computer based model,
which integrate all the different parts and installations of the building. In the energy performance, it is
required to consider the installations of renewable energy, solar gains, recovery of energy losses, shading
and efficiency in installations for energy consumption calculation. Consumption of fossil fuel, building’s
implied emission is calculated comparing the use of different energy forms depending on local energy
conditions.
This method gives optimal freedom for constructors or designers to reduce energy consumption within
the frame by using alternatives [Jens Laustsen, 2008].

6
2.3 Code of Practice for Energy Efficient Buildings in Sri
Lanka – 2008
The history of the energy efficient building codes in Sri Lanka runs back to year 2000. Realizing the
pressing need for the revitalization of building design in the country, Ceylon Electricity Board (CEB)
developed an Energy Efficient Building Code (EEBC) way back in 2000. Unfortunately, as the actual
implementation of the code was on voluntary basis, it did not get off the ground.
Given this background, and the need for building codes to be continuously upgraded in the face of
advancing technological innovations, Sri Lanka Sustainable Energy Authority reviewed the Energy
Efficient Building Code and published the document of Code of Practice on Energy Efficient Buildings in
Sri Lanka - 2008.
Code of Practice for Energy Efficient Buildings encourages energy efficient designs and retrofits of
buildings to reduce energy consumption without compromising the function of the building, or the
comfort, health and productivity of occupants. It sets minimum energy performance standards for
buildings and at the same time provides the methods for determining compliance. The Code is applicable
to commercial buildings, industrial facilities and large scale housing complexes that have at least one of the
features namely; four or more floors, a floor area of 500 m2 or more, an electricity demand of 100 kVA or
more and an air conditioning capacity of 350 kW or more. It has been developed to cover the building
elements; building envelops, ventilation and air conditioning systems, lighting, service and water heating
and electrical power distribution [Sri Lanka Sustainable Energy Authority, 2009].
In this research it is focused on the building envelop section only. According to the building code [Sri
Lanka Sustainable Energy Authority, 2009], “Building envelope refers to the exterior plus the semi-
exterior portions of a building. For the purposes of determining building envelope requirements, the
classifications are defined as follows:
(a) Building envelope, exterior: the elements of a building that separate conditioned spaces from the
exterior
(b) Building envelope, semi-exterior: the elements of a building that separate conditioned space from
unconditioned space or that encloses semi-cooled spaces through which thermal energy may be
transferred to or from the exterior, or to or from unconditioned spaces, or to or from conditioned spaces”
.

7
Figure 2-1: Exterior and semi-exterior building envelop (American Society of Heating, Refrigerating and Air-Conditioning Engineers, 2004)
Building envelope elements play a considerable role on the visual and thermal comfort of the occupants
and energy consumption of the building. By proper design and construction of the building envelop the
load on these systems can be reduced. Heat transmission of a building is occur through the components
of the building envelop. Generally heat is transferred from high temperature to low temperature. The
three-ways of heat transfer namely; conduction, convection and radiation are occurred in simultaneously
in a building. Conduction is the transfer of heat in a solid medium due to the direct contact of particles.
Convection heat transfer occurs due to the movement of a fluid. Radiation heat transfer is the movement
of energy/heat through space without relying on conduction through the air or by the movement of air.
Figures 2.2 indicate these three-modes of heat transfer occurred in external surfaces of a building.
Figure 2-2: Schematic showing three modes of heat transfer of an exterior envelop element (Bureau of Energy Efficiency,2009)
8
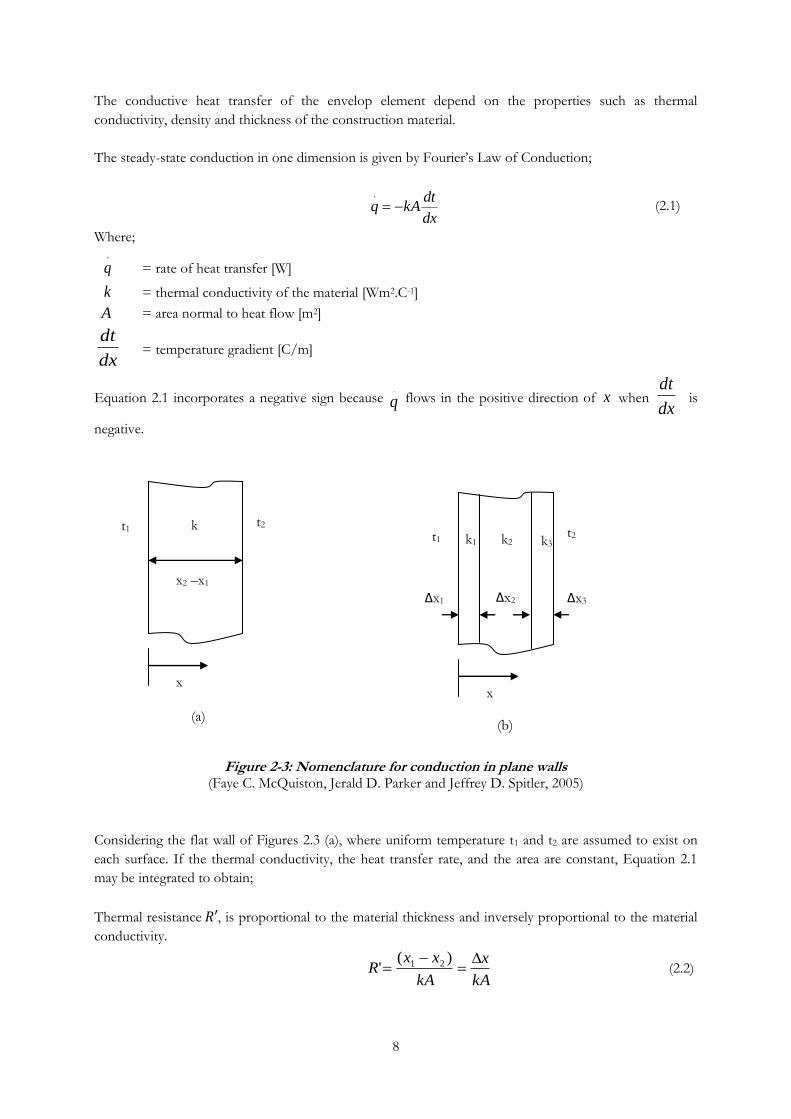
The conductive heat transfer of the envelop element depend on the properties such as thermal
conductivity, density and thickness of the construction material.
The steady-state conduction in one dimension is given by Fourier’s Law of Conduction;
dx
dtkAq
.
(2.1)
Where;
.
q = rate of heat transfer [W]
k = thermal conductivity of the material [Wm2.C-1]
A = area normal to heat flow [m2]
dx
dt = temperature gradient [C/m]
Equation 2.1 incorporates a negative sign because q.
flows in the positive direction of x when dx
dt is
negative.
Figure 2-3: Nomenclature for conduction in plane walls (Faye C. McQuiston, Jerald D. Parker and Jeffrey D. Spitler, 2005)
Considering the flat wall of Figures 2.3 (a), where uniform temperature t1 and t2 are assumed to exist on
each surface. If the thermal conductivity, the heat transfer rate, and the area are constant, Equation 2.1
may be integrated to obtain;
Thermal resistance 𝑅′, is proportional to the material thickness and inversely proportional to the material
conductivity.
kA
x
kA
xxR
)(' 21 (2.2)
k1 k3 k2
x2 –x1
k
x
t1 t2
(a)
x
t1 t2
∆x1 ∆x3 ∆x2
(b)

9
The thermal resistance for a unit area is defined by;
k
xR
(2.3)
The thermal resistance 𝑅′, q and (t2-t1) are analogous to electrical resistance, current and potential
difference in Ohm’s law. This analogy can be used to analyze the conduction heat through a wall, roof
and windows made up of two or more layers of dissimilar materials. Figures 2.3 (b) shows a wall
constructed of three different materials. The heat transfer by conduction is given by;
Ak
x
Ak
x
Ak
xRRRR
3
3
2
2
1
1'
3
'
2
'
1
'
(2.4)
Where; the resistances are in series.
Thermal conductance C of the material is given by;
x
k
RC
1 (2.5)
Heat transfer rate due to the thermal convection is given by;
)(.
wtthAq (2.6)
Where;
h = film coefficient, [Wm-2.K-1]
t = bulk temperature, [0C]
tw = wall temperature, [0C]
Equation 2.6 can also be expressed in terms of thermal resistance for convection 𝑅𝑐𝑛𝑣′ ;
'
.
cnv
w
R
ttq
(2.7)
Where hA
Rcnv
1' (2.8)
Therefore convection thermal resistance for unit area, 𝑅𝑐𝑛𝑣
hR cnv
1 (2.9)
The film coefficient h depends on the fluid, the fluid velocity, the flow channel or wall shape or
orientation, and the degree of development of the flow field. There are two types of convection
mechanisms called forced convection and free or natural convection. When the convection heat transfer is
occurred due to the movement of bulk of fluid relative to the heat transfer surface, the mechanism is

10
called forced convection. Usually the motion is caused by a blower, fan or pump. Here the effects of the
buoyancy forces are negligible. The free convection is occurred due to the movement of fluid due to the
buoyancy forces. The surrounding bulk of the fluid is stationary and exerts a viscous drag on the layer of
moving fluid(Faye C. McQuiston, Jerald D. Parker and Jeffrey D. Spitler, 2005).
The direct net transfer of energy by radiation between two surfaces that see only each other and that are
separated by a nonabsorbent medium is given by;
22
2
121
1
11
1
4
2
4
112
.
111
)(
AFAA
TTq
(2.10)
Where;
= Boltzmann constant = 5.673 x 10⁻⁸ [W/m2.K4]
T = absolute temperature [K]
= emittance of surface 1 or surface 2
A = surface area [m2]
F = configuration factor, a function of geometry only
(Faye C. McQuiston, Jerald D. Parker and Jeffrey D. Spitler, 2005)
In equation 2.10, it is assumed that emittance ( ) equals to absorptance ( ) in both surfaces.
Figure 2-4: Thermal radiation effects of wall (Faye C. McQuiston, Jerald D. Parker and Jeffrey D. Spitler, 2005)
Considering the wall at Figures 2.4
....
orwi qqqq (2.11)
For the wall being heated by a combination of convection and radiation on each surfaces and having 5
different resistances, the equivalent thermal resistance '
eR
qr
qw
t0
h0
ti
hi k
qi
q0

11
''
3
'
2
'
1
''
oie RRRRRR (2.12)
In terms of fundamental variables;
OOii
eAhAk
x
A
R
Ak
x
AhR
11
33
3
2
2
11
1'
(2.13)
Overall heat-transfer coefficient is given by;
RAR
U11
/ (2.14)
The heat transfer rate in each component is given by;
tUAq .
(2.15)
Where;
UA = conductance [W/C]
A = Surface area normal to flow [m2]
t = overall temperature difference [C]
The rate of heat transfer proportional to the overall heat transfer coefficient, surface are normal to flow
and overall temperature difference. Therefore the rate of heat transfer of the element can be reduced by
increasing the thermal resistance. In order to increase the resistance it can introduce low conductive
materials and or increase the thickness of the material layers.
The average yearly temperature of Sri Lanka ranges from 280C to 320C. The difference of elevation in Sri
Lanka influences temperature variation in the country. It ranges from hot to cold from the lowland to
upland. According to the Department of Agriculture, Sri Lanka can be divided in to three climate zones
namely wet, intermediate and dry zone and Figures 2.5 indicates the zones.

12
Figure 2-5: Climatic zones of Sri Lanka (http://www.climatechange.lk/maps/climaticzones.jpg)
The thermal properties of the building depend on its outdoor climate conditions as well as the internal
conditions such as type of the activities, time of operation. In the Code, the country is divided in to three
climatic zones, namely warm-humid, warm-dry and uplands based on the outdoor dry bulb and wet bulb
temperatures. These represent the climate zones wet, intermediate and dry in Figures 2.5 respectively. The
specified dry bulb and wet bulb temperatures of different zones are;
Warm-humid – 310C, 270C
Warm-dry – 330C, 260C
Uplands – 280C, 230C
Based on the duration of the operation of the building two typologies are identified as day-time operation
and extended operation. Normal eight (08) hours per day operation buildings such as offices, shops are
considered as day time operation and more than 08 hour operation buildings such as hospitals, hotels, and
supermarkets are considered as extended operation. The materials to be used in the construction are
decided according to the climatic zone as well as building typology.
13
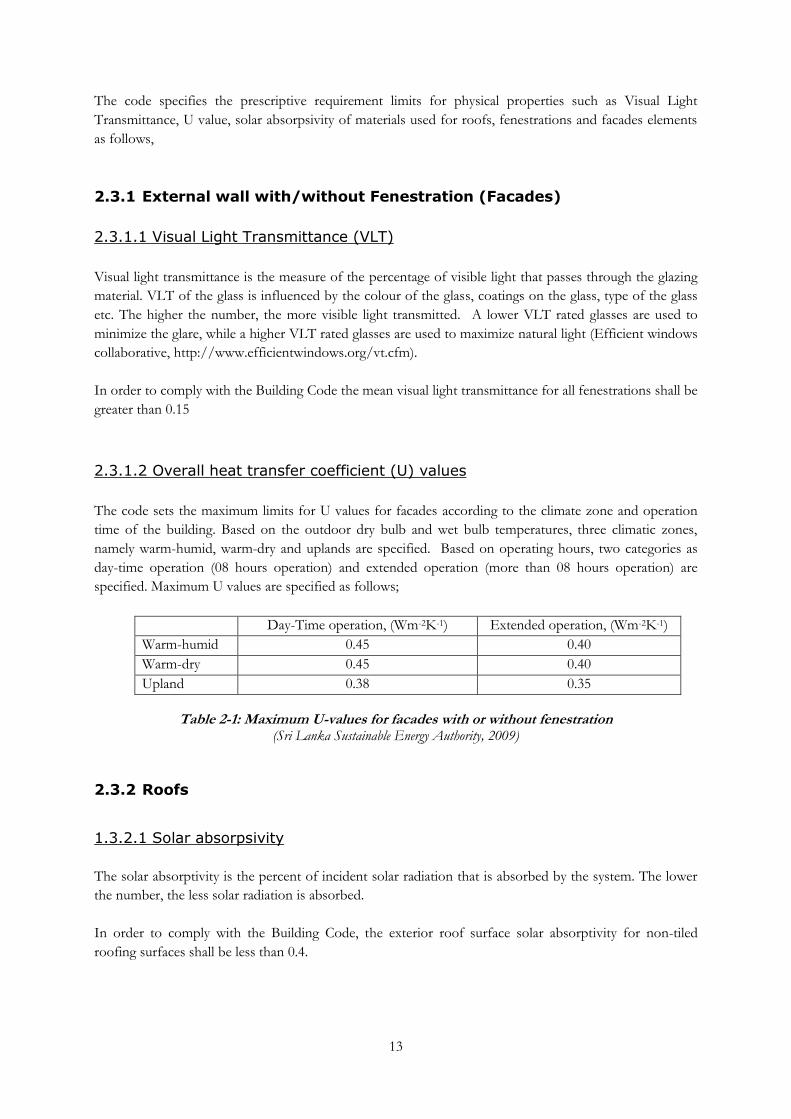
The code specifies the prescriptive requirement limits for physical properties such as Visual Light
Transmittance, U value, solar absorpsivity of materials used for roofs, fenestrations and facades elements
as follows,
2.3.1 External wall with/without Fenestration (Facades)
2.3.1.1 Visual Light Transmittance (VLT)
Visual light transmittance is the measure of the percentage of visible light that passes through the glazing
material. VLT of the glass is influenced by the colour of the glass, coatings on the glass, type of the glass
etc. The higher the number, the more visible light transmitted. A lower VLT rated glasses are used to
minimize the glare, while a higher VLT rated glasses are used to maximize natural light (Efficient windows
collaborative, http://www.efficientwindows.org/vt.cfm).
In order to comply with the Building Code the mean visual light transmittance for all fenestrations shall be
greater than 0.15
2.3.1.2 Overall heat transfer coefficient (U) values
The code sets the maximum limits for U values for facades according to the climate zone and operation
time of the building. Based on the outdoor dry bulb and wet bulb temperatures, three climatic zones,
namely warm-humid, warm-dry and uplands are specified. Based on operating hours, two categories as
day-time operation (08 hours operation) and extended operation (more than 08 hours operation) are
specified. Maximum U values are specified as follows;
Day-Time operation, (Wm-2K-1) Extended operation, (Wm-2K-1)
Warm-humid 0.45 0.40
Warm-dry 0.45 0.40
Upland 0.38 0.35
Table 2-1: Maximum U-values for facades with or without fenestration (Sri Lanka Sustainable Energy Authority, 2009)
2.3.2 Roofs
1.3.2.1 Solar absorpsivity
The solar absorptivity is the percent of incident solar radiation that is absorbed by the system. The lower
the number, the less solar radiation is absorbed.
In order to comply with the Building Code, the exterior roof surface solar absorptivity for non-tiled
roofing surfaces shall be less than 0.4.
14
1.3.2.2 Overall heat transfer coefficient (U) values
The code sets the maximum limits for U values for roofs according to the type of the roof, climate zone,
and operation time of the building as follows;
Day-Time operation, (Wm-2K-1) Extended operation, (Wm-2K-1)
Tiled Non-Tiled Tiled Non-Tiled
Warm-humid 0.30 0.40 0.30 0.28
Warm-dry 0.25 0.40 0.25 0.28
Upland 0.20 0.35 0.20 0.25
Table 2-2: Maximum U-Factor values for roofs (Sri Lanka Sustainable Energy Authority, 2009)
2.3.3 Area Weighted Cumulative Overall Thermal Transfer Value (OTTV)
According to the building code, “Area weighted cumulative OTTV of the actual building design
combining actual OTTVi values of all facades of the building and U-factor values of roofs shall be less
than the corresponding cumulative OTTV of the actual building design estimated using all prescriptive
values and also than a value of 50 W/m2” (Sri Lanka Sustainable Energy Authority, 2009).
This value represents the average rate of heat transfer through the building envelop due to the
temperature difference between exterior and the conditioned space. The OTTV is directly proportional to
the heat gain and the standards set the maximum OTTV for the building envelop. The aim of limiting the
OTTV is to reduce the heat gain and finally reduce the load on air conditioning.
𝑂𝑇𝑇𝑉 = 𝑄
𝐴
Where the terms defined as;
Q = Heat gain through the envelop (W)
A = Gross area of the building envelop (m2)
Heat gain through the envelop represents major three heat gains namely; Heat conduction through
opaque section of wall and roof , Heat conduction through fenestration and Solar heat gain through
fenestration.
𝑂𝑇𝑇𝑉𝑖 = ∆𝑇𝑒𝑞 ∝ 1 − 𝑊𝑊𝑅 𝑈𝑤 + ∆𝑇 𝑊𝑊𝑅 𝑈𝑓 + 𝑆𝐹 𝑊𝑊𝑅 𝑆𝐶 𝑆𝐹
𝑂𝑇𝑇𝑉 = 𝐴1𝑂𝑇𝑇𝑉1 + 𝐴2𝑂𝑇𝑇𝑉2 + 𝐴3𝑂𝑇𝑇𝑉3 …………… + 𝐴𝑁𝑂𝑇𝑇𝑉𝑁 + 𝐴𝑅𝑜𝑜𝑓𝑂𝑇𝑇𝑉𝑅𝑜𝑜𝑓
𝐴1 + 𝐴2 + 𝐴3 + …………… + 𝐴𝑁 + 𝐴𝑅𝑜𝑜𝑓
Where the terms are defined as:

15
OTTVi = Overall thermal transmittance value for the ith specific wall or roof orientation and construction
combination, (W/m2)
Ai = Area of the ith specific wall or roof (m2)
∆Teq = Equivalent indoor-outdoor temperature difference through the opaque wall section, (19.3°C)
= Solar absorptance of the exterior opaque wall (dimensionless)
WWR = Window-to-wall ratio, using the gross wall area in the denominator, (dimensionless).
Uw = Thermal transmittance of opaque wall section, (W/m2°C)
∆T = Temperature difference through the window section, (3.6°C)
Uf = Thermal transmittance of window section, (W/m2°C)
SF = Solar factor, defined as the average hourly value of solar energy incident on vertical windows, (186
W/m2)
SC = Shading coefficient of the fenestration system (dimensionless)
CF = Solar correction factor for the orientation of the fenestration
The Code has provided the respective constants for ∆Teq, ∆T, and SF and respective tables for CF and SC
by considering the Sri Lankan environmental conditions.
2.4 Introduction of OTTV as a building code parameter
The Overall Thermal Transfer Value (OTTV) is an index which was introduced by the American Society
of Heating, Refrigerating and Air-conditioning Engineers (ASHRAE) originated in 1975 to measure the
thermal performance of an air conditioned building by ASHRAE Standards 90-75, “Energy Conservation
in New Building Design”. Then many countries included this method for building codes [F.W.H Yik et al,
2005].
Later on, this method was dropped from ASHRAE standard 90.1-89 in favor of performance-based
energy budgets generated through computer simulations. But most of the Asian countries such as Hong
Kong, Singapore, Thailand, and Malaysia still use this method because of its relative ease of calculation,
and flexibility of trade-offs between different parts of the envelope.
2.5 Previous studies on OTTV
F.W.H Yik and K.S.Y Wan [F.W.H Yik et al, 2005] have carried out a research to study the
appropriateness of OTTV as a measurement to regulate the envelope energy performance of air
conditioned buildings. The research was carried out in Hong Kong. The research studies showed that for

16
buildings situated in a sub-tropical climate region like Hong Kong, “acceptable correlation between
OTTV and energy use for air-conditioning (with all other things being equal) could be achieved only if the
heat transfer in buildings during the cool months was ignored. Even though OTTV calculated in such a
way may be a good reflection of the impact of envelope performance on energy use for air-conditioning, it
remains an inadequate measure of the envelope performance” [F.W.H Yik et al, 2005].
Further they have questioned the appropriateness of pre calculated coefficients “As the case study results
for office and residential buildings presented in this paper show, the use of pre-calculated coefficients for
OTTV calculation has inherent deficiencies, as the interacting effects among heat gains from different
envelope elements and internal sources, and the impacts of room configuration cannot be properly
accounted for. The OTTV determined from such methods, therefore, is subject to uncertainties and may
be inconsistent with the envelope performance” [F.W.H Yik et al, 2005].
In order to increase the effectiveness they have suggested “To be effective, regulatory control over
building energy performance needs to include requirements on the energy performance of building
services installations. In order to provide designers with flexibility in meeting the control requirements in
the most economical manner, compliance through an alternative route that is based on the total energy
budget approach, as in ASHRAE Standard 90.1, should be provided”. One important suggestion provided
is “In this case, detailed computer simulation becomes an integral part of compliance demonstration.
When detailed simulation is used, minimum performance required of individual types of envelope
components can be specified on the basis of more basic characteristics, e.g. the characteristics of a
particular wall construction and glazing and a window-to-wall area ratio limit, instead of using the
simplistic OTTV method, which is prone to errors” [F.W.H Yik et al, 2005].
A research has been carried out in Malaysia by Mansour Nikpour et al, 2011 to study the Self shaded
strategy in high-rise buildings effect on minimizing the amount of OTTV. As per the research,” the
reduction is 68.94 × WWR for Malaysia. The effect of Self-shaded strategy is more significant if the
amount of WWR increase.
This is an effective approach to allow architectural design to have a more flexible building facade design,
and to enhance a more energy-efficient and greener building development.
2.6 Overview of DesignBuilder software as a simulation tool
DesignBuilder Version 2.4.2.010 was used for the modeling purpose. DesignBuilder is one of the
graphical user interfaces of Energyplus simulation engine. Energyplus is a building energy simulation
programme developed by U.S department of energy.
This software programme models energy flows such as heating, cooling, lighting, ventilation and water
use.
Capabilities of the DesignBuilder software version 2.4.2.010 are as follows;
Evaluating facade options for overhangs, internal blinds and visual appearance.
Thermal simulation of naturally ventilated buildings.
Daylighting - models lighting control systems and calculates savings in electric lighting.
Visualisation of site layouts and solar shading.

17
Calculating heating and cooling loads and required equipment sizes.
Limitations of the DesignBuilder software version 2.4.2.010 are as follows;
Version 2.4.2.010 is not capable of carrying out life cycle cost analysis.
It cannot analyze solar absorptivity and visual light transmittance parameters.
The input/output of the DesignBuilder software are as follows.
Figure 2-6: Input/output to the DesignBuilder software
Inputs
Location & Weather
data
Building Layout
Construction material
Building activities
Lighting
Openings
HVAC
Design Builder
Software
Outputs
Cooling Load
Heating Load
Simulation of build
environment with real weather
data
Energy consumption
Indoor climate condition
variations
System design load
18
3 Methodology
This chapter covers the methodology followed in the research. As explained in section 1.3, main
objectives of the research were to analyze the prescriptive requirements prescribed in the building code
for the building envelops to optimize the energy efficiency of commercial buildings, modeling of indoor
climate to study the cooling energy variation with Overall Thermal Transfer Value using “DesignBuilder”
software, carry out a cost benefit analysis for enhanced energy efficiency building envelops applications
and to provide general guidelines / recommendations for building envelop design which could be useful
to policy makers.
.
In the code, it has specified maximum allowable U-values for walls and roofs, air leakages for
fenestrations and doors, solar absorptivity for non-tiled roofing surfaces and minimum VLT for
fenestration under mandatory and prescriptive requirements. In order to comply with the Building Code,
it is required to meet all these requirements and the OTTV of the building should be less than the
corresponding cumulative OTTV of the building design estimated using all prescriptive values and also
than a value of 50W/m2.
With the time limitation, focus of this research was limited to analyze the improvements of energy
efficiency by means of annual cooling energy reduction of buildings with the OTTV reduction. The
selected buildings are located in warm-humid zone and operated in day time. The OTTV values of the
buildings were reduced by changing the U-values of walls, roof and fenestrations.
Below mentioned six basic steps were carried out during the research;
1. Identification of five (05) office buildings in Colombo.
2. Collection of data for calculation of the building envelop properties
3. Modeling of indoor climate and study the annual cooling energy variation with Overall Thermal
Transfer Value, using DesignBuilder software.
4. Carry out a cost benefit analysis for enhanced energy efficiency building envelops applications.
5. Identification of the optimum building envelops models.
6. Develop general guidelines /recommendations / grading system for building envelops design
based on the results.
3.1 Identification of five (05) office buildings in Colombo, Sri
Lanka
The code is applicable for the commercial buildings, industrial facilities and large scale housing
developments having one or more of the features; four or more stories, floor area of 500m2 or more,
electrical power demand of 100 kVA or more and air-conditioning cooling capacity of 350 kW (output) or
more. It defines maximum U values for facades and roofs according to the climate zone and building
usage.
The focus area of this research is limited to the day time operation buildings in warm humid climate.
Therefore 05 office buildings located in Colombo area having one or more of above features have been
selected for the analysis.
According to the concise Oxford English dictionary (Indian Edition), 2007, office building is a building
used as place of business for clerical, administrative, or similar work.
19
Following office buildings have been identified for the analysis.
1. Project Office of Greater Colombo Urban Transport Development Project (OCH) Southern
Section from Kaduwela to Kottawa, Road Development Authority, Udumulla Road, Battaramulla
No. of floors – 01
Floor area – 550 m2
2. Wing 4G of Bandaranayake Memorial International Conference Hall (BMICH), Bauddhaloka
Mawatha, Colombo 07
No. of floors – 03
Floor area – 1600 m2
3. Air Mech (Pvt) Ltd, No. 73 B, Nugegoda Road, Papiliyana, Boralasgamuwa.
No. of floors – 04
Floor area – 500 m2
4. Sri Lanka Standard Institute (SLSI), No. 17, Victoria Place, Alwitigala Mawatha, Colombo 08.
No. of floors – 08
Floor area – 6100 m2
5. World Trade Center (WTC), No. 18-01, Colombo 01
No. of floors – 37
Floor area – 81500 m2
The buildings were selected based on the number of floors to cover both possible scenarios of low rise
and high rise buildings.
3.2 Collection of data for calculation of the building envelop
properties
Following measurements were obtained for each building mentioned in section 3.1 for the calculation of
the OTTV of the existing building. These parameters were identified as specified in the building code.
1. Plan view, front elevation and side elevation drawings of the building
2. Building construction material and thickness of each layer of the building envelop
3. Types and height of shading devices
4. Building orientation
3.3 Modeling of indoor climate
The DesignBuilder software was used for the indoor climate modeling. Following assumptions in table 3.1
were made for the modeling purposes in order to maintain the similar indoor activities and conditions for
all buildings.

20
Parameter Value Units
Occupancy Density (People/100m2) 7
Metabolic rate Light office work /standing
/walking
123 W/human
Factor (1-Men, 0.85-
women,0.75-children)
0.9
Clothing Summer 0.6 Clo
Cooling Set point temperature 24 0C
Fresh air Ventilation, rate 10 (l/s. person)
Lighting Illuminance 500 Lux
Lighting density 10 W/m2
Infiltration 2 l/s.m2
Heat Dissipation No. of Computers / 100m2 4
Heat dissipation from
computers
3 W/m2
Office equipment 3 W/m2
Miscellaneous 3 W/m2
HVAC System Template Fan coil
Sizing Method ASHRAE heat balance
Site Location Latitude 6.49 0
Longitude 79.52 0
Site details Elevation above sea level 5 m
Monthly temperature January 26.6 0C
February 26.1 0C
March 27.7 0C
April 28.3 0C
May 28.8 0C
June 27.8 0C
July 27.3 0C
August 27.1 0C
September 27.6 0C
October 27.1 0C
November 26.4 0C
December 26.2 0C
Time Zone (GMT+06.00) Sri
Jayawardhanapura
Simulation Weather data LKA_COLOMBO_RATHMALANA_
SWERA
Table 3-1: Assumptions and data used for buildings simulation
Following steps were followed to identify the correlation between the OTTV, and annual cooling energy
of a building.
1. 1st Step - Calculate existing OTTV manually and find the respective annual cooling energy
using DesignBuilder simulation.

21
The OTTV of the building was calculated considering the existing building properties
such as construction materials, orientation, window to wall ratio, shading coefficients etc.
Properties of the construction materials were extracted from the DesignBuilder software.
Then annual cooling energy was found using DesignBuilder.
2. 2nd Step - Reduce the OTTV by introducing different construction materials for walls, windows
and roof with low thermal transfer values and find the respective annual cooling energy using
DesignBuilder simulation.
Followings are the modifications carried out individually for the existing buildings,
i. Introduce double layer glazing for the windows
ii. Introduce insulations for the walls
iii. Introduce insulations for the roof
iv. Introduce insulations to walls and roof in order to obtain the maximum U values
prescribed for facades and roofs in warm humid, day time operation buildings in the
building code
Further to above common modifications, some more modifications have been done specific to each
building depending on the existing building envelope parameters.
3.3.1 Building 1: Project Office of Greater Colombo Urban Transport
Development Project
This is a single story office building with a floor area of 550 m2. Length, width and height of the building
is 38 m, 12m and 3m respectively. Building is oriented in north-south direction. Walls of the building are
made from masonry block and 3mm thick single clear glasses are used for windows. Galvanized steel
sheets are used for the roof.
3.3.1.1. Layout diagram of the existing building 1
Below diagram shows the existing layout diagram modeled in the software using the measurements
obtained from the actual building.

22
Figure 3-1: Layout diagram of the existing building 1 (Extracted from DesignBuilder)
3.3.1.2. Summary of the results of building 1
U values of the construction materials of walls, window and roof are 3.098 W/m2.K, 6.257 W/m2.K and
7.141 W/m2.K respectively. According to the prescriptive requirements of the building code, the
maximum U values for the wall and roofs of an office building located in Colombo area are 0.45 W/m2.K
and 0.3 W/m2.K respectively. Therefore this building is not met the prescriptive requirements of the
Code. OTTV of the existing building is 47 W/m2. Calculated OTTV of the building for prescriptive
requirements is 12.3 W/m2. In order to comply the building with the code the OTTV should be lesser
than 50 W/m2 as well as 12.3 W/m2. Therefore this building is not complying with the code.
More details on thermal properties and lay out diagrams of the construction materials and OTTV
calculations are provided in section 1 of annex 1.
Following table shows the absolute and percentage change of OTTV and annual cooling energy with
modifications.

23
Modification
Overall Thermal Transfer
Value (OTTV),
W/m2
Annual cooling energy, MWh
Specific energy
consumption, MWh/m2
Percentage reduction of OTTV,
%
Percentage reduction of
annual cooling energy,
%
Existing building 47.1 87.5 0.159 N/A N/A
Introduce double layer glazing 46.5 87.7 0.159 1.27 (0.23)
Introduce insulation to walls 43.8 84.4 0.153 7.01 3.54
Introduce insulation to roof 46.7 87.5 0.159 0.85 0.00
Introduce insulations to walls
and roof, in order to achieve
the maximum U values for
facades and roofs specified in
Building Code
12.3 84.4 0.153 73.89 3.54
Reduce WWR 46.4 87.3 0.159 1.46 0.25
Reduce WWR and Introduce 1m Overhangs to windows
41.9 84.7 0.154 11.08 3.18
Reduce WWR , Introduce 1m Overhangs to windows and change the wall materials to brick
41.4 83.2 0.151 12.17 4.89
Reduce WWR , Introduce 1.5 m Overhangs to windows and change the wall materials to brick
41.3 82.7 0.150 12.39 5.45
Reduce WWR , Introduce 1.5 m Overhangs to windows and change the wall and roof materials to brick and clay tiles respectively
36.5 83.2 0.151 22.46 4.97
Table 3-2: Absolute and percentage reduction of OTTV and annual cooling energy with
modifications of building 1
Introduction of double layer glazing has resulted a reduction of OTTV but it has increased the annual cooling energy. Introduction of insulation to roof has no impact on cooling energy. All other modifications have resulted in reduction of both OTTV and annual cooling energy.
Following graph shows the variation of annual cooling energy with the OTTV.

24
Figure 3-2: Variation of the annual cooling energy with the OTTV of the building 1
The data points can be approximately represented by a second order polynomial with R2 value of 0.861.
It can be observed that up to a certain point the cooling energy reduces with the reduction of OTTV. But
afterward the cooling energy increases while the OTTV decrease.
3.3.2 Building 2: Wing 4 G of Bandaranayke Memorial International
Conference Hall
Bandaranayke Memorial International Conference Hall (BMICH) is a building complex with many office
compartments. Only wing 4 G has been considered for this study. It is a three storey building having
approximate area of 1600m2. The building is oriented in North-West and South-East direction. Two sides
of the building have shaded due to the adjacent buildings. Walls of the building are made from 225mm
thick burned brick and 3mm thick single clear glasses are used for widows. A concrete slab is used as the
roof.
3.3.2.1. Layout diagram of the existing building 2
Below diagram shows the existing layout diagram modeled in the software using the measurements
obtained from the actual building. It has been used component blocks in order to incorporate the shading
effect of the surrounding buildings. There are shading effect due to the verandahs in exterior walls in long
axis also. The components blocks in blue and magenta color shows in Figures 3.2 are used to incorporate
the shading effects due to adjacent buildings and external verandah respectively.
Length of the building = 47 m
Width of the building = 11 m
Slab to Slab height = 3.7 m
25
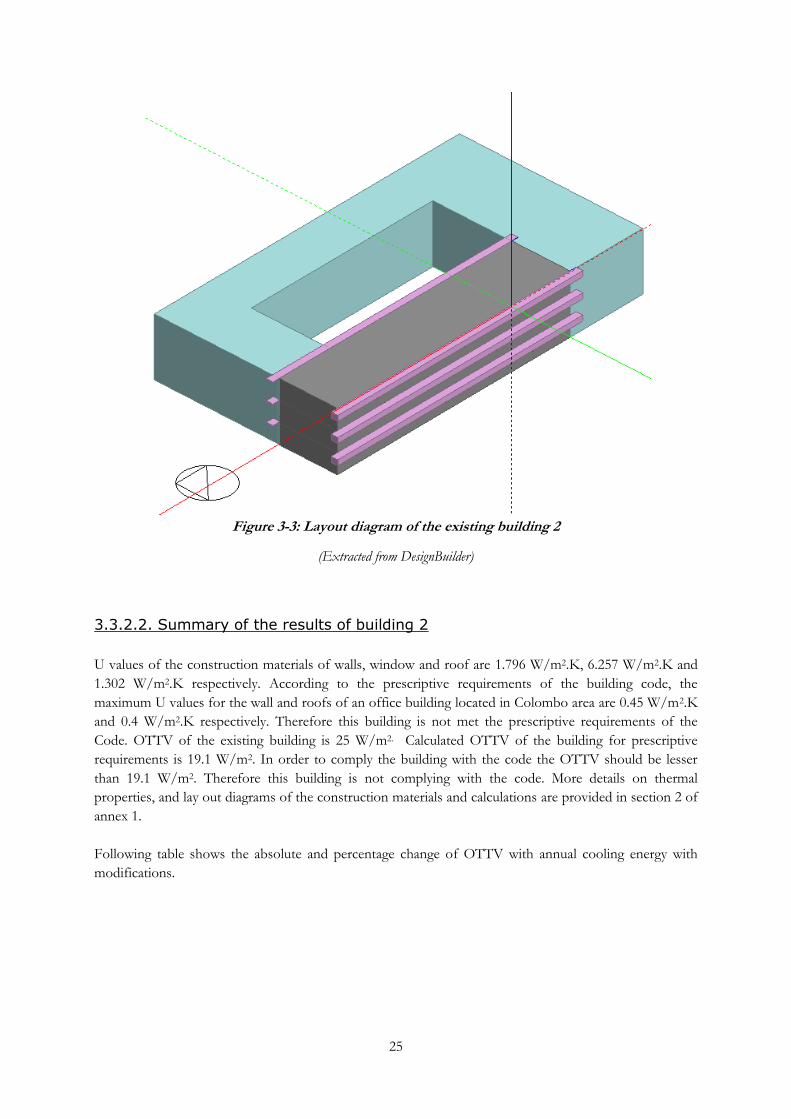
Figure 3-3: Layout diagram of the existing building 2
(Extracted from DesignBuilder)
3.3.2.2. Summary of the results of building 2
U values of the construction materials of walls, window and roof are 1.796 W/m2.K, 6.257 W/m2.K and
1.302 W/m2.K respectively. According to the prescriptive requirements of the building code, the
maximum U values for the wall and roofs of an office building located in Colombo area are 0.45 W/m2.K
and 0.4 W/m2.K respectively. Therefore this building is not met the prescriptive requirements of the
Code. OTTV of the existing building is 25 W/m2. Calculated OTTV of the building for prescriptive
requirements is 19.1 W/m2. In order to comply the building with the code the OTTV should be lesser
than 19.1 W/m2. Therefore this building is not complying with the code. More details on thermal
properties, and lay out diagrams of the construction materials and calculations are provided in section 2 of
annex 1.
Following table shows the absolute and percentage change of OTTV with annual cooling energy with
modifications.

26
Modification
Overall Thermal Transfer
Value (OTTV),
W/m2
Annual cooling energy, MWh
Specific energy consumption,
MWh/m2
Percentage reduction of OTTV, %
Percentage reduction of
annual cooling
energy, %
Existing building 25.1 428.22 0.268 N/A N/A
Introduce double layer glazing
23.0 446.72 0.279 8.37 -4.32
Introduce insulation to walls
23.4 409.34 0.256 6.77 4.41
Introduce insulation to roof
22.8 419.41 0.262 9.16 2.06
Introduce insulations to walls and roof, in order to achieve the maximum U values for facades and roofs specified in Building Code
19.1 427.99 0.267 23.9 0.05
Reduce WWR 22.7 442.55 0.277 9.56 -3.35
Reduce WWR, introduce double layer glazing for windows and introduce insulations to wall
19.1 410.59 0.257 23.75 4.12
Table 3-3: Absolute and percentage reduction of OTTV and annual cooling energy with modifications of building 2
Introduction of double layer glazing and reduction of WWR has resulted a reduction of OTTV but it has
increased the annual cooling energy. All other modifications have resulted in a reduction of annual cooling
energy requirement.
Following graph shows the variation of annual cooling energy with the OTTV.

27
Figure 3-4: Variation of the annual cooling energy with the OTTV of the building 2
A relationship could not be found between the data points. In some cases, totally different annual cooling
energies for approximately same OTTV can be observed.
3.3.3 Building 3: Air- Mech Engineering Office
Air- Mech is a 4 storey office building having approximate floor area 500m2. The building is oriented in
North-South direction. Walls of the building are made from 225mm thick burned brick and 3mm thick
single clear glasses are used for widows. A concrete slab is used as a roof.
Length of the building = 15 m
Width of the building = 10 m
Height of ground floor = 3.5 m
Slab to Slab height of 1st, 2nd and 3rd floors = 3 m
3.3.3.1. Layout diagram of the existing building 3
Below diagram shows the existing layout diagram modeled in the software using the measurements
obtained from the actual building.
405
410
415
420
425
430
435
440
445
450
15 17 19 21 23 25 27
BMICH
BMICH
Annual cooling energy, MWh
OTTV, W/m2

28
Figure 3-5: Layout diagram of the existing building 3
(Extracted from DesignBuilder)
3.3.3.2. Summary of the results of building 3
U values of the construction materials of walls, window and roof are 1.796 W/m2.K, 6.257 W/m2.K and
1.302 W/m2.K respectively. According to the prescriptive requirements of the building code, the
maximum U values for the wall and roofs of an office building located in Colombo area are 0.45 W/m2.K
and 0.4 W/m2.K respectively. Therefore this building has not met the prescriptive requirements of the
Code. OTTV of the existing building is 55 W/m2. Calculated OTTV of the building for prescriptive
requirements is 47.4 W/m2. In order to comply the building with the code the OTTV should be lesser
than 47.4 W/m2. Therefore this building is not complying with the code.
More details on thermal properties, and lay out diagrams of the construction materials and calculations are
provided in section 3 of annex 1.
Following table shows the absolute and percentage change of OTTV and annual cooling energy with
modifications.
29
Modification
Overall Thermal Transfer
Value (OTTV),
W/m2
Annual cooling energy, MWh
Specific energy consumption,
MWh/m2
Percentage reduction of OTTV, %
Percentage reduction of
annual cooling
energy, %
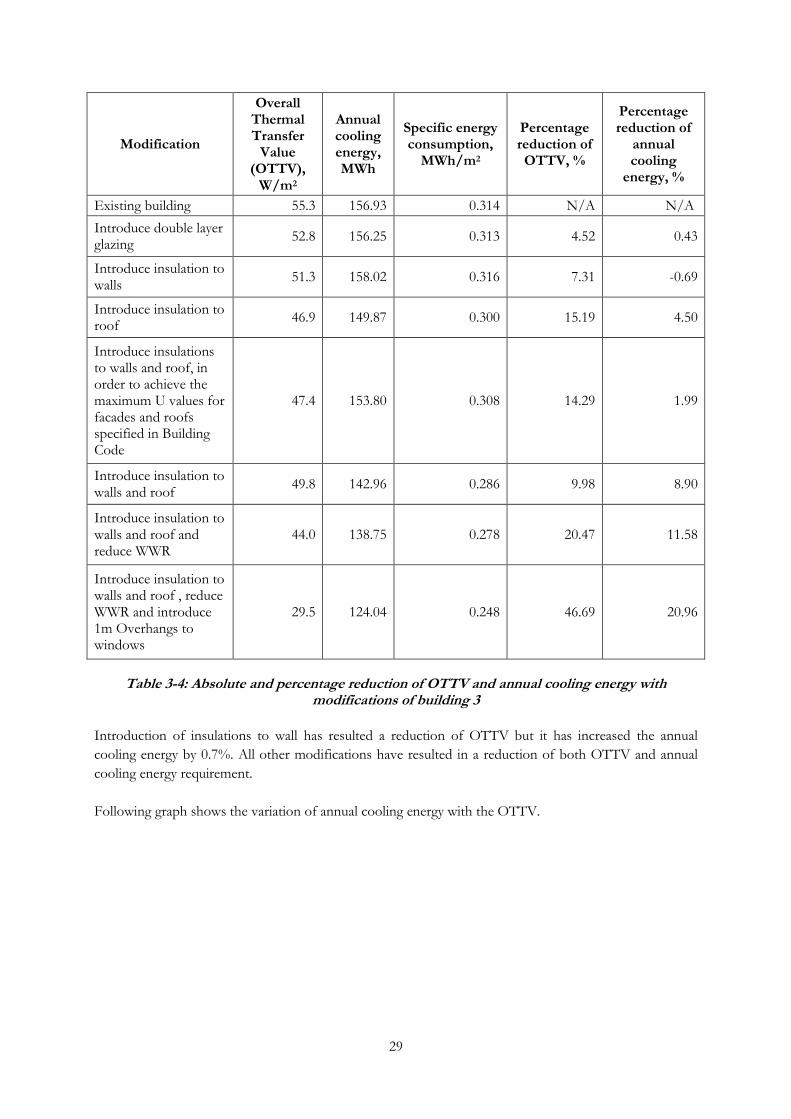
Existing building 55.3 156.93 0.314 N/A N/A
Introduce double layer glazing
52.8 156.25 0.313 4.52 0.43
Introduce insulation to walls
51.3 158.02 0.316 7.31 -0.69
Introduce insulation to roof
46.9 149.87 0.300 15.19 4.50
Introduce insulations to walls and roof, in order to achieve the maximum U values for facades and roofs specified in Building Code
47.4 153.80 0.308 14.29 1.99
Introduce insulation to walls and roof
49.8 142.96 0.286 9.98 8.90
Introduce insulation to walls and roof and reduce WWR
44.0 138.75 0.278 20.47 11.58
Introduce insulation to walls and roof , reduce WWR and introduce 1m Overhangs to windows
29.5 124.04 0.248 46.69 20.96
Table 3-4: Absolute and percentage reduction of OTTV and annual cooling energy with modifications of building 3
Introduction of insulations to wall has resulted a reduction of OTTV but it has increased the annual
cooling energy by 0.7%. All other modifications have resulted in a reduction of both OTTV and annual
cooling energy requirement.
Following graph shows the variation of annual cooling energy with the OTTV.

30
Figure 3-6: Variation of the annual cooling energy with the OTTV of the building 3
The data points can be represented by a linear graph with R2 value of 0.838.
3.3.4 Building 4: Sri Lanka Standards Institute (SLSI)
SLSI is an 8 storey office building having approximate floor area of 6100m2. Walls of the building are
made from 225mm thick burned brick and 3mm thick single clear glasses are used for widows. A concrete
slab is used as a roof. The building is shaded by the buildings and trees in all directions except south.
Building has an open court yard at the middle. This building is surrounded by shady trees and some
buildings from three sides. This factor also has been considered when calculating the OTTV values and
simulations.
3.3.4.1. Layout diagram of the existing building 4
Below diagram shows the existing layout diagram modeled in the software using the measurements
obtained from the actual building. The components blocks in blue and magenta color shows in Figures
3.4 are used to incorporate the shading effects due to adjacent buildings and external verandah
respectively.

31
Figure 3-7: Layout diagram of the existing building 4
(Extracted from DesignBuilder)
3.3.4.2. Summary of the results of building 4.
U values of the construction materials of walls, window and roof are 1.796 W/m2.K, 6.257 W/m2.K and
1.302 W/m2.K respectively. According to the prescriptive requirements of the building code, the
maximum U values for the wall and roofs of an office building located in Colombo area are 0.45 W/m2.K
and 0.4 W/m2.K respectively. Therefore this building is not met the prescriptive requirements of the
Code. OTTV of the existing building is 44 W/m2. Calculated OTTV of the building for prescriptive
requirements is 32 W/m2. In order to comply the building with the code the OTTV should be lesser than
32 W/m2. Therefore this building is not complying with the code.
More details on thermal properties, and lay out diagrams of the construction materials and calculations are
provided in section 4 of annex 1.
Following table shows the absolute and percentage change of OTTV with annual cooling energy with
modifications.
32
Modification
Overall Thermal Transfer
Value (OTTV),
W/m2
Annual cooling energy, MWh
Specific energy consumption,
MWh/m2
Percentage reduction of OTTV, %
Percentage reduction of
annual cooling
energy, %
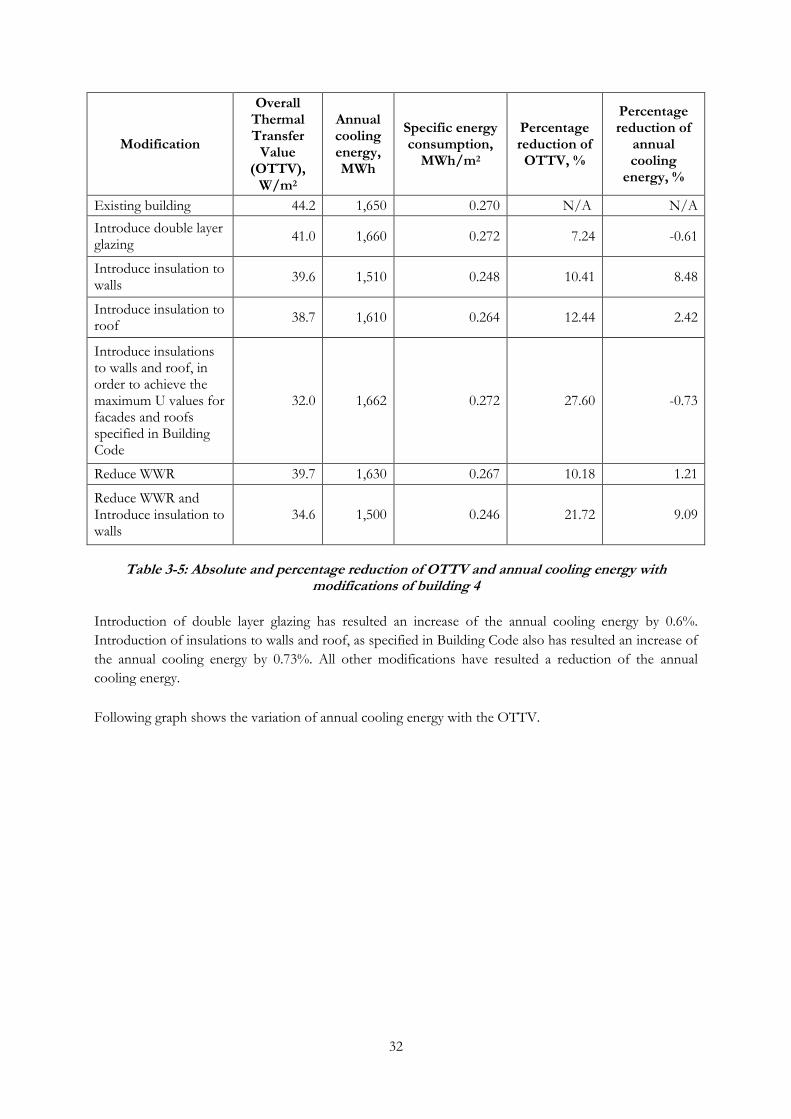
Existing building 44.2 1,650 0.270 N/A N/A
Introduce double layer glazing
41.0 1,660 0.272 7.24 -0.61
Introduce insulation to walls
39.6 1,510 0.248 10.41 8.48
Introduce insulation to roof
38.7 1,610 0.264 12.44 2.42
Introduce insulations to walls and roof, in order to achieve the maximum U values for facades and roofs specified in Building Code
32.0 1,662 0.272 27.60 -0.73
Reduce WWR 39.7 1,630 0.267 10.18 1.21
Reduce WWR and Introduce insulation to walls
34.6 1,500 0.246 21.72 9.09
Table 3-5: Absolute and percentage reduction of OTTV and annual cooling energy with modifications of building 4
Introduction of double layer glazing has resulted an increase of the annual cooling energy by 0.6%.
Introduction of insulations to walls and roof, as specified in Building Code also has resulted an increase of
the annual cooling energy by 0.73%. All other modifications have resulted a reduction of the annual
cooling energy.
Following graph shows the variation of annual cooling energy with the OTTV.

33
Figure 3-8: Variation of the annual cooling energy with the OTTV of the building 4
A clear relationship could not be found between the data points. This could have been due to extreme
data points. Therefore a further analysis was carried out by eliminating extreme data points. When the
data points (39.6, 1510) and (32.0, 1662) were removed, following graph could be obtained.
Figure 3-9: Variation of the annual cooling energy with the OTTV of the building 4 (after
removing two data points)
Above data set displays a linear relationship with R2 of 0.799.
1,480
1,500
1,520
1,540
1,560
1,580
1,600
1,620
1,640
1,660
1,680
30 35 40 45 50 55 60
SLSI
SLSI
Annual cooling energy, MWh
OTTV, W/m2
y = 16.47x + 957.0R² = 0.799
1,450
1,500
1,550
1,600
1,650
1,700
30 35 40 45
SLSI
SLSI
Linear (SLSI)
Annual cooling energy, MWh
OTTV, W/m2

34
3.3.5 Building 5: World Trade Centre (WTC)
WTC is high rise building having 37 storeys. It has twin towers. There are several offices building in this
space and floor area is around 81,500m2. The building is shaded by the buildings located in east and west
directions. Unconditioned car park is attached to the Southside wall of the ground floor. Therefore it is
assumed that there is no solar heat gains through that wall and do not consider it for OTTV calculation.
3.3.5.1. Layout diagram of the existing building 5
Below diagram shows the existing layout diagram modeled in the software using the measurements
obtained from the actual building.
Figure 3-10: Layout diagram of the existing building 5
(Extracted from DesignBuilder)
3.3.5.2. Summary of the results of building 5.
U values of the construction materials of walls, window and roof are 2.37W/m2.K, 6.121 W/m2.K and
1.302 W/m2.K respectively. According to the prescriptive requirements of the building code, the
maximum U values for the wall and roofs of an office building located in Colombo area are 0.45 W/m2.K
and 0.4 W/m2.K respectively. Therefore this building is not met the prescriptive requirements of the
Code. OTTV of the existing building is 87.6 W/m2. Calculated OTTV of the building for prescriptive
requirements is 84.4 W/m2. In order to comply the building with the code the OTTV should be lesser 50
W/m2. Therefore this building is not complying with the code. More details on thermal properties, and lay
out diagrams of the construction materials and calculations are provided in section 5 of annex 1.
In order to reduce the OTTV, following parameters were changed. Following table shows the absolute
and percentage change of OTTV with annual cooling energy for modifications done.

35
Modification
Overall Thermal Transfer
Value (OTTV),
W/m2
Annual cooling energy, MWh
Specific energy consumption,
MWh/m2
Percentage reduction of OTTV, %
Percentage reduction of
annual cooling
energy, %
Existing building 87.8 33,200 0.407 N/A N/A
Introduce double layer glazing
81.8 33,091 0.406 6.1 0.3
Introduce insulation to walls
84.8 32,962 0.404 2.9 0.7
Introduce insulation to roof
85.1 33,175 0.407 1.1 0.1
Introduce insulations to walls and roof, in order to achieve the maximum U values for facades and roofs specified in Building Code
82.8 33,107 0.406 3.7 0.3
Table 3-6: Absolute and percentage reduction of OTTV and annual cooling energy with modification of building 5
In this building all the modifications have resulted reduction of both OTTV and annual cooling energy.
Following graph shows the variation of annual cooling energy with the OTTV.
Figure 3-11: Variation of the annual cooling energy with the OTTV of the building 5

36
A clear relationship could not be found between the data points. This could have been due to extreme
data points. Therefore, a further analysis was carried out by eliminating extreme data points. When the
data points (84.8, 32962) were removed, following graph could be obtained.
Figure 3-12: Variation of the annual cooling energy with the OTTV of the building 5(after
removing two data points)
Above data set displays a linear relationship with R2 of 0.946.
y = 19.06x + 31534R² = 0.946
32,800
32,850
32,900
32,950
33,000
33,050
33,100
33,150
33,200
33,250
81.0 82.0 83.0 84.0 85.0 86.0 87.0 88.0 89.0
WTCAnnual cooling energy, MWh
OTTV, W/m2

37
4 Analysis of Results
This chapter provides a detailed analysis of the simulation results. There are 3 sections namely; analysis of
simulation results, cost benefit analysis for enhanced energy efficiency building and identification of the
optimum building models. In the cost benefit analysis the LCC was calculated using the incremental cost
of modifications to the existing building. Finally optimum building envelop models were identified based
on the cost benefit analysis.
4.1 Analysis of Simulation Results
The main objective of specifying the maximum U values and OTTV for the building envelop is to reduce
the cooling energy requirement of the building. A proportional relationship between the OTTV and the
annual cooling energy was expected. But in some cases this has not happened. Table 4.1 and Table 4.2
summarize the situations where unexpected increase of annual cooling energy with the reduction of
OTTV and observed relationship between OTTV and annual cooling energy respectively.
Building Modifications resulted in an increase of annual cooling energy
requirement with compared to existing building
Building 1 (RDA) Introduction of double layer glazing
Building 2 (BMICH) 1. Introduce insulations to walls
2. Reduction of WWR
Building 3 (Air Mech) Introduction of insulations to walls
Building 4 (SLSI) 1. Introduction of double layer glazing
2. Introduce insulations to walls and roof, in order to achieve the
maximum U values for facades and roofs specified in Building
Code
Table 4-1: Building modifications resulted to increase of annual cooling energy
It can be observed that even for the same modification, there are different behaviors in different
buildings. Which means that the required envelop properties to optimize cooling energy requirement of a
building is unique for each building.
Building Relationship between OTTV
and annual cooling energy
R2 Value
Building 1 (RDA) Second order polynomial 0.836
Building 2 (BMICH) None N/A
Building 3 (Air Mech) Linear 0.838
Building 4 (SLSI) None N/A
Building 5 (WTC) None N/A
Table 4-2: Relationship between OTTV and annual cooling energy
As per above table, only building 1(RDA) and building 3 (Airmech) shows a positive relationship between
the OTTV and cooling energy requirement. Any of the other buildings do not show any relationship.
Therefore further analysis is required to assess the other factors which have not been considered for
above analysis.
38
4.2 Cost benefit analysis for enhanced energy efficiency
building envelops applications
Ultimate objective of the Energy Efficient Building Code is to optimize the energy usage and related
energy cost. A cost benefit analysis was carried out to assess the optimum building envelop model.
Average incremental cost was calculated using market rates for each modification done. This cost is
compared against the long term cost saving due to reduction of annual cooling energy. Life Cycle Cost
was calculated for each option by assuming electricity tariff of LKR.20 and percentage cost of capital 12%
to be constant for 20 year period. The option with the minimum Life Cycle Cost (LCC) is considered as
the preferred option.
Tables 4.3 to 4.7 summarize the Life Cycle Cost calculation for each building element change. Preference
is given for the option with lesser Life Cycle Cost.

39
4.2.1 Building 1 (RDA)
Modification
OTTV, W/m2
Annual cooling energy, MWh
Incremental Cost, LKR
Annual cost for
energy, LKR
Million
Present value of 20 year energy cost, LKR
Million
Total Life
Cycle cost, LKR
Million
Preference
Existing building 47.1 87.5 N/A 0.963 7.19 7.19 6
Introduce double layer glazing
46.5 87.7 103,400 0.965 7.21 7.31 8
Introduce insulation to walls
43.8 84.4 834,328 0.928 6.93 7.77 9
Introduce insulation to roof
46.7 87.5 85,006 0.963 7.19 7.27 7
Introduce insulations to walls and roof, in order to achieve the maximum U values for facades and roofs specified in Code
12.3 84.4 1,274,146 0.928 6.93 8.21 10
Reduce WWR 46.4 87.3 -73 0.960 7.17 7.17 5
Reduce WWR and Introduce 1m Overhangs to windows
41.9 84.7 88,117 0.932 6.96 7.05 1
Reduce WWR , Introduce 1m Overhangs to windows and change the wall materials to brick
41.4 83.2 231,341 0.915 6.84 7.07 3
Reduce WWR , Introduce 1.5 m Overhangs to windows and change the wall materials to brick
41.3 82.7 274,412 0.910 6.80 7.07 4
Reduce WWR , Introduce 1.5 m Overhangs to windows and change the wall and roof materials to brick and clay tiles respectively
36.5 83.2 231,269 0.915 6.83 7.06 2
Table 4-3: LCC for different modifications of building 1
Based on the minimum LCC, Reduce WWR and introduce 1m overhangs to windows can be considered
as the preferred option for the building 1 from the options considered.

40
4.2.2 Building 2 (BMICH)
Modification OTTV, W/m2
Annual cooling energy, MWh
Incremental Cost, LKR
Annual cost for
energy, LKR
Million
Present value of 20 year energy cost, LKR
Million
Total Life
Cycle cost, LKR
Million
Preference
Existing building 25.1 428.22 N/A 4.71 35.18 35.18 1
Introduce double layer glazing
23.0 446.72 833,250 4.91 36.70 37.54 6
Introduce insulation to walls
23.4 409.34 1,989,010 4.50 33.63 35.62 2
Introduce insulation to roof
22.8 419.41 2,720,490 4.61 34.46 37.18 5
Introduce insulations to walls and roof, in order to achieve the maximum U values for facades and roofs specified in Code
19.1 427.99 3,539,181 4.71 35.16 38.70 7
Reduce WWR 22.7 442.55 -9,293 4.87 36.36 36.35 3
Reduce WWR and Introduce double layer glazing and introduce insulations to wall
19.1 410.59 2,778,900 4.52 33.73 36.51 4
Table 4-4: LCC for different modifications of building 2
Based on the minimum LCC, the existing building envelop is the preferred option for the building 2 from
the options considered.

41
4.2.3 Building 3 (Air-Mech)
Modification OTTV, W/m2
Annual cooling energy, MWh
Incremental Cost, LKR
Annual cost for
energy, LKR
Million
Present value of 20 year energy cost, LKR
Million
Total Life
Cycle cost, LKR
Million
Preference
Existing building 55.3 151.3 N/A 1.66 12.43 12.43 1
Introduce double layer glazing
52.8 151.1 448,800 1.66 12.41 12.86 2
Introduce insulation to walls
52.7 152.2 1,395,183 1.67 12.50 13.90 6
Introduce insulation to roof
52.5 151.1 592,137 1.66 12.41 13.01 3
Introduce insulations to walls and roof, in order to achieve the maximum U values for facades and roofs specified in Code
47.4 153.8 1,684,045 1.69 12.64 14.32 7
Introduce insulation to walls and roof
49.78 142.96 1,987,320 1.57 11.75 13.73 5
Introduce insulation to walls and roof and reduce WWR
43.98 138.75 2,027,607 1.53 11.40 13.43 4
Introduce insulation to walls and roof , reduce WWR and introduce 1m overhangs to windows
29.48 124.04 4,901,422 1.36 10.19 15.09 8
Table 4-5: LCC for different modifications of building 3
Based on the minimum LCC, the existing building envelop is the preferred option for the building 3 from
the options considered.

42
4.2.4 Building 4 (SLSI)
Modification OTTV, W/m2
Annual cooling energy, MWh
Incremental Cost, LKR
Annual cost for
energy, LKR
Million
Present value of 20 year energy cost, LKR
Million
Total Life Cycle cost,
LKR Million
Preference
Existing building
44.2 1,650 N/A 18.15 135.56 135.56 3
Introduce double layer glazing
41.0 1,660 3,707,000 18.26 136.38 140.09 6
Introduce insulation to walls
39.6 1,510 6,380,036 16.61 124.06 130.44 1
Introduce insulation to roof
38.7 1,610 3,886,848 17.71 132.28 136.16 4
Introduce insulations to walls and roof, in order to achieve the maximum U values for facades and roofs specified in Code
32.0 1,662 8,416,310 18.28 136.55 144.96 7
Reduce WWR 39.7 1,630 -52,346 17.93 133.92 133.92 2
Reduce WWR and Introduce insulation to walls
34.6 1,500 14,706,064 16.50 123.24 137.94 5
Table 4-6: LCC for different modifications of building 4
Based on the minimum LCC, Introduce insulation to walls is the preferred option for the building 4 from the options considered.

43
4.2.5 Building 5 (WTC)
Modification OTTV, W/m2
Annual cooling energy, MWh
Incremental Cost, LKR
Annual cost for energy,
LKR Million
Present value of 20 year energy cost, LKR
Million
Total Life Cycle cost,
LKR Million
Preference
Existing building
87.8 33,200 N/A 365.20 2,727.68 2,727.68 1
Introduce double layer glazing
81.8 33,091 20,123,707 364.00 2,718.72 2,738.85 3
Introduce insulation to walls
84.8 32,962 34,105,423 362.58 2,708.12 2,742.23 4
Introduce insulation to roof
85.1 33,175 10,587,612 364.93 2,725.62 2,736.21 2
As per maximum U values for facades and roofs specified in Building Code
82.8 33,107 38,423,984 364.18 2,720.04 2,758.46 5
Table 4-7: LCC for different modifications of building 5
Based on the minimum LCC, the existing building envelop is the preferred option for the building 3 from
the options considered.
4.3 Summary of the optimum building envelops models
Building envelops can be designed to optimize the energy performance based on the above LCC
calculation. As per the cost benefit analysis, following building envelop changes can be recommended as
most energy effective methods from the options considered, for the buildings considered.
Building Preferred Method
RDA Reduce WWR and Introduce 1m Overhangs to windows
BMICH Existing building
Air-Mech Existing building
SLSI Introduce insulation to walls
WTC Existing building
Table 4-8: Recommended modification for buildings
44
Existing buildings envelops of BMICH, Air-Mech and WTC can be recommended as the optimum
solution based on the LCC method. Reduction of WWR and introduction of 1m overhangs to windows
can be considered as the most preferred option for RDA while introduce insulation to walls can be
considered as the most preferred option for SLSI.

45
5 Discussion and Conclusion
This chapter discusses the outcomes of the study, sensitivity of the measurement, recommendations to
improvements of code of practice for energy efficient buildings.
During the study, different relationships between OTTV and cooling energy requirement of buildings
were observed. A second order polynomial distribution with R2 of 0.861 and a linear distribution with R2
of 0.838 were observed for a single storey RDA building and 3 stories Airmech building respectively.
However any specific relationship was not identified for BMICH, SLSI and WTC buildings which have 3,
8 and 37 stories respectively.
Following table shows the specific annual cooling energy requirement variation with the OTTV of the
buildings considered.
RDA BMICH Air mech SLSI WTC
OTTV, W/m2
Specific annual cooling energy,
MWh/m2
OTTV, W/m2
Specific annual cooling energy,
MWh/m2
OTTV, W/m2
Specific annual cooling energy,
MWh/m2
OTTV, W/m2
Specific annual cooling energy,
MWh/m2
OTTV, W/m2
Specific annual cooling energy,
MWh/m2
47.1 0.159 25.1 0.268 55.3 0.314 44.2 0.270 87.8 0.407
46.7 0.159 23.4 0.256 52.8 0.313 41.0 0.272 85.1 0.407
46.5 0.159 23.0 0.279 51.3 0.316 39.7 0.267 84.8 0.404
46.4 0.159 22.8 0.262 49.8 0.286 39.6 0.248 82.8 0.406
43.8 0.153 22.7 0.277 47.4 0.308 38.7 0.264 81.8 0.406
41.9 0.154 19.1 0.257 46.9 0.300 34.6 0.246 - -
41.4 0.151 19.1 0.267 44.0 0.278 32.0 0.272 - -
41.3 0.150 - - 29.5 0.248 - - - -
36.5 0.151 - - - - - - - -
12.3 0.153 - - - - - - - -
Table 5-1: Variation of OTTV and specific annual cooling energy requirement with modification for buildings
Following graph shows the specific annual cooling energy requirement variation with the OTTV of the
buildings considered.

46
Figure 5-1: Variation of specific annual energy consumption Vs OTTV for buildings
As shown in above graph, it is not possible to predict a common relationship between OTTV and specific
annual cooling energy requirement for all the buildings considered. The annual cooling energy has
increased in following instances, even though the OTTV has reduced.
1. Introduction of double layer glazing (RDA/SLSI)
2. Introduction of insulations to walls (BMICH / Airmech)
3. Reduction of WWR (BMICH)
4. Introduction of insulations to both walls and roof (SLSI)
Air-Conditioning energy requirement of a building depend on both external and internal heat gains.
External gains include solar heat gain through windows, walls, doors and roof, heat gains through
infiltration and ventilation. Internal gains include heat release by occupants in the space, lighting systems,
equipments etc. The thermal mass of the building also affect to the cooling energy. Therefore in order to
reduce cooling energy it is required to reduce all these heat gains. By introducing insulations to the
building envelop and proper shadings, the solar heat gains can be minimized. OTTV accounts major three
heat gains namely; Heat conduction through opaque section of wall and roof, Heat conduction through
fenestration and Solar heat gain through fenestration. Therefore the reduction of external heat gains via
increasing the insulations cause reduction of OTTV.
In case where the external temperature is lower than the internal temperature (ex: during night
hours/rainy days) there will be a heat outflow which will effectively reduce the cooling energy. When the
insulation is increased, this heat outflow also will be minimized and will result in increased cooling energy
requirement. This phenomenon is the reason for the increased cooling energy requirement even when the
OTTV is reduced in above instances.

47
The accuracy of the results depends on accuracy of assumptions made, weather details, thermal properties
of building construction materials and simulation software. Following are some potential reasons
identified for any deviation from the actual results.
1. In order to maintain the similar indoor conditions for all buildings, it was assumed the same
parameters for all buildings such as occupancy density, occupancy pattern, metabolic rate,
clothing, cooling set point temperature, fresh air requirement, luminance level, lighting density,
infiltration, heat dissipation, elevation as mentioned in table 3.1. The annual cooling energy was
calculated based on these values. But the actual situation of the building might have been
different. The actual occupancy density and patterns, clothing levels, lighting requirement etc
might vary from one building to another. Therefore the actual cooling energy requirement may
not equal to the simulated value. Any error in these assumptions might have caused errors in
annual energy calculation.
2. In order to incorporate the shading effect of the buildings and vegetations, and the effect of
attached unconditioned spaces such as warehouses, car parks component blocks were used in
simulation. There may be slight difference between the simulated results and the actual results.
3. The thermal properties of construction materials were obtained from the “DesignBuilder”
software since the exact values of the materials used in Sri Lanka are not available. If the
properties of the actual materials are different, there can be errors in the OTTV as well as annual
cooling energy.
4. The simulation was carried out using the “DesignBuilder” software. The simulation software
may not be able to simulate precisely the equipment behaviors, building shapes and conditions
that exist in the building. If there is any modeling/software error, this might cause errors in the
annual cooling energy.
The impact on cooling energy requirement from envelop parameter modification is unique for each
building. In some instances the reduction of OTTV has not resulted in any reduction of the cooling
energy requirement. There is a combined effect from each building component which affects the final
energy requirement. A simulation based technique is recommended to be used to find the optimum
building envelop design to minimize the annual cooling energy requirement. And also it is recommended
to carry out a cost benefit analysis for the possible designs in order to find the most cost effective design.
This study was carried out only for 5 commercial buildings representing low rise to high rise located in a
warm humid climate. These buildings had drastically different envelop parameters. In this study OTTV
reductions of buildings were achieved by introducing insulations to the envelop elements, changing WWR,
introducing external shadings of the building for OTTV reductions. The accuracy of the derivations can
be increased by observing a fairly large number of buildings incorporating more modifications using the
software.
Within the limited time period, this study was carried out to find the behavior of annual cooling energy
requirement with the reduction of OTTV. The OTTV of the existing building was considered as the
maximum value. Further studies need to be carried out to identify the variation of energy performance
with the increase of OTTV.

48
The thermal properties of the construction materials were obtained from the DesignBuilder software for
the OTTV calculation. The exact properties of the building material used in Sri Lanka were not available.
A proper research need to be carried out to identify the material properties precisely.
Based on the results, following improvements can be suggested for further improvements of the building
code.
1. Any of the building considered did not comply with the prescriptive values of the code. U values
of the wall and roof materials were above the maximum value specified. Cumulative OTTV of all
buildings were above the corresponding OTTV estimated using prescriptive values. And also
there are huge incremental costs involved to achieve these requirements. But the benefit is much
lower or negligible. OTTV of the RDA, BMICH, Air-Mech, SLSI and WTC buildings were 47.1
W/m2, 25.1 W/m2, 55.3 W/m2, 44.2 W/m2 and 87.8 W/m2 respectively. Only 3 buildings RDA,
BMICH and SLSI were under the threshold value of 50 W/m2. It is recommended to revise these
maximum values in reviews.
2. Standard U value tables of the construction materials are not available in the present code. It is
suggested to include these tables, and then the building designers can select appropriate materials
and thickness.
3. A detailed guide line to be provided as a supplement to the existing building code, providing
following information.
a). Passive building technologies such as roof top gardens, Wet walls, ponds, natural ventilation
and lighting. Details shall be provided as applicable for different climate zones.
b). Calculation methodology of OTTV considering building attachments (garage, Verandah,
corridor) to the main building.
4. Only the shading effects from projections are considered for the OTTV calculations. The
shadings provided by the vegetations, nearby buildings are not captured in the current OTTV
formula. If these can be captured, the values denoted by OTTV will be more accurate.
5. A simulation based analysis to be recommended in the building code in order to assess the
optimum building envelope parameters.
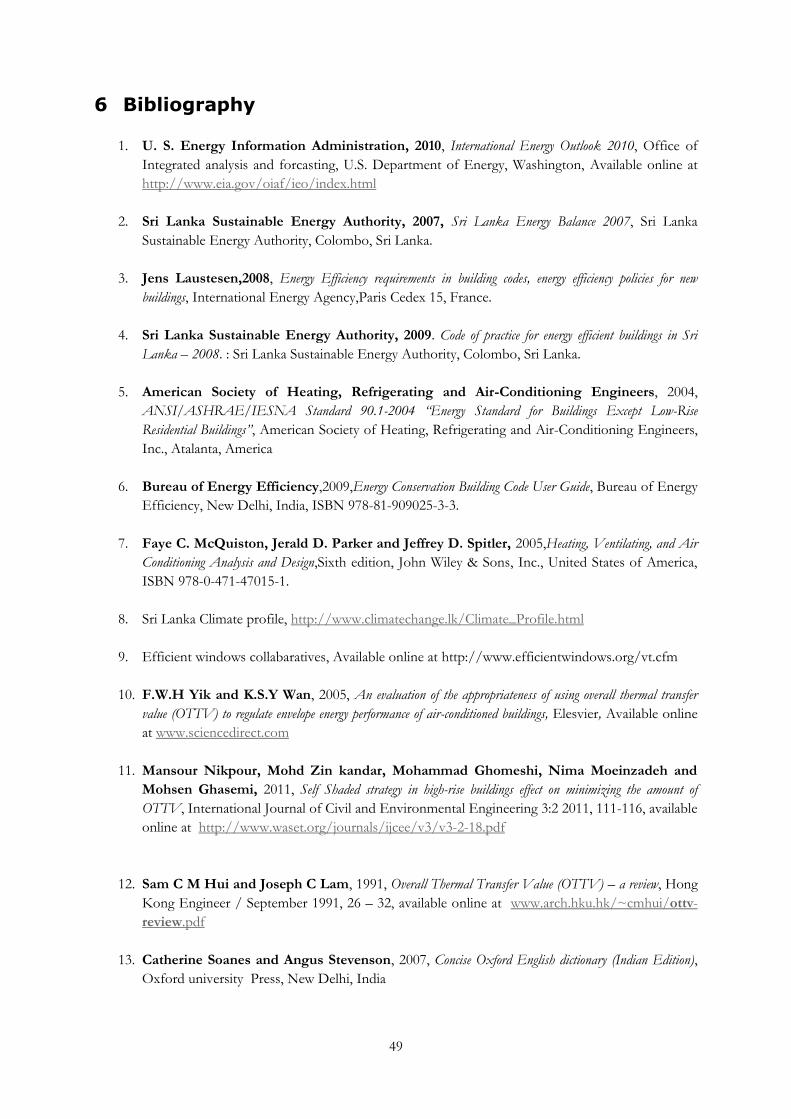
49
6 Bibliography
1. U. S. Energy Information Administration, 2010, International Energy Outlook 2010, Office of
Integrated analysis and forcasting, U.S. Department of Energy, Washington, Available online at
http://www.eia.gov/oiaf/ieo/index.html
2. Sri Lanka Sustainable Energy Authority, 2007, Sri Lanka Energy Balance 2007, Sri Lanka
Sustainable Energy Authority, Colombo, Sri Lanka.
3. Jens Laustesen,2008, Energy Efficiency requirements in building codes, energy efficiency policies for new
buildings, International Energy Agency,Paris Cedex 15, France.
4. Sri Lanka Sustainable Energy Authority, 2009. Code of practice for energy efficient buildings in Sri
Lanka – 2008. : Sri Lanka Sustainable Energy Authority, Colombo, Sri Lanka.
5. American Society of Heating, Refrigerating and Air-Conditioning Engineers, 2004,
ANSI/ASHRAE/IESNA Standard 90.1-2004 “Energy Standard for Buildings Except Low-Rise
Residential Buildings”, American Society of Heating, Refrigerating and Air-Conditioning Engineers,
Inc., Atalanta, America
6. Bureau of Energy Efficiency,2009,Energy Conservation Building Code User Guide, Bureau of Energy
Efficiency, New Delhi, India, ISBN 978-81-909025-3-3.
7. Faye C. McQuiston, Jerald D. Parker and Jeffrey D. Spitler, 2005,Heating, Ventilating, and Air
Conditioning Analysis and Design,Sixth edition, John Wiley & Sons, Inc., United States of America,
ISBN 978-0-471-47015-1.
8. Sri Lanka Climate profile, http://www.climatechange.lk/Climate_Profile.html
9. Efficient windows collabaratives, Available online at http://www.efficientwindows.org/vt.cfm
10. F.W.H Yik and K.S.Y Wan, 2005, An evaluation of the appropriateness of using overall thermal transfer
value (OTTV) to regulate envelope energy performance of air-conditioned buildings, Elesvier, Available online
at www.sciencedirect.com
11. Mansour Nikpour, Mohd Zin kandar, Mohammad Ghomeshi, Nima Moeinzadeh and
Mohsen Ghasemi, 2011, Self Shaded strategy in high-rise buildings effect on minimizing the amount of
OTTV, International Journal of Civil and Environmental Engineering 3:2 2011, 111-116, available
online at http://www.waset.org/journals/ijcee/v3/v3-2-18.pdf
12. Sam C M Hui and Joseph C Lam, 1991, Overall Thermal Transfer Value (OTTV) – a review, Hong
Kong Engineer / September 1991, 26 – 32, available online at www.arch.hku.hk/~cmhui/ottv-
review.pdf
13. Catherine Soanes and Angus Stevenson, 2007, Concise Oxford English dictionary (Indian Edition),
Oxford university Press, New Delhi, India

50
14. W.R. Chan, P.N. Price, A.J. Gadgil, Sheltering in Buildings from Large-Scale Outdoor Releases, Air
Infiltration and Ventilation Centre Ventilation Information Paper, LBNL-55575
15. Faye C.McQuiston, Jerald D.Parker and Jeffrey D. Spitler, 2005, Heating, Ventilating, and air
Conditioning analysis and design, John Wiley & Sons, Inc., America.
16. Ministry of Non Conventional Energy Sources, 2002, Energy Efficient building in India, Tata
Energy Recourse Institute, India.
17. Public Utilities commission of Sri Lanka, 2011, Electricity tariff 2011, available on line at
http://www.pucsl.gov.lk/download/Electricity/Tariffs%20Extention-English-2011.pdf, accessed
on

51
ANNEXURE 1: Calculation of OTTV and annual cooling
energy of buildings
1. Building 1: Project Office of Greater Colombo Urban
Transport Development Project (OCH) Southern Section from
Kaduwela to Kottawa, Road Development Authority (RDA),
Udumulla Road, Battaramulla
1.1. OTTV and annual cooling energy for existing building
1.1.1 U values of elements of the existing building
U values for each building component were calculated using the properties of the existing buildings’
construction material for each element. Following table shows the conductivity, specific heat, density and
thickness of the each layer of the wall construction and U value of the wall.
Wall materials Conductivity,
W/m.K
Specific Heat,
J/kg.K
Density,
kg/m3
Thickness,
mm
Gypsum plastering 0.8 840 1300 2
Cement plaster, Sand aggregate 0.72 840 1860 10
Masonry block 0.85 840 1650 102
Cement plaster, Sand aggregate 0.72 840 1860 10
Gypsum plastering 0.8 840 1300 2
Uw , W/m2.K 3.098
Table 01: Properties of construction materials and U value of the wall of existing building 1
(Adapted from DesignBuilder)
Following Figure shows a cross section of a wall of existing building.
Figure 01: Cross section of the wall of existing building 1 (Adapted from DesignBuilder)

52
Single layer, 3mm thick glass are used for the windows and following table shows the conductivity and U
value of the glass.
Material Conductivity, W/m.K Thickness, mm
Single clear glass 0.9 3
Uf, W/m2.K 6.257
Table 02: Properties and U value of existing window construction materials of the building 1
(Adapted from DesignBuilder)
The roofing material and properties are shown in below;
Material Conductivity,
W/m.K
Specific Heat,
J/kg.K
Density,
kg/m3
Thickness,
mm
Galvanized steel sheet 50 450 7800 2
U, W/m2.K 7.141
Table 03: Properties and U value of roof construction materials of the existing building 1 (Adapted
from DesignBuilder)
The floor construction material and properties are shown in below;
Conductivity,
W/m.K
Specific Heat,
J/kg.K Density, kg/m3 Thickness, mm
Floor/ Roof Screed 0.41 840 1200 70
Cast Concrete 1.13 1000 2000 100
U, W/m2.K 7.141
Table 04: Properties and U value of floor construction materials of the existing building 1 (Adapted
from DesignBuilder)
Following Figure shows a cross section of a floor of existing building.
Figure 02: Cross section of the floor of building 1 (Adapted from DesignBuilder)

53
1.1.2. Calculation of Window to Wall Ratio (WWR)
Following Figure shows the layout diagram of the building. It has numbered the wall faces as indicate in
the Figure for OTTV calculation. WWR of faces were calculated based on measured data.
Figure 03: Layout diagram of building 1 (Adapted from DesignBuilder)
There are no windows in wall 1 and 3.
WWR of face 2
Window area
= (1.95*1.2*8) + (2*0.5*0.5)
= 19.22 m2
Wall area
= 38 * 3
= 114 m2
WWR
= 0.17
WWR of face 4
Window area
= (6*1.95*1.2) + (3*1.2*1.2)
= 18.36 m2
Wall area
= 38 * 3
= 114 m2
WWR
= 0.16
1.1.3. Calculation of Shading Coefficient of windows
There are no external shadings in the existing building.
N

54
1.1.4. Calculation of OTTV
The OTTV for the existing building was calculated using above U values. Below table shows the
calculation of OTTVs for each building component and overall building.
Wall Face/Roof Area ∆Teq α WWR Uw ∆T Uf SF SC CF OTTVi Ai*OTTVi
1 36 19.3 0.3 0.00 3.098 3.6 6.257 186 1 0.95 18 646
2 114 19.3 0.3 0.17 3.098 3.6 6.257 186 1 0.9 47 5378
3 36 19.3 0.3 0.00 3.098 3.6 6.257 186 1 0.79 18 646
4 114 19.3 0.3 0.16 3.098 3.6 6.257 186 1 1.34 59 6675
Roof 549 7.9 0.86 0.00 7.141
49 26647
OTTV 47
Table 05: OTTV of the existing building 1
1.1.5. Annual Cooling energy
By simulating the building with above parameters in the DesignBuilder software the annual cooling energy
of the building was found.
Annual cooling energy = 87.5 MWh
1.2. OTTV and annual cooling energy for modified building:
Introduce double layer glazing for windows
1.2.1 U values of the window glazing
Double layer, 3mm thick glasses and air layer are used for the windows and following table shows the
conductivity and U value of the glass.
Material Conductivity, W/m.K Thickness, mm
Single Clear Glass 0.9 3
Air - 13
Single Clear Glass 0.9 3
Uf, W/m2.K 2.761
Table 06: Properties and U value of double layer window construction materials of the building 1
(Adapted from DesignBuilder)
1.2.2. Calculation of OTTV
Following table shows the OTTV of the modified building.

55
Wall
Face/Roof Area ∆Teq α WWR Uw ∆T Uf SF SC CF OTTVi Ai*OTTVi
1 36 19.3 0.3 0.00 3.098 3.6 2.761 186 1 0.95 17.94 645.75
2 114 19.3 0.3 0.17 3.098 3.6 2.761 186 1 0.9 45.04 5134.08
3 36 19.3 0.3 0.00 3.098 3.6 2.761 186 1 0.79 17.94 645.75
4 114 19.3 0.3 0.16 3.098 3.6 2.761 186 1 1.34 56.54 6445.12
Roof 549 7.9 0.86 0.00 7.141 48.52 26646.90
OTTV 46.53
Table 07: OTTV of the modified building 1
1.2.3. Annual cooling energy
By simulating the building with above parameters in the DesignBuilder software the annual cooling energy
of the building was found.
Annual cooling energy = 87.7 MWh
1.3. OTTV and annual cooling energy for modified building:
Introduce wall with insulation
1.3.1. U values of the wall material
Wall thicknesses were increased and insulations were introduced to walls to reduce the OTTV. Following
table and Figure shows the properties of the modified wall.
Wall materials Conductivity,
W/m.K
Specific Heat,
J/kg.K
Density,
kg/m3
Thickness,
mm
Gypsum plastering 0.8 840 1300 16
Brick, burned 0.85 840 1500 112
EPS Expanded Polystyrene 0.72 840 1860 15
Brick, burned 0.85 840 1500 112
Gypsum plastering 0.8 840 1300 16
Uw , W/m2.K 1.251
Table 08: Properties and U value of modified wall of the building 1(Adapted from DesignBuilder)
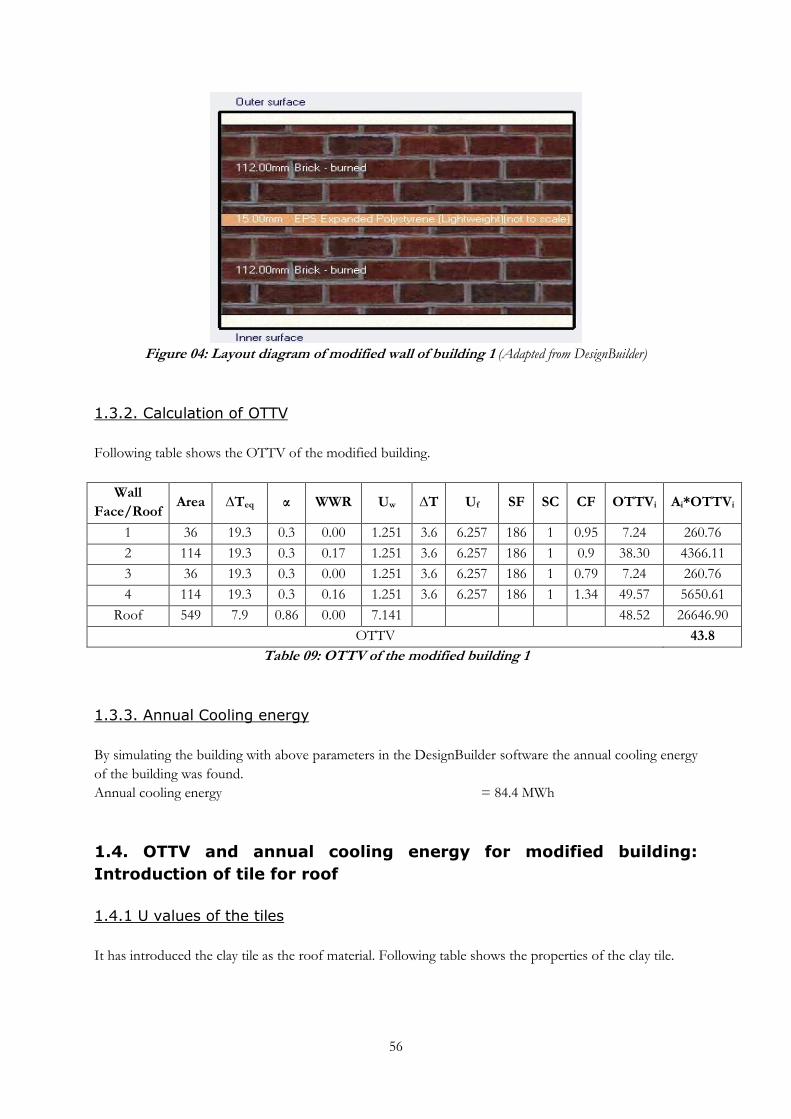
56
Figure 04: Layout diagram of modified wall of building 1 (Adapted from DesignBuilder)
1.3.2. Calculation of OTTV
Following table shows the OTTV of the modified building.
Wall
Face/Roof Area ∆Teq α WWR Uw ∆T Uf SF SC CF OTTVi Ai*OTTVi
1 36 19.3 0.3 0.00 1.251 3.6 6.257 186 1 0.95 7.24 260.76
2 114 19.3 0.3 0.17 1.251 3.6 6.257 186 1 0.9 38.30 4366.11
3 36 19.3 0.3 0.00 1.251 3.6 6.257 186 1 0.79 7.24 260.76
4 114 19.3 0.3 0.16 1.251 3.6 6.257 186 1 1.34 49.57 5650.61
Roof 549 7.9 0.86 0.00 7.141 48.52 26646.90
OTTV 43.8
Table 09: OTTV of the modified building 1
1.3.3. Annual Cooling energy
By simulating the building with above parameters in the DesignBuilder software the annual cooling energy
of the building was found.
Annual cooling energy = 84.4 MWh
1.4. OTTV and annual cooling energy for modified building:
Introduction of tile for roof
1.4.1 U values of the tiles
It has introduced the clay tile as the roof material. Following table shows the properties of the clay tile.
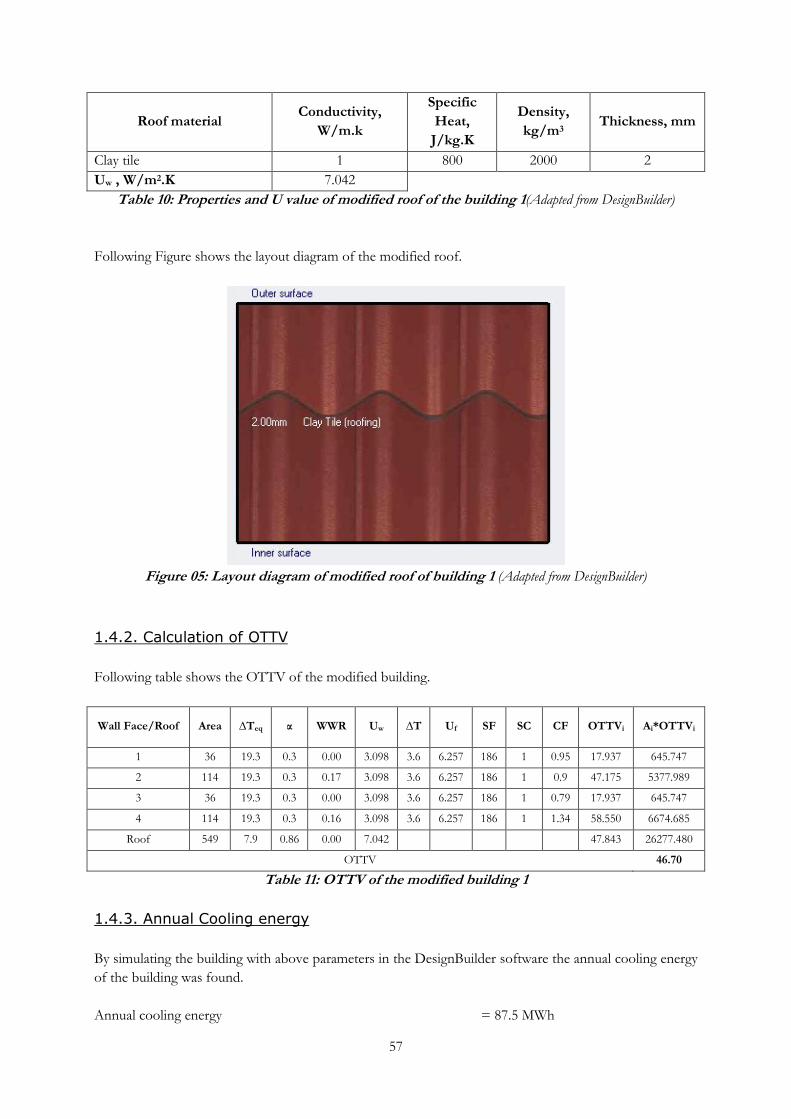
57
Roof material Conductivity,
W/m.k
Specific
Heat,
J/kg.K
Density,
kg/m3 Thickness, mm
Clay tile 1 800 2000 2
Uw , W/m2.K 7.042
Table 10: Properties and U value of modified roof of the building 1(Adapted from DesignBuilder)
Following Figure shows the layout diagram of the modified roof.
Figure 05: Layout diagram of modified roof of building 1 (Adapted from DesignBuilder)
1.4.2. Calculation of OTTV
Following table shows the OTTV of the modified building.
Wall Face/Roof Area ∆Teq α WWR Uw ∆T Uf SF SC CF OTTVi Ai*OTTVi
1 36 19.3 0.3 0.00 3.098 3.6 6.257 186 1 0.95 17.937 645.747
2 114 19.3 0.3 0.17 3.098 3.6 6.257 186 1 0.9 47.175 5377.989
3 36 19.3 0.3 0.00 3.098 3.6 6.257 186 1 0.79 17.937 645.747
4 114 19.3 0.3 0.16 3.098 3.6 6.257 186 1 1.34 58.550 6674.685
Roof 549 7.9 0.86 0.00 7.042 47.843 26277.480
OTTV 46.70
Table 11: OTTV of the modified building 1
1.4.3. Annual Cooling energy
By simulating the building with above parameters in the DesignBuilder software the annual cooling energy
of the building was found.
Annual cooling energy = 87.5 MWh

58
1.5. OTTV and annual cooling energy for modified building:
Introduce insulations to walls and roof, in order to achieve the
maximum U values for facades and roofs specified in Building Code
1.5.1 U values of the wall and roof materials
Insulation layer was introduced to building wall to achieve the maximum U value specified in the code.
Following table shows the conductivity, specific heat, density, thickness and U value of the modified wall.
Wall materials Conductivity,
W/m.K
Specific Heat,
J/kg.K
Density,
kg/m3
Thickness,
mm
Brick Work 0.84 800 1700 100
XPS Extruded polystyrene –
CO2 blowing 0.034 1400 35 58
Concrete Block 0.51 1000 1400 100
Gypsum plastering 0.4 1000 1000 13
Uw, W/m2.K 0.45
Table 12: Properties and U value of modified wall construction of the building 1 (Adapted from
DesignBuilder)
Following Figure shows a cross section of a modified wall.
Figure 06: Cross section of the modified wall of building 1(Adapted from DesignBuilder)
Clay tile was introduced to building roof. Following table shows the conductivity, specific heat, density,
thickness and U value of the modified roof.
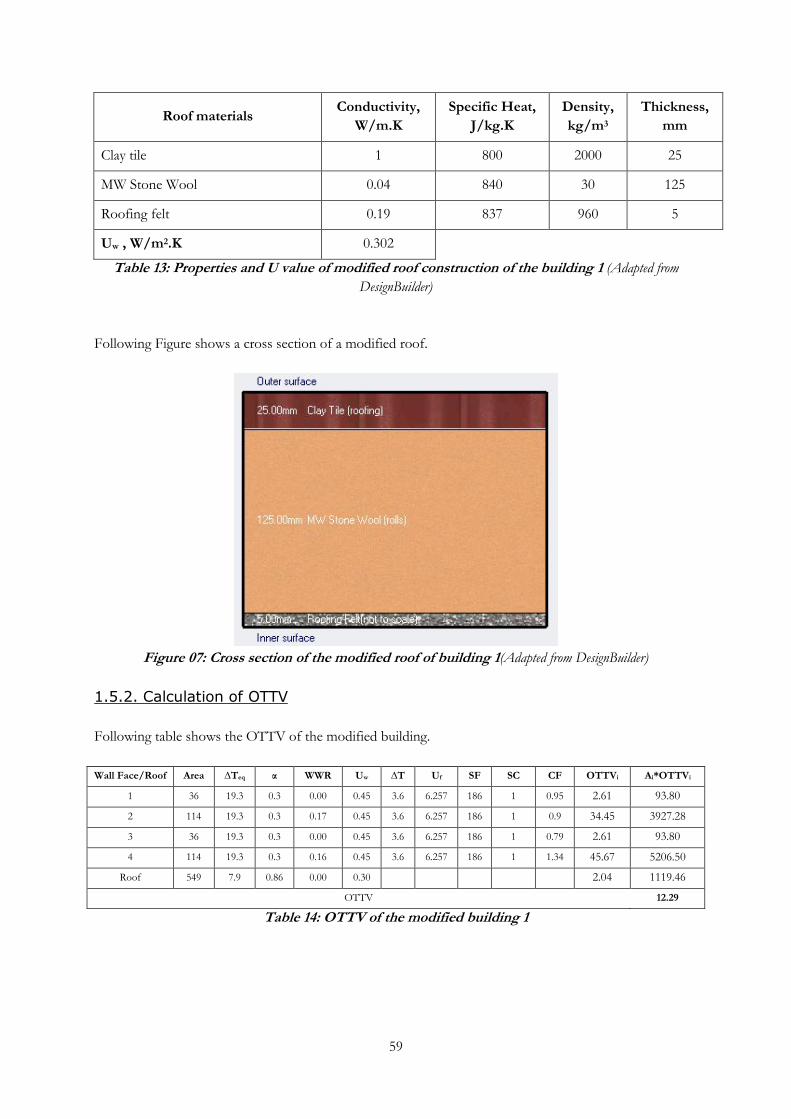
59
Roof materials Conductivity,
W/m.K
Specific Heat,
J/kg.K
Density,
kg/m3
Thickness,
mm
Clay tile 1 800 2000 25
MW Stone Wool 0.04 840 30 125
Roofing felt 0.19 837 960 5
Uw , W/m2.K 0.302
Table 13: Properties and U value of modified roof construction of the building 1 (Adapted from
DesignBuilder)
Following Figure shows a cross section of a modified roof.
Figure 07: Cross section of the modified roof of building 1(Adapted from DesignBuilder)
1.5.2. Calculation of OTTV
Following table shows the OTTV of the modified building.
Wall Face/Roof Area ∆Teq α WWR Uw ∆T Uf SF SC CF OTTVi Ai*OTTVi
1 36 19.3 0.3 0.00 0.45 3.6 6.257 186 1 0.95 2.61 93.80
2 114 19.3 0.3 0.17 0.45 3.6 6.257 186 1 0.9 34.45 3927.28
3 36 19.3 0.3 0.00 0.45 3.6 6.257 186 1 0.79 2.61 93.80
4 114 19.3 0.3 0.16 0.45 3.6 6.257 186 1 1.34 45.67 5206.50
Roof 549 7.9 0.86 0.00 0.30 2.04 1119.46
OTTV 12.29
Table 14: OTTV of the modified building 1

60
1.5.3. Annual Cooling energy
By simulating the building with above parameters in the DesignBuilder software the annual cooling energy
of the building was found.
Annual cooling energy = 84.4 MWh
1.6. OTTV and annual cooling energy for modified building:
Reduction of WWR
1.6.1 U values of the construction materials
U values of the construction materials are same as section 1.1.1.
1.6.2. Calculation of OTTV
While WWR of the East and West facades were reduced, North and south facades were increased.
Following table shows the OTTV of the modified building.
Wall Face/Roof Area ∆Teq α WWR Uw ∆T Uf SF SC CF OTTVi Ai*OTTVi
1 36 19.3 0.3 0.07 3.098 3.6 6.257 186 1 0.95 29.721 1069.961
2 114 19.3 0.3 0.15 3.098 3.6 6.257 186 1 0.9 43.027 4905.023
3 36 19.3 0.3 0.01 3.098 3.6 6.257 186 1 0.79 18.990 683.629
4 114 19.3 0.3 0.14 3.098 3.6 6.257 186 1 1.34 53.607 6111.187
Roof 549.24 7.9 0.86 0.000 7.141 48.516 26646.903
OTTV 46.4
Table 15: OTTV of the modified building 1
1.6.3. Annual Cooling energy
By simulating the building with above parameters in the DesignBuilder software the annual cooling energy
of the building was found.
Annual cooling energy = 87.3 MWh
1.7. OTTV and annual cooling energy for modified building:
Reduction of WWR and Introduction of 1m overhang to windows
1.7.1 U values of the construction materials
U values of the construction materials are same as section 1.1.1.
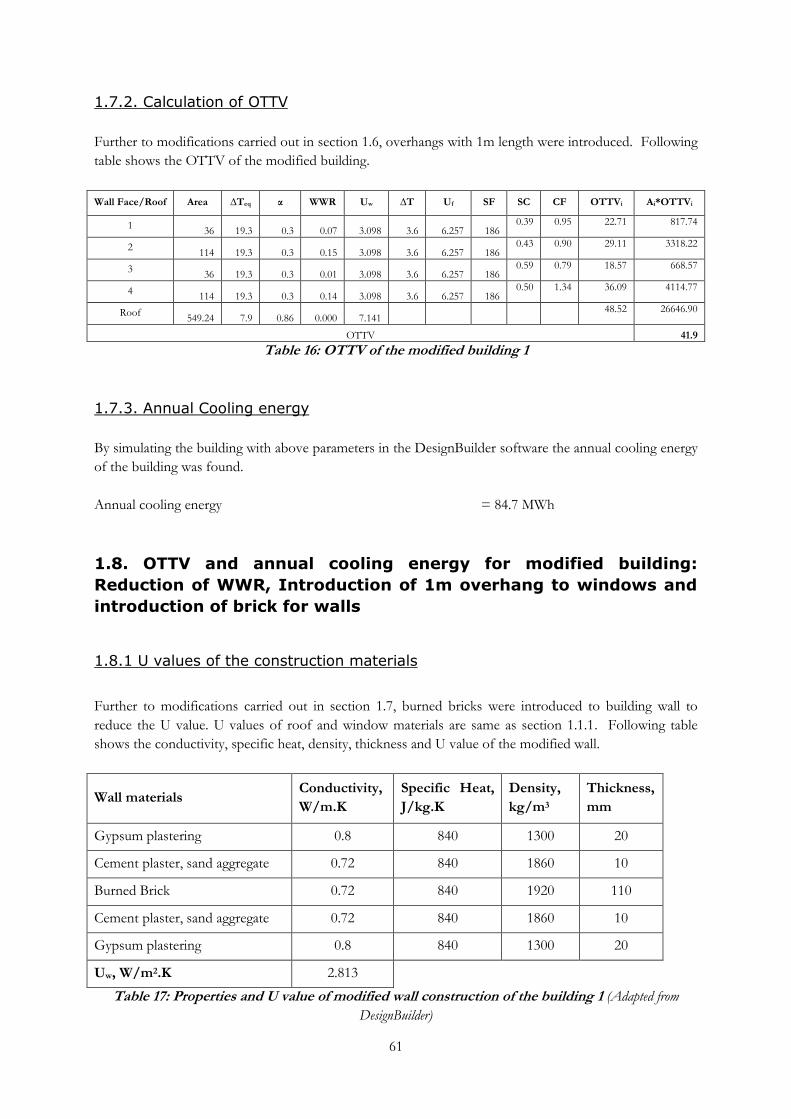
61
1.7.2. Calculation of OTTV
Further to modifications carried out in section 1.6, overhangs with 1m length were introduced. Following
table shows the OTTV of the modified building.
Wall Face/Roof Area ∆Teq α WWR Uw ∆T Uf SF SC CF OTTVi Ai*OTTVi
1 36 19.3 0.3 0.07 3.098 3.6 6.257 186
0.39 0.95 22.71 817.74
2 114 19.3 0.3 0.15 3.098 3.6 6.257 186
0.43 0.90 29.11 3318.22
3 36 19.3 0.3 0.01 3.098 3.6 6.257 186
0.59 0.79 18.57 668.57
4 114 19.3 0.3 0.14 3.098 3.6 6.257 186
0.50 1.34 36.09 4114.77
Roof 549.24 7.9 0.86 0.000 7.141
48.52 26646.90
OTTV 41.9
Table 16: OTTV of the modified building 1
1.7.3. Annual Cooling energy
By simulating the building with above parameters in the DesignBuilder software the annual cooling energy
of the building was found.
Annual cooling energy = 84.7 MWh
1.8. OTTV and annual cooling energy for modified building:
Reduction of WWR, Introduction of 1m overhang to windows and
introduction of brick for walls
1.8.1 U values of the construction materials
Further to modifications carried out in section 1.7, burned bricks were introduced to building wall to
reduce the U value. U values of roof and window materials are same as section 1.1.1. Following table
shows the conductivity, specific heat, density, thickness and U value of the modified wall.
Wall materials Conductivity,
W/m.K
Specific Heat,
J/kg.K
Density,
kg/m3
Thickness,
mm
Gypsum plastering 0.8 840 1300 20
Cement plaster, sand aggregate 0.72 840 1860 10
Burned Brick 0.72 840 1920 110
Cement plaster, sand aggregate 0.72 840 1860 10
Gypsum plastering 0.8 840 1300 20
Uw, W/m2.K 2.813
Table 17: Properties and U value of modified wall construction of the building 1 (Adapted from
DesignBuilder)

62
Following Figure shows a cross section of a modified wall.
Figure 08: Cross section of the modified wall of building 1(Adapted from DesignBuilder)
1.8.2. Calculation of OTTV
Following table shows the OTTV of the modified building.
Wall Face/Roof Area ∆Teq α WWR Uw ∆T Uf SF SC CF OTTVi Ai*OTTVi
1 36 19.3 0.3 0.07 2.813 3.6 6.257 186
0.39 0.95 21.17 762.19
2 114 19.3 0.3 0.15 2.813 3.6 6.257 186
0.43 0.9 27.70 3157.55
3 36 19.3 0.3 0.01 2.813 3.6 6.257 186
0.59 0.79 16.93 609.57
4 114 19.3 0.3 0.14 2.813 3.6 6.257 186
0.5 1.34 34.68 3953.09
Roof 549.24 7.9 0.86 0.000 7.141
48.52 26646.90
OTTV 41.4
Table 18: OTTV of the modified building 1
1.8.3. Annual Cooling energy
By simulating the building with above parameters in the DesignBuilder software the annual cooling energy
of the building was found.
Annual cooling energy = 83.2 MWh

63
1.9. OTTV and annual cooling energy for modified building:
Reduction of WWR, Introduction of burned brick for wall and
Introduction of 1.5m overhang to windows
1.9.1 U values of the construction materials
U values of the construction materials are same as section 1.8.1.
1.9.2. Calculation of OTTV
Further to modifications carried out in section 1.8, length of overhangs was lengthening to 1.5m.
Following table shows the OTTV of the modified building.
Wall Face/Roof Area ∆Teq α WWR Uw ∆T Uf SF SC CF OTTVi Ai*OTTVi
1 36 19.3 0.3 0.07 3.098 3.6 6.257 186
0.37 0.95 20.94 753.93
2 114 19.3 0.3 0.15 3.098 3.6 6.257 186
0.36 0.90 25.87 2948.76
3 36 19.3 0.3 0.01 3.098 3.6 6.257 186
0.37 0.79 16.70 601.31
4 114 19.3 0.3 0.14 3.098 3.6 6.257 186
0.54 1.34 35.90 4092.84
Roof 549.24 7.9 0.86 0.000 7.141
48.52 26646.90
OTTV 41.3
Table 19: OTTV of the modified building 1
1.9.3. Annual Cooling energy
By simulating the building with above parameters in the DesignBuilder software the annual cooling energy
of the building was found.
Annual cooling energy = 82.7 MWh
1.10. OTTV and annual cooling energy for modified building:
Reduction of WWR, Introduction of burned brick for wall and
Introduction of 1.5m overhang to windows
1.10.1 U values of the construction materials
Further to modifications carried out in section 1.9, clay tiles were introduced for roof. U values of the
construction materials are same as section 1.9.1 except roofing materials. Following table shows the
conductivity, specific heat, density, thickness and U value of the modified roof.

64
Roof materials Conductivity,
W/m.K
Specific Heat,
J/kg.K
Density,
kg/m3
Thickness,
mm
Clay tile 1 800 2000 25
Uw , W/m2.K 6.061
Table 20: Properties and U value of modified roof construction of the building 1 (Adapted from
DesignBuilder)
Figure 09: Cross section of the modified roof of building 1(Adapted from DesignBuilder)
1.10.2. Calculation of OTTV
Following table shows the OTTV of the modified building.
Wall Face/Roof Area ∆Teq α WWR Uw ∆T Uf SF SC CF OTTVi Ai*OTTVi
1 36 19.3 0.3 0.07 3.098 3.6 6.257 186 0.37 0.95 20.94 753.93
2 114 19.3 0.3 0.15 3.098 3.6 6.257 186 0.36 0.90 25.87 2948.76
3 36 19.3 0.3 0.01 3.098 3.6 6.257 186 0.37 0.79 16.70 601.31
4 114 19.3 0.3 0.14 3.098 3.6 6.257 186 0.54 1.34 35.90 4092.84
Roof 549.24 7.9 0.86 0.00 6.061 41.18 22616.84
OTTV 36.5
Table 20: OTTV of the modified building 1
1.10.3. Annual Cooling energy
By simulating the building with above parameters in the DesignBuilder software the annual cooling energy
of the building was found.
Annual cooling energy = 83.2 MWh

65
2. Building 2: Wing 4 G of Bandaranayke Memorial
International Conference Hall (BMICH)
2.1. OTTV and annual cooling energy for existing building
2.1.1 U values of the building construction materials
U values for each building component were calculated using the properties of the existing buildings’
construction material for each element. Following table shows the conductivity, specific heat, density and
thickness of the each layer of the wall construction and U value of the wall.
Wall materials Conductivity,
W/m.K
Specific Heat,
J/kg.K
Density,
kg/m3
Thickness,
mm
Gypsum plastering 0.8 840 1300 2
Cement plaster, Sand aggregate 0.72 840 1860 25
Brick 0.72 840 1650 225
Cement plaster, Sand aggregate 0.72 840 1860 25
Gypsum plastering 0.8 840 1300 2
Uw , W/m2.K 1.796
Table 21: Properties of Existing Construction Materials and U value of the wall of building 2
(Adapted from DesignBuilder)
Following Figure shows a cross section of a wall of existing building.
Figure 10: Cross section of the wall of building 2 (Adapted from DesignBuilder)
Single layer, 3mm thick glass are used for the windows and following table shows the conductivity and U
value of the glass.

66
Material Conductivity, W/m.K Thickness, mm
Single Clear Glass 0.9 3
Uf, W/m2.K 6.257
Table 22: Properties and U value of existing window construction materials of the building 2
(Adapted from DesignBuilder)
The roofing material and properties are shown in below;
Material Conductivity,
W/m.K
Specific Heat,
J/kg.K
Density,
kg/m3
Thickness,
mm
Asphalt 0.7 1000 2100 2
Concrete , cast-roofing slab
,aerate 0.16 840 500 100
U, W/m2.K 1.302
Table 23: Properties and U value of existing roof construction materials of the building 2 (Adapted
from DesignBuilder)
Following Figure shows a cross section of a roof of existing building
Figure 11: Cross section of the roof of building 2 (Adapted from DesignBuilder)
The floor construction material and properties are shown in below table;
Table 24: Properties and U value of Existing floor Construction Materials of the building 2
(Adapted from DesignBuilder)
Conductivity,
W/m.K
Specific Heat,
J/kg.K
Density,
kg/m3
Thickness,
mm
Floor/ Roof Screed 0.41 840 1200 70
Cast Concrete 1.13 1000 2000 100
U, W/m2.K 7.141

67
2.1.2. Calculation of Window to Wall Ratio (WWR)
Following Figure shows the layout diagram of the building. It has numbered the wall faces as indicate in
the Figure for OTTV calculation. WWR of faces were calculated based on measured data. All floors are
identical.
Figurer 12: Layout diagram of building 2 (Adapted from DesignBuilder)
WWR of Wall face 1 of ground floor
Number of Windows = 12
Area of Window = 2.06 m2
Total Window area = 12*2.06
=24.7 m2
Total Wall Area = 47*3.68
=171.5 m2
WWR
= 24.7/171.5
=0.14
This method was followed to find the WWR of other faces also.

68
2.1.3. Calculation of shading coefficient of windows
It is considered the shading due to the verandah in wall faces 1 and 3.
Length of the verandah (Depth of Horizontal Projection) = 1.25 m
Height of the window
= 2.22 m
R1
= 1.25/2.22
=0.6
The OTTV value for the existing building was calculated using above U values, R1 and calculated WWR.
Below table shows the calculation of OTTVs for each building component.
Floor
No.
Wall
Face/Roof Area ∆Teq α WWR Uw ∆T Uf SF SC CF OTTVi Ai*OTTVi
Ground
1 171.49 19.3 0.30 0.14 1.80 3.60 6.257 186 0.56 0.79 24.00 4114.89
2 40.41 19.3 0.30 0.00 1.80 3.60 6.257 186 0.47 0.90 10.40 420.18
3 171.49 19.3 0.30 0.45 1.80 3.60 6.257 186 0.52 0.79 49.86 8550.90
4 40.41 19.3 0.30 0.00 1.80 3.60 6.257 186 0.61 1.34 10.40 420.18
First
1 171.49 19.3 0.30 0.14 1.80 3.60 6.257 186 0.56 0.79 24.00 4114.89
2 40.41 19.3 0.30 0.00 1.80 3.60 6.257 186 0.47 0.90 10.40 420.18
3 171.49 19.3 0.30 0.45 1.80 3.60 6.257 186 0.52 0.79 49.86 8550.90
4 40.41 19.3 0.30 0.00 1.80 3.60 6.257 186 0.61 1.34 10.40 420.18
Second
1 171.49 19.3 0.30 0.14 1.80 3.60 6.257 186 0.56 0.79 24.00 4114.89
2 40.41 19.3 0.30 0.00 1.80 3.60 6.257 186 0.47 0.90 10.40 420.18
3 171.49 19.3 0.30 0.45 1.80 3.60 6.257 186 0.52 0.79 49.86 8550.90
4 40.41 19.3 0.30 0.00 1.80 3.60 6.257 186 0.61 1.34 10.40 420.18
Roof 526.82 7.9 0.86 0.00 1.302
8.85 4660.14
OTTV 25.1
Table 25: Existing OTTV of the Building 2
2.1.4. Annual Cooling energy
By simulating the building with above parameters in the DesignBuilder software the annual cooling energy
of the building was found.
Annual cooling energy = 428.22 MWh
2.2. OTTV and annual cooling energy for modified building:
Introduction of double layer glazing for the windows.
2.2.1 U values of the window glazing
Double layer glasses were introduced to windows and the material properties are same as the section 1.2.1.

69
2.2.2. Calculation of OTTV
Below table show the calculation of OTTV of the building.
Floor No. Wall / Roof Area ∆Teq α WWR Uw ∆T Uf SF SC CF OTTVi Ai*OTTVi
Ground
1 171.49 19.3 0.30 0.14 1.8 3.6 2.76 186 0.56 0.79 21.85 3747.81
2 40.41 19.3 0.30 0.00 1.8 3.6 2.76 186 0.47 0.90 10.40 420.18
3 171.49 19.3 0.30 0.45 1.8 3.6 2.76 186 0.52 0.79 44.58 7644.27
4 40.41 19.3 0.30 0.00 1.8 3.6 2.76 186 0.61 1.34 10.40 420.18
First
1 171.49 19.3 0.30 0.14 1.8 3.6 2.76 186 0.56 0.79 21.85 3747.81
2 40.41 19.3 0.30 0.00 1.8 3.6 2.76 186 0.47 0.90 10.40 420.18
3 171.49 19.3 0.30 0.45 1.8 3.6 2.76 186 0.52 0.79 44.58 7644.27
4 40.41 19.3 0.30 0.00 1.8 3.6 2.76 186 0.61 1.34 10.40 420.18
Second
1 171.49 19.3 0.30 0.14 1.8 3.6 2.76 186 0.56 0.79 21.85 3747.81
2 40.41 19.3 0.30 0.00 1.8 3.6 2.76 186 0.47 0.90 10.40 420.18
3 171.49 19.3 0.30 0.45 1.8 3.6 2.76 186 0.52 0.79 44.58 7644.27
4 40.41 19.3 0.30 0.00 1.8 3.6 2.76 186 0.61 1.34 10.40 420.18
Roof 526.82 7.90 0.86 0.00 1.3 8.85 4660.14
OTTV 23.0
Table 20: OTTV of the modified building 2
2.2.3. Annual cooling energy
By simulating the revised parameters in the DesignBuilder software the annual cooling energy were found.
Annual Cooling energy = 419.23 MWh
2.3. OTTV and annual cooling energy for modified building:
Introduction of wall with insulation
2.3.1 U values of the wall material
Wall thicknesses were increased and insulations were introduced to walls to reduce the OTTV. Properties
of the modified wall are same as the section 1.2.2.
2.3.2. Calculation of OTTV
Below table shows the calculation of OTTVs of modified building.
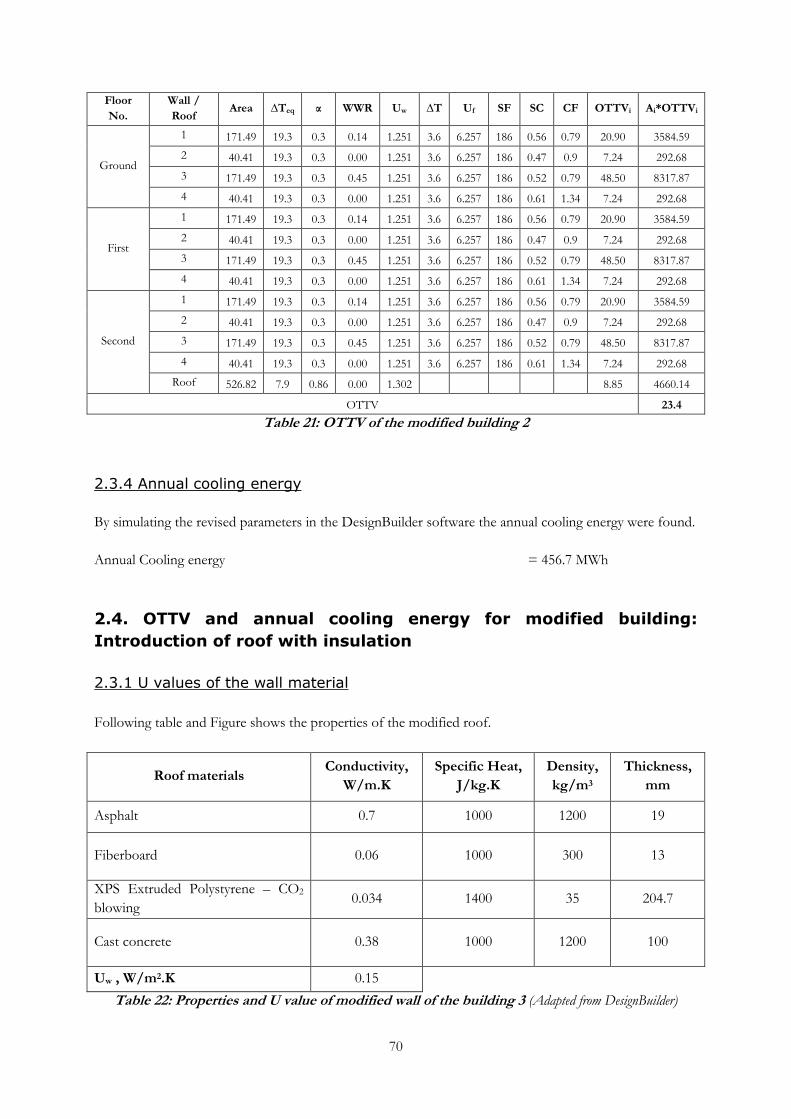
70
Floor
No.
Wall /
Roof Area ∆Teq α WWR Uw ∆T Uf SF SC CF OTTVi Ai*OTTVi
Ground
1 171.49 19.3 0.3 0.14 1.251 3.6 6.257 186 0.56 0.79 20.90 3584.59
2 40.41 19.3 0.3 0.00 1.251 3.6 6.257 186 0.47 0.9 7.24 292.68
3 171.49 19.3 0.3 0.45 1.251 3.6 6.257 186 0.52 0.79 48.50 8317.87
4 40.41 19.3 0.3 0.00 1.251 3.6 6.257 186 0.61 1.34 7.24 292.68
First
1 171.49 19.3 0.3 0.14 1.251 3.6 6.257 186 0.56 0.79 20.90 3584.59
2 40.41 19.3 0.3 0.00 1.251 3.6 6.257 186 0.47 0.9 7.24 292.68
3 171.49 19.3 0.3 0.45 1.251 3.6 6.257 186 0.52 0.79 48.50 8317.87
4 40.41 19.3 0.3 0.00 1.251 3.6 6.257 186 0.61 1.34 7.24 292.68
Second
1 171.49 19.3 0.3 0.14 1.251 3.6 6.257 186 0.56 0.79 20.90 3584.59
2 40.41 19.3 0.3 0.00 1.251 3.6 6.257 186 0.47 0.9 7.24 292.68
3 171.49 19.3 0.3 0.45 1.251 3.6 6.257 186 0.52 0.79 48.50 8317.87
4 40.41 19.3 0.3 0.00 1.251 3.6 6.257 186 0.61 1.34 7.24 292.68
Roof 526.82 7.9 0.86 0.00 1.302 8.85 4660.14
OTTV 23.4
Table 21: OTTV of the modified building 2
2.3.4 Annual cooling energy
By simulating the revised parameters in the DesignBuilder software the annual cooling energy were found.
Annual Cooling energy = 456.7 MWh
2.4. OTTV and annual cooling energy for modified building:
Introduction of roof with insulation
2.3.1 U values of the wall material
Following table and Figure shows the properties of the modified roof.
Roof materials Conductivity,
W/m.K
Specific Heat,
J/kg.K
Density,
kg/m3
Thickness,
mm
Asphalt 0.7 1000 1200 19
Fiberboard 0.06 1000 300 13
XPS Extruded Polystyrene – CO2
blowing 0.034 1400 35 204.7
Cast concrete 0.38 1000 1200 100
Uw , W/m2.K 0.15
Table 22: Properties and U value of modified wall of the building 3 (Adapted from DesignBuilder)

71
Figure 13: Layout diagram of modified roof of building 3 (Adapted from DesignBuilder)
2.3.2. Calculation of OTTV
Below table shows the calculation of OTTVs for each building component.
Floor
No. Wall / Roof Area ∆Teq α WWR Uw ∆T Uf SF SC CF OTTVi Ai*OTTVi
Ground
Floor
1 171 19.3 0.3 0.14 1.796 3.6 6.257 186 0.56 0.79 23.62 4049.97
2 40 19.3 0.3 0.00 1.796 3.6 6.257 186 0.47 0.9 10.40 420.18
3 171 19.3 0.3 0.45 1.796 3.6 6.257 186 0.52 0.79 50.24 8615.50
4 40 19.3 0.3 0.00 1.796 3.6 6.257 186 0.61 1.34 10.40 420.18
First
Floor
1 171 19.3 0.3 0.14 1.796 3.6 6.257 186 0.56 0.79 23.62 4049.97
2 40 19.3 0.3 0.00 1.796 3.6 6.257 186 0.47 0.9 10.40 420.18
3 171 19.3 0.3 0.45 1.796 3.6 6.257 186 0.52 0.79 50.24 8615.50
4 40 19.3 0.3 0.00 1.796 3.6 6.257 186 0.61 1.34 10.40 420.18
Second
Floor
1 171 19.3 0.3 0.14 1.796 3.6 6.257 186 0.56 0.79 23.62 4049.97
2 40 19.3 0.3 0.00 1.796 3.6 6.257 186 0.47 0.9 10.40 420.18
3 171 19.3 0.3 0.45 1.796 3.6 6.257 186 0.52 0.79 50.24 8615.50
4 40 19.3 0.3 0.00 1.796 3.6 6.257 186 0.61 1.34 10.40 420.18
Roof 527 7.9 0.86 0.00 0.150 1.02 536.88
OTTV 22.8
Table 23: OTTV of the modified building 2
2.4.3 Annual cooling energy
By simulating the revised parameters in the DesignBuilder software the annual cooling energy were found.
Annual Cooling energy = 419.4 MWh

72
2.5. OTTV and annual cooling energy for modified building:
Introduce insulations to walls and roof, in order to achieve the
maximum U values for facades and roofs specified in Building Code
2.5.1 U values of the wall and roof materials
Insulation layer was introduced to building wall to achieve the maximum U value specified in the code.
The properties of the wall material are same as section 1.5.1.
Insulation layer was introduced to the roof and the Following table shows the conductivity, specific heat,
density, thickness and U value of the modified roof.
Roof materials Conductivity,
W/m.K
Specific Heat,
J/kg.K
Density,
kg/m3
Thickness,
mm
Asphalt 0.7 1000 1200 19
Fiberboard 0.06 1000 300 9
XPS Extruded Polystyrene – CO2
blowing 0.034 1400 35 65.2
Cast concrete 0.38 1000 1200 100
Uw , W/m2.K 0.4
Table 24: Properties and U value of modified roof construction of the building 2 (Adapted from
DesignBuilder)
Following Figure shows a cross section of a modified roof.
Figure 14: Cross section of the modified roof of building 2 (Adapted from DesignBuilder)

73
2.5.2. Calculation of OTTV
Below table shows the calculation of OTTVs for each building component.
Floor
No.
Wall
/
Roof
Area ∆Teq α WWR Uw ∆T Uf SF SC CF OTTVi Ai*OTTVi
Ground
Floor
1 171 19.3 0.3 0.14 0.45 3.6 6.257 186 0.56 0.79 17.32 2970.89
2 40 19.3 0.3 0.00 0.45 3.6 6.257 186 0.47 0.9 2.61 105.28
3 171 19.3 0.3 0.45 0.45 3.6 6.257 186 0.52 0.79 45.54 7810.16
4 40 19.3 0.3 0.00 0.45 3.6 6.257 186 0.61 1.34 2.61 105.28
First
Floor
1 171 19.3 0.3 0.14 0.45 3.6 6.257 186 0.56 0.79 17.32 2970.89
2 40 19.3 0.3 0.00 0.45 3.6 6.257 186 0.47 0.9 2.61 105.28
3 171 19.3 0.3 0.45 0.45 3.6 6.257 186 0.52 0.79 45.54 7810.16
4 40 19.3 0.3 0.00 0.45 3.6 6.257 186 0.61 1.34 2.61 105.28
Second
Floor
1 171 19.3 0.3 0.14 0.45 3.6 6.257 186 0.56 0.79 17.32 2970.89
2 40 19.3 0.3 0.00 0.45 3.6 6.257 186 0.47 0.9 2.61 105.28
3 171 19.3 0.3 0.45 0.45 3.6 6.257 186 0.52 0.79 45.54 7810.16
4 40 19.3 0.3 0.00 0.45 3.6 6.257 186 0.61 1.34 2.61 105.28
Roof 527 7.9 0.86 0.00 0.40 2.72 1431.69
OTTV 19.1
Table 25: OTTV of the modified building 2
2.5.3 Annual cooling energy
By simulating the revised parameters in the DesignBuilder software the annual cooling energy were found.
Annual Cooling energy = 428 MWh
2.6. OTTV and annual cooling energy for modified building: Reduce
WWR
2.6.1 U values of the construction materials
U values of the construction materials are same as section 2.1.1.
2.6.2. Calculation of OTTV
The facades which have the WWR above 0.35, WWR of the facades were reduced as the maximum value
to 0.35. Below table shows the calculation of OTTVs for each building component.

74
Floor No.
Wall / Roof Area ∆Teq α WWR Uw ∆T Uf SF SC CF OTTVi Ai*OTTVi
Ground Floor
1 171.488 19.3 0.3 0.14 1.796 3.6 6.257 186 0.56 0.79 23.995 4114.894
2 40.4064 19.3 0.3 0.00 1.796 3.6 6.257 186 0.47 0.9 10.399 420.180
3 171.488 19.3 0.3 0.35 1.796 3.6 6.257 186 0.52 0.79 41.386 7097.227
4 40.4064 19.3 0.3 0.00 1.796 3.6 6.257 186 0.61 1.34 10.399 420.180
First Floor
1 171.488 19.3 0.3 0.14 1.796 3.6 6.257 186 0.56 0.79 23.995 4114.894
2 40.4064 19.3 0.3 0.00 1.796 3.6 6.257 186 0.47 0.9 10.399 420.180
3 171.488 19.3 0.3 0.35 1.796 3.6 6.257 186 0.52 0.79 41.386 7097.227
4 40.4064 19.3 0.3 0.00 1.796 3.6 6.257 186 0.61 1.34 10.399 420.180
Second Floor
1 171.488 19.3 0.3 0.14 1.796 3.6 6.257 186 0.56 0.79 23.995 4114.894
2 40.4064 19.3 0.3 0.00 1.796 3.6 6.257 186 0.47 0.9 10.399 420.180
3 171.488 19.3 0.3 0.35 1.796 3.6 6.257 186 0.52 0.79 41.386 7097.227
4 40.4064 19.3 0.3 0.00 1.796 3.6 6.257 186 0.61 1.34 10.399 420.180
0.000
Roof 526.82 7.9 0.86 0.00 1.302 8.846 4660.138
OTTV 22.7
Table 26: OTTV of the modified building 2
2.6.3 Annual cooling energy
By simulating the revised parameters in the DesignBuilder software the annual cooling energy were found.
Annual Cooling energy = 442.55 MWh
2.7. OTTV and annual cooling energy for modified building: Reduce
WWR, Introduce double layer glazing for windows and insulations
to wall
Further to the modifications carried out in section 2.6, double layer glazings were introduced to the
window and insulations were introduced to walls in order to reduce the U values of window and wall.
2.7.1 U values of the construction materials
U values of the window, wall and roof materials are same as in section 2.2.1, 1.2.2 and 2.1.1 respectively.
2.7.2. Calculation of OTTV
Below table shows the calculation of OTTVs for each building component.
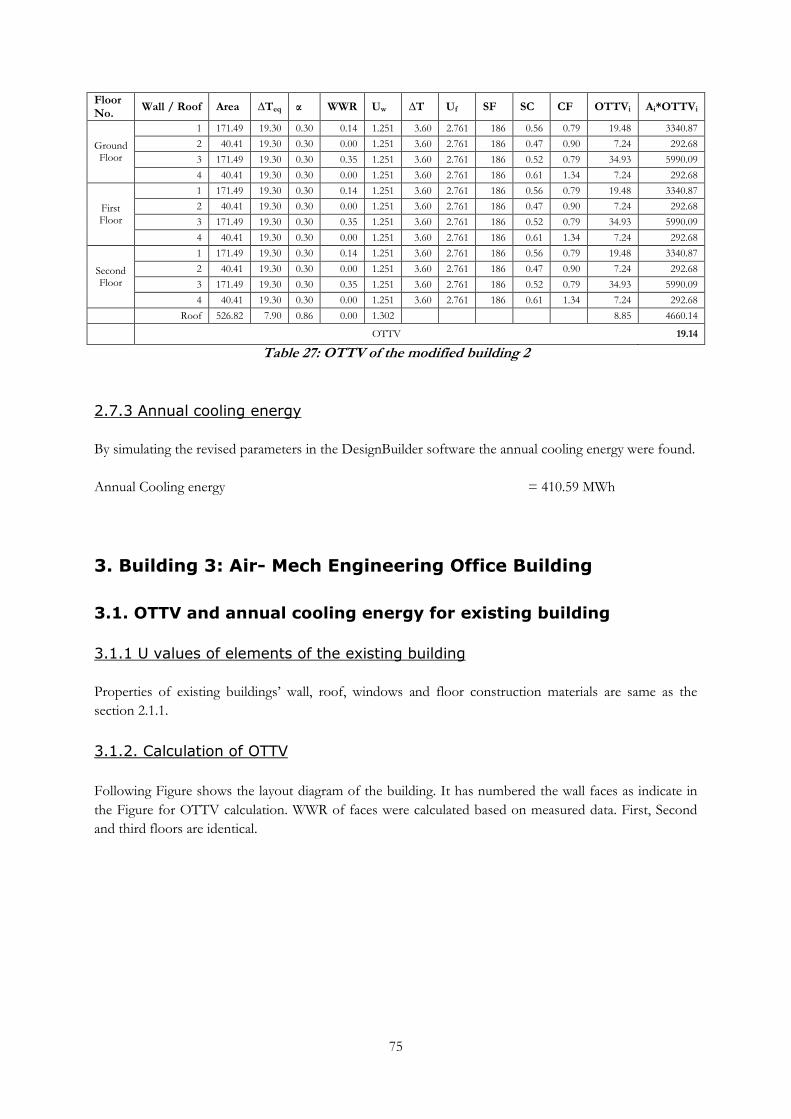
75
Floor No.
Wall / Roof Area ∆Teq α WWR Uw ∆T Uf SF SC CF OTTVi Ai*OTTVi
Ground Floor
1 171.49 19.30 0.30 0.14 1.251 3.60 2.761 186 0.56 0.79 19.48 3340.87
2 40.41 19.30 0.30 0.00 1.251 3.60 2.761 186 0.47 0.90 7.24 292.68
3 171.49 19.30 0.30 0.35 1.251 3.60 2.761 186 0.52 0.79 34.93 5990.09
4 40.41 19.30 0.30 0.00 1.251 3.60 2.761 186 0.61 1.34 7.24 292.68
First Floor
1 171.49 19.30 0.30 0.14 1.251 3.60 2.761 186 0.56 0.79 19.48 3340.87
2 40.41 19.30 0.30 0.00 1.251 3.60 2.761 186 0.47 0.90 7.24 292.68
3 171.49 19.30 0.30 0.35 1.251 3.60 2.761 186 0.52 0.79 34.93 5990.09
4 40.41 19.30 0.30 0.00 1.251 3.60 2.761 186 0.61 1.34 7.24 292.68
Second Floor
1 171.49 19.30 0.30 0.14 1.251 3.60 2.761 186 0.56 0.79 19.48 3340.87
2 40.41 19.30 0.30 0.00 1.251 3.60 2.761 186 0.47 0.90 7.24 292.68
3 171.49 19.30 0.30 0.35 1.251 3.60 2.761 186 0.52 0.79 34.93 5990.09
4 40.41 19.30 0.30 0.00 1.251 3.60 2.761 186 0.61 1.34 7.24 292.68
Roof 526.82 7.90 0.86 0.00 1.302 8.85 4660.14
OTTV 19.14
Table 27: OTTV of the modified building 2
2.7.3 Annual cooling energy
By simulating the revised parameters in the DesignBuilder software the annual cooling energy were found.
Annual Cooling energy = 410.59 MWh
3. Building 3: Air- Mech Engineering Office Building
3.1. OTTV and annual cooling energy for existing building
3.1.1 U values of elements of the existing building
Properties of existing buildings’ wall, roof, windows and floor construction materials are same as the
section 2.1.1.
3.1.2. Calculation of OTTV
Following Figure shows the layout diagram of the building. It has numbered the wall faces as indicate in
the Figure for OTTV calculation. WWR of faces were calculated based on measured data. First, Second
and third floors are identical.

76
Figure 16 Layout diagram of building 3 (Extracted from DesignBuilder)
Below table shows the calculation of OTTVs for each building component.
Floor Wall/Roof Area ∆Teq α WWR Uw ∆T Uf SF SC CF OTTVi Ai*OTTVi
Ground
Floor
1 37 19.3 0.3 0.17 1.968 3.6 6.257 186 1 0.95 44 1626
2 55 19.3 0.3 0.00 1.968 3.6 6.257 186 1 0.9 11 631
3 37 19.3 0.3 0.03 1.968 3.6 6.257 186 1 0.79 15 568
4 55 19.3 0.3 0.11 1.968 3.6 6.257 186 1 1.34 39 2182
1st Floor
5 31 19.3 0.3 0.37 1.968 3.6 6.257 186 1 0.95 80 2442
6 21 19.3 0.3 0.00 1.968 3.6 6.257 186 1 0.9 11 243
7 8 19.3 0.3 0.55 1.968 3.6 6.257 186 1 0.79 98 798
8 11 19.3 0.3 0.40 1.968 3.6 6.257 186 1 0.9 83 924
9 8 19.3 0.3 0.55 1.968 3.6 6.257 186 1 0.95 115 931
10 12 19.3 0.3 0.00 1.968 3.6 6.257 186 1 0.9 11 139
11 31 19.3 0.3 0.25 1.968 3.6 6.257 186 1 0.79 50 1547
12 43 19.3 0.3 0.42 1.968 3.6 6.257 186 1 1.34 120 5137
2nd and
3rd Floors 330 24324
Roof 117 19.3 0.9 0.00 1.302 22 2586
OTTV 55.34
Table 28: Existing OTTV of the Building 3

77
3.1.3. Annual cooling energy
By simulating the building with above parameters in the DesignBuilder software the annual cooling energy
of the building was found.
Annual cooling energy = 151.33 MWh
3.2. OTTV and annual cooling energy for modified building:
Introduce double layer glazing for the windows.
3.2.1 U values of the window glazing
Double layer glasses were introduced to windows and the material properties are same as the section 1.2.1.
3.2.2. Calculation of OTTV
Below table show the calculation of OTTV of the building.
Floor
Wall
/Roo
f
Area ∆Teq α WWR Uw ∆T Uf SF SC CF OTTVi Ai*OTTVi
Ground
Floor
1 37 19.3 0.3 0.17 1.968 3.6 2.761 186 1 0.95 42 1545
2 55 19.3 0.3 0.00 1.968 3.6 2.761 186 1 0.9 11 631
3 37 19.3 0.3 0.03 1.968 3.6 2.761 186 1 0.79 15 556
4 55 19.3 0.3 0.11 1.968 3.6 2.761 186 1 1.34 38 2107
1st Floor
5 31 19.3 0.3 0.37 1.968 3.6 2.761 186 1 0.95 75 2302
6 21 19.3 0.3 0.00 1.968 3.6 2.761 186 1 0.9 11 243
7 8 19.3 0.3 0.55 1.968 3.6 2.761 186 1 0.79 91 742
8 11 19.3 0.3 0.40 1.968 3.6 2.761 186 1 0.9 78 868
9 8 19.3 0.3 0.55 1.968 3.6 2.761 186 1 0.95 108 875
10 12 19.3 0.3 0.00 1.968 3.6 2.761 186 1 0.9 11 139
11 31 19.3 0.3 0.25 1.968 3.6 2.761 186 1 0.79 47 1452
12 43 19.3 0.3 0.42 1.968 3.6 2.761 186 1 1.34 115 4912
2nd and
3rd Floors 330 23066
Roof 117 19.3 0.88 0.00 1.302 22 2586
OTTV 52.76
Table 29: OTTV of the modified building 3
3.2.3. Annual Cooling energy
By simulating the building with above parameters in the DesignBuilder software the annual cooling energy
of the building was found.
Annual cooling energy = 151.1 MWh

78
3.3. OTTV and annual cooling energy for modified building:
Introduce wall with insulation
3.3.1 U values of the wall material
Wall thicknesses were increased and insulations were introduced to walls to reduce the OTTV. Properties
of the modified wall are same as the section 1.2.2.
3.3.2. Calculation of OTTV
Below table shows the calculation of OTTVs of modified building.
Floor Wall/Roof Area ∆Teq α WWR Uw ∆T Uf SF SC CF OTTVi Ai*OTTVi
Ground
Floor
1 37 19.3 0.3 0.17 1.251 3.6 6.257 186 1 0.95 41 1499
2 55 19.3 0.3 0.00 1.251 3.6 6.257 186 1 0.9 7 401
3 37 19.3 0.3 0.03 1.251 3.6 6.257 186 1 0.79 11 418
4 55 19.3 0.3 0.11 1.251 3.6 6.257 186 1 1.34 36 1976
1st Floor
5 31 19.3 0.3 0.37 1.251 3.6 6.257 186 1 0.95 77 2362
6 21 19.3 0.3 0.00 1.251 3.6 6.257 186 1 0.9 7 154
7 8 19.3 0.3 0.55 1.251 3.6 6.257 186 1 0.79 97 783
8 11 19.3 0.3 0.40 1.251 3.6 6.257 186 1 0.9 80 897
9 8 19.3 0.3 0.55 1.251 3.6 6.257 186 1 0.95 113 916
10 12 19.3 0.3 0.00 1.251 3.6 6.257 186 1 0.9 7 88
11 31 19.3 0.3 0.25 1.251 3.6 6.257 186 1 0.79 47 1451
12 43 19.3 0.3 0.42 1.251 3.6 6.257 186 1 1.34 118 5034
2nd and 3rd
Floors 330 23369
Roof 117 19.3 0.88 0.00 1.302 22 2586
OTTV 52.65
Table 30: OTTV of the modified building 3
3.3.3. Annual cooling energy
By simulating the building with above parameters in the DesignBuilder software the annual cooling energy
of the building was found.
Annual cooling energy = 152.21 MWh
3.4. OTTV and annual cooling energy for modified building:
Introduction of roof with insulation
3.4.1 U values of the roof material
Insulations were introduced to roofs to reduce the OTTV. Properties of the modified roof are same as the
section 1.2.2.
3.4.2. Calculation of OTTV
Below table shows the calculation of OTTVs of modified building.

79
Floor Wall/Roof Area ∆Teq α WWR Uw ∆T Uf SF SC CF OTTVi Ai*OTTVi
Ground
Floor
1 37 19.3 0.3 0.17 1.968 3.6 6.257 186 1 0.95 44 1626
2 55 19.3 0.3 0.00 1.968 3.6 6.257 186 1 0.9 11 631
3 37 19.3 0.3 0.03 1.968 3.6 6.257 186 1 0.79 15 568
4 55 19.3 0.3 0.11 1.968 3.6 6.257 186 1 1.34 39 2182
1st
Floor
5 31 19.3 0.3 0.37 1.968 3.6 6.257 186 1 0.95 80 2442
6 21 19.3 0.3 0.00 1.968 3.6 6.257 186 1 0.9 11 243
7 8 19.3 0.3 0.55 1.968 3.6 6.257 186 1 0.79 98 798
8 11 19.3 0.3 0.40 1.968 3.6 6.257 186 1 0.9 83 924
9 8 19.3 0.3 0.55 1.968 3.6 6.257 186 1 0.95 115 931
10 12 19.3 0.3 0.00 1.968 3.6 6.257 186 1 0.9 11 139
11 31 19.3 0.3 0.25 1.968 3.6 6.257 186 1 0.79 50 1547
12 43 19.3 0.3 0.42 1.968 3.6 6.257 186 1 1.34 120 5137
2nd and
3rd
Floors
330 24324
Roof 117 19.3 0.88 0.00 0.15 3 298
OTTV 52.47
Table 31: OTTV of the modified building 3
3.4.3. Annual cooling energy
By simulating the building with above parameters in the DesignBuilder software the annual cooling energy
of the building was found.
Annual cooling energy = 151.06 MWh
3.5. OTTV and annual cooling energy for modified building:
Introduce insulations to walls and roof, in order to achieve the
maximum U values for facades and roofs specified in Building Code
3.5.1 U values of the wall and roof materials
Insulation layers were introduced to building wall and roof to achieve the maximum U value specified in
the code. The properties of these materials are same as section 2.5.1.
3.5.2. Calculation of OTTV
Below table shows the calculation of OTTVs of modified building.

80
Floor Wall/Roof Area ∆Teq α WWR Uw ∆T Uf SF SC CF OTTVi Ai*OTTVi
Ground
Floor
1 37 19.3 0.3 0.17 0.45 3.6 6.257 186 1 0.95 37 1357
2 55 19.3 0.3 0.00 0.45 3.6 6.257 186 1 0.9 3 144
3 37 19.3 0.3 0.03 0.45 3.6 6.257 186 1 0.79 7 251
4 55 19.3 0.3 0.11 0.45 3.6 6.257 186 1 1.34 32 1747
1st Floor
5 31 19.3 0.3 0.37 0.45 3.6 6.257 186 1 0.95 74 2272
6 21 19.3 0.3 0.00 0.45 3.6 6.257 186 1 0.9 3 56
7 8 19.3 0.3 0.55 0.45 3.6 6.257 186 1 0.79 94 766
8 11 19.3 0.3 0.40 0.45 3.6 6.257 186 1 0.9 78 866
9 8 19.3 0.3 0.55 0.45 3.6 6.257 186 1 0.95 111 899
10 12 19.3 0.3 0.00 0.45 3.6 6.257 186 1 0.9 3 32
11 31 19.3 0.3 0.25 0.45 3.6 6.257 186 1 0.79 44 1343
12 43 19.3 0.3 0.42 0.45 3.6 6.257 186 1 1.34 115 4919
2,3 330 22303
Roof 117 19.3 0.88 0.00 0.40 7 794
OTTV 47.40
Table 32: OTTV of the modified building 3
3.5.3. Annual cooling energy
By simulating the building with above parameters in the DesignBuilder software the annual cooling energy
of the building was found.
Annual cooling energy = 153.75 MWh
3.6. OTTV and annual cooling energy for modified building:
Introduce insulations to walls and roof
3.6.1 U values of the wall and roof materials
Insulation layers were introduced to building wall and roof. The properties of wall and roof materials are
same as section 3.3.1 and 3.4.1 respectively.
3.6.2. Calculation of OTTV
Below table shows the calculation of OTTVs of modified building.
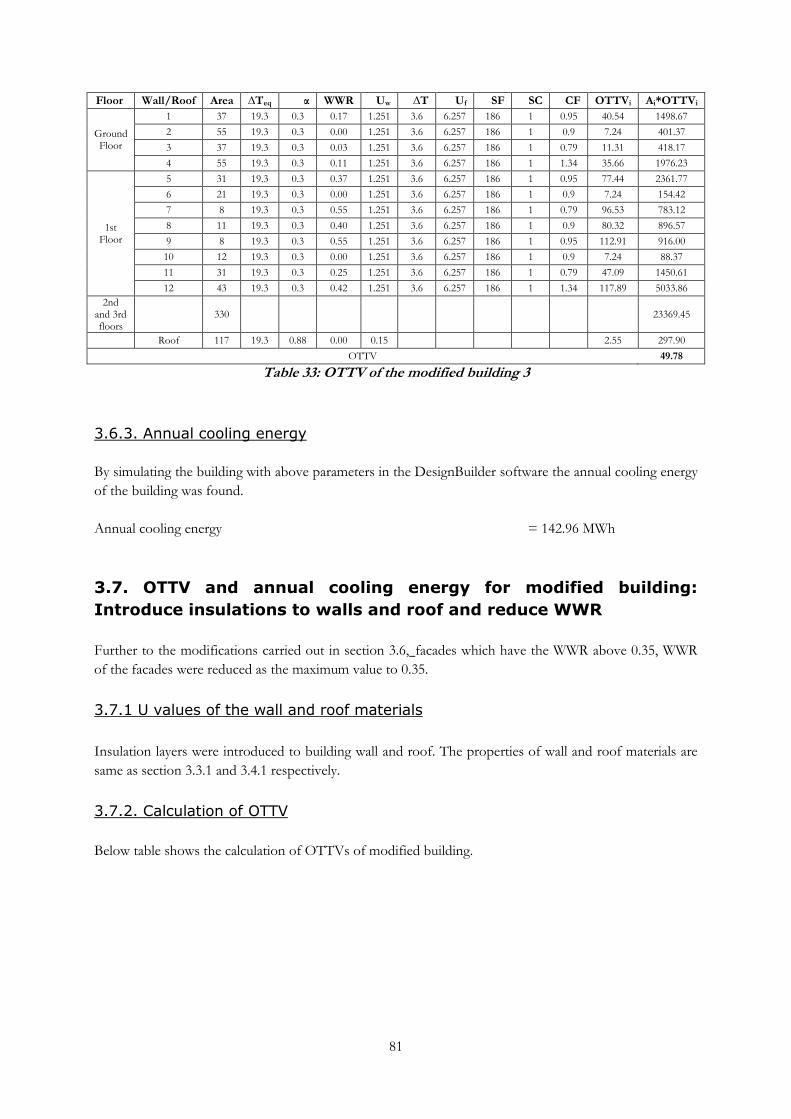
81
Floor Wall/Roof Area ∆Teq α WWR Uw ∆T Uf SF SC CF OTTVi Ai*OTTVi
Ground Floor
1 37 19.3 0.3 0.17 1.251 3.6 6.257 186 1 0.95 40.54 1498.67
2 55 19.3 0.3 0.00 1.251 3.6 6.257 186 1 0.9 7.24 401.37
3 37 19.3 0.3 0.03 1.251 3.6 6.257 186 1 0.79 11.31 418.17
4 55 19.3 0.3 0.11 1.251 3.6 6.257 186 1 1.34 35.66 1976.23
1st Floor
5 31 19.3 0.3 0.37 1.251 3.6 6.257 186 1 0.95 77.44 2361.77
6 21 19.3 0.3 0.00 1.251 3.6 6.257 186 1 0.9 7.24 154.42
7 8 19.3 0.3 0.55 1.251 3.6 6.257 186 1 0.79 96.53 783.12
8 11 19.3 0.3 0.40 1.251 3.6 6.257 186 1 0.9 80.32 896.57
9 8 19.3 0.3 0.55 1.251 3.6 6.257 186 1 0.95 112.91 916.00
10 12 19.3 0.3 0.00 1.251 3.6 6.257 186 1 0.9 7.24 88.37
11 31 19.3 0.3 0.25 1.251 3.6 6.257 186 1 0.79 47.09 1450.61
12 43 19.3 0.3 0.42 1.251 3.6 6.257 186 1 1.34 117.89 5033.86
2nd and 3rd floors
330
23369.45
Roof 117 19.3 0.88 0.00 0.15
2.55 297.90
OTTV 49.78
Table 33: OTTV of the modified building 3
3.6.3. Annual cooling energy
By simulating the building with above parameters in the DesignBuilder software the annual cooling energy
of the building was found.
Annual cooling energy = 142.96 MWh
3.7. OTTV and annual cooling energy for modified building:
Introduce insulations to walls and roof and reduce WWR
Further to the modifications carried out in section 3.6, facades which have the WWR above 0.35, WWR
of the facades were reduced as the maximum value to 0.35.
3.7.1 U values of the wall and roof materials
Insulation layers were introduced to building wall and roof. The properties of wall and roof materials are
same as section 3.3.1 and 3.4.1 respectively.
3.7.2. Calculation of OTTV
Below table shows the calculation of OTTVs of modified building.

82
Floor Wall/Roof Area ∆Teq α WWR Uw ∆T Uf SF SC CF OTTVi Ai*OTTVi
Ground Floor
1 37 19.3 0.3 0.17 1.251 3.6 6.257 186 1 0.95 41 1499
2 55 19.3 0.3 0.00 1.251 3.6 6.257 186 1 0.9 7 401
3 37 19.3 0.3 0.03 1.251 3.6 6.257 186 1 0.79 11 418
4 55 19.3 0.3 0.11 1.251 3.6 6.257 186 1 1.34 36 1976
1st Floor
5 31 19.3 0.3 0.35 1.251 3.6 6.257 186 1 0.95 74 2270
6 21 19.3 0.3 0.00 1.251 3.6 6.257 186 1 0.9 7 154
7 8 19.3 0.3 0.35 1.251 3.6 6.257 186 1 0.79 64 519
8 11 19.3 0.3 0.35 1.251 3.6 6.257 186 1 0.9 71 795
9 8 19.3 0.3 0.35 1.251 3.6 6.257 186 1 0.95 74 604
10 12 19.3 0.3 0.00 1.251 3.6 6.257 186 1 0.9 7 88
11 31 19.3 0.3 0.25 1.251 3.6 6.257 186 1 0.79 47 1451
12 43 19.3 0.3 0.35 1.251 3.6 6.257 186 1 1.34 100 4263
2,3
330
20288
Roof 117 19.3 0.88 0.00 0.15
3 298
OTTV 43.98
Table 34: OTTV of the modified building 3
3.7.3. Annual cooling energy
By simulating the building with above parameters in the DesignBuilder software the annual cooling energy
of the building was found.
Annual cooling energy = 138.75 MWh
3.8. OTTV and annual cooling energy for modified building:
Introduce insulations to walls and roof, reduce WWR and
introduce 1m length overhangs to windows
Further to the modifications carried out in section 3.7, 1m length overhangs were introduced to windows
3.8.1 U values of the wall and roof materials
The properties of wall and roof materials are same as section 3.3.1 and 3.4.1 respectively.
3.8.2. Calculation of OTTV
Below table shows the calculation of OTTVs of modified building.

83
Floor Wall/Roof Area ∆Teq α WWR Uw ∆T Uf SF SC CF OTTVi Ai*OTTVi
Ground Floor
1 37 19.3 0.3 0.17 1.251 3.6 6.257 186 0.53 0.95 26.14 966.19
2 55 19.3 0.3 0.00 1.251 3.6 6.257 186 0.59 0.9 7.24 401.37
3 37 19.3 0.3 0.03 1.251 3.6 6.257 186 0.68 0.79 10.13 374.57
4 55 19.3 0.3 0.11 1.251 3.6 6.257 186 0.68 1.34 27.09 1501.39
1st Floor
5 31 19.3 0.3 0.35 1.251 3.6 6.257 186 0.53 0.95 45.37 1383.78
6 21 19.3 0.3 0.00 1.251 3.6 6.257 186 0.59 0.9 7.24 154.42
7 8 19.3 0.3 0.35 1.251 3.6 6.257 186 0.68 0.79 47.56 385.88
8 11 19.3 0.3 0.35 1.251 3.6 6.257 186 0.59 0.9 47.16 526.45
9 8 19.3 0.3 0.35 1.251 3.6 6.257 186 0.53 0.95 54.65 443.35
10 12 19.3 0.3 0.00 1.251 3.6 6.257 186 0.59 0.9 7.24 88.37
11 31 19.3 0.3 0.25 1.251 3.6 6.257 186 0.68 0.79 30.13 928.04
12 43 19.3 0.3 0.35 1.251 3.6 6.257 186 0.68 1.34 64.06 2735.36
2nd and 3rd floors
330
13291.31
Roof 117 19.3 0.88 0.00 0.15
2.55 298
OTTV 29.48
Table 35: OTTV of the modified building 3
3.8.3. Annual cooling energy
By simulating the building with above parameters in the DesignBuilder software the annual cooling energy
of the building was found.
Annual cooling energy = 124.04 MWh
4. Building 4: Sri Lanka Standards Institute (SLSI) Building
4.1. OTTV and annual cooling energy for existing building
4.1.1 U values of elements of the existing building
Properties of existing buildings’ wall, roof, windows and floor construction materials are same as the
section 2.1.1.
4.1.2. Calculation of OTTV
Following Figure shows the plan view of the building. It has numbered the wall faces as indicate in the
Figure for OTTV calculation.

84
Figure 18: Plan view of building 4
Note: Not drawn to the scale
Following Figure shows the layout diagram of the building 4 used for DesignBuilder software. It indicates
the wall face 1 and 17. All floors are identical. WWR of faces were calculated based on measured data.
Figure 19: Layout diagram of building 4
Following table shows the calculation of OTTV.
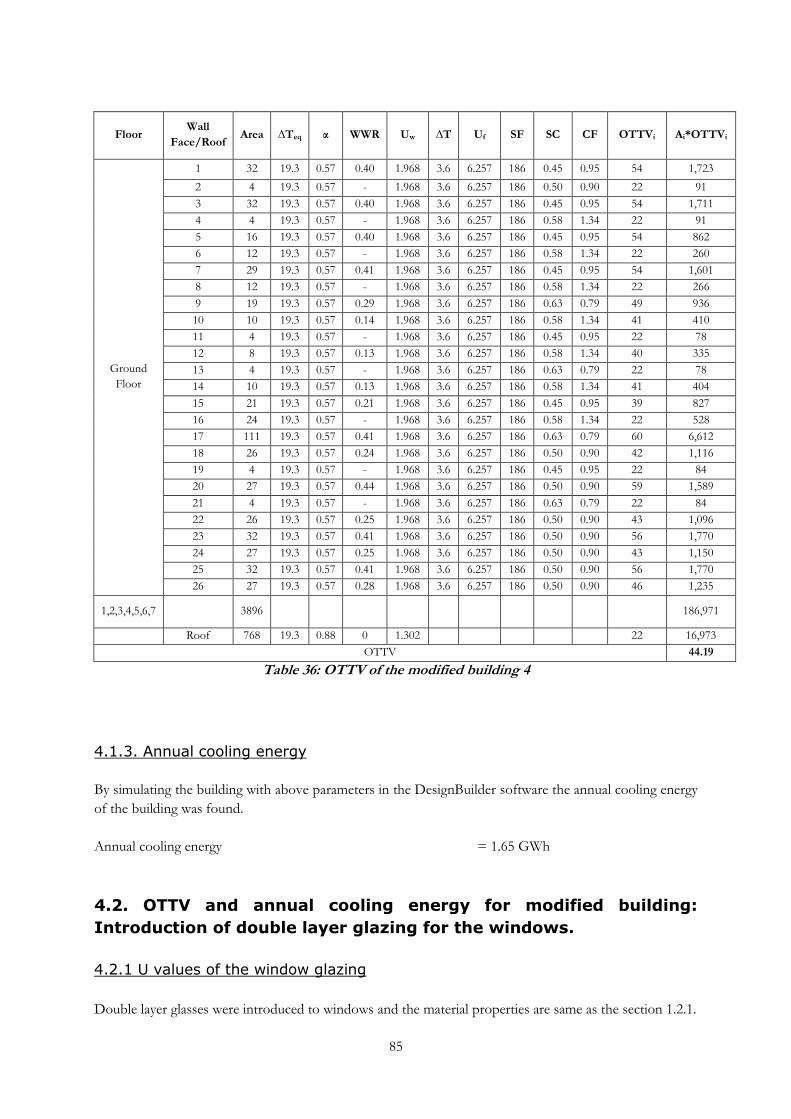
85
Floor Wall
Face/Roof Area ∆Teq α WWR Uw ∆T Uf SF SC CF OTTVi Ai*OTTVi
Ground
Floor
1 32 19.3 0.57 0.40 1.968 3.6 6.257 186 0.45 0.95 54 1,723
2 4 19.3 0.57 - 1.968 3.6 6.257 186 0.50 0.90 22 91
3 32 19.3 0.57 0.40 1.968 3.6 6.257 186 0.45 0.95 54 1,711
4 4 19.3 0.57 - 1.968 3.6 6.257 186 0.58 1.34 22 91
5 16 19.3 0.57 0.40 1.968 3.6 6.257 186 0.45 0.95 54 862
6 12 19.3 0.57 - 1.968 3.6 6.257 186 0.58 1.34 22 260
7 29 19.3 0.57 0.41 1.968 3.6 6.257 186 0.45 0.95 54 1,601
8 12 19.3 0.57 - 1.968 3.6 6.257 186 0.58 1.34 22 266
9 19 19.3 0.57 0.29 1.968 3.6 6.257 186 0.63 0.79 49 936
10 10 19.3 0.57 0.14 1.968 3.6 6.257 186 0.58 1.34 41 410
11 4 19.3 0.57 - 1.968 3.6 6.257 186 0.45 0.95 22 78
12 8 19.3 0.57 0.13 1.968 3.6 6.257 186 0.58 1.34 40 335
13 4 19.3 0.57 - 1.968 3.6 6.257 186 0.63 0.79 22 78
14 10 19.3 0.57 0.13 1.968 3.6 6.257 186 0.58 1.34 41 404
15 21 19.3 0.57 0.21 1.968 3.6 6.257 186 0.45 0.95 39 827
16 24 19.3 0.57 - 1.968 3.6 6.257 186 0.58 1.34 22 528
17 111 19.3 0.57 0.41 1.968 3.6 6.257 186 0.63 0.79 60 6,612
18 26 19.3 0.57 0.24 1.968 3.6 6.257 186 0.50 0.90 42 1,116
19 4 19.3 0.57 - 1.968 3.6 6.257 186 0.45 0.95 22 84
20 27 19.3 0.57 0.44 1.968 3.6 6.257 186 0.50 0.90 59 1,589
21 4 19.3 0.57 - 1.968 3.6 6.257 186 0.63 0.79 22 84
22 26 19.3 0.57 0.25 1.968 3.6 6.257 186 0.50 0.90 43 1,096
23 32 19.3 0.57 0.41 1.968 3.6 6.257 186 0.50 0.90 56 1,770
24 27 19.3 0.57 0.25 1.968 3.6 6.257 186 0.50 0.90 43 1,150
25 32 19.3 0.57 0.41 1.968 3.6 6.257 186 0.50 0.90 56 1,770
26 27 19.3 0.57 0.28 1.968 3.6 6.257 186 0.50 0.90 46 1,235
1,2,3,4,5,6,7
3896
186,971
Roof 768 19.3 0.88 0 1.302
22 16,973
OTTV 44.19
Table 36: OTTV of the modified building 4
4.1.3. Annual cooling energy
By simulating the building with above parameters in the DesignBuilder software the annual cooling energy
of the building was found.
Annual cooling energy = 1.65 GWh
4.2. OTTV and annual cooling energy for modified building:
Introduction of double layer glazing for the windows.
4.2.1 U values of the window glazing
Double layer glasses were introduced to windows and the material properties are same as the section 1.2.1.

86
4.2.2. Calculation of OTTV
Following table shows the calculation of OTTV.
Floor
Wall
Face/
Roof
Area ∆Teq α WWR Uw ∆T Uf SF SC CF OTTVi Ai*OTTVi
Ground
Floor
1 32 19.3 0.57 0.40 1.968 3.6 2.761 186 0.45 0.95 49 1,561
2 4 19.3 0.57 - 1.968 3.6 2.761 186 0.50 0.90 22 91
3 32 19.3 0.57 0.42 1.968 3.6 2.761 186 0.45 0.95 50 1,601
4 4 19.3 0.57 - 1.968 3.6 2.761 186 0.58 1.34 22 91
5 16 19.3 0.57 0.40 1.968 3.6 2.761 186 0.45 0.95 49 781
6 12 19.3 0.57 - 1.968 3.6 2.761 186 0.58 1.34 22 260
7 29 19.3 0.57 0.41 1.968 3.6 2.761 186 0.45 0.95 49 1,450
8 12 19.3 0.57 - 1.968 3.6 2.761 186 0.58 1.34 22 266
9 19 19.3 0.57 0.29 1.968 3.6 2.761 186 0.63 0.79 45 866
10 10 19.3 0.57 0.14 1.968 3.6 2.761 186 0.58 1.34 40 394
11 4 19.3 0.57 - 1.968 3.6 2.761 186 0.45 0.95 22 78
12 8 19.3 0.57 0.13 1.968 3.6 2.761 186 0.58 1.34 38 321
13 4 19.3 0.57 - 1.968 3.6 2.761 186 0.63 0.79 22 78
14 10 19.3 0.57 0.13 1.968 3.6 2.761 186 0.58 1.34 39 388
15 21 19.3 0.57 0.21 1.968 3.6 2.761 186 0.45 0.95 36 770
16 24 19.3 0.57 - 1.968 3.6 2.761 186 0.58 1.34 22 528
17 111 19.3 0.57 0.41 1.968 3.6 2.761 186 0.63 0.79 54 6,046
18 26 19.3 0.57 0.24 1.968 3.6 2.761 186 0.50 0.90 39 1,035
19 4 19.3 0.57 - 1.968 3.6 2.761 186 0.45 0.95 22 84
20 27 19.3 0.57 0.44 1.968 3.6 2.761 186 0.50 0.90 53 1,440
21 4 19.3 0.57 - 1.968 3.6 2.761 186 0.63 0.79 22 84
22 26 19.3 0.57 0.25 1.968 3.6 2.761 186 0.50 0.90 40 1,015
23 32 19.3 0.57 0.41 1.968 3.6 2.761 186 0.50 0.90 51 1,608
24 27 19.3 0.57 0.25 1.968 3.6 2.761 186 0.50 0.90 39 1,066
25 32 19.3 0.57 0.41 1.968 3.6 2.761 186 0.50 0.90 51 1,608
26 27 19.3 0.57 0.28 1.968 3.6 2.761 186 0.50 0.90 42 1,138
1,2,3,4,5
,6,7 3896
172,539
Roof 768 19.3 0.88 0 1.302
22 16,973
OTTV 41.03
Table 37: OTTV of the modified building 4
4.2.3. Annual cooling energy
By simulating the building with above parameters in the DesignBuilder software the annual cooling energy
of the building was found.
nnual cooling energy = 1.66 GWh

87
4.3. OTTV and annual cooling energy for modified building:
Introduce wall with insulation
4.3.1 U values of the wall material
Wall thicknesses were increased and insulations were introduced to walls to reduce the OTTV. Properties
of the modified wall are same as the section 1.2.2.
4.3.2. Calculation of OTTV
Below table shows the calculation of OTTVs of modified building.
Floor
Wall
Face/
Roof
Area ∆Teq α WWR Uw ∆T Uf SF SC CF OTTVi Ai*OTTVi
Ground
Floor
1 32 19.3 0.57 0.40 1.251 3.6 6.257 186 0.45 0.95 49 1,574
2 4 19.3 0.57 - 1.251 3.6 6.257 186 0.50 0.9 14 58
3 32 19.3 0.57 0.42 1.251 3.6 6.257 186 0.45 0.95 51 1,625
4 4 19.3 0.57 - 1.251 3.6 6.257 186 0.58 1.34 14 58
5 16 19.3 0.57 0.40 1.251 3.6 6.257 186 0.45 0.95 49 787
6 12 19.3 0.57 - 1.251 3.6 6.257 186 0.58 1.34 14 165
7 29 19.3 0.57 0.41 1.251 3.6 6.257 186 0.45 0.95 50 1,464
8 12 19.3 0.57 - 1.251 3.6 6.257 186 0.58 1.34 14 169
9 19 19.3 0.57 0.29 1.251 3.6 6.257 186 0.63 0.79 43 829
10 10 19.3 0.57 0.14 1.251 3.6 6.257 186 0.58 1.34 35 343
11 4 19.3 0.57 - 1.251 3.6 6.257 186 0.45 0.95 14 50
12 8 19.3 0.57 0.13 1.251 3.6 6.257 186 0.58 1.34 33 277
13 4 19.3 0.57 - 1.251 3.6 6.257 186 0.63 0.79 14 50
14 10 19.3 0.57 0.13 1.251 3.6 6.257 186 0.58 1.34 34 336
15 21 19.3 0.57 0.21 1.251 3.6 6.257 186 0.45 0.95 33 695
16 24 19.3 0.57 - 1.251 3.6 6.257 186 0.58 1.34 14 335
17 111 19.3 0.57 0.41 1.251 3.6 6.257 186 0.63 0.79 55 6,092
18 26 19.3 0.57 0.24 1.251 3.6 6.257 186 0.50 0.9 36 958
19 4 19.3 0.57 - 1.251 3.6 6.257 186 0.45 0.95 14 54
20 27 19.3 0.57 0.44 1.251 3.6 6.257 186 0.50 0.9 54 1,470
21 4 19.3 0.57 - 1.251 3.6 6.257 186 0.63 0.79 14 54
22 26 19.3 0.57 0.25 1.251 3.6 6.257 186 0.50 0.9 37 946
23 32 19.3 0.57 0.41 1.251 3.6 6.257 186 0.50 0.9 52 1,624
24 27 19.3 0.57 0.25 1.251 3.6 6.257 186 0.50 0.9 37 990
25 32 19.3 0.57 0.41 1.251 3.6 6.257 186 0.50 0.9 52 1,624
26 27 19.3 0.57 0.28 1.251 3.6 6.257 186 0.50 0.9 40 1,083
1,2,3,4,5
,6,7 3896
165,957
Roof 768 19.3 0.88 0 1.302
22 16,973
OTTV 39.58
Table 38: OTTV of the modified building 4
4.3.3. Annual cooling energy
By simulating the building with above parameters in the DesignBuilder software the annual cooling energy
of the building was found.

88
Annual cooling energy = 1.67 GWh
4.4. OTTV and annual cooling energy for modified building:
Introduction of roof with insulation
4.4.1 U values of the roof material
Insulations were introduced to roofs to reduce the OTTV. Properties of the modified roof are same as the
section 1.2.2.
4.4.2. Calculation of OTTV
Below table shows the calculation of OTTVs of modified building.

89
Floor
Wall
Face/
Roof
Area ∆Teq α WWR Uw ∆T Uf SF SC CF OTTVi Ai*OTTVi
Ground
Floor
1 32 19.3 0.57
0.40 1.968 3.6 6.257 186 0.45 0.95 49
1,546
2 4 19.3 0.57
- 1.968 3.6 6.257 186 0.5 0.9 22
91
3 32 19.3 0.57
0.42 1.968 3.6 6.257 186 0.45 0.95 48
1,533
4 4 19.3 0.57
- 1.968 3.6 6.257 186 0.58 1.34 22
91
5 16 19.3 0.57
0.40 1.968 3.6 6.257 186 0.45 0.95 49
773
6 12 19.3 0.57
- 1.968 3.6 6.257 186 0.58 1.34 22
260
7 29 19.3 0.57
0.41 1.968 3.6 6.257 186 0.45 0.95 49
1,427
8 12 19.3 0.57
- 1.968 3.6 6.257 186 0.58 1.34 22
266
9 19 19.3 0.57
0.29 1.968 3.6 6.257 186 0.63 0.79 49
936
10 10 19.3 0.57
0.14 1.968 3.6 6.257 186 0.58 1.34 41
410
11 4 19.3 0.57
- 1.968 3.6 6.257 186 0.45 0.95 22
78
12 8 19.3 0.57
0.13 1.968 3.6 6.257 186 0.58 1.34 40
335
13 4 19.3 0.57
- 1.968 3.6 6.257 186 0.63 0.79 22
78
14 10 19.3 0.57
0.13 1.968 3.6 6.257 186 0.58 1.34 41
404
15 21 19.3 0.57
0.21 1.968 3.6 6.257 186 0.45 0.95 39
827
16 24 19.3 0.57
- 1.968 3.6 6.257 186 0.58 1.34 22
528
17 111 19.3 0.57
0.41 1.968 3.6 6.257 186 0.63 0.79 53
5,899
18 26 19.3 0.57
0.24 1.968 3.6 6.257 186 0.5 0.9 42
1,116
19 4 19.3 0.57 - 1.968 3.6 6.257 186 0.45 0.95 22
84
20 27 19.3 0.57 0.44 1.968 3.6 6.257 186 0.5 0.9 59
1,589
21 4 19.3 0.57 - 1.968 3.6 6.257 186 0.63 0.79 22
84
22 26 19.3 0.57 0.25 1.968 3.6 6.257 186 0.5 0.9 43
1,096
23 32 19.3 0.57 0.41 1.968 3.6 6.257 186 0.5 0.9 50
1,574
24 27 19.3 0.57 0.25 1.968 3.6 6.257 186 0.5 0.9 43
1,150
25 32 19.3 0.57 0.41 1.968 3.6 6.257 186 0.5 0.9 50
1,574
26 27 19.3 0.57 0.28 1.968 3.6 6.257 186 0.5 0.9 46
1,235
1,2,3,4,5
,6,7 3896
174,900
Roof 768 19.3 0.88 0 0.15 3
1,955
OTTV 39
Table 39: OTTV of the modified building 4

90
4.4.3. Annual cooling energy
By simulating the building with above parameters in the DesignBuilder software the annual cooling energy
of the building was found.
Annual cooling energy = 1.61 GWh
4.5. OTTV and annual cooling energy for modified building:
Introduce insulations to walls and roof, in order to achieve the
maximum U values for facades and roofs specified in Building Code
4.5.1 U values of the wall and roof materials
Insulation layers were introduced to building wall and roof to achieve the maximum U value specified in
the code. The properties of these materials are same as section 2.5.1.
4.5.2. Calculation of OTTV
Below table shows the calculation of OTTVs of modified building.
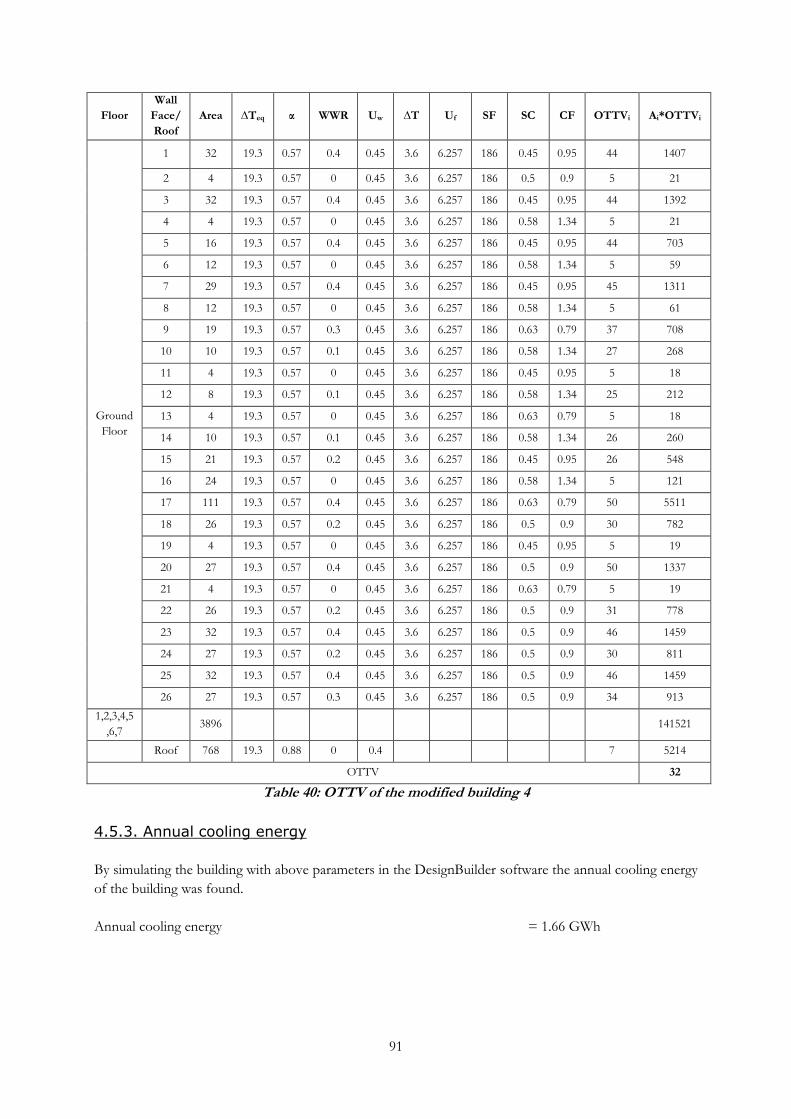
91
Floor
Wall
Face/
Roof
Area ∆Teq α WWR Uw ∆T Uf SF SC CF OTTVi Ai*OTTVi
Ground
Floor
1 32 19.3 0.57 0.4 0.45 3.6 6.257 186 0.45 0.95 44 1407
2 4 19.3 0.57 0 0.45 3.6 6.257 186 0.5 0.9 5 21
3 32 19.3 0.57 0.4 0.45 3.6 6.257 186 0.45 0.95 44 1392
4 4 19.3 0.57 0 0.45 3.6 6.257 186 0.58 1.34 5 21
5 16 19.3 0.57 0.4 0.45 3.6 6.257 186 0.45 0.95 44 703
6 12 19.3 0.57 0 0.45 3.6 6.257 186 0.58 1.34 5 59
7 29 19.3 0.57 0.4 0.45 3.6 6.257 186 0.45 0.95 45 1311
8 12 19.3 0.57 0 0.45 3.6 6.257 186 0.58 1.34 5 61
9 19 19.3 0.57 0.3 0.45 3.6 6.257 186 0.63 0.79 37 708
10 10 19.3 0.57 0.1 0.45 3.6 6.257 186 0.58 1.34 27 268
11 4 19.3 0.57 0 0.45 3.6 6.257 186 0.45 0.95 5 18
12 8 19.3 0.57 0.1 0.45 3.6 6.257 186 0.58 1.34 25 212
13 4 19.3 0.57 0 0.45 3.6 6.257 186 0.63 0.79 5 18
14 10 19.3 0.57 0.1 0.45 3.6 6.257 186 0.58 1.34 26 260
15 21 19.3 0.57 0.2 0.45 3.6 6.257 186 0.45 0.95 26 548
16 24 19.3 0.57 0 0.45 3.6 6.257 186 0.58 1.34 5 121
17 111 19.3 0.57 0.4 0.45 3.6 6.257 186 0.63 0.79 50 5511
18 26 19.3 0.57 0.2 0.45 3.6 6.257 186 0.5 0.9 30 782
19 4 19.3 0.57 0 0.45 3.6 6.257 186 0.45 0.95 5 19
20 27 19.3 0.57 0.4 0.45 3.6 6.257 186 0.5 0.9 50 1337
21 4 19.3 0.57 0 0.45 3.6 6.257 186 0.63 0.79 5 19
22 26 19.3 0.57 0.2 0.45 3.6 6.257 186 0.5 0.9 31 778
23 32 19.3 0.57 0.4 0.45 3.6 6.257 186 0.5 0.9 46 1459
24 27 19.3 0.57 0.2 0.45 3.6 6.257 186 0.5 0.9 30 811
25 32 19.3 0.57 0.4 0.45 3.6 6.257 186 0.5 0.9 46 1459
26 27 19.3 0.57 0.3 0.45 3.6 6.257 186 0.5 0.9 34 913
1,2,3,4,5
,6,7 3896 141521
Roof 768 19.3 0.88 0 0.4 7 5214
OTTV 32
Table 40: OTTV of the modified building 4
4.5.3. Annual cooling energy
By simulating the building with above parameters in the DesignBuilder software the annual cooling energy
of the building was found.
Annual cooling energy = 1.66 GWh

92
4.6. OTTV and annual cooling energy for modified building: Reduce
WWR
The facades which have the WWR above 0.3, WWR of the facades were reduced as the maximum value to
0.3.
4.6.1 U values of construction materials
Properties of the buildings’ wall, roof, windows and floor construction materials are same as the section
2.1.1.
4.6.2. Calculation of OTTV
Below table shows the calculation of OTTVs of modified building.

93
Floor Wall
Face/Roof
Area ∆Teq α WWR Uw ∆T Uf SF SC CF OTTVi Ai*OTTVi
Ground Floor
1 32 19.3 0.57 0.30 1.968 3.6 6.257 186 0.45 0.95 46 1,455
2 4 19.3 0.57 - 1.968 3.6 6.257 186 0.5 0.9 22 91
3 32 19.3 0.57 0.30 1.968 3.6 6.257 186 0.45 0.95 46 1,455
4 4 19.3 0.57 - 1.968 3.6 6.257 186 0.58 1.34 22 91
5 16 19.3 0.57 0.30 1.968 3.6 6.257 186 0.45 0.95 46 728
6 12 19.3 0.57 - 1.968 3.6 6.257 186 0.58 1.34 22 260
7 29 19.3 0.57 0.30 1.968 3.6 6.257 186 0.45 0.95 46 1,346
8 12 19.3 0.57 - 1.968 3.6 6.257 186 0.58 1.34 22 266
9 19 19.3 0.57 0.29 1.968 3.6 6.257 186 0.63 0.79 49 936
10 10 19.3 0.57 0.14 1.968 3.6 6.257 186 0.58 1.34 41 410
11 4 19.3 0.57 - 1.968 3.6 6.257 186 0.45 0.95 22 78
12 8 19.3 0.57 0.13 1.968 3.6 6.257 186 0.58 1.34 40 335
13 4 19.3 0.57 - 1.968 3.6 6.257 186 0.63 0.79 22 78
14 10 19.3 0.57 0.13 1.968 3.6 6.257 186 0.58 1.34 41 404
15 21 19.3 0.57 0.21 1.968 3.6 6.257 186 0.45 0.95 39 827
16 24 19.3 0.57 - 1.968 3.6 6.257 186 0.58 1.34 22 528
17 111 19.3 0.57 0.30 1.968 3.6 6.257 186 0.63 0.79 50 5,515
18 26 19.3 0.57 0.24 1.968 3.6 6.257 186 0.5 0.9 42 1,116
19 4 19.3 0.57 - 1.968 3.6 6.257 186 0.45 0.95 22 84
20 27 19.3 0.57 0.30 1.968 3.6 6.257 186 0.5 0.9 47 1,270
21 4 19.3 0.57 - 1.968 3.6 6.257 186 0.63 0.79 22 84
22 26 19.3 0.57 0.25 1.968 3.6 6.257 186 0.5 0.9 43 1,096
23 32 19.3 0.57 0.30 1.968 3.6 6.257 186 0.5 0.9 47 1,481
24 27 19.3 0.57 0.25 1.968 3.6 6.257 186 0.5 0.9 43 1,150
25 32 19.3 0.57 0.30 1.968 3.6 6.257 186 0.5 0.9 47 1,481
26 27 19.3 0.57 0.28 1.968 3.6 6.257 186 0.5 0.9 46 1,235
1,2,3,4,5,6,7
3896
166,608
Roof 768 19.3 0.88 0 1.302
22 16,973
OTTV 39.73
Table 41: OTTV of the modified building 4
4.6.3. Annual cooling energy
By simulating the building with above parameters in the DesignBuilder software the annual cooling energy
of the building was found.
Annual cooling energy = 1.63 GWh
4.7. OTTV and annual cooling energy for modified building: Reduce
WWR and introduce insulations to walls
Further to the modifications at section 4.6, insulations were introduced to walls.
4.7.1 U values of construction materials
Properties of the buildings’ wall materials are same as the section 4.3.2.

94
4.7.2. Calculation of OTTV
Below table shows the calculation of OTTVs of modified building.
Floor Wall
Face/Roof
Area ∆Teq α WWR Uw ∆T Uf SF SC CF OTTVi Ai*OTTVi
Ground Floor
1 32 19.3 0.57 0.30 1.251 3.6 6.257 186 0.45 0.95 40.25 1,279.81
2 4 19.3 0.57 - 1.251 3.6 6.257 186 0.5 0.9 13.76 57.80
3 32 19.3 0.57 0.30 1.251 3.6 6.257 186 0.45 0.95 40.25 1,279.81
4 4 19.3 0.57 - 1.251 3.6 6.257 186 0.58 1.34 13.76 57.80
5 16 19.3 0.57 0.30 1.251 3.6 6.257 186 0.45 0.95 40.25 639.91
6 12 19.3 0.57 - 1.251 3.6 6.257 186 0.58 1.34 13.76 165.15
7 29 19.3 0.57 0.30 1.251 3.6 6.257 186 0.45 0.95 40.25 1,183.22
8 12 19.3 0.57 - 1.251 3.6 6.257 186 0.58 1.34 13.76 169.28
9 19 19.3 0.57 0.29 1.251 3.6 6.257 186 0.63 0.79 43.15 828.55
10 10 19.3 0.57 0.14 1.251 3.6 6.257 186 0.58 1.34 34.65 343.05
11 4 19.3 0.57 - 1.251 3.6 6.257 186 0.45 0.95 13.76 49.54
12 8 19.3 0.57 0.13 1.251 3.6 6.257 186 0.58 1.34 32.93 276.59
13 4 19.3 0.57 - 1.251 3.6 6.257 186 0.63 0.79 13.76 49.54
14 10 19.3 0.57 0.13 1.251 3.6 6.257 186 0.58 1.34 33.95 336.15
15 21 19.3 0.57 0.21 1.251 3.6 6.257 186 0.45 0.95 32.65 695.35
16 24 19.3 0.57 - 1.251 3.6 6.257 186 0.58 1.34 13.76 335.45
17 111 19.3 0.57 0.30 1.251 3.6 6.257 186 0.63 0.79 44.16 4,902.07
18 26 19.3 0.57 0.24 1.251 3.6 6.257 186 0.5 0.9 36.30 958.32
19 4 19.3 0.57 - 1.251 3.6 6.257 186 0.45 0.95 13.76 53.67
20 27 19.3 0.57 0.30 1.251 3.6 6.257 186 0.5 0.9 41.50 1,120.53
21 4 19.3 0.57 - 1.251 3.6 6.257 186 0.63 0.79 13.76 53.67
22 26 19.3 0.57 0.25 1.251 3.6 6.257 186 0.5 0.9 37.10 945.94
23 32 19.3 0.57 0.30 1.251 3.6 6.257 186 0.5 0.9 41.50 1,307.29
24 27 19.3 0.57 0.25 1.251 3.6 6.257 186 0.5 0.9 36.66 989.81
25 32 19.3 0.57 0.30 1.251 3.6 6.257 186 0.5 0.9 41.50 1,307.29
26 27 19.3 0.57 0.28 1.251 3.6 6.257 186 0.5 0.9 40.10 1,082.83
1,2,3,4,5,6,7
3896
143,278.97
Roof 768 19.3 0.88 0 1.302
22.11 16,973.07
OTTV 34.62
Table 42: OTTV of the modified building 4
4.7.3. Annual cooling energy
By simulating the building with above parameters in the DesignBuilder software the annual cooling energy
of the building was found.
Annual cooling energy = 1.50 GWh
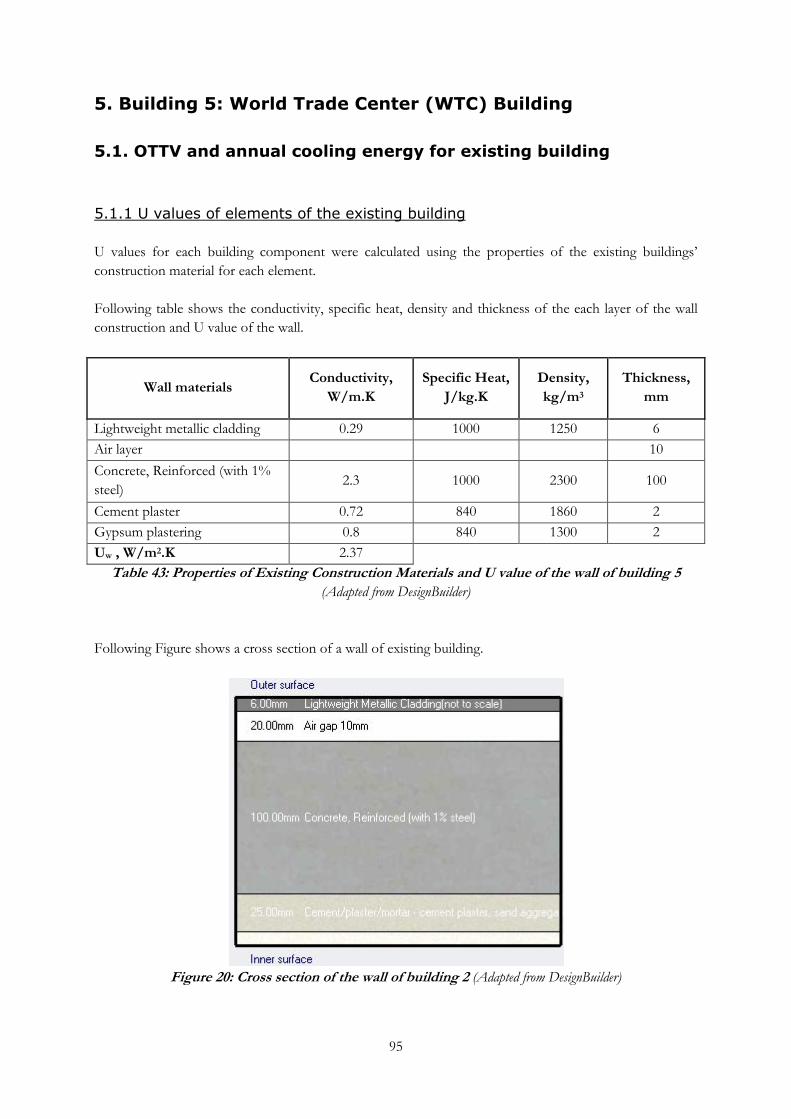
95
5. Building 5: World Trade Center (WTC) Building
5.1. OTTV and annual cooling energy for existing building
5.1.1 U values of elements of the existing building
U values for each building component were calculated using the properties of the existing buildings’
construction material for each element.
Following table shows the conductivity, specific heat, density and thickness of the each layer of the wall
construction and U value of the wall.
Wall materials Conductivity,
W/m.K
Specific Heat,
J/kg.K
Density,
kg/m3
Thickness,
mm
Lightweight metallic cladding 0.29 1000 1250 6
Air layer
10
Concrete, Reinforced (with 1%
steel) 2.3 1000 2300 100
Cement plaster 0.72 840 1860 2
Gypsum plastering 0.8 840 1300 2
Uw , W/m2.K 2.37
Table 43: Properties of Existing Construction Materials and U value of the wall of building 5
(Adapted from DesignBuilder)
Following Figure shows a cross section of a wall of existing building.
Figure 20: Cross section of the wall of building 2 (Adapted from DesignBuilder)

96
Single layer, 6mm thick, blue colored glass are used for the windows and following table shows the
conductivity and U value of the glass.
Material Conductivity, W/m.K Thickness, mm
Generic blue glass 0.9 6
Uf, W/m2.K 6.121
Table 44: Properties and U value of existing window construction materials of the building 5
(Adapted from DesignBuilder)
Properties of existing buildings’ roof and floor construction materials are same as the section 2.1.1.
5.1.2. Calculation of OTTV
Following table shows the calculation of OTTV.

97
Floor Wall Area ∆Teq α WWR Uw ∆T Uf SF SC CF OTTVi Ai*OTTVi
Level 1
1 340 19.3 0.12 0.4 2.373 3.6 6.121 186 1 0.95 83 28114
2 59 19.3 0.12 0.4 2.373 3.6 6.121 186 1 0.93 81 4829
3 74 19.3 0.12 0.4 2.373 3.6 6.121 186 1 0.9 79 5880
4 34 19.3 0.12 0.4 2.373 3.6 6.121 186 1 0.85 75 2547
5 34 19.3 0.12 0.4 2.373 3.6 6.121 186 1 0.79 71 2375
6 35 19.3 0.12 0.4 2.373 3.6 6.121 186 1 1.07 92 3174
7 33 19.3 0.12 0.4 2.373 3.6 6.121 186 1 1.34 112 3701
8 34 19.3 0.12 0.4 2.373 3.6 6.121 186 1 0.85 75 2585
9 31 19.3 0.12 0.4 2.373 3.6 6.121 186 1 0.79 71 2169
10 33 19.3 0.12 0.4 2.373 3.6 6.121 186 1 1.07 92 3018
11 33 19.3 0.12 0.4 2.373 3.6 6.121 186 1 1.07 92 3072
12 33 19.3 0.12 0.4 2.373 3.6 6.121 186 1 1.07 92 3037
13 35 19.3 0.12 0.4 2.373 3.6 6.121 186 1 1.07 92 3175
14 33 19.3 0.12 0.4 2.373 3.6 6.121 186 1 1.07 92 3037
15 33 19.3 0.12 0.4 2.373 3.6 6.121 186 1 1.34 112 3652
16 74 19.3 0.12 0.4 2.373 3.6 6.121 186 1 1.34 112 8315
Level 2,3 1216 109128
Level 4
1 114 19.3 0.12 0.4 2.373 3.6 6.121 186 1 0.95 83 9433
2 113 19.3 0.12 0.4 2.373 3.6 6.121 186 1 0.93 81 9175
3 34 19.3 0.12 0.4 2.373 3.6 6.121 186 1 0.85 75 2547
4 34 19.3 0.12 0.4 2.373 3.6 6.121 186 1 0.79 71 2375
5 35 19.3 0.12 0.4 2.373 3.6 6.121 186 1 1.07 92 3174
6 33 19.3 0.12 0.4 2.373 3.6 6.121 186 1 1.34 112 3701
7 34 19.3 0.12 0.4 2.373 3.6 6.121 186 1 0.85 75 2585
8 31 19.3 0.12 0.4 2.373 3.6 6.121 186 1 0.79 71 2169
9 40 19.3 0.12 0.4 2.373 3.6 6.121 186 1 1.34 114 4522
10 113 19.3 0.12 0.4 2.373 3.6 6.121 186 1 0.95 88 9865
11 113 19.3 0.12 0.4 2.373 3.6 6.121 186 1 1.34 119 13446
12 33 19.3 0.12 0.4 2.373 3.6 6.121 186 1 1.07 92 3018
13 33 19.3 0.12 0.4 2.373 3.6 6.121 186 1 1.07 92 3072
14 33 19.3 0.12 0.4 2.373 3.6 6.121 186 1 1.07 92 3037
15 35 19.3 0.12 0.4 2.373 3.6 6.121 186 1 1.07 92 3175
16 33 19.3 0.12 0.4 2.373 3.6 6.121 186 1 1.07 92 3037
17 33 19.3 0.12 0.4 2.373 3.6 6.121 186 1 1.34 112 3652
18 40 19.3 0.12 0.4 2.373 3.6 6.121 186 1 1.07 92 3692
Level 5 - 37 30748 2830433
Roof 2092 19.3 0.88 0.0 1.302 22 46268
OTTV 87.8
Table 45: OTTV of the existing building 5

98
5.1.3. Annual cooling energy
By simulating the building with above parameters in the DesignBuilder software the annual cooling energy
of the building was found.
Annual cooling energy = 33200 MWh
5.2. OTTV and annual cooling energy for modified building:
Introduction of double layer glazing for the windows.
5.2.1 U values of the window glazing
Double layer glasses were introduced to windows and the material properties are same as the section 1.2.1.
5.2.2. Calculation of OTTV
Following table shows the calculation of OTTV.

99
Floor Wall Area ∆Teq α WWR Uw ∆T Uf SF SC CF OTTVi Ai*OTTVi
Level 1
1 340 19.3 0.12 0.40 2.373 3.6 2.761 186 1 0.95 78 26471
2 59 19.3 0.12 0.40 2.373 3.6 2.761 186 1 0.93 76 4542
3 74 19.3 0.12 0.40 2.373 3.6 2.761 186 1 0.9 74 5520
4 34 19.3 0.12 0.40 2.373 3.6 2.761 186 1 0.85 71 2383
5 34 19.3 0.12 0.40 2.373 3.6 2.761 186 1 0.79 66 2213
6 35 19.3 0.12 0.40 2.373 3.6 2.761 186 1 1.07 87 3006
7 33 19.3 0.12 0.40 2.373 3.6 2.761 186 1 1.34 107 3541
8 34 19.3 0.12 0.40 2.373 3.6 2.761 186 1 0.85 71 2419
9 31 19.3 0.12 0.40 2.373 3.6 2.761 186 1 0.79 66 2021
10 33 19.3 0.12 0.40 2.373 3.6 2.761 186 1 1.07 87 2858
11 33 19.3 0.12 0.40 2.373 3.6 2.761 186 1 1.07 87 2910
12 33 19.3 0.12 0.40 2.373 3.6 2.761 186 1 1.07 87 2876
13 35 19.3 0.12 0.40 2.373 3.6 2.761 186 1 1.07 87 3007
14 33 19.3 0.12 0.40 2.373 3.6 2.761 186 1 1.07 87 2877
15 33 19.3 0.12 0.40 2.373 3.6 2.761 186 1 1.34 107 3494
16 74 19.3 0.12 0.40 2.373 3.6 2.761 186 1 1.34 107 7955
Level 2,3 1216 103245
Level 4
1 114 19.3 0.12 0.40 2.373 3.6 2.761 186 1 0.95 78 8882
2 113 19.3 0.12 0.40 2.373 3.6 2.761 186 1 0.93 76 8629
3 34 19.3 0.12 0.40 2.373 3.6 2.761 186 1 0.85 71 2383
4 34 19.3 0.12 0.40 2.373 3.6 2.761 186 1 0.79 66 2213
5 35 19.3 0.12 0.40 2.373 3.6 2.761 186 1 1.07 87 3006
6 33 19.3 0.12 0.40 2.373 3.6 2.761 186 1 1.34 107 3541
7 34 19.3 0.12 0.40 2.373 3.6 2.761 186 1 0.85 71 2419
8 31 19.3 0.12 0.40 2.373 3.6 2.761 186 1 0.79 66 2021
9 40 19.3 0.12 0.40 2.373 3.6 2.761 186 1 1.34 107 4234
10 113 19.3 0.12 0.40 2.373 3.6 2.761 186 1 0.95 78 8770
11 113 19.3 0.12 0.40 2.373 3.6 2.761 186 1 1.34 107 12071
12 33 19.3 0.12 0.40 2.373 3.6 2.761 186 1 1.07 87 2858
13 33 19.3 0.12 0.40 2.373 3.6 2.761 186 1 1.07 87 2910
14 33 19.3 0.12 0.40 2.373 3.6 2.761 186 1 1.07 87 2876
15 35 19.3 0.12 0.40 2.373 3.6 2.761 186 1 1.07 87 3007
16 33 19.3 0.12 0.40 2.373 3.6 2.761 186 1 1.07 87 2877
17 33 19.3 0.12 0.40 2.373 3.6 2.761 186 1 1.34 107 3494
18 40 19.3 0.12 0.40 2.373 3.6 2.761 186 1 1.07 87 3497
Level 5 - 37 30748 2629682
Roof 2092 19.3 0.88 0 1.302 22 46268
OTTV 81.8
Table 46: OTTV of the modified building 5

100
5.2.3. Annual cooling energy
By simulating the building with above parameters in the DesignBuilder software the annual cooling energy
of the building was found.
Annual cooling energy = 33091 MWh
5.3. OTTV and annual cooling energy for modified building:
Introduce wall with insulation
5.3.1 U values of the wall material
Burned brick wall with insulations were introduced to walls to reduce the OTTV. Properties of the
modified wall are same as the section 1.2.2.
5.3.2. Calculation of OTTV
Below table shows the calculation of OTTVs of modified building.

101
Floor Wall Area ∆Teq α WWR Uw ∆T Uf SF SC CF OTTVi Ai*OTTVi
Level 1
1 340 19.3 0.12 0.4 1.251 3.6 6.121 186 1 0.95 81 27584
2 59 19.3 0.12 0.4 1.251 3.6 6.121 186 1 0.93 80 4737
3 74 19.3 0.12 0.4 1.251 3.6 6.121 186 1 0.9 78 5764
4 34 19.3 0.12 0.4 1.251 3.6 6.121 186 1 0.85 74 2494
5 34 19.3 0.12 0.4 1.251 3.6 6.121 186 1 0.79 69 2323
6 35 19.3 0.12 0.4 1.251 3.6 6.121 186 1 1.07 90 3120
7 33 19.3 0.12 0.4 1.251 3.6 6.121 186 1 1.34 110 3649
8 34 19.3 0.12 0.4 1.251 3.6 6.121 186 1 0.85 74 2531
9 31 19.3 0.12 0.4 1.251 3.6 6.121 186 1 0.79 69 2121
10 33 19.3 0.12 0.4 1.251 3.6 6.121 186 1 1.07 90 2966
11 33 19.3 0.12 0.4 1.251 3.6 6.121 186 1 1.07 90 3020
12 33 19.3 0.12 0.4 1.251 3.6 6.121 186 1 1.07 90 2985
13 35 19.3 0.12 0.4 1.251 3.6 6.121 186 1 1.07 90 3121
14 33 19.3 0.12 0.4 1.251 3.6 6.121 186 1 1.07 90 2985
15 33 19.3 0.12 0.4 1.251 3.6 6.121 186 1 1.34 110 3601
16 74 19.3 0.12 0.4 1.251 3.6 6.121 186 1 1.34 110 8199
Level 2,3
1895 162401
Level 4
1 114 19.3 0.12 0.4 1.251 3.6 6.121 186 1 0.95 81 9256
2 113 19.3 0.12 0.4 1.251 3.6 6.121 186 1 0.93 80 8999
3 34 19.3 0.12 0.4 1.251 3.6 6.121 186 1 0.85 74 2494
4 34 19.3 0.12 0.4 1.251 3.6 6.121 186 1 0.79 69 2323
5 35 19.3 0.12 0.4 1.251 3.6 6.121 186 1 1.07 90 3120
6 33 19.3 0.12 0.4 1.251 3.6 6.121 186 1 1.34 110 3649
7 34 19.3 0.12 0.4 1.251 3.6 6.121 186 1 0.85 74 2531
8 31 19.3 0.12 0.4 1.251 3.6 6.121 186 1 0.79 69 2121
9 40 19.3 0.12 0.4 1.251 3.6 6.121 186 1 1.34 110 4363
10 113 19.3 0.12 0.4 1.251 3.6 6.121 186 1 0.95 81 9139
11 113 19.3 0.12 0.4 1.251 3.6 6.121 186 1 1.34 110 12441
12 33 19.3 0.12 0.4 1.251 3.6 6.121 186 1 1.07 90 2966
13 33 19.3 0.12 0.4 1.251 3.6 6.121 186 1 1.07 90 3020
14 33 19.3 0.12 0.4 1.251 3.6 6.121 186 1 1.07 90 2985
15 35 19.3 0.12 0.4 1.251 3.6 6.121 186 1 1.07 90 3121
16 33 19.3 0.12 0.4 1.251 3.6 6.121 186 1 1.07 90 2985
17 33 19.3 0.12 0.4 1.251 3.6 6.121 186 1 1.34 110 3601
18 40 19.3 0.12 0.4 1.251 3.6 6.121 186 1 1.07 90 3629
Level 5 - 37
30748 2730512
Roof 2092 19.3 0.88 0 1.302 22 46268
OTTV 84.8
Table 47: OTTV of the modified building 5

102
5.3.3. Annual cooling energy
By simulating the building with above parameters in the DesignBuilder software the annual cooling energy
of the building was found.
Annual cooling energy = 32962 MWh
5.4. OTTV and annual cooling energy for modified building:
Introduction of roof with insulation
5.4.1 U values of the roof material
Insulations were introduced to roofs to reduce the OTTV. Properties of the modified roof are same as the
section 1.2.2.
5.4.2. Calculation of OTTV
Below table shows the calculation of OTTVs of modified building.

103
Floor Wall Area ∆Teq α WWR Uw ∆T Uf SF SC CF OTTVi Ai*OTTVi
Level 1
1 340 19.3 0.12 0.4 2.373 3.6 6.121 186 1 0.95 83 28114
2 59 19.3 0.12 0.4 2.373 3.6 6.121 186 1 0.93 81 4829
3 74 19.3 0.12 0.4 2.373 3.6 6.121 186 1 0.9 79 5880
4 34 19.3 0.12 0.4 2.373 3.6 6.121 186 1 0.85 75 2547
5 34 19.3 0.12 0.4 2.373 3.6 6.121 186 1 0.79 71 2375
6 35 19.3 0.12 0.4 2.373 3.6 6.121 186 1 1.07 92 3174
7 33 19.3 0.12 0.4 2.373 3.6 6.121 186 1 1.34 112 3701
8 34 19.3 0.12 0.4 2.373 3.6 6.121 186 1 0.85 75 2585
9 31 19.3 0.12 0.4 2.373 3.6 6.121 186 1 0.79 71 2169
10 33 19.3 0.12 0.4 2.373 3.6 6.121 186 1 1.07 92 3018
11 33 19.3 0.12 0.4 2.373 3.6 6.121 186 1 1.07 92 3072
12 33 19.3 0.12 0.4 2.373 3.6 6.121 186 1 1.07 92 3037
13 35 19.3 0.12 0.4 2.373 3.6 6.121 186 1 1.07 92 3175
14 33 19.3 0.12 0.4 2.373 3.6 6.121 186 1 1.07 92 3037
15 33 19.3 0.12 0.4 2.373 3.6 6.121 186 1 1.34 112 3652
16 74 19.3 0.12 0.4 2.373 3.6 6.121 186 1 1.34 112 8315
Level 2,3 1895 165356
Level 4
1 114 19.3 0.12 0.4 2.373 3.6 6.121 186 1 0.95 83 9433
2 113 19.3 0.12 0.4 2.373 3.6 6.121 186 1 0.93 81 9175
3 34 19.3 0.12 0.4 2.373 3.6 6.121 186 1 0.85 75 2547
4 34 19.3 0.12 0.4 2.373 3.6 6.121 186 1 0.79 71 2375
5 35 19.3 0.12 0.4 2.373 3.6 6.121 186 1 1.07 92 3174
6 33 19.3 0.12 0.4 2.373 3.6 6.121 186 1 1.34 112 3701
7 34 19.3 0.12 0.4 2.373 3.6 6.121 186 1 0.85 75 2585
8 31 19.3 0.12 0.4 2.373 3.6 6.121 186 1 0.79 71 2169
9 40 19.3 0.12 0.4 2.373 3.6 6.121 186 1 1.34 112 4425
10 113 19.3 0.12 0.4 2.373 3.6 6.121 186 1 0.95 83 9314
11 113 19.3 0.12 0.4 2.373 3.6 6.121 186 1 1.34 112 12617
12 33 19.3 0.12 0.4 2.373 3.6 6.121 186 1 1.07 92 3018
13 33 19.3 0.12 0.4 2.373 3.6 6.121 186 1 1.07 92 3072
14 33 19.3 0.12 0.4 2.373 3.6 6.121 186 1 1.07 92 3037
15 35 19.3 0.12 0.4 2.373 3.6 6.121 186 1 1.07 92 3175
16 33 19.3 0.12 0.4 2.373 3.6 6.121 186 1 1.07 92 3037
17 33 19.3 0.12 0.4 2.373 3.6 6.121 186 1 1.34 112 3652
18 40 19.3 0.12 0.4 2.373 3.6 6.121 186 1 1.07 92 3692
Level 5 - 37 30748 2778452
Roof 2092 19.3 0.88 0 0.15 3 5330
Total 36614 3116011
OTTV 85.1
Table 48: OTTV of the modified building 5

104
5.4.3. Annual cooling energy
By simulating the building with above parameters in the DesignBuilder software the annual cooling energy
of the building was found.
Annual cooling energy = 33175 MWh
5.5. OTTV and annual cooling energy for modified building:
Introduce insulations to walls and roof, in order to achieve the
maximum U values for facades and roofs specified in Building Code
5.5.1 U values of the wall and roof materials
Insulated building wall and roof were introduced to achieve the maximum U value specified in the code.
The properties of these materials are same as section 2.5.1.
5.5.2. Calculation of OTTV
Below table shows the calculation of OTTVs of modified building.

105
Floor Wall Area ∆Teq α WWR Uw ∆T Uf SF SC CF OTTVi Ai*OTTVi
1
1 340 19.3 0.12 0.4 0.45 3.6 6.121 186 1 0.95 80 27207
2 59 19.3 0.12 0.4 0.45 3.6 6.121 186 1 0.93 79 4671
3 74 19.3 0.12 0.4 0.45 3.6 6.121 186 1 0.9 76 5681
4 34 19.3 0.12 0.4 0.45 3.6 6.121 186 1 0.85 73 2457
5 34 19.3 0.12 0.4 0.45 3.6 6.121 186 1 0.79 68 2285
6 35 19.3 0.12 0.4 0.45 3.6 6.121 186 1 1.07 89 3081
7 33 19.3 0.12 0.4 0.45 3.6 6.121 186 1 1.34 109 3612
8 34 19.3 0.12 0.4 0.45 3.6 6.121 186 1 0.85 73 2493
9 31 19.3 0.12 0.4 0.45 3.6 6.121 186 1 0.79 68 2087
10 33 19.3 0.12 0.4 0.45 3.6 6.121 186 1 1.07 89 2930
11 33 19.3 0.12 0.4 0.45 3.6 6.121 186 1 1.07 89 2982
12 33 19.3 0.12 0.4 0.45 3.6 6.121 186 1 1.07 89 2948
13 35 19.3 0.12 0.4 0.45 3.6 6.121 186 1 1.07 89 3082
14 33 19.3 0.12 0.4 0.45 3.6 6.121 186 1 1.07 89 2948
15 33 19.3 0.12 0.4 0.45 3.6 6.121 186 1 1.34 109 3565
16 74 19.3 0.12 0.4 0.45 3.6 6.121 186 1 1.34 109 8116
2,3 1895 160292
4
1 114 19.3 0.12 0.4 0.45 3.6 6.121 186 1 0.95 80 9129
2 113 19.3 0.12 0.4 0.45 3.6 6.121 186 1 0.93 79 8873
3 34 19.3 0.12 0.4 0.45 3.6 6.121 186 1 0.85 73 2457
4 34 19.3 0.12 0.4 0.45 3.6 6.121 186 1 0.79 68 2285
5 35 19.3 0.12 0.4 0.45 3.6 6.121 186 1 1.07 89 3081
6 33 19.3 0.12 0.4 0.45 3.6 6.121 186 1 1.34 109 3612
7 34 19.3 0.12 0.4 0.45 3.6 6.121 186 1 0.85 73 2493
8 31 19.3 0.12 0.4 0.45 3.6 6.121 186 1 0.79 68 2087
9 40 19.3 0.12 0.4 0.45 3.6 6.121 186 1 1.34 109 4319
10 113 19.3 0.12 0.4 0.45 3.6 6.121 186 1 0.95 80 9013
11 113 19.3 0.12 0.4 0.45 3.6 6.121 186 1 1.34 109 12315
12 33 19.3 0.12 0.4 0.45 3.6 6.121 186 1 1.07 89 2930
13 33 19.3 0.12 0.4 0.45 3.6 6.121 186 1 1.07 89 2982
14 33 19.3 0.12 0.4 0.45 3.6 6.121 186 1 1.07 89 2948
15 35 19.3 0.12 0.4 0.45 3.6 6.121 186 1 1.07 89 3082
16 33 19.3 0.12 0.4 0.45 3.6 6.121 186 1 1.07 89 2948
17 33 19.3 0.12 0.4 0.45 3.6 6.121 186 1 1.34 109 3565
18 40 19.3 0.12 0.4 0.45 3.6 6.121 186 1 1.07 89 3584
5 - 37 30748 2696288
Roof 2092 19.3 0.88 0 0.4 7 14214
OTTV 82.8
Table 49: OTTV of the modified building 5
5.5.3. Annual cooling energy
By simulating the building with above parameters in the DesignBuilder software the annual cooling energy
of the building was found.
Annual cooling energy = 33107 MWh

106
ANNEXURE 2: Cost of Building Materials
Work item Unit Current Rate, Rs.
Reinforcement ton 106,049.44
Formwork m2 739.04
Wall materials
Brick work (225mm thick) m2 2,310.34
Brick work (112mm thick) m2 1,721.12
Block work (200 mm thick) m2 1,646.80
Block work (150 mm thick) m2 1,314.89
Block work (100 mm thick) m2 1,185.50
Internal Plastering m2 490.42
External Plastering m2 561.13
Glazing materials
Tempered Glass (5mm thick) m2 3,225.81
Tempered Glass (6mm thick) m2 3,763.44
Tempered Glass (8mm thick) m2 4,032.26
Tempered Glass (10mm thick) m2 4,569.89
Tempered Glass (12mm thick) m2 4,838.71
3mm Clear Glass m2 2,500.00
Dbl LoE (3mm/13mm Arg) Glass m2 5,250.00
Trp LoE Glass m2 7,875.00
Roofing materials
Concrete (Slab) m3 12,037.97
Cast Concrete (100mm thick) m2 1,203.80
SnAl Galvanized sheets (3' x 1') m2 645.16
Asbestos sheets (3.5' x 6') m2 576.04
Asbestos sheets (3.5' x 8') m2 585.64
Asbestos sheets (3.5' x 10') m2 568.36
Asbestos sheets (3.5' x 12') m2 568.36
Al Sheet m2 1,500.00
Clay tile (25*35) m2 800.00
Asphalt (19mm) m2 1,500.00
Roofing felt m2 100.00
Insulation materials
Mcfoil (2mm thick) m2 100.00
Mcfoil (3mm thick) m2 143.00
XPS foam board (205mm thick) m2 2,706.00
XPS foam board (65mm thick) m2 858.00
Fiber board (13mm thick) m2 855.00
Fiber board (9mm thick) m2 712.50
Related Documents