Analysis of a Rotatable Wind Turbine Tower by means of Aero-Servo-Elastic Load Simulations ACHIM STRUVE

Welcome message from author
This document is posted to help you gain knowledge. Please leave a comment to let me know what you think about it! Share it to your friends and learn new things together.
Transcript
Analysis of a Rotatable Wind Turbine Tower by means of Aero-Servo-Elastic Load Simulations
ACHIM STRUVE
Anal
ysis
of
a Ro
tata
ble
Win
d Tu
rbin
e To
wer
ACH
IM S
TRU
VE


Achim Struve
Analysis of a Rotatable Wind Turbine Tower by means of Aero-Servo-Elastic Load Simulations

BAnd 11
Versuchsanstalt für Stahl, Holz und SteineBerichte zum Stahl- und Leichtbau
Analysis of a Rotatable Wind Turbine Tower by means of Aero-Servo-Elastic Load Simulations
by Achim Struve
Print on demand 2021 – Gedruckt auf FSC-zertifiziertem Papier
ISSn 2198-7912ISBn 978-3-7315-1045-1 dOI 10.5445/KSP/1000123255
This document – excluding the cover, pictures and graphs – is licensed under a Creative Commons Attribution-Share Alike 4.0 International License (CC BY-SA 4.0): https://creativecommons.org/licenses/by-sa/4.0/deed.en
The cover page is licensed under a Creative CommonsAttribution-No Derivatives 4.0 International License (CC BY-ND 4.0):https://creativecommons.org/licenses/by-nd/4.0/deed.en
Impressum
Karlsruher Institut für Technologie (KIT) KIT Scientific Publishing Straße am Forum 2 d-76131 Karlsruhe
KIT Scientific Publishing is a registered trademark of Karlsruhe Institute of Technology. Reprint using the book cover is not allowed.
www.ksp.kit.edu
Karlsruher Institut für TechnologieVersuchsanstalt für Stahl, Holz und Steine
Analysis of a Rotatable Wind Turbine Tower by means of Aero-Servo-Elastic Load Simulations
Zur Erlangung des akademischen Grades eines doktor-Ingenieurs von der KIT-Fakultät für Bauingenieur-, Geo- und Umweltwissenschaften des Karlsruher Instituts für Technologie (KIT) genehmigte dissertation
von Achim Struve, M.Eng.
Tag der mündlichen Prüfung: 14. Juli 2020Hauptreferent: Prof. dr.-Ing. Thomas UmmenhoferKorreferent: Prof. dr.-Ing. Torsten FaberKorreferent: Prof. dr.-Ing. Peter Knödel


Acknowledgement
This work was written throughout my time as scholarship holder of the Energie und Kli-maschutzgesellschaft Schleswig-Holstein (EKSH) and scientific assistant of the Wind EnergyTechnology Institute (WETI) of the University of Applied Sciences Flensburg. Besides, I wasexternal postgraduate at the Karlsruhe Institute of Technology (KIT).
Special thanks go to Prof. Dr.-Ing. Torsten Faber, who gave me the theme for this work andprovided me an employment as scientific assistant at the WETI. His trust in me, the access tohis network of professionals, and his support have been crucial for the success of this work.
Another special thanks go to Prof. Dr.-Ing. Thomas Ummenhofer, who accepted me as anexternal postgraduate at the KIT. His trust in me and the many advices regarding light weightsteel structures have been important for the success of this work.
Thanks go to Jason Jonkman, Ph.D. and Rick Damiani, Ph.D from the National RenewableEnergy Laboratory (NREL)U.S. for provision of an internship in their institution from Februaryto April 2017. Furthermore, they helped me in the understanding of the aero-servo-elastic loadsimulation environment FAST and its submodule SubDyn.
Thanks for technical and encouraging conversations throughout the writing of the dissertationgo to Dr. Peter Maulshagen, Prof. Dr. Clemens Jauch, Prof. Dr. Alois Schaffarczyk, and Prof.Dr.-Ing. Peter Knödel.
Thanks for the provision of a three year postgraduate scholarship goes to the EKSH andespecially to Dr. Klaus Wortmann and Stefan Sievers. The postgraduate scholarship enabledme to work much more on the dissertation in a shorter period of time, than it would have beenwithout it.
Moreover, I thank my wife Nadine and my daughter Elisa that they gave me time to work on thedissertation and that they supported me with encouragement and love. Thanks go to my parentsElke and Jens for their encouragement and especially to my joy and saviour, Jesus Christ.
i

Abstract
This work contributes to the improvement of renewable energy competitiveness over conven-tional fossil and nuclear energy sources. It highlights how the costs and CO2-emissions ofland-based wind turbines can be reduced as a result of an innovative and material efficient sup-port structure concept. The fundamental approach for the concept is to place the yaw systemat the tower base, allowing the whole wind turbine tower to be rotated so that it always hasthe same alignment as the rotor. This achieves a load-direction-derived design for the towerthrough which material is saved. This work indicates that the material saving potential of arotatable elliptical tower compared to a conventional circular one is limited. The reason for thatis found in the transport constraints through bridges and tunnels, which apply likewise to ellip-tical tubular towers. A rotatable lattice tower is more convenient because its size is not limitedthrough transport, and lattice towers are material saving concepts for the trend to larger hubheights. This work shows that the ability to rotate the tower enables wider leg distances alongthe blades passing lattice tower section, whereby local member loads are reduced, and materialcan be saved. Furthermore, a tower inclination against the main wind direction was introducedto induce counter acting moments, which reduce the extreme loads and achieve more materialsavings. Moreover, a vertical rotor alignment was realized through the increased blades tipdistance to the inclined tower and the wind turbine became more efficient. The potential of therotatable inclined lattice tower concept was analysed by means of aero-servo-elastic load simu-lations in the FAST environment. Since the convenient linear beam finite element submodule,SubDyn, had no capability to represent other member cross sections than circular ones, it wasadjusted. In the present case, the beam element stiffness andmass matrix formulations had to bechanged to account for arbitrary cross sections. Furthermore, the direction cosine matrices hadto be expanded to provide the control over lattice member alignments around their length axes.A validation of the general aero-servo-elastic analysis procedure and the changes in SubDynensured reliable results.
The aero-servo-elastic load simulations and an appropriate load post processing are the maintools for a rotatable inclined lattice tower design according to IEC 61400-1 and to DNV GLstandards. This includes the consideration of relevant design load cases and the ultimate, thefatigue, and the serviceability limit states. A balance between saved material costs, tower topyaw system costs, increased wind turbine efficiency, and increased tower base yaw system andfoundation costs revealed significant cost savings. Under the assumptions made, the savingsof the rotatable inclined lattice tower amounted to 45 kAC at 80 m to 768 kAC at 175 m hubheight compared to the most cost-effective conventional alternatives for a 5 MW referencewind turbine. This implies 8 % and 49 % in cost savings and indicates the big economicalpotential of land-based innovative rotatable inclined lattice towers for larger hub heights undertransport constraints.
iii

Kurzfassung
DieseArbeit trägt zurVerbesserung derWettbewerbsfähigkeit erneuerbarer Energien gegenüberkonventionellen fossilen und nuklearen Energiequellen bei. Sie zeigt auf, wie die Kostenund CO2-Emissionen von Onshore-Windenergieanlagen durch ein materialeffizientes und in-novatives Tragstrukturkonzept reduziert werden können. Der grundlegende Ansatz für dasKonzept besteht darin, das Giersystem am Turmfuß zu platzieren, sodass der gesamte Turmder Windenergieanlage gedreht werden kann und er immer dieselbe Ausrichtung wie der Rotorhat. Dadurch wird für den Turm ein von der Lastrichtung abgeleitetes Design möglich, welchesMaterialeinsparungen zur Folge hat. Diese Arbeit offenbart, dass das Materialeinsparpotenzialeines drehbaren elliptischen Turms im Vergleich zu einem konventionellen runden Turm be-grenzt ist. Der Grund dafür liegt in den Transportbeschränkungen durch Brücken und Tunnel,die ebenfalls für elliptische Rohrtürme gelten. Ein drehbarer Gitterturm ist somit eine gutealternative, da seine Größe nicht durch den Transport begrenzt ist und Gittertürme ohnehinmaterialsparende Konzepte für den Trend zu größeren Nabenhöhen sind. Die Arbeit zeigt, dasssolch ein Turm größere Stielabstände entlang des oberen Turmabschnitts, an dem die Rotor-blätter passieren, ermöglicht. Hierdurch wird die Belastung der Stäbe reduziert und Materialeingespart. Darüber hinaus wurde eine Turmneigung gegen die Hauptwindrichtung einge-führt, um gegenwirkende Momente zu induzieren, die die Extremlasten reduzieren und nochmehr Materialeinsparungen erzielen. Außerdem wurde eine vertikale Ausrichtung des Rotorsdurch den erhöhten Blattspitzenabstand zum geneigten Turm erreicht, wodurch die Effizienz derWindenergieanlage zunahm. Das Potenzial des drehbaren geneigten Gitterturmkonzepts wurdemittels aero-servo-elastischer Lastsimulationen in der dafür gut geeigneten FAST-Umgebunganalysiert. Da das Subdyn-Modul mit seinem Linearen-Balken-Finite-Elemente-Ansatz keineanderen Querschnitte als kreisförmige repräsentieren konnte, wurde es angepasst. Im vor-liegenden Fall mussten die Balken Steifigkeits- und Massenmatrixformulierungen geändertwerden, um beliebige Querschnitte zu berücksichtigen. Außerdem mussten die Richtungskos-inusmatrizen erweitert werden, um die Ausrichtung der Balkenelemente um ihre Längsachsenzu steuern. Eine Validierung der aero-servo-elastischen Lastberechnung und der nötigen Än-derungen in SubDyn stellten die Zuverlässigkeit der Ergebnisse sicher.
Die aero-servo-elastischen Lastsimulationen und eine geeignete Transformation der Lastenin Ausnutzungsgrade sind die Hauptwerkzeuge für die Auslegung eines drehbaren geneigtenGitterturms gemäß IEC 61400-1 und den DNV GL-Standards. Dies beinhaltet die Berück-sichtigung relevanter Lastfälle und der Grenzzustände der Tragfähigkeit, der Ermüdung undder Gebrauchstauglichkeit. Eine Bilanzierung zwischen eingesparten Turmmaterialkosten,eingesparten Kosten für das Giersystem am Turmkopf, Mehreinnahmen durch die erhöhte Ef-fizienz der Windenergieanlage sowie erhöhten Kosten für das Giersystem am Turmfuß undden erhöhten Fundamentkosten ergab signifikante Kosteneinsparungen. Unter den gemachten
v

Kurzfassung
Annahmen beliefen sich die Einsparungen des drehbaren geneigten Gitterturms auf 45.000Euro bei 80 m bis 768.000 Euro bei 175 m Nabenhöhe, im Vergleich zu den kostengünstigstenkonventionellen Alternativen, für eine 5 MW Referenzanlage. Dies bedeutet entsprechend 8 %und 49 % Kosteneinsparungen und zeigt das enorme wirtschaftliche Potenzial von innova-tiven drehbaren geneigten Onshore-Gittertürmen mit großen Nabenhöhen unter den üblichenTransportbeschränkungen.
vi
Contents
Acknowledgement . . . . . . . . . . . . . . . . . . . . . . . . . . . . . . . . . . . i
Abstract . . . . . . . . . . . . . . . . . . . . . . . . . . . . . . . . . . . . . . . . . iii
Kurzfassung . . . . . . . . . . . . . . . . . . . . . . . . . . . . . . . . . . . . . . v
1 Introduction . . . . . . . . . . . . . . . . . . . . . . . . . . . . . . . . . . . . . 11.1 Historical Background . . . . . . . . . . . . . . . . . . . . . . . . . . . . . 11.2 Motivation . . . . . . . . . . . . . . . . . . . . . . . . . . . . . . . . . . . . 21.3 Problem Description . . . . . . . . . . . . . . . . . . . . . . . . . . . . . . 21.4 Limitations . . . . . . . . . . . . . . . . . . . . . . . . . . . . . . . . . . . 41.5 Document Structure . . . . . . . . . . . . . . . . . . . . . . . . . . . . . . . 5
2 State of the Art . . . . . . . . . . . . . . . . . . . . . . . . . . . . . . . . . . . 72.1 Fundamentals of Wind Energy Conversion . . . . . . . . . . . . . . . . . . . 7
2.1.1 Wind . . . . . . . . . . . . . . . . . . . . . . . . . . . . . . . . . . 72.1.2 Wind Energy Conversion . . . . . . . . . . . . . . . . . . . . . . . . 82.1.3 Wind Turbine Components . . . . . . . . . . . . . . . . . . . . . . . 10
2.2 Tower Assessment . . . . . . . . . . . . . . . . . . . . . . . . . . . . . . . . 132.2.1 Prevailing Standards . . . . . . . . . . . . . . . . . . . . . . . . . . 132.2.2 Design Load Cases of the IEC 61400-1 . . . . . . . . . . . . . . . . 142.2.3 Other Design Load Cases . . . . . . . . . . . . . . . . . . . . . . . . 192.2.4 Partial Safety Factors . . . . . . . . . . . . . . . . . . . . . . . . . . 192.2.5 Ultimate Limit State . . . . . . . . . . . . . . . . . . . . . . . . . . 212.2.6 Fatigue Limit State . . . . . . . . . . . . . . . . . . . . . . . . . . . 232.2.7 Accidental Limit State . . . . . . . . . . . . . . . . . . . . . . . . . 262.2.8 Serviceability Limit State . . . . . . . . . . . . . . . . . . . . . . . 27
2.3 Foundations . . . . . . . . . . . . . . . . . . . . . . . . . . . . . . . . . . . 282.3.1 Concepts . . . . . . . . . . . . . . . . . . . . . . . . . . . . . . . . 282.3.2 Assessment and Guidelines . . . . . . . . . . . . . . . . . . . . . . . 29
2.4 Manufacturing Technology . . . . . . . . . . . . . . . . . . . . . . . . . . . 292.4.1 Tubular Steel Tower Manufacturing . . . . . . . . . . . . . . . . . . 292.4.2 Lattice Steel Tower Member Manufacturing . . . . . . . . . . . . . . 31
2.5 Transport and Erection . . . . . . . . . . . . . . . . . . . . . . . . . . . . . 31
vii
Contents
2.6 Yaw System . . . . . . . . . . . . . . . . . . . . . . . . . . . . . . . . . . . 322.7 Lattice Towers . . . . . . . . . . . . . . . . . . . . . . . . . . . . . . . . . . 33
2.7.1 Bracing Concepts . . . . . . . . . . . . . . . . . . . . . . . . . . . . 342.7.2 Bracing Member Cross Sections . . . . . . . . . . . . . . . . . . . . 362.7.3 Load Derived Leg Inclination . . . . . . . . . . . . . . . . . . . . . 382.7.4 Leg Cross Sections . . . . . . . . . . . . . . . . . . . . . . . . . . . 392.7.5 Joints . . . . . . . . . . . . . . . . . . . . . . . . . . . . . . . . . . 402.7.6 Aerodynamics . . . . . . . . . . . . . . . . . . . . . . . . . . . . . 422.7.7 Challenges and Solutions . . . . . . . . . . . . . . . . . . . . . . . . 45
2.8 Load Evaluation . . . . . . . . . . . . . . . . . . . . . . . . . . . . . . . . . 472.8.1 Wind Turbine Load Categories . . . . . . . . . . . . . . . . . . . . . 472.8.2 Aero-Servo-Elastic Loadsimulations . . . . . . . . . . . . . . . . . . 492.8.3 Resolved Support Structures in FAST . . . . . . . . . . . . . . . . . 50
2.9 Rotatable Support Structures for Wind Turbines . . . . . . . . . . . . . . . . 542.9.1 Industrial Approaches and Patents . . . . . . . . . . . . . . . . . . . 542.9.2 Scientific State of the Art . . . . . . . . . . . . . . . . . . . . . . . . 57
2.10 Other Related Structural Systems . . . . . . . . . . . . . . . . . . . . . . . . 612.10.1 Railway Turntables . . . . . . . . . . . . . . . . . . . . . . . . . . . 612.10.2 Rotatable Buildings . . . . . . . . . . . . . . . . . . . . . . . . . . . 622.10.3 Mobile Cranes . . . . . . . . . . . . . . . . . . . . . . . . . . . . . 632.10.4 Bucket Wheel Excavators . . . . . . . . . . . . . . . . . . . . . . . 642.10.5 Rotatable Shortwave Antennas . . . . . . . . . . . . . . . . . . . . . 652.10.6 Summary of Findings from Related Systems . . . . . . . . . . . . . . 66
3 Load Analysis of Conventional Designs . . . . . . . . . . . . . . . . . . . . 693.1 Methodological Approach . . . . . . . . . . . . . . . . . . . . . . . . . . . 693.2 Reference Wind Turbine . . . . . . . . . . . . . . . . . . . . . . . . . . . . 693.3 Quasi-Steady Loads Sensitivity to Structural Dimensions . . . . . . . . . . . 713.4 Loads from the Literature . . . . . . . . . . . . . . . . . . . . . . . . . . . . 743.5 ASE Load Analysis of the Reference Wind Turbine . . . . . . . . . . . . . . 76
3.5.1 Validation of ASE Load Analysis Procedure with DLCs 1.x . . . . . 763.5.2 Blade-Stall-Induced Vibrations in Parking DLCs . . . . . . . . . . . 853.5.3 Loads Analysis of all Considered DLCs . . . . . . . . . . . . . . . . 86
4 Load-Direction-Derived Support Structures . . . . . . . . . . . . . . . . . 934.1 Definition of Load-Direction-Derived . . . . . . . . . . . . . . . . . . . . . 934.2 Yaw System and Foundation . . . . . . . . . . . . . . . . . . . . . . . . . . 93
4.2.1 Challenges and Requirements . . . . . . . . . . . . . . . . . . . . . 934.2.2 Concepts . . . . . . . . . . . . . . . . . . . . . . . . . . . . . . . . 94
4.3 Requirements and Structural Aspects . . . . . . . . . . . . . . . . . . . . . . 974.3.1 Cross Sectional Strength . . . . . . . . . . . . . . . . . . . . . . . . 974.3.2 Global Stability . . . . . . . . . . . . . . . . . . . . . . . . . . . . . 97
viii
Contents
4.3.3 Structural Dynamics . . . . . . . . . . . . . . . . . . . . . . . . . . 984.4 Aerodynamics . . . . . . . . . . . . . . . . . . . . . . . . . . . . . . . . . . 100
4.4.1 Forces and Moments Caused by the Wind . . . . . . . . . . . . . . . 1024.4.2 Tower Dam and Shadow . . . . . . . . . . . . . . . . . . . . . . . . 1034.4.3 Gust Induced Vibrations . . . . . . . . . . . . . . . . . . . . . . . . 1054.4.4 Vortex-Induced Vibrations . . . . . . . . . . . . . . . . . . . . . . . 1064.4.5 Flutter . . . . . . . . . . . . . . . . . . . . . . . . . . . . . . . . . . 107
4.5 Methodical Approach for Evaluation of the Tower Concept . . . . . . . . . . 108
5 Rotatable Tubular Concepts . . . . . . . . . . . . . . . . . . . . . . . . . . . 1115.1 Comparison of Tubular Cross Sections . . . . . . . . . . . . . . . . . . . . . 1115.2 Elliptical Tower . . . . . . . . . . . . . . . . . . . . . . . . . . . . . . . . . 112
5.2.1 Strength Analysis . . . . . . . . . . . . . . . . . . . . . . . . . . . . 1145.2.2 Local Shell Buckling . . . . . . . . . . . . . . . . . . . . . . . . . . 1145.2.3 Material Saving Potential of a Cross Section . . . . . . . . . . . . . . 1165.2.4 Aerodynamic Loads on the Elliptical Tower . . . . . . . . . . . . . . 1185.2.5 Material Saving Potential for Towers . . . . . . . . . . . . . . . . . . 121
5.3 Other Tubular Tower Concepts . . . . . . . . . . . . . . . . . . . . . . . . . 1255.3.1 Kamm-back Tower . . . . . . . . . . . . . . . . . . . . . . . . . . . 1255.3.2 Outer Skin Modification . . . . . . . . . . . . . . . . . . . . . . . . 127
6 Rotatable Inclined Lattice Tower Concepts . . . . . . . . . . . . . . . . . . 1296.1 Tower Cross Sectional Concepts . . . . . . . . . . . . . . . . . . . . . . . . 1296.2 Tower Inclination . . . . . . . . . . . . . . . . . . . . . . . . . . . . . . . . 131
6.2.1 Inclination Consequences to Extreme Tower Loads . . . . . . . . . . 1326.2.2 Inclination Consequences to Tower Fatigue . . . . . . . . . . . . . . 1336.2.3 Blade to Tower Clearance . . . . . . . . . . . . . . . . . . . . . . . 1346.2.4 Loads from Gyroscopic Motion . . . . . . . . . . . . . . . . . . . . 138
6.3 Other Concepts . . . . . . . . . . . . . . . . . . . . . . . . . . . . . . . . . 1486.3.1 Divided Hybrid Profile . . . . . . . . . . . . . . . . . . . . . . . . . 1486.3.2 Inclined Guyed Tower . . . . . . . . . . . . . . . . . . . . . . . . . 148
7 Rotatable Inclined Lattice Tower Design . . . . . . . . . . . . . . . . . . . 1517.1 Conceptual Specifications . . . . . . . . . . . . . . . . . . . . . . . . . . . . 151
7.1.1 Shape and Parameters of the Rotatable Inclined Lattice Tower . . . . 1517.1.2 Nacelle Interface . . . . . . . . . . . . . . . . . . . . . . . . . . . . 1557.1.3 Member Sections . . . . . . . . . . . . . . . . . . . . . . . . . . . . 1567.1.4 Conceptual Joint Design . . . . . . . . . . . . . . . . . . . . . . . . 159
7.2 Design as Iterative Process . . . . . . . . . . . . . . . . . . . . . . . . . . . 160
8 Modelling the Rotatable Inclined Lattice Tower in FAST . . . . . . . . . . 1638.1 Modification of SubDyn’s Finite-Element Beam Model . . . . . . . . . . . . 163
ix
Contents
8.1.1 Extension of Structural Matrices . . . . . . . . . . . . . . . . . . . . 1648.1.2 Adaptation of Direction Cosine Matrices . . . . . . . . . . . . . . . 167
8.2 Modelling the Tower in SubDyn . . . . . . . . . . . . . . . . . . . . . . . . 1708.3 Validation of the SubDyn Model . . . . . . . . . . . . . . . . . . . . . . . . 1738.4 Implementation of the SubDyn Model in FAST . . . . . . . . . . . . . . . . 174
8.4.1 Adjustments to the FAST Environment . . . . . . . . . . . . . . . . 1758.4.2 SubDyn Simulation Settings . . . . . . . . . . . . . . . . . . . . . . 177
9 Structural Analysis of a Rotatable Inclined Lattice Tower . . . . . . . . . 1799.1 Choosing Design Parameter Values . . . . . . . . . . . . . . . . . . . . . . . 1799.2 Modal Analysis . . . . . . . . . . . . . . . . . . . . . . . . . . . . . . . . . 181
9.2.1 Mode Shapes . . . . . . . . . . . . . . . . . . . . . . . . . . . . . . 1819.2.2 Campbell Diagram . . . . . . . . . . . . . . . . . . . . . . . . . . . 1829.2.3 Modes Sensitivity to the Tower Inclination . . . . . . . . . . . . . . 184
9.3 ASE Simulation Results of IEC 61400-1 Load Cases . . . . . . . . . . . . . 1859.3.1 Normal Power Production . . . . . . . . . . . . . . . . . . . . . . . 1869.3.2 Loads Sensitivity to the Tower Inclination . . . . . . . . . . . . . . . 1909.3.3 Power Production with Faults in the Control System . . . . . . . . . 1929.3.4 Shut-Down with EOG (Mexican Hat) . . . . . . . . . . . . . . . . . 1949.3.5 Transport and Installation . . . . . . . . . . . . . . . . . . . . . . . 195
9.4 Post Processing Loads . . . . . . . . . . . . . . . . . . . . . . . . . . . . . 1959.4.1 Warping Stresses . . . . . . . . . . . . . . . . . . . . . . . . . . . . 1969.4.2 Considered Stresses . . . . . . . . . . . . . . . . . . . . . . . . . . 2019.4.3 Buckling Analysis . . . . . . . . . . . . . . . . . . . . . . . . . . . 202
9.5 Ultimate Limit State Analysis . . . . . . . . . . . . . . . . . . . . . . . . . . 2039.5.1 Tower Aerodynamic Induced Loads . . . . . . . . . . . . . . . . . . 2039.5.2 Extreme Load Utilization . . . . . . . . . . . . . . . . . . . . . . . . 208
9.6 Fatigue Limit State Analysis . . . . . . . . . . . . . . . . . . . . . . . . . . 2119.6.1 Explaining the Procedure . . . . . . . . . . . . . . . . . . . . . . . . 2119.6.2 Fatigue Utilizations of the C3 RILT . . . . . . . . . . . . . . . . . . 2129.6.3 Periodical Inspection of the C3 RILT . . . . . . . . . . . . . . . . . 214
9.7 Accidental Limit State Analysis . . . . . . . . . . . . . . . . . . . . . . . . 2149.8 Serviceability Limit State Analysis . . . . . . . . . . . . . . . . . . . . . . . 215
9.8.1 Natural Frequency Requirements . . . . . . . . . . . . . . . . . . . . 2159.8.2 Blade Tip to Tower Clearance . . . . . . . . . . . . . . . . . . . . . 215
10 Potential of Rotatable Support Structures . . . . . . . . . . . . . . . . . . 21710.1 Savings through the Material . . . . . . . . . . . . . . . . . . . . . . . . . . 217
10.1.1 Material Usage of Rotatable Inclined Lattice Towers . . . . . . . . . 21710.1.2 Comparison of the Material Usage . . . . . . . . . . . . . . . . . . . 218
10.2 Increased Energy Yield through Tower Inclination . . . . . . . . . . . . . . . 221
x
Contents
10.3 Yaw System Costs . . . . . . . . . . . . . . . . . . . . . . . . . . . . . . . . 22310.4 Economical Potential . . . . . . . . . . . . . . . . . . . . . . . . . . . . . . 224
11 Summary . . . . . . . . . . . . . . . . . . . . . . . . . . . . . . . . . . . . . . 227
12 Outlook . . . . . . . . . . . . . . . . . . . . . . . . . . . . . . . . . . . . . . . 229
13 References . . . . . . . . . . . . . . . . . . . . . . . . . . . . . . . . . . . . . 231
14 Appendix . . . . . . . . . . . . . . . . . . . . . . . . . . . . . . . . . . . . . . 24514.1 Conversation with Clipper Windpower . . . . . . . . . . . . . . . . . . . . . 24514.2 Considered DLCs According to Different References . . . . . . . . . . . . . 24614.3 Statistical Outliers Check in Validation Procedure for RootMyc1 . . . . . . . 24614.4 Summary of Required Simulation Time Periods in Comparison Study . . . . 24814.5 ASE Validation - Relevant FAST Input Files . . . . . . . . . . . . . . . . . 24814.6 ASE Validation - Comparison of Timeseries . . . . . . . . . . . . . . . . . 25514.7 ASE Validation - FAST Tower Aerodynamics Input File . . . . . . . . . . . 25714.8 Rotor Blades Extreme Root Bending Moments Under Different Conditions
and DLCs . . . . . . . . . . . . . . . . . . . . . . . . . . . . . . . . . . . . 25814.9 Extreme Loads from ASE Simulation of the Reference WT . . . . . . . . . . 25914.10 Expertise Survey - Yaw Bearing at WT Tower Base . . . . . . . . . . . . . . 26214.11 Transition between Shells and Plates . . . . . . . . . . . . . . . . . . . . . . 27014.12 Conversation with 5 MW NREL Baseline WT Developer . . . . . . . . . . . 27514.13 Calculating Tower Natural Frequencies by Lagrange’s Equation of Motion . . 27614.14 Polynomial Coefficients for Tower Mass to Tower Height Relation . . . . . . 27814.15 Offer for Lockbolts . . . . . . . . . . . . . . . . . . . . . . . . . . . . . . . 27914.16 Python Script to Solve for the Constant Lattice Tower Bracing Angle . . . . 27914.17 Derivation ofX-BracingMember Intersection Point forArbitrary Lattice Tower
Shapes . . . . . . . . . . . . . . . . . . . . . . . . . . . . . . . . . . . . . 28014.18 SubDyn Rotatable Inclined Lattice Tower Input File . . . . . . . . . . . . . 28314.19 Modelling in RFEM . . . . . . . . . . . . . . . . . . . . . . . . . . . . . . 28614.20 Tower Inclination Sensitivity to Yield Strength Utilizations . . . . . . . . . . 28814.21 Rotatable Inclined Lattice Tower Reynold’s Numbers . . . . . . . . . . . . . 28914.22 Rotatable Inclined Lattice Tower 87.6 m Member Parameters . . . . . . . . . 29014.23 Rotatable Inclined Lattice Tower 87.6 m DLC Utilizations . . . . . . . . . . 29114.24 Rotatable Inclined Lattice Tower 147.6 m Member Parameters . . . . . . . . 29414.25 Rotatable Inclined Lattice Tower 147.6 m Utilizations . . . . . . . . . . . . 295
xi


Nomenclature
The following list shows the abbreviations, greek symbols, latin symbols, mathematical sym-bols, and relevant FAST environmental Parameters, which were used and likewise described inthis work. Not contained abbreviations and symbols are explained throughout the text.
Abbreviations1p, 3p one-per-revolution and three per revolutionASE aero-servo-elasticBEM blade element momentumBU bucklingC1-C6 design cases as given in Table 9.3DNV GL Det Norske Veritas Germanischer LloydDOF degree of freedomECD extreme coherent gust with wind direction changeEDC extreme direction changeEOG extreme operating gustETM extreme turbulence modelEWM extreme wind modelEWS extreme wind shearFA fore-aftFAST fatigue, aerodynamics, structures, and turbulenceFMD flexible multibody dynamicsGEBT geometrically exact beam theoryHiFIT high frequency impact treatmentLDD load-direction-derivedNREL National Renewable Energy LaboratoryNTM normal turbulence modelNWP normal wind profileRILT rotatable inclined lattice towerRNA rotor nacelle assembly
xiii
Nomenclature
SS side-sideTP transition pieceUIT ultrasonic impact treatmentWndDir horizontal wind direction with 0 deg along the global x-axis andmathemat-
ical positive anti-clockwise rotation around the upwards pointing z-axisYS yield strengthGreek Symbolsα power law exponent / buckling curve dependent imperfection coefficientα, β, γ beam element node rotationsα1 curve linear coordinateαAoA angle of attack on an aerodynamic profileαB bracing angleαcr relation of the design load to the ideal buckling loadαPC blade precone angleαST rotor shaft tiltαTI tower inclination angleαTT tower taper angleαω steepness of prescribed yaw acceleration curveβFTB flexural-torsional buckling coefficientχ column buckling reduction factor regarding the considered buckling curve∆σ stress range∆Cfound. foundation cost increase∆IRILT additional money income through vertical rotor alignmentηmech., ηelec. mechanical and electrical efficienciesγf patial safety factor for the type of loadsγM3(,ser) partial safety factor to account for the kind of a joint connectionγm patial safety factor for the materialγn patial safety factor for the consequences of failureγzx, γzy cross sectional shear strains in along its x and y directionsκx, κy beam curvature around x and y axesκz beam torsional twist rateλ lattice structure slendernessΛ1 turbulence length parameterλ1 slenderness to evaluate the slenderness ratioµ friction coefficient / expected statistical value / viscosity coefficientν kinematic viscosity
xiv
Nomenclature
ω angular frequency / sectorial areaλ slenderness ratio of a column buckling memberΦ function for evaluation of χ / Euler angleφ(x, y, z, t) velocity potential functionΨ Euler angleψλ reduction factor to account for finite tower slendernessρ densityσ2 statistic varianceσ1, σ2, σ3 standard deviation of turbulence in longitudinal, lateral, and upward direc-
tionσθ,Rd circumferential buckling stressσm,T mean normal stress on the towers tensile sideσm,W mean normal stress due to structural weightσm mean normal stressσv standard deviation of the turbulenceσx,d, σy,d design normal stresses in x- and y-directionσx,Rd meridian buckling stressτd design shear stressτxθ,Ed shear buckling stressΘ Euler angleθcg wind speed increase for an ECDθe extreme direction change angleΩ
mm×m diagonalmatrix, which represents the eigenfrequencies of the retainedCraig-Bampton eigenmodes
ΦR
transformation matrix for the interior node DOFs with respect to the rigidbody interface motions
Φm
transformation matrix between the Craig-Bampton reduced generalizedDOFs and the original interoir nodes
ϕ eigenvector of a systemε factor in dependence of fyεz cross sectional axial strainϕ lattice structure member density / leg cross sectional angle / angle of attack
on an aerodynamic profileΘb,1 demanded blade one pitch angle positive clockwise around the blades pitch
axis looking from its tip to its rootζ critical damping ratio
xv
Nomenclature
ζ (HD) damping ratio for the platform-heave DOF in HydroDynLatin SymbolsM (ED) RNA and tower mass, modelled in ElastoDynEe beam element orthonormal basisI global coordinate system orthonormal basisL1, L2 line 1 and 2Pproj. beam element cross sectional plane at its start positionPXY global coordinate system XY -planedm/dt mass flowALife average lifetime availability of a WTb mean lattice tower member widthELife average lifetime energy yield of a WTI, J, K global coordinate system orthonormal basis unit vectorsie, je, ke beam element orthonormal basis unit vectorsn1, n2 direction unit vector of line 1 and 2P averaged WT rotor powerSi mean of load cycle i
SF prescribed fixed load meanUL SubDyn internal DOFsUR SubDyn interface DOFsx arithmetic meanA beam element alignment point in spaceA′ projected beam element alignment point in spaceE end point position vector of a beam element in spaceO global coordinate system originS start point position vector of a beam element in spaceÛr velocity vector of a material point in a beam
KBB
substructures equivalent stiffness matrix, referred to the transition piecereference point
MBB
substructures equivalent mass matrix, referred to the transition piece refer-ence point
MBm
matrix partition after Craig-Bampton reduction, referred to the transitionpiece reference point
B strain-displacement matrix
C global damping matrix of a finite element beam system
xvi
Nomenclature
C(HD) HydroDyn 6 × 6 linear damping matrix for the platform DOFs
C1, D
1, F
Y1SubDyn model modal parameter containing matrices for transition pieceload state-space formulation
C2, D
2, F
Y2SubDyn model modal parameter containing matrices for substructuremovement state-space formulation
DΦΘΨ
direction cosine matrix for rotation about all three Euler angles
DΦ, D
Θ, D
Ψdirection cosine matrices for rotation about different Euler angles
Dsys
damping matrix of a system
I identity matrix
K global stiffness matrix of a finite element beam system
Kc
beam cross sectional stiffness matrix
Kel
beam element stiffness matrix
Ksys
system stiffness matrix
M global mass matrix of a finite element beam system
Mc
beam cross sectional mass matrix
Mel
beam element mass matrix
Msys
system mass matrix
N(z) polynomial matrix
Nα
transformation matrix for the generalized beam degrees of freedom
FTP transition piece forces and moments after Craig-Bampton reduction
Fm interior forces and moments, which account only for the Craig-Bamptonretained modes
F nodal external load vector of a finite element beam system / external forcevector of a node
f internal moment vector of a system / beam element load vectorFHDR hydrodynamic forces on boundary nodes in SubDynFL hydrodynamic forces on every interior node in SubDynFTP transition piece loadsg angular moment of inertia vectorh linear moment of inertia vectorM applied external momentsm internal moment vector of a systemPx x-bracing intersection point position vectorqm
modal coefficients for the retained modes
xvii
Nomenclature
U nodal displacement vector of a finite element beam systemu SubDyn input vector / beam element node displacement and rotation vectorUR boundary DOFsx system displacement vectorx0 position vector of a point on a beam curvexleg,left position vector of a leg joint on the left side of the considered x-bracingxleg,right position vector of a leg joint on the right side of the considered x-bracingxnode,incl.,i position vector of inclined tower node i with respect to the global coordinate
systemxnode,i position vector of tower node i with respect to the global coordinate systemY2 SubDyn output vectorA aerodynamically related profile shape area / cross sectional areaa axial induction factor for an actuator disc / amount of support reactionsaB lattice tower bottom lengthAdisc rotor disc areaaM intermediate tower lengthANREL cross sectional area of the bottom reference NREL WT towerAref lattice tower reference area: projected wind attack areaAR rotor areaAT projected tower areaaT lattice tower top lengthAx, Ay, Axy corrected shear areas with respect to cross sectional reference axes x and y
Ael,m,i area of cross sectional element i of member m
Ag,k projected area of joint steel sheet k
B length of an elliptical tower profileb outer dimension of a bracing member / side length of a lattice tower cross
sectionbB lattice tower bottom widthbM intermediate tower widthbT lattice tower top widthbi width of member i / width of the lattice tower at joint i
bL,p,i, bB,p,i projected leg and bracing widths in air flow direction of segment i
C Weibull scale parameter / constantc/t fineness or chord to thickness ratio of an aerodynamic profilec1 length of one-side supported plate sectionC1, C2 integration constants
xviii
Nomenclature
c2 length of two-side supported plate sectioncD drag coefficientcf,0 basic force coefficientcf force coefficientcL lift coefficientcM moment coefficientcP power coefficientcscd structural coefficientcT thrust coefficientCyaw bear. yaw bearing costsCyaw sys. conv. costs of a conventional yaw systemCyaw sys. RILT costs of a yaw system at the tower baseD outer tower diameterd lattice structure width / dimensionless radial distance from the tower centerDc characteristic cumulative damageDextr maximum extrusion moulding profile diameterDrot rotor diameterDT,NREL baseline NREL reference WT tower top diameterdT horizontal distance from tower center line to outer tower surfaceDT, DB top and bottom diameter for a tower with circular cross sectionDyaw bear. yaw bearing diameterDFF design fatigue factordnL amount of elements along a straight part of a cross sectiondnt amount of elements along the thickness of a straight cross sectional partE Young’s moduluse distance from an aerodynamic profile tip to its pressure pointEkin kinetic energyEpot potential energyf frequencyfb,Rd buckling resistance load of the most unfavourable load combination and
imperfectionsfb buckling load of themost unfavourable load combination and imperfectionsFB,FC tower base yaw bearing reaction forcesFcr ideal buckling loadFd design loadFFTB maximum shear force on a beam until flexural-torsional buckling starts
xix
Nomenclature
fL dimensionless frequencyfm reduction factor for hot spot stress rangesFp,C tension force in boltFs,Rd(,ser) slip resistance of bolt connection per boltFt,Ed(,ser) tension force in bolt connection per boltFv,Ed(,ser) shear force in bolt connection per boltfv vortex creation frequencyFw wind force on a structurefy material yield strengthFz,ref Extreme axial tower force from the reference ASE simulationFz force in z-direction - this is often the axial forcef0, j structural eigenfrequency j
Fk,i characteristic load i
fR,i excitation frequency i
Fui , Fvi , Fwi beam element shear forces and axial force of node i
G shear modulusg amount of equilibrium conditions per nodegx, gy, gz gravity components in x−, y−, and z−directionsH width of an elliptical tower profileh outer dimension of a bracing memberHF hat profile one side supported flap lengthHL hat profile two side supported lengthHT,aero artificially increased tower height for aerodynamic tower loadsHT,NREL tower height of the reference NREL WTHT tower heighthi vertical joint distance between joint i − 1 and i
hi,a vertical joint distance between joint i − 1 and i at x-axis parallel sidehi,b vertical joint distance between joint i − 1 and i at y-axis parallel sidei radius of gyrationi2 area stiffness or radius of gyrationImin minimum second area moment of inertia of a cross sectionimin minimum radius of gyration of an assembled profile with small spreadIp polar moment of inertiaIref reference turbulence intensityIt torsional constant
xx
Nomenclature
Iv turbulence intensityIx, Iy, Ixy second area moments of inertia with respect to cross sectional reference
axes x and y
Jω warping constantk Weibull shape parameter / amount of all nodes inclusive support nodes /
wall roughness / slope of a tapered towerkσ,min minimum buckling valueks geometry coefficient to account for the clearance between a hole and a boltkx, kθ , kτ buckling interaction parametersL integral length dimension / beam lengthl lattice structure height / related body dimension for aerodynamic profilesL1 tower base yaw bearing axial support distanceLcr buckling length of a column buckling memberLeXY beam element length, projected to the global XY planeLe beam element lengthLF flap length of a leg profileLL side length of a leg profileLL∗ scaled side length of a leg profilelOH overhang length from the tower top center at height HT + lTS to the blade
root center in the hublshell unsupported shell lengthlTS vertical distance from tower top to the rotor shaftLt reference lengthli length of member i
m Wöhler exponentm1,m2 inverse Wöhler curve slopes for the finite life fatigue strength and fatigue
limit cycle rangesMManwell gyroscopic moment by Manwell et al.Mmax maximum overturning moment at tower baseMT torsional momentMW,y bending moment due to tower wind loads in x directionMx,ref , My,ref Extreme side-side and fore-aft tower bending moments from the reference
ASE simulationMx, My bending moments around x- and y-axesmyaw bear. yaw bearing massMz,q Vlasov torsional moment
xxi
Nomenclature
Mz,SV Saint-Venant torsional momentMαi , Mβi , Mγi beam element bending moments and torsional moment of node i
N number of system degrees of freedomN(S) amount of load cycles until failure under load range S
Nb,Rd member column buckling resistance against axial forceNB number of binsnel number of cross sectional finite elementsNFL,B1 fatigue limit lifetime cycles for detail class B1NLeg number of lattice tower legsnM number of lattice tower membersNnodes number of tower nodesNseg number of bracing segments of a lattice towernST amount of short time load cyclesnS number of cross sectional spots, where stresses were calculatedP rotor powerp amount of all lattice membersp(VH) probability density function for wind speed occurrancesp − 1 highest power of shape function polynomialsPr rated WT powerPw wind powerPW(VH) probability that a wind speed is below VH
q pressureqp gust velocity pressureQW,x accumulated shear force distribution in x directionqW,x shear force distribution in x directionr sum of all constraints between the membersRd design resistanceRk characteristic resistanceRrot rotor radiusRe Reynolds numberS load range / Strouhal numbers amount of independent load components per memberS0 theoretical laod range at N(S) = 0 to model the S-N curveSd design load effectSFL,B1 fatigue limit stress range for detail class B1
xxii
Nomenclature
Sk characteristic load effectSL gust energy as dimensionless spectral densitySRILT,mat. material related cost savings of the RILTsx, sy coordinates on a cross sections where stresses were calculatedSi load range i
SG,i Goodman corrected load range i
SFtm tower mass scaling factorT thrust force / time periodt time / wall thicknessTDL wind turbine design lifetimeTECD time period of extreme coherent gust with direction changeTEDC time period of extreme direction changeTEOG time period of the extreme operating gustTEWS time period of extreme wind shearTL calculated lifetime of a structural componenttL wall thickness of a leg profiletmin,Brace minimumwall thickness of the bracing profile to be not classified as class 4tmin,Leg minimum wall thickness of the leg profile to be not classified as class 4TPII periodical inspection intervaltp thickness of an junction plateu, v, w beam element node displacements / flow velocitiesuwake dimensionless wake velocity deficitV wind speed / beam volumev (ze) current wind speed at the reference height ze
V∞ free stream velocityV1 free stream wind speed before wind turbineV2 wind speed at wind turbine rotor discV4 wind speed downstream of a wind turbine rotor discVave annual mean wind speed at hub heightVcg wind speed increase for an ECDVdiv critical divergence wind speedVe1, Ve50 extreme wind speed with a recurring period of 1 and 50 yearsVeq equivalent wind speed at the towers weighted wind attack pointVgust extreme operating gust wind speedVH wind speed at hub height
xxiii
Nomenclature
Vin,Vout cut-in and cut-out wind speedVm mean wind speed, dependent of the basis wind speed with a mean recurring
period of 50 yearsVref 10 min mean of reference wind speedVr rated wind speedVw current wind speedVx, Vy current stream velocity in x and y directionwp filler plates representative continous widthWx, Wy section modules around x and y axesx, y, z Cartesian coordinatesxs, ys cross sectional shear center coordinates with respect to the reference pointxc,m,i, yc,m,i geometrical center point coordinates of cross sectional element i ofmember
m
z0 roughness heightzH hub heightzmin minimum heightzTip height coordinate of the rotor blade being at the lowest postionzt reference heightMathematical SymbolsÜ• second derivative with respect to timeÛ• first derivative with respect to time∇ nabla operator• unit vector• vector• matrix
• skew symmetric matrix of a vectorT transposeE 〈•〉 expected valueSi , Ci sine and cosie function of argument i
Relevant FAST Environmental ParametersBldPitchn blade n pitch angleGenPwr generator powerIntfFXss transition piece interface reaction force in global X-directionIntfFYss transition piece interface reaction force in global Y-directionIntfFZss transition piece interface reaction force in global Z-directionIntfMXss transition piece interface reaction moment around global X-axis
xxiv
Nomenclature
IntfMYss transition piece interface reaction moment around global Y-axisIntfMZss transition piece interface reaction moment around global Z-axisNacYIner nacelle yaw inertiaPtfmCMxt initial platform displacement in local tower x-directionPtfmCMyt initial platform displacement in local tower y-directionPtfmCMzt initial platform displacement in local tower z-directionPtfmHeave initial platform heave displacementPtfmPIner platform pitch inertiaPtfmPitch initial platform pitch rotationPtfmRIner platform roll inertiaPtfmRoll initial platform roll rotationPtfmSurge initial platform surge displacementPtfmSway initial platform sway displacementPtfmTDxi global tower top displacement in X-directionPtfmTDyi global tower top displacement in Y-directionPtfmYaw initial platform yaw rotationRootMxc1 in-plane blade root bending momentRootMyc1 out-of-plane blade root bending momentRotSpeed rotor speedRotThrust rotor thrustRotTorq rotor torqueTowerBsHt height of the ElastoDyn tower baseTowerHt height of the ElastoDyn towerTwrBrMxt tower top bending moment about its x axisTwrBrMyt tower top bending moment about its y axisTwrBsMxt tower base bending moment about its x axisTwrBsMyt tower base bending moment about its y axisWind1VelX wind speed in global X-directionWind1VelY wind speed in global Y-direction
xxv

1 Introduction
1.1 Historical Background
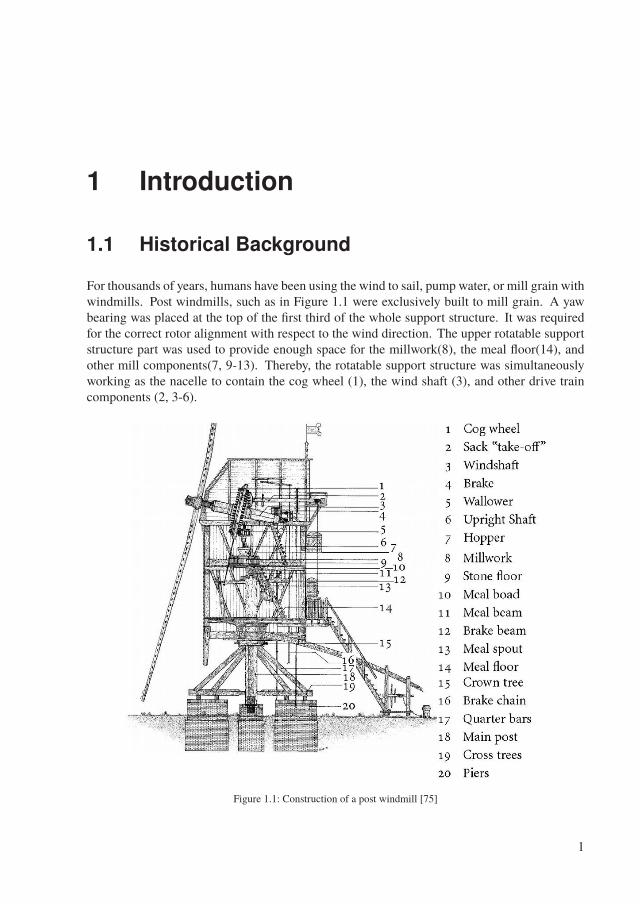
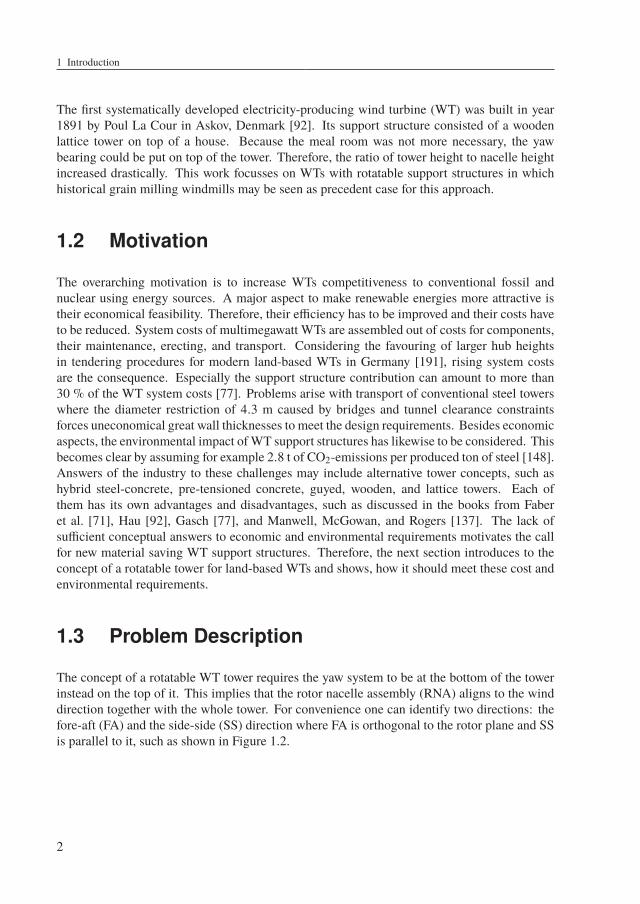
For thousands of years, humans have been using the wind to sail, pump water, or mill grain withwindmills. Post windmills, such as in Figure 1.1 were exclusively built to mill grain. A yawbearing was placed at the top of the first third of the whole support structure. It was requiredfor the correct rotor alignment with respect to the wind direction. The upper rotatable supportstructure part was used to provide enough space for the millwork(8), the meal floor(14), andother mill components(7, 9-13). Thereby, the rotatable support structure was simultaneouslyworking as the nacelle to contain the cog wheel (1), the wind shaft (3), and other drive traincomponents (2, 3-6).
Figure 1.1: Construction of a post windmill [75]
1
1 Introduction
The first systematically developed electricity-producing wind turbine (WT) was built in year1891 by Poul La Cour in Askov, Denmark [92]. Its support structure consisted of a woodenlattice tower on top of a house. Because the meal room was not more necessary, the yawbearing could be put on top of the tower. Therefore, the ratio of tower height to nacelle heightincreased drastically. This work focusses on WTs with rotatable support structures in whichhistorical grain milling windmills may be seen as precedent case for this approach.
1.2 Motivation
The overarching motivation is to increase WTs competitiveness to conventional fossil andnuclear using energy sources. A major aspect to make renewable energies more attractive istheir economical feasibility. Therefore, their efficiency has to be improved and their costs haveto be reduced. System costs of multimegawatt WTs are assembled out of costs for components,their maintenance, erecting, and transport. Considering the favouring of larger hub heightsin tendering procedures for modern land-based WTs in Germany [191], rising system costsare the consequence. Especially the support structure contribution can amount to more than30 % of the WT system costs [77]. Problems arise with transport of conventional steel towerswhere the diameter restriction of 4.3 m caused by bridges and tunnel clearance constraintsforces uneconomical great wall thicknesses to meet the design requirements. Besides economicaspects, the environmental impact ofWT support structures has likewise to be considered. Thisbecomes clear by assuming for example 2.8 t of CO2-emissions per produced ton of steel [148].Answers of the industry to these challenges may include alternative tower concepts, such ashybrid steel-concrete, pre-tensioned concrete, guyed, wooden, and lattice towers. Each ofthem has its own advantages and disadvantages, such as discussed in the books from Faberet al. [71], Hau [92], Gasch [77], and Manwell, McGowan, and Rogers [137]. The lack ofsufficient conceptual answers to economic and environmental requirements motivates the callfor new material saving WT support structures. Therefore, the next section introduces to theconcept of a rotatable tower for land-based WTs and shows, how it should meet these cost andenvironmental requirements.
1.3 Problem Description
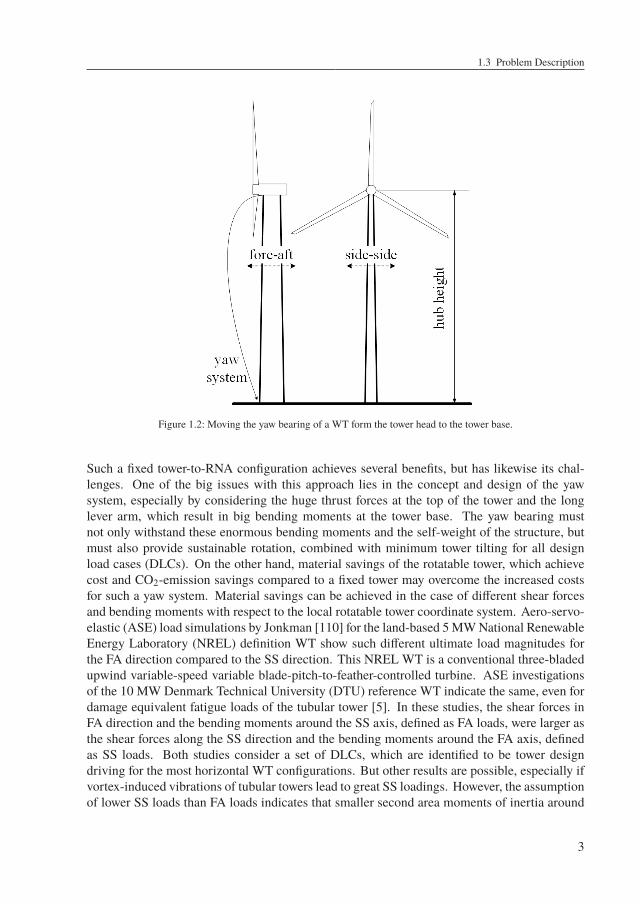
The concept of a rotatable WT tower requires the yaw system to be at the bottom of the towerinstead on the top of it. This implies that the rotor nacelle assembly (RNA) aligns to the winddirection together with the whole tower. For convenience one can identify two directions: thefore-aft (FA) and the side-side (SS) direction where FA is orthogonal to the rotor plane and SSis parallel to it, such as shown in Figure 1.2.
2
1.3 Problem Description
Figure 1.2: Moving the yaw bearing of a WT form the tower head to the tower base.
Such a fixed tower-to-RNA configuration achieves several benefits, but has likewise its chal-lenges. One of the big issues with this approach lies in the concept and design of the yawsystem, especially by considering the huge thrust forces at the top of the tower and the longlever arm, which result in big bending moments at the tower base. The yaw bearing mustnot only withstand these enormous bending moments and the self-weight of the structure, butmust also provide sustainable rotation, combined with minimum tower tilting for all designload cases (DLCs). On the other hand, material savings of the rotatable tower, which achievecost and CO2-emission savings compared to a fixed tower may overcome the increased costsfor such a yaw system. Material savings can be achieved in the case of different shear forcesand bending moments with respect to the local rotatable tower coordinate system. Aero-servo-elastic (ASE) load simulations by Jonkman [110] for the land-based 5 MW National RenewableEnergy Laboratory (NREL) definition WT show such different ultimate load magnitudes forthe FA direction compared to the SS direction. This NREL WT is a conventional three-bladedupwind variable-speed variable blade-pitch-to-feather-controlled turbine. ASE investigationsof the 10 MW Denmark Technical University (DTU) reference WT indicate the same, even fordamage equivalent fatigue loads of the tubular tower [5]. In these studies, the shear forces inFA direction and the bending moments around the SS axis, defined as FA loads, were larger asthe shear forces along the SS direction and the bending moments around the FA axis, definedas SS loads. Both studies consider a set of DLCs, which are identified to be tower designdriving for the most horizontal WT configurations. But other results are possible, especially ifvortex-induced vibrations of tubular towers lead to great SS loadings. However, the assumptionof lower SS loads than FA loads indicates that smaller second area moments of inertia around
3
1 Introduction
the FA axis are sufficient, thus material can be saved. Such direction dependent stiffness andchanged mass distributions along the tower lead to two different bending modes with lowernatural frequency around the FA axes. This property has to be mentioned for the proposedoperational range and within corresponding control strategies. Other advantages of rotatabletowers are better transportability through bridges and tunnels due to their tendency for elongatedmore flat tower profiles and improved yaw system maintenance accessibility. Dependent onthe yaw system design it is imaginable to exchange the whole bearing without dismounting thetower and RNA. This can be done by heaving the whole turbine with hydraulic presses, whilethe tower is guyed and would save crane costs. Lower aerodynamic tower drag may also bepossible along the FA direction by means of aerodynamic profiles, but can lead to additionallift forces in case of skewed inflow. DLCs which account for a yaw system failure and thewind has a skewed or perpendicular inflow angle to the WT may be dangerous and have tobe analysed within ASE load simulations. Nevertheless aerodynamic cross sections have thepotential to reduce the tower dam effect and improve the tower shadow behaviour in case ofdownwind WTs. This work discusses these aspects in more detail and shows the developmentand analysis of an even more effective rotatable tower concept, than the typical suggestions ofan elliptical or aerodynamically shaped tower cross section.
1.4 Limitations
The goal of the present work is to discuss the technical and economical feasibility of WTs withrotatable support structure. Since not many scientific works mentioned this concept before,this work has first to deal with a conceptual comparison of potential rotatable support structuresolutions. Afterwards a deeper analysis is presented for the rotatable inclined lattice toweras one of several possible approaches. The preliminary nature of this work and its limitedscope hindered more detailed investigations with respect to the yaw system, the foundation, themachinery bed at the tower top and the lattice tower joints, even though each of these aspects ismentioned throughout the work. Since the applied complex ASE simulations and their resultsdepended not only on the support structure, but also on other parts, the environment, and thecontrol system, many more short cuts had to be introduced to keep the size of the work withincertain borders. For example, not all design load cases were considered, but the ones, whichpointed out by the literature and own experience as being relevant. Furthermore, the towerassessment was primary done according to the IEC 61400-1 and only partially according to themore sophisticated DNV GL-standards. Control system adjustments for transient WT eventswere carried out on a simple level to decrease the loads for a rotatable WT support structure.Therefore, many improvements and deeper investigations in following scientific works areconceivable.
4
1.5 Document Structure
1.5 Document Structure
This section provides a short overview of the content in each chapter.
Chapter 1 - IntroductionChapter 1 contains the historical background of grain milling windmills as precedents of theproposed rotatable WT tower concepts. A following motivational part explains why newmaterial and cost saving tower concepts are required. A subsequent problem descriptionintroduces to some fundamental aspects of rotatable WT tower concepts. In the end, somelimitations and the document structure of this work are presented.
Chapter 2 - State of the ArtChapter 2 presents all fundamental basics and knowledge requirements for this work. It containsa short introduction to wind energy conversion and repeats the necessary tower and foundationassessment aspects. Afterwards, some WT tower related subjects are introduced, such as itsmanufacturing technology, transport and erection. The yaw system is likewise explained onthe surface, because it is not the focus in this work. A more detailed introduction is given tolattice towers, because the more investigated concept in this work is a structure out of latticemembers. For the structural analysis, the load evaluation is presented as one important aspectand followed by a literature research about rotatable support structures for WTs and relatedtechnology trees of other industry sectors.
Chapter 3 - Load Analysis of Conventional DesignsChapter 3 shows the methodological approach for the chapter and partially for this work. Itfocusses on conventional WTs and introduces the referenceWT and their analytically evaluatedloads. After a complementary literature research about tower loads, the own ASE load analysisof the reference WT is carried out and validated.
Chapter 4 - Load-Direction-Derived Support StructuresChapter 4 introduces to fundamental aspects of load-direction-derived support structures withthe focus on rotatable WT towers. After a definition of the term load-direction-derived, towerbase yaw systems and corresponding foundations are presented and discussed. Afterwards, thestructural and aerodynamic properties of rotatable towers are explained. The end of the chaptershows the concept evaluation method for a rotatable tower.
Chapter 5 - Rotatable Tubular ConceptsChapter 5 analyses tubular rotatable tower concepts and starts with a comparison of possibleshapes. Afterwards, a more detailed analysis of an elliptical tower shape reveals its potential interms of material savings. In the end, some additional tubular concepts are introduced.
Chapter 6 - Rotatable Inclined Lattice Tower ConceptChapter 6 explains the favoured rotatable inclined lattice tower concept in this work. It startswith the cross sectional concept of the lattice tower, followed by the new aspect of towerinclination, and ends by other possible concept proposals.
5
1 Introduction
Chapter 7 - Rotatable Inclined Lattice Tower DesignChapter 7 introduces to the more detailed rotatable inclined lattice tower design and explainsits parametric specifications. The end contains a short subsection about the general design asan iterative process.
Chapter 8 - Modelling the Rotatable Inclined Lattice Tower in FASTChapter 8 treats the modelling of the tower in the ASE load simulation environment. Therefore,the necessary adjustments in the source code are explained and the afterwards modelled towerin SubDyn is validated through a parallel modelling approach. The end of the chapter containsthe implementation of the SubDyn model in the ASE load simulation framework of FAST, thecorresponding adjustments in FAST, and the SubDyn simulation settings.
Chapter 9 - Structural Analysis of a Rotatable Inclined Lattice TowerChapter 9 treats the whole structural analysis of the rotatable inclined lattice tower. It starts withthe definition of design parameter values. A following modal analysis of the structure is carriedout before the actual ASE simulation of IEC 61400-1 load cases. After the post processing ofthe loads, the ultimate, fatigue, accidental, and serviceability limit state are checked to ensurethe integrity of the structure over its lifetime.
Chapter 10 - Potential of Rotatable Support StructuresChapter 10 provides the potential analysis of the rotatable inclined lattice tower with respect toits costs. Therefore, material savings are evaluated first to calculated the corresponding CO2and cost savings. The next two subsections determine the increased WT efficiency throughtower inclination and provide an estimation of tower base yaw system costs. In the end, theeconomical potential is analysed by balancing the cost savings, additional money income, andadditional costs of the rotatable inclined lattice tower.
6
2 State of the Art
2.1 Fundamentals of Wind Energy Conversion
This section gives a brief overview about WT technology, whereby subsection 2.1.1 givesa short introduction to wind as energy resource, subsection 2.1.2 explains the fundamentalphysics of wind energy conversion, and subsection 2.1.3 presents some main WT componentsand its functions. More detailed introductions into wind energy technology may be readin [77], [92], [71], and [137].
2.1.1 Wind
According to Manwell, Mcgowan, and Rogers [137, p. 24] the sun is one origin for wind, whichheats earthly surfaces differently due to its solar radiation. A corresponding pressure gradientin the air with different temperatures forces the air to move from high pressure zones to lowpressure zones. Another reason for air to move is the earth’s rotation. Its circumferential speedamounts to 1670 km/h at the equator and decreases to zero at the poles [ibid.]. In the smallerscale the earth’s surface roughness influences the vertical gradient of the horizontal wind speed,such as being relevant for WTs assessment, discussed in section 2.2. An appropriate measurefor wind resource potential gives the wind power density Pw/Adisc, which results out of thewind mass flow dm/dt = Ûm = ρair Adisc Vw through a disc with an assumed area of Adisc = 1 m2.Pw is the rotor power, m is the mass of an air particle, t is time, ρair is the air density, and Vw isthe wind speed.
Pw =12
dmdt
V2w →
Pw
Adisc=
12ρair V3
w (2.1)
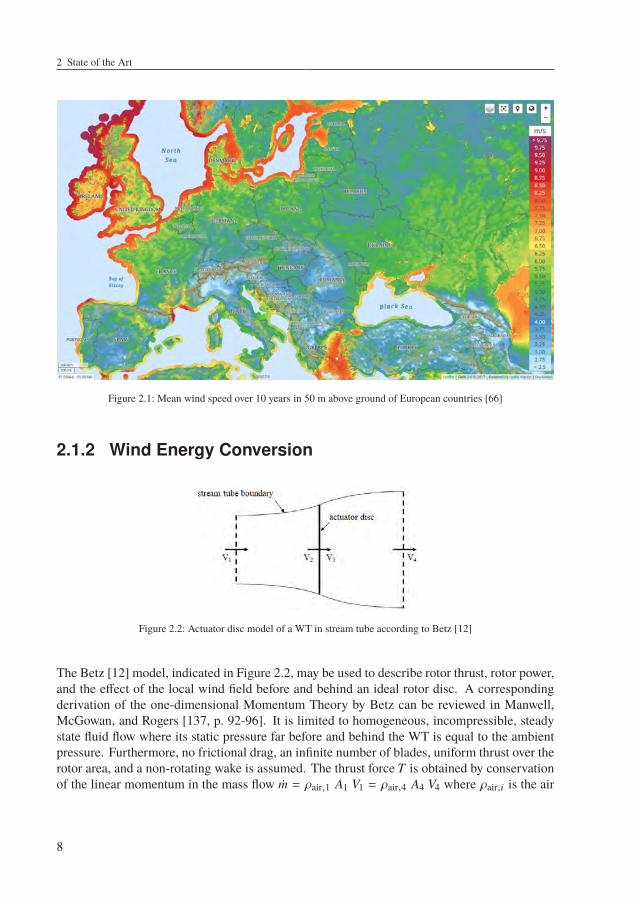
Since Equation 2.1 shows that the wind speed contributes to the power of 3 to the wind powerdensity, it is one of the most important factors to chose an appropriate WT site. Figure 2.1shows therefore the mean wind speed of some European countries in altitudes of 50 m abovethe ground. From that it is clear that sea sites provide the highest wind power potential, butthey require cost intensive WT support structure concepts, expensive mounting on site, andthey introduce higher maintenance costs to the WT. However, land-based WTs have still theirjustification, especially if they use innovative more economic tower concepts for larger hubheights, which overcome transportability problems, such as discussed throughout this work.
7
2 State of the Art
Figure 2.1: Mean wind speed over 10 years in 50 m above ground of European countries [66]
2.1.2 Wind Energy Conversion
Figure 2.2: Actuator disc model of a WT in stream tube according to Betz [12]
The Betz [12] model, indicated in Figure 2.2, may be used to describe rotor thrust, rotor power,and the effect of the local wind field before and behind an ideal rotor disc. A correspondingderivation of the one-dimensional Momentum Theory by Betz can be reviewed in Manwell,McGowan, and Rogers [137, p. 92-96]. It is limited to homogeneous, incompressible, steadystate fluid flow where its static pressure far before and behind the WT is equal to the ambientpressure. Furthermore, no frictional drag, an infinite number of blades, uniform thrust over therotor area, and a non-rotating wake is assumed. The thrust force T is obtained by conservationof the linear momentum in the mass flow Ûm = ρair,1 A1 V1 = ρair,4 A4 V4 where ρair,i is the air
8
2.1 Fundamentals of Wind Energy Conversion
density, Ai is the cross sectional area, and i denotes the corresponding section in the streamtube so that
T = Ûm (V1 − V4) (2.2)
By application of the Bernoulli function, one can write Equation 2.2 with respect to the actuatordisc area A2 as
T =12ρ2 A2
(V2
1 − V24
)(2.3)
In this simple model the wind speed at the actuator disc is the average between the upstreamand downstream wind speeds according to
V2 =V1 + V4
2(2.4)
An axial induction factor a is introduced to describe the wind speed as fractional decrease ofthe wind speed V1 in free stream condition with respect to the wind speed V2 at the rotor discaccording to Equation 2.5.
a =V1 − V2
V1(2.5)
Using Equations 2.4 and 2.5 in 2.3 results to
T =12ρ2 A2 V2
2 [4 a (1 − a)] (2.6)
and the thrust coefficient cT is defined as
cT =T
12ρ2 V2
2 A2
=Thrust Force
Dynamic Force= 4 a (1 − a) (2.7)
The rotor power P is calculated by multiplication of the thrust force with the wind speed at therotor disc and gives
P =12ρ2 A2 V3
2 4 a (1 − a)2 (2.8)
where the power coefficient cP is defined as
cP =P
12ρ2 V3
2 A2
=Rotor PowerWind Power
= 4 a (1 − a)2 (2.9)
The zero equalized derivative of the power coefficient in Equation 2.9 with respect to a revealsthe maximum1 theoretical power coefficient of cP,max = 16/27 ≈ 0.59 at an axial inductionfactor of a = 1/3. In reality properties, such as the rotation of thewake behind theWT, tip losses,associated with a finite blade number, and non-zero aerodynamic drag cause a reduced powercoefficient. Using an induction factor of a = 1/3 in Equation 2.7 results to a correspondingthrust coefficient of cT,max = 8/9. Note that the overall WT efficiency can be calculated by
1 This theoretical maximum power coefficient is likewise known as Betz limit.
9
2 State of the Art
multiplication of the power coefficient with the mechanical efficiency ηmech., which accountsfor gear box and bearing friction heat dissipation and with the electrical efficiency ηelec., whichaccounts for losses in the generator, power electronics, and cables.
A rotating wind wake behind the WT is not assumed in the previous consideration. Morerealistic approaches include the kinetic energy, which is lost by the rotor and given to the nowpartial rotating wind field behind theWT. This wind field may be seen as annual control volumearound the rotor where the angular momentum loss is calculated for. Detailed explanationsmay be read in [137, p. 96-101] and are not given in this work.
Current rotor designs are established by means of the more exact Blade Element Momentum(BEM) Theory. In this approach the conservation of linear and angular momentum is combinedwith an analysis of forces and moments at rotor blade sections [137, p. 117]. Since it revealsmore information about blade loads and provides flexibility to include more sophisticatedaerodynamic models, such as tip loss as result of a finite blade number, wake rotation, andradial airflow along the blade, it is used in many aero-servo-elastic (ASE) simulation tools, suchas explained in subsection 2.8.2. Detailed explanations of the previously mentioned aspectsmay be reviewed in [137, p. 115-145].
2.1.3 Wind Turbine Components
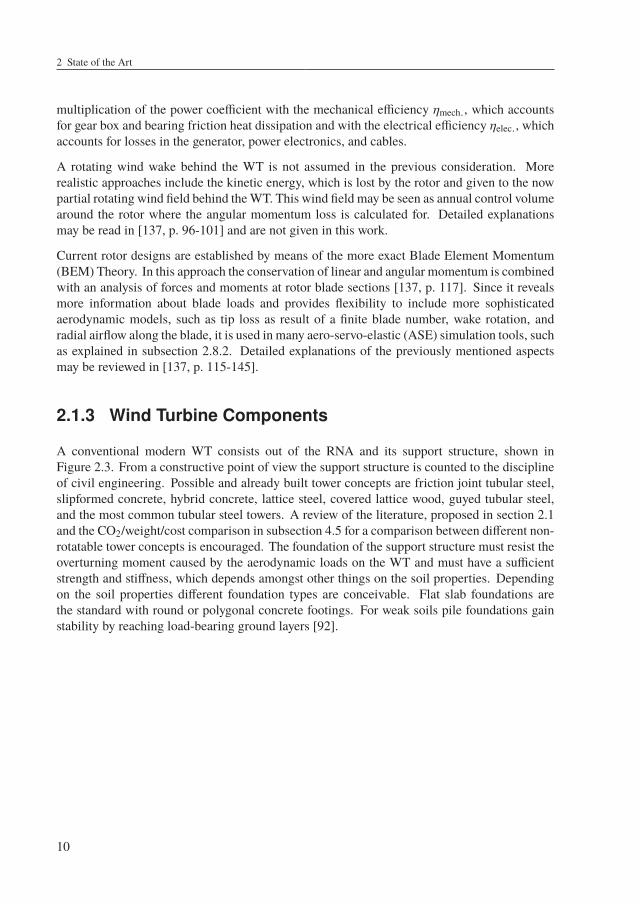
A conventional modern WT consists out of the RNA and its support structure, shown inFigure 2.3. From a constructive point of view the support structure is counted to the disciplineof civil engineering. Possible and already built tower concepts are friction joint tubular steel,slipformed concrete, hybrid concrete, lattice steel, covered lattice wood, guyed tubular steel,and the most common tubular steel towers. A review of the literature, proposed in section 2.1and the CO2/weight/cost comparison in subsection 4.5 for a comparison between different non-rotatable tower concepts is encouraged. The foundation of the support structure must resist theoverturning moment caused by the aerodynamic loads on the WT and must have a sufficientstrength and stiffness, which depends amongst other things on the soil properties. Dependingon the soil properties different foundation types are conceivable. Flat slab foundations arethe standard with round or polygonal concrete footings. For weak soils pile foundations gainstability by reaching load-bearing ground layers [92].
10
2.1 Fundamentals of Wind Energy Conversion
Figure 2.3: Complete exemplary wind turbine with conventional tubular steel tower and gravity slab foundation fromHau [92, p. 73]
11
2 State of the Art
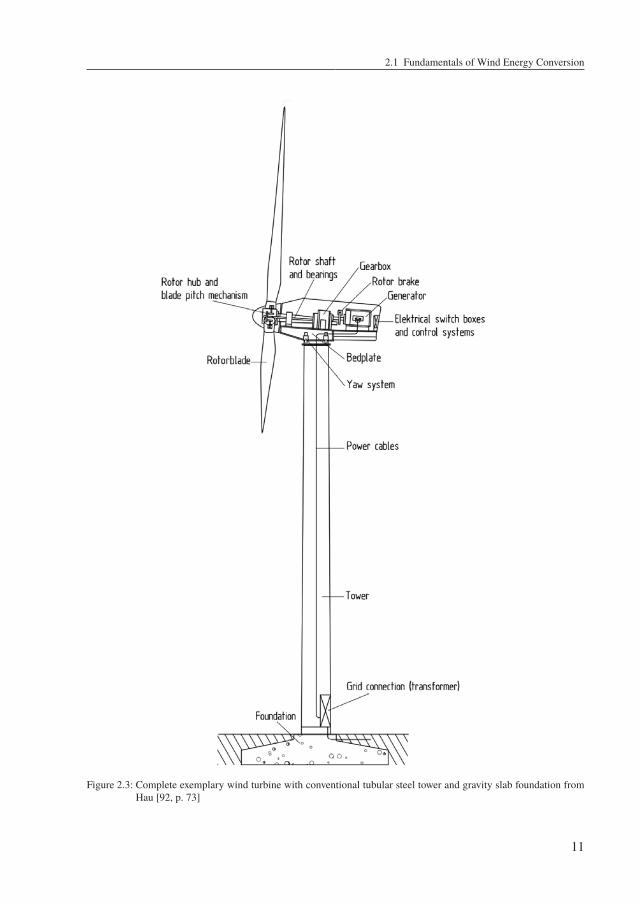
A more detailed picture of the RNA is given in Figure 2.4. The machine foundation (17) ismounted on the yaw bearing (16), which is bolted to the top of the tower. As reaction tochanging wind directions the necessary RNA’s alignment to the wind will be realized by theyaw drives with its gears (18). To control the power output and the loads modern WTs havethe additional ability to pitch their blades (12) with help of their pitch mechanism (1, 2, and13). The blade carrying hub (3) rotates relatively slow with high aerodynamic torque. Fromthe rotor the power is led into the gearbox (6) over the main shaft (4) where it is transformedto a lower torque with higher rotational speed on the high speed shaft (19) for the generator(20 and 21). The transformer brings the electric voltage on a reasonable level for the wholewind farm to feed it into the grid. A breaking (7, 14, and 15) and cooling (5) system ensuresoperational safety and ultra-sonic sensors (10) help to measure the wind properties. ModernWTs are connected to a computational network (9) to collect data and to provide an interfaceto external WT control. For maintenance services a crane (8) helps to manage heavy weightcomponents.
Figure 2.4: Vestas V80-2 MW wind turbine nacelle components. 1. hub controller, 2. pitch cylinder, 3. blade hub,4. main shaft, 5. oil cooler, 6. gearbox, 7. parking brake, 8. service crane, 9. VMP-top controller withconverter, 10. ultra-sonic sensors, 11. transformer, 12. blade, 13. blade bearing, 14. rotor lock system,15. hydraulic unit, 16. yaw ring, 17. machine foundation, 18. yaw gears, 19. composite disk coupling,20. OptiSpeedTM-generator, 21. generator cooler. Picture from [28] and description of the componentsfrom [190]
.
12
2.2 Tower Assessment
2.2 Tower Assessment
Standards build the base for WT tower assessment, whereby some of them are introduced insubsection 2.2.1. On the loads and site conditions side, subsection 2.2.2 presents the DLCs,demanded by the IEC 61400-1 [50]. The following subsection 2.2.3 summarizes additionalDLCs from other standards and their difference with respect to the IEC 61400-1. Furthermore,WT tower assessment ensures the observance of the following limit states throughout allconsidered DLCs:
• Ultimate Limit State (ULS), see subsection 2.2.5
• Fatigue Limit State (FLS), see subsection 2.2.6
• Accidental Limit State (ALS), see subsection 2.2.7
• Serviceability Limit State (SLS), see subsection 2.2.8
Each of these limit states can be evaluated under the partial safety factor method, implied byIEC 61400-1 [50] and explained in [63]. It demands that a design load effect Sd must not exceedthe design resistance Rd
Sd ≤ Rd (2.10)
while both sides are scaled by means of certain partial safety factors. Sd of the design criterionin Equation 2.10 may represent internal or external forces and moments, a deformation, orstresses in a cross section. On the other side Rd may be used as capacity, a critical deformation,or a yield stress. A discussion about corresponding partial safety factors (PSFs) to be appliedin different situations is given in subsection 2.2.4.
2.2.1 Prevailing Standards
Faber [71] gives an overview about different design requirements for support structures and listssome corresponding standards. The IEC 61400-1 standard [50] contains a minimum of loadcases and requirements, especially for land-based WTs.2 Owing to its fundamental characterit is often used in scientific investigations and serves as base for the more practical relevantDIBt [152] andDNVGL standard. TheDNVGL standard is distributed over several specializeddocuments, whereby the loads and site conditions standard [64], support structure standard [63],and the recommended practice report for fatigue design [62] are the most important guidelinesfor the design of WT support structures. Other standards, such as the Eurocode 3 for generalrequirements - DIN EN 1993-1-1 [42], for plated structural elements - DIN EN 1993-1-5 [43],for strength and stability of shell structures - DINEN 1993-1-6 [44], and for fatigue assessment -DIN EN 1993-1-9 [47] must often be consulted if it comes to the direct verification of structuralcomponents. The tower and masts part of the Eurocode 3, DIN EN 1993-3-1 [48], may also berelevant together with the wind actions part of Eurocode 1, DIN EN 1991-1-4 [67]. As the most2 In this work edition 3 of IEC 61400-1 was used, because it was valid for the time when this work was written. Thenext edition 4 [51] was in its draft stage at this time
13
2 State of the Art
support structures have bolted or welded joints, DIN EN 1993-1-8 [45] is likewise important.A comprehensive overview about all relevant standards and guidelines for WT design is givenin Table 1-1 of [63].
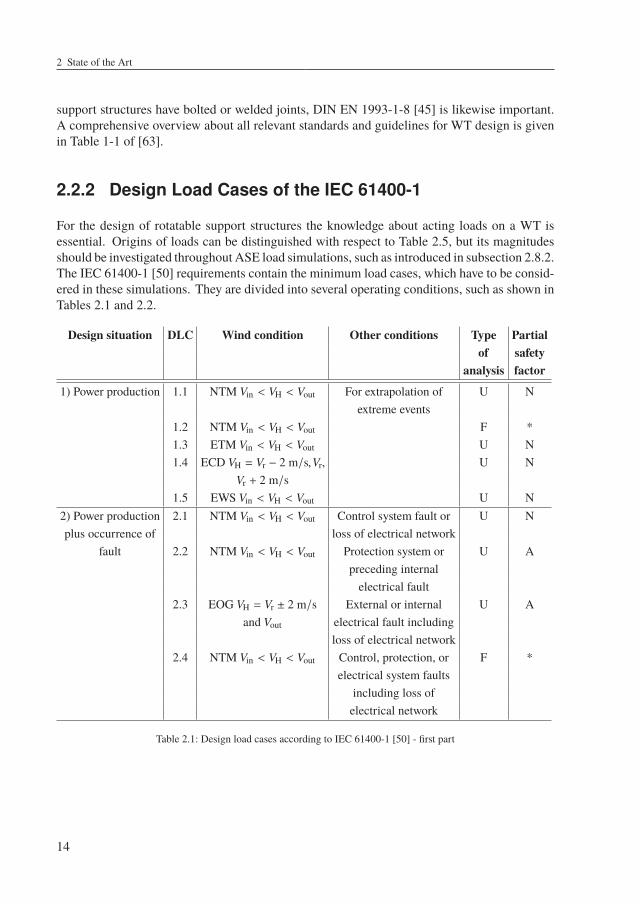
2.2.2 Design Load Cases of the IEC 61400-1
For the design of rotatable support structures the knowledge about acting loads on a WT isessential. Origins of loads can be distinguished with respect to Table 2.5, but its magnitudesshould be investigated throughout ASE load simulations, such as introduced in subsection 2.8.2.The IEC 61400-1 [50] requirements contain the minimum load cases, which have to be consid-ered in these simulations. They are divided into several operating conditions, such as shown inTables 2.1 and 2.2.
Design situation DLC Wind condition Other conditions Type Partialof safety
analysis factor
1) Power production 1.1 NTM Vin < VH < Vout For extrapolation of U Nextreme events
1.2 NTM Vin < VH < Vout F *1.3 ETM Vin < VH < Vout U N1.4 ECD VH = Vr − 2 m/s,Vr, U N
Vr + 2 m/s1.5 EWS Vin < VH < Vout U N
2) Power production 2.1 NTM Vin < VH < Vout Control system fault or U Nplus occurrence of loss of electrical network
fault 2.2 NTM Vin < VH < Vout Protection system or U Apreceding internalelectrical fault
2.3 EOG VH = Vr ± 2 m/s External or internal U Aand Vout electrical fault including
loss of electrical network2.4 NTM Vin < VH < Vout Control, protection, or F *
electrical system faultsincluding loss ofelectrical network
Table 2.1: Design load cases according to IEC 61400-1 [50] - first part
14
2.2 Tower Assessment
Design situation DLC Wind condition Other conditions Type Partialof safety
analysis factor
3) Start-up 3.1 NWP Vin < VH < Vout F *3.2 EOG VH = Vin,Vr U N
±2 m/s and Vout
3.3 EDC VH = Vin,Vr U N±2 m/s and Vout
4) Normal shut 4.1 NWP Vin < VH < Vout F *down 4.2 EOG VH = Vr ± 2 m/s U N
and Vout
5) Emergency shut 5.1 NTM VH = Vr ± 2 m/s U Ndown and Vout
6) Parked (standing 6.1 EWM 50-year recurrence U Nstill or idling) period
6.2 EWM 50-year recurrence Loss of electrical U Aperiod network connection
6.3 EWM 1-year recurrence Extreme yaw U Nperiod misalignment
6.4 NTM VH < 0.7 Vref F *7) Parked and fault 7.1 EWM 1-year recurrence U A
conditions period8) Transport, 8.1 NTM Vmaint to be stated by U Tassembly, the manufacturer
maintenance and,repair
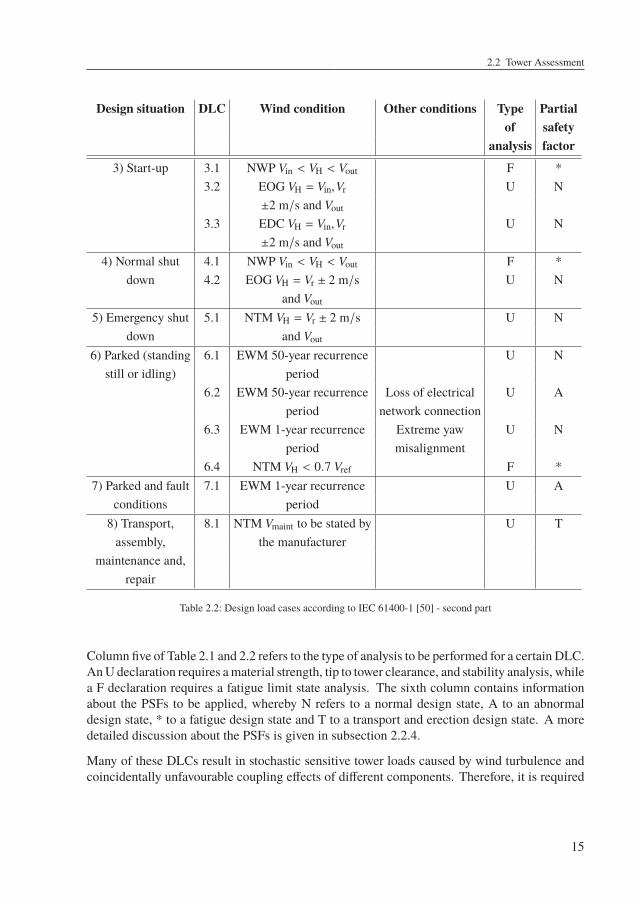
Table 2.2: Design load cases according to IEC 61400-1 [50] - second part
Column five of Table 2.1 and 2.2 refers to the type of analysis to be performed for a certain DLC.AnUdeclaration requires amaterial strength, tip to tower clearance, and stability analysis, whilea F declaration requires a fatigue limit state analysis. The sixth column contains informationabout the PSFs to be applied, whereby N refers to a normal design state, A to an abnormaldesign state, * to a fatigue design state and T to a transport and erection design state. A moredetailed discussion about the PSFs is given in subsection 2.2.4.
Many of these DLCs result in stochastic sensitive tower loads caused by wind turbulence andcoincidentally unfavourable coupling effects of different components. Therefore, it is required
15
2 State of the Art
to calculate multiple timeseries with different random seeds3 of DLCs with stochastic windfields. It follows a summarized explanation of the different windmodels, given by abbreviationsin the wind condition column of Tables 2.1 and 2.2. The detailed explanations can be found inthe IEC 61400-I [50], but a summarized repetition is useful for later discussion about certainload cases in the following ASE load simulations.
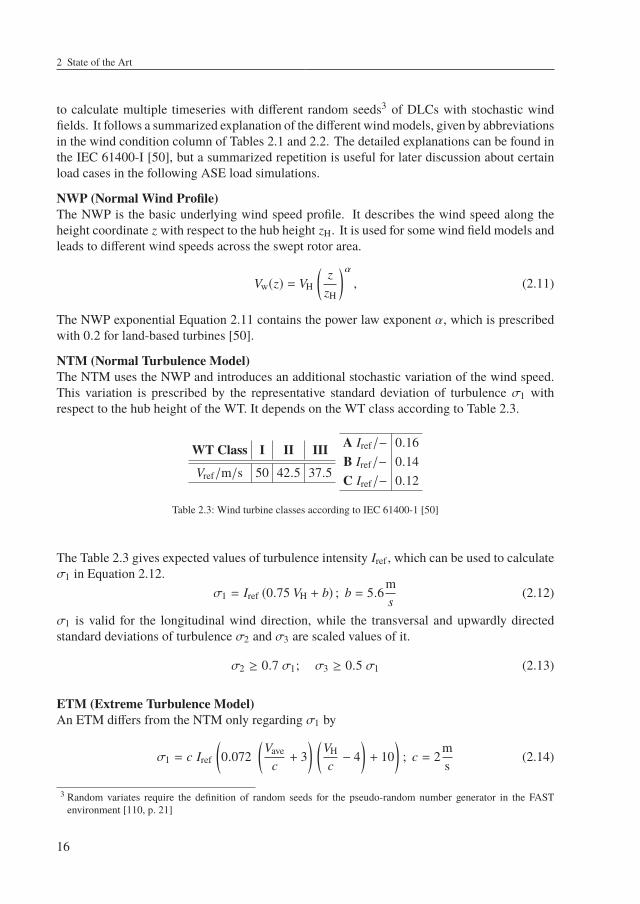
NWP (Normal Wind Profile)The NWP is the basic underlying wind speed profile. It describes the wind speed along theheight coordinate z with respect to the hub height zH. It is used for some wind field models andleads to different wind speeds across the swept rotor area.
Vw(z) = VH
(z
zH
)α, (2.11)
The NWP exponential Equation 2.11 contains the power law exponent α, which is prescribedwith 0.2 for land-based turbines [50].
NTM (Normal Turbulence Model)The NTM uses the NWP and introduces an additional stochastic variation of the wind speed.This variation is prescribed by the representative standard deviation of turbulence σ1 withrespect to the hub height of the WT. It depends on the WT class according to Table 2.3.
WT Class I II III
Vref/m/s 50 42.5 37.5
A Iref/− 0.16B Iref/− 0.14C Iref/− 0.12
Table 2.3: Wind turbine classes according to IEC 61400-1 [50]
The Table 2.3 gives expected values of turbulence intensity Iref , which can be used to calculateσ1 in Equation 2.12.
σ1 = Iref (0.75 VH + b) ; b = 5.6ms
(2.12)
σ1 is valid for the longitudinal wind direction, while the transversal and upwardly directedstandard deviations of turbulence σ2 and σ3 are scaled values of it.
σ2 ≥ 0.7 σ1; σ3 ≥ 0.5 σ1 (2.13)
ETM (Extreme Turbulence Model)An ETM differs from the NTM only regarding σ1 by
σ1 = c Iref
(0.072
(Vave
c+ 3
) (VH
c− 4
)+ 10
); c = 2
ms
(2.14)
3 Random variates require the definition of random seeds for the pseudo-random number generator in the FASTenvironment [110, p. 21]
16
2.2 Tower Assessment
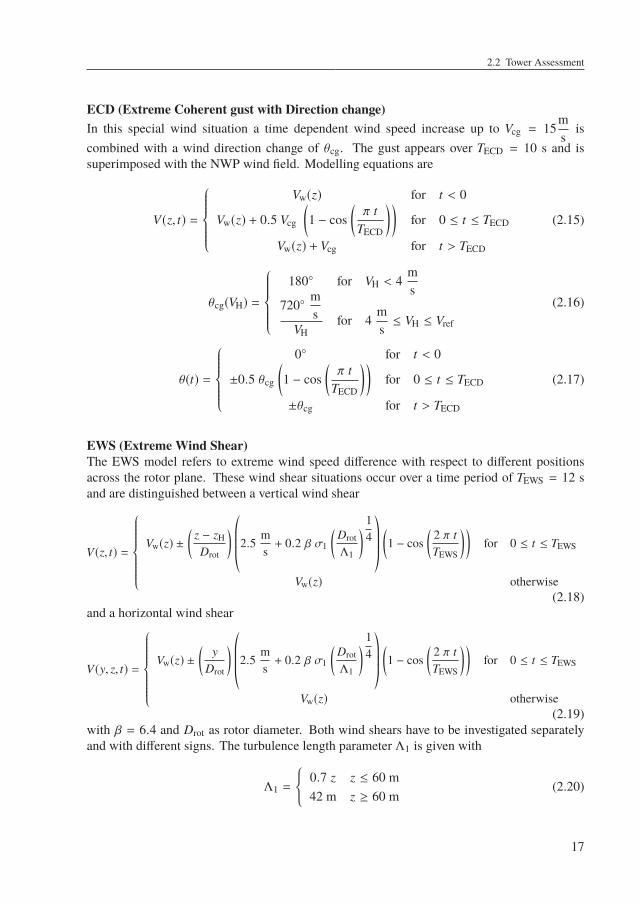
ECD (Extreme Coherent gust with Direction change)In this special wind situation a time dependent wind speed increase up to Vcg = 15
ms
iscombined with a wind direction change of θcg. The gust appears over TECD = 10 s and issuperimposed with the NWP wind field. Modelling equations are
V(z, t) =
Vw(z) for t < 0
Vw(z) + 0.5 Vcg
(1 − cos
(π t
TECD
))for 0 ≤ t ≤ TECD
Vw(z) + Vcg for t > TECD
(2.15)
θcg(VH) =
180 for VH < 4
ms
720ms
VHfor 4
ms≤ VH ≤ Vref
(2.16)
θ(t) =
0 for t < 0
±0.5 θcg
(1 − cos
(π t
TECD
))for 0 ≤ t ≤ TECD
±θcg for t > TECD
(2.17)
EWS (Extreme Wind Shear)The EWS model refers to extreme wind speed difference with respect to different positionsacross the rotor plane. These wind shear situations occur over a time period of TEWS = 12 sand are distinguished between a vertical wind shear
V(z, t) =
Vw(z) ±
(z − zH
Drot
) ©«2.5ms+ 0.2 β σ1
(Drot
Λ1
) 14ª®®®¬(1 − cos
(2 π tTEWS
))for 0 ≤ t ≤ TEWS
Vw(z) otherwise(2.18)
and a horizontal wind shear
V(y, z, t) =
Vw(z) ±
(y
Drot
) ©«2.5ms+ 0.2 β σ1
(Drot
Λ1
) 14ª®®®¬(1 − cos
(2 π tTEWS
))for 0 ≤ t ≤ TEWS
Vw(z) otherwise(2.19)
with β = 6.4 and Drot as rotor diameter. Both wind shears have to be investigated separatelyand with different signs. The turbulence length parameter Λ1 is given with
Λ1 =
0.7 z z ≤ 60 m42 m z ≥ 60 m
(2.20)
17
2 State of the Art
EWM (Extreme Wind Model)The EWM can be modeled either as a stationary wind field or as a turbulent one. In case of astationary wind field, additional yaw misalignments of ±15 have to be accounted for. In thismodel two wind speeds have to be investigated. One with an extreme wind speed Ve50 with arecurring period of 50 years and the other with a recurring period of 1 year Ve1. The equationsare
Ve50(z) = 1.4 Vref
(z
zH
)0.11(2.21)
andVe1(z) = 0.8 Ve50(z). (2.22)
For the turbulent case a standard deviation of the longitudinal turbulence of
σ1 = 0.11 VH (2.23)
should be assumed. Interestingly, the international standard EN 61400-1:2005 [103] prescribesEquation 2.21 as
Ve50(z) = Vref
(z
zH
)0.11(2.24)
in case of turbulent wind. This means, that the extreme wind speeds are smaller than in theGerman standard. In this work, the international assumption for the extreme wind speeds areapplied to achieve comparability.
EOG (Extreme Operating Gust)The EOG is an extreme wind speed change, whose function over time looks like a Mexicanhat4. The maximum gust wind speed Vgust of it is
Vgust = min
1.35 (Ve1 − VH) ; 3.3©«
σ1
1 + 0.1(
Drot
Λ1
) ª®®®®¬ (2.25)
and the time and height coordinate dependent function is
V(z, t) =
Vw(z) − 0.37 Vgust sin(
3 π tTEOG
) (1 − cos
(2 π tTEOG
))for 0 ≤ t ≤ TEOG
Vw(z) otherwise(2.26)
with TEOG = 10.5 s.
4 This name is widely used in the wind energy sector to describe the EOG wind speed change. See for example thearticle of Gillebaart, Bernhammer, Zuijlen, and van Kuik [82]
18
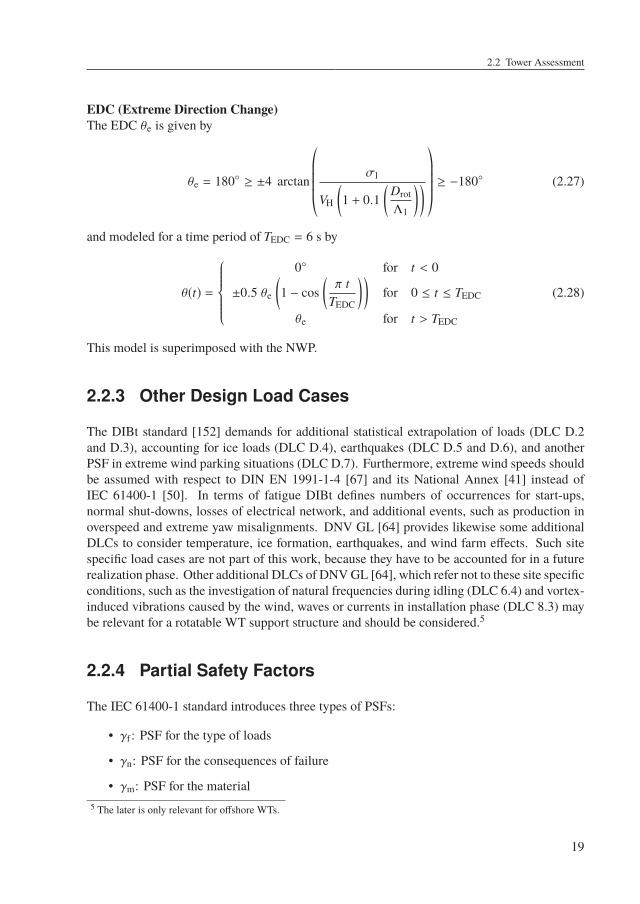
2.2 Tower Assessment
EDC (Extreme Direction Change)The EDC θe is given by
θe = 180 ≥ ±4 arctan©«
σ1
VH
(1 + 0.1
(Drot
Λ1
)) ª®®®®¬≥ −180 (2.27)
and modeled for a time period of TEDC = 6 s by
θ(t) =
0 for t < 0
±0.5 θe
(1 − cos
(π t
TEDC
))for 0 ≤ t ≤ TEDC
θe for t > TEDC
(2.28)
This model is superimposed with the NWP.
2.2.3 Other Design Load Cases
The DIBt standard [152] demands for additional statistical extrapolation of loads (DLC D.2and D.3), accounting for ice loads (DLC D.4), earthquakes (DLC D.5 and D.6), and anotherPSF in extreme wind parking situations (DLC D.7). Furthermore, extreme wind speeds shouldbe assumed with respect to DIN EN 1991-1-4 [67] and its National Annex [41] instead ofIEC 61400-1 [50]. In terms of fatigue DIBt defines numbers of occurrences for start-ups,normal shut-downs, losses of electrical network, and additional events, such as production inoverspeed and extreme yaw misalignments. DNV GL [64] provides likewise some additionalDLCs to consider temperature, ice formation, earthquakes, and wind farm effects. Such sitespecific load cases are not part of this work, because they have to be accounted for in a futurerealization phase. Other additional DLCs of DNVGL [64], which refer not to these site specificconditions, such as the investigation of natural frequencies during idling (DLC 6.4) and vortex-induced vibrations caused by the wind, waves or currents in installation phase (DLC 8.3) maybe relevant for a rotatable WT support structure and should be considered.5
2.2.4 Partial Safety Factors
The IEC 61400-1 standard introduces three types of PSFs:
• γf : PSF for the type of loads
• γn: PSF for the consequences of failure
• γm: PSF for the material5 The later is only relevant for offshore WTs.
19
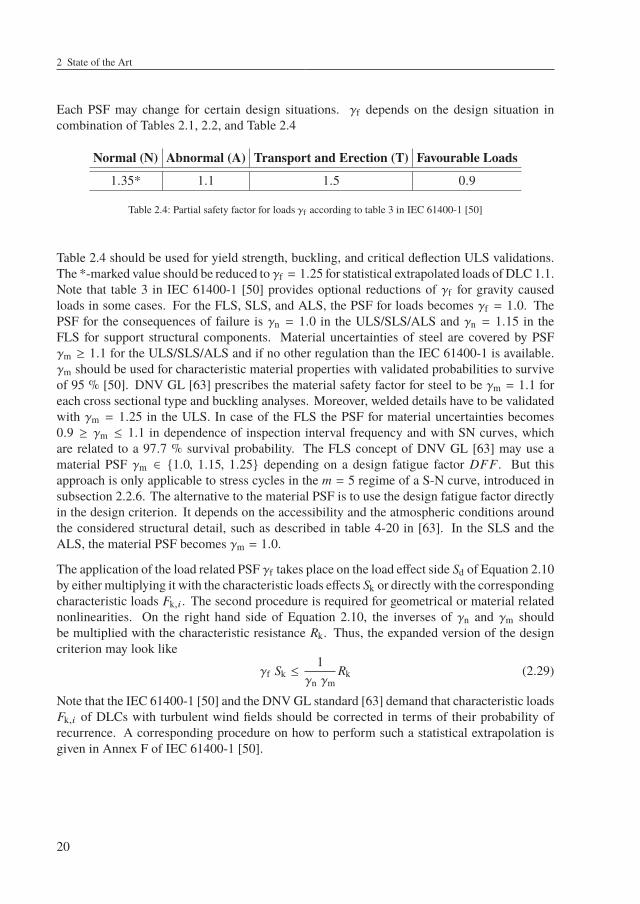
2 State of the Art
Each PSF may change for certain design situations. γf depends on the design situation incombination of Tables 2.1, 2.2, and Table 2.4
Normal (N) Abnormal (A) Transport and Erection (T) Favourable Loads
1.35* 1.1 1.5 0.9
Table 2.4: Partial safety factor for loads γf according to table 3 in IEC 61400-1 [50]
Table 2.4 should be used for yield strength, buckling, and critical deflection ULS validations.The *-marked value should be reduced to γf = 1.25 for statistical extrapolated loads of DLC 1.1.Note that table 3 in IEC 61400-1 [50] provides optional reductions of γf for gravity causedloads in some cases. For the FLS, SLS, and ALS, the PSF for loads becomes γf = 1.0. ThePSF for the consequences of failure is γn = 1.0 in the ULS/SLS/ALS and γn = 1.15 in theFLS for support structural components. Material uncertainties of steel are covered by PSFγm ≥ 1.1 for the ULS/SLS/ALS and if no other regulation than the IEC 61400-1 is available.γm should be used for characteristic material properties with validated probabilities to surviveof 95 % [50]. DNV GL [63] prescribes the material safety factor for steel to be γm = 1.1 foreach cross sectional type and buckling analyses. Moreover, welded details have to be validatedwith γm = 1.25 in the ULS. In case of the FLS the PSF for material uncertainties becomes0.9 ≥ γm ≤ 1.1 in dependence of inspection interval frequency and with SN curves, whichare related to a 97.7 % survival probability. The FLS concept of DNV GL [63] may use amaterial PSF γm ∈ 1.0, 1.15, 1.25 depending on a design fatigue factor DFF. But thisapproach is only applicable to stress cycles in the m = 5 regime of a S-N curve, introduced insubsection 2.2.6. The alternative to the material PSF is to use the design fatigue factor directlyin the design criterion. It depends on the accessibility and the atmospheric conditions aroundthe considered structural detail, such as described in table 4-20 in [63]. In the SLS and theALS, the material PSF becomes γm = 1.0.
The application of the load related PSF γf takes place on the load effect side Sd of Equation 2.10by either multiplying it with the characteristic loads effects Sk or directly with the correspondingcharacteristic loads Fk,i . The second procedure is required for geometrical or material relatednonlinearities. On the right hand side of Equation 2.10, the inverses of γn and γm shouldbe multiplied with the characteristic resistance Rk. Thus, the expanded version of the designcriterion may look like
γf Sk ≤1
γn γmRk (2.29)
Note that the IEC 61400-1 [50] and the DNVGL standard [63] demand that characteristic loadsFk,i of DLCs with turbulent wind fields should be corrected in terms of their probability ofrecurrence. A corresponding procedure on how to perform such a statistical extrapolation isgiven in Annex F of IEC 61400-1 [50].
20
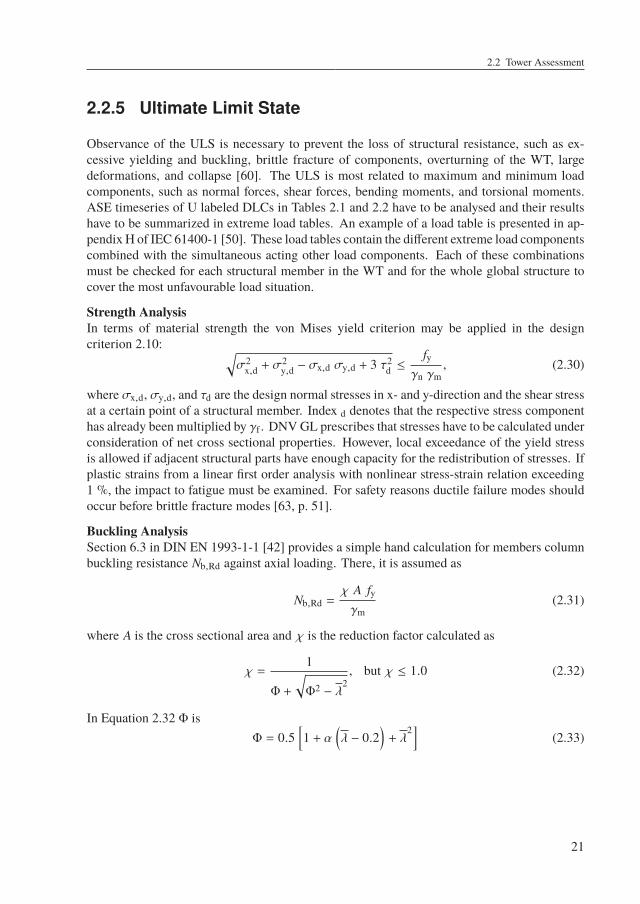
2.2 Tower Assessment
2.2.5 Ultimate Limit State
Observance of the ULS is necessary to prevent the loss of structural resistance, such as ex-cessive yielding and buckling, brittle fracture of components, overturning of the WT, largedeformations, and collapse [60]. The ULS is most related to maximum and minimum loadcomponents, such as normal forces, shear forces, bending moments, and torsional moments.ASE timeseries of U labeled DLCs in Tables 2.1 and 2.2 have to be analysed and their resultshave to be summarized in extreme load tables. An example of a load table is presented in ap-pendix H of IEC 61400-1 [50]. These load tables contain the different extreme load componentscombined with the simultaneous acting other load components. Each of these combinationsmust be checked for each structural member in the WT and for the whole global structure tocover the most unfavourable load situation.
Strength AnalysisIn terms of material strength the von Mises yield criterion may be applied in the designcriterion 2.10: √
σ2x,d + σ
2y,d − σx,d σy,d + 3 τ2
d ≤fy
γn γm, (2.30)
where σx,d, σy,d, and τd are the design normal stresses in x- and y-direction and the shear stressat a certain point of a structural member. Index d denotes that the respective stress componenthas already been multiplied by γf . DNVGL prescribes that stresses have to be calculated underconsideration of net cross sectional properties. However, local exceedance of the yield stressis allowed if adjacent structural parts have enough capacity for the redistribution of stresses. Ifplastic strains from a linear first order analysis with nonlinear stress-strain relation exceeding1 %, the impact to fatigue must be examined. For safety reasons ductile failure modes shouldoccur before brittle fracture modes [63, p. 51].
Buckling AnalysisSection 6.3 in DIN EN 1993-1-1 [42] provides a simple hand calculation for members columnbuckling resistance Nb,Rd against axial loading. There, it is assumed as
Nb,Rd =χ A fyγm
(2.31)
where A is the cross sectional area and χ is the reduction factor calculated as
χ =1
Φ +
√Φ2 − λ
2, but χ ≤ 1.0 (2.32)
In Equation 2.32 Φ isΦ = 0.5
[1 + α
(λ − 0.2
)+ λ
2](2.33)
21
2 State of the Art
whereα is the buckling curve dependent imperfection coefficient from table 6.2 inDINEN1993-1-1 [42] and λ is the slenderness ratio with
λ =Lcr
i λ1(2.34)
Lcr in Equation 2.34 is the buckling length in the considered load plane, i is the radius ofgyration with
i =
√IA
(2.35)
and λ1 is
λ1 = π
√Efy
(2.36)
where E is the Young’s modulus for the material. From Equations 2.31 to 2.35 it is clear thatan increased bending stiffness E I of a member means increased global buckling resistance.The geometric influence to the bending stiffness is given by the second area moment of inertiaI, which increases with more material being distributed as far away from the bending axes aspossible.
In numerical global buckling analyses themost unfavourable bucklingmodemust be consideredfor validation, while initial imperfections and residual stresses must be accounted for [63, p. 51].Eurocode 3 is appropriate for buckling analyses [63, p. 52] where first order calculation isallowed if the relation αcr of the design load Fd to the ideal buckling load Fcr is
αcr =
Fd
Fcr≥ 10 for elastic analysis
Fd
Fcr≥ 15 for plastic analysis
(2.37)
Otherwise Eurocode 3 [42] demands that the stability analysis of structures must account forsecond order influences and in any case for imperfections. These effects may be examinedwithin the calculation of the whole structure, the whole structure and partwise equivalentbeam approaches, or equivalent beam approach for each member with buckling lengths andbuckling shapes according to the whole structures buckling mode shape. If structural membersimperfections are not accounted appropriately in the whole structure calculation, additionalequivalent beam proofs may be necessary. In each case appropriate equivalent imperfectionsmust be defined to account for residual stresses, geometric imperfections, such as inclinationand deviation from straightness, and eccentricities. Thereby, equivalent imperfections have tobe applied to the whole structure and to individual members locally. Equivalent imperfectionshapes may be derived from the most unfavourable buckling mode shape, while their actualvalues of initial inclination and curvature are given in DIN EN 1993-1-1 5.3.2(3) [42] or may beprovided in the National Annex. It is likewise allowed to use equivalent loads or to use the mostunfavourable buckling mode shape with a prescribed amplitude to account for imperfections.Considering the design criterion of Equation 2.10 in terms of buckling, the Equation 2.38 must
22
2.2 Tower Assessment
hold, where fb is the calculated buckling load of the most unfavourable load combination andimperfections and fb,Rd is the corresponding buckling resistance load.
γf fbγn γm fb,Rd
≥ 1.0 (2.38)
Local buckling must be checked for cross sectional parts, which do not meet the criteria ofcross section class 3. These criteria are related to the shape, the dimensions, and the normalstress distribution of a cross sectional part and are listed in table 5.2 of DIN EN 1993-1-1 [42]and DNV GL appendix B [63]. Each cross section which does not observe the criteria oftype 3 becomes a type 4 and must be treated with respect to plate buckling in DIN EN 1993-1-5 [43] or to shell buckling in DIN EN 1993-1-6 [44], respectively. Furthermore, the DNV GLstandard [63] notes that the interaction of local and global buckling modes may be relevant andshould be considered especially for tubular towers.
2.2.6 Fatigue Limit State
WTs are dynamically loaded structures, whereby its components experience many damagingload cycles over their lifetime. Therefore, the FLS has high relevance especially for bolted andwelded details in WTs. Structural details may fail according to one of the following three crackgrowth cases [62, p. 15]:
• fatigue crack growth from the weld toe into the base material
• fatigue crack growth from the weld root through the fillet weld
• fatigue crack growth from the weld root into the base material
• fatigue crack growth from a surface irregularity or notch into the base material
Common fatigue strength assessment methods are represented by the nominal stress, structuralstress, notch stress, notch strain, and crack growth concepts. Each of these methods arebriefly explained by Keindorf [117]. Other references for aspects of fatigue analysis are fromHaibach [89] and Radaj and Vormwald [154]. Owing to the mainly focussed tower conceptin this work, only base material structural details occur for the main members, wherefore themost simple nominal stress concept is applied. The nominal stress concept uses the stressesextracted by means of fundamental beam analysis with its net cross sections. All lifetime stresscycles at a structural point may be extrapolated from short time timeseries of ASE analysesand counted with respect to a certain cycle count algorithm. A widely used counting algorithmfor stress cycles is the Rainflow counting developed among others [154, p. 271] by Matsuishiand Endo [138]. Counted stress cycles are assembled to binned stress range spectra, wherea certain stress range corresponds to a certain number of occurring cycles over the lifetime.Hypothetical beam discontinuities are accounted for on the resistance side by correspondingnominal stress S-N curves for a characteristic detail.
23
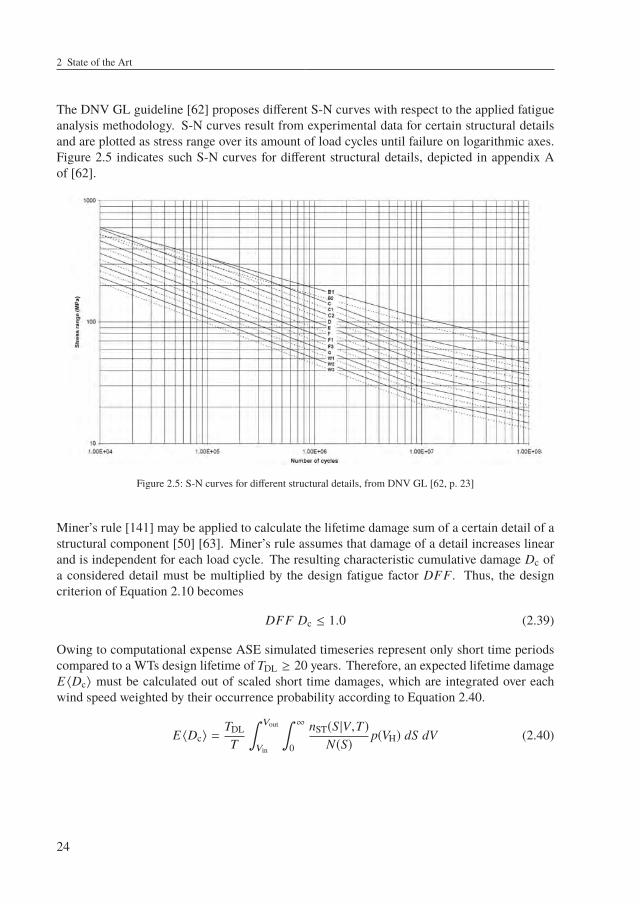
2 State of the Art
The DNV GL guideline [62] proposes different S-N curves with respect to the applied fatigueanalysis methodology. S-N curves result from experimental data for certain structural detailsand are plotted as stress range over its amount of load cycles until failure on logarithmic axes.Figure 2.5 indicates such S-N curves for different structural details, depicted in appendix Aof [62].
Figure 2.5: S-N curves for different structural details, from DNV GL [62, p. 23]
Miner’s rule [141] may be applied to calculate the lifetime damage sum of a certain detail of astructural component [50] [63]. Miner’s rule assumes that damage of a detail increases linearand is independent for each load cycle. The resulting characteristic cumulative damage Dc ofa considered detail must be multiplied by the design fatigue factor DFF. Thus, the designcriterion of Equation 2.10 becomes
DFF Dc ≤ 1.0 (2.39)
Owing to computational expense ASE simulated timeseries represent only short time periodscompared to a WTs design lifetime of TDL ≥ 20 years. Therefore, an expected lifetime damageE 〈Dc〉 must be calculated out of scaled short time damages, which are integrated over eachwind speed weighted by their occurrence probability according to Equation 2.40.
E 〈Dc〉 =TDL
T
∫ Vout
Vin
∫ ∞
0
nST(S |V,T)N(S)
p(VH) dS dV (2.40)
24
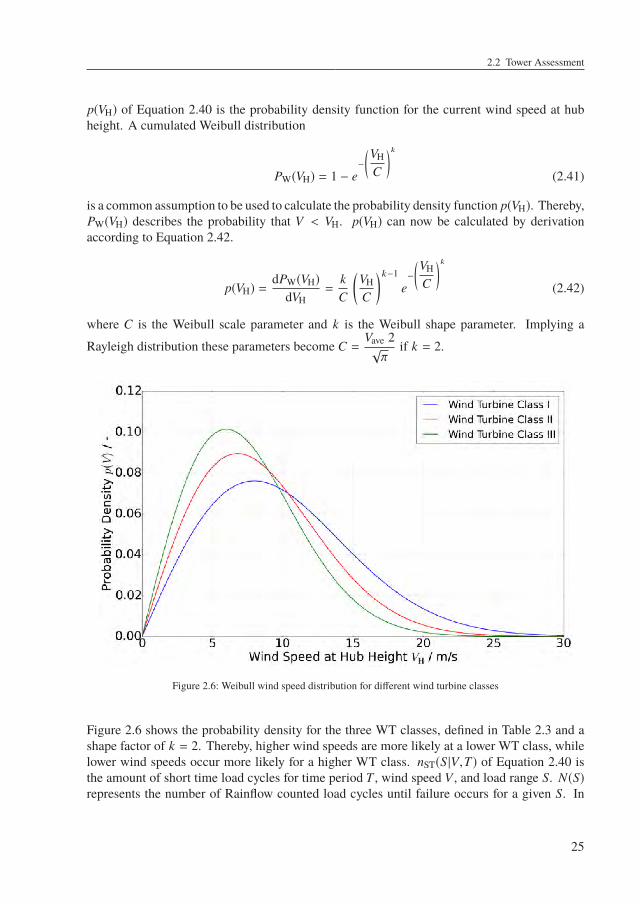
2.2 Tower Assessment
p(VH) of Equation 2.40 is the probability density function for the current wind speed at hubheight. A cumulated Weibull distribution
PW(VH) = 1 − e−
(VH
C
)k(2.41)
is a common assumption to be used to calculate the probability density function p(VH). Thereby,PW(VH) describes the probability that V < VH. p(VH) can now be calculated by derivationaccording to Equation 2.42.
p(VH) =dPW(VH)
dVH=
kC
(VH
C
)k−1e−
(VH
C
)k(2.42)
where C is the Weibull scale parameter and k is the Weibull shape parameter. Implying a
Rayleigh distribution these parameters become C =Vave 2√π
if k = 2.
Figure 2.6: Weibull wind speed distribution for different wind turbine classes
Figure 2.6 shows the probability density for the three WT classes, defined in Table 2.3 and ashape factor of k = 2. Thereby, higher wind speeds are more likely at a lower WT class, whilelower wind speeds occur more likely for a higher WT class. nST(S |V,T) of Equation 2.40 isthe amount of short time load cycles for time period T , wind speed V , and load range S. N(S)represents the number of Rainflow counted load cycles until failure occurs for a given S. In
25
2 State of the Art
case of detail categories provided by DNVGL [62], S-N curves represent a survival probabilityof 97.7 %. The IEC 61400-1 based fatigue evaluation tool MLife [94] models the S-N curve by
N(S) =©«
S0 − |SF |
12
S
ª®®¬m
(2.43)
where S0 is the theoretical load range at the intersection between the curve and the log (S) axis,|SF | is an absolute prescribed fixed load mean, and m is the Wöhler exponent. S0 and m dependon the specific material and detail category. Equation 2.43 is valid only for one load mean, butin reality each load cycle appears over an individual mean value. Therefore, each calculatedload range Si must be corrected according to Goodman
SG,i = Si
(S0 − |SF |
S0 − |Si |
)(2.44)
where a Goodman exponent of one is assumed.
2.2.7 Accidental Limit State
According toDNVGL [63] special accidental events and their consequencesmust be consideredwithin the ALS. Thereby, accidents, such as
• dropped objects
• collision impact
• explosions
• fire
• change of intended pressure difference
may occur under different environmental and operating conditions, which should be examinedlikewise. ALSs with impacts of agriculturally machinery for land-based structures or boat col-lisions for offshore structures demand dynamic nonlinear time simulations. These simulationsmust represent each collision phase and must account for the impact energy dissipation of theWT support structure. The energy dissipation of the colliding object may also accounted for,but must be fully documented. For fire or explosive ALSs the engineer may consider to reducethe amount of explosive matters and to use fire suppressing equipment. DNV GL [63] listssome possible damages as consequence of an accidental event:
• large permanent deformations
• loss of stability or disconnections, e.g. denting of a monopile shell wall
26
2.2 Tower Assessment
• buckling failure of a brace member in a jacket structure
• formation of a plastic hinge in a boat bumper
• rupture of a bolted joint
Such damages should occur without complete loss of structural integrity and should not leadto further post accidental damage developments. The post accidental structural behaviour interms of safety for humans and the environment is likewise important. A post accidentalanalysis should account for expected gravity loads, specified variable loads, and specifiedenvironmental loads, but no additional accidental actions. Detailed information about designagainst accidental loads are given in the respective recommended practice report of DNV GL,called DNVGL-RP-C204 [65]
2.2.8 Serviceability Limit State
The SLS considers the consequences of extreme characteristic loads and loads with a loadduration distribution of 10−4 and 10−2 of the whole WT lifetime [63]. Relevant consequencesare permanent deformations or yielding of structural members, excessive vibrations, differentialsettlements of foundations, intolerable tilt of a WT, collision of the blade with the supportstructure, and temperature induced deformations.
Natural Frequency RequirementsExcessive structural vibration should be avoided to prevent rapid fatigue damage accumulation,affecting turbine operation and energy production, and discomfort for people. Therefore, themain excitation frequencies fR,i should occur with certain distance to the structural naturalfrequencies f0, j . DNV GL gives the rule
fR,if0, j≤ 0.95 or
fR,if0, j≥ 1.05 (2.45)
for each combination of i and j [63, p. 35]. In practice two main excitation frequencies arerelevant for land-based WT support structures: The 1-per-revolution (1p) and n-per-revolution(np) excitation frequency where n denotes the amount of blades. Frequency overlaps of fR,iand f0, j may occur during start-up and shut-down of the WT, but their relevance is small forshort time periods. Furthermore, overlapping excitation frequencies with structural naturalfrequencies are allowed if resonance effects can be omitted by damping devices or vibrationmonitoring systems and corresponding control manoeuvres [63].
Blade to Tower ClearanceRotor blades should never collide with the WT support structure. Therefore, DNV GL definessome requirements to theminimumblade to tower clearance under serviceability load conditionsin the rotor blades standard DNVGL-ST-0376 [61]. In general blade to tower clearance shallnot become less than 30 % of the unloaded state and must be evaluated by ASE simulations.The limitation can be reduced to 25 % by means of additional deflection measurements at
27
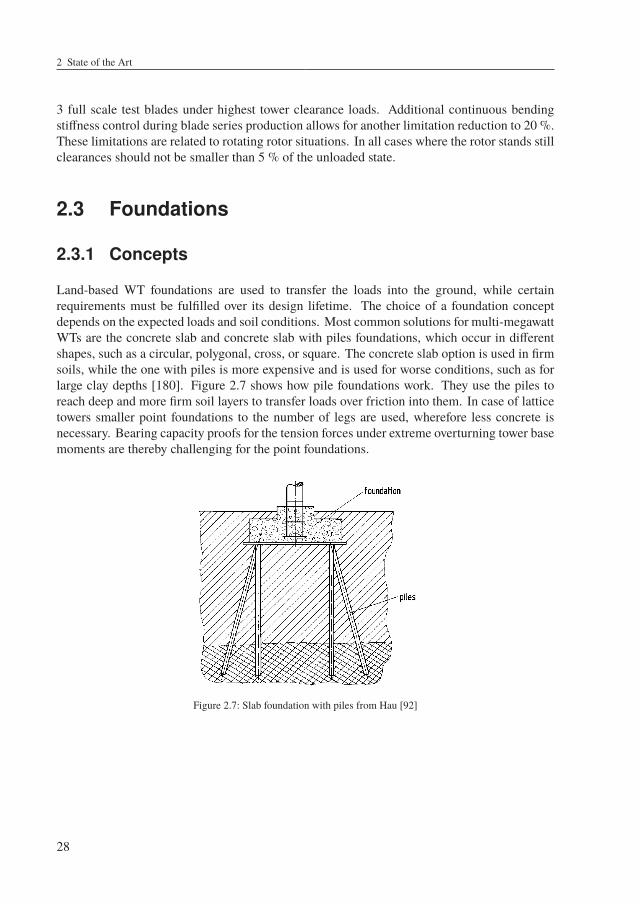
2 State of the Art
3 full scale test blades under highest tower clearance loads. Additional continuous bendingstiffness control during blade series production allows for another limitation reduction to 20 %.These limitations are related to rotating rotor situations. In all cases where the rotor stands stillclearances should not be smaller than 5 % of the unloaded state.
2.3 Foundations
2.3.1 Concepts
Land-based WT foundations are used to transfer the loads into the ground, while certainrequirements must be fulfilled over its design lifetime. The choice of a foundation conceptdepends on the expected loads and soil conditions. Most common solutions for multi-megawattWTs are the concrete slab and concrete slab with piles foundations, which occur in differentshapes, such as a circular, polygonal, cross, or square. The concrete slab option is used in firmsoils, while the one with piles is more expensive and is used for worse conditions, such as forlarge clay depths [180]. Figure 2.7 shows how pile foundations work. They use the piles toreach deep and more firm soil layers to transfer loads over friction into them. In case of latticetowers smaller point foundations to the number of legs are used, wherefore less concrete isnecessary. Bearing capacity proofs for the tension forces under extreme overturning tower basemoments are thereby challenging for the point foundations.
Figure 2.7: Slab foundation with piles from Hau [92]
28
2.4 Manufacturing Technology
2.3.2 Assessment and Guidelines
The assessment of WT foundations must ensure at least the following requirements accordingto Svensson [180]:
• The structure must be stable
• The material strength must not be exceeded
• The function of the structure must be maintained
• The structure should be aesthetically pleasing
• The structure has to be resistant against external factors, such as fire, earthquake, flooding,frost, moisture, temperature differences, traffic accidents, and vermin such as termitesand insects etc.
However, in most cases this means that the foundation and the surrounding soil must resistextreme tower base overturning moments, shear forces, and fatigue loadings, while certaincrack widths in the foundation should not be exceeded. Especially important guidelines forthe foundation assessment are the Eurocodes 0 - Basis of Structural Design (EN 1990), 1 -Actions on Structures (EN 1991), 2 - Design of Concrete Structures (EN 1992), 3 - Design ofSteel Structures (EN 1993), 4 - Design of Composite Steel and Concrete Structures (EN 1994),7 - Geotechnical Design (EN 1997), and 8 - Design of Structures for Earthquake Resistance(EN 1998).
2.4 Manufacturing Technology
This section gives a brief overview over tubular steel tower and lattice tower steel membermanufacturing.
2.4.1 Tubular Steel Tower Manufacturing
The most common tubular steel tower concept is manufactured out of rolled and welded steelsheets. In terms of rolling, these steel sheets are assumed to be limited to wall thicknesses ofabout 75 mm [68]. After rolling a longitudinal weld seam connects both edges of one sheet.Afterwards, several of such cylindrical sheets will be welded together circumferential to onetransportable pipe section, such as shown in Figure 2.8.
29
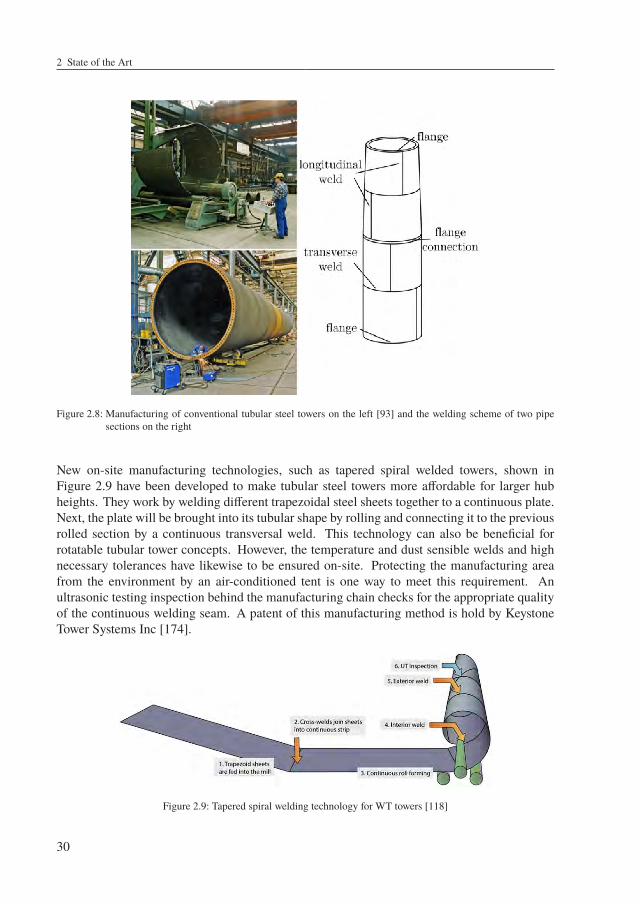
2 State of the Art
Figure 2.8: Manufacturing of conventional tubular steel towers on the left [93] and the welding scheme of two pipesections on the right
New on-site manufacturing technologies, such as tapered spiral welded towers, shown inFigure 2.9 have been developed to make tubular steel towers more affordable for larger hubheights. They work by welding different trapezoidal steel sheets together to a continuous plate.Next, the plate will be brought into its tubular shape by rolling and connecting it to the previousrolled section by a continuous transversal weld. This technology can also be beneficial forrotatable tubular tower concepts. However, the temperature and dust sensible welds and highnecessary tolerances have likewise to be ensured on-site. Protecting the manufacturing areafrom the environment by an air-conditioned tent is one way to meet this requirement. Anultrasonic testing inspection behind the manufacturing chain checks for the appropriate qualityof the continuous welding seam. A patent of this manufacturing method is hold by KeystoneTower Systems Inc [174].
Figure 2.9: Tapered spiral welding technology for WT towers [118]
30
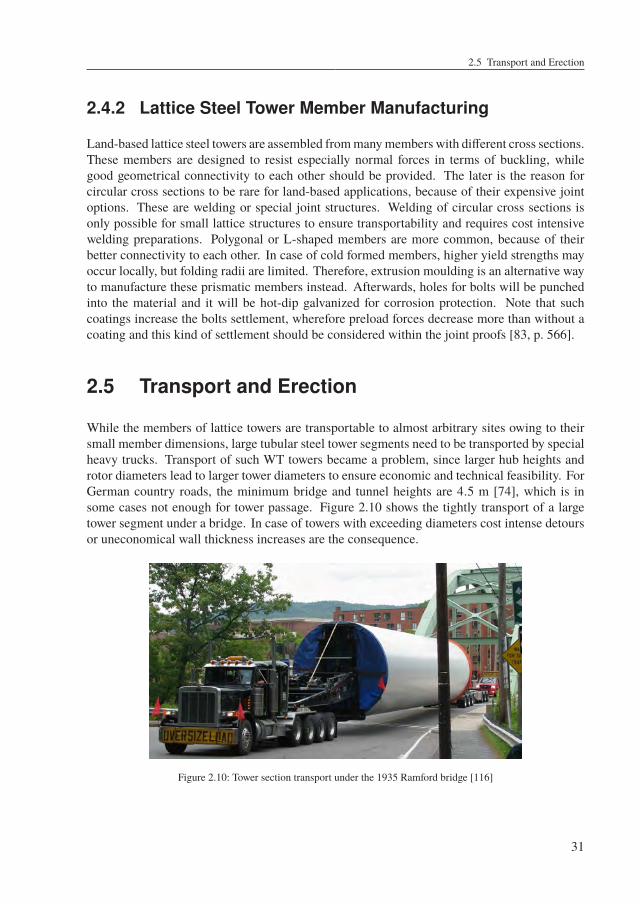
2.5 Transport and Erection
2.4.2 Lattice Steel Tower Member Manufacturing
Land-based lattice steel towers are assembled frommanymembers with different cross sections.These members are designed to resist especially normal forces in terms of buckling, whilegood geometrical connectivity to each other should be provided. The later is the reason forcircular cross sections to be rare for land-based applications, because of their expensive jointoptions. These are welding or special joint structures. Welding of circular cross sections isonly possible for small lattice structures to ensure transportability and requires cost intensivewelding preparations. Polygonal or L-shaped members are more common, because of theirbetter connectivity to each other. In case of cold formed members, higher yield strengths mayoccur locally, but folding radii are limited. Therefore, extrusion moulding is an alternative wayto manufacture these prismatic members instead. Afterwards, holes for bolts will be punchedinto the material and it will be hot-dip galvanized for corrosion protection. Note that suchcoatings increase the bolts settlement, wherefore preload forces decrease more than without acoating and this kind of settlement should be considered within the joint proofs [83, p. 566].
2.5 Transport and Erection
While the members of lattice towers are transportable to almost arbitrary sites owing to theirsmall member dimensions, large tubular steel tower segments need to be transported by specialheavy trucks. Transport of such WT towers became a problem, since larger hub heights androtor diameters lead to larger tower diameters to ensure economic and technical feasibility. ForGerman country roads, the minimum bridge and tunnel heights are 4.5 m [74], which is insome cases not enough for tower passage. Figure 2.10 shows the tightly transport of a largetower segment under a bridge. In case of towers with exceeding diameters cost intense detoursor uneconomical wall thickness increases are the consequence.
Figure 2.10: Tower section transport under the 1935 Ramford bridge [116]
31
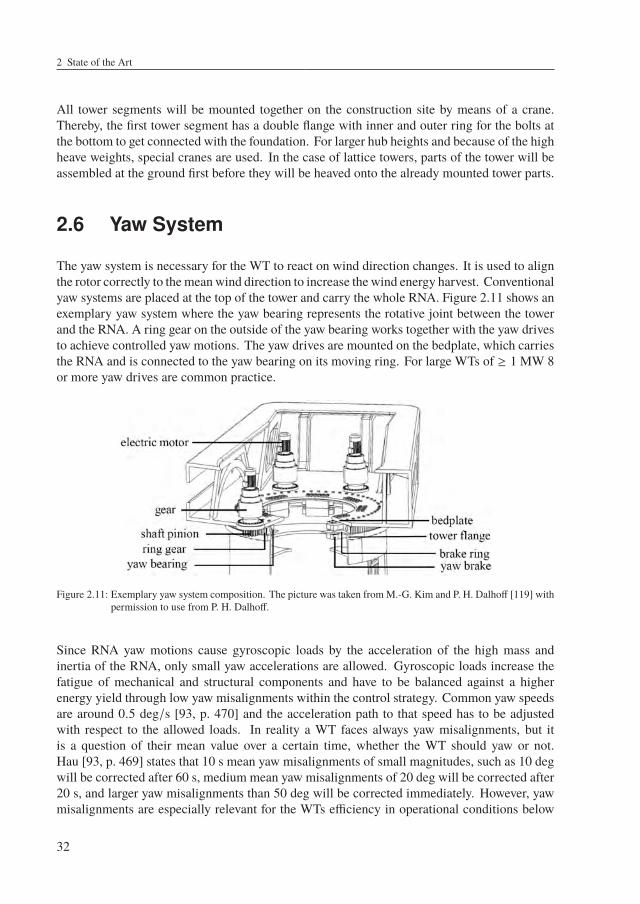
2 State of the Art
All tower segments will be mounted together on the construction site by means of a crane.Thereby, the first tower segment has a double flange with inner and outer ring for the bolts atthe bottom to get connected with the foundation. For larger hub heights and because of the highheave weights, special cranes are used. In the case of lattice towers, parts of the tower will beassembled at the ground first before they will be heaved onto the already mounted tower parts.
2.6 Yaw System
The yaw system is necessary for the WT to react on wind direction changes. It is used to alignthe rotor correctly to the meanwind direction to increase the wind energy harvest. Conventionalyaw systems are placed at the top of the tower and carry the whole RNA. Figure 2.11 shows anexemplary yaw system where the yaw bearing represents the rotative joint between the towerand the RNA. A ring gear on the outside of the yaw bearing works together with the yaw drivesto achieve controlled yaw motions. The yaw drives are mounted on the bedplate, which carriesthe RNA and is connected to the yaw bearing on its moving ring. For large WTs of ≥ 1 MW 8or more yaw drives are common practice.
Figure 2.11: Exemplary yaw system composition. The picture was taken fromM.-G. Kim and P. H. Dalhoff [119] withpermission to use from P. H. Dalhoff.
Since RNA yaw motions cause gyroscopic loads by the acceleration of the high mass andinertia of the RNA, only small yaw accelerations are allowed. Gyroscopic loads increase thefatigue of mechanical and structural components and have to be balanced against a higherenergy yield through low yaw misalignments within the control strategy. Common yaw speedsare around 0.5 deg/s [93, p. 470] and the acceleration path to that speed has to be adjustedwith respect to the allowed loads. In reality a WT faces always yaw misalignments, but itis a question of their mean value over a certain time, whether the WT should yaw or not.Hau [93, p. 469] states that 10 s mean yaw misalignments of small magnitudes, such as 10 degwill be corrected after 60 s, medium mean yaw misalignments of 20 deg will be corrected after20 s, and larger yaw misalignments than 50 deg will be corrected immediately. However, yawmisalignments are especially relevant for the WTs efficiency in operational conditions below
32
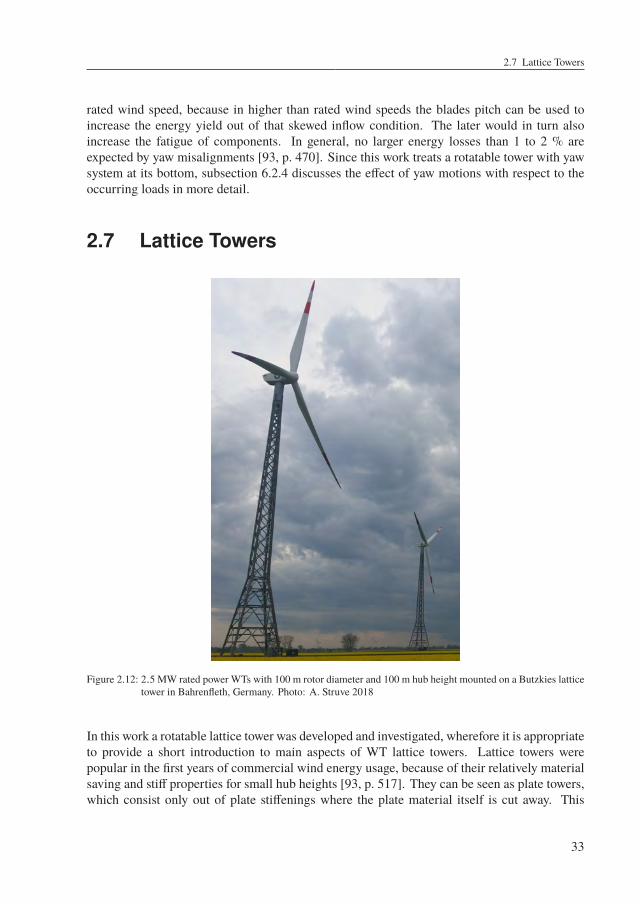
2.7 Lattice Towers
rated wind speed, because in higher than rated wind speeds the blades pitch can be used toincrease the energy yield out of that skewed inflow condition. The later would in turn alsoincrease the fatigue of components. In general, no larger energy losses than 1 to 2 % areexpected by yaw misalignments [93, p. 470]. Since this work treats a rotatable tower with yawsystem at its bottom, subsection 6.2.4 discusses the effect of yaw motions with respect to theoccurring loads in more detail.
2.7 Lattice Towers
Figure 2.12: 2.5 MW rated power WTs with 100 m rotor diameter and 100 m hub height mounted on a Butzkies latticetower in Bahrenfleth, Germany. Photo: A. Struve 2018
In this work a rotatable lattice tower was developed and investigated, wherefore it is appropriateto provide a short introduction to main aspects of WT lattice towers. Lattice towers werepopular in the first years of commercial wind energy usage, because of their relatively materialsaving and stiff properties for small hub heights [93, p. 517]. They can be seen as plate towers,which consist only out of plate stiffenings where the plate material itself is cut away. This
33
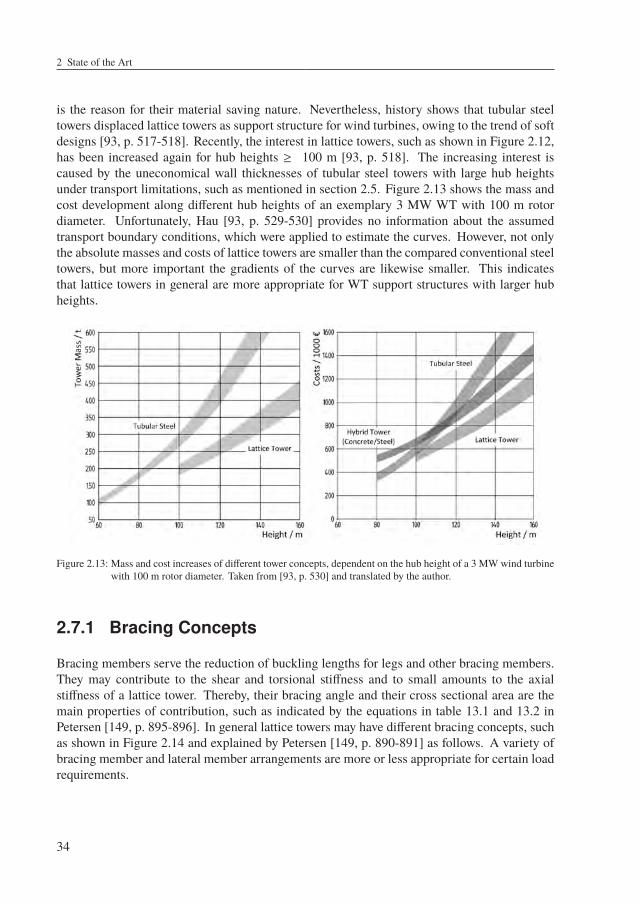
2 State of the Art
is the reason for their material saving nature. Nevertheless, history shows that tubular steeltowers displaced lattice towers as support structure for wind turbines, owing to the trend of softdesigns [93, p. 517-518]. Recently, the interest in lattice towers, such as shown in Figure 2.12,has been increased again for hub heights ≥ 100 m [93, p. 518]. The increasing interest iscaused by the uneconomical wall thicknesses of tubular steel towers with large hub heightsunder transport limitations, such as mentioned in section 2.5. Figure 2.13 shows the mass andcost development along different hub heights of an exemplary 3 MW WT with 100 m rotordiameter. Unfortunately, Hau [93, p. 529-530] provides no information about the assumedtransport boundary conditions, which were applied to estimate the curves. However, not onlythe absolute masses and costs of lattice towers are smaller than the compared conventional steeltowers, but more important the gradients of the curves are likewise smaller. This indicatesthat lattice towers in general are more appropriate for WT support structures with larger hubheights.
Figure 2.13: Mass and cost increases of different tower concepts, dependent on the hub height of a 3 MW wind turbinewith 100 m rotor diameter. Taken from [93, p. 530] and translated by the author.
2.7.1 Bracing Concepts
Bracing members serve the reduction of buckling lengths for legs and other bracing members.They may contribute to the shear and torsional stiffness and to small amounts to the axialstiffness of a lattice tower. Thereby, their bracing angle and their cross sectional area are themain properties of contribution, such as indicated by the equations in table 13.1 and 13.2 inPetersen [149, p. 895-896]. In general lattice towers may have different bracing concepts, suchas shown in Figure 2.14 and explained by Petersen [149, p. 890-891] as follows. A variety ofbracing member and lateral member arrangements are more or less appropriate for certain loadrequirements.
34
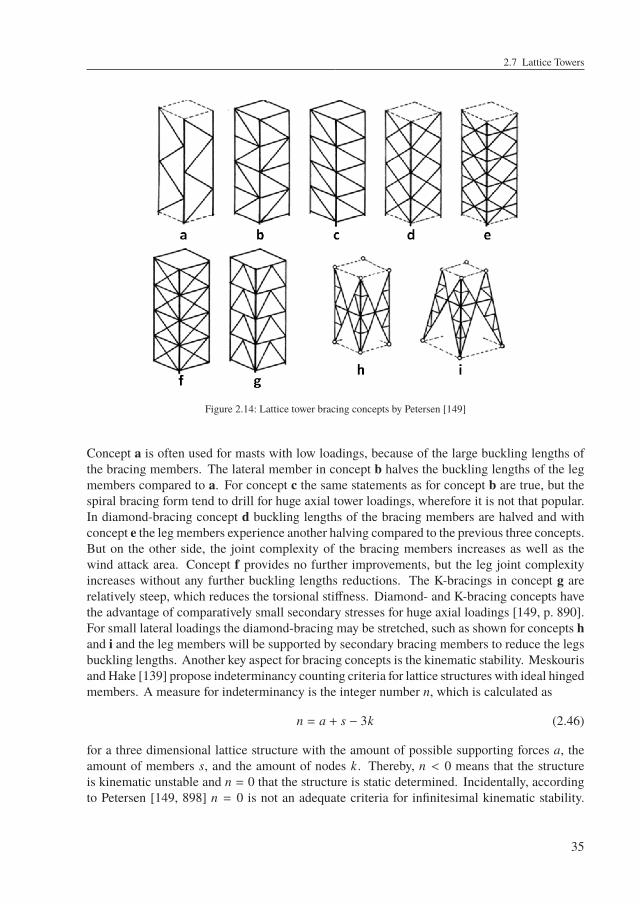
2.7 Lattice Towers
Figure 2.14: Lattice tower bracing concepts by Petersen [149]
Concept a is often used for masts with low loadings, because of the large buckling lengths ofthe bracing members. The lateral member in concept b halves the buckling lengths of the legmembers compared to a. For concept c the same statements as for concept b are true, but thespiral bracing form tend to drill for huge axial tower loadings, wherefore it is not that popular.In diamond-bracing concept d buckling lengths of the bracing members are halved and withconcept e the leg members experience another halving compared to the previous three concepts.But on the other side, the joint complexity of the bracing members increases as well as thewind attack area. Concept f provides no further improvements, but the leg joint complexityincreases without any further buckling lengths reductions. The K-bracings in concept g arerelatively steep, which reduces the torsional stiffness. Diamond- and K-bracing concepts havethe advantage of comparatively small secondary stresses for huge axial loadings [149, p. 890].For small lateral loadings the diamond-bracing may be stretched, such as shown for concepts hand i and the leg members will be supported by secondary bracing members to reduce the legsbuckling lengths. Another key aspect for bracing concepts is the kinematic stability. Meskourisand Hake [139] propose indeterminancy counting criteria for lattice structures with ideal hingedmembers. A measure for indeterminancy is the integer number n, which is calculated as
n = a + s − 3k (2.46)
for a three dimensional lattice structure with the amount of possible supporting forces a, theamount of members s, and the amount of nodes k. Thereby, n < 0 means that the structureis kinematic unstable and n = 0 that the structure is static determined. Incidentally, accordingto Petersen [149, 898] n = 0 is not an adequate criteria for infinitesimal kinematic stability.
35
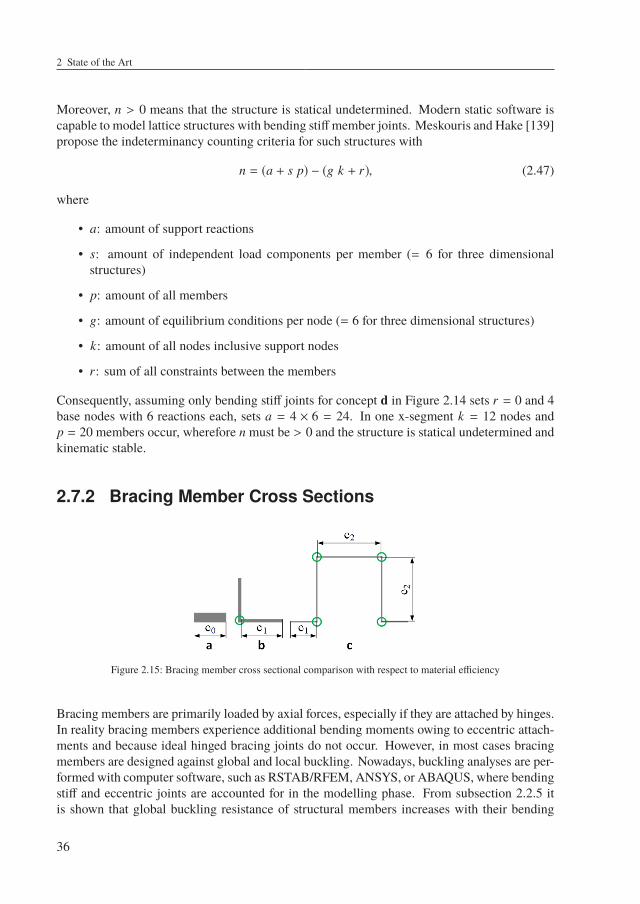
2 State of the Art
Moreover, n > 0 means that the structure is statical undetermined. Modern static software iscapable to model lattice structures with bending stiff member joints. Meskouris and Hake [139]propose the indeterminancy counting criteria for such structures with
n = (a + s p) − (g k + r), (2.47)
where
• a: amount of support reactions
• s: amount of independent load components per member (= 6 for three dimensionalstructures)
• p: amount of all members
• g: amount of equilibrium conditions per node (= 6 for three dimensional structures)
• k: amount of all nodes inclusive support nodes
• r: sum of all constraints between the members
Consequently, assuming only bending stiff joints for concept d in Figure 2.14 sets r = 0 and 4base nodes with 6 reactions each, sets a = 4 × 6 = 24. In one x-segment k = 12 nodes andp = 20 members occur, wherefore n must be > 0 and the structure is statical undetermined andkinematic stable.
2.7.2 Bracing Member Cross Sections
Figure 2.15: Bracing member cross sectional comparison with respect to material efficiency
Bracing members are primarily loaded by axial forces, especially if they are attached by hinges.In reality bracing members experience additional bending moments owing to eccentric attach-ments and because ideal hinged bracing joints do not occur. However, in most cases bracingmembers are designed against global and local buckling. Nowadays, buckling analyses are per-formed with computer software, such as RSTAB/RFEM, ANSYS, or ABAQUS, where bendingstiff and eccentric joints are accounted for in the modelling phase. From subsection 2.2.5 itis shown that global buckling resistance of structural members increases with their bending
36
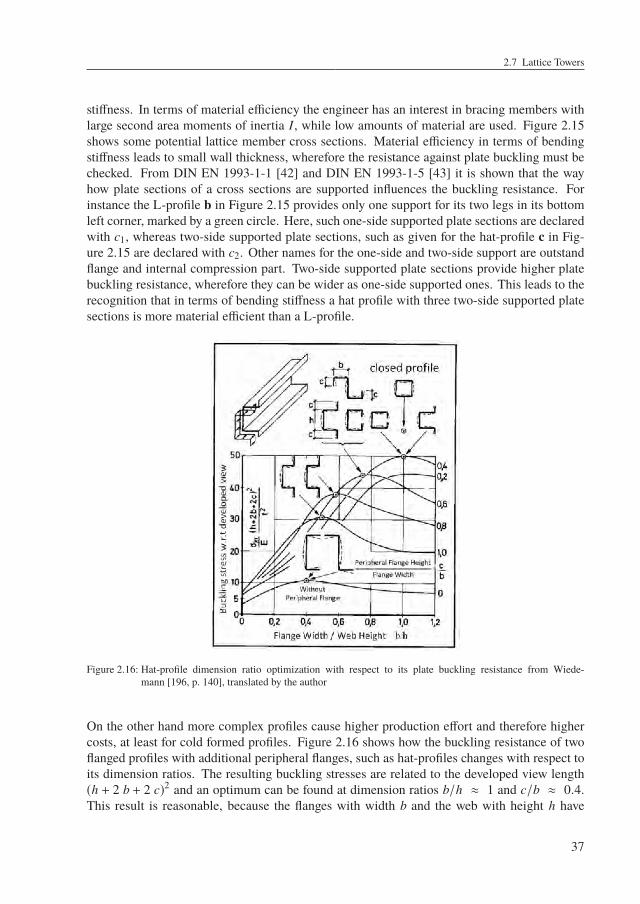
2.7 Lattice Towers
stiffness. In terms of material efficiency the engineer has an interest in bracing members withlarge second area moments of inertia I, while low amounts of material are used. Figure 2.15shows some potential lattice member cross sections. Material efficiency in terms of bendingstiffness leads to small wall thickness, wherefore the resistance against plate buckling must bechecked. From DIN EN 1993-1-1 [42] and DIN EN 1993-1-5 [43] it is shown that the wayhow plate sections of a cross sections are supported influences the buckling resistance. Forinstance the L-profile b in Figure 2.15 provides only one support for its two legs in its bottomleft corner, marked by a green circle. Here, such one-side supported plate sections are declaredwith c1, whereas two-side supported plate sections, such as given for the hat-profile c in Fig-ure 2.15 are declared with c2. Other names for the one-side and two-side support are outstandflange and internal compression part. Two-side supported plate sections provide higher platebuckling resistance, wherefore they can be wider as one-side supported ones. This leads to therecognition that in terms of bending stiffness a hat profile with three two-side supported platesections is more material efficient than a L-profile.
Figure 2.16: Hat-profile dimension ratio optimization with respect to its plate buckling resistance from Wiede-mann [196, p. 140], translated by the author
On the other hand more complex profiles cause higher production effort and therefore highercosts, at least for cold formed profiles. Figure 2.16 shows how the buckling resistance of twoflanged profiles with additional peripheral flanges, such as hat-profiles changes with respect toits dimension ratios. The resulting buckling stresses are related to the developed view length(h + 2 b + 2 c)2 and an optimum can be found at dimension ratios b/h ≈ 1 and c/b ≈ 0.4.This result is reasonable, because the flanges with width b and the web with height h have
37
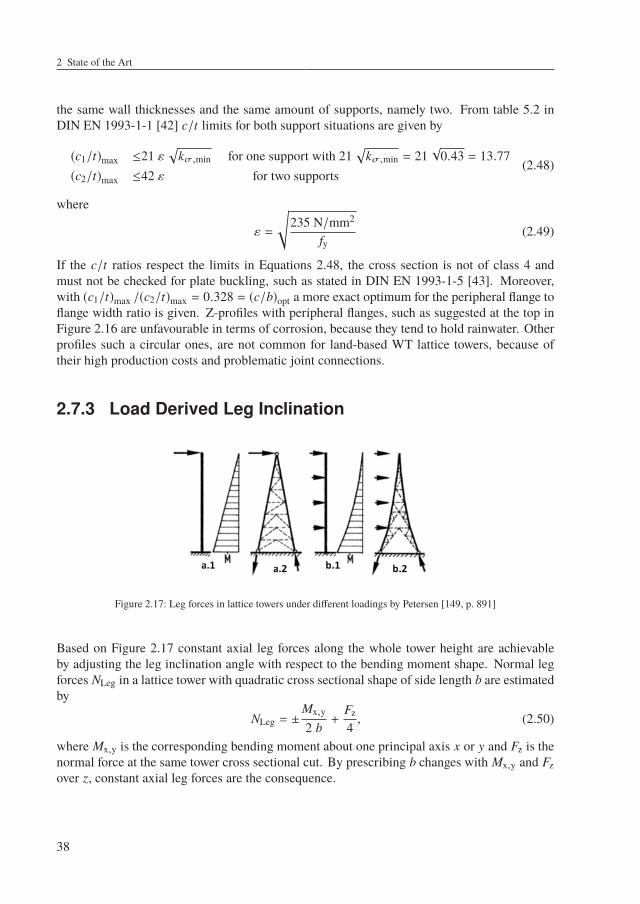
2 State of the Art
the same wall thicknesses and the same amount of supports, namely two. From table 5.2 inDIN EN 1993-1-1 [42] c/t limits for both support situations are given by
(c1/t)max ≤21 ε√
kσ,min for one support with 21√
kσ,min = 21√
0.43 = 13.77(c2/t)max ≤42 ε for two supports
(2.48)
where
ε =
√235 N/mm2
fy(2.49)
If the c/t ratios respect the limits in Equations 2.48, the cross section is not of class 4 andmust not be checked for plate buckling, such as stated in DIN EN 1993-1-5 [43]. Moreover,with (c1/t)max /(c2/t)max = 0.328 = (c/b)opt a more exact optimum for the peripheral flange toflange width ratio is given. Z-profiles with peripheral flanges, such as suggested at the top inFigure 2.16 are unfavourable in terms of corrosion, because they tend to hold rainwater. Otherprofiles such a circular ones, are not common for land-based WT lattice towers, because oftheir high production costs and problematic joint connections.
2.7.3 Load Derived Leg Inclination
Figure 2.17: Leg forces in lattice towers under different loadings by Petersen [149, p. 891]
Based on Figure 2.17 constant axial leg forces along the whole tower height are achievableby adjusting the leg inclination angle with respect to the bending moment shape. Normal legforces NLeg in a lattice tower with quadratic cross sectional shape of side length b are estimatedby
NLeg = ±Mx,y
2 b+
Fz
4, (2.50)
where Mx,y is the corresponding bending moment about one principal axis x or y and Fz is thenormal force at the same tower cross sectional cut. By prescribing b changes with Mx,y and Fzover z, constant axial leg forces are the consequence.
38
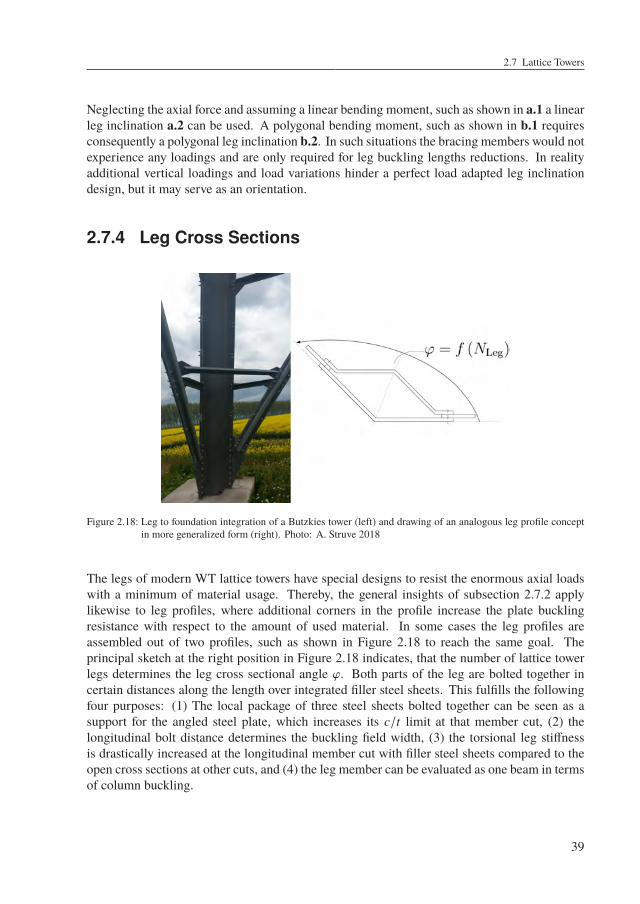
2.7 Lattice Towers
Neglecting the axial force and assuming a linear bending moment, such as shown in a.1 a linearleg inclination a.2 can be used. A polygonal bending moment, such as shown in b.1 requiresconsequently a polygonal leg inclination b.2. In such situations the bracing members would notexperience any loadings and are only required for leg buckling lengths reductions. In realityadditional vertical loadings and load variations hinder a perfect load adapted leg inclinationdesign, but it may serve as an orientation.
2.7.4 Leg Cross Sections
Figure 2.18: Leg to foundation integration of a Butzkies tower (left) and drawing of an analogous leg profile conceptin more generalized form (right). Photo: A. Struve 2018
The legs of modern WT lattice towers have special designs to resist the enormous axial loadswith a minimum of material usage. Thereby, the general insights of subsection 2.7.2 applylikewise to leg profiles, where additional corners in the profile increase the plate bucklingresistance with respect to the amount of used material. In some cases the leg profiles areassembled out of two profiles, such as shown in Figure 2.18 to reach the same goal. Theprincipal sketch at the right position in Figure 2.18 indicates, that the number of lattice towerlegs determines the leg cross sectional angle ϕ. Both parts of the leg are bolted together incertain distances along the length over integrated filler steel sheets. This fulfills the followingfour purposes: (1) The local package of three steel sheets bolted together can be seen as asupport for the angled steel plate, which increases its c/t limit at that member cut, (2) thelongitudinal bolt distance determines the buckling field width, (3) the torsional leg stiffnessis drastically increased at the longitudinal member cut with filler steel sheets compared to theopen cross sections at other cuts, and (4) the leg member can be evaluated as one beam in termsof column buckling.
39
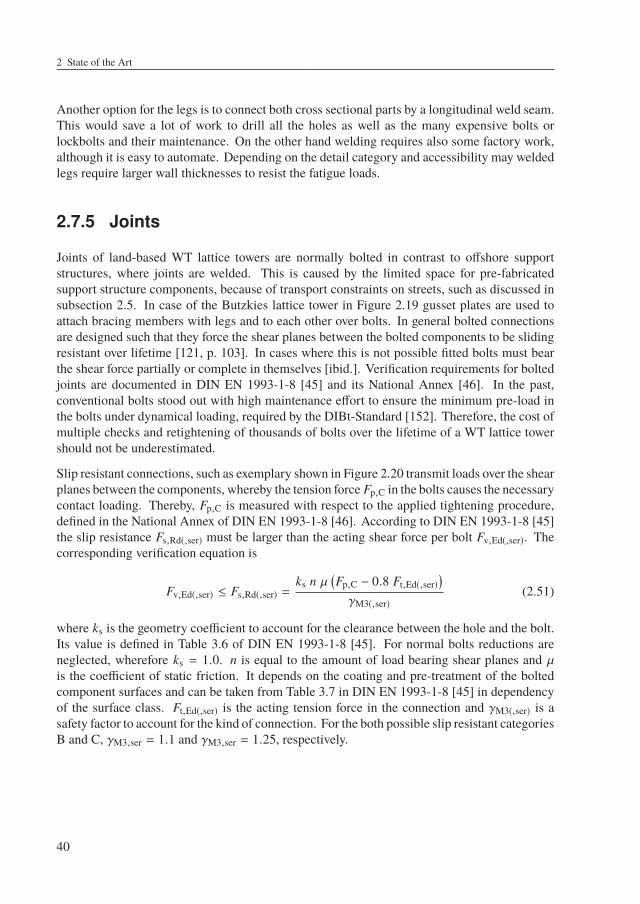
2 State of the Art
Another option for the legs is to connect both cross sectional parts by a longitudinal weld seam.This would save a lot of work to drill all the holes as well as the many expensive bolts orlockbolts and their maintenance. On the other hand welding requires also some factory work,although it is easy to automate. Depending on the detail category and accessibility may weldedlegs require larger wall thicknesses to resist the fatigue loads.
2.7.5 Joints
Joints of land-based WT lattice towers are normally bolted in contrast to offshore supportstructures, where joints are welded. This is caused by the limited space for pre-fabricatedsupport structure components, because of transport constraints on streets, such as discussed insubsection 2.5. In case of the Butzkies lattice tower in Figure 2.19 gusset plates are used toattach bracing members with legs and to each other over bolts. In general bolted connectionsare designed such that they force the shear planes between the bolted components to be slidingresistant over lifetime [121, p. 103]. In cases where this is not possible fitted bolts must bearthe shear force partially or complete in themselves [ibid.]. Verification requirements for boltedjoints are documented in DIN EN 1993-1-8 [45] and its National Annex [46]. In the past,conventional bolts stood out with high maintenance effort to ensure the minimum pre-load inthe bolts under dynamical loading, required by the DIBt-Standard [152]. Therefore, the cost ofmultiple checks and retightening of thousands of bolts over the lifetime of a WT lattice towershould not be underestimated.
Slip resistant connections, such as exemplary shown in Figure 2.20 transmit loads over the shearplanes between the components, whereby the tension force Fp,C in the bolts causes the necessarycontact loading. Thereby, Fp,C is measured with respect to the applied tightening procedure,defined in the National Annex of DIN EN 1993-1-8 [46]. According to DIN EN 1993-1-8 [45]the slip resistance Fs,Rd(,ser) must be larger than the acting shear force per bolt Fv,Ed(,ser). Thecorresponding verification equation is
Fv,Ed(,ser) ≤ Fs,Rd(,ser) =ks n µ
(Fp,C − 0.8 Ft,Ed(,ser)
)γM3(,ser)
(2.51)
where ks is the geometry coefficient to account for the clearance between the hole and the bolt.Its value is defined in Table 3.6 of DIN EN 1993-1-8 [45]. For normal bolts reductions areneglected, wherefore ks = 1.0. n is equal to the amount of load bearing shear planes and µis the coefficient of static friction. It depends on the coating and pre-treatment of the boltedcomponent surfaces and can be taken from Table 3.7 in DIN EN 1993-1-8 [45] in dependencyof the surface class. Ft,Ed(,ser) is the acting tension force in the connection and γM3(,ser) is asafety factor to account for the kind of connection. For the both possible slip resistant categoriesB and C, γM3,ser = 1.1 and γM3,ser = 1.25, respectively.
40
2.7 Lattice Towers
Figure 2.19: Different joints of a Butzkies lattice tower. Photo: A. Struve 2018
Furthermore, the bolted parts must be checked against material yielding in the net cross sectionand for the bearing of the hole. Depending on the bolt connection category the bolts must bechecked against shearing. The fatigue check of the shear planes can be neglected, because ofthe distributed loads over the contact plane.
To overcome the challenges concerning maintenance, slip resistant lockbolt joints with lowvariations in the pre-load force, good visual inspection capability, and high possible pre-load forces are a common solution [83, p. 562]. Moreover, Glienke et al. [83] investigatedand quantified the pre-load losses for slip resistant connections under dynamical loading in thecontext ofWT lattice towers. They propose a promising verification procedure of slide resistantconnections, which accounts for the pre-load losses to reduce or to avoid later maintenanceeffort. However, further research is required to account for common component surface coatingsand pre-treatments and for clamping length to diameter ratios [83, p. 569].
41
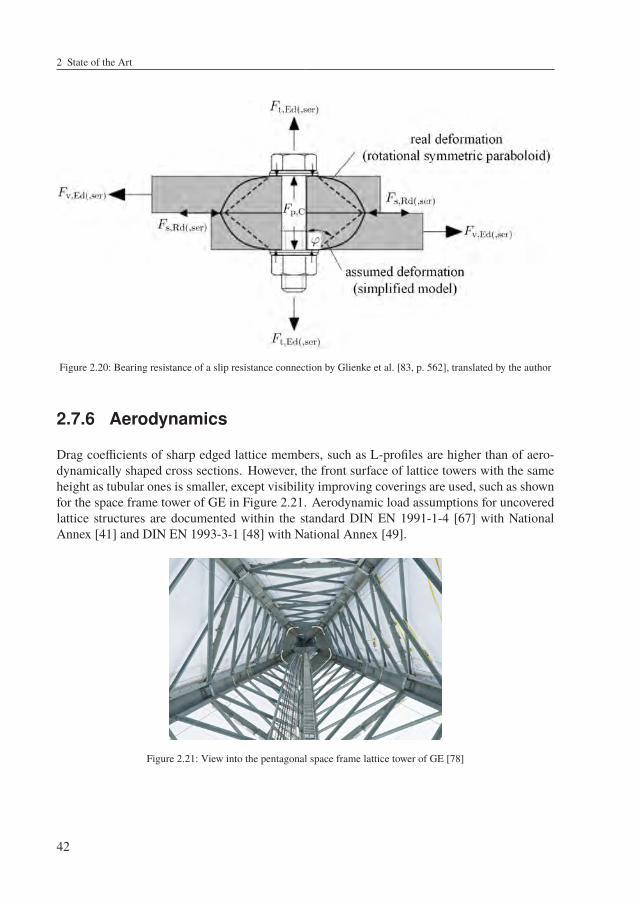
2 State of the Art
Figure 2.20: Bearing resistance of a slip resistance connection by Glienke et al. [83, p. 562], translated by the author
2.7.6 Aerodynamics
Drag coefficients of sharp edged lattice members, such as L-profiles are higher than of aero-dynamically shaped cross sections. However, the front surface of lattice towers with the sameheight as tubular ones is smaller, except visibility improving coverings are used, such as shownfor the space frame tower of GE in Figure 2.21. Aerodynamic load assumptions for uncoveredlattice structures are documented within the standard DIN EN 1991-1-4 [67] with NationalAnnex [41] and DIN EN 1993-3-1 [48] with National Annex [49].
Figure 2.21: View into the pentagonal space frame lattice tower of GE [78]
42
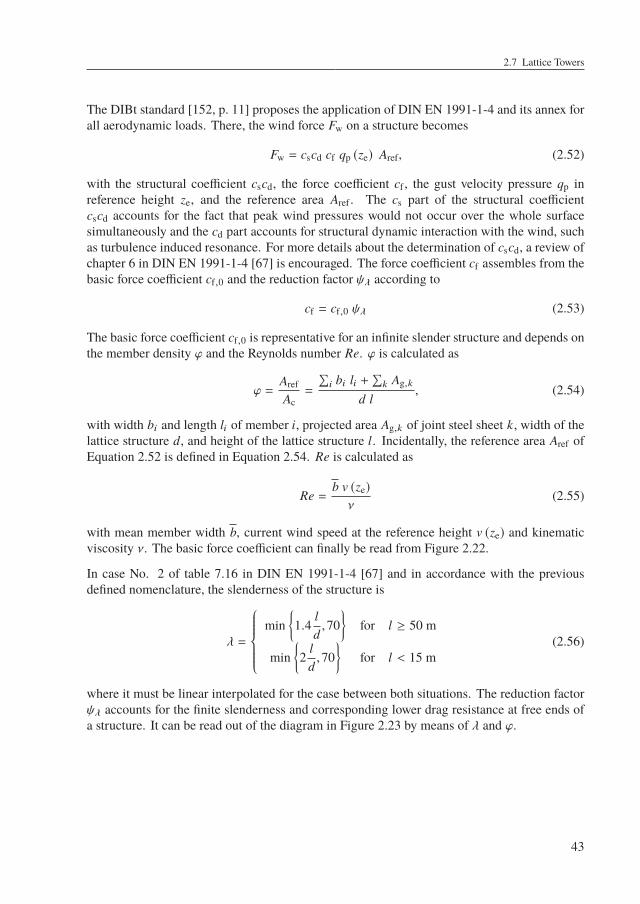
2.7 Lattice Towers
The DIBt standard [152, p. 11] proposes the application of DIN EN 1991-1-4 and its annex forall aerodynamic loads. There, the wind force Fw on a structure becomes
Fw = cscd cf qp (ze) Aref, (2.52)
with the structural coefficient cscd, the force coefficient cf , the gust velocity pressure qp inreference height ze, and the reference area Aref . The cs part of the structural coefficientcscd accounts for the fact that peak wind pressures would not occur over the whole surfacesimultaneously and the cd part accounts for structural dynamic interaction with the wind, suchas turbulence induced resonance. For more details about the determination of cscd, a review ofchapter 6 in DIN EN 1991-1-4 [67] is encouraged. The force coefficient cf assembles from thebasic force coefficient cf,0 and the reduction factor ψλ according to
cf = cf,0 ψλ (2.53)
The basic force coefficient cf,0 is representative for an infinite slender structure and depends onthe member density ϕ and the Reynolds number Re. ϕ is calculated as
ϕ =Aref
Ac=
∑i bi li +
∑k Ag,k
d l, (2.54)
with width bi and length li of member i, projected area Ag,k of joint steel sheet k, width of thelattice structure d, and height of the lattice structure l. Incidentally, the reference area Aref ofEquation 2.52 is defined in Equation 2.54. Re is calculated as
Re =b v (ze)
ν(2.55)
with mean member width b, current wind speed at the reference height v (ze) and kinematicviscosity ν. The basic force coefficient can finally be read from Figure 2.22.
In case No. 2 of table 7.16 in DIN EN 1991-1-4 [67] and in accordance with the previousdefined nomenclature, the slenderness of the structure is
λ =
min
1.4
ld,70
for l ≥ 50 m
min2
ld,70
for l < 15 m
(2.56)
where it must be linear interpolated for the case between both situations. The reduction factorψλ accounts for the finite slenderness and corresponding lower drag resistance at free ends ofa structure. It can be read out of the diagram in Figure 2.23 by means of λ and ϕ.
43
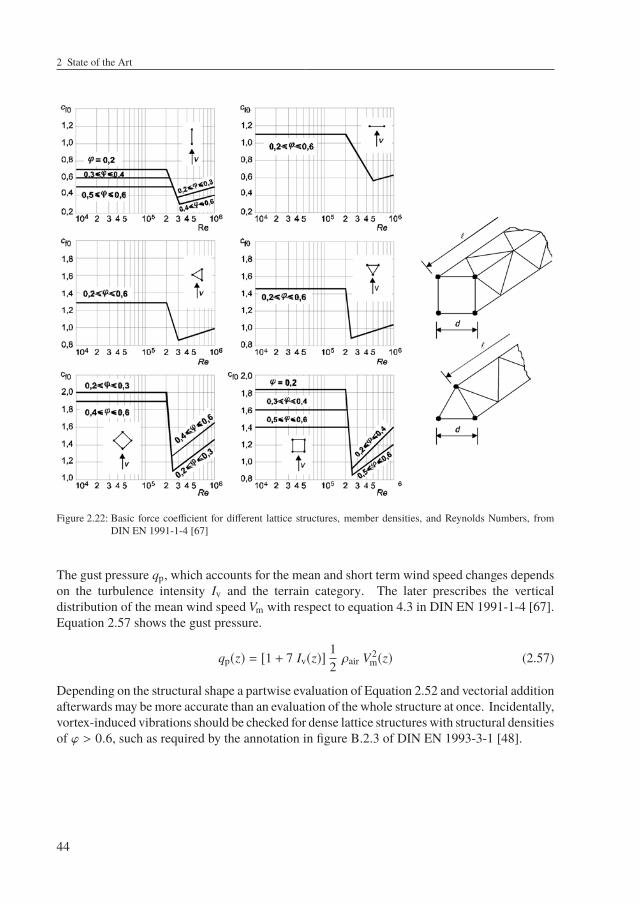
2 State of the Art
Figure 2.22: Basic force coefficient for different lattice structures, member densities, and Reynolds Numbers, fromDIN EN 1991-1-4 [67]
The gust pressure qp, which accounts for the mean and short term wind speed changes dependson the turbulence intensity Iv and the terrain category. The later prescribes the verticaldistribution of the mean wind speed Vm with respect to equation 4.3 in DIN EN 1991-1-4 [67].Equation 2.57 shows the gust pressure.
qp(z) = [1 + 7 Iv(z)]12ρair V2
m(z) (2.57)
Depending on the structural shape a partwise evaluation of Equation 2.52 and vectorial additionafterwards may bemore accurate than an evaluation of the whole structure at once. Incidentally,vortex-induced vibrations should be checked for dense lattice structures with structural densitiesof ϕ > 0.6, such as required by the annotation in figure B.2.3 of DIN EN 1993-3-1 [48].
44
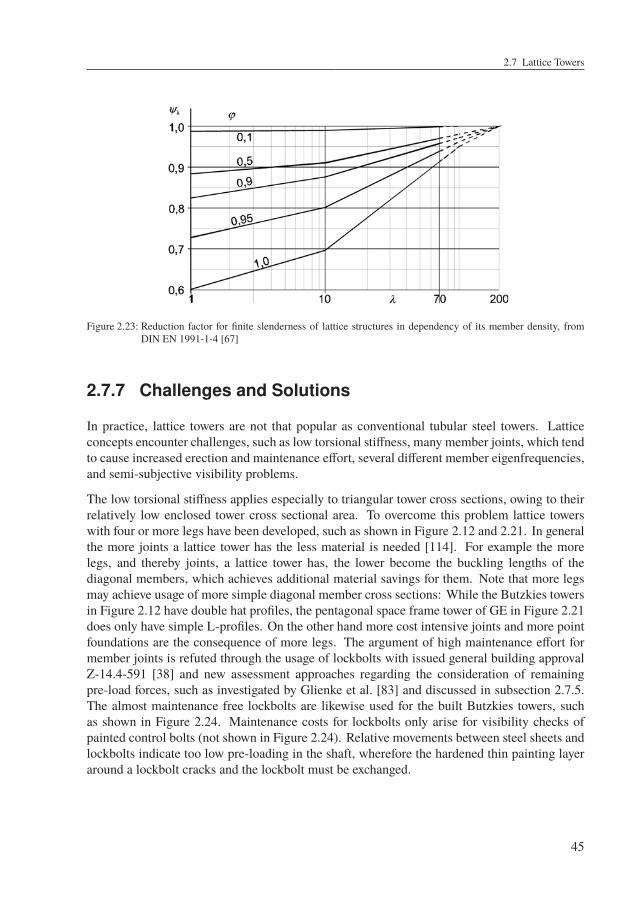
2.7 Lattice Towers
Figure 2.23: Reduction factor for finite slenderness of lattice structures in dependency of its member density, fromDIN EN 1991-1-4 [67]
2.7.7 Challenges and Solutions
In practice, lattice towers are not that popular as conventional tubular steel towers. Latticeconcepts encounter challenges, such as low torsional stiffness, many member joints, which tendto cause increased erection and maintenance effort, several different member eigenfrequencies,and semi-subjective visibility problems.
The low torsional stiffness applies especially to triangular tower cross sections, owing to theirrelatively low enclosed tower cross sectional area. To overcome this problem lattice towerswith four or more legs have been developed, such as shown in Figure 2.12 and 2.21. In generalthe more joints a lattice tower has the less material is needed [114]. For example the morelegs, and thereby joints, a lattice tower has, the lower become the buckling lengths of thediagonal members, which achieves additional material savings for them. Note that more legsmay achieve usage of more simple diagonal member cross sections: While the Butzkies towersin Figure 2.12 have double hat profiles, the pentagonal space frame tower of GE in Figure 2.21does only have simple L-profiles. On the other hand more cost intensive joints and more pointfoundations are the consequence of more legs. The argument of high maintenance effort formember joints is refuted through the usage of lockbolts with issued general building approvalZ-14.4-591 [38] and new assessment approaches regarding the consideration of remainingpre-load forces, such as investigated by Glienke et al. [83] and discussed in subsection 2.7.5.The almost maintenance free lockbolts are likewise used for the built Butzkies towers, suchas shown in Figure 2.24. Maintenance costs for lockbolts only arise for visibility checks ofpainted control bolts (not shown in Figure 2.24). Relative movements between steel sheets andlockbolts indicate too low pre-loading in the shaft, wherefore the hardened thin painting layeraround a lockbolt cracks and the lockbolt must be exchanged.
45
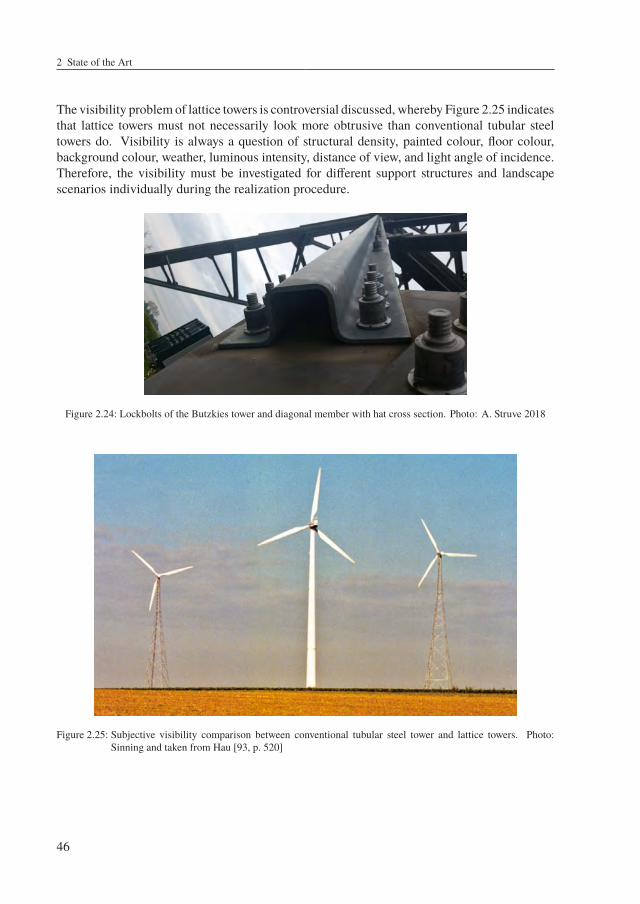
2 State of the Art
The visibility problem of lattice towers is controversial discussed, whereby Figure 2.25 indicatesthat lattice towers must not necessarily look more obtrusive than conventional tubular steeltowers do. Visibility is always a question of structural density, painted colour, floor colour,background colour, weather, luminous intensity, distance of view, and light angle of incidence.Therefore, the visibility must be investigated for different support structures and landscapescenarios individually during the realization procedure.
Figure 2.24: Lockbolts of the Butzkies tower and diagonal member with hat cross section. Photo: A. Struve 2018
Figure 2.25: Subjective visibility comparison between conventional tubular steel tower and lattice towers. Photo:Sinning and taken from Hau [93, p. 520]
46
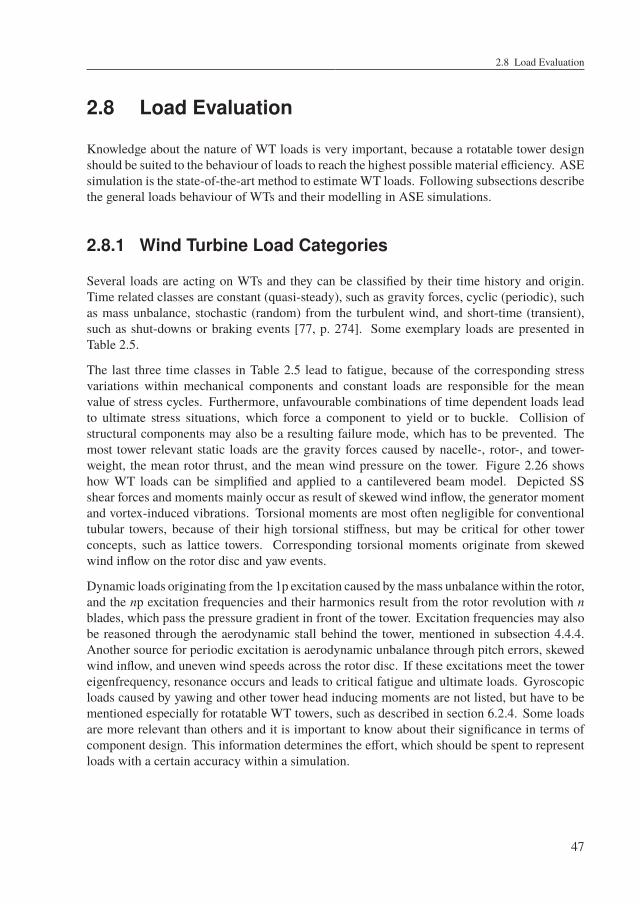
2.8 Load Evaluation
2.8 Load Evaluation
Knowledge about the nature of WT loads is very important, because a rotatable tower designshould be suited to the behaviour of loads to reach the highest possible material efficiency. ASEsimulation is the state-of-the-art method to estimate WT loads. Following subsections describethe general loads behaviour of WTs and their modelling in ASE simulations.
2.8.1 Wind Turbine Load Categories
Several loads are acting on WTs and they can be classified by their time history and origin.Time related classes are constant (quasi-steady), such as gravity forces, cyclic (periodic), suchas mass unbalance, stochastic (random) from the turbulent wind, and short-time (transient),such as shut-downs or braking events [77, p. 274]. Some exemplary loads are presented inTable 2.5.
The last three time classes in Table 2.5 lead to fatigue, because of the corresponding stressvariations within mechanical components and constant loads are responsible for the meanvalue of stress cycles. Furthermore, unfavourable combinations of time dependent loads leadto ultimate stress situations, which force a component to yield or to buckle. Collision ofstructural components may also be a resulting failure mode, which has to be prevented. Themost tower relevant static loads are the gravity forces caused by nacelle-, rotor-, and tower-weight, the mean rotor thrust, and the mean wind pressure on the tower. Figure 2.26 showshow WT loads can be simplified and applied to a cantilevered beam model. Depicted SSshear forces and moments mainly occur as result of skewed wind inflow, the generator momentand vortex-induced vibrations. Torsional moments are most often negligible for conventionaltubular towers, because of their high torsional stiffness, but may be critical for other towerconcepts, such as lattice towers. Corresponding torsional moments originate from skewedwind inflow on the rotor disc and yaw events.
Dynamic loads originating from the 1p excitation caused by themass unbalancewithin the rotor,and the np excitation frequencies and their harmonics result from the rotor revolution with nblades, which pass the pressure gradient in front of the tower. Excitation frequencies may alsobe reasoned through the aerodynamic stall behind the tower, mentioned in subsection 4.4.4.Another source for periodic excitation is aerodynamic unbalance through pitch errors, skewedwind inflow, and uneven wind speeds across the rotor disc. If these excitations meet the towereigenfrequency, resonance occurs and leads to critical fatigue and ultimate loads. Gyroscopicloads caused by yawing and other tower head inducing moments are not listed, but have to bementioned especially for rotatable WT towers, such as described in section 6.2.4. Some loadsare more relevant than others and it is important to know about their significance in terms ofcomponent design. This information determines the effort, which should be spent to representloads with a certain accuracy within a simulation.
47
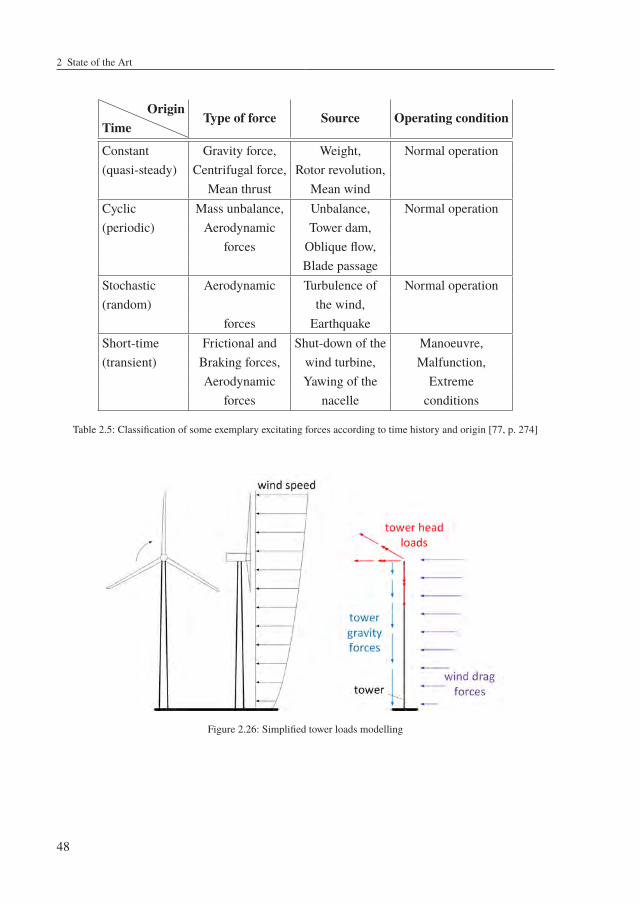
2 State of the Art
TimeOrigin
Type of force Source Operating condition
Constant Gravity force, Weight, Normal operation(quasi-steady) Centrifugal force, Rotor revolution,
Mean thrust Mean windCyclic Mass unbalance, Unbalance, Normal operation(periodic) Aerodynamic Tower dam,
forces Oblique flow,Blade passage
Stochastic Aerodynamic Turbulence of Normal operation(random) the wind,
forces EarthquakeShort-time Frictional and Shut-down of the Manoeuvre,(transient) Braking forces, wind turbine, Malfunction,
Aerodynamic Yawing of the Extremeforces nacelle conditions
Table 2.5: Classification of some exemplary excitating forces according to time history and origin [77, p. 274]
Figure 2.26: Simplified tower loads modelling
48
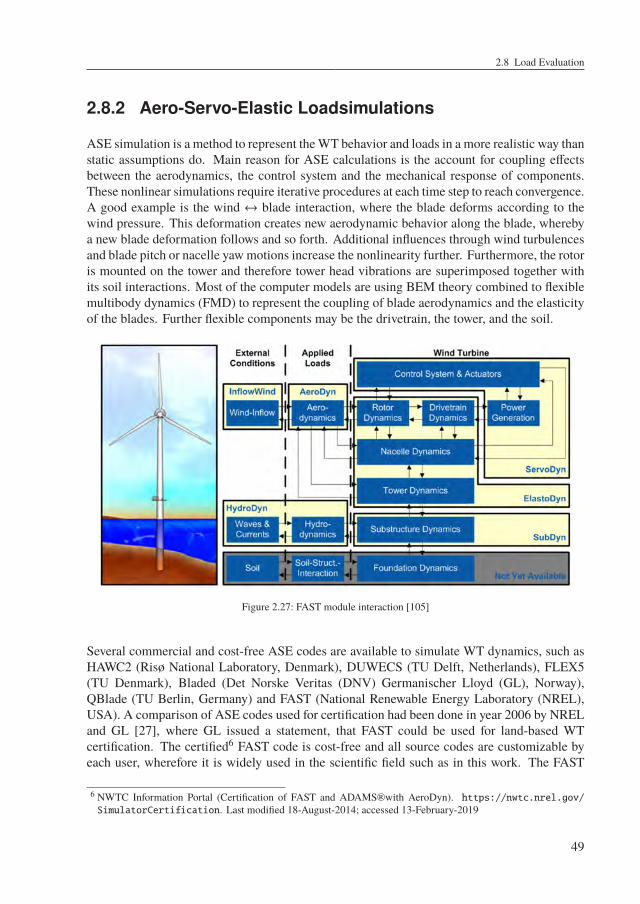
2.8 Load Evaluation
2.8.2 Aero-Servo-Elastic Loadsimulations
ASE simulation is a method to represent theWT behavior and loads in a more realistic way thanstatic assumptions do. Main reason for ASE calculations is the account for coupling effectsbetween the aerodynamics, the control system and the mechanical response of components.These nonlinear simulations require iterative procedures at each time step to reach convergence.A good example is the wind ↔ blade interaction, where the blade deforms according to thewind pressure. This deformation creates new aerodynamic behavior along the blade, wherebya new blade deformation follows and so forth. Additional influences through wind turbulencesand blade pitch or nacelle yawmotions increase the nonlinearity further. Furthermore, the rotoris mounted on the tower and therefore tower head vibrations are superimposed together withits soil interactions. Most of the computer models are using BEM theory combined to flexiblemultibody dynamics (FMD) to represent the coupling of blade aerodynamics and the elasticityof the blades. Further flexible components may be the drivetrain, the tower, and the soil.
Figure 2.27: FAST module interaction [105]
Several commercial and cost-free ASE codes are available to simulate WT dynamics, such asHAWC2 (Risø National Laboratory, Denmark), DUWECS (TU Delft, Netherlands), FLEX5(TU Denmark), Bladed (Det Norske Veritas (DNV) Germanischer Lloyd (GL), Norway),QBlade (TU Berlin, Germany) and FAST (National Renewable Energy Laboratory (NREL),USA). A comparison of ASE codes used for certification had been done in year 2006 by NRELand GL [27], where GL issued a statement, that FAST could be used for land-based WTcertification. The certified6 FAST code is cost-free and all source codes are customizable byeach user, wherefore it is widely used in the scientific field such as in this work. The FAST
6 NWTC Information Portal (Certification of FAST and ADAMS®with AeroDyn). https://nwtc.nrel.gov/SimulatorCertification. Last modified 18-August-2014; accessed 13-February-2019
49
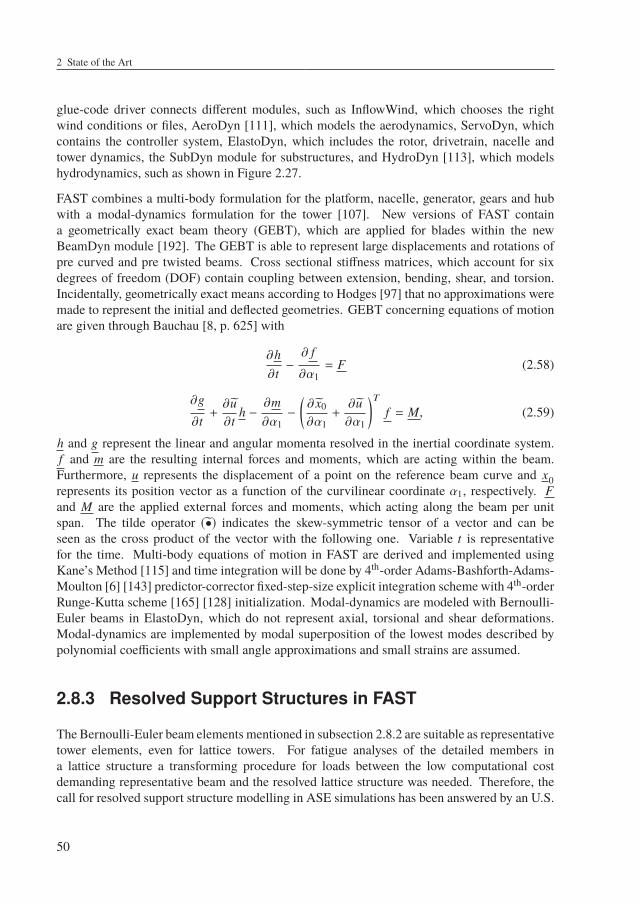
2 State of the Art
glue-code driver connects different modules, such as InflowWind, which chooses the rightwind conditions or files, AeroDyn [111], which models the aerodynamics, ServoDyn, whichcontains the controller system, ElastoDyn, which includes the rotor, drivetrain, nacelle andtower dynamics, the SubDyn module for substructures, and HydroDyn [113], which modelshydrodynamics, such as shown in Figure 2.27.
FAST combines a multi-body formulation for the platform, nacelle, generator, gears and hubwith a modal-dynamics formulation for the tower [107]. New versions of FAST containa geometrically exact beam theory (GEBT), which are applied for blades within the newBeamDyn module [192]. The GEBT is able to represent large displacements and rotations ofpre curved and pre twisted beams. Cross sectional stiffness matrices, which account for sixdegrees of freedom (DOF) contain coupling between extension, bending, shear, and torsion.Incidentally, geometrically exact means according to Hodges [97] that no approximations weremade to represent the initial and deflected geometries. GEBT concerning equations of motionare given through Bauchau [8, p. 625] with
∂h∂t−∂ f
∂α1= F (2.58)
∂g
∂t+∂u∂t
h −∂m∂α1−
(∂ x0
∂α1+
∂u∂α1
)Tf = M, (2.59)
h and g represent the linear and angular momenta resolved in the inertial coordinate system.f and m are the resulting internal forces and moments, which are acting within the beam.Furthermore, u represents the displacement of a point on the reference beam curve and x0represents its position vector as a function of the curvilinear coordinate α1, respectively. Fand M are the applied external forces and moments, which acting along the beam per unitspan. The tilde operator (•) indicates the skew-symmetric tensor of a vector and can beseen as the cross product of the vector with the following one. Variable t is representativefor the time. Multi-body equations of motion in FAST are derived and implemented usingKane’s Method [115] and time integration will be done by 4th-order Adams-Bashforth-Adams-Moulton [6] [143] predictor-corrector fixed-step-size explicit integration scheme with 4th-orderRunge-Kutta scheme [165] [128] initialization. Modal-dynamics are modeled with Bernoulli-Euler beams in ElastoDyn, which do not represent axial, torsional and shear deformations.Modal-dynamics are implemented by modal superposition of the lowest modes described bypolynomial coefficients with small angle approximations and small strains are assumed.
2.8.3 Resolved Support Structures in FAST
The Bernoulli-Euler beam elements mentioned in subsection 2.8.2 are suitable as representativetower elements, even for lattice towers. For fatigue analyses of the detailed members ina lattice structure a transforming procedure for loads between the low computational costdemanding representative beam and the resolved lattice structure was needed. Therefore, thecall for resolved support structure modelling in ASE simulations has been answered by an U.S.
50
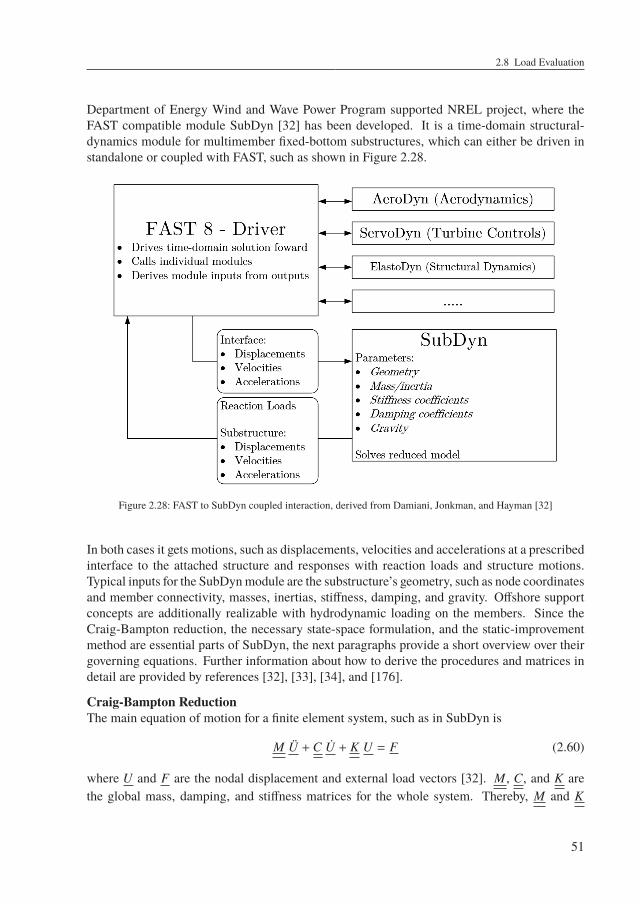
2.8 Load Evaluation
Department of Energy Wind and Wave Power Program supported NREL project, where theFAST compatible module SubDyn [32] has been developed. It is a time-domain structural-dynamics module for multimember fixed-bottom substructures, which can either be driven instandalone or coupled with FAST, such as shown in Figure 2.28.
Figure 2.28: FAST to SubDyn coupled interaction, derived from Damiani, Jonkman, and Hayman [32]
In both cases it gets motions, such as displacements, velocities and accelerations at a prescribedinterface to the attached structure and responses with reaction loads and structure motions.Typical inputs for the SubDynmodule are the substructure’s geometry, such as node coordinatesand member connectivity, masses, inertias, stiffness, damping, and gravity. Offshore supportconcepts are additionally realizable with hydrodynamic loading on the members. Since theCraig-Bampton reduction, the necessary state-space formulation, and the static-improvementmethod are essential parts of SubDyn, the next paragraphs provide a short overview over theirgoverning equations. Further information about how to derive the procedures and matrices indetail are provided by references [32], [33], [34], and [176].
Craig-Bampton ReductionThe main equation of motion for a finite element system, such as in SubDyn is
M ÜU + C ÛU + K U = F (2.60)
where U and F are the nodal displacement and external load vectors [32]. M , C, and K arethe global mass, damping, and stiffness matrices for the whole system. Thereby, M and K
51
2 State of the Art
are assembled from the element mass and stiffness matrices and C is derived with respect todifferent mode damping ratios for the whole system. These matrices are of dimensions N × N ,which would lead to computational expensive mathematical operations for typical numbers ofsubstructures DOFs with N > 103. A modal reduction of the linear frame finite-element beammodel via Craig-Bampton method, supplemented by a static-improvement method achieves asignificant reduction of DOFs, while accurate results are obtained. Thereby, only the boundaryDOFs UR from the interface nodes and the reduced interior generalized modal DOFs q
mare
retained. The Craig-Bampton transformation between the boundary DOFs together with allinternal DOFs and the reduced generalized DOFs is performed by
URUL
=
[I 0Φ
RΦ
m
] URqm
(2.61)
where ΦRand Φ
mare transformation matrices for the interior node DOFs UL with respect to
the rigid body interface motions UR and for the retained internal eigenmodes with respect tothe generalized modal DOFs q
m.
Deriving the full Craig-Bampton reduced equation of motion by means of some mathematicalsteps one arrives at[
MBB
MBm
MmB
I
] ÜUTPÜqm
+
[0 00 2 ζ Ω
m
] ÛUTPÛqm
+
[K
BB0
0 Ω2m
] UTPqm
=
FTPFm
(2.62)
where Fm represents the interior loads, which account for the retained modes, FTP are thetransition piece (TP) loads after Craig-Bampton reduction, M
BBis the substructures equivalent
mass matrix, MBm
is a matrix partition after the Craig-Bampton reduction, I is the identity
matrix, KBB
is the substructures equivalent stiffness matrix. In Equation 2.62, the equivalentmass and stiffnessmatrices are referred to the TP and the damping ratio ζ is defined as percent ofthe critical damping ratio. Ω
mis am×m diagonal matrix, which represents the eigenfrequencies
of the retained Craig-Bampton eigenmodes. With this reduced system the number of DOFsreduces from 6 × free nodes to 6 + m. Such a significant DOF reduction makes the SubDynmodule suitable for practical analyses of resolved beam structures in computational expensiveASE simulations.
State-Space FormulationThe state-space formulation is used to compute the substructures response at each time step. Itconnects the outer inputs, such as the transition piece displacements, velocities, accelerations,and substructure hydrodynamic forces calledu =
UTP,
ÛUTP,ÜUTP,FL,FHDR
T to the structural response outputs, such as the transition pieceloads and the deflections, velocities, and accelerations of the substructure. FL and FHDR arethe hydrodynamic forces on every interior and on the boundary nodes, respectively. A reviewof Figure 2.28 where hydrodynamic interaction is neglected
(FL = 0; FHDR = 0
)may help for
clarification.
52
2.8 Load Evaluation
Transition piece loads FTP are calculated by the state-space formulation
FTP = C1
x + D1
u + FY1
(2.63)
where C1, D
1, and F
Y1contain input independent and therefore constant model modal pa-
rameters, which are likewise used in the Craig-Bampton reduced equation of motion 2.62. In
Equation 2.63 x =qm, Ûq
m
Tand the input vector u is slightly modified with respect to the
hydrodynamical forces on the boundary nodes, wherefore it is denoted as u. The later has noinfluence if no hydrodynamic loads are considered.
Substructure movements are denoted as Y2 =UR,UL,
ÛUR, ÛUL,ÜUR, ÜUL
Tand distinguished in
terms of the interface DOFs UR and the internal DOFs UL. A state-space connection betweenthe inputs and movements is obtained by using again substructure describing modal parameters,contained in the Craig-Bampton reduced equation of motion 2.62 and denoted as C
2, D
2, and
FY2. The state-space formulation for substructure movement becomes the similar form as in
Equation 2.63Y2 = C
2x + D
2u + F
Y2(2.64)
Static-Improvement MethodModelling of the important gravity and buoyancy forces requires the inclusion of a hugeamount Craig-Bampton modes, because the corresponding frequencies are comparatively high.Thereby, the advantage of having only a few modal DOFs and a resulting improved computa-tional performance would vanish. The static-improvement method is incorporated to overcomethis issue. It works through accounting for dynamically not included modes by means of aquasi-statically approach: It adds the difference between two static solutions to the dynamicsolution, which was explained before. These two static solutions of the Craig-Bampton modalsystem lead to another transformation as it was in Equation 2.61, namely
URUL
=
[I 0 0 0Φ
RΦ
mΦ
L−Φ
m
] URqm
qL0
qm0
(2.65)
In Equation 2.65 the additional terms ΦL
qL0
and −Φm
qm0
are the two static solutions for thefull Craig-Bampton systemwith all L DOFs and the reduced systemwith m DOFs, respectively.The corresponding necessary slight changes to the state-space formulation is explained togetherwith more detailed derivations by Damiani, Jonkman, and Hayman [32].
53
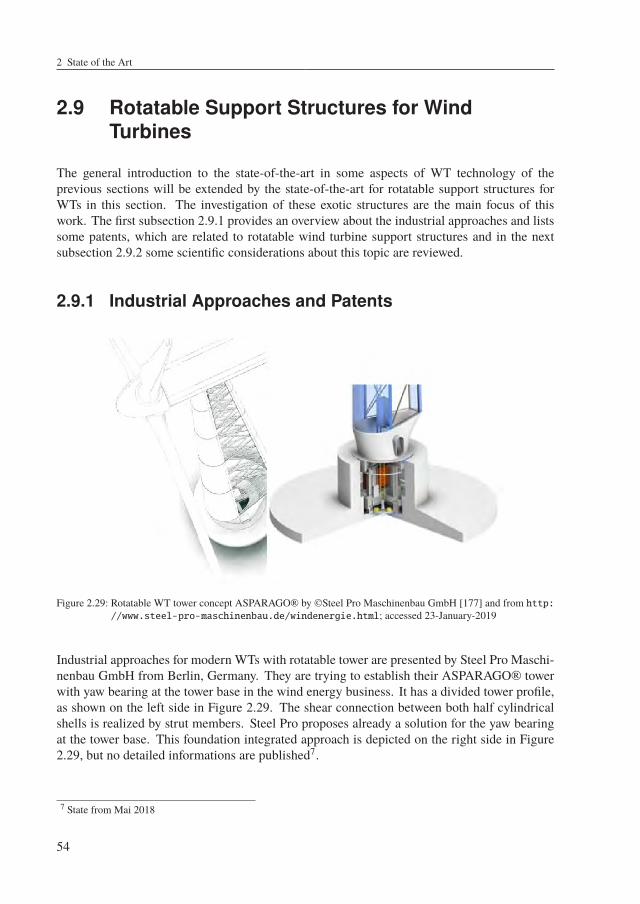
2 State of the Art
2.9 Rotatable Support Structures for WindTurbines
The general introduction to the state-of-the-art in some aspects of WT technology of theprevious sections will be extended by the state-of-the-art for rotatable support structures forWTs in this section. The investigation of these exotic structures are the main focus of thiswork. The first subsection 2.9.1 provides an overview about the industrial approaches and listssome patents, which are related to rotatable wind turbine support structures and in the nextsubsection 2.9.2 some scientific considerations about this topic are reviewed.
2.9.1 Industrial Approaches and Patents
Figure 2.29: Rotatable WT tower concept ASPARAGO® by ©Steel Pro Maschinenbau GmbH [177] and from http://www.steel-pro-maschinenbau.de/windenergie.html; accessed 23-January-2019
Industrial approaches for modern WTs with rotatable tower are presented by Steel Pro Maschi-nenbau GmbH from Berlin, Germany. They are trying to establish their ASPARAGO® towerwith yaw bearing at the tower base in the wind energy business. It has a divided tower profile,as shown on the left side in Figure 2.29. The shear connection between both half cylindricalshells is realized by strut members. Steel Pro proposes already a solution for the yaw bearingat the tower base. This foundation integrated approach is depicted on the right side in Figure2.29, but no detailed informations are published7.
7 State from Mai 2018
54
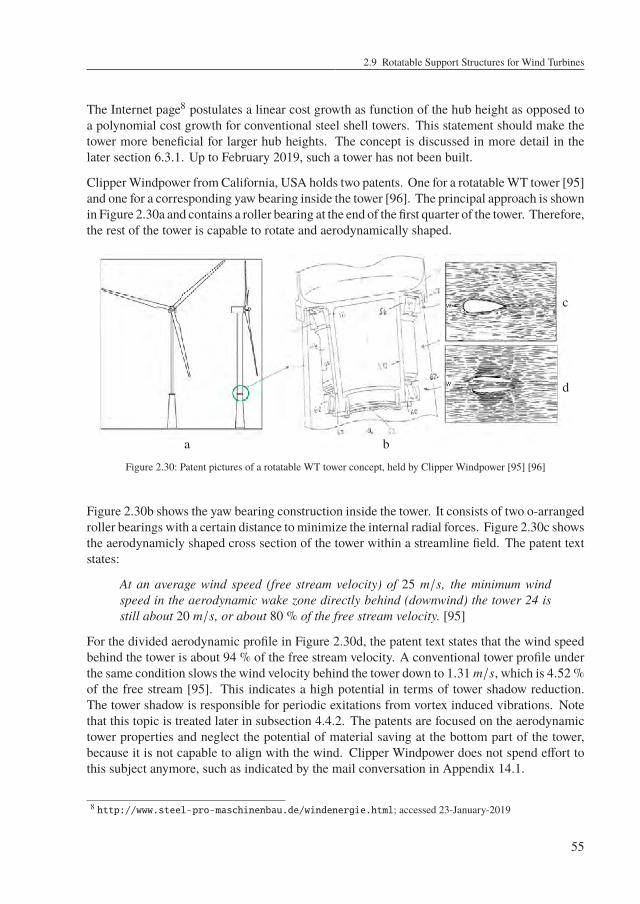
2.9 Rotatable Support Structures for Wind Turbines
The Internet page8 postulates a linear cost growth as function of the hub height as opposed toa polynomial cost growth for conventional steel shell towers. This statement should make thetower more beneficial for larger hub heights. The concept is discussed in more detail in thelater section 6.3.1. Up to February 2019, such a tower has not been built.
ClipperWindpower fromCalifornia, USA holds two patents. One for a rotatableWT tower [95]and one for a corresponding yaw bearing inside the tower [96]. The principal approach is shownin Figure 2.30a and contains a roller bearing at the end of the first quarter of the tower. Therefore,the rest of the tower is capable to rotate and aerodynamically shaped.
a b
c
d
Figure 2.30: Patent pictures of a rotatable WT tower concept, held by Clipper Windpower [95] [96]
Figure 2.30b shows the yaw bearing construction inside the tower. It consists of two o-arrangedroller bearings with a certain distance to minimize the internal radial forces. Figure 2.30c showsthe aerodynamicly shaped cross section of the tower within a streamline field. The patent textstates:
At an average wind speed (free stream velocity) of 25 m/s, the minimum windspeed in the aerodynamic wake zone directly behind (downwind) the tower 24 isstill about 20 m/s, or about 80 % of the free stream velocity. [95]
For the divided aerodynamic profile in Figure 2.30d, the patent text states that the wind speedbehind the tower is about 94 % of the free stream velocity. A conventional tower profile underthe same condition slows the wind velocity behind the tower down to 1.31 m/s, which is 4.52 %of the free stream [95]. This indicates a high potential in terms of tower shadow reduction.The tower shadow is responsible for periodic exitations from vortex induced vibrations. Notethat this topic is treated later in subsection 4.4.2. The patents are focused on the aerodynamictower properties and neglect the potential of material saving at the bottom part of the tower,because it is not capable to align with the wind. Clipper Windpower does not spend effort tothis subject anymore, such as indicated by the mail conversation in Appendix 14.1.
8 http://www.steel-pro-maschinenbau.de/windenergie.html; accessed 23-January-2019
55
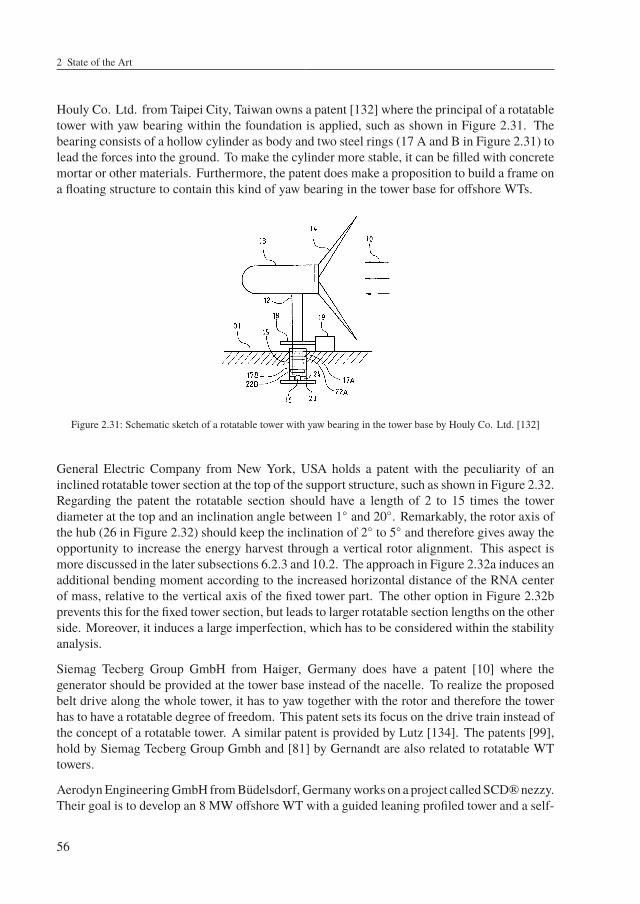
2 State of the Art
Houly Co. Ltd. from Taipei City, Taiwan owns a patent [132] where the principal of a rotatabletower with yaw bearing within the foundation is applied, such as shown in Figure 2.31. Thebearing consists of a hollow cylinder as body and two steel rings (17 A and B in Figure 2.31) tolead the forces into the ground. To make the cylinder more stable, it can be filled with concretemortar or other materials. Furthermore, the patent does make a proposition to build a frame ona floating structure to contain this kind of yaw bearing in the tower base for offshore WTs.
Figure 2.31: Schematic sketch of a rotatable tower with yaw bearing in the tower base by Houly Co. Ltd. [132]
General Electric Company from New York, USA holds a patent with the peculiarity of aninclined rotatable tower section at the top of the support structure, such as shown in Figure 2.32.Regarding the patent the rotatable section should have a length of 2 to 15 times the towerdiameter at the top and an inclination angle between 1 and 20. Remarkably, the rotor axis ofthe hub (26 in Figure 2.32) should keep the inclination of 2 to 5 and therefore gives away theopportunity to increase the energy harvest through a vertical rotor alignment. This aspect ismore discussed in the later subsections 6.2.3 and 10.2. The approach in Figure 2.32a induces anadditional bending moment according to the increased horizontal distance of the RNA centerof mass, relative to the vertical axis of the fixed tower part. The other option in Figure 2.32bprevents this for the fixed tower section, but leads to larger rotatable section lengths on the otherside. Moreover, it induces a large imperfection, which has to be considered within the stabilityanalysis.
Siemag Tecberg Group GmbH from Haiger, Germany does have a patent [10] where thegenerator should be provided at the tower base instead of the nacelle. To realize the proposedbelt drive along the whole tower, it has to yaw together with the rotor and therefore the towerhas to have a rotatable degree of freedom. This patent sets its focus on the drive train instead ofthe concept of a rotatable tower. A similar patent is provided by Lutz [134]. The patents [99],hold by Siemag Tecberg Group Gmbh and [81] by Gernandt are also related to rotatable WTtowers.
AerodynEngineeringGmbH fromBüdelsdorf, Germanyworks on a project called SCD® nezzy.Their goal is to develop an 8 MW offshore WT with a guided leaning profiled tower and a self-
56
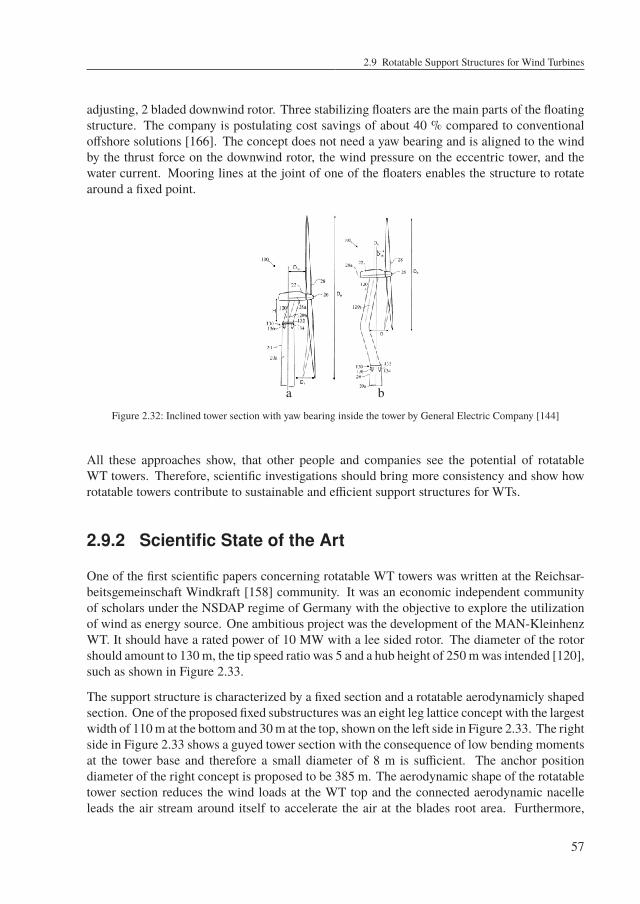
2.9 Rotatable Support Structures for Wind Turbines
adjusting, 2 bladed downwind rotor. Three stabilizing floaters are the main parts of the floatingstructure. The company is postulating cost savings of about 40 % compared to conventionaloffshore solutions [166]. The concept does not need a yaw bearing and is aligned to the windby the thrust force on the downwind rotor, the wind pressure on the eccentric tower, and thewater current. Mooring lines at the joint of one of the floaters enables the structure to rotatearound a fixed point.
a b
Figure 2.32: Inclined tower section with yaw bearing inside the tower by General Electric Company [144]
All these approaches show, that other people and companies see the potential of rotatableWT towers. Therefore, scientific investigations should bring more consistency and show howrotatable towers contribute to sustainable and efficient support structures for WTs.
2.9.2 Scientific State of the Art
One of the first scientific papers concerning rotatable WT towers was written at the Reichsar-beitsgemeinschaft Windkraft [158] community. It was an economic independent communityof scholars under the NSDAP regime of Germany with the objective to explore the utilizationof wind as energy source. One ambitious project was the development of the MAN-KleinhenzWT. It should have a rated power of 10 MW with a lee sided rotor. The diameter of the rotorshould amount to 130 m, the tip speed ratio was 5 and a hub height of 250 m was intended [120],such as shown in Figure 2.33.
The support structure is characterized by a fixed section and a rotatable aerodynamicly shapedsection. One of the proposed fixed substructures was an eight leg lattice concept with the largestwidth of 110 m at the bottom and 30 m at the top, shown on the left side in Figure 2.33. The rightside in Figure 2.33 shows a guyed tower section with the consequence of low bending momentsat the tower base and therefore a small diameter of 8 m is sufficient. The anchor positiondiameter of the right concept is proposed to be 385 m. The aerodynamic shape of the rotatabletower section reduces the wind loads at the WT top and the connected aerodynamic nacelleleads the air stream around itself to accelerate the air at the blades root area. Furthermore,
57
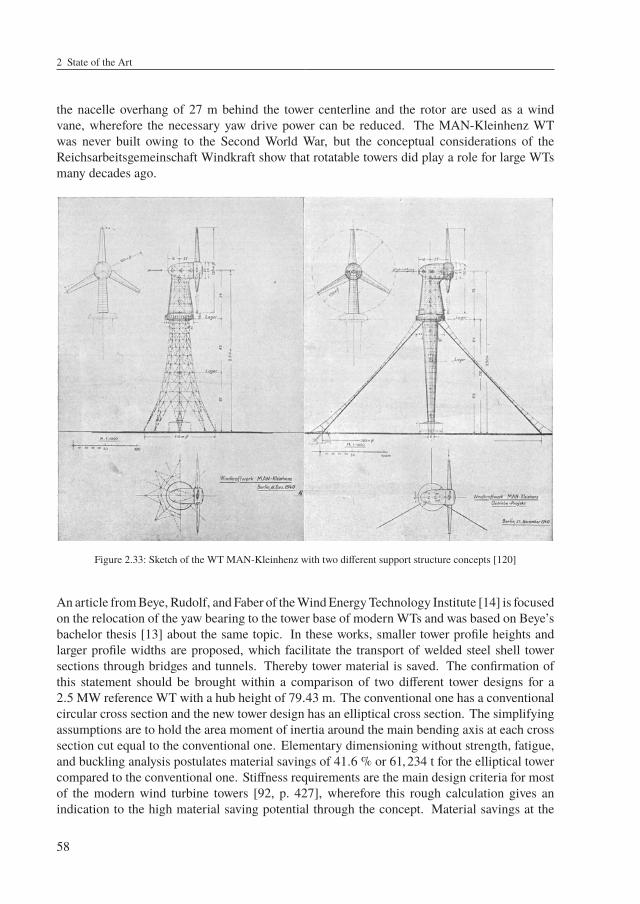
2 State of the Art
the nacelle overhang of 27 m behind the tower centerline and the rotor are used as a windvane, wherefore the necessary yaw drive power can be reduced. The MAN-Kleinhenz WTwas never built owing to the Second World War, but the conceptual considerations of theReichsarbeitsgemeinschaft Windkraft show that rotatable towers did play a role for large WTsmany decades ago.
Figure 2.33: Sketch of the WT MAN-Kleinhenz with two different support structure concepts [120]
An article fromBeye, Rudolf, and Faber of theWindEnergyTechnology Institute [14] is focusedon the relocation of the yaw bearing to the tower base of modern WTs and was based on Beye’sbachelor thesis [13] about the same topic. In these works, smaller tower profile heights andlarger profile widths are proposed, which facilitate the transport of welded steel shell towersections through bridges and tunnels. Thereby tower material is saved. The confirmation ofthis statement should be brought within a comparison of two different tower designs for a2.5 MW reference WT with a hub height of 79.43 m. The conventional one has a conventionalcircular cross section and the new tower design has an elliptical cross section. The simplifyingassumptions are to hold the area moment of inertia around the main bending axis at each crosssection cut equal to the conventional one. Elementary dimensioning without strength, fatigue,and buckling analysis postulates material savings of 41.6 % or 61,234 t for the elliptical towercompared to the conventional one. Stiffness requirements are the main design criteria for mostof the modern wind turbine towers [92, p. 427], wherefore this rough calculation gives anindication to the high material saving potential through the concept. Material savings at the
58
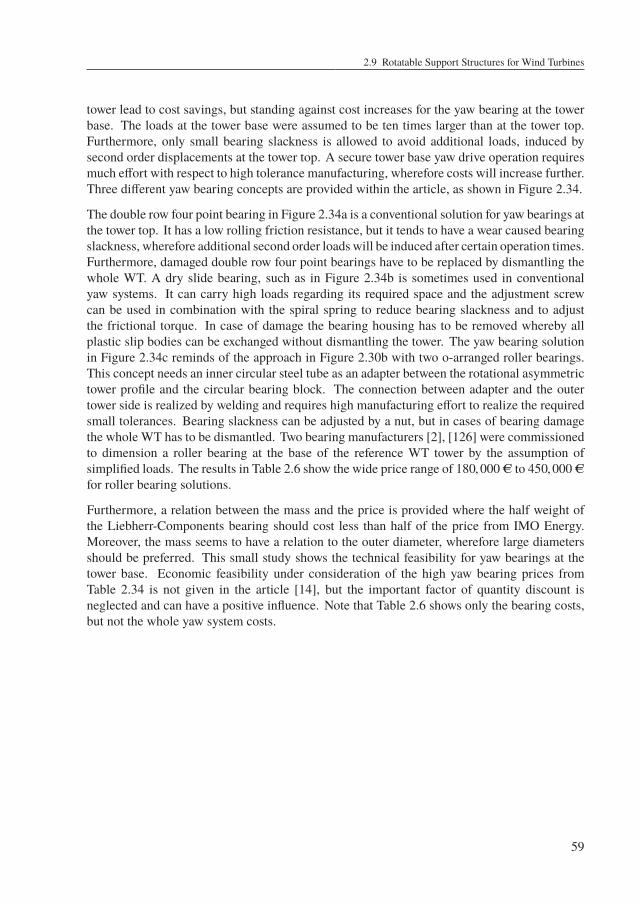
2.9 Rotatable Support Structures for Wind Turbines
tower lead to cost savings, but standing against cost increases for the yaw bearing at the towerbase. The loads at the tower base were assumed to be ten times larger than at the tower top.Furthermore, only small bearing slackness is allowed to avoid additional loads, induced bysecond order displacements at the tower top. A secure tower base yaw drive operation requiresmuch effort with respect to high tolerance manufacturing, wherefore costs will increase further.Three different yaw bearing concepts are provided within the article, as shown in Figure 2.34.
The double row four point bearing in Figure 2.34a is a conventional solution for yaw bearings atthe tower top. It has a low rolling friction resistance, but it tends to have a wear caused bearingslackness, wherefore additional second order loads will be induced after certain operation times.Furthermore, damaged double row four point bearings have to be replaced by dismantling thewhole WT. A dry slide bearing, such as in Figure 2.34b is sometimes used in conventionalyaw systems. It can carry high loads regarding its required space and the adjustment screwcan be used in combination with the spiral spring to reduce bearing slackness and to adjustthe frictional torque. In case of damage the bearing housing has to be removed whereby allplastic slip bodies can be exchanged without dismantling the tower. The yaw bearing solutionin Figure 2.34c reminds of the approach in Figure 2.30b with two o-arranged roller bearings.This concept needs an inner circular steel tube as an adapter between the rotational asymmetrictower profile and the circular bearing block. The connection between adapter and the outertower side is realized by welding and requires high manufacturing effort to realize the requiredsmall tolerances. Bearing slackness can be adjusted by a nut, but in cases of bearing damagethe whole WT has to be dismantled. Two bearing manufacturers [2], [126] were commissionedto dimension a roller bearing at the base of the reference WT tower by the assumption ofsimplified loads. The results in Table 2.6 show the wide price range of 180,000AC to 450,000ACfor roller bearing solutions.
Furthermore, a relation between the mass and the price is provided where the half weight ofthe Liebherr-Components bearing should cost less than half of the price from IMO Energy.Moreover, the mass seems to have a relation to the outer diameter, wherefore large diametersshould be preferred. This small study shows the technical feasibility for yaw bearings at thetower base. Economic feasibility under consideration of the high yaw bearing prices fromTable 2.34 is not given in the article [14], but the important factor of quantity discount isneglected and can have a positive influence. Note that Table 2.6 shows only the bearing costs,but not the whole yaw system costs.
59
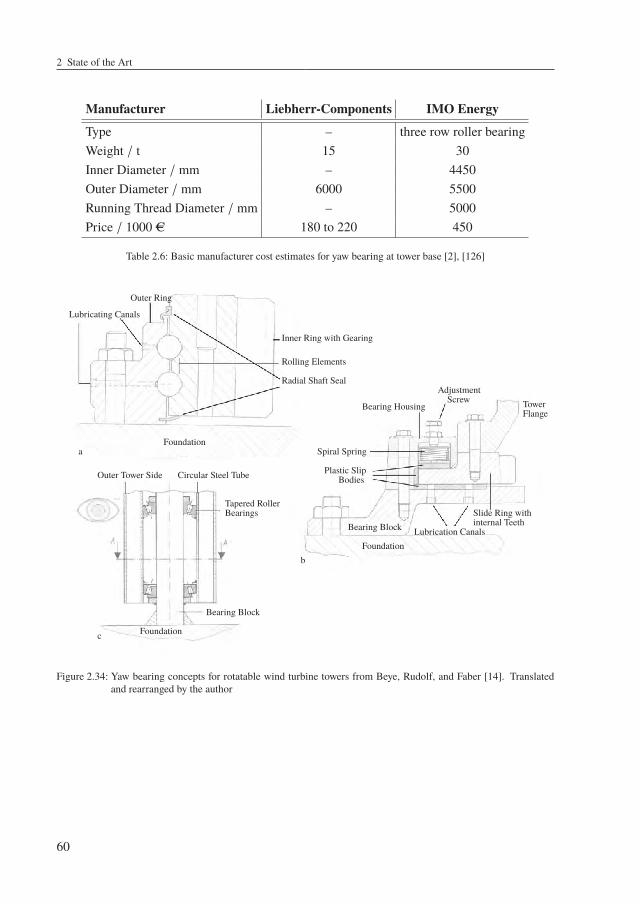
2 State of the Art
Manufacturer Liebherr-Components IMO Energy
Type – three row roller bearingWeight / t 15 30Inner Diameter / mm – 4450Outer Diameter / mm 6000 5500Running Thread Diameter / mm – 5000Price / 1000 AC 180 to 220 450
Table 2.6: Basic manufacturer cost estimates for yaw bearing at tower base [2], [126]
aFoundation
Lubricating Canals
Outer Ring
Inner Ring with Gearing
Rolling Elements
Radial Shaft Seal
bFoundation
Lubrication Canals
Slide Ring withinternal TeethBearing Block
Plastic SlipBodies
Spiral Spring
Bearing Housing
AdjustmentScrew Tower
Flange
c Foundation
Bearing Block
Tapered RollerBearings
Circular Steel TubeOuter Tower Side
Figure 2.34: Yaw bearing concepts for rotatable wind turbine towers from Beye, Rudolf, and Faber [14]. Translatedand rearranged by the author
60
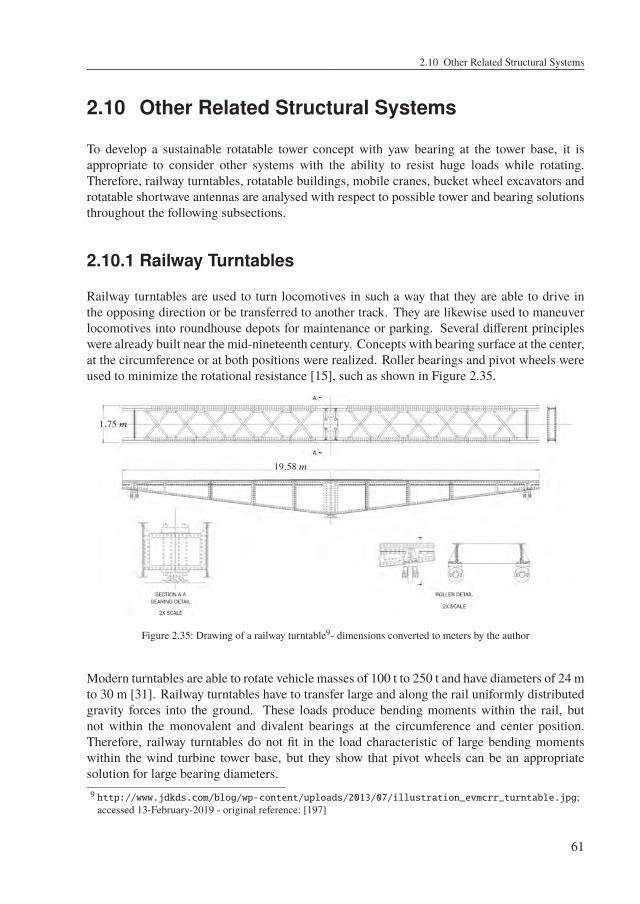
2.10 Other Related Structural Systems
2.10 Other Related Structural Systems
To develop a sustainable rotatable tower concept with yaw bearing at the tower base, it isappropriate to consider other systems with the ability to resist huge loads while rotating.Therefore, railway turntables, rotatable buildings, mobile cranes, bucket wheel excavators androtatable shortwave antennas are analysed with respect to possible tower and bearing solutionsthroughout the following subsections.
2.10.1 Railway Turntables
Railway turntables are used to turn locomotives in such a way that they are able to drive inthe opposing direction or be transferred to another track. They are likewise used to maneuverlocomotives into roundhouse depots for maintenance or parking. Several different principleswere already built near the mid-nineteenth century. Concepts with bearing surface at the center,at the circumference or at both positions were realized. Roller bearings and pivot wheels wereused to minimize the rotational resistance [15], such as shown in Figure 2.35.
1.75 m
19.58 m
Figure 2.35: Drawing of a railway turntable9- dimensions converted to meters by the author
Modern turntables are able to rotate vehicle masses of 100 t to 250 t and have diameters of 24 mto 30 m [31]. Railway turntables have to transfer large and along the rail uniformly distributedgravity forces into the ground. These loads produce bending moments within the rail, butnot within the monovalent and divalent bearings at the circumference and center position.Therefore, railway turntables do not fit in the load characteristic of large bending momentswithin the wind turbine tower base, but they show that pivot wheels can be an appropriatesolution for large bearing diameters.9 http://www.jdkds.com/blog/wp-content/uploads/2013/07/illustration_evmcrr_turntable.jpg;accessed 13-February-2019 - original reference: [197]
61
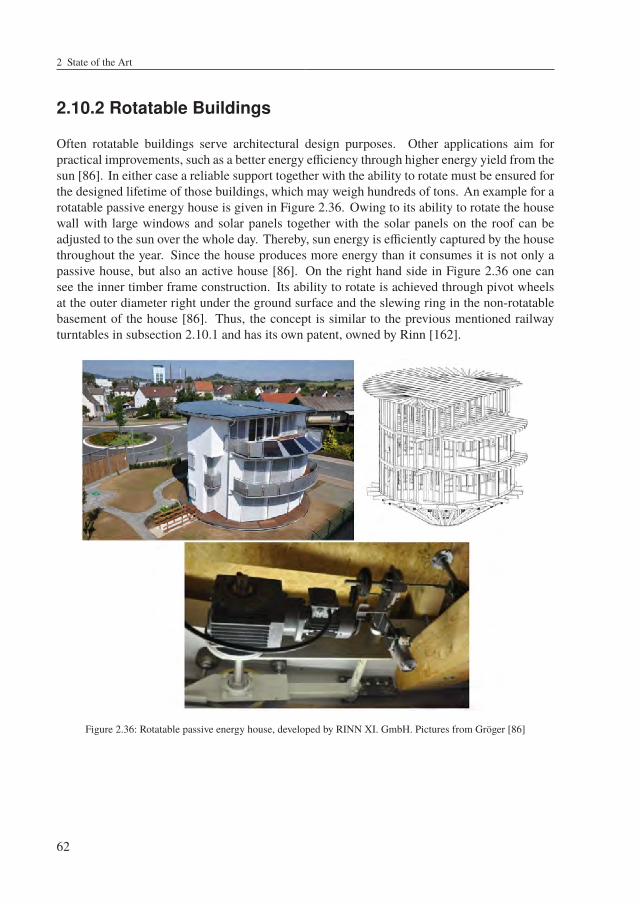
2 State of the Art
2.10.2 Rotatable Buildings
Often rotatable buildings serve architectural design purposes. Other applications aim forpractical improvements, such as a better energy efficiency through higher energy yield from thesun [86]. In either case a reliable support together with the ability to rotate must be ensured forthe designed lifetime of those buildings, which may weigh hundreds of tons. An example for arotatable passive energy house is given in Figure 2.36. Owing to its ability to rotate the housewall with large windows and solar panels together with the solar panels on the roof can beadjusted to the sun over the whole day. Thereby, sun energy is efficiently captured by the housethroughout the year. Since the house produces more energy than it consumes it is not only apassive house, but also an active house [86]. On the right hand side in Figure 2.36 one cansee the inner timber frame construction. Its ability to rotate is achieved through pivot wheelsat the outer diameter right under the ground surface and the slewing ring in the non-rotatablebasement of the house [86]. Thus, the concept is similar to the previous mentioned railwayturntables in subsection 2.10.1 and has its own patent, owned by Rinn [162].
Figure 2.36: Rotatable passive energy house, developed by RINN XI. GmbH. Pictures from Gröger [86]
62
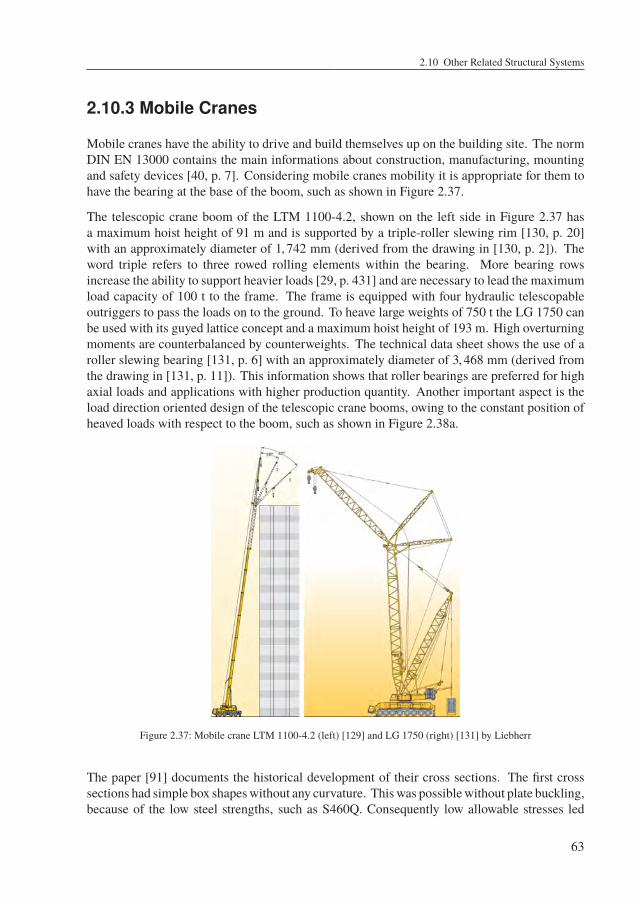
2.10 Other Related Structural Systems
2.10.3 Mobile Cranes
Mobile cranes have the ability to drive and build themselves up on the building site. The normDIN EN 13000 contains the main informations about construction, manufacturing, mountingand safety devices [40, p. 7]. Considering mobile cranes mobility it is appropriate for them tohave the bearing at the base of the boom, such as shown in Figure 2.37.
The telescopic crane boom of the LTM 1100-4.2, shown on the left side in Figure 2.37 hasa maximum hoist height of 91 m and is supported by a triple-roller slewing rim [130, p. 20]with an approximately diameter of 1,742 mm (derived from the drawing in [130, p. 2]). Theword triple refers to three rowed rolling elements within the bearing. More bearing rowsincrease the ability to support heavier loads [29, p. 431] and are necessary to lead the maximumload capacity of 100 t to the frame. The frame is equipped with four hydraulic telescopableoutriggers to pass the loads on to the ground. To heave large weights of 750 t the LG 1750 canbe used with its guyed lattice concept and a maximum hoist height of 193 m. High overturningmoments are counterbalanced by counterweights. The technical data sheet shows the use of aroller slewing bearing [131, p. 6] with an approximately diameter of 3,468 mm (derived fromthe drawing in [131, p. 11]). This information shows that roller bearings are preferred for highaxial loads and applications with higher production quantity. Another important aspect is theload direction oriented design of the telescopic crane booms, owing to the constant position ofheaved loads with respect to the boom, such as shown in Figure 2.38a.
Figure 2.37: Mobile crane LTM 1100-4.2 (left) [129] and LG 1750 (right) [131] by Liebherr
The paper [91] documents the historical development of their cross sections. The first crosssections had simple box shapeswithout any curvature. Thiswas possiblewithout plate buckling,because of the low steel strengths, such as S460Q. Consequently low allowable stresses led
63
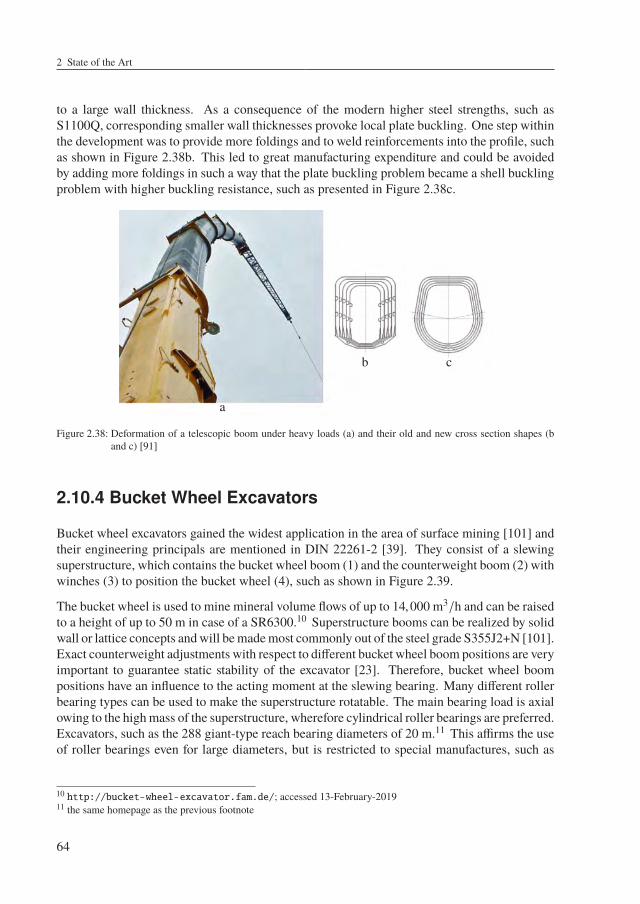
2 State of the Art
to a large wall thickness. As a consequence of the modern higher steel strengths, such asS1100Q, corresponding smaller wall thicknesses provoke local plate buckling. One step withinthe development was to provide more foldings and to weld reinforcements into the profile, suchas shown in Figure 2.38b. This led to great manufacturing expenditure and could be avoidedby adding more foldings in such a way that the plate buckling problem became a shell bucklingproblem with higher buckling resistance, such as presented in Figure 2.38c.
a
b c
Figure 2.38: Deformation of a telescopic boom under heavy loads (a) and their old and new cross section shapes (band c) [91]
2.10.4 Bucket Wheel Excavators
Bucket wheel excavators gained the widest application in the area of surface mining [101] andtheir engineering principals are mentioned in DIN 22261-2 [39]. They consist of a slewingsuperstructure, which contains the bucket wheel boom (1) and the counterweight boom (2) withwinches (3) to position the bucket wheel (4), such as shown in Figure 2.39.
The bucket wheel is used to mine mineral volume flows of up to 14,000 m3/h and can be raisedto a height of up to 50 m in case of a SR6300.10 Superstructure booms can be realized by solidwall or lattice concepts andwill bemademost commonly out of the steel grade S355J2+N [101].Exact counterweight adjustments with respect to different bucket wheel boom positions are veryimportant to guarantee static stability of the excavator [23]. Therefore, bucket wheel boompositions have an influence to the acting moment at the slewing bearing. Many different rollerbearing types can be used to make the superstructure rotatable. The main bearing load is axialowing to the highmass of the superstructure, wherefore cylindrical roller bearings are preferred.Excavators, such as the 288 giant-type reach bearing diameters of 20 m.11 This affirms the useof roller bearings even for large diameters, but is restricted to special manufactures, such as
10 http://bucket-wheel-excavator.fam.de/; accessed 13-February-201911 the same homepage as the previous footnote
64
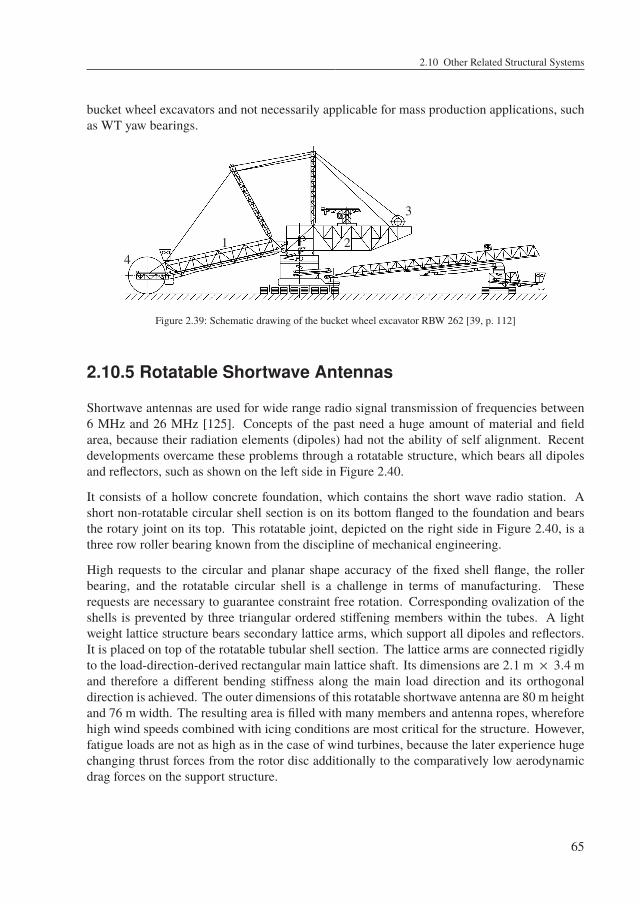
2.10 Other Related Structural Systems
bucket wheel excavators and not necessarily applicable for mass production applications, suchas WT yaw bearings.
14
2
3
Figure 2.39: Schematic drawing of the bucket wheel excavator RBW 262 [39, p. 112]
2.10.5 Rotatable Shortwave Antennas
Shortwave antennas are used for wide range radio signal transmission of frequencies between6 MHz and 26 MHz [125]. Concepts of the past need a huge amount of material and fieldarea, because their radiation elements (dipoles) had not the ability of self alignment. Recentdevelopments overcame these problems through a rotatable structure, which bears all dipolesand reflectors, such as shown on the left side in Figure 2.40.
It consists of a hollow concrete foundation, which contains the short wave radio station. Ashort non-rotatable circular shell section is on its bottom flanged to the foundation and bearsthe rotary joint on its top. This rotatable joint, depicted on the right side in Figure 2.40, is athree row roller bearing known from the discipline of mechanical engineering.
High requests to the circular and planar shape accuracy of the fixed shell flange, the rollerbearing, and the rotatable circular shell is a challenge in terms of manufacturing. Theserequests are necessary to guarantee constraint free rotation. Corresponding ovalization of theshells is prevented by three triangular ordered stiffening members within the tubes. A lightweight lattice structure bears secondary lattice arms, which support all dipoles and reflectors.It is placed on top of the rotatable tubular shell section. The lattice arms are connected rigidlyto the load-direction-derived rectangular main lattice shaft. Its dimensions are 2.1 m × 3.4 mand therefore a different bending stiffness along the main load direction and its orthogonaldirection is achieved. The outer dimensions of this rotatable shortwave antenna are 80 m heightand 76 m width. The resulting area is filled with many members and antenna ropes, whereforehigh wind speeds combined with icing conditions are most critical for the structure. However,fatigue loads are not as high as in the case of wind turbines, because the later experience hugechanging thrust forces from the rotor disc additionally to the comparatively low aerodynamicdrag forces on the support structure.
65
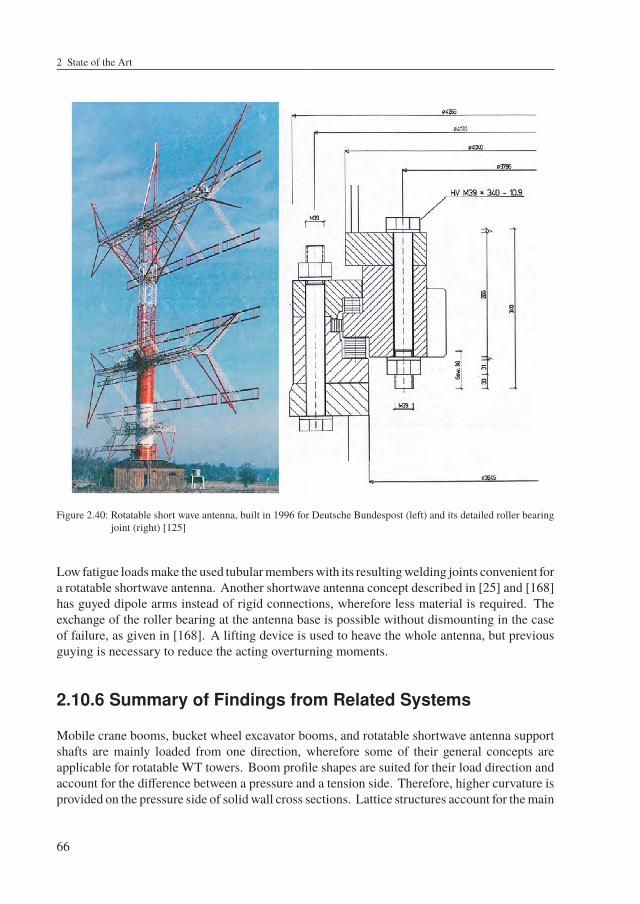
2 State of the Art
Figure 2.40: Rotatable short wave antenna, built in 1996 for Deutsche Bundespost (left) and its detailed roller bearingjoint (right) [125]
Low fatigue loadsmake the used tubularmemberswith its resultingwelding joints convenient fora rotatable shortwave antenna. Another shortwave antenna concept described in [25] and [168]has guyed dipole arms instead of rigid connections, wherefore less material is required. Theexchange of the roller bearing at the antenna base is possible without dismounting in the caseof failure, as given in [168]. A lifting device is used to heave the whole antenna, but previousguying is necessary to reduce the acting overturning moments.
2.10.6 Summary of Findings from Related Systems
Mobile crane booms, bucket wheel excavator booms, and rotatable shortwave antenna supportshafts are mainly loaded from one direction, wherefore some of their general concepts areapplicable for rotatable WT towers. Boom profile shapes are suited for their load direction andaccount for the difference between a pressure and a tension side. Therefore, higher curvature isprovided on the pressure side of solid wall cross sections. Lattice structures account for themain
66
2.10 Other Related Structural Systems
load direction through different side lengths to increase the bending stiffness around the mainlyloaded axis. Modern mobile crane booms are out of high-strength fine-grained steel, becauseof static loads. In opposition, bucket wheel excavator booms are more designed with respectto fatigue and therefore consisting of lower steel grades, such as the hot-rolled structural steelS355J2+N. This achieves lower steel costs, because the current Eurocode 3 normDINEN 1993-1-9:2010-12 for fatigue does not distinguish between steel strengths regarding their fatigueresistance [47]. In contrast to this, research activities of Ummenhofer et al. [188], [187] showthat relations between steel strengths and their fatigue resistance exist especially if weldingseems are treated after welding by a High Frequency Impact Treatment (HiFIT) or by anUltrasonic Impact Treatment (UIT).
Different bearing solutions are proposed by the previous industry applications. The mostof them are working with roller bearings in between a large diameter range from less than1 m up to 20 m. Production quantity has to be considered if the former findings shouldbe applied to WT towers. WTs are produced in higher quantity as bucket wheel excavatorsand shortwave antennas, wherefore the economical benefit of mass production of large rollerbearings can be exploited. Another way to realize large bearing diameters is obtained by pivotwheels, rolling on a rail and optionally combined with an inner slewing ring, such as railwayturntables and rotatable houses have. All the findings in related technical fields show that hugebearing diameters are possible, while large axial loads have to be carried. At the same time,rotatable shortwave antennas show that large bending moments are likewise supportable by aroller bearing with comparatively small diameter. These findings show already that technicalfeasibility for rotatable WT towers is given.
67

3 Load Analysis of ConventionalDesigns
3.1 Methodological Approach
This work focuses on the load analysis of rotatableWT support structures, but it was appropriateto analyse the loads of a conventional WT first. Resulting findings helped to understand thedriving influences and the loads analysis methodology could be validated. After an appropriatereference WT was chosen in section 3.2, simplified analytical equations show the influence ofWT dimensions regarding the tower base bending moment in section 3.3. Next, a literatureresearch for ASE calculated loads of scientific relevant reference WTs in section 3.4 is pre-sented. In the end, the analysis of the reference turbine in section 3.5 achieved a systematiccomparison between the conventional reference and the later presented rotatable support struc-ture. Moreover, it delivered a validation for the ASE load simulation procedure. Note that thestate-of-the-art framework, FAST, mentioned in subsection 2.8.2, was used for all ASE loadsimulations.
3.2 Reference Wind Turbine
ReferenceWTs serve the purpose of comparability between different research and developmentprojects and to set new standards. Therefore, it was appropriate to chose one reference WT asbasis for the development of a rotatable support structure. Some published reference WTs aresummarized with fundamental specifications within Table 3.1.
In this work, the NREL 5MWBaselineWT and its conventional tubular steel tower was chosenas reference, due to following reasons:
• Practical relevant land-based WT power class
• Representative tower concept for the most land-based WTs
• Properties are based on the real existing REpower 5M
• Comprehensive parameter documentation
• Already implemented in the ASE FAST framework
69
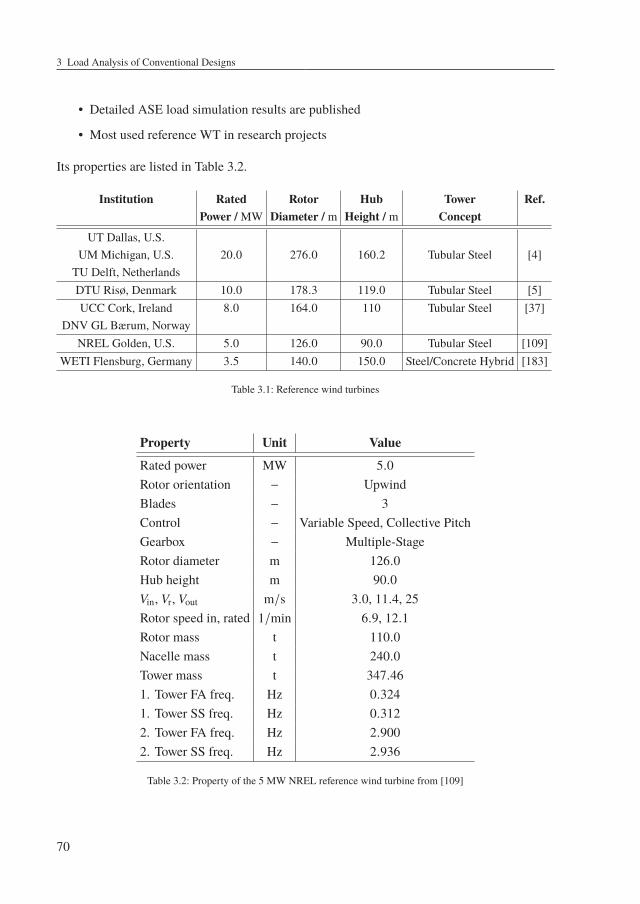
3 Load Analysis of Conventional Designs
• Detailed ASE load simulation results are published
• Most used reference WT in research projects
Its properties are listed in Table 3.2.
Institution Rated Rotor Hub Tower Ref.Power / MW Diameter / m Height / m Concept
UT Dallas, U.S.UM Michigan, U.S. 20.0 276.0 160.2 Tubular Steel [4]
TU Delft, NetherlandsDTU Risø, Denmark 10.0 178.3 119.0 Tubular Steel [5]UCC Cork, Ireland 8.0 164.0 110 Tubular Steel [37]
DNV GL Bærum, NorwayNREL Golden, U.S. 5.0 126.0 90.0 Tubular Steel [109]
WETI Flensburg, Germany 3.5 140.0 150.0 Steel/Concrete Hybrid [183]
Table 3.1: Reference wind turbines
Property Unit Value
Rated power MW 5.0Rotor orientation − UpwindBlades − 3Control − Variable Speed, Collective PitchGearbox − Multiple-StageRotor diameter m 126.0Hub height m 90.0Vin, Vr, Vout m/s 3.0, 11.4, 25Rotor speed in, rated 1/min 6.9, 12.1Rotor mass t 110.0Nacelle mass t 240.0Tower mass t 347.461. Tower FA freq. Hz 0.3241. Tower SS freq. Hz 0.3122. Tower FA freq. Hz 2.9002. Tower SS freq. Hz 2.936
Table 3.2: Property of the 5 MW NREL reference wind turbine from [109]
70
3.3 Quasi-Steady Loads Sensitivity to Structural Dimensions
3.3 Quasi-Steady Loads Sensitivity to StructuralDimensions
Quasi-steady loads, such as defined in Table 2.5 of subsection 2.8.1, are dependent on thestructural properties of a WT. This subsection treats analytical load estimations for differentWTs with conventional tubular towers to show these dependencies. Tubular tower designdriving load components are the internal normal forces and the acting bending moments.While normal forces are due to the structural self-weight, bending moments result form themean rotor thrust and the aerodynamic drag forces on the tower with their respective lever arms.Thereby, the mean rotor thrust is a function of the rotor diameter and the hub height. Towerdrag forces are due to the tower diameter and the tower height. Mean rotor thrust T and towerdrag W estimates can be carried out according to Gasch [77] by the relations
T =12ρair AR cT V2
H (3.1)
W =12ρair AT cD V2
eq, (3.2)
where ρair is the air density, AR and AT are the rotor and projected tower area, cT and cDare the assumed rotor thrust and tower drag coefficients, VH equals to the wind speed at hubheight, and Veq equals to the equivalent wind speed at the weighted wind attack point onthe tower, respectively. Furthermore, an exponential wind profile according to IEC 61400-1 [50] was assumed to calculate the wind speed distribution Vw(z) along the WT height. Itfollowed from the relation, given in Equation 2.11. The thrust force of the rotor in Equation 3.1was calculated by the mean wind speed of the exponential wind profile in Equation 2.11:
〈Vw(z)〉zH −12
Drot ≤ z ≤ zH +12
Drot. Furthermore, the wind drag force per unit length wasgiven through normalization of Equation 3.2 by the hub height zH.
qW,x(z) =12ρair DT(z) cD (Vw(z))2 (3.3)
For the purpose of this loads study, the outer tower diameter DT(z) is represented by the linearEquation 3.4
DT(z) = DT,b +DT,t − DT,b
zHz, (3.4)
71
3 Load Analysis of Conventional Designs
where DT(z = 0) = DT,b is the tower base diameter and DT(z = zH) = DT,t is the towertop diameter, respectively. Usage of Equation 3.4 and integration of the wind line load ofEquation 3.3 delivers the accumulated shear force distribution according to
QW,x(z) =∫ zH−z
0qW,x(z) dz
=
∫ zH−z
0
[12ρair
(DT,b +
DT,t − DT,b
zHz)
cD
(VH
(z
zH
)α)2]
dz
=12ρair cD
(VH
zαH
)2
︸ ︷︷ ︸C
(zH − z)2 α+1[
DT,b
2 α + 1+
DT,t − DT,b
zH (2 α + 2)(zH − z)
] (3.5)
Another integration of QW,x(z) and T delivers the bending moment due to tower wind loads
MW,y(z) =∫ zH−z
0QW,x(z) dz
=
∫ zH−z
0C (zH − z)2 α+1
[DT,b
2 α + 1+
DT,t − DT,b
zH (2 α + 2)(zH − z)
]dz
= −C (zH − z)2 α+2[
DT,b
4 α2 + 6 α + 2+
DT,t − DT,b
zH(4 α2 + 10α + 6
) (zH − z)] zH−z
0
= C[
DT,b
4 α2 + 6 α + 2
(z2 α+2
H − z2 α+2)+
DT,t − DT,b
zH(4 α2 + 10α + 6
) (z2 α+3
H − z2 α+3)].
(3.6)and due to rotor thrust
MT,y(z) =∫ zH−z
0T dz
= T (zH − z)(3.7)
Application of these equations together with the parameter set from Table 3.3 reveals themagnitude of FA bending moments in a rated steady wind speed situation for different hubheights and rotor diameters.
The thrust coefficient for rated wind speed was calculated according to the 5 MW NRELreference WT [109] and outer tower dimensions were taken from it, likewise. An exponentialwind profile with α = 0.2 was chosen, with respect to IEC 61400-1 [50].
Figure 3.1 shows the resulting bending moments from Equations 3.6 and 3.7 at z = 0 for thetower base in different relations and WT configurations. The top diagram depicts the absolutetower base bending moments for the rated wind speed of Vr = 11.4 m/s for different towerheights and rotor diameters. The moments increase with increasing dimensions, as expected.In the middle diagram, tower base bending moments caused by the tower drag are related tomoments caused by the rotor thrust. For this parameter set, the tower drag load contribution of2 % to 11 % is relatively small with respect to the rotor thrust contribution. The bottom diagram
72
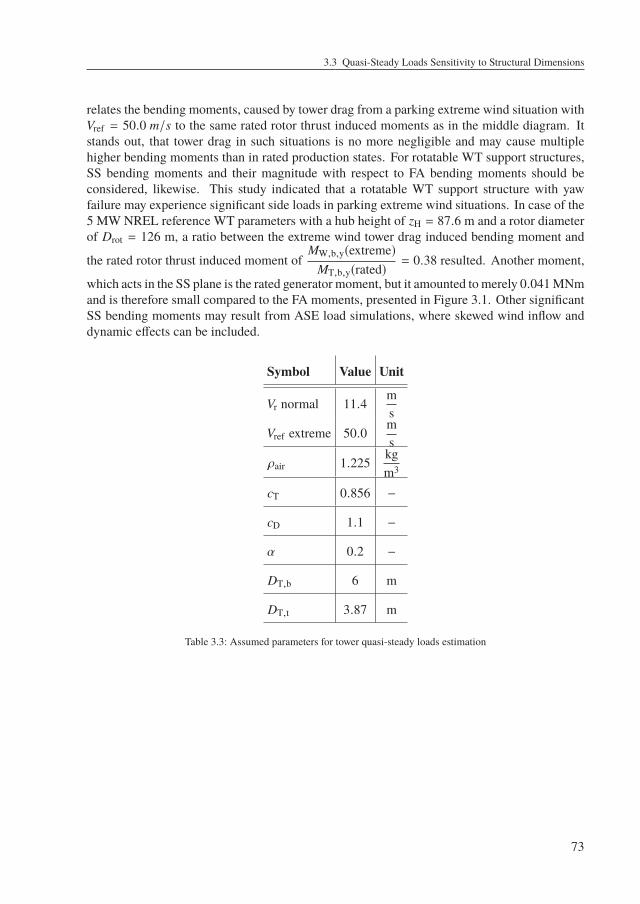
3.3 Quasi-Steady Loads Sensitivity to Structural Dimensions
relates the bending moments, caused by tower drag from a parking extreme wind situation withVref = 50.0 m/s to the same rated rotor thrust induced moments as in the middle diagram. Itstands out, that tower drag in such situations is no more negligible and may cause multiplehigher bending moments than in rated production states. For rotatable WT support structures,SS bending moments and their magnitude with respect to FA bending moments should beconsidered, likewise. This study indicated that a rotatable WT support structure with yawfailure may experience significant side loads in parking extreme wind situations. In case of the5 MW NREL reference WT parameters with a hub height of zH = 87.6 m and a rotor diameterof Drot = 126 m, a ratio between the extreme wind tower drag induced bending moment and
the rated rotor thrust induced moment ofMW,b,y(extreme)
MT,b,y(rated)= 0.38 resulted. Another moment,
which acts in the SS plane is the rated generator moment, but it amounted to merely 0.041 MNmand is therefore small compared to the FA moments, presented in Figure 3.1. Other significantSS bending moments may result from ASE load simulations, where skewed wind inflow anddynamic effects can be included.
Symbol Value Unit
Vr normal 11.4ms
Vref extreme 50.0ms
ρair 1.225kgm3
cT 0.856 −
cD 1.1 −
α 0.2 −
DT,b 6 m
DT,t 3.87 m
Table 3.3: Assumed parameters for tower quasi-steady loads estimation
73
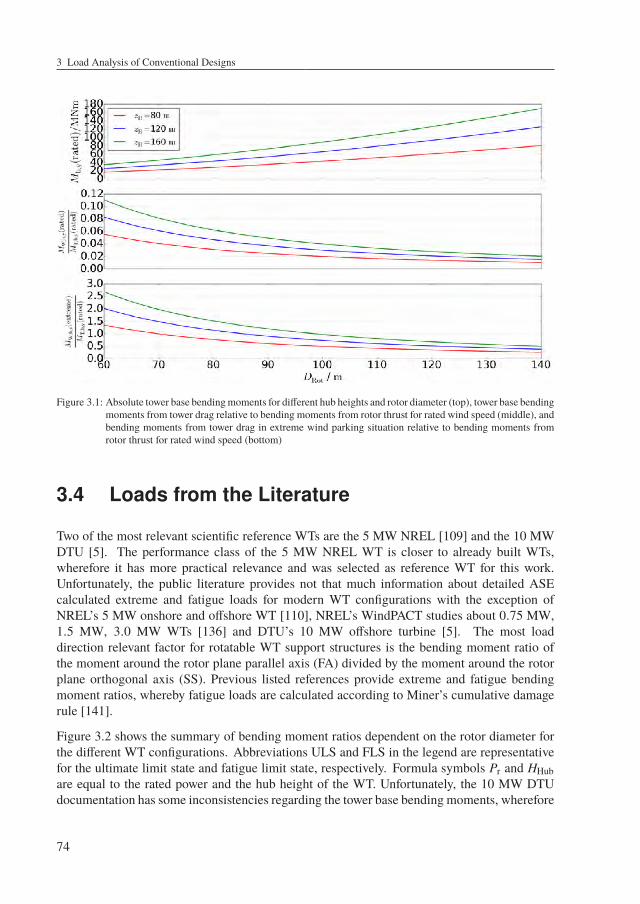
3 Load Analysis of Conventional Designs
Figure 3.1: Absolute tower base bendingmoments for different hub heights and rotor diameter (top), tower base bendingmoments from tower drag relative to bending moments from rotor thrust for rated wind speed (middle), andbending moments from tower drag in extreme wind parking situation relative to bending moments fromrotor thrust for rated wind speed (bottom)
3.4 Loads from the Literature
Two of the most relevant scientific reference WTs are the 5 MW NREL [109] and the 10 MWDTU [5]. The performance class of the 5 MW NREL WT is closer to already built WTs,wherefore it has more practical relevance and was selected as reference WT for this work.Unfortunately, the public literature provides not that much information about detailed ASEcalculated extreme and fatigue loads for modern WT configurations with the exception ofNREL’s 5 MW onshore and offshore WT [110], NREL’s WindPACT studies about 0.75 MW,1.5 MW, 3.0 MW WTs [136] and DTU’s 10 MW offshore turbine [5]. The most loaddirection relevant factor for rotatable WT support structures is the bending moment ratio ofthe moment around the rotor plane parallel axis (FA) divided by the moment around the rotorplane orthogonal axis (SS). Previous listed references provide extreme and fatigue bendingmoment ratios, whereby fatigue loads are calculated according to Miner’s cumulative damagerule [141].
Figure 3.2 shows the summary of bending moment ratios dependent on the rotor diameter forthe different WT configurations. Abbreviations ULS and FLS in the legend are representativefor the ultimate limit state and fatigue limit state, respectively. Formula symbols Pr and HHubare equal to the rated power and the hub height of the WT. Unfortunately, the 10 MW DTUdocumentation has some inconsistencies regarding the tower base bending moments, wherefore
74
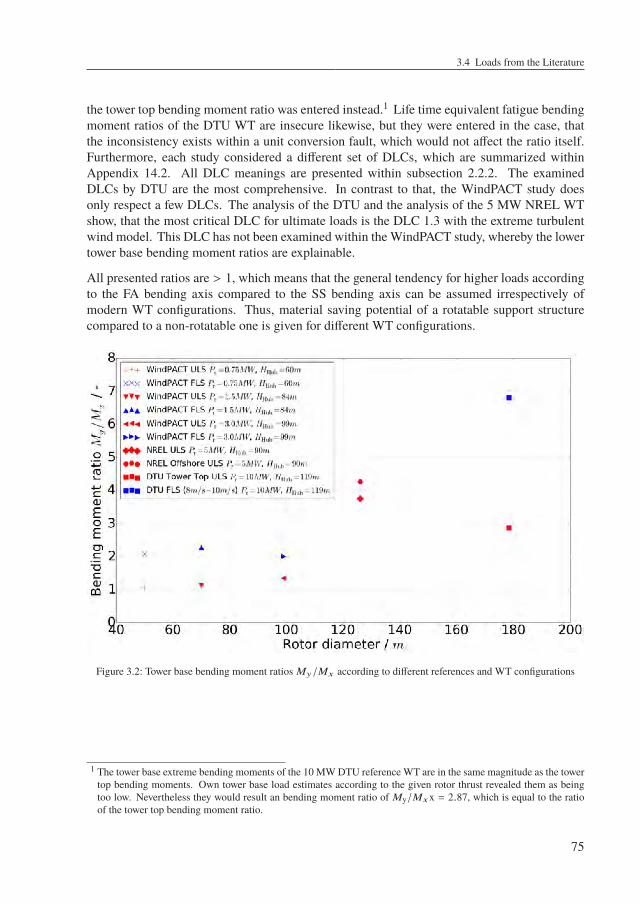
3.4 Loads from the Literature
the tower top bending moment ratio was entered instead.1 Life time equivalent fatigue bendingmoment ratios of the DTU WT are insecure likewise, but they were entered in the case, thatthe inconsistency exists within a unit conversion fault, which would not affect the ratio itself.Furthermore, each study considered a different set of DLCs, which are summarized withinAppendix 14.2. All DLC meanings are presented within subsection 2.2.2. The examinedDLCs by DTU are the most comprehensive. In contrast to that, the WindPACT study doesonly respect a few DLCs. The analysis of the DTU and the analysis of the 5 MW NREL WTshow, that the most critical DLC for ultimate loads is the DLC 1.3 with the extreme turbulentwind model. This DLC has not been examined within the WindPACT study, whereby the lowertower base bending moment ratios are explainable.
All presented ratios are > 1, which means that the general tendency for higher loads accordingto the FA bending axis compared to the SS bending axis can be assumed irrespectively ofmodern WT configurations. Thus, material saving potential of a rotatable support structurecompared to a non-rotatable one is given for different WT configurations.
Figure 3.2: Tower base bending moment ratios My/Mx according to different references and WT configurations
1 The tower base extreme bending moments of the 10 MW DTU reference WT are in the same magnitude as the towertop bending moments. Own tower base load estimates according to the given rotor thrust revealed them as beingtoo low. Nevertheless they would result an bending moment ratio of My/Mxx = 2.87, which is equal to the ratioof the tower top bending moment ratio.
75
3 Load Analysis of Conventional Designs
3.5 ASE Load Analysis of the Reference WindTurbine
While the previous section presents loads from the literature, in this section the FAST frame-work, introduced in subsection 2.8.2, was used to performown loads studies for the non-rotatablereference tower. This first analysis served as validation of the general ASE load simulationprocedure and as reference to the later ASE load simulation of the rotatable support structure.Python2 scripts were written to automatically generate all required input files for the TurbSimturbulent wind field generator, for the IECWind3 steady wind field generator, and for the FASTenvironment. Thereby, the parameter settings for the different DLCs could be set byminimizingthe probability of typing errors. Moreover, to shorten the ASE simulation time, the analysiswas parallelized by distributing the start command of the different simulation jobs over severalbatch files. Thereby, one batch file for each thread of the computer was created.
3.5.1 Validation of ASE Load Analysis Procedure with DLCs1.x
ASE load simulations are sensitive to many parameters, whereby inexperienced engineers tendto make mistakes in setting the correct values and to pick the wrong underlying models. For thisreason, an existing study was used as basis for further investigations. The previous mentionedstudy of Jonkman [110] presents load comparisons between the land-based 5 MW NRELreference WT and an offshore floating version of it. The following own loads analysis used allthe parameters, given in this study [110] to reproduce the same loads analysis results. This stepensured the correct application of this complex ASE tool. Nevertheless, a brief summary ofthe most important applied parameter settings, simplifying assumptions, and considered DLCsof the comparative study [110] are presented beforehand.
Modelling Assumptions in the ASE Load Analysis of Jonkman [110]The study [110] uses the NREL 5 MW BaselineWT, presented in 3.2, as a land-based and as anoffshore variant with floating barge. For this work, only the land-based version was of interest.For comparison between the land-based and the offshore version, Jonkman [110] chose anoffshore reference site in the northeast of the Shetland Islands of Scotland in collaboration withITI Energy. Since both versions should experience the same wind conditions for comparability,a power law exponent of α = 0.14 was used for the land-based and for the offshore variant.The power law exponent is applied in the underlying power law wind profile, introduced insubsection 2.2.2. Note that extreme wind conditions with a recurrence period of 1 year and50 years were modelled with α = 0.11. The reference 10 min average wind speed Vref and theexpected turbulence intensity Iref were assumed according to WT class BI. Values for Vref andIref may be reviewed from Table 2.3. The air density was chosen with respect to IEC 61400-
2 The Python(x,y)-2.7.10.0 distribution was used. It is available at https://python-xy.github.io/; accessed21-July-2020
3 IECWind version 4.0 was used in this work
76
3.5 ASE Load Analysis of the Reference Wind Turbine
1 [50] to be ρair = 1.225kgm3 . Simplifications in this study were made by the exclusion of
earthquakes, wake effects from neighbouring wind turbines, atmospheric pressure variations,and the soil conditions. Thus, the WT was clamped to the ground rigidly. Following DOFswere enabled in the analysis: two flapwise and one edgewise bending-mode for each blade,one drivetrain torsion, one variable generator speed, one nacelle yaw, and two FA and two SStower bending modes. Scaling of two blade masses, one with +0.5 % and one with −0.5 % ofthe reference mass was incorporated to mimic a rotor imbalance. Furthermore, blade structuraldamping ratios of each blade mode were set to 2.5 % of the critical value. Aerodynamic towerdrag was neglected, because it was not available in AeroDyn, at that time. The ASE simulationswere carried out with FAST glue-code version 6.10a-jmj and AeroDyn version v12.60i-pjm.
DLC Specifications in the ASE Load Analysis of Jonkman [110]Due to the preliminary nature of the study [110], not all DLCs, demanded by the IEC 61400-1 [50], were analysed. Although it is stated, that fatigue behaviour governs the design of WTsin many cases, fatigue DLCs were neglected. This step is justified, because the study claims tocover only a first step of an iterative design procedure where an initial concept is designed withrespect to ultimate loads, before it is checked for fatigue.4 Start-up and shutdown DLCs (3.x,4.x, 5.x) as well as the transport, assembly, maintenance, and repair DLCs (8.x) were neglected.Jonkman [110] stated that in his experience with land-based turbines, the omitted DLCs didnot dominate the ultimate loads. Consequently, the land-based relevant DLC specifications inTable 3.4 were considered.
In case of statistical extrapolated loads in DLC 1.1, the PSF for loads is 1.25. Jonkman statedthat in his and others experience loads increase about 20 % after extrapolation. Therefore,he replaced the extrapolation procedure by scaling the loads of DLC 1.1 with a factor of1.2 [110, p. 100]. In power production DLCs, the quasi-steady BEM axial-induction modelwith the Beddoes-Leishman dynamic-stall model were used in AeroDyn. For parking DLCs,thesemodelswere disabled because theywere unsuitable for high post-stall angles of attack [110,p.97]. Moreover, parkingDLCsweremodelledwith an idling rotor and 90 pitched rotor blades.According to IEC 61400-1 7.4.2 [50], fault situations with the most unfavourable consequenceshave to be considered. Jonkman [110] decided to simulate a fault in DLC 2.1 where one bladeis running suddenly with full pitch rate of 8 /s to 0. It was assumed that the WT protectionsystem detects the fault and that the control system performs a shutdown with 0.2 s delay. Theshutdown happened through feathering the other two blades to 90.
4 see also van der Tempel [189].
77
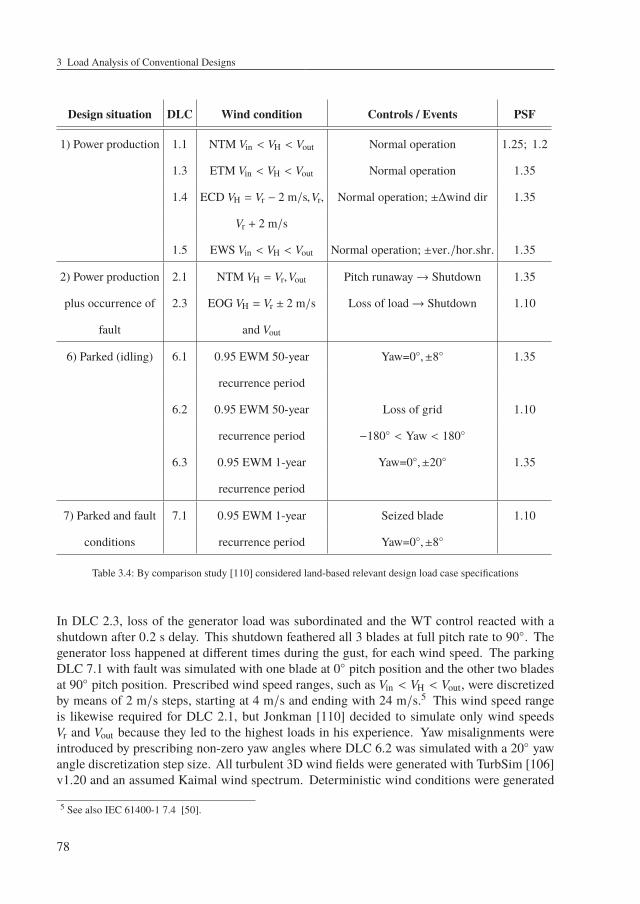
3 Load Analysis of Conventional Designs
Design situation DLC Wind condition Controls / Events PSF
1) Power production 1.1 NTM Vin < VH < Vout Normal operation 1.25; 1.2
1.3 ETM Vin < VH < Vout Normal operation 1.35
1.4 ECD VH = Vr − 2 m/s,Vr, Normal operation; ±∆wind dir 1.35
Vr + 2 m/s
1.5 EWS Vin < VH < Vout Normal operation; ±ver./hor.shr. 1.35
2) Power production 2.1 NTM VH = Vr,Vout Pitch runaway→ Shutdown 1.35
plus occurrence of 2.3 EOG VH = Vr ± 2 m/s Loss of load→ Shutdown 1.10
fault and Vout
6) Parked (idling) 6.1 0.95 EWM 50-year Yaw=0,±8 1.35
recurrence period
6.2 0.95 EWM 50-year Loss of grid 1.10
recurrence period −180 < Yaw < 180
6.3 0.95 EWM 1-year Yaw=0,±20 1.35
recurrence period
7) Parked and fault 7.1 0.95 EWM 1-year Seized blade 1.10
conditions recurrence period Yaw=0,±8
Table 3.4: By comparison study [110] considered land-based relevant design load case specifications
In DLC 2.3, loss of the generator load was subordinated and the WT control reacted with ashutdown after 0.2 s delay. This shutdown feathered all 3 blades at full pitch rate to 90. Thegenerator loss happened at different times during the gust, for each wind speed. The parkingDLC 7.1 with fault was simulated with one blade at 0 pitch position and the other two bladesat 90 pitch position. Prescribed wind speed ranges, such as Vin < VH < Vout, were discretizedby means of 2 m/s steps, starting at 4 m/s and ending with 24 m/s.5 This wind speed rangeis likewise required for DLC 2.1, but Jonkman [110] decided to simulate only wind speedsVr and Vout because they led to the highest loads in his experience. Yaw misalignments wereintroduced by prescribing non-zero yaw angles where DLC 6.2 was simulated with a 20 yawangle discretization step size. All turbulent 3D wind fields were generated with TurbSim [106]v1.20 and an assumed Kaimal wind spectrum. Deterministic wind conditions were generated
5 See also IEC 61400-1 7.4 [50].
78
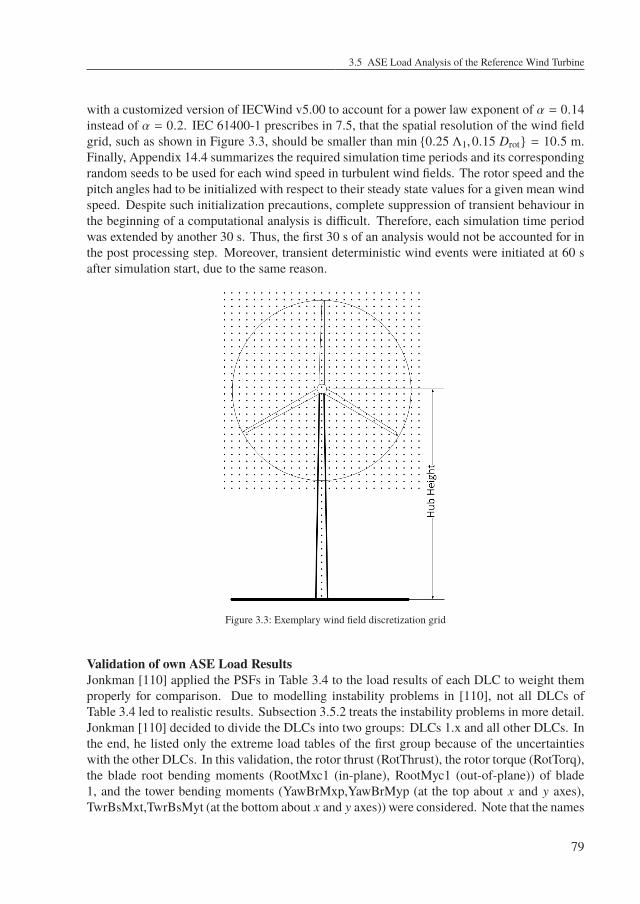
3.5 ASE Load Analysis of the Reference Wind Turbine
with a customized version of IECWind v5.00 to account for a power law exponent of α = 0.14instead of α = 0.2. IEC 61400-1 prescribes in 7.5, that the spatial resolution of the wind fieldgrid, such as shown in Figure 3.3, should be smaller than min 0.25 Λ1,0.15 Drot = 10.5 m.Finally, Appendix 14.4 summarizes the required simulation time periods and its correspondingrandom seeds to be used for each wind speed in turbulent wind fields. The rotor speed and thepitch angles had to be initialized with respect to their steady state values for a given mean windspeed. Despite such initialization precautions, complete suppression of transient behaviour inthe beginning of a computational analysis is difficult. Therefore, each simulation time periodwas extended by another 30 s. Thus, the first 30 s of an analysis would not be accounted for inthe post processing step. Moreover, transient deterministic wind events were initiated at 60 safter simulation start, due to the same reason.
Figure 3.3: Exemplary wind field discretization grid
Validation of own ASE Load ResultsJonkman [110] applied the PSFs in Table 3.4 to the load results of each DLC to weight themproperly for comparison. Due to modelling instability problems in [110], not all DLCs ofTable 3.4 led to realistic results. Subsection 3.5.2 treats the instability problems in more detail.Jonkman [110] decided to divide the DLCs into two groups: DLCs 1.x and all other DLCs. Inthe end, he listed only the extreme load tables of the first group because of the uncertaintieswith the other DLCs. In this validation, the rotor thrust (RotThrust), the rotor torque (RotTorq),the blade root bending moments (RootMxc1 (in-plane), RootMyc1 (out-of-plane)) of blade1, and the tower bending moments (YawBrMxp,YawBrMyp (at the top about x and y axes),TwrBsMxt,TwrBsMyt (at the bottom about x and y axes)) were considered. Note that the names
79
3 Load Analysis of Conventional Designs
for the different loads correspond to the load sensor names, defined in the FAST environment.Due to the stochastic nature of ASE load analyses with turbulent wind fields, deviations from thecomparison study of Jonkman [110] could be expected. Unfortunately, no further informationabout the statistical properties, such as the expected value µ or the standard deviation σ ofhis results with six random seeds per wind speed were available. Haid et al. [90] publishedinformation about expected load deviations with respect to the amount of selected randomseeds in ASE load analyses of offshore floating WTs. They [90] provide an investigation forthe absolute maximum blade root out-of-plane bending moment at 12 m/s mean wind speed inthe NTM wind model. This bending moment diverged with 10 random seeds by 3.5 % fromthe mean of 36 random seeds with 95 % confidence. Similar results could likewise be observedfor other loads.
In the present comparison of loads another method was applied for the purpose of valida-tion. The goal was to simulate a larger amount of stochastic sensitive timeseries to show theprobability with which Jonkman’s [110] results would occur in own load analyses. For thispurpose, all 1.x DLCs were simulated with the same settings, as in the comparison study ofJonkman [110]. The only difference was the amount of chosen random seeds for the extremeload relevant wind speeds. For DLC 1.1 with wind speed VH = 24 m/s and DLC 1.3 with windspeeds VH = 20 m/s and VH = 24 m/s, 500 random seeds were simulated instead of 6. Thesewind speeds were more relevant than the others because according to appendix F in [110], theextreme loads of the most considered sensors occurred within them. Table 3.5 summarizes theresults of the comparison study [110] and the own load simulations. Thereby, the first columnlists the considered load sensors, the second and third columns contain the calculated extremeloads of each load sensor together with the corresponding DLC and mean hub height windspeed where they occur. Column two contains the results of the comparison study [110] andcolumn three the results of the own simulations. The last column gives information about theunit of the load sensor and its value deviation with respect to the comparison study [110]. Apositive deviation indicates, that the own result is higher than the comparison result. Table 3.5shows, that this was true for each considered load sensor, except for the FA tower base bendingmoment (TwrBsMyt). The reason for that is discussed later in this subsection. For somesensors, such as the in-plane bending moment of blade 1 (RootMxc1), the FA bending momentat the top of the tower (YawBrMyp), and the SS bending moment at the bottom of the tower(TwrBsMxt) deviations of > 10 % occurred. Furthermore, the driving DLC for the out-of-planeblade bending moment (RootMyc1) changed from 1.4 r+2 to 1.3 V24. Note that r+2 denotesrated wind speed at hub height plus 2 m/s and V24 denotes 24 m/s wind speed at hub height,respectively. All these result differences are justified through the huge difference in the numberof considered random seeds. Due to probability, more random seeds in certain DLCs increasetheir chance to be load drivers.
Therefore, a closer look into the statistical evaluation of extreme loads helped to explain thedifferences. Figure 3.4 highlights the statistical results for the rotor thrust, the rotor torque,and the blade 1 bending moments. The results are presented in form of the probability densityfunction (PDF)
PDF(x, µ,σ2
)= ϕµ,σ2 (x) =
1√
2 π σ2e−(x − µ)2
2 σ2 , (3.8)
80
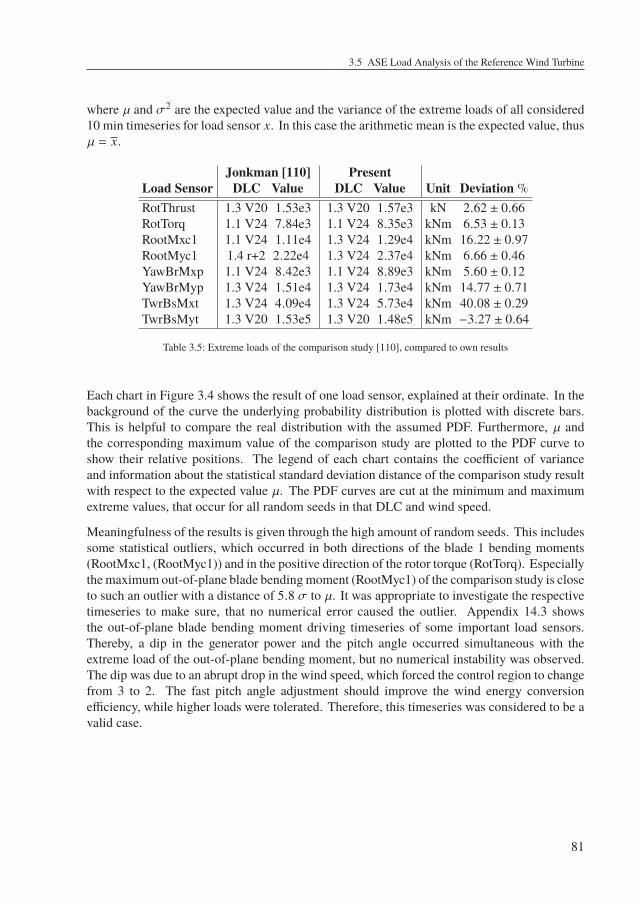
3.5 ASE Load Analysis of the Reference Wind Turbine
where µ and σ2 are the expected value and the variance of the extreme loads of all considered10 min timeseries for load sensor x. In this case the arithmetic mean is the expected value, thusµ = x.
Jonkman [110] PresentLoad Sensor DLC Value DLC Value Unit Deviation %RotThrust 1.3 V20 1.53e3 1.3 V20 1.57e3 kN 2.62 ± 0.66RotTorq 1.1 V24 7.84e3 1.1 V24 8.35e3 kNm 6.53 ± 0.13RootMxc1 1.1 V24 1.11e4 1.3 V24 1.29e4 kNm 16.22 ± 0.97RootMyc1 1.4 r+2 2.22e4 1.3 V24 2.37e4 kNm 6.66 ± 0.46YawBrMxp 1.1 V24 8.42e3 1.1 V24 8.89e3 kNm 5.60 ± 0.12YawBrMyp 1.3 V24 1.51e4 1.3 V24 1.73e4 kNm 14.77 ± 0.71TwrBsMxt 1.3 V24 4.09e4 1.3 V24 5.73e4 kNm 40.08 ± 0.29TwrBsMyt 1.3 V20 1.53e5 1.3 V20 1.48e5 kNm −3.27 ± 0.64
Table 3.5: Extreme loads of the comparison study [110], compared to own results
Each chart in Figure 3.4 shows the result of one load sensor, explained at their ordinate. In thebackground of the curve the underlying probability distribution is plotted with discrete bars.This is helpful to compare the real distribution with the assumed PDF. Furthermore, µ andthe corresponding maximum value of the comparison study are plotted to the PDF curve toshow their relative positions. The legend of each chart contains the coefficient of varianceand information about the statistical standard deviation distance of the comparison study resultwith respect to the expected value µ. The PDF curves are cut at the minimum and maximumextreme values, that occur for all random seeds in that DLC and wind speed.
Meaningfulness of the results is given through the high amount of random seeds. This includessome statistical outliers, which occurred in both directions of the blade 1 bending moments(RootMxc1, (RootMyc1)) and in the positive direction of the rotor torque (RotTorq). Especiallythe maximum out-of-plane blade bendingmoment (RootMyc1) of the comparison study is closeto such an outlier with a distance of 5.8 σ to µ. It was appropriate to investigate the respectivetimeseries to make sure, that no numerical error caused the outlier. Appendix 14.3 showsthe out-of-plane blade bending moment driving timeseries of some important load sensors.Thereby, a dip in the generator power and the pitch angle occurred simultaneous with theextreme load of the out-of-plane bending moment, but no numerical instability was observed.The dip was due to an abrupt drop in the wind speed, which forced the control region to changefrom 3 to 2. The fast pitch angle adjustment should improve the wind energy conversionefficiency, while higher loads were tolerated. Therefore, this timeseries was considered to be avalid case.
81
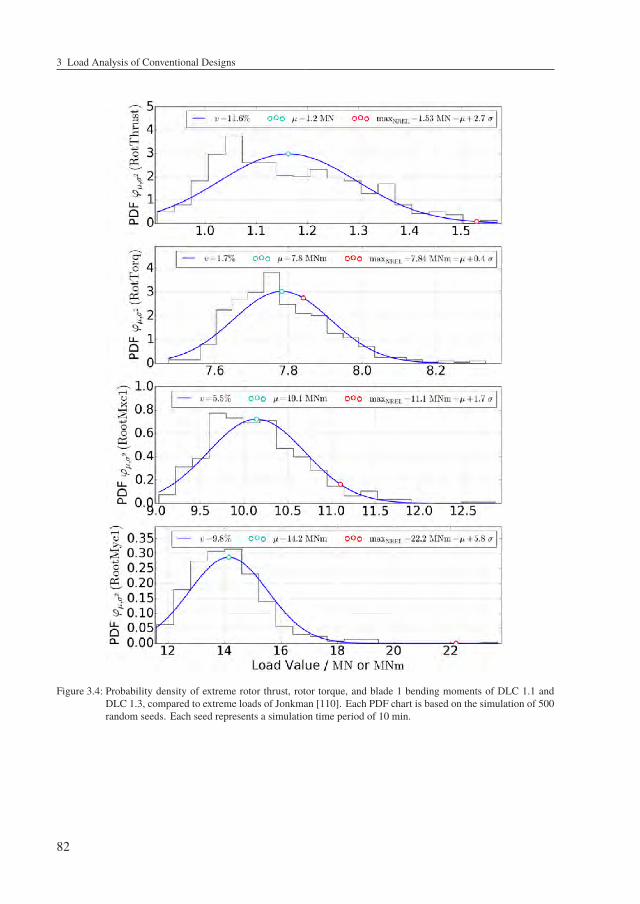
3 Load Analysis of Conventional Designs
Figure 3.4: Probability density of extreme rotor thrust, rotor torque, and blade 1 bending moments of DLC 1.1 andDLC 1.3, compared to extreme loads of Jonkman [110]. Each PDF chart is based on the simulation of 500random seeds. Each seed represents a simulation time period of 10 min.
82

3.5 ASE Load Analysis of the Reference Wind Turbine
Figure 3.5: Probability density of extreme tower top and tower bottom bending moments of DLC 1.1 and DLC 1.3,compared to extreme loads of Jonkman [110]. Each PDF chart is based on the simulation of 500 randomseeds. Each seed represents a simulation time period of 10 min.
Analogous, the statistical results of the extreme tower bendingmoments are shown in Figure 3.5.Here, only the FA tower base bending moment (TwrBsMyt) shows some significant outliers andthe reference result of the NREL comparison study [110] had a distance of 4.0 σ from µ. Themaximum value of TwrBsMyt in the own analysis was 1.48e5 kNm and was therefore 3.3 %
83
3 Load Analysis of Conventional Designs
lower than the result of the comparison study [110]. Unfortunately, the study [110] gives noinformation about the numerical stability of the interesting timeseries nor shows the timeseriesthemselves. This is due to the different scope of Jonkman [110], who compared the land-basedand offshore extreme loads with focus on the complex offshore floating barge support. Thus,there are four possible scenarios, which could explain that the own results for the FA tower basebending moment are slightly lower than the results from the comparison study:
1. The present own ASE loads analysis had somewhere different settings than the compar-ison study.
2. The more recent software versions of FAST, AeroDyn, and TurbSim, used in the ownanalyses, led to incomparability between the results due to underlying changes in thephysical models.
3. The result of the comparison study [110] was a valid statistical outlier.
4. The result of the comparison study [110] could be an invalid statistical outlier due tonumerical instability.
To treat scenario 1., Appendix 14.5 shows the main input files, from which the new validmaximum FA tower base bending moment resulted. Showing the corresponding input files isnecessary for transparency anyway. The answer to scenario 2. is, that according to the AeroDynchange log [26], no changes to the physical models were done between the relevant softwareversions, which would lead to the load differences. If more recent options were available, thesettings in AeroDyn and TurbSim were set such that they mimic the settings of the comparisonstudy. For example the aerodynamic tower drag CalcTwrAero was disabled and the ScaleIECparameter in TurbSim was set to 0. Jonkman provided access to the timeseries, which wasresponsible for his extreme FA tower base bending moment. It is shown together with ownresults in Appendix 14.6 and reveals, that no numerical instability caused the extreme load inthe comparison study [110] or in the own extreme load timeseries. The extreme FA tower basebendingmoments were rather caused by the change of the control region, such as for the extremeout-of-plane blade bending moment (RootMyc1), mentioned earlier in this subsection. Thus,scenario 4. could be rejected. Furthermore, the FA tower base bending moment arithmeticmeans and their standard deviation suggests that the own load simulation parameters wereset correctly. Although the comparison studies extreme load was about 3.3 % larger thanthe corresponding extreme of the own ASE analysis, the arithmetic mean and the standarddeviation of the comparison studies timeseries were about 3.6 % smaller. These comparablesmall differences would not play a crucial role for the goal of this work and all important inputfiles are disclosed in Appendix 14.5 for the review of following researchers. The similarity ofown results compared to the comparison study supports that the important model settings werechosen correctly. Therefore, the own load simulation procedure is considered to be validated.
84
3.5 ASE Load Analysis of the Reference Wind Turbine
3.5.2 Blade-Stall-Induced Vibrations in Parking DLCs
As explained in subsection 3.5.1, Jonkman [110] avoided the presentation of extreme loadsfor other DLCs than 1.x, but especially for rotatable support structures, other DLCs than 1.xmay be relevant. In the comparison study, idling DLC 6.2 showed an unreasonable extremeload driving SS tower instability between certain yaw misalignments. Note that DLC 6.2 treatsa loss of electrical power grid in extreme wind speed parking situation, wherefore each yawmisalignment −180 < Yaw Error < 180 was possible. The mentioned instability couldlikewise be reproduced in own ASE simulations. In DLC 6.2 of IEC 61400-1 [103], an extremewind speed Ve50 = 50 m/s with recurrence period of 50 years and in DLC 6.3 an extreme windspeed Ve1 = 40 m/s with recurrence period of 1 year is proposed for wind turbine class I. Inthese cases, theWT rotor idles freely with all blades being feathered to 90 deg. Own experienceindicated, that idling of the WT rotor led to smaller loads, than a fixed parked rotor.
Jonkman [110, p. 118] stated in the comparison study that it was difficult to determine, whetherthe instability was of physical nature or was an artefact of modelling assumptions. He supposedthat the amount of structural damping in the first SS tower bending mode was exceeded by therotors energy absorption. Skrzypinski confirmed this behaviour in his dissertation [172, p. 22]and related it to negative damping for the first edgewise blade mode in parking DLCs withspecific yaw misalignments. Figure 3.6 shows the maximum, mean, and the minimum rotorthrusts (RotThrust) and edgewise bending moments (RootMxb1) of DLC 6.2 for different yawmisalignments between −180 deg ≤ Yaw Error ≤ 180 deg of the own analysis. This time,turbulent wind fields were used. The mean of the standard deviations of six simulationswith different random seeds is likewise plotted and indicates on which yaw misalignmentsinstabilities occur.
In this analysis, yaw misalignments of −40 deg ≤ Yaw Error ≤ −10 deg and 10 deg ≤Yaw Error ≤ 30 deg highlighted significant instabilities. Moreover, Skrzypinski [172, p. 22]associated the negative damping in the edgewise blademode to stall-induced vibrations. Bertag-nolio et al. [11] stated that airfoils under stall conditions experience large fluctuations of aerody-namic forces, caused by trailing edge shear flow instabilities, airfoil surface turbulent boundarylayer vortices, vortex shedding, and unsteady detached flow over the airfoil. This phenomenoncan be observed within the FAST and the HAWC2 ASE codes, but Skrzypinski [172, p. 54]concluded that in state-of-the-arts ASE codes, blade standstill vibrations in deep stall are prob-ably modelled inaccurately. He suggested that low amounts of temporal lag in the aerodynamicresponse would already lead to significantly increased aerodynamic damping, which wouldprevent the unstable behaviour. Based on these and other experts experience6, it was not sure ifthe instabilities would occur in the physical world. Therefore, ASE calculations of critical yawmisalignments between −40 deg ≤ Yaw Error ≤ −10 deg and 10 deg ≤ Yaw Error ≤ 40 deg inparking DLCs were discarded in this work. In case that future findings confirm the instabilitiesas being real in a physical sense, the rotatable WT support structure, developed in this work,must be checked again for these yaw misalignments in extreme wind speed conditions.
6 See a discussion about this topic by the experts internet community forum of the National Wind Technology Center(NWTC) ofNREL:https://wind.nrel.gov/forum/wind/viewtopic.php?f=3&t=1219&p=5270; last accesson 5. March 2018
85
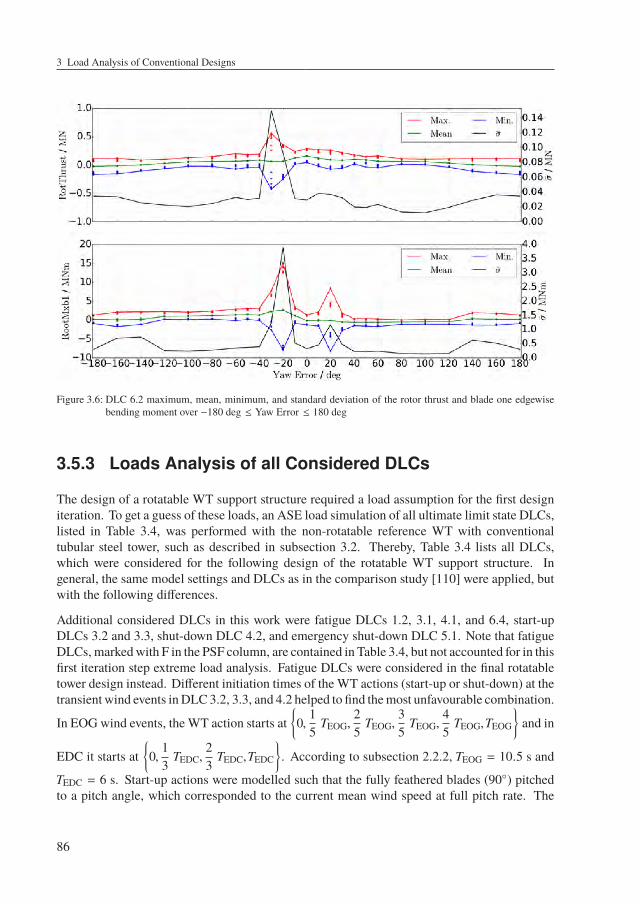
3 Load Analysis of Conventional Designs
Figure 3.6: DLC 6.2 maximum, mean, minimum, and standard deviation of the rotor thrust and blade one edgewisebending moment over −180 deg ≤ Yaw Error ≤ 180 deg
3.5.3 Loads Analysis of all Considered DLCs
The design of a rotatable WT support structure required a load assumption for the first designiteration. To get a guess of these loads, an ASE load simulation of all ultimate limit state DLCs,listed in Table 3.4, was performed with the non-rotatable reference WT with conventionaltubular steel tower, such as described in subsection 3.2. Thereby, Table 3.4 lists all DLCs,which were considered for the following design of the rotatable WT support structure. Ingeneral, the same model settings and DLCs as in the comparison study [110] were applied, butwith the following differences.
Additional considered DLCs in this work were fatigue DLCs 1.2, 3.1, 4.1, and 6.4, start-upDLCs 3.2 and 3.3, shut-down DLC 4.2, and emergency shut-down DLC 5.1. Note that fatigueDLCs, markedwith F in the PSF column, are contained in Table 3.4, but not accounted for in thisfirst iteration step extreme load analysis. Fatigue DLCs were considered in the final rotatabletower design instead. Different initiation times of the WT actions (start-up or shut-down) at thetransient wind events inDLC3.2, 3.3, and 4.2 helped to find themost unfavourable combination.
In EOG wind events, the WT action starts at0,
15
TEOG,25
TEOG,35
TEOG,45
TEOG,TEOG
and in
EDC it starts at0,
13
TEDC,23
TEDC,TEDC
. According to subsection 2.2.2, TEOG = 10.5 s and
TEDC = 6 s. Start-up actions were modelled such that the fully feathered blades (90) pitchedto a pitch angle, which corresponded to the current mean wind speed at full pitch rate. The
86
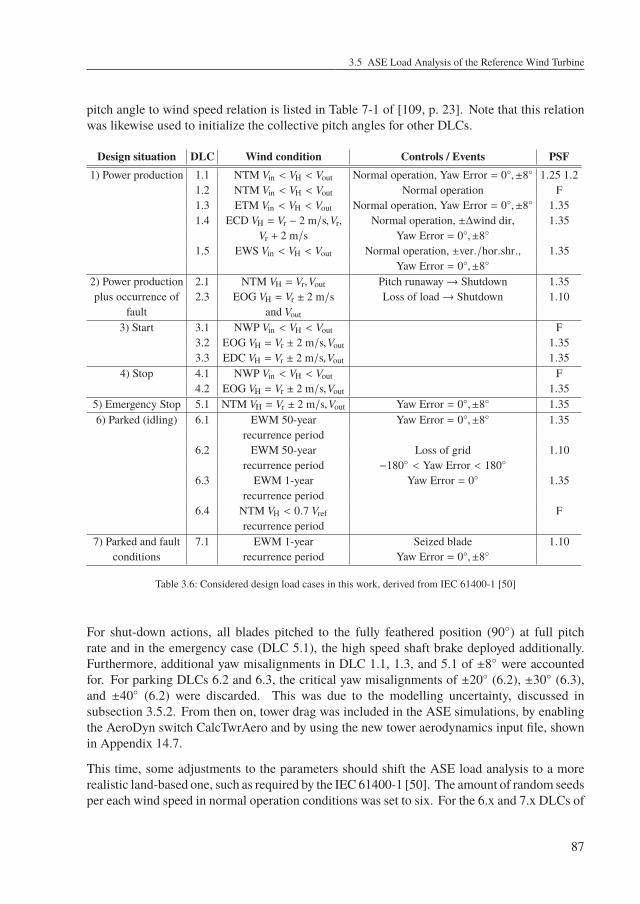
3.5 ASE Load Analysis of the Reference Wind Turbine
pitch angle to wind speed relation is listed in Table 7-1 of [109, p. 23]. Note that this relationwas likewise used to initialize the collective pitch angles for other DLCs.
Design situation DLC Wind condition Controls / Events PSF1) Power production 1.1 NTM Vin < VH < Vout Normal operation, Yaw Error = 0,±8 1.25 1.2
1.2 NTM Vin < VH < Vout Normal operation F1.3 ETM Vin < VH < Vout Normal operation, Yaw Error = 0,±8 1.351.4 ECD VH = Vr − 2 m/s,Vr, Normal operation, ±∆wind dir, 1.35
Vr + 2 m/s Yaw Error = 0,±8
1.5 EWS Vin < VH < Vout Normal operation, ±ver./hor.shr., 1.35Yaw Error = 0,±8
2) Power production 2.1 NTM VH = Vr,Vout Pitch runaway→ Shutdown 1.35plus occurrence of 2.3 EOG VH = Vr ± 2 m/s Loss of load→ Shutdown 1.10
fault and Vout
3) Start 3.1 NWP Vin < VH < Vout F3.2 EOG VH = Vr ± 2 m/s,Vout 1.353.3 EDC VH = Vr ± 2 m/s,Vout 1.35
4) Stop 4.1 NWP Vin < VH < Vout F4.2 EOG VH = Vr ± 2 m/s,Vout 1.35
5) Emergency Stop 5.1 NTM VH = Vr ± 2 m/s,Vout Yaw Error = 0,±8 1.356) Parked (idling) 6.1 EWM 50-year Yaw Error = 0,±8 1.35
recurrence period6.2 EWM 50-year Loss of grid 1.10
recurrence period −180 < Yaw Error < 180
6.3 EWM 1-year Yaw Error = 0 1.35recurrence period
6.4 NTM VH < 0.7 Vref Frecurrence period
7) Parked and fault 7.1 EWM 1-year Seized blade 1.10conditions recurrence period Yaw Error = 0,±8
Table 3.6: Considered design load cases in this work, derived from IEC 61400-1 [50]
For shut-down actions, all blades pitched to the fully feathered position (90) at full pitchrate and in the emergency case (DLC 5.1), the high speed shaft brake deployed additionally.Furthermore, additional yaw misalignments in DLC 1.1, 1.3, and 5.1 of ±8 were accountedfor. For parking DLCs 6.2 and 6.3, the critical yaw misalignments of ±20 (6.2), ±30 (6.3),and ±40 (6.2) were discarded. This was due to the modelling uncertainty, discussed insubsection 3.5.2. From then on, tower drag was included in the ASE simulations, by enablingthe AeroDyn switch CalcTwrAero and by using the new tower aerodynamics input file, shownin Appendix 14.7.
This time, some adjustments to the parameters should shift the ASE load analysis to a morerealistic land-based one, such as required by the IEC 61400-1 [50]. The amount of random seedsper each wind speed in normal operation conditions was set to six. For the 6.x and 7.x DLCs of
87
3 Load Analysis of Conventional Designs
offshore WTs, six 1 h simulations per random seed are required by the IEC 61400-3 [102]. Thedesign standard for land-based WTs, IEC 61400-1 [50], requires six random seeds, each withonly 10 min simulation time. Therefore, the factor of 0.95 for DLCs 6.x and 7.x in Table 3.4could be set to 1.00. Furthermore, the power law exponent was set to the land-based value ofα = 0.2 for all DLCs, except for the parking ones, where α = 0.11. All extreme load relevantDLCs summed up to 1082 different ASE simulation files.
Figure 3.7 compares the extreme tower base SS (TwrBsMxt), FA (TwrBsMyt), and torsional(TwrBsMzt) moment results of all DLCs with tower drag (CalcTwrAero = True) and without(CalcTwrAero = False). Additionally, the extreme rotor torque (RotTorq) values are providedfor the following discussion about different load influencing control settings. However, the redand blue bars are considered first. In the most cases, tower drag had no significant impact tothe extreme tower base bending moments, except for the parking DLCs 6.x and 7.x. This wasexpected due to the high wind pressure on the tower for the extreme wind speed with 1 yearand 50 year recurrence period probability. Considering the SS tower base bending momentof its driving DLC 6.2, a load increase of 20.1 % resulted from enabling the tower drag. Onthe other hand, this made the blade aerodynamics responsible for ≈ 79.9 % of the extreme SStower base bending moment in this case. As expected, the tower drag had no visible influenceto the extreme torsional moment at the tower base, but the moment was noticeable high in DLC2.1.
To reduce this outstanding extreme torsional moment, the pitch rate was changed from 8 deg/sto 2 deg/s for any transient pitch maneuvers in DLCs 2.x, 3.x, 4.x, and 5.1. Neither IEC 61400-1 [50], DNV GL [64] nor DIBt [152] prescribe minimum pitch rates or maximum start-up andshut-down times. Note that this valid control adjustment did not affect the normal productionpitch rates. Another control adjustment was introduced to reduce the extreme SS tower basebending moment in extreme wind parking situations. In this study, the worst case for theSS tower base bending moment was electrical power grid loss in extreme wind conditions inDLC 6.2, because it was assumed that the yaw system fails and the WT is attacked by thewind potentially from all directions. Therefore, instead of an idling rotor, the rotor was parkedwith one blade pointing vertically upwards in DLCs 6.x and 7.1 in this new control approach.Furthermore, it was assumed, that a hydraulic aggregate provides enough energy to adjust thepitch angle of the single blade at top position with respect to the wind direction. Note thatthe participating measurement and control systems must also have enough energy, potentiallyprovided by a battery for the storm hours. The demanded pitch angle Θb,1 for blade one at thetop position calculates as function of the wind direction WndDir as follows
Θb,1 =90 deg −WndDir for WndDir >= −90 degΘb,1 = − 270 deg −WndDir for WndDir < −90 deg
(3.9)
where the other two blades stay at feathered 90 deg position for all wind directions.
The magenta and cyan bars in Figure 3.7 show, that the intended extreme tower base SSbending moment and torsional moment reductions were achieved by the previous discussedcontrol adjustments. Thereby, the extreme SS tower base bending moment with tower dragin DLC 6.2 was reduced about 57.6 %, so that DLC 2.1 became its new driving DLC. Here,
88
3.5 ASE Load Analysis of the Reference Wind Turbine
the extreme SS tower base bending moment increased slightly about 1 % due to the reducedpitch rate. On the other hand, the reduced pitch rate caused a significant extreme tower basetorsional moment reduction of 24 %. Note that the rotor torque in parking situations increasedfor parked rotors compared to idling ones. This did not affect the drive train loads, becauseof the locked rotor, but requires a closer look to the hub and lock system design to ensuretheir sufficient strength. Appendix 14.8 shows the corresponding extreme blade root moments,where the changed controls had no significant impact. For transient start-up and shut-downevents, more sophisticated control algorithms may help to reduce the resulting extreme loadsfurther. Nevertheless, such control system improvements were out of scope for this work.
Table 3.7 summarizes the corresponding extreme load results for the load sensors, mentioned insubsection 3.5.1. Thereby, column 1 contains the load sensor name, column 2 declares if it is aminimum or maximum, column 3 lists the file name of the timeseries where the correspondingextreme load occurred, column 4 contains the load value, and column 5 its unit. The firstnumbers in the file names declare the respective load case and an attached T marks files withturbulent wind field. Following numbers give information about the wind direction with respectto the WT rotor or the turbines action time at transient wind events, the mean wind speed, andin case of stochastic sensitive DLCs, the random seed number.
The resulting extreme loads of each load sensor from all consideredDLCswere larger comparedto the validation case in Table 3.5, where only DLCs 1.x were accounted for. Thus, the 1.xDLCs seemed to have negligible influence to the extreme loads, but WT shut-down events andparking DLCs dominated the extreme loads of this load sensors, instead. The analysis of allDLCs revealed, that the difference between the absolute extreme SS and FA tower base bendingmoment was smaller than in the reference result. Figure 3.2 and Table 3.5 may be reviewedfor comparison. The absolute TwrBsMyt/TwrBsMxt = 1.72 ratio was small and indicated,that there was not as much material saving potential as suggested by the literature research inFigure 3.2. Even if the new SS bending moment driving DLC 2.1 results could be questioned interms of the applied control settings, they provided an assumption on the safe side for the designof the rotatable support structure. This assumption was due to the material saving potential,which results from different tower cross sectional stiffness with respect to its load direction,such as mentioned in subsection 4.3.1. A comprehensive summary of important load sensorextreme loads is given in Appendix 14.9.
89
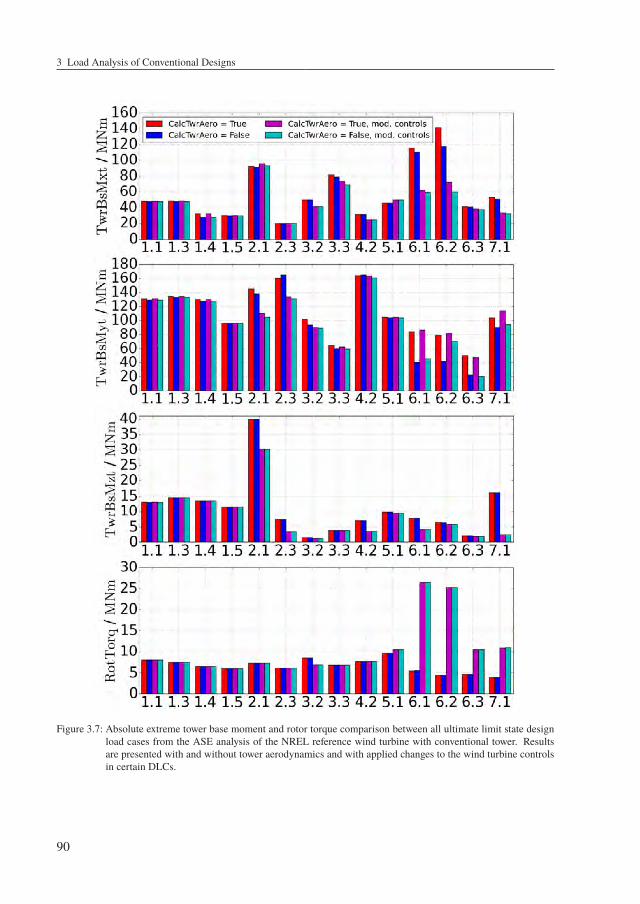
3 Load Analysis of Conventional Designs
Figure 3.7: Absolute extreme tower base moment and rotor torque comparison between all ultimate limit state designload cases from the ASE analysis of the NREL reference wind turbine with conventional tower. Resultsare presented with and without tower aerodynamics and with applied changes to the wind turbine controlsin certain DLCs.
90
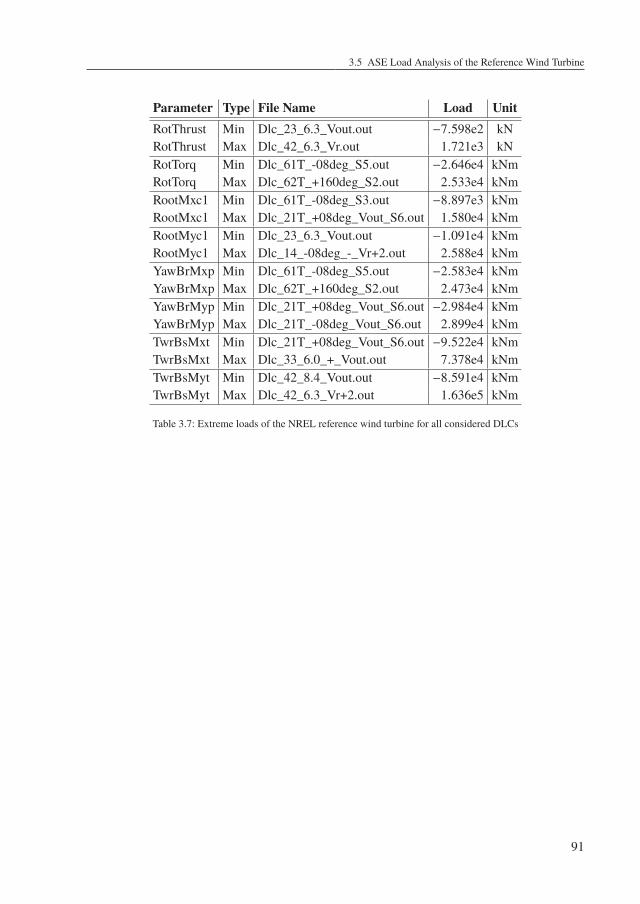
3.5 ASE Load Analysis of the Reference Wind Turbine
Parameter Type File Name Load UnitRotThrust Min Dlc_23_6.3_Vout.out −7.598e2 kNRotThrust Max Dlc_42_6.3_Vr.out 1.721e3 kNRotTorq Min Dlc_61T_-08deg_S5.out −2.646e4 kNmRotTorq Max Dlc_62T_+160deg_S2.out 2.533e4 kNmRootMxc1 Min Dlc_61T_-08deg_S3.out −8.897e3 kNmRootMxc1 Max Dlc_21T_+08deg_Vout_S6.out 1.580e4 kNmRootMyc1 Min Dlc_23_6.3_Vout.out −1.091e4 kNmRootMyc1 Max Dlc_14_-08deg_-_Vr+2.out 2.588e4 kNmYawBrMxp Min Dlc_61T_-08deg_S5.out −2.583e4 kNmYawBrMxp Max Dlc_62T_+160deg_S2.out 2.473e4 kNmYawBrMyp Min Dlc_21T_+08deg_Vout_S6.out −2.984e4 kNmYawBrMyp Max Dlc_21T_-08deg_Vout_S6.out 2.899e4 kNmTwrBsMxt Min Dlc_21T_+08deg_Vout_S6.out −9.522e4 kNmTwrBsMxt Max Dlc_33_6.0_+_Vout.out 7.378e4 kNmTwrBsMyt Min Dlc_42_8.4_Vout.out −8.591e4 kNmTwrBsMyt Max Dlc_42_6.3_Vr+2.out 1.636e5 kNm
Table 3.7: Extreme loads of the NREL reference wind turbine for all considered DLCs
91

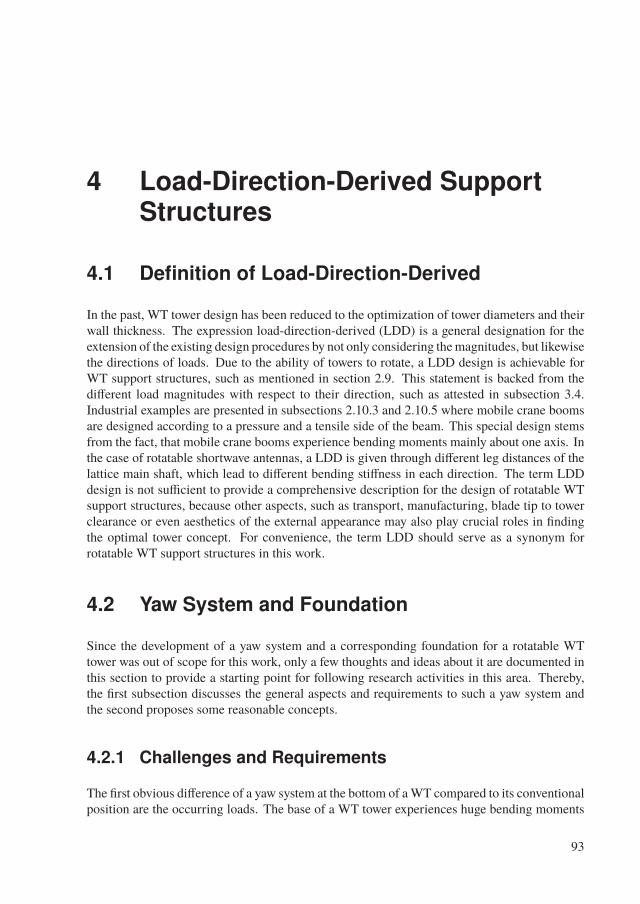
4 Load-Direction-Derived SupportStructures
4.1 Definition of Load-Direction-Derived
In the past, WT tower design has been reduced to the optimization of tower diameters and theirwall thickness. The expression load-direction-derived (LDD) is a general designation for theextension of the existing design procedures by not only considering themagnitudes, but likewisethe directions of loads. Due to the ability of towers to rotate, a LDD design is achievable forWT support structures, such as mentioned in section 2.9. This statement is backed from thedifferent load magnitudes with respect to their direction, such as attested in subsection 3.4.Industrial examples are presented in subsections 2.10.3 and 2.10.5 where mobile crane boomsare designed according to a pressure and a tensile side of the beam. This special design stemsfrom the fact, that mobile crane booms experience bending moments mainly about one axis. Inthe case of rotatable shortwave antennas, a LDD is given through different leg distances of thelattice main shaft, which lead to different bending stiffness in each direction. The term LDDdesign is not sufficient to provide a comprehensive description for the design of rotatable WTsupport structures, because other aspects, such as transport, manufacturing, blade tip to towerclearance or even aesthetics of the external appearance may also play crucial roles in findingthe optimal tower concept. For convenience, the term LDD should serve as a synonym forrotatable WT support structures in this work.
4.2 Yaw System and Foundation
Since the development of a yaw system and a corresponding foundation for a rotatable WTtower was out of scope for this work, only a few thoughts and ideas about it are documented inthis section to provide a starting point for following research activities in this area. Thereby,the first subsection discusses the general aspects and requirements to such a yaw system andthe second proposes some reasonable concepts.
4.2.1 Challenges and Requirements
The first obvious difference of a yaw system at the bottom of aWT compared to its conventionalposition are the occurring loads. The base of a WT tower experiences huge bending moments
93
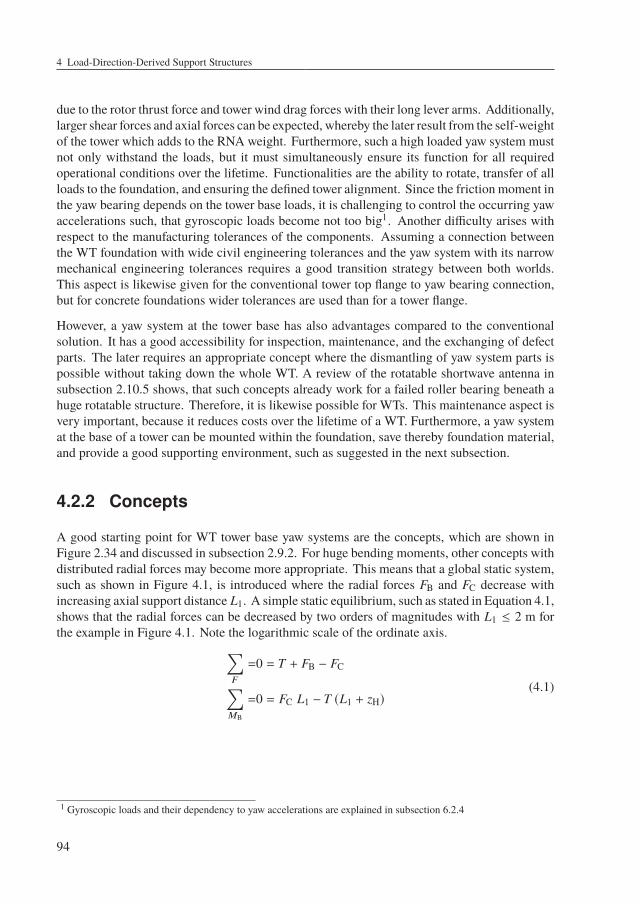
4 Load-Direction-Derived Support Structures
due to the rotor thrust force and tower wind drag forces with their long lever arms. Additionally,larger shear forces and axial forces can be expected, whereby the later result from the self-weightof the tower which adds to the RNA weight. Furthermore, such a high loaded yaw system mustnot only withstand the loads, but it must simultaneously ensure its function for all requiredoperational conditions over the lifetime. Functionalities are the ability to rotate, transfer of allloads to the foundation, and ensuring the defined tower alignment. Since the friction moment inthe yaw bearing depends on the tower base loads, it is challenging to control the occurring yawaccelerations such, that gyroscopic loads become not too big1. Another difficulty arises withrespect to the manufacturing tolerances of the components. Assuming a connection betweenthe WT foundation with wide civil engineering tolerances and the yaw system with its narrowmechanical engineering tolerances requires a good transition strategy between both worlds.This aspect is likewise given for the conventional tower top flange to yaw bearing connection,but for concrete foundations wider tolerances are used than for a tower flange.
However, a yaw system at the tower base has also advantages compared to the conventionalsolution. It has a good accessibility for inspection, maintenance, and the exchanging of defectparts. The later requires an appropriate concept where the dismantling of yaw system parts ispossible without taking down the whole WT. A review of the rotatable shortwave antenna insubsection 2.10.5 shows, that such concepts already work for a failed roller bearing beneath ahuge rotatable structure. Therefore, it is likewise possible for WTs. This maintenance aspect isvery important, because it reduces costs over the lifetime of a WT. Furthermore, a yaw systemat the base of a tower can be mounted within the foundation, save thereby foundation material,and provide a good supporting environment, such as suggested in the next subsection.
4.2.2 Concepts
A good starting point for WT tower base yaw systems are the concepts, which are shown inFigure 2.34 and discussed in subsection 2.9.2. For huge bending moments, other concepts withdistributed radial forces may become more appropriate. This means that a global static system,such as shown in Figure 4.1, is introduced where the radial forces FB and FC decrease withincreasing axial support distance L1. A simple static equilibrium, such as stated in Equation 4.1,shows that the radial forces can be decreased by two orders of magnitudes with L1 ≤ 2 m forthe example in Figure 4.1. Note the logarithmic scale of the ordinate axis.∑
F
=0 = T + FB − FC∑MB
=0 = FC L1 − T (L1 + zH)(4.1)
1 Gyroscopic loads and their dependency to yaw accelerations are explained in subsection 6.2.4
94
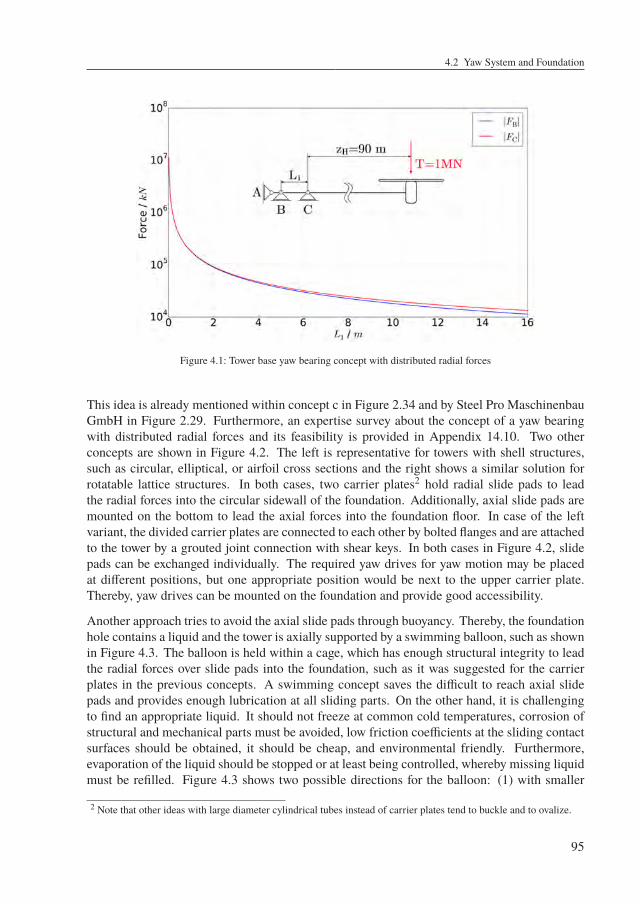
4.2 Yaw System and Foundation
Figure 4.1: Tower base yaw bearing concept with distributed radial forces
This idea is already mentioned within concept c in Figure 2.34 and by Steel Pro MaschinenbauGmbH in Figure 2.29. Furthermore, an expertise survey about the concept of a yaw bearingwith distributed radial forces and its feasibility is provided in Appendix 14.10. Two otherconcepts are shown in Figure 4.2. The left is representative for towers with shell structures,such as circular, elliptical, or airfoil cross sections and the right shows a similar solution forrotatable lattice structures. In both cases, two carrier plates2 hold radial slide pads to leadthe radial forces into the circular sidewall of the foundation. Additionally, axial slide pads aremounted on the bottom to lead the axial forces into the foundation floor. In case of the leftvariant, the divided carrier plates are connected to each other by bolted flanges and are attachedto the tower by a grouted joint connection with shear keys. In both cases in Figure 4.2, slidepads can be exchanged individually. The required yaw drives for yaw motion may be placedat different positions, but one appropriate position would be next to the upper carrier plate.Thereby, yaw drives can be mounted on the foundation and provide good accessibility.
Another approach tries to avoid the axial slide pads through buoyancy. Thereby, the foundationhole contains a liquid and the tower is axially supported by a swimming balloon, such as shownin Figure 4.3. The balloon is held within a cage, which has enough structural integrity to leadthe radial forces over slide pads into the foundation, such as it was suggested for the carrierplates in the previous concepts. A swimming concept saves the difficult to reach axial slidepads and provides enough lubrication at all sliding parts. On the other hand, it is challengingto find an appropriate liquid. It should not freeze at common cold temperatures, corrosion ofstructural and mechanical parts must be avoided, low friction coefficients at the sliding contactsurfaces should be obtained, it should be cheap, and environmental friendly. Furthermore,evaporation of the liquid should be stopped or at least being controlled, whereby missing liquidmust be refilled. Figure 4.3 shows two possible directions for the balloon: (1) with smaller
2 Note that other ideas with large diameter cylindrical tubes instead of carrier plates tend to buckle and to ovalize.
95
4 Load-Direction-Derived Support Structures
diameter and larger draft and (2) with larger diameter and smaller draft. As shown in theprevious concept, higher drafts would lead to reduced radial loads, but in case of very largetower base dimensions, a smaller balloon draft may replace sufficient liquid to carry the WTand must hold a lower gas pressure.
Figure 4.2: Tower base yaw bearing concepts - one concept for towers with shell structures (left) and one concept fortowers with lattice structures (right)
A swimming yaw bearing concept mimics a floating offshore foundation, but with better radialsupport conditions andwithout currents and highwaves. However, additional dynamics throughbuoyancy together with temperature driven changes in the liquid viscosity and the gas pressurehave to be investigated carefully with respect to the operational conditions and requirements ofthe WT.
Figure 4.3: Swimming yaw bearing concept with large balloon draft (left) and small balloon draft (right)
96
4.3 Requirements and Structural Aspects
4.3 Requirements and Structural Aspects
The favoured concept should stand out with causing low CO2-emissions throughout the wholeproduction chain and with cost efficiency. CO2-emissions can be influenced by the kind and
amount of used material. Considering 2.8t CO2
t steel[148] shows the tremendous contribution to
carbon dioxide emissions, which hundreds of tons weighing steel WT support structures have.Cost efficiency should be considered in terms of its fixed and variable costs over lifetime.Fixed costs for towers are highly related to the amount of material, the complexity of usedstructural members, and its joints. Variable costs are mainly subject to maintenance costs.Tower maintenance costs depend on the kind and amount of joints, corrosion resistance andfatigue behaviour. At this point the structural mass stands out as major factor to ecological andeconomical properties of a WT support structure. Unfortunately, it is difficult to get reliablecost values, which account for the complexity of structural members and joints. Nevertheless,complexity of members and joints must be considered besides the major interest of develop-ing a material efficient concept. Beyond that, it must account for the ultimate, fatigue, andserviceability limit states, such as described in subsections 2.2.5, 2.2.6, and 2.2.8. Before thediscussion about different LDD support structure concepts starts, the following subsectionssummarize some influencing aspects in general, such as the cross sectional strength, the globalstability, and the dynamic response.
4.3.1 Cross Sectional Strength
Most relevant tower load components are the global axial force in combination with the bendingmoment, because they lead to extreme normal stresses within the wall of tubular towers orthe legs and bracing members of lattice towers. In terms of fatigue, the global vibratingbending moments cause the main stress amplitudes, while the self-weight-caused axial forceand bending moments, induced by the mean rotor thrust are responsible for the mean stress levelin the structural details. As shown within section 3.4, extreme and damage equivalent fatiguebending moments differ according to the FA and SS axis. In terms of tubular shell towers,this behaviour can be exploited for material savings regarding bending stresses. Reduced SSbendingmoments Mx, compared to the FA bendingmoments My require smaller sectionmoduli
Wx =Ix
amaxthan Wy =
Iy
amaxto satisfy the same bending normal stresses, whereby material
can be saved. Consequently a smaller cross sectional area A will increase the normal stresses,caused by the axial force. This effect is assumed to be moderate, because reduced materialmass will likewise lead to smaller axial forces.
4.3.2 Global Stability
Stability failure modes of a structure can be distinguished between the global bending andflexural-torsional buckling, and local shell and plate buckling, respectively. Each of these
97
4 Load-Direction-Derived Support Structures
phenomena has to be considered for rotatable WT support structures. Regarding subsection4.3.1, a LDD tower can have different area moments of inertia for each bending axis. Thismeans, that the ideal Euler buckling load corresponds to the decreased (SS) bending stiffnessand global stability becomes lower compared to a conventional steel tower. Another failuremode is the flexural-torsional buckling. It describes the stability collapse of a beam, whichtries to evade bending caused by a shear force. Therefore, the beam profile rotates around thetorsional axis especially when the torsional stiffness is very low. Richard and Sander [161]propose an equation to determine the maximum shear force FFTB for a beam until flexural-torsional buckling begins. Thereby, it considers the interaction between bending and torsionalstiffness according to
FFTB = βFTB
√E Imin G IT
L2 , (4.2)
where βFTB = 4.013 and Imin = min[Ix, Iy
]for cantilever beams with a constant cross section
along its length L. The maximum sustainable shear force in equation 4.2 is sensitive to theexpression
√E Imin G IT, which shows that the SS bending stiffness together with the torsional
stiffness drive the flexural-torsional buckling resistance for rotatable support structures. Moreinformation about analytical and numerical buckling analyses of column like structures isprovided in subsection 2.2.5.
4.3.3 Structural Dynamics
Structural dynamics treat the behaviour of a structure in the time or frequency domain. Thisdynamic behaviour is primarily determined by the structure’s natural frequencies3 and modeshapes. Natural frequencies and their mode shapes depend on the stiffness distribution, massdistribution and the damping of a structure. They are expressed in a coupled form for eachdegree of freedom (DOF) within the system stiffness matrix KN×N
sys, the system damping matrix
DN×N
sysand the system mass matrix MN×N
syswith N as the number of DOFs. The equation of
motionM
sysÜx(t) + D
sysÛx(t) + K
sysx(t) = F(t) (4.3)
describes the equilibrium between the system reaction on the left hand side and the excitationforces F(t)N×1 on the right hand side. System reactions are the node displacements x(t)N×1
and their derivatives with respect to time, which are the node velocitiesd x(t)N×1
dt= Ûx(t)N×1
and the node accelerationsd2 x(t)N×1
dt2 = Üx(t)N×1, respectively. For practical applications it is
difficult to estimate the damping matrix, wherefore the undamped(D
sys= 0
)system will be
3 In this work, the term natural frequency is interchangeable with the word eigenfrequency.
98
4.3 Requirements and Structural Aspects
solved first. After usage of the right trial functions, the eigenvalue problem for the undampednatural frequencies ω and its eigenvectors ϕ can be solved according to the real form [87](
Ksys− ω2 M
sys
)ϕ = 0 (4.4)
where the determinant det[K
sys− ω2 M
sys
]= 0 delivers a polynomial of Nth degree and the
square roots of ω2 are the natural frequencies [153, p. 312]. Equation 4.4 connects the globalstiffness and mass distribution to the natural frequencies and eigenvectors of the system. Oneway to determine the damping matrix is given by Rayleigh [156] with
Dsys= α M
sys+ β K
sys(4.5)
where coefficientsα and βwill be chosen according to the first or the first two natural frequenciesω1 and ω2 and its damping ratios ζ1 and ζ2, such as shown by Strømmen [178]:
α =2 ω1 ω2 (ω2 ζ1 − ω1 ζ2)
ω22 − ω
21
β =2 (ω2 ζ2 − ω1 ζ1)
ω22 − ω
21
(4.6)
By providing a yaw bearing at the tower base, the cross section of the tower must not remaincircular and can have lower stiffness regarding its secondary load direction (SS). Such one sidedstiffness reduction would lead to more diverging bending mode eigenfrequencies. As this workis using the 5 MW NRELWT as a reference, a review of its Campbell diagram helps to identifypossible support structure frequency ranges. Figure 4.4 shows the major one-per-revolution(1p) and three-per-revolution (3p) excitation frequencies.
The 1p excitation is caused by rotor mass unbalance and the 3p excitation stems from aerody-namic unbalance due to inclined inflow and tower dam effects of a three bladed WT, mentionedin subsection 4.4.2. Cut-in and cut-out rotor speeds of 6.9 rpm and 12.1 rpm are displayed withvertical lines and mark the operational range of the turbine. Furthermore, horizontal lines indi-cate the first bending eigenfrequencies of the tubular reference tower in FA and SS directions.The dashed lines represent the ±5 % safety margins for all frequencies and the green areas,soft-soft, soft-stiff, and stiff-stiff mark the frequency ranges appropriate for support structureeigenfrequencies to avoid resonance. For the NREL reference WT, it can be seen that thefirst two bending natural frequencies of the NREL reference tower diverge about 3.8 %. Thisdivergence is caused by the mass distribution of the RNA. A LDD tower may have even largerdifferences between these eigenfrequencies, because of a less SS stiffness. Such a configura-tion will shift the SS bending eigenfrequency farther away from resonance and therefore to lessdynamic loads, in case of the present WT configuration. In other situations with other hubheights, or other WT properties the Campbell diagram changes, wherefore reduced SS bendingstiffness of a LDD tower may also increase the dynamic response. Thus, the dynamic behaviour
99
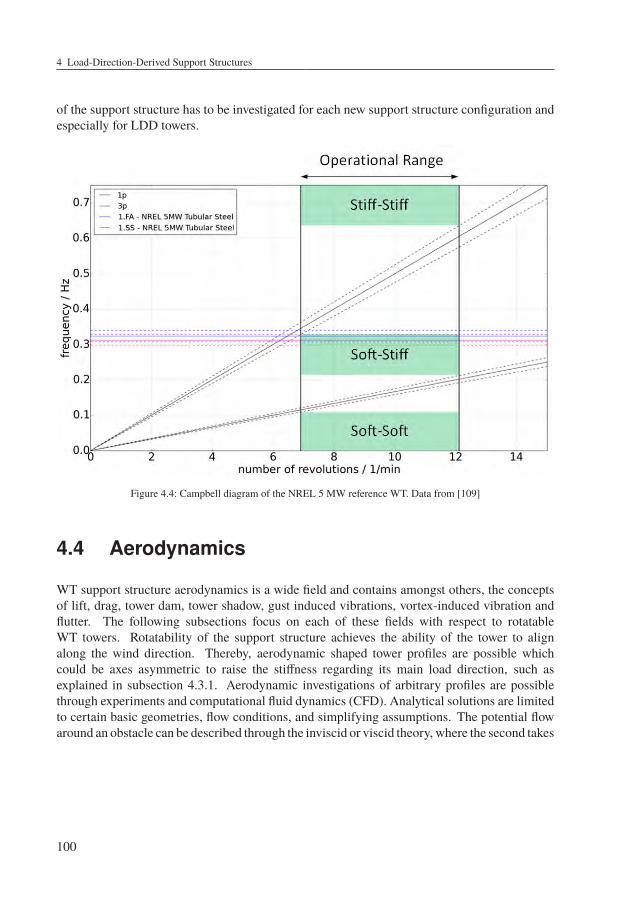
4 Load-Direction-Derived Support Structures
of the support structure has to be investigated for each new support structure configuration andespecially for LDD towers.
Figure 4.4: Campbell diagram of the NREL 5 MW reference WT. Data from [109]
4.4 Aerodynamics
WT support structure aerodynamics is a wide field and contains amongst others, the conceptsof lift, drag, tower dam, tower shadow, gust induced vibrations, vortex-induced vibration andflutter. The following subsections focus on each of these fields with respect to rotatableWT towers. Rotatability of the support structure achieves the ability of the tower to alignalong the wind direction. Thereby, aerodynamic shaped tower profiles are possible whichcould be axes asymmetric to raise the stiffness regarding its main load direction, such asexplained in subsection 4.3.1. Aerodynamic investigations of arbitrary profiles are possiblethrough experiments and computational fluid dynamics (CFD). Analytical solutions are limitedto certain basic geometries, flow conditions, and simplifying assumptions. The potential flowaround an obstacle can be described through the inviscid or viscid theory, where the second takes
100
4.4 Aerodynamics
into account viscous forces (friction) between the fluid particles according to the incompressibleNavier-Stokes Equations 4.7, documented likewise by White [194].
ρair gx −∂q∂x+ µ
(∂2u∂x2 +
∂2u∂y2 +
∂2u∂z2
)=ρair
dudt
ρair gy −∂q∂y+ µ
(∂2v
∂x2 +∂2v
∂y2 +∂2v
∂z2
)=ρair
dvdt
ρair gz −∂pq∂z+ µ
(∂2w
∂x2 +∂2w
∂y2 +∂2w
∂z2
)=ρair
dwdt,
(4.7)
where gx, gy, gz are the gravity components, q is the pressure, µ is the viscosity coefficient,u, v, w are the flow velocities in x, y, z direction and t equals to the time. Assuming inviscid,incompressible and irrotational flow,
∇ × V = ∇ × (∇φ) = 0 (4.8)
Laplace’s equation applies. The condition for irrotational flow in equation 4.8 contains thenabla operator
∇ =©«∂/∂x∂/∂y
∂/∂z
ª®®¬ , (4.9)
the velocity potential function φ(x, y, z, t), which reduces the three unknowns u, v, w to oneunknown φ(x, y, z, t) and the velocity vector V . Solving Laplace’s equation
∇2φ = 0 =∂2φ
∂x2 +∂2φ
∂y2 +∂2φ
∂z2 (4.10)
for φ(x, y, z, t) provides the searched velocities through its derivatives
u =∂φ
∂x, v =
∂φ
∂y, w =
∂φ
∂z. (4.11)
Analytical solving techniques for Laplace’s equation are amongst others conformal map-ping [155], numerical finite differences [146], numerical finite elements [157] and numericalboundary elements [24]. The inviscid assumption is sufficient for laminar flow without sepa-ration from the profile (stall) and for a certain distance away from the profile surface, becausethe no-slip condition at the wall induces viscous stresses. This region is also called boundarylayer. Lift, drag, the tower dam, and the tower shadow can be treated with this simplifyingassumption for laminar flows. Investigation of vortex-induced vibrations and flutter requiressolving of the viscous problem, such as presented in equation 4.7. Several CFD codes, suchas the commercial ANSYS Fluent4 and the open source OpenFOAM5 are capable to solve the
4 http://www.ansys.com/Products/Fluids/ANSYS-Fluent; Accessed 03-February-20195 http://www.openfoam.com/; Accessed 03-February-2019
101
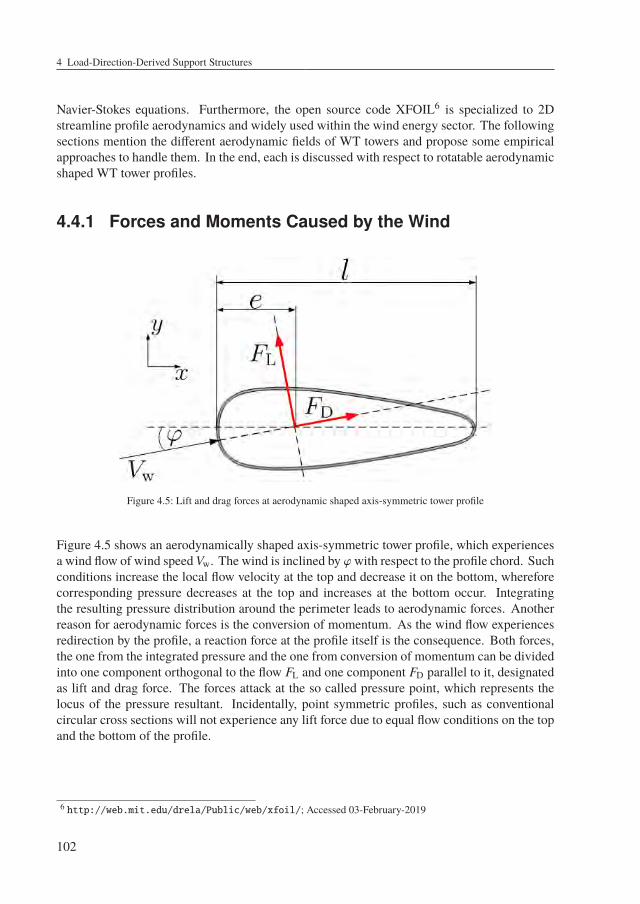
4 Load-Direction-Derived Support Structures
Navier-Stokes equations. Furthermore, the open source code XFOIL6 is specialized to 2Dstreamline profile aerodynamics and widely used within the wind energy sector. The followingsections mention the different aerodynamic fields of WT towers and propose some empiricalapproaches to handle them. In the end, each is discussed with respect to rotatable aerodynamicshaped WT tower profiles.
4.4.1 Forces and Moments Caused by the Wind
Figure 4.5: Lift and drag forces at aerodynamic shaped axis-symmetric tower profile
Figure 4.5 shows an aerodynamically shaped axis-symmetric tower profile, which experiencesa wind flow of wind speedVw. The wind is inclined by ϕwith respect to the profile chord. Suchconditions increase the local flow velocity at the top and decrease it on the bottom, whereforecorresponding pressure decreases at the top and increases at the bottom occur. Integratingthe resulting pressure distribution around the perimeter leads to aerodynamic forces. Anotherreason for aerodynamic forces is the conversion of momentum. As the wind flow experiencesredirection by the profile, a reaction force at the profile itself is the consequence. Both forces,the one from the integrated pressure and the one from conversion of momentum can be dividedinto one component orthogonal to the flow FL and one component FD parallel to it, designatedas lift and drag force. The forces attack at the so called pressure point, which represents thelocus of the pressure resultant. Incidentally, point symmetric profiles, such as conventionalcircular cross sections will not experience any lift force due to equal flow conditions on the topand the bottom of the profile.
6 http://web.mit.edu/drela/Public/web/xfoil/; Accessed 03-February-2019
102
4.4 Aerodynamics
According to Sockel [175], each body within a flow does have a dimensionless lift and dragcoefficient cL and cD, which depends on the impounded pressure q, the related profile shapearea A and the corresponding force due to
cL (ϕ,Re, k/l) =FL (ϕ,Re, k/l)
q A= 2
FL (ϕ,Re, k/l)ρair V2
w A(4.12)
cD (ϕ,Re, k/l) =FD (ϕ,Re, k/l)
q A= 2
FD (ϕ,Re, k/l)ρair V2
w A. (4.13)
The forces are a function of the angle of attack ϕ, the Reynolds number Re and the roughnessratio k/l, where k equals to the wall roughness and l is the related body dimension, such asshown in Figure 4.5. Due to Eurocode 1 DIN EN 1991-1-4 [67], wall roughness values are forinstance k = 0.2 for galvanized and k = 0.006 for fine spray paint on steel. Eurocode 1 DIN EN1991-1-4 [67] and the literature [175], [3], [194] provide aerodynamic coefficients for simpleprofile shapes, such as circular or rectangular ones. Several streamline profile coefficients aresummarized by Abbott and Doenhoff [1]. In most cases, the reference area A corresponds to theprojected profile area at the profiles cut with the largest width. Furthermore, the lift and dragforces do not necessarily attack at the shear center. Therefore, they can induce an additionaltorsional moment around the torsional axis. Sockel [175] relates the moment coefficient cM tothe tip of the profile according to
cM =el(cL cos (ϕ) + cD sin (ϕ)) , (4.14)
where e is the distance from the profile tip to the pressure point. Rotor blade shapes are oftenoptimised towards maximum lift to drag ratios under structural constraints. An aerodynamictower shape should be optimised with respect to low SS aerodynamic lift loads for relevantReynolds numbers and angle of attacks. This changed focus compared to blades is due tothe fact that blades should have an aerodynamic lift to generate torque at the rotor shaft. Forrotatable WT towers, the lift causes additional loads in its weak direction and can become adisadvantage.
4.4.2 Tower Dam and Shadow
Blade excitation, caused by its passage through the decreased wind speed area in front of thetower, is called tower dam effect. This effect is only relevant for upwind turbines and shouldbe as low as possible. Accurate investigations regarding blade excitation due to the tower dameffect require experiments, connected with CFD to include blade aerodynamic effects, suchas tip losses, stall and the cross-flow along the blade. Such investigations were performedfor example by Shkara et al. [171]. For ASE load simulations, expensive computationalcalculations should be avoided, wherefore several simplified more or less empirical approacheshave been introduced within the literature. Most of them are focused on the description ofthe wind field behind the tower, which is called tower shadow. Its relevance is limited todownwind WTs, because of the changed local wind behaviour, which encounters the passing
103
4 Load-Direction-Derived Support Structures
blades. An exception occurs if periodic effects, such as vortex-induced vibrations result fromthe tower shadow. This effect is mentioned in the later text. Reiso [160] gives a comprehensiveenumeration of different empirical tower shadow models, where some of them are valid for theregion in front of the tower to estimate the tower dam effect. The analytical solution of thepotential flow around a cylinder is the basis of most of the approaches. According to Reiso [160]it delivers the velocity components
Vx = V∞
(1 −
x2 − y2(x2 + y2)2
(D2
)2)
(4.15)
Vy = V∞−2 x y(
x2 + y2)2
(D2
)2, (4.16)
where V∞ is the free stream velocity and D equals to the obstacle’s diameter. x and y representthe Cartesian position of the velocity components within the 2D flow field. Powles model [150]describes the tower shadow with a cosine squared function and NREL [142] combines it withthe potential flow according to
Vx = (u − uwake)V∞ (4.17)
Vy = (v − uwake)V∞ (4.18)
with
u = 1 −(x + 0.1)2 − y2((x + 0.1)2 + y2
)2 +cD (x + 0.1)
2 π (x + 0.1)2 + y2(4.19)
v = 2(x + 0.1) y(
(x + 0.1)2 + y2)2 +
cD y
2 π (x + 0.1)2 + y2(4.20)
anduwake =
cD√
dcos2
(π y
2√
d
)for |y | ≤
√d
uwake =0 for |y | >√
d,
(4.21)
whered =
√x2 + y2. (4.22)
It is important to note that x and y in Equations 4.19 to 4.22 are the Cartesian coordinates,normalized by the cylinder radius. Further models are developed by Blevin [20], where thewind speed deficit and the wake width depends on cD and Schlichting and Gersten [167], whoconsider the Reynolds number additionally to the drag coefficient. This would enable otherprofiles than circular ones, but the model is restricted to regions x > 3 l on the lee side, wherel represents the characteristic length. Introducing a jet into the stream is proposed by Madsenet al. [135] within the JET wake model and can also be applied as tower shadow approach. Thetower shadow of lattice structures is implemented within Bladed [22]. It uses a combinationof potential flow for the free stream area, Powles model and a correction for the influence
104
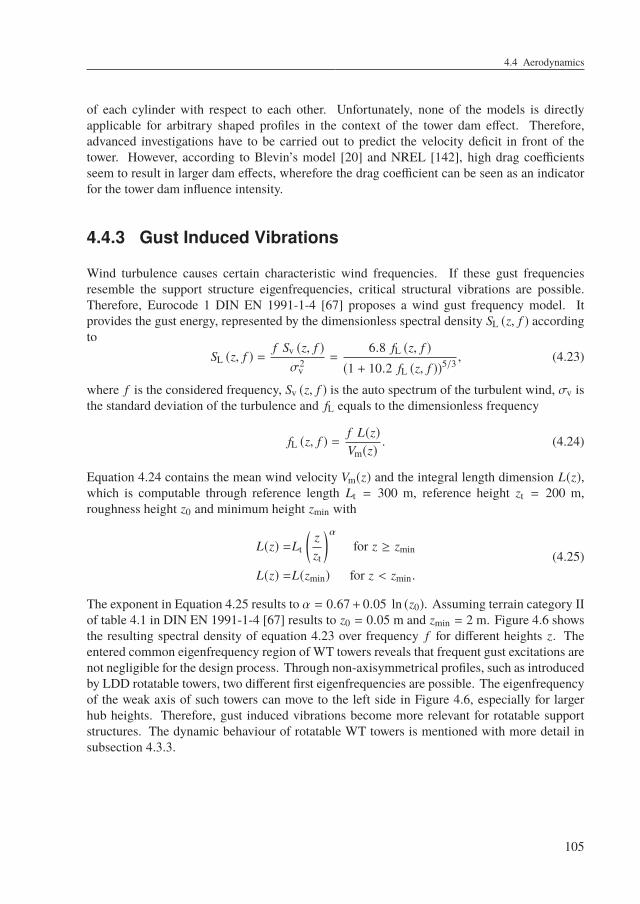
4.4 Aerodynamics
of each cylinder with respect to each other. Unfortunately, none of the models is directlyapplicable for arbitrary shaped profiles in the context of the tower dam effect. Therefore,advanced investigations have to be carried out to predict the velocity deficit in front of thetower. However, according to Blevin’s model [20] and NREL [142], high drag coefficientsseem to result in larger dam effects, wherefore the drag coefficient can be seen as an indicatorfor the tower dam influence intensity.
4.4.3 Gust Induced Vibrations
Wind turbulence causes certain characteristic wind frequencies. If these gust frequenciesresemble the support structure eigenfrequencies, critical structural vibrations are possible.Therefore, Eurocode 1 DIN EN 1991-1-4 [67] proposes a wind gust frequency model. Itprovides the gust energy, represented by the dimensionless spectral density SL (z, f ) accordingto
SL (z, f ) =f Sv (z, f )
σ2v
=6.8 fL (z, f )
(1 + 10.2 fL (z, f ))5/3, (4.23)
where f is the considered frequency, Sv (z, f ) is the auto spectrum of the turbulent wind, σv isthe standard deviation of the turbulence and fL equals to the dimensionless frequency
fL (z, f ) =f L(z)Vm(z)
. (4.24)
Equation 4.24 contains the mean wind velocity Vm(z) and the integral length dimension L(z),which is computable through reference length Lt = 300 m, reference height zt = 200 m,roughness height z0 and minimum height zmin with
L(z) =Lt
(zzt
)αfor z ≥ zmin
L(z) =L(zmin) for z < zmin.
(4.25)
The exponent in Equation 4.25 results to α = 0.67+ 0.05 ln (z0). Assuming terrain category IIof table 4.1 in DIN EN 1991-1-4 [67] results to z0 = 0.05 m and zmin = 2 m. Figure 4.6 showsthe resulting spectral density of equation 4.23 over frequency f for different heights z. Theentered common eigenfrequency region of WT towers reveals that frequent gust excitations arenot negligible for the design process. Through non-axisymmetrical profiles, such as introducedby LDD rotatable towers, two different first eigenfrequencies are possible. The eigenfrequencyof the weak axis of such towers can move to the left side in Figure 4.6, especially for largerhub heights. Therefore, gust induced vibrations become more relevant for rotatable supportstructures. The dynamic behaviour of rotatable WT towers is mentioned with more detail insubsection 4.3.3.
105
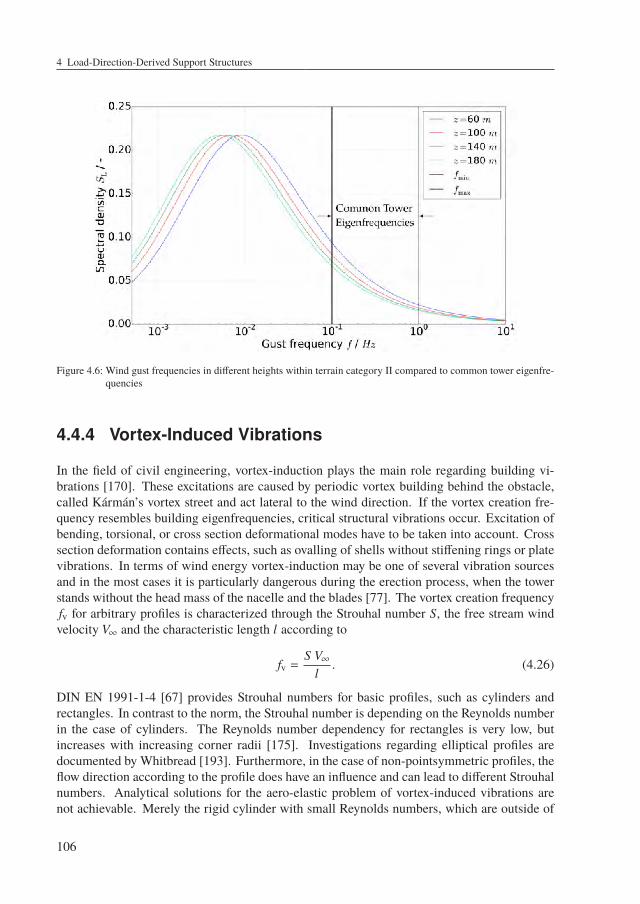
4 Load-Direction-Derived Support Structures
Figure 4.6: Wind gust frequencies in different heights within terrain category II compared to common tower eigenfre-quencies
4.4.4 Vortex-Induced Vibrations
In the field of civil engineering, vortex-induction plays the main role regarding building vi-brations [170]. These excitations are caused by periodic vortex building behind the obstacle,called Kármán’s vortex street and act lateral to the wind direction. If the vortex creation fre-quency resembles building eigenfrequencies, critical structural vibrations occur. Excitation ofbending, torsional, or cross section deformational modes have to be taken into account. Crosssection deformation contains effects, such as ovalling of shells without stiffening rings or platevibrations. In terms of wind energy vortex-induction may be one of several vibration sourcesand in the most cases it is particularly dangerous during the erection process, when the towerstands without the head mass of the nacelle and the blades [77]. The vortex creation frequencyfv for arbitrary profiles is characterized through the Strouhal number S, the free stream windvelocity V∞ and the characteristic length l according to
fv =S V∞
l. (4.26)
DIN EN 1991-1-4 [67] provides Strouhal numbers for basic profiles, such as cylinders andrectangles. In contrast to the norm, the Strouhal number is depending on the Reynolds numberin the case of cylinders. The Reynolds number dependency for rectangles is very low, butincreases with increasing corner radii [175]. Investigations regarding elliptical profiles aredocumented by Whitbread [193]. Furthermore, in the case of non-pointsymmetric profiles, theflow direction according to the profile does have an influence and can lead to different Strouhalnumbers. Analytical solutions for the aero-elastic problem of vortex-induced vibrations arenot achievable. Merely the rigid cylinder with small Reynolds numbers, which are outside of
106
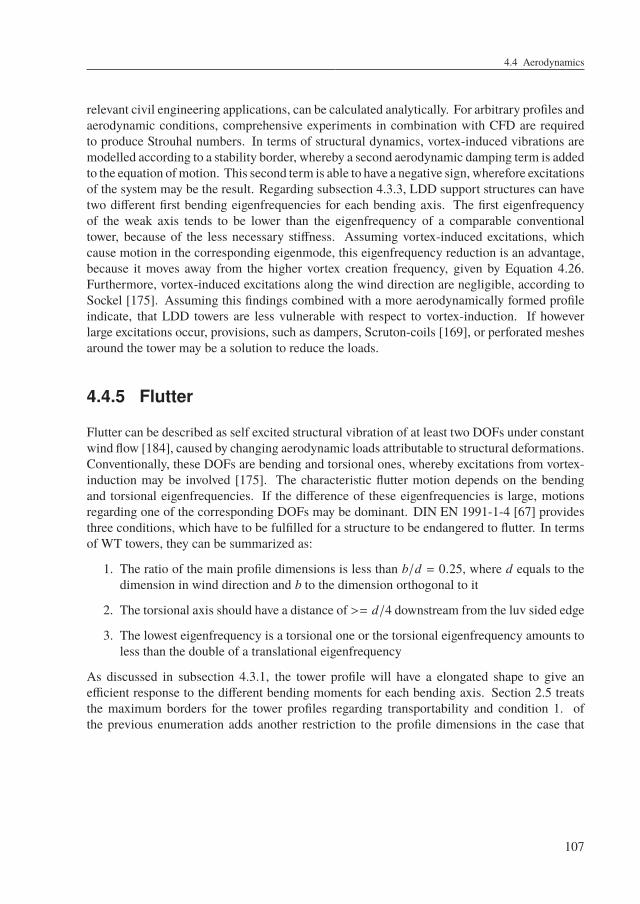
4.4 Aerodynamics
relevant civil engineering applications, can be calculated analytically. For arbitrary profiles andaerodynamic conditions, comprehensive experiments in combination with CFD are requiredto produce Strouhal numbers. In terms of structural dynamics, vortex-induced vibrations aremodelled according to a stability border, whereby a second aerodynamic damping term is addedto the equation ofmotion. This second term is able to have a negative sign, wherefore excitationsof the system may be the result. Regarding subsection 4.3.3, LDD support structures can havetwo different first bending eigenfrequencies for each bending axis. The first eigenfrequencyof the weak axis tends to be lower than the eigenfrequency of a comparable conventionaltower, because of the less necessary stiffness. Assuming vortex-induced excitations, whichcause motion in the corresponding eigenmode, this eigenfrequency reduction is an advantage,because it moves away from the higher vortex creation frequency, given by Equation 4.26.Furthermore, vortex-induced excitations along the wind direction are negligible, according toSockel [175]. Assuming this findings combined with a more aerodynamically formed profileindicate, that LDD towers are less vulnerable with respect to vortex-induction. If howeverlarge excitations occur, provisions, such as dampers, Scruton-coils [169], or perforated meshesaround the tower may be a solution to reduce the loads.
4.4.5 Flutter
Flutter can be described as self excited structural vibration of at least two DOFs under constantwind flow [184], caused by changing aerodynamic loads attributable to structural deformations.Conventionally, these DOFs are bending and torsional ones, whereby excitations from vortex-induction may be involved [175]. The characteristic flutter motion depends on the bendingand torsional eigenfrequencies. If the difference of these eigenfrequencies is large, motionsregarding one of the corresponding DOFs may be dominant. DIN EN 1991-1-4 [67] providesthree conditions, which have to be fulfilled for a structure to be endangered to flutter. In termsof WT towers, they can be summarized as:
1. The ratio of the main profile dimensions is less than b/d = 0.25, where d equals to thedimension in wind direction and b to the dimension orthogonal to it
2. The torsional axis should have a distance of >= d/4 downstream from the luv sided edge
3. The lowest eigenfrequency is a torsional one or the torsional eigenfrequency amounts toless than the double of a translational eigenfrequency
As discussed in subsection 4.3.1, the tower profile will have a elongated shape to give anefficient response to the different bending moments for each bending axis. Section 2.5 treatsthe maximum borders for the tower profiles regarding transportability and condition 1. ofthe previous enumeration adds another restriction to the profile dimensions in the case that
107
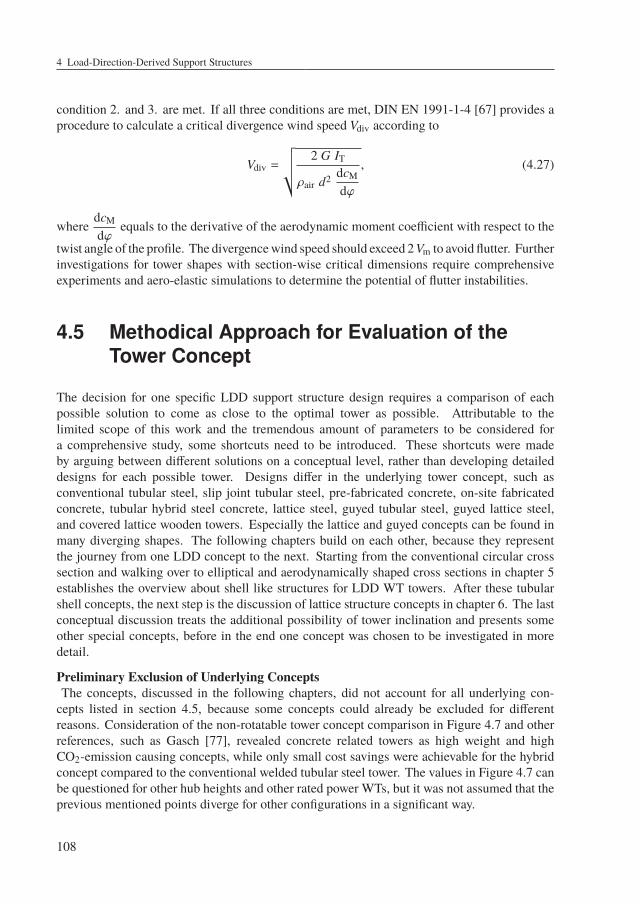
4 Load-Direction-Derived Support Structures
condition 2. and 3. are met. If all three conditions are met, DIN EN 1991-1-4 [67] provides aprocedure to calculate a critical divergence wind speed Vdiv according to
Vdiv =
√√√√ 2 G IT
ρair d2 dcM
dϕ
, (4.27)
wheredcM
dϕequals to the derivative of the aerodynamic moment coefficient with respect to the
twist angle of the profile. The divergencewind speed should exceed 2 Vm to avoid flutter. Furtherinvestigations for tower shapes with section-wise critical dimensions require comprehensiveexperiments and aero-elastic simulations to determine the potential of flutter instabilities.
4.5 Methodical Approach for Evaluation of theTower Concept
The decision for one specific LDD support structure design requires a comparison of eachpossible solution to come as close to the optimal tower as possible. Attributable to thelimited scope of this work and the tremendous amount of parameters to be considered fora comprehensive study, some shortcuts need to be introduced. These shortcuts were madeby arguing between different solutions on a conceptual level, rather than developing detaileddesigns for each possible tower. Designs differ in the underlying tower concept, such asconventional tubular steel, slip joint tubular steel, pre-fabricated concrete, on-site fabricatedconcrete, tubular hybrid steel concrete, lattice steel, guyed tubular steel, guyed lattice steel,and covered lattice wooden towers. Especially the lattice and guyed concepts can be found inmany diverging shapes. The following chapters build on each other, because they representthe journey from one LDD concept to the next. Starting from the conventional circular crosssection and walking over to elliptical and aerodynamically shaped cross sections in chapter 5establishes the overview about shell like structures for LDD WT towers. After these tubularshell concepts, the next step is the discussion of lattice structure concepts in chapter 6. The lastconceptual discussion treats the additional possibility of tower inclination and presents someother special concepts, before in the end one concept was chosen to be investigated in moredetail.
Preliminary Exclusion of Underlying ConceptsThe concepts, discussed in the following chapters, did not account for all underlying con-cepts listed in section 4.5, because some concepts could already be excluded for differentreasons. Consideration of the non-rotatable tower concept comparison in Figure 4.7 and otherreferences, such as Gasch [77], revealed concrete related towers as high weight and highCO2-emission causing concepts, while only small cost savings were achievable for the hybridconcept compared to the conventional welded tubular steel tower. The values in Figure 4.7 canbe questioned for other hub heights and other rated power WTs, but it was not assumed that theprevious mentioned points diverge for other configurations in a significant way.
108
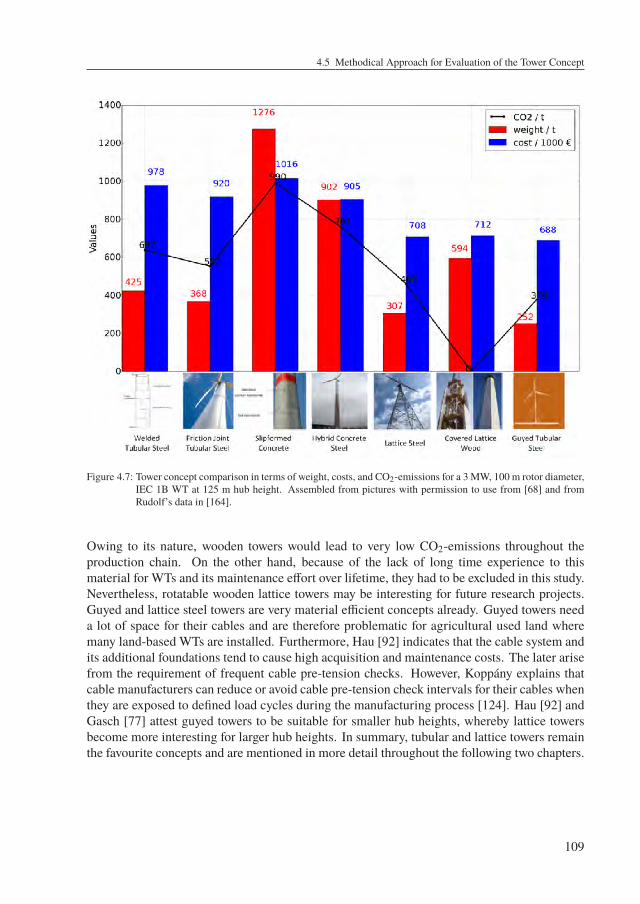
4.5 Methodical Approach for Evaluation of the Tower Concept
Figure 4.7: Tower concept comparison in terms of weight, costs, and CO2-emissions for a 3 MW, 100 m rotor diameter,IEC 1B WT at 125 m hub height. Assembled from pictures with permission to use from [68] and fromRudolf’s data in [164].
Owing to its nature, wooden towers would lead to very low CO2-emissions throughout theproduction chain. On the other hand, because of the lack of long time experience to thismaterial for WTs and its maintenance effort over lifetime, they had to be excluded in this study.Nevertheless, rotatable wooden lattice towers may be interesting for future research projects.Guyed and lattice steel towers are very material efficient concepts already. Guyed towers needa lot of space for their cables and are therefore problematic for agricultural used land wheremany land-based WTs are installed. Furthermore, Hau [92] indicates that the cable system andits additional foundations tend to cause high acquisition and maintenance costs. The later arisefrom the requirement of frequent cable pre-tension checks. However, Koppány explains thatcable manufacturers can reduce or avoid cable pre-tension check intervals for their cables whenthey are exposed to defined load cycles during the manufacturing process [124]. Hau [92] andGasch [77] attest guyed towers to be suitable for smaller hub heights, whereby lattice towersbecome more interesting for larger hub heights. In summary, tubular and lattice towers remainthe favourite concepts and are mentioned in more detail throughout the following two chapters.
109

5 Rotatable Tubular Concepts
5.1 Comparison of Tubular Cross Sections
Major influencing factors to LDD tubular tower designs are the area stiffness, manufacturingeffort, the aerodynamic drag, and local shell/plate stability. The area stiffness (radius of
gyration) i2 =IA
is a measure for material efficiency in terms of bending stiffness. Themanufacturing effort of a shell depends on the amount of necessary welding seams, the amountof cross sectional parts, and the complexity of the shape. In this case, complexity is a synonymfor change in curvature along the profile, which has a relevance for the rolling process. Theaerodynamic drag in FA direction is assumed to have no high influence to the design, becausethe induced bending moments from this line load along the tower are significantly smaller thanthe bending moments, induced by rotor thrust. This assumption is supported by findings fromsection 3.3 and subsection 3.5.3. Section 4.4 discusses the aerodynamics of LDD structures inmore detail. In terms of local stability of LDD tubular structures, plate like, ideal shell like,and intermediates are conceivable. Curvature of a shell plays an important role, such as thelittle discourse in Appendix 14.11 indicates. The table in Figure 5.1 compares different LDDshell concepts on a qualitative level in terms of area stiffness, manufacturing, stability, andaerodynamic drag. Plus signs refer to favoured and minus signs refer to unfavoured properties,respectively.
The sketches on the left side show, how different cross sectional shapes would fit into arectangular design space, such as introduced in Figure 5.2. Such a transport constraint forcesa circular cross section (a) to have a small diameter, while a rectangular one (b) would fitperfectly into it. The small diameter of concept a leads to higher curvature and therefore goodlocal stability, but because of large material distances from the bending axes, concepts b and creach better material efficiency in terms of bending stiffness. On the other hand, they have lowlocal stability properties, due to the plate like walls. In terms of manufacturing, concepts a andb are assessed to be the same, because a requires rolling of one steel sheet and one longitudinalwelding seam, while b requires folding of one steel sheet and likewise one longitudinal weldingseam. Concepts g and h obtain less aerodynamic resistance and intermediate local stability,but on the other hand they lack of a lower area stiffness and show more complex curvatures,wherefore a more expensive manufacturing process is expected. The elliptical cross section (f)was found to be a good compromise between the different aspects, wherefore it is consideredin more detail throughout the next section.
111
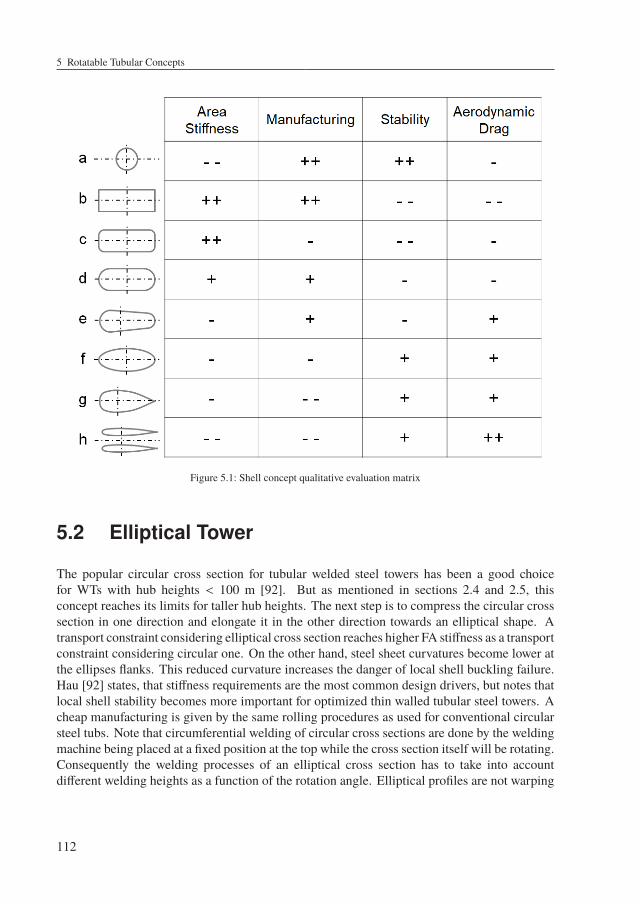
5 Rotatable Tubular Concepts
Figure 5.1: Shell concept qualitative evaluation matrix
5.2 Elliptical Tower
The popular circular cross section for tubular welded steel towers has been a good choicefor WTs with hub heights < 100 m [92]. But as mentioned in sections 2.4 and 2.5, thisconcept reaches its limits for taller hub heights. The next step is to compress the circular crosssection in one direction and elongate it in the other direction towards an elliptical shape. Atransport constraint considering elliptical cross section reaches higher FA stiffness as a transportconstraint considering circular one. On the other hand, steel sheet curvatures become lower atthe ellipses flanks. This reduced curvature increases the danger of local shell buckling failure.Hau [92] states, that stiffness requirements are the most common design drivers, but notes thatlocal shell stability becomes more important for optimized thin walled tubular steel towers. Acheap manufacturing is given by the same rolling procedures as used for conventional circularsteel tubs. Note that circumferential welding of circular cross sections are done by the weldingmachine being placed at a fixed position at the top while the cross section itself will be rotating.Consequently the welding processes of an elliptical cross section has to take into accountdifferent welding heights as a function of the rotation angle. Elliptical profiles are not warping
112
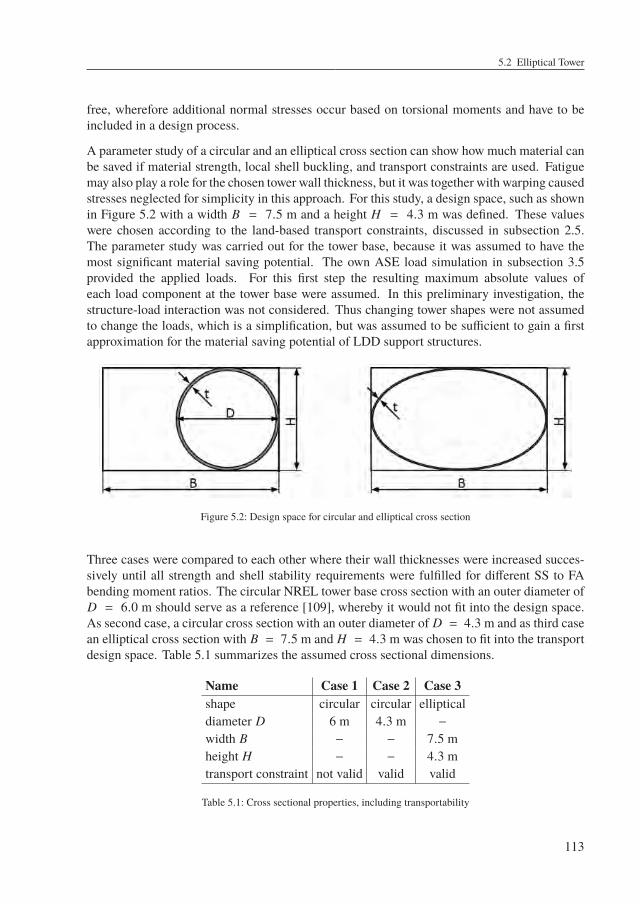
5.2 Elliptical Tower
free, wherefore additional normal stresses occur based on torsional moments and have to beincluded in a design process.
A parameter study of a circular and an elliptical cross section can show how much material canbe saved if material strength, local shell buckling, and transport constraints are used. Fatiguemay also play a role for the chosen tower wall thickness, but it was together with warping causedstresses neglected for simplicity in this approach. For this study, a design space, such as shownin Figure 5.2 with a width B = 7.5 m and a height H = 4.3 m was defined. These valueswere chosen according to the land-based transport constraints, discussed in subsection 2.5.The parameter study was carried out for the tower base, because it was assumed to have themost significant material saving potential. The own ASE load simulation in subsection 3.5provided the applied loads. For this first step the resulting maximum absolute values ofeach load component at the tower base were assumed. In this preliminary investigation, thestructure-load interaction was not considered. Thus changing tower shapes were not assumedto change the loads, which is a simplification, but was assumed to be sufficient to gain a firstapproximation for the material saving potential of LDD support structures.
Figure 5.2: Design space for circular and elliptical cross section
Three cases were compared to each other where their wall thicknesses were increased succes-sively until all strength and shell stability requirements were fulfilled for different SS to FAbending moment ratios. The circular NREL tower base cross section with an outer diameter ofD = 6.0 m should serve as a reference [109], whereby it would not fit into the design space.As second case, a circular cross section with an outer diameter of D = 4.3 m and as third casean elliptical cross section with B = 7.5 m and H = 4.3 m was chosen to fit into the transportdesign space. Table 5.1 summarizes the assumed cross sectional dimensions.
Name Case 1 Case 2 Case 3shape circular circular ellipticaldiameter D 6 m 4.3 m −
width B − − 7.5 mheight H − − 4.3 mtransport constraint not valid valid valid
Table 5.1: Cross sectional properties, including transportability
113
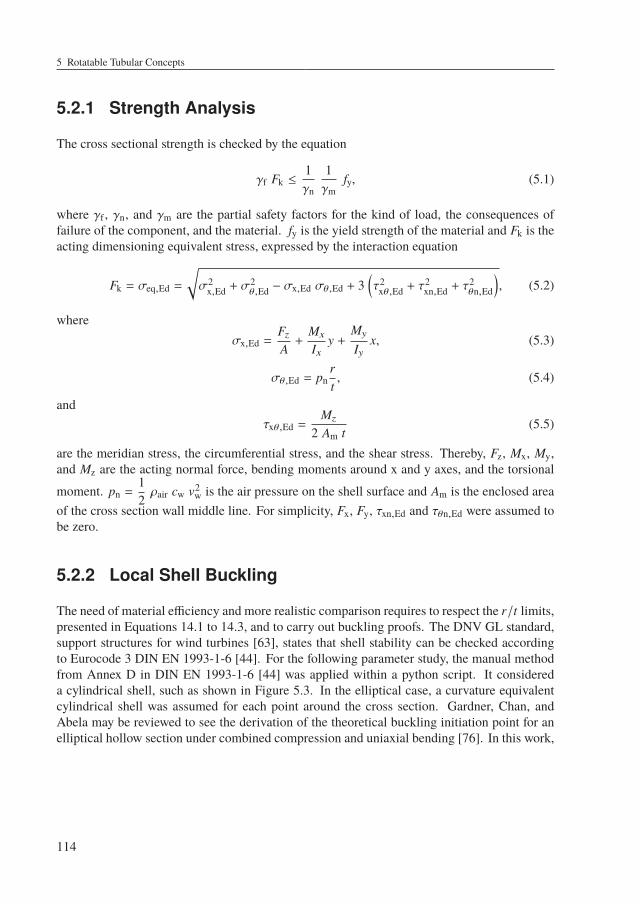
5 Rotatable Tubular Concepts
5.2.1 Strength Analysis
The cross sectional strength is checked by the equation
γf Fk ≤1γn
1γm
fy, (5.1)
where γf , γn, and γm are the partial safety factors for the kind of load, the consequences offailure of the component, and the material. fy is the yield strength of the material and Fk is theacting dimensioning equivalent stress, expressed by the interaction equation
Fk = σeq,Ed =
√σ2
x,Ed + σ2θ,Ed − σx,Ed σθ,Ed + 3
(τ2
xθ,Ed + τ2xn,Ed + τ
2θn,Ed
), (5.2)
whereσx,Ed =
Fz
A+
Mx
Ixy +
My
Iyx, (5.3)
σθ,Ed = pnrt, (5.4)
andτxθ,Ed =
Mz
2 Am t(5.5)
are the meridian stress, the circumferential stress, and the shear stress. Thereby, Fz, Mx, My,and Mz are the acting normal force, bending moments around x and y axes, and the torsional
moment. pn =12ρair cw v2
w is the air pressure on the shell surface and Am is the enclosed areaof the cross section wall middle line. For simplicity, Fx, Fy, τxn,Ed and τθn,Ed were assumed tobe zero.
5.2.2 Local Shell Buckling
The need of material efficiency and more realistic comparison requires to respect the r/t limits,presented in Equations 14.1 to 14.3, and to carry out buckling proofs. The DNV GL standard,support structures for wind turbines [63], states that shell stability can be checked accordingto Eurocode 3 DIN EN 1993-1-6 [44]. For the following parameter study, the manual methodfrom Annex D in DIN EN 1993-1-6 [44] was applied within a python script. It considereda cylindrical shell, such as shown in Figure 5.3. In the elliptical case, a curvature equivalentcylindrical shell was assumed for each point around the cross section. Gardner, Chan, andAbela may be reviewed to see the derivation of the theoretical buckling initiation point for anelliptical hollow section under combined compression and uniaxial bending [76]. In this work,
114
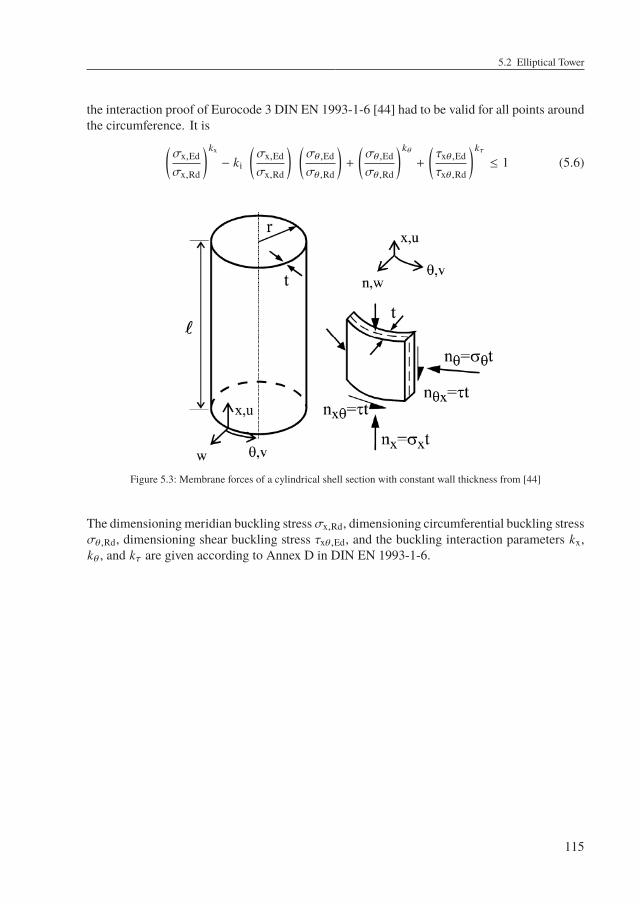
5.2 Elliptical Tower
the interaction proof of Eurocode 3 DIN EN 1993-1-6 [44] had to be valid for all points aroundthe circumference. It is(
σx,Ed
σx,Rd
)kx
− ki
(σx,Ed
σx,Rd
) (σθ,Ed
σθ,Rd
)+
(σθ,Ed
σθ,Rd
)kθ+
(τxθ,Ed
τxθ,Rd
)kτ≤ 1 (5.6)
Figure 5.3: Membrane forces of a cylindrical shell section with constant wall thickness from [44]
The dimensioning meridian buckling stressσx,Rd, dimensioning circumferential buckling stressσθ,Rd, dimensioning shear buckling stress τxθ,Ed, and the buckling interaction parameters kx,kθ , and kτ are given according to Annex D in DIN EN 1993-1-6.
115
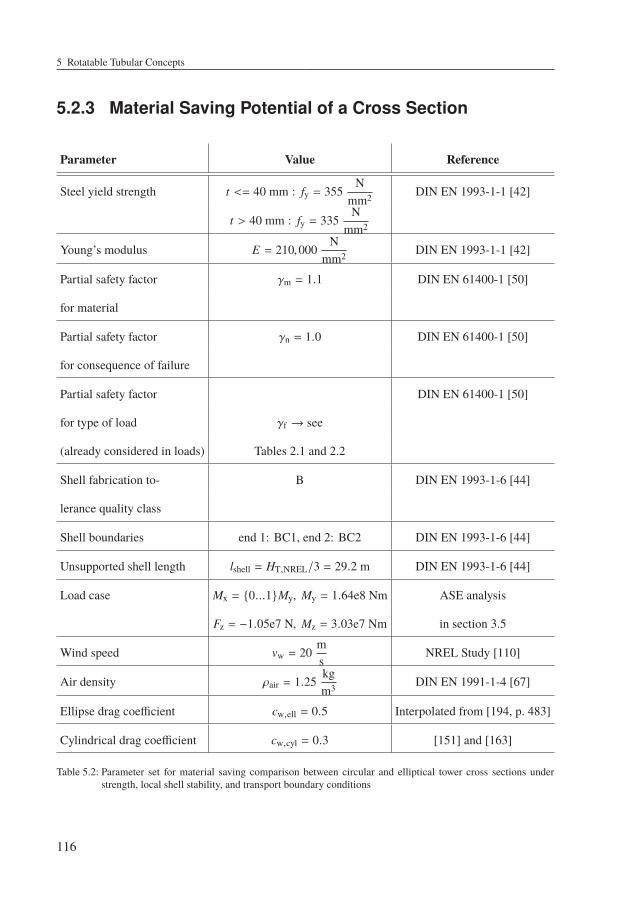
5 Rotatable Tubular Concepts
5.2.3 Material Saving Potential of a Cross Section
Parameter Value Reference
Steel yield strength t <= 40 mm : fy = 355N
mm2 DIN EN 1993-1-1 [42]
t > 40 mm : fy = 335N
mm2
Young’s modulus E = 210,000N
mm2 DIN EN 1993-1-1 [42]
Partial safety factor γm = 1.1 DIN EN 61400-1 [50]
for material
Partial safety factor γn = 1.0 DIN EN 61400-1 [50]
for consequence of failure
Partial safety factor DIN EN 61400-1 [50]
for type of load γf → see
(already considered in loads) Tables 2.1 and 2.2
Shell fabrication to- B DIN EN 1993-1-6 [44]
lerance quality class
Shell boundaries end 1: BC1, end 2: BC2 DIN EN 1993-1-6 [44]
Unsupported shell length lshell = HT,NREL/3 = 29.2 m DIN EN 1993-1-6 [44]
Load case Mx = 0...1My, My = 1.64e8 Nm ASE analysis
Fz = −1.05e7 N, Mz = 3.03e7 Nm in section 3.5
Wind speed vw = 20ms
NREL Study [110]
Air density ρair = 1.25kgm3 DIN EN 1991-1-4 [67]
Ellipse drag coefficient cw,ell = 0.5 Interpolated from [194, p. 483]
Cylindrical drag coefficient cw,cyl = 0.3 [151] and [163]
Table 5.2: Parameter set for material saving comparison between circular and elliptical tower cross sections understrength, local shell stability, and transport boundary conditions
116
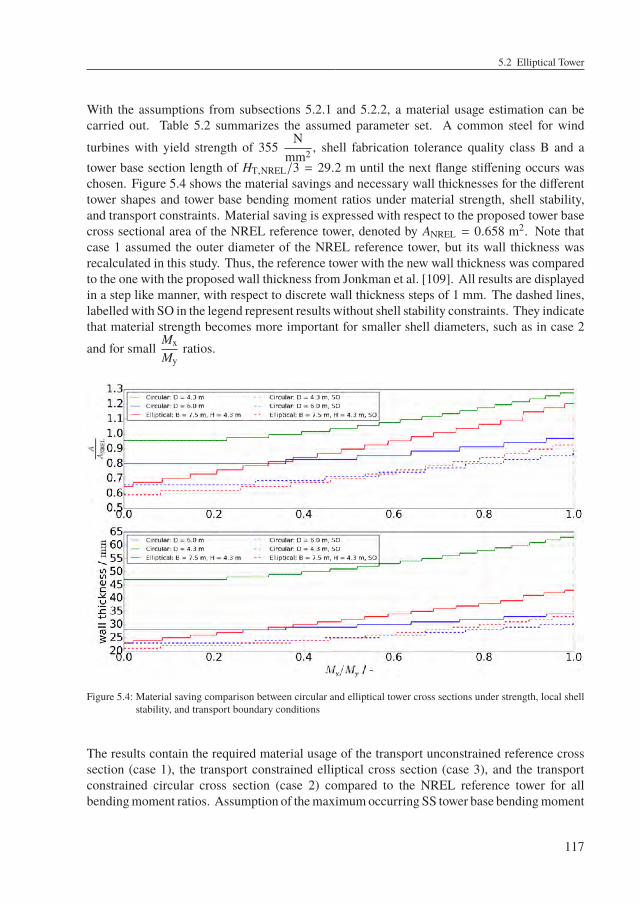
5.2 Elliptical Tower
With the assumptions from subsections 5.2.1 and 5.2.2, a material usage estimation can becarried out. Table 5.2 summarizes the assumed parameter set. A common steel for wind
turbines with yield strength of 355N
mm2 , shell fabrication tolerance quality class B and atower base section length of HT,NREL/3 = 29.2 m until the next flange stiffening occurs waschosen. Figure 5.4 shows the material savings and necessary wall thicknesses for the differenttower shapes and tower base bending moment ratios under material strength, shell stability,and transport constraints. Material saving is expressed with respect to the proposed tower basecross sectional area of the NREL reference tower, denoted by ANREL = 0.658 m2. Note thatcase 1 assumed the outer diameter of the NREL reference tower, but its wall thickness wasrecalculated in this study. Thus, the reference tower with the new wall thickness was comparedto the one with the proposed wall thickness from Jonkman et al. [109]. All results are displayedin a step like manner, with respect to discrete wall thickness steps of 1 mm. The dashed lines,labelled with SO in the legend represent results without shell stability constraints. They indicatethat material strength becomes more important for smaller shell diameters, such as in case 2
and for smallMx
Myratios.
Figure 5.4: Material saving comparison between circular and elliptical tower cross sections under strength, local shellstability, and transport boundary conditions
The results contain the required material usage of the transport unconstrained reference crosssection (case 1), the transport constrained elliptical cross section (case 3), and the transportconstrained circular cross section (case 2) compared to the NREL reference tower for allbendingmoment ratios. Assumption of themaximumoccurring SS tower base bendingmoment
117
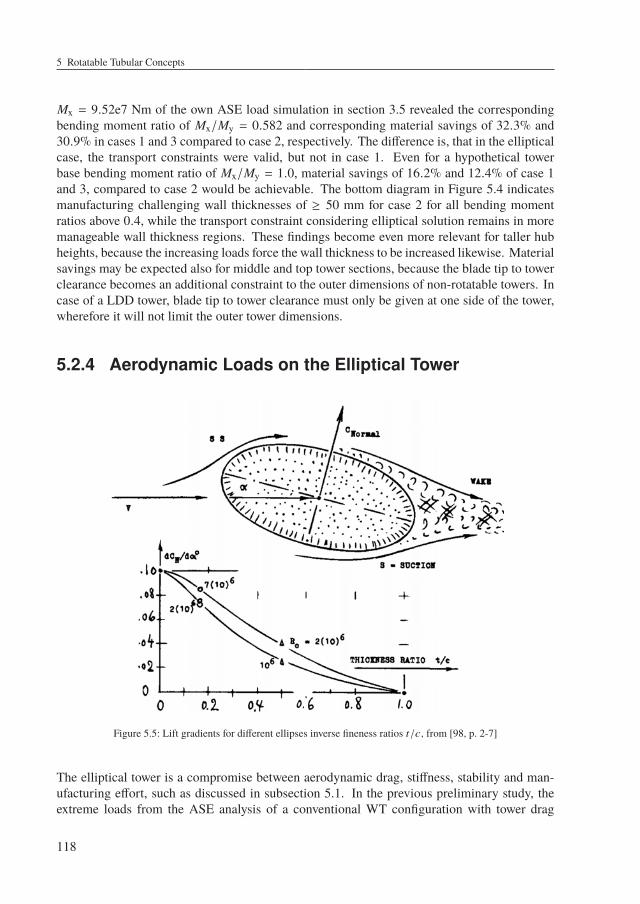
5 Rotatable Tubular Concepts
Mx = 9.52e7 Nm of the own ASE load simulation in section 3.5 revealed the correspondingbending moment ratio of Mx/My = 0.582 and corresponding material savings of 32.3% and30.9% in cases 1 and 3 compared to case 2, respectively. The difference is, that in the ellipticalcase, the transport constraints were valid, but not in case 1. Even for a hypothetical towerbase bending moment ratio of Mx/My = 1.0, material savings of 16.2% and 12.4% of case 1and 3, compared to case 2 would be achievable. The bottom diagram in Figure 5.4 indicatesmanufacturing challenging wall thicknesses of ≥ 50 mm for case 2 for all bending momentratios above 0.4, while the transport constraint considering elliptical solution remains in moremanageable wall thickness regions. These findings become even more relevant for taller hubheights, because the increasing loads force the wall thickness to be increased likewise. Materialsavings may be expected also for middle and top tower sections, because the blade tip to towerclearance becomes an additional constraint to the outer dimensions of non-rotatable towers. Incase of a LDD tower, blade tip to tower clearance must only be given at one side of the tower,wherefore it will not limit the outer tower dimensions.
5.2.4 Aerodynamic Loads on the Elliptical Tower
Figure 5.5: Lift gradients for different ellipses inverse fineness ratios t/c, from [98, p. 2-7]
The elliptical tower is a compromise between aerodynamic drag, stiffness, stability and man-ufacturing effort, such as discussed in subsection 5.1. In the previous preliminary study, theextreme loads from the ASE analysis of a conventional WT configuration with tower drag
118
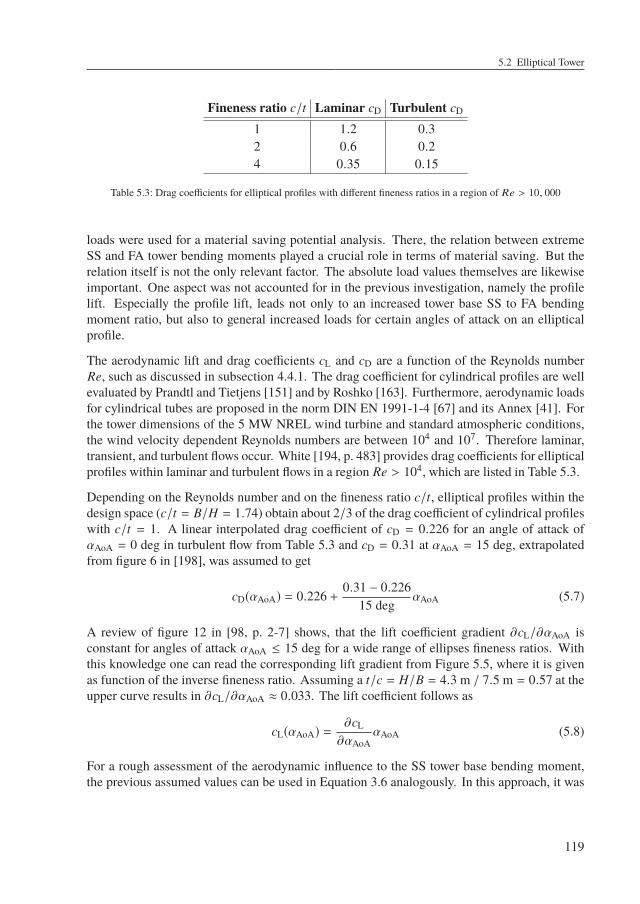
5.2 Elliptical Tower
Fineness ratio c/t Laminar cD Turbulent cD
1 1.2 0.32 0.6 0.24 0.35 0.15
Table 5.3: Drag coefficients for elliptical profiles with different fineness ratios in a region of Re > 10, 000
loads were used for a material saving potential analysis. There, the relation between extremeSS and FA tower bending moments played a crucial role in terms of material saving. But therelation itself is not the only relevant factor. The absolute load values themselves are likewiseimportant. One aspect was not accounted for in the previous investigation, namely the profilelift. Especially the profile lift, leads not only to an increased tower base SS to FA bendingmoment ratio, but also to general increased loads for certain angles of attack on an ellipticalprofile.
The aerodynamic lift and drag coefficients cL and cD are a function of the Reynolds numberRe, such as discussed in subsection 4.4.1. The drag coefficient for cylindrical profiles are wellevaluated by Prandtl and Tietjens [151] and by Roshko [163]. Furthermore, aerodynamic loadsfor cylindrical tubes are proposed in the norm DIN EN 1991-1-4 [67] and its Annex [41]. Forthe tower dimensions of the 5 MW NREL wind turbine and standard atmospheric conditions,the wind velocity dependent Reynolds numbers are between 104 and 107. Therefore laminar,transient, and turbulent flows occur. White [194, p. 483] provides drag coefficients for ellipticalprofiles within laminar and turbulent flows in a region Re > 104, which are listed in Table 5.3.
Depending on the Reynolds number and on the fineness ratio c/t, elliptical profiles within thedesign space (c/t = B/H = 1.74) obtain about 2/3 of the drag coefficient of cylindrical profileswith c/t = 1. A linear interpolated drag coefficient of cD = 0.226 for an angle of attack ofαAoA = 0 deg in turbulent flow from Table 5.3 and cD = 0.31 at αAoA = 15 deg, extrapolatedfrom figure 6 in [198], was assumed to get
cD(αAoA) = 0.226 +0.31 − 0.226
15 degαAoA (5.7)
A review of figure 12 in [98, p. 2-7] shows, that the lift coefficient gradient ∂cL/∂αAoA isconstant for angles of attack αAoA ≤ 15 deg for a wide range of ellipses fineness ratios. Withthis knowledge one can read the corresponding lift gradient from Figure 5.5, where it is givenas function of the inverse fineness ratio. Assuming a t/c = H/B = 4.3 m / 7.5 m = 0.57 at theupper curve results in ∂cL/∂αAoA ≈ 0.033. The lift coefficient follows as
cL(αAoA) =∂cL
∂αAoAαAoA (5.8)
For a rough assessment of the aerodynamic influence to the SS tower base bending moment,the previous assumed values can be used in Equation 3.6 analogously. In this approach, it was
119
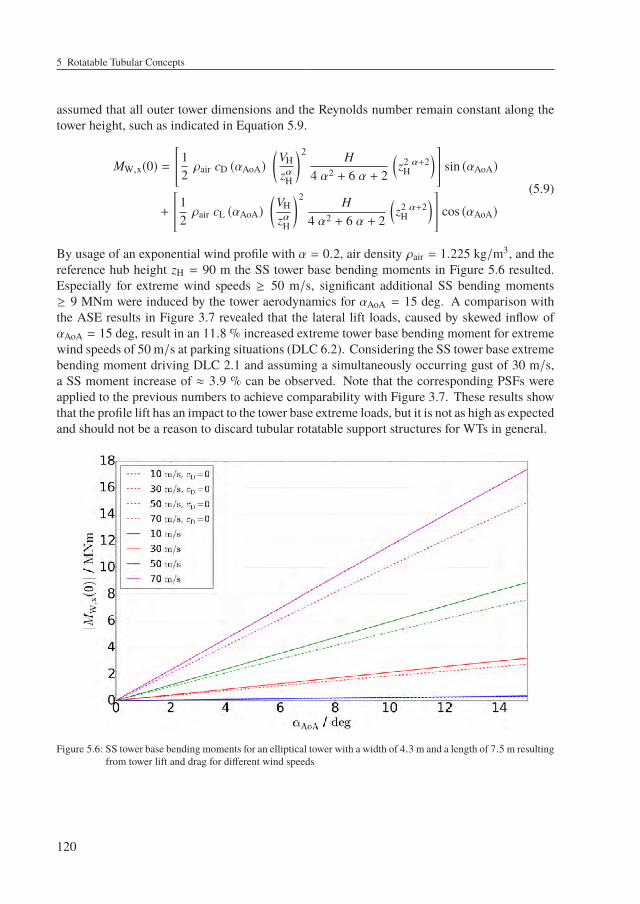
5 Rotatable Tubular Concepts
assumed that all outer tower dimensions and the Reynolds number remain constant along thetower height, such as indicated in Equation 5.9.
MW,x(0) =
[12ρair cD (αAoA)
(VH
zαH
)2 H4 α2 + 6 α + 2
(z2 α+2
H
)]sin (αAoA)
+
[12ρair cL (αAoA)
(VH
zαH
)2 H4 α2 + 6 α + 2
(z2 α+2
H
)]cos (αAoA)
(5.9)
By usage of an exponential wind profile with α = 0.2, air density ρair = 1.225 kg/m3, and thereference hub height zH = 90 m the SS tower base bending moments in Figure 5.6 resulted.Especially for extreme wind speeds ≥ 50 m/s, significant additional SS bending moments≥ 9 MNm were induced by the tower aerodynamics for αAoA = 15 deg. A comparison withthe ASE results in Figure 3.7 revealed that the lateral lift loads, caused by skewed inflow ofαAoA = 15 deg, result in an 11.8 % increased extreme tower base bending moment for extremewind speeds of 50 m/s at parking situations (DLC 6.2). Considering the SS tower base extremebending moment driving DLC 2.1 and assuming a simultaneously occurring gust of 30 m/s,a SS moment increase of ≈ 3.9 % can be observed. Note that the corresponding PSFs wereapplied to the previous numbers to achieve comparability with Figure 3.7. These results showthat the profile lift has an impact to the tower base extreme loads, but it is not as high as expectedand should not be a reason to discard tubular rotatable support structures for WTs in general.
Figure 5.6: SS tower base bending moments for an elliptical tower with a width of 4.3 m and a length of 7.5 m resultingfrom tower lift and drag for different wind speeds
120
5.2 Elliptical Tower
Furthermore, investigations about the aerodynamic characteristics of an elliptical radar antenna[88] show that the size and momentum deficit of the wakes behind an elliptical profile arereduced compared to a cylindrical one, where lower wake interactions for corresponding towerscan be expected.
5.2.5 Material Saving Potential for Towers
In this subsection, material saving estimations for different shell tower configurations withchanging hub heights are considered. A review of the previous two subsections indicates, thatan elliptical tower shape provides material saving potential compared to a transport constrainedcircular one. Note that no fatigue considerations were implied in the previous subsection 5.2.3.In terms of the preliminary nature of this work, no additional ASE simulations were carried outto investigate the proposed tubular towers in more detail. Instead, a simplified approach shouldserve to estimate tubular tower masses. This required a well documented and investigated WTand tower as reference. Again, the 5 MW baseline WT was appropriate with respect to theserequirements and its properties may be reviewed in section 3.2.
As reasonable simplification for this study, the towers were designed for extreme loads, suchas suggested by the previous subsection 5.2.3. This assumption is not self-evident, because thedesign report of the NREL reference WT states that the tower wall thickness had to be scaledup about 30 % to avoid resonance within all operational conditions. Thus, it was designedwith respect to its eigenfrequency and not with respect to ultimate loads. A review of theWTs Campbell diagram in Figure 4.4 shows, that this reason for increased wall thickness isnot really comprehensible. In fact, the eigenfrequency of the reference tower is very closeto the 3p excitation frequency at cut-in rotational speed. A discussion with the developers ofthe NREL reference WT reveals, that earlier versions of the baseline WT had a higher cut-inrotational speed and that the tower wall thickness increase is an artefact from that time to addressearlier resonance problems. However, this adjustment was never been corrected with respectto the new operational rotational speed range. The mentioned discussion may be reviewed inAppendix 14.12. Regardless of the real driving factor, material strength and buckling wereassumed to govern the wall thickness of the tower designs for this comparison study withtransport constraints to the outer tower dimensions, such as indicated by Figure 5.2 and listedin Table 5.4. Case 1 corresponded to the outer dimensions of the reference WT and case 2 usedthe transport constraint at the tower top and bottom, while the tower top diameter remainedthe same as for case 1. This decision was made attributing to the assumption of standardizedyaw bearing diameters. In case 3, an elliptical cross section with transport considering outerdimensions at the tower base and tower top was assumed.
121
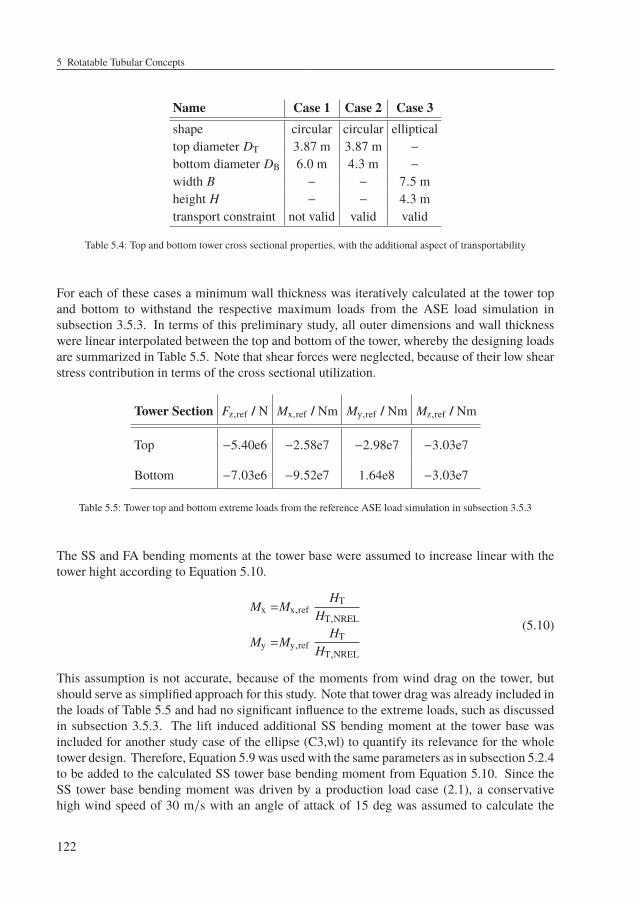
5 Rotatable Tubular Concepts
Name Case 1 Case 2 Case 3shape circular circular ellipticaltop diameter DT 3.87 m 3.87 m −
bottom diameter DB 6.0 m 4.3 m −
width B − − 7.5 mheight H − − 4.3 mtransport constraint not valid valid valid
Table 5.4: Top and bottom tower cross sectional properties, with the additional aspect of transportability
For each of these cases a minimum wall thickness was iteratively calculated at the tower topand bottom to withstand the respective maximum loads from the ASE load simulation insubsection 3.5.3. In terms of this preliminary study, all outer dimensions and wall thicknesswere linear interpolated between the top and bottom of the tower, whereby the designing loadsare summarized in Table 5.5. Note that shear forces were neglected, because of their low shearstress contribution in terms of the cross sectional utilization.
Tower Section Fz,ref / N Mx,ref / Nm My,ref / Nm Mz,ref / Nm
Top −5.40e6 −2.58e7 −2.98e7 −3.03e7
Bottom −7.03e6 −9.52e7 1.64e8 −3.03e7
Table 5.5: Tower top and bottom extreme loads from the reference ASE load simulation in subsection 3.5.3
The SS and FA bending moments at the tower base were assumed to increase linear with thetower hight according to Equation 5.10.
Mx =Mx,refHT
HT,NREL
My =My,refHT
HT,NREL
(5.10)
This assumption is not accurate, because of the moments from wind drag on the tower, butshould serve as simplified approach for this study. Note that tower drag was already included inthe loads of Table 5.5 and had no significant influence to the extreme loads, such as discussedin subsection 3.5.3. The lift induced additional SS bending moment at the tower base wasincluded for another study case of the ellipse (C3,wl) to quantify its relevance for the wholetower design. Therefore, Equation 5.9 was used with the same parameters as in subsection 5.2.4to be added to the calculated SS tower base bending moment from Equation 5.10. Since theSS tower base bending moment was driven by a production load case (2.1), a conservativehigh wind speed of 30 m/s with an angle of attack of 15 deg was assumed to calculate the
122
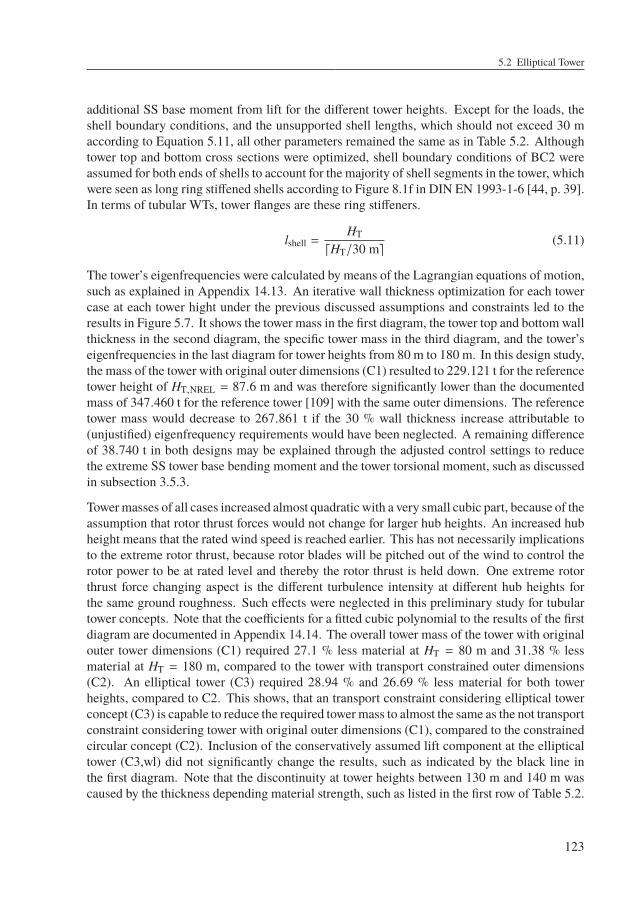
5.2 Elliptical Tower
additional SS base moment from lift for the different tower heights. Except for the loads, theshell boundary conditions, and the unsupported shell lengths, which should not exceed 30 maccording to Equation 5.11, all other parameters remained the same as in Table 5.2. Althoughtower top and bottom cross sections were optimized, shell boundary conditions of BC2 wereassumed for both ends of shells to account for the majority of shell segments in the tower, whichwere seen as long ring stiffened shells according to Figure 8.1f in DIN EN 1993-1-6 [44, p. 39].In terms of tubular WTs, tower flanges are these ring stiffeners.
lshell =HT
dHT/30 me(5.11)
The tower’s eigenfrequencies were calculated by means of the Lagrangian equations of motion,such as explained in Appendix 14.13. An iterative wall thickness optimization for each towercase at each tower hight under the previous discussed assumptions and constraints led to theresults in Figure 5.7. It shows the tower mass in the first diagram, the tower top and bottom wallthickness in the second diagram, the specific tower mass in the third diagram, and the tower’seigenfrequencies in the last diagram for tower heights from 80 m to 180 m. In this design study,the mass of the tower with original outer dimensions (C1) resulted to 229.121 t for the referencetower height of HT,NREL = 87.6 m and was therefore significantly lower than the documentedmass of 347.460 t for the reference tower [109] with the same outer dimensions. The referencetower mass would decrease to 267.861 t if the 30 % wall thickness increase attributable to(unjustified) eigenfrequency requirements would have been neglected. A remaining differenceof 38.740 t in both designs may be explained through the adjusted control settings to reducethe extreme SS tower base bending moment and the tower torsional moment, such as discussedin subsection 3.5.3.
Towermasses of all cases increased almost quadratic with a very small cubic part, because of theassumption that rotor thrust forces would not change for larger hub heights. An increased hubheight means that the rated wind speed is reached earlier. This has not necessarily implicationsto the extreme rotor thrust, because rotor blades will be pitched out of the wind to control therotor power to be at rated level and thereby the rotor thrust is held down. One extreme rotorthrust force changing aspect is the different turbulence intensity at different hub heights forthe same ground roughness. Such effects were neglected in this preliminary study for tubulartower concepts. Note that the coefficients for a fitted cubic polynomial to the results of the firstdiagram are documented in Appendix 14.14. The overall tower mass of the tower with originalouter tower dimensions (C1) required 27.1 % less material at HT = 80 m and 31.38 % lessmaterial at HT = 180 m, compared to the tower with transport constrained outer dimensions(C2). An elliptical tower (C3) required 28.94 % and 26.69 % less material for both towerheights, compared to C2. This shows, that an transport constraint considering elliptical towerconcept (C3) is capable to reduce the required tower mass to almost the same as the not transportconstraint considering tower with original outer dimensions (C1), compared to the constrainedcircular concept (C2). Inclusion of the conservatively assumed lift component at the ellipticaltower (C3,wl) did not significantly change the results, such as indicated by the black line inthe first diagram. Note that the discontinuity at tower heights between 130 m and 140 m wascaused by the thickness depending material strength, such as listed in the first row of Table 5.2.
123
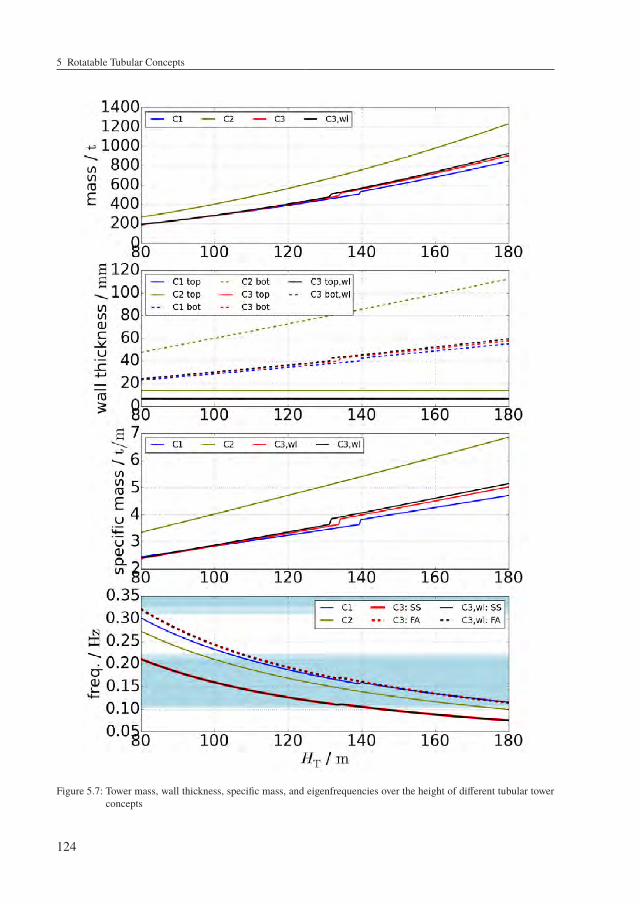
5 Rotatable Tubular Concepts
Figure 5.7: Tower mass, wall thickness, specific mass, and eigenfrequencies over the height of different tubular towerconcepts
124
5.3 Other Tubular Tower Concepts
A good manufacturable wall thickness of < 50 mm at the tower bottom was achieved for towerheights of < 164.9 m, < 84.0 m, < 156.9 m, and < 153.4 m for cases C1, C2, C3, andC3,wl. This shows, that the elliptical tower concept is feasible and a material saving solutionfor transport constrained towers with large hub heights. The specific tower mass increasedlinear with the tower height as it is the derivative of the mass with respect to the tower height.Thereby, different slopes corresponded to different cases. The last diagram in Figure 5.7 showsthe first bending eigenfrequency of each tower. It reveals, that the most configurations hadtower eigenfrequencies within the 1p excitation frequency of the operational rotational speedrange, indicated by the bottom light blue rectangular patch. In cases C1 and C2, the +5 %frequency safety range is reached at tower heights of 103.9 m and 95.5 m. Since the ellipticaltower had different bending eigenfrequencies in the FA and SS direction, no tower of casesC3 or C3,wl exists, which would not hit either the 1p or 3p excitation frequency within theoperational range. Note that the 3p excitation frequency range is indicated by the light bluerectangular patch at the top of the fourth diagram. In terms of eigenfrequencies, none of thepresent cases was appropriate for large hub heights if no further improvements of the dynamicstructural properties would be incorporated. If the outer tower dimensions should remain thesame, following approaches may be applied to reduce or to avoid resonance of such towerconfigurations:
• increase the wall thickness, especially at the tower bottom to increase the tower’s eigen-frequencies
• increase the tower head mass to decrease the tower eigenfrequencies
• use a damping system to convert energy into heat, whereby resonance amplitudes can bereduced
• use a monitoring system on the WT to detect tower resonances and drive through themas quick as possible
Each of these options is either connected to increased costs or decreased WT efficiency and isnot further evaluated in terms of this preliminary study.
5.3 Other Tubular Tower Concepts
This section provides a brief discussion about other possible tubular tower shapes. Thereby,Kamm-back and outer skin modified towers are treated.
5.3.1 Kamm-back Tower
Kamm-back profiles are aerodynamically shaped, but have no real trailing edge, such as shownin Figure 5.8. Their invention was done by Kamm, W. [100] with the intention to realize a lowaerodynamic drag for cars with the compromise of a practical shape. Therefore, he proposed to
125
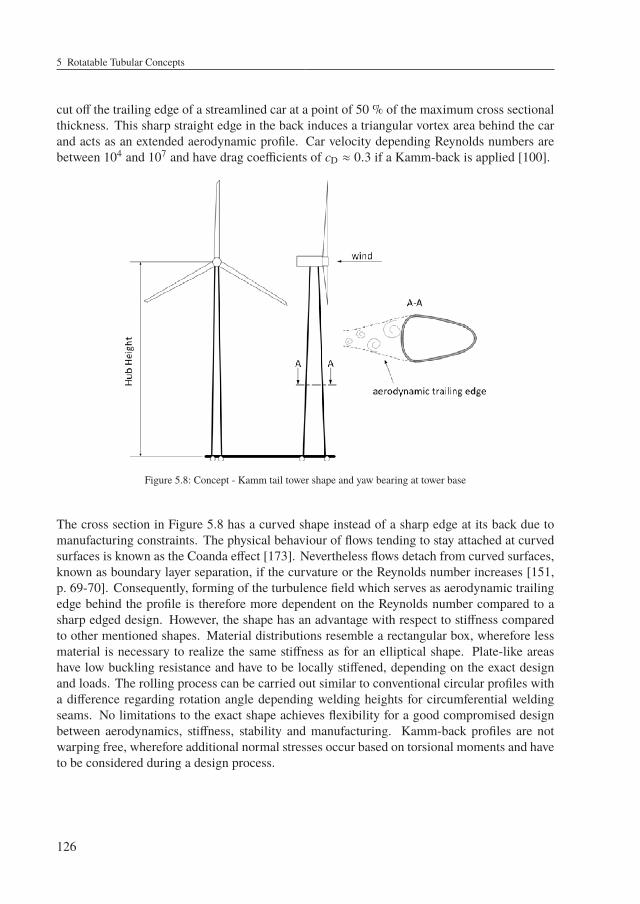
5 Rotatable Tubular Concepts
cut off the trailing edge of a streamlined car at a point of 50 % of the maximum cross sectionalthickness. This sharp straight edge in the back induces a triangular vortex area behind the carand acts as an extended aerodynamic profile. Car velocity depending Reynolds numbers arebetween 104 and 107 and have drag coefficients of cD ≈ 0.3 if a Kamm-back is applied [100].
Figure 5.8: Concept - Kamm tail tower shape and yaw bearing at tower base
The cross section in Figure 5.8 has a curved shape instead of a sharp edge at its back due tomanufacturing constraints. The physical behaviour of flows tending to stay attached at curvedsurfaces is known as the Coanda effect [173]. Nevertheless flows detach from curved surfaces,known as boundary layer separation, if the curvature or the Reynolds number increases [151,p. 69-70]. Consequently, forming of the turbulence field which serves as aerodynamic trailingedge behind the profile is therefore more dependent on the Reynolds number compared to asharp edged design. However, the shape has an advantage with respect to stiffness comparedto other mentioned shapes. Material distributions resemble a rectangular box, wherefore lessmaterial is necessary to realize the same stiffness as for an elliptical shape. Plate-like areashave low buckling resistance and have to be locally stiffened, depending on the exact designand loads. The rolling process can be carried out similar to conventional circular profiles witha difference regarding rotation angle depending welding heights for circumferential weldingseams. No limitations to the exact shape achieves flexibility for a good compromised designbetween aerodynamics, stiffness, stability and manufacturing. Kamm-back profiles are notwarping free, wherefore additional normal stresses occur based on torsional moments and haveto be considered during a design process.
126
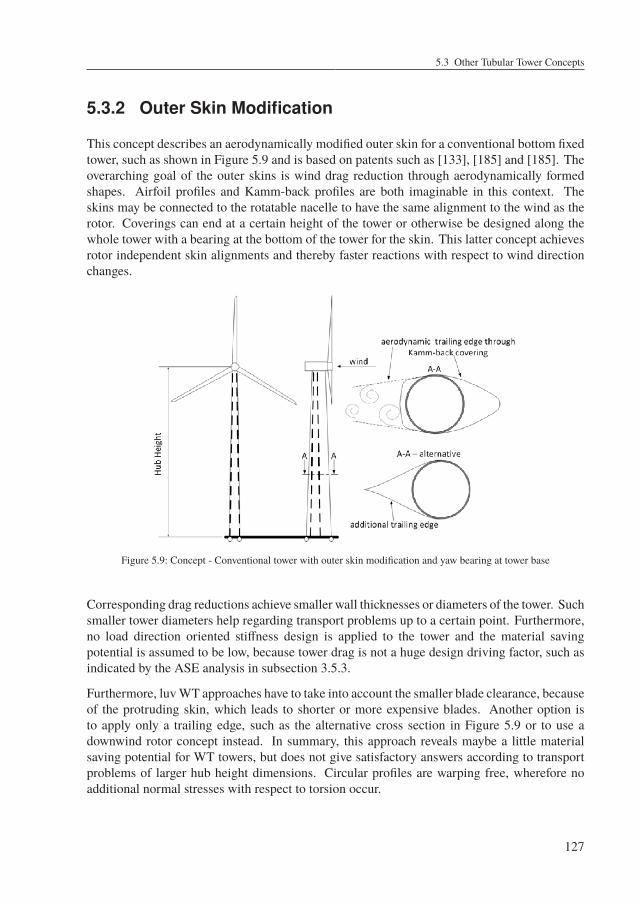
5.3 Other Tubular Tower Concepts
5.3.2 Outer Skin Modification
This concept describes an aerodynamically modified outer skin for a conventional bottom fixedtower, such as shown in Figure 5.9 and is based on patents such as [133], [185] and [185]. Theoverarching goal of the outer skins is wind drag reduction through aerodynamically formedshapes. Airfoil profiles and Kamm-back profiles are both imaginable in this context. Theskins may be connected to the rotatable nacelle to have the same alignment to the wind as therotor. Coverings can end at a certain height of the tower or otherwise be designed along thewhole tower with a bearing at the bottom of the tower for the skin. This latter concept achievesrotor independent skin alignments and thereby faster reactions with respect to wind directionchanges.
Figure 5.9: Concept - Conventional tower with outer skin modification and yaw bearing at tower base
Corresponding drag reductions achieve smaller wall thicknesses or diameters of the tower. Suchsmaller tower diameters help regarding transport problems up to a certain point. Furthermore,no load direction oriented stiffness design is applied to the tower and the material savingpotential is assumed to be low, because tower drag is not a huge design driving factor, such asindicated by the ASE analysis in subsection 3.5.3.
Furthermore, luvWT approaches have to take into account the smaller blade clearance, becauseof the protruding skin, which leads to shorter or more expensive blades. Another option isto apply only a trailing edge, such as the alternative cross section in Figure 5.9 or to use adownwind rotor concept instead. In summary, this approach reveals maybe a little materialsaving potential for WT towers, but does not give satisfactory answers according to transportproblems of larger hub height dimensions. Circular profiles are warping free, wherefore noadditional normal stresses with respect to torsion occur.
127

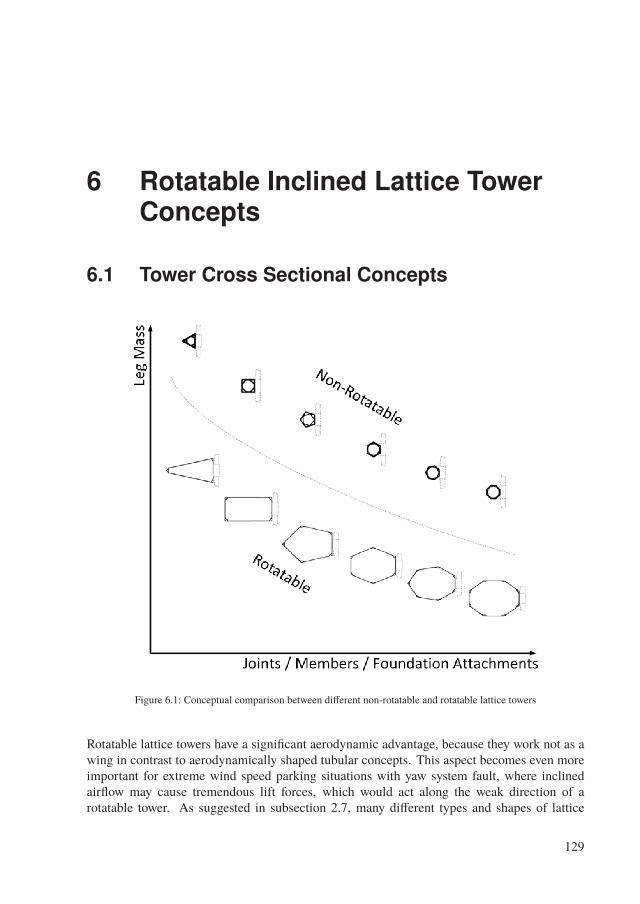
6 Rotatable Inclined Lattice TowerConcepts
6.1 Tower Cross Sectional Concepts
Figure 6.1: Conceptual comparison between different non-rotatable and rotatable lattice towers
Rotatable lattice towers have a significant aerodynamic advantage, because they work not as awing in contrast to aerodynamically shaped tubular concepts. This aspect becomes even moreimportant for extreme wind speed parking situations with yaw system fault, where inclinedairflow may cause tremendous lift forces, which would act along the weak direction of arotatable tower. As suggested in subsection 2.7, many different types and shapes of lattice
129
6 Rotatable Inclined Lattice Tower Concepts
towers are conceivable. Figure 6.1 shows some different non-rotatable and rotatable latticetower cross sectional concepts. A warping free three legged design would thereby reducethe amount of members and joints within the structure compared to a polygonal tower crosssection with more legs. On the other hand, more legs lead to lower axial loading per leg andtherefore lower leg masses. In general, the advantage of rotatable lattice towers with respectto non-rotatable ones lies in the increased space for the outer tower dimensions. Non-rotatablelattice towers must have small outer dimensions at least for the tower sections where the bladespass, such as indicated by Figure 2.12. A review of Equation 2.50 reveals that in case of arectangular tower cross section, leg forces reduce linear with their distance to each other. Forall rotatable concepts, the tower alignment with respect to the RNA is such that the straightfront edge reveals good blade clearance. How the tower looks like behind the front edge doesnot matter for the blade clearance, because it is fixed with respect to the rotor alignment.
This freedom in the outer shape of the lattice tower cross section means that it can be designedwith respect to the main load direction, such as explained in section 4.1. Therefore, a squaretower cross section may become a stretched rectangular one or a polygonal tower cross sectionmay be stretched to be adjusted to the higher FA loadings, such as suggested by Figure 6.1.However, rotatable lattice towers reveal material saving potential even for loads, which are equalin SS and FA direction because of the possibility of increased outer dimensions, compared tonon-rotatable ones. In the end, the amount of legs is an optimization problem with costs andCO2-emissions being the values to be minimized. Counting the bolts of the tower in Figure 2.12reveals that each x-bracing or k-bracing, which consists out of four members, requires about 48bolts for its five joints. Furthermore, the connection between each of the 8 leg segments perleg requires about 52 bolts. Summing the bolts for the leg connections and the 21 bracings perleg up and assuming the lockbolt prices from the offer in Appendix 14.15, results in Figure 6.2for different amounts of lattice tower legs. Note that the Butzkies tower in Figure 2.12 containsalso bolts to merge the two cross sectional parts to one member along its lengths. These boltswere neglected in Figure 6.2 where only joint bolts were considered. Furthermore, the 2.5 MWWT on the Butzkies tower leads probably to lower tower head loads than the 5 MW NRELreference WT, but the first tower is 12.4 m taller than the reference one. Therefore, the resultswere not completely representative for an analogous lattice tower for the reference WT.
However, assuming the larger 25.4 mm Bobtail lockbolts for the whole tower, revealed costsbetween 25,416AC and 67,775AC for towers with 3 and 8 legs, respectively. This cost differenceof 42,359 AC appears relatively small, but note that only purchase costs are considered. Theassembly of all the joints and their observation of the pre-load in the bolts lead to additionalcosts over the lifetime of the WT. Since the lockbolts advantage are the low maintenance costs,these costs were not evaluated for the preliminary nature of this work.
130
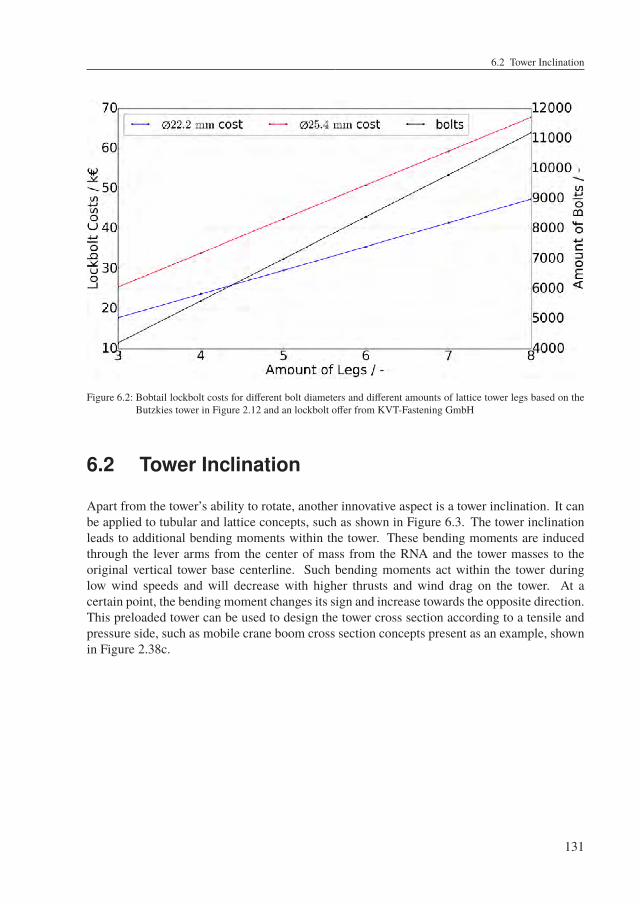
6.2 Tower Inclination
Figure 6.2: Bobtail lockbolt costs for different bolt diameters and different amounts of lattice tower legs based on theButzkies tower in Figure 2.12 and an lockbolt offer from KVT-Fastening GmbH
6.2 Tower Inclination
Apart from the tower’s ability to rotate, another innovative aspect is a tower inclination. It canbe applied to tubular and lattice concepts, such as shown in Figure 6.3. The tower inclinationleads to additional bending moments within the tower. These bending moments are inducedthrough the lever arms from the center of mass from the RNA and the tower masses to theoriginal vertical tower base centerline. Such bending moments act within the tower duringlow wind speeds and will decrease with higher thrusts and wind drag on the tower. At acertain point, the bending moment changes its sign and increase towards the opposite direction.This preloaded tower can be used to design the tower cross section according to a tensile andpressure side, such as mobile crane boom cross section concepts present as an example, shownin Figure 2.38c.
131
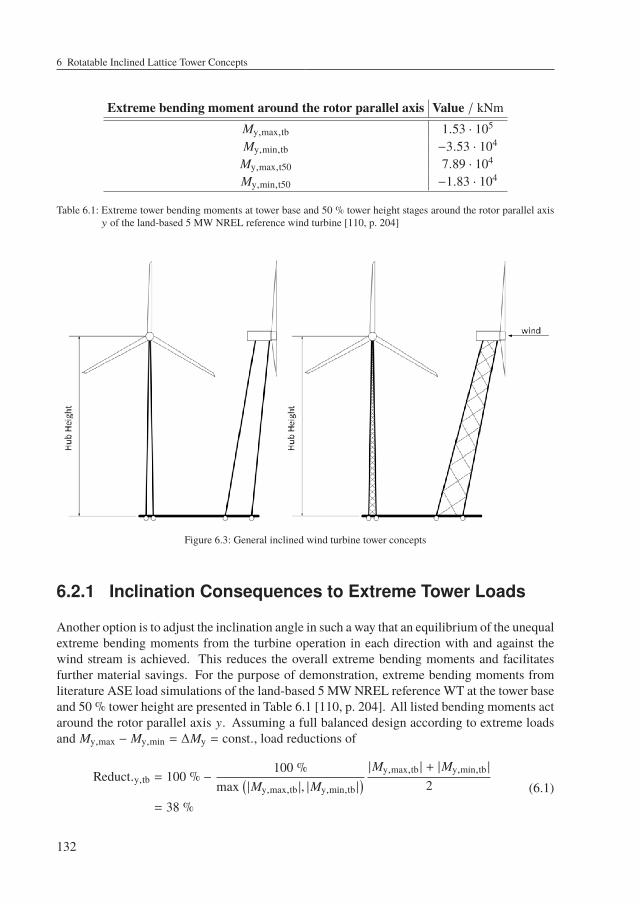
6 Rotatable Inclined Lattice Tower Concepts
Extreme bending moment around the rotor parallel axis Value / kNmMy,max,tb 1.53 · 105
My,min,tb −3.53 · 104
My,max,t50 7.89 · 104
My,min,t50 −1.83 · 104
Table 6.1: Extreme tower bending moments at tower base and 50 % tower height stages around the rotor parallel axisy of the land-based 5 MW NREL reference wind turbine [110, p. 204]
Figure 6.3: General inclined wind turbine tower concepts
6.2.1 Inclination Consequences to Extreme Tower Loads
Another option is to adjust the inclination angle in such a way that an equilibrium of the unequalextreme bending moments from the turbine operation in each direction with and against thewind stream is achieved. This reduces the overall extreme bending moments and facilitatesfurther material savings. For the purpose of demonstration, extreme bending moments fromliterature ASE load simulations of the land-based 5 MW NREL reference WT at the tower baseand 50 % tower height are presented in Table 6.1 [110, p. 204]. All listed bending moments actaround the rotor parallel axis y. Assuming a full balanced design according to extreme loadsand My,max − My,min = ∆My = const., load reductions of
Reduct.y,tb = 100 % −100 %
max(|My,max,tb |, |My,min,tb |
) |My,max,tb | + |My,min,tb |
2= 38 %
(6.1)
132

6.2 Tower Inclination
for the tower base and
Reduct.y,t50 = 100 % −100 %
max(|My,max,t50 |, |My,min,t50 |
) |My,max,t50 | + |My,min,t50 |
2= 38 %
(6.2)
for the 50 % tower height stage resulted. A tower inclination parallel to the rotor plane revealedreductions of extreme loads up to Reduct.x,tb ≈ 16 % and Reduct.x,t50 ≈ 27 %, respectively.Note that these load reductions were from theoretical nature and have to be validated in anASE load simulation. Furthermore, loads found in literature only accounted for DLCs 1.xin their extreme load evaluation. Other ratios may result from the inclusion of more DLCs.However, the proposed load reductions would come additionally to load reductions from loweraerodynamic tower drag in case of a lattice tower and lower periodic excitations, caused by thesmaller tower dam influence from a larger blade clearance.
6.2.2 Inclination Consequences to Tower Fatigue
Fatigue loads are also influenced by tower inclination if mean stress levels are considered.According to Eurocode 3 DIN EN 1993-1-9 [47], mean stresses should not be mentioned forwelded joints, except stress-relief annealing is applied. DNV GL [63] proposes a reductionfactor fm for hot spot stress ranges ∆σ for welded structural details under the followingconditions: (1) They have to be subject to post weld heat treatment or (2) corresponding lowresidual stresses must be documented. The approximation of the tower base bending moment asan ideal sinusoidal function around a constant mean value Mmean , 0 would lead to qualitativenormal stresses, such as indicated in Figure 6.4.
The black dashed line in Figure 6.4 represents normal stresses, caused by the structural weight.Red and blue lines are the mean and periodic cycling stresses on the tensile and on thecompression side of an arbitrary tower. In many fatigue assessment cases, the highest evaluatedlifetime damage at a certain cross sectional point drives the necessary wall thickness of a wholetower section. Thereby, a decreased mean stress level decreases the reduction factor fm, whichleads to material savings. The factor is determined by Equation 6.3.
fm =
0.8 for σm ≤ −∆σ/2
0.9 + 0.2σm
∆σfor −∆σ/2 < σm < ∆σ/2
1.0 for σm ≥ ∆σ/2(6.3)
With increasing tower inclination against the wind direction, mean normal stresses on thecompression and tensile side will come closer to the normal stress caused by the structuralweight σm,W, such as implied in Figure 6.5.
133
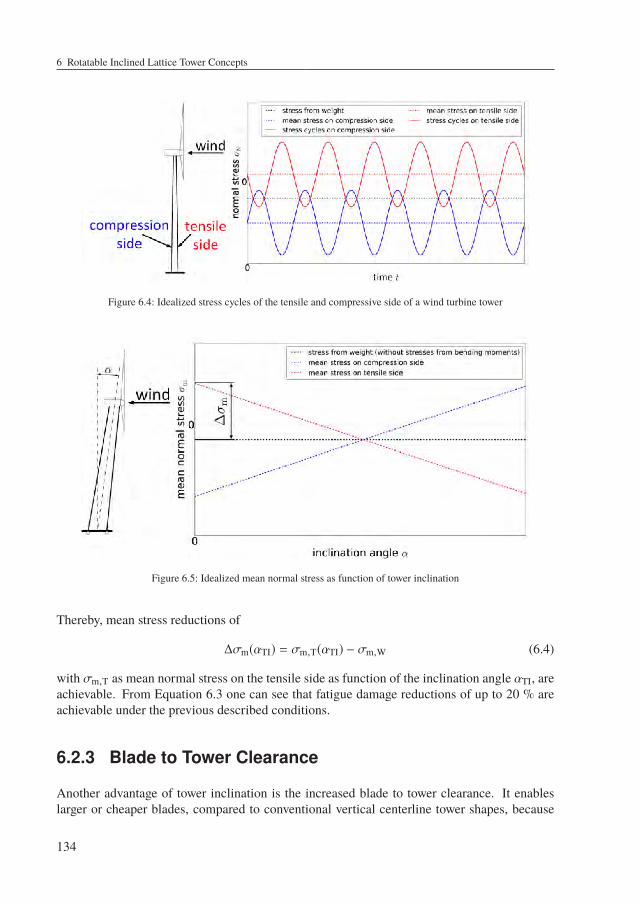
6 Rotatable Inclined Lattice Tower Concepts
Figure 6.4: Idealized stress cycles of the tensile and compressive side of a wind turbine tower
Figure 6.5: Idealized mean normal stress as function of tower inclination
Thereby, mean stress reductions of
∆σm(αTI) = σm,T(αTI) − σm,W (6.4)
with σm,T as mean normal stress on the tensile side as function of the inclination angle αTI, areachievable. From Equation 6.3 one can see that fatigue damage reductions of up to 20 % areachievable under the previous described conditions.
6.2.3 Blade to Tower Clearance
Another advantage of tower inclination is the increased blade to tower clearance. It enableslarger or cheaper blades, compared to conventional vertical centerline tower shapes, because
134
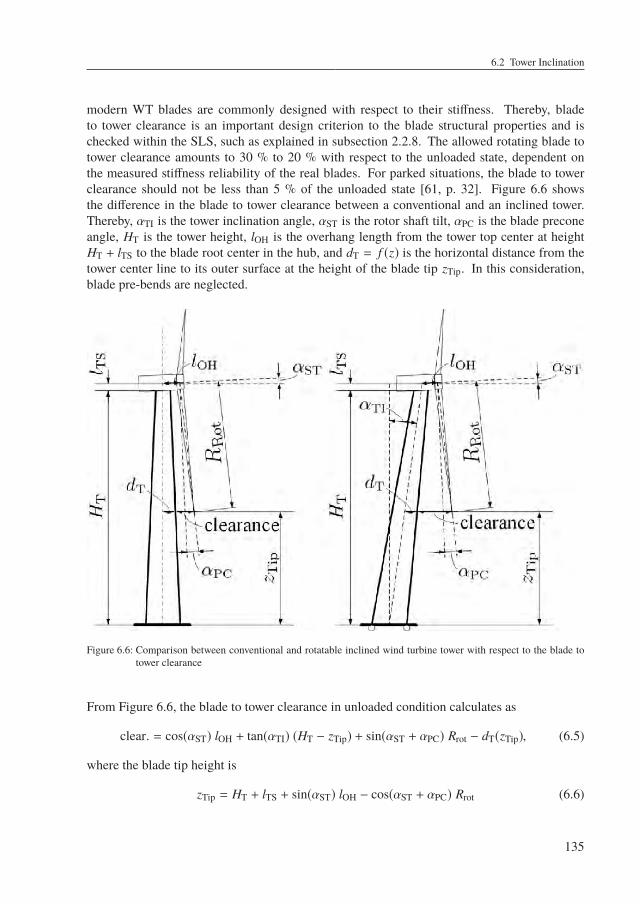
6.2 Tower Inclination
modern WT blades are commonly designed with respect to their stiffness. Thereby, bladeto tower clearance is an important design criterion to the blade structural properties and ischecked within the SLS, such as explained in subsection 2.2.8. The allowed rotating blade totower clearance amounts to 30 % to 20 % with respect to the unloaded state, dependent onthe measured stiffness reliability of the real blades. For parked situations, the blade to towerclearance should not be less than 5 % of the unloaded state [61, p. 32]. Figure 6.6 showsthe difference in the blade to tower clearance between a conventional and an inclined tower.Thereby, αTI is the tower inclination angle, αST is the rotor shaft tilt, αPC is the blade preconeangle, HT is the tower height, lOH is the overhang length from the tower top center at heightHT + lTS to the blade root center in the hub, and dT = f (z) is the horizontal distance from thetower center line to its outer surface at the height of the blade tip zTip. In this consideration,blade pre-bends are neglected.
Figure 6.6: Comparison between conventional and rotatable inclined wind turbine tower with respect to the blade totower clearance
From Figure 6.6, the blade to tower clearance in unloaded condition calculates as
clear. = cos(αST) lOH + tan(αTI) (HT − zTip) + sin(αST + αPC) Rrot − dT(zTip), (6.5)
where the blade tip height is
zTip = HT + lTS + sin(αST) lOH − cos(αST + αPC) Rrot (6.6)
135
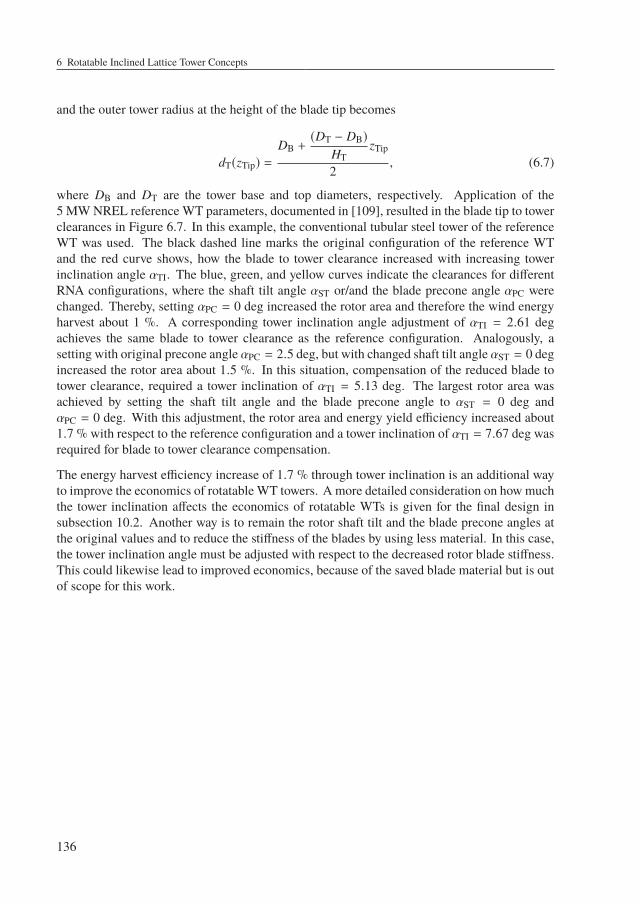
6 Rotatable Inclined Lattice Tower Concepts
and the outer tower radius at the height of the blade tip becomes
dT(zTip) =
DB +(DT − DB)
HTzTip
2, (6.7)
where DB and DT are the tower base and top diameters, respectively. Application of the5 MW NREL reference WT parameters, documented in [109], resulted in the blade tip to towerclearances in Figure 6.7. In this example, the conventional tubular steel tower of the referenceWT was used. The black dashed line marks the original configuration of the reference WTand the red curve shows, how the blade to tower clearance increased with increasing towerinclination angle αTI. The blue, green, and yellow curves indicate the clearances for differentRNA configurations, where the shaft tilt angle αST or/and the blade precone angle αPC werechanged. Thereby, setting αPC = 0 deg increased the rotor area and therefore the wind energyharvest about 1 %. A corresponding tower inclination angle adjustment of αTI = 2.61 degachieves the same blade to tower clearance as the reference configuration. Analogously, asetting with original precone angle αPC = 2.5 deg, but with changed shaft tilt angle αST = 0 degincreased the rotor area about 1.5 %. In this situation, compensation of the reduced blade totower clearance, required a tower inclination of αTI = 5.13 deg. The largest rotor area wasachieved by setting the shaft tilt angle and the blade precone angle to αST = 0 deg andαPC = 0 deg. With this adjustment, the rotor area and energy yield efficiency increased about1.7 % with respect to the reference configuration and a tower inclination of αTI = 7.67 deg wasrequired for blade to tower clearance compensation.
The energy harvest efficiency increase of 1.7 % through tower inclination is an additional wayto improve the economics of rotatable WT towers. A more detailed consideration on howmuchthe tower inclination affects the economics of rotatable WTs is given for the final design insubsection 10.2. Another way is to remain the rotor shaft tilt and the blade precone angles atthe original values and to reduce the stiffness of the blades by using less material. In this case,the tower inclination angle must be adjusted with respect to the decreased rotor blade stiffness.This could likewise lead to improved economics, because of the saved blade material but is outof scope for this work.
136
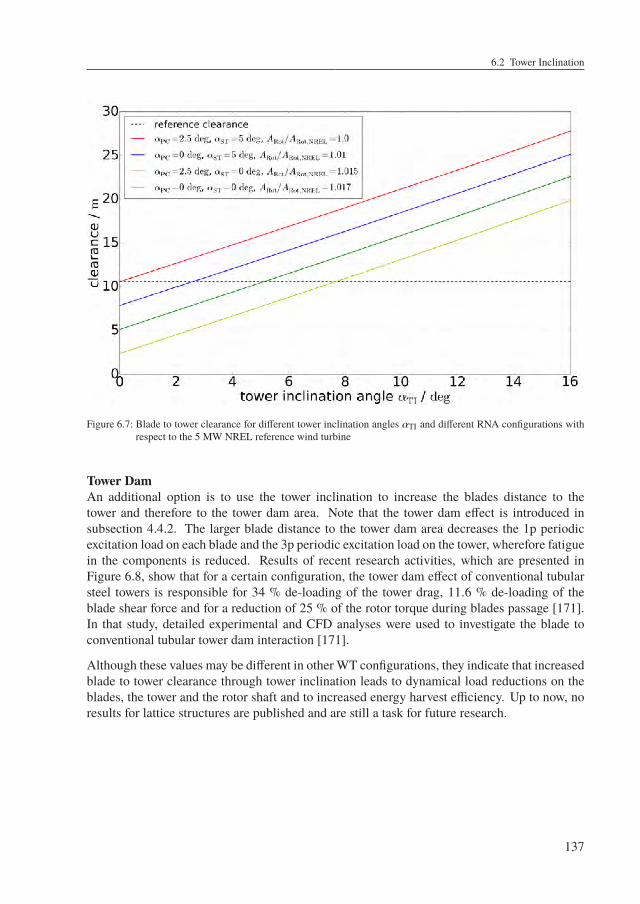
6.2 Tower Inclination
Figure 6.7: Blade to tower clearance for different tower inclination angles αTI and different RNA configurations withrespect to the 5 MW NREL reference wind turbine
Tower DamAn additional option is to use the tower inclination to increase the blades distance to thetower and therefore to the tower dam area. Note that the tower dam effect is introduced insubsection 4.4.2. The larger blade distance to the tower dam area decreases the 1p periodicexcitation load on each blade and the 3p periodic excitation load on the tower, wherefore fatiguein the components is reduced. Results of recent research activities, which are presented inFigure 6.8, show that for a certain configuration, the tower dam effect of conventional tubularsteel towers is responsible for 34 % de-loading of the tower drag, 11.6 % de-loading of theblade shear force and for a reduction of 25 % of the rotor torque during blades passage [171].In that study, detailed experimental and CFD analyses were used to investigate the blade toconventional tubular tower dam interaction [171].
Although these values may be different in other WT configurations, they indicate that increasedblade to tower clearance through tower inclination leads to dynamical load reductions on theblades, the tower and the rotor shaft and to increased energy harvest efficiency. Up to now, noresults for lattice structures are published and are still a task for future research.
137
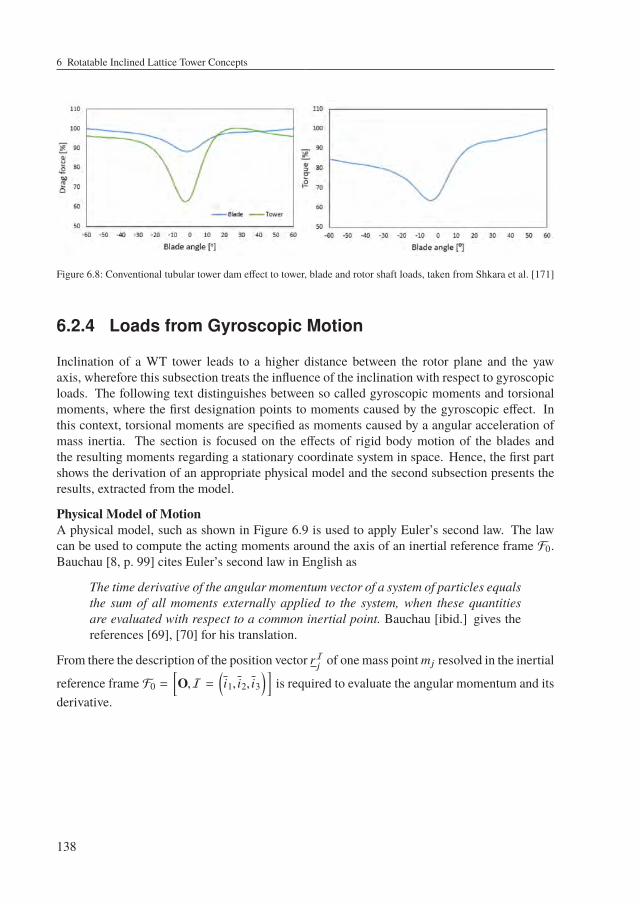
6 Rotatable Inclined Lattice Tower Concepts
Figure 6.8: Conventional tubular tower dam effect to tower, blade and rotor shaft loads, taken from Shkara et al. [171]
6.2.4 Loads from Gyroscopic Motion
Inclination of a WT tower leads to a higher distance between the rotor plane and the yawaxis, wherefore this subsection treats the influence of the inclination with respect to gyroscopicloads. The following text distinguishes between so called gyroscopic moments and torsionalmoments, where the first designation points to moments caused by the gyroscopic effect. Inthis context, torsional moments are specified as moments caused by a angular acceleration ofmass inertia. The section is focused on the effects of rigid body motion of the blades andthe resulting moments regarding a stationary coordinate system in space. Hence, the first partshows the derivation of an appropriate physical model and the second subsection presents theresults, extracted from the model.
Physical Model of MotionA physical model, such as shown in Figure 6.9 is used to apply Euler’s second law. The lawcan be used to compute the acting moments around the axis of an inertial reference frame F0.Bauchau [8, p. 99] cites Euler’s second law in English as
The time derivative of the angular momentum vector of a system of particles equalsthe sum of all moments externally applied to the system, when these quantitiesare evaluated with respect to a common inertial point. Bauchau [ibid.] gives thereferences [69], [70] for his translation.
From there the description of the position vector rIj of one mass point mj resolved in the inertial
reference frame F0 =[O,I =
(i1, i2, i3
)]is required to evaluate the angular momentum and its
derivative.
138
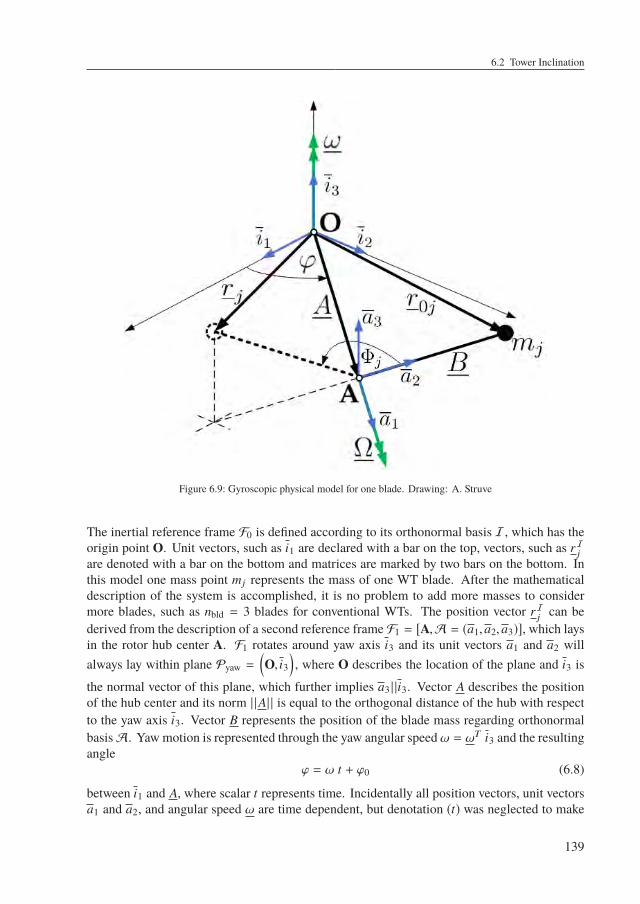
6.2 Tower Inclination
Figure 6.9: Gyroscopic physical model for one blade. Drawing: A. Struve
The inertial reference frame F0 is defined according to its orthonormal basis I, which has theorigin point O. Unit vectors, such as i1 are declared with a bar on the top, vectors, such as rIjare denoted with a bar on the bottom and matrices are marked by two bars on the bottom. Inthis model one mass point mj represents the mass of one WT blade. After the mathematicaldescription of the system is accomplished, it is no problem to add more masses to considermore blades, such as nbld = 3 blades for conventional WTs. The position vector rIj can bederived from the description of a second reference frame F1 = [A,A = (a1,a2,a3)], which laysin the rotor hub center A. F1 rotates around yaw axis i3 and its unit vectors a1 and a2 willalways lay within plane Pyaw =
(O, i3
), where O describes the location of the plane and i3 is
the normal vector of this plane, which further implies a3 | |i3. Vector A describes the positionof the hub center and its norm | |A| | is equal to the orthogonal distance of the hub with respectto the yaw axis i3. Vector B represents the position of the blade mass regarding orthonormalbasisA. Yaw motion is represented through the yaw angular speedω = ωT i3 and the resultingangle
ϕ = ω t + ϕ0 (6.8)
between i1 and A, where scalar t represents time. Incidentally all position vectors, unit vectorsa1 and a2, and angular speed ω are time dependent, but denotation (t) was neglected to make
139
6 Rotatable Inclined Lattice Tower Concepts
the equations more readable. The position rIj of mj resolved in F0 will be described through arotation of initial position vector rI0j around axis a1. The corresponding rotation angle is calledΦj and describes the rotation of blade j around the rotor axis resolved in reference frame F1.It is calculated through the rotor angular velocity Ω = ΩT aA1
Φj = Ω t + Φ0j (6.9)
whereΦ0j is equal to the initial angle of each blade j. Unit vectors aI1 , aI2 and aI3 are describedthrough a rotation tensor RI
ϕ, which brings orthonormal basis I to A. The corresponding
rotation tensor RIϕis defined as
RIϕ=I + sin(ϕ)i3 + (1 − cos(ϕ)) i3 i3
=
1 0 00 1 00 0 1
+
0 −Sϕ 0Sϕ 0 00 0 0
+−1 0 00 −1 00 0 0
+Cϕ 0 00 Cϕ 00 0 0
=
Cϕ −Sϕ 0Sϕ Cϕ 00 0 1
,(6.10)
where Sϕ and Cϕ are abbreviations for sin(ϕ) and cos(ϕ), respectively. The used notation (•)denotes the skew-symmetric matrix of a vector and can be used as alternative representation ofa cross product through a matrix multiplication. According to a rotation around axis i3, unitvectors of A resolved in I become
aI1 = RIϕ
i1 =©«CϕSϕ0
ª®®¬ (6.11)
aI2 = RIϕ
i2 =©«−SϕCϕ0
ª®®¬ (6.12)
aI3 = RIϕ
i3 =©«001
ª®®¬ (6.13)
140
6.2 Tower Inclination
The second rotation about axis aI1 , which describes the blade motion around the hub centertakes place through rotation tensor RI
j:
RIj=I + sin(Φj)aI1 +
(1 − cos(Φj)
)aI1 aI1
=
1 + S2
ϕ (1 − CΦ) Sϕ Cϕ (1 − CΦ) Sϕ SΦCϕ Sϕ (1 − CΦ) 1 + C2
ϕ (CΦ − 1) −Cϕ SΦ−Sϕ SΦ Cϕ SΦ 1 − S2
ϕC2ϕ +
(S2ϕ + C2
ϕ
)CΦ
,(6.14)
where SΦ and CΦ are abbreviations for sin(Φj) and cos(Φj), respectively. With initial positionvector rI0j
rI0j = aI1 | |A| | + aI2 | |B| | cos(Φ0) + aI3 | |B| | sin(Φ0) (6.15)
the complete motion of mj is described by
rIj = RIj
rI0j . (6.16)
The angular momentum LI with respect to the inertial reference frame F0 is the sum of alllinear moments pI
jwith respect to their position rIj . Following equations are written without
subscript I , because all corresponding variables are described in terms of the inertial referenceframe.
L =nbld∑j=1
r j × pj=
nbld∑j=1
mj r j × Ûr j . (6.17)
According to Euler’s second law a derivative with respect to time, denoted asddt= (Û•) leads to
the acting moments around the reference frame axes:
M = ÛL =nbld∑j=1
mj Ûr j × Ûr j +
nbld∑j=1
mj r j × Ür j =
nbld∑j=1
mj r j × Ür j
=
nbld∑j=1
mj rj Ür j =
nbld∑j=1
mj˜(Rj
r0j
) (ÜRj
r0j + 2 ÛRjÛr0j + R
jÜr0j
) (6.18)
The required derivatives of the initial position vector r0j are expressed as
Ûr0j =Ûa1 | |A| | + Ûa2 | |B| | cos(Φ0) (6.19)
Ür0j =Üa1 | |A| | + Üa2 | |B| | cos(Φ0), (6.20)
141
6 Rotatable Inclined Lattice Tower Concepts
where the derivatives of the corresponding unit vectors, which are given by Equations 6.11,6.12, and 6.13 are
Ûa1 =©«−Sϕ ( Ûω t + ω)Cϕ ( Ûω t + ω)
0
ª®®¬ (6.21)
Üa1 =©«−Cϕ ( Ûω t + ω)2 − Sϕ ( Üω t + 2 Ûω)−Sϕ ( Ûω t + ω)2 + Cϕ ( Üω t + 2 Ûω)
0
ª®®¬ (6.22)
Ûa2 =©«−Cϕ ( Ûω t + ω)−Sϕ ( Ûω t + ω)
0
ª®®¬ (6.23)
Üa2 =©«
Sϕ ( Ûω t + ω)2 − Cϕ ( Üω t + 2 Ûω)−Cϕ ( Ûω t + ω)2 − Sϕ ( Üω t + 2 Ûω)
0
ª®®¬ (6.24)
Ûa3 = Üa3 =©«000
ª®®¬ (6.25)
Furthermore, derivatives of the rotation tensor Rjare required to compute Equation 6.18. They
may be written as
ÛRj=
ddt
(I + sin(Φj)a1 +
(1 − cos(Φj)
)a1 a1
)=CΦ
(ÛΩ t +Ω
)a1 + SΦ Ûa1 + Ûa1 a1 + a1 Ûa1 + SΦ
(ÛΩ t +Ω
)a1 a1
− CΦ Ûa1 a1 − CΦ a1 Ûa1
(6.26)
ÜRj=
d2
dt2
(I + sin(Φj)a1 +
(1 − cos(Φj)
)a1 a1
)= − SΦ
(ÛΩ t +Ω
)2 a1 + CΦ(ÜΩ t + 2 ÛΩ
)a1 + 2 CΦ
(ÛΩ t +Ω
)Ûa1 + SΦ Üa1
+ Üa1 a1 + 2 Ûa1 Ûa1 + a1 Üa1 + CΦ(ÛΩ t +Ω
)2 a1 a1 + SΦ(ÜΩ t + 2 ÛΩ
)a1 a1
+ 2 SΦ(ÛΩ t +Ω
)Ûa1 a1 + 2 SΦ
(ÛΩ t +Ω
)a1 Ûa1 − CΦ Üa1 a1 − 2 CΦ Ûa1 Ûa1
− CΦ a1 Üa1
(6.27)
142
6.2 Tower Inclination
Finally the derivatives of the skew symmetric matrix of the unit vector a1 are given through
Ûa1 =ddt
©«
0 0 Sϕ0 0 −Cϕ−Sϕ Cϕ 0
ª®®¬
=
0 0 Cϕ ( Ûω t + ω)0 0 Sϕ ( Ûω t + ω)
−Cϕ ( Ûω t + ω) −Sϕ ( Ûω t + ω) 0
(6.28)
Üa1 =d2
dt2
©«
0 0 Sϕ0 0 −Cϕ−Sϕ Cϕ 0
ª®®¬
=
[0 0 −Sϕ ( Ûω t+ω)2+Cϕ ( Üω t+2 Ûω)0 0 Cϕ ( Ûω t+ω)2+Sϕ ( Üω t+2 Ûω)
Sϕ ( Ûω t+ω)2−Cϕ ( Üω t+2 Ûω) −Cϕ ( Ûω t+ω)2−Sϕ ( Üω t+2 Ûω) 0
] (6.29)
Model Application and ResultsFor the computation of the actingmoments, parameters of theNREL 5 MW definitionWT [109]were applied to the previous established model, depicted in Figure 6.9. Thereby, one of thenbld = 3 blade masses is equal to mj = 17,740 kg, the radius to the blade mass with respect tothe second mass moment of inertia JArot,a1
of one blade becomes
| |B| | =
√Jrot,aA1
mj=
√11,776,047 kg m2
17,740 kg= 25.76 m (6.30)
and the orthogonal hub distance from the yaw axis equals to | |A| |NREL = 5 m. The rotorrotational speed was chosen to be constant and equal to the rated rotational speed
Ω = 12.11
minmin60 s
2 π = 1.27rads
(6.31)
ÛΩ = ÜΩ = 0. (6.32)
Yaw motion is modelled by a certain acceleration from ω(t = 0 s) = 01sto ω(t = ∞) = ω∞ =
0.3
sπ
180through the following relation
ω(t) = ω∞(1 − e−αω t ) (6.33)
Ûω(t) = ω∞ αω e−αω t (6.34)
Üω(t) = −ω∞ α2ω e−αω t, (6.35)
where αω adjusts the steepness of the yaw acceleration curve. Figure 6.10 shows the resultswith respect to an arbitrary chosen αω = 2 for the first 5 seconds of rotor and yaw motion.
143
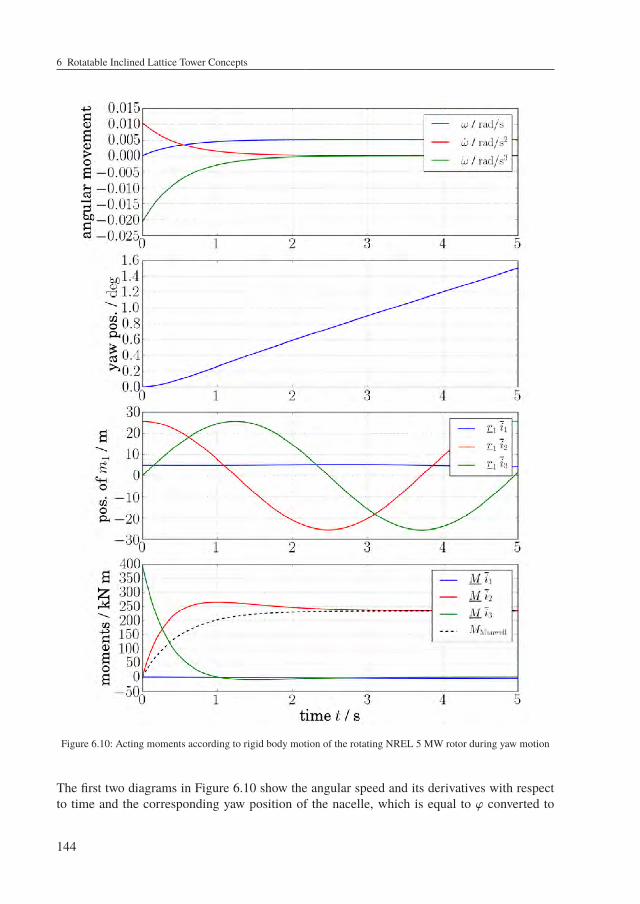
6 Rotatable Inclined Lattice Tower Concepts
Figure 6.10: Acting moments according to rigid body motion of the rotating NREL 5 MW rotor during yaw motion
The first two diagrams in Figure 6.10 show the angular speed and its derivatives with respectto time and the corresponding yaw position of the nacelle, which is equal to ϕ converted to
144
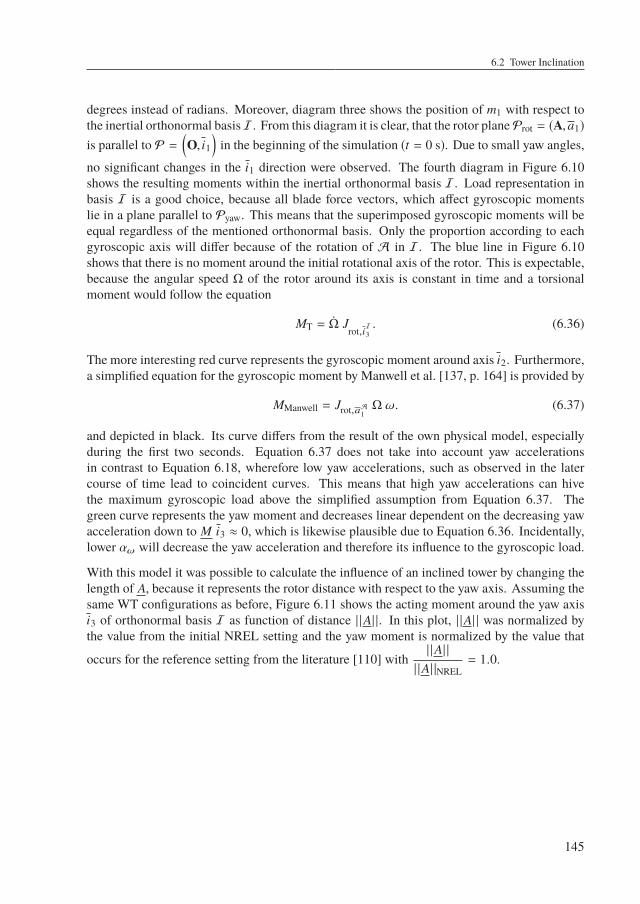
6.2 Tower Inclination
degrees instead of radians. Moreover, diagram three shows the position of m1 with respect tothe inertial orthonormal basisI. From this diagram it is clear, that the rotor plane Prot = (A,a1)
is parallel to P =(O, i1
)in the beginning of the simulation (t = 0 s). Due to small yaw angles,
no significant changes in the i1 direction were observed. The fourth diagram in Figure 6.10shows the resulting moments within the inertial orthonormal basis I. Load representation inbasis I is a good choice, because all blade force vectors, which affect gyroscopic momentslie in a plane parallel to Pyaw. This means that the superimposed gyroscopic moments will beequal regardless of the mentioned orthonormal basis. Only the proportion according to eachgyroscopic axis will differ because of the rotation of A in I. The blue line in Figure 6.10shows that there is no moment around the initial rotational axis of the rotor. This is expectable,because the angular speed Ω of the rotor around its axis is constant in time and a torsionalmoment would follow the equation
MT = ÛΩ Jrot,iI3
. (6.36)
The more interesting red curve represents the gyroscopic moment around axis i2. Furthermore,a simplified equation for the gyroscopic moment by Manwell et al. [137, p. 164] is provided by
MManwell = Jrot,aA1Ω ω. (6.37)
and depicted in black. Its curve differs from the result of the own physical model, especiallyduring the first two seconds. Equation 6.37 does not take into account yaw accelerationsin contrast to Equation 6.18, wherefore low yaw accelerations, such as observed in the latercourse of time lead to coincident curves. This means that high yaw accelerations can hivethe maximum gyroscopic load above the simplified assumption from Equation 6.37. Thegreen curve represents the yaw moment and decreases linear dependent on the decreasing yawacceleration down to M i3 ≈ 0, which is likewise plausible due to Equation 6.36. Incidentally,lower αω will decrease the yaw acceleration and therefore its influence to the gyroscopic load.
With this model it was possible to calculate the influence of an inclined tower by changing thelength of A, because it represents the rotor distance with respect to the yaw axis. Assuming thesame WT configurations as before, Figure 6.11 shows the acting moment around the yaw axisi3 of orthonormal basis I as function of distance | |A| |. In this plot, | |A| | was normalized bythe value from the initial NREL setting and the yaw moment is normalized by the value that
occurs for the reference setting from the literature [110] with| |A| || |A| |NREL
= 1.0.
145
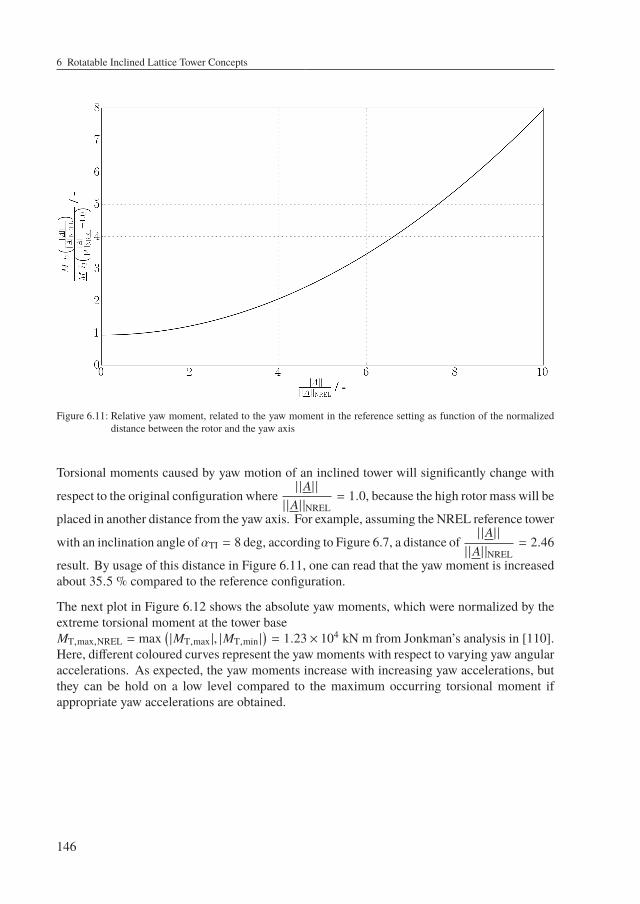
6 Rotatable Inclined Lattice Tower Concepts
Figure 6.11: Relative yaw moment, related to the yaw moment in the reference setting as function of the normalizeddistance between the rotor and the yaw axis
Torsional moments caused by yaw motion of an inclined tower will significantly change with
respect to the original configuration where| |A| || |A| |NREL
= 1.0, because the high rotor mass will be
placed in another distance from the yaw axis. For example, assuming the NREL reference tower
with an inclination angle of αTI = 8 deg, according to Figure 6.7, a distance of| |A| || |A| |NREL
= 2.46
result. By usage of this distance in Figure 6.11, one can read that the yaw moment is increasedabout 35.5 % compared to the reference configuration.
The next plot in Figure 6.12 shows the absolute yaw moments, which were normalized by theextreme torsional moment at the tower baseMT,max,NREL = max
(|MT,max |, |MT,min |
)= 1.23× 10⁴ kN m from Jonkman’s analysis in [110].
Here, different coloured curves represent the yaw moments with respect to varying yaw angularaccelerations. As expected, the yaw moments increase with increasing yaw accelerations, butthey can be hold on a low level compared to the maximum occurring torsional moment ifappropriate yaw accelerations are obtained.
146
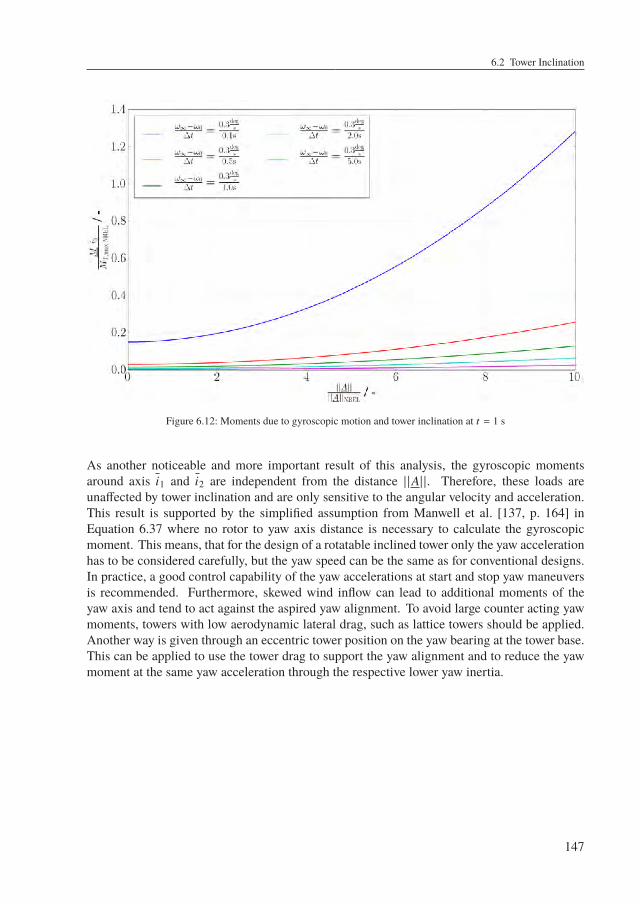
6.2 Tower Inclination
Figure 6.12: Moments due to gyroscopic motion and tower inclination at t = 1 s
As another noticeable and more important result of this analysis, the gyroscopic momentsaround axis i1 and i2 are independent from the distance | |A| |. Therefore, these loads areunaffected by tower inclination and are only sensitive to the angular velocity and acceleration.This result is supported by the simplified assumption from Manwell et al. [137, p. 164] inEquation 6.37 where no rotor to yaw axis distance is necessary to calculate the gyroscopicmoment. This means, that for the design of a rotatable inclined tower only the yaw accelerationhas to be considered carefully, but the yaw speed can be the same as for conventional designs.In practice, a good control capability of the yaw accelerations at start and stop yaw maneuversis recommended. Furthermore, skewed wind inflow can lead to additional moments of theyaw axis and tend to act against the aspired yaw alignment. To avoid large counter acting yawmoments, towers with low aerodynamic lateral drag, such as lattice towers should be applied.Another way is given through an eccentric tower position on the yaw bearing at the tower base.This can be applied to use the tower drag to support the yaw alignment and to reduce the yawmoment at the same yaw acceleration through the respective lower yaw inertia.
147
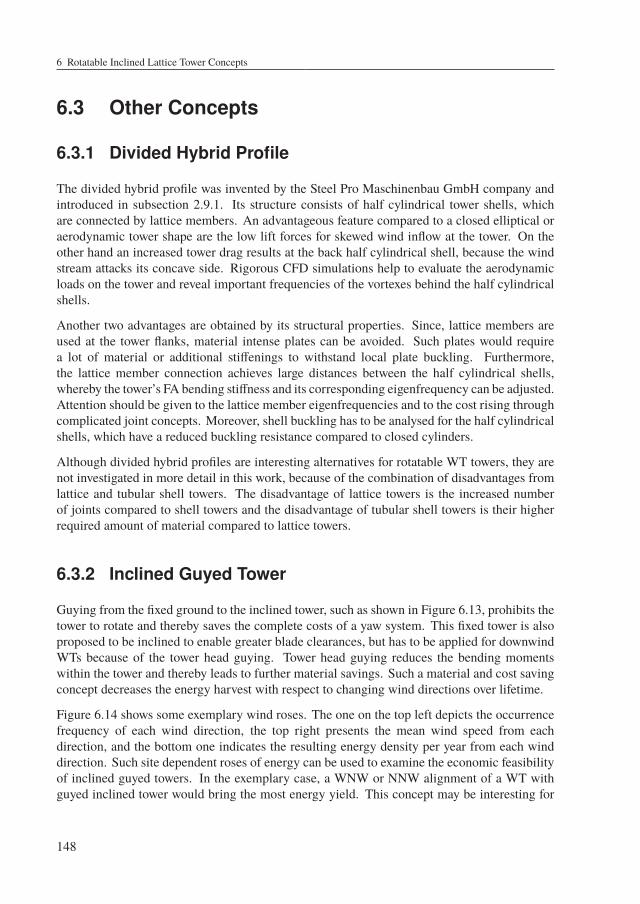
6 Rotatable Inclined Lattice Tower Concepts
6.3 Other Concepts
6.3.1 Divided Hybrid Profile
The divided hybrid profile was invented by the Steel Pro Maschinenbau GmbH company andintroduced in subsection 2.9.1. Its structure consists of half cylindrical tower shells, whichare connected by lattice members. An advantageous feature compared to a closed elliptical oraerodynamic tower shape are the low lift forces for skewed wind inflow at the tower. On theother hand an increased tower drag results at the back half cylindrical shell, because the windstream attacks its concave side. Rigorous CFD simulations help to evaluate the aerodynamicloads on the tower and reveal important frequencies of the vortexes behind the half cylindricalshells.
Another two advantages are obtained by its structural properties. Since, lattice members areused at the tower flanks, material intense plates can be avoided. Such plates would requirea lot of material or additional stiffenings to withstand local plate buckling. Furthermore,the lattice member connection achieves large distances between the half cylindrical shells,whereby the tower’s FA bending stiffness and its corresponding eigenfrequency can be adjusted.Attention should be given to the lattice member eigenfrequencies and to the cost rising throughcomplicated joint concepts. Moreover, shell buckling has to be analysed for the half cylindricalshells, which have a reduced buckling resistance compared to closed cylinders.
Although divided hybrid profiles are interesting alternatives for rotatable WT towers, they arenot investigated in more detail in this work, because of the combination of disadvantages fromlattice and tubular shell towers. The disadvantage of lattice towers is the increased numberof joints compared to shell towers and the disadvantage of tubular shell towers is their higherrequired amount of material compared to lattice towers.
6.3.2 Inclined Guyed Tower
Guying from the fixed ground to the inclined tower, such as shown in Figure 6.13, prohibits thetower to rotate and thereby saves the complete costs of a yaw system. This fixed tower is alsoproposed to be inclined to enable greater blade clearances, but has to be applied for downwindWTs because of the tower head guying. Tower head guying reduces the bending momentswithin the tower and thereby leads to further material savings. Such a material and cost savingconcept decreases the energy harvest with respect to changing wind directions over lifetime.
Figure 6.14 shows some exemplary wind roses. The one on the top left depicts the occurrencefrequency of each wind direction, the top right presents the mean wind speed from eachdirection, and the bottom one indicates the resulting energy density per year from each winddirection. Such site dependent roses of energy can be used to examine the economic feasibilityof inclined guyed towers. In the exemplary case, a WNW or NNW alignment of a WT withguyed inclined tower would bring the most energy yield. This concept may be interesting for
148
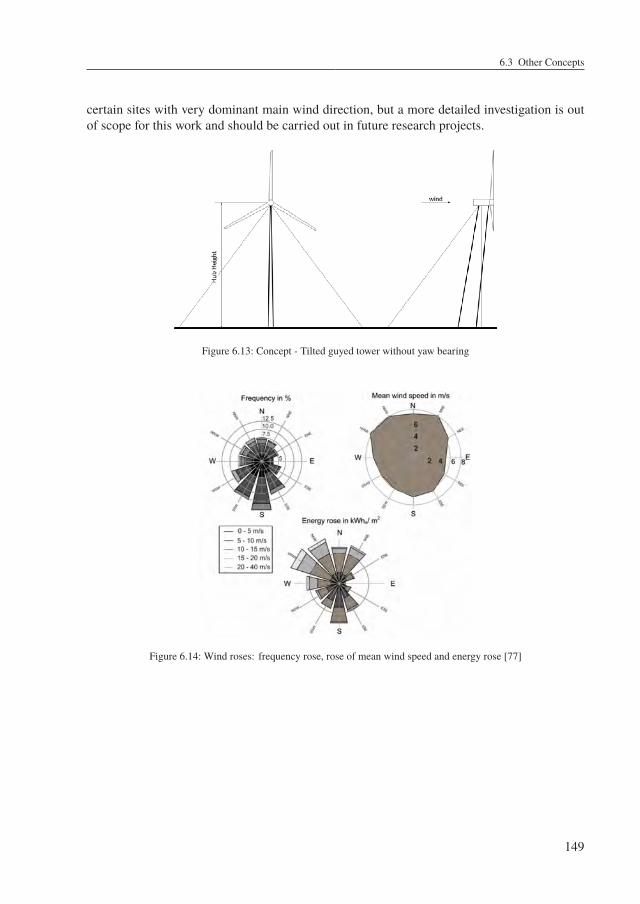
6.3 Other Concepts
certain sites with very dominant main wind direction, but a more detailed investigation is outof scope for this work and should be carried out in future research projects.
Figure 6.13: Concept - Tilted guyed tower without yaw bearing
Figure 6.14: Wind roses: frequency rose, rose of mean wind speed and energy rose [77]
149

7 Rotatable Inclined Lattice TowerDesign
7.1 Conceptual Specifications
This section describes the general concept and its parameters to be investigated in more detailthroughout the following chapters. Thereby, the first subsection 7.1.1 treats the shape andparameters of the chosen rotatable inclined lattice tower concept, the following subsection 7.1.3describes the chosen member profiles in more detail, and the last two subsections 7.1.4 and7.1.2 treat the conceptual joint details and the nacelle attachment.
7.1.1 Shape and Parameters of the Rotatable InclinedLattice Tower
The decision for the amount of lattice tower legs is an optimization problem with manyparameters. In this work, a four legged rectangular lattice tower cross section was investigatedfor the following reasons:
• Relatively low amount of joints, which means less assembling costs, less bolts andtherefore reduced purchase costs, and less maintenance with respect to tower crosssections with more legs
• Relatively torsional stiff compared to triangular tower cross sections
• Lower bracing member buckling lengths compared to triangular cross sections
• The tower top shape resembles the rectangular shape of common machine foundationsand provides an appropriate space for the oblong arranged nacelle components
Other tower cross sections may be more material efficient, but have to be investigated in futureresearch projects. Figure 7.1 shows the intended rotatable inclined lattice tower concept withits dimensions. Thereby, a linear tower inclination and tower taper was chosen with respect tothe almost linear bending moment distribution, which is mainly driven by the rotor thrust. Thetower drag induced nonlinear part of the tower bending moment was assumed to be smallercompared to a tubular shell concept. Furthermore, a linear tower inclination and taper requiresless design parameters and is therefore more appropriate in terms of this preliminary work. X-bracings were used along the whole height of the tower in contrast to the Butzkies lattice tower
151
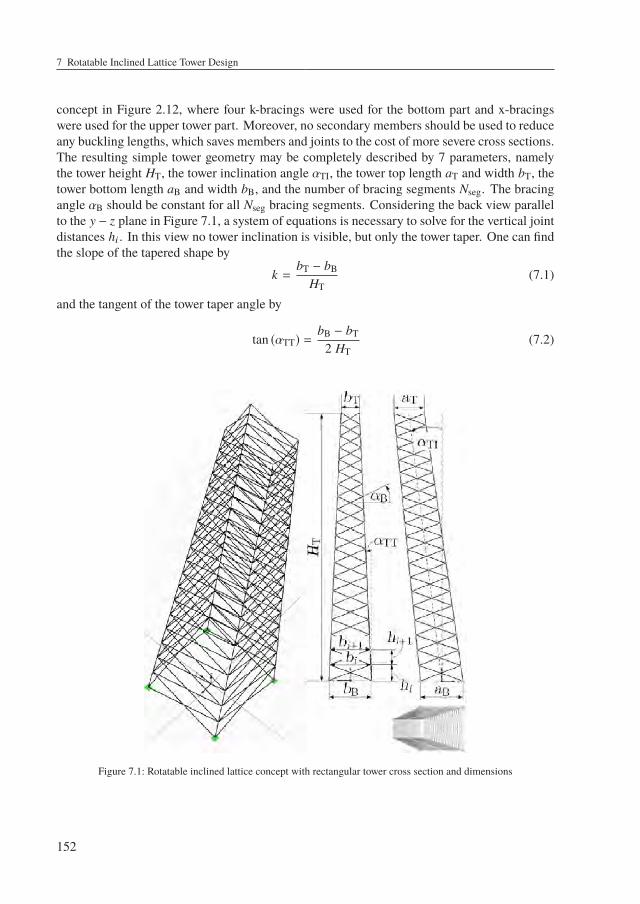
7 Rotatable Inclined Lattice Tower Design
concept in Figure 2.12, where four k-bracings were used for the bottom part and x-bracingswere used for the upper tower part. Moreover, no secondary members should be used to reduceany buckling lengths, which saves members and joints to the cost of more severe cross sections.The resulting simple tower geometry may be completely described by 7 parameters, namelythe tower height HT, the tower inclination angle αTI, the tower top length aT and width bT, thetower bottom length aB and width bB, and the number of bracing segments Nseg. The bracingangle αB should be constant for all Nseg bracing segments. Considering the back view parallelto the y − z plane in Figure 7.1, a system of equations is necessary to solve for the vertical jointdistances hi . In this view no tower inclination is visible, but only the tower taper. One can findthe slope of the tapered shape by
k =bT − bB
HT(7.1)
and the tangent of the tower taper angle by
tan (αTT) =bB − bT
2 HT(7.2)
Figure 7.1: Rotatable inclined lattice concept with rectangular tower cross section and dimensions
152
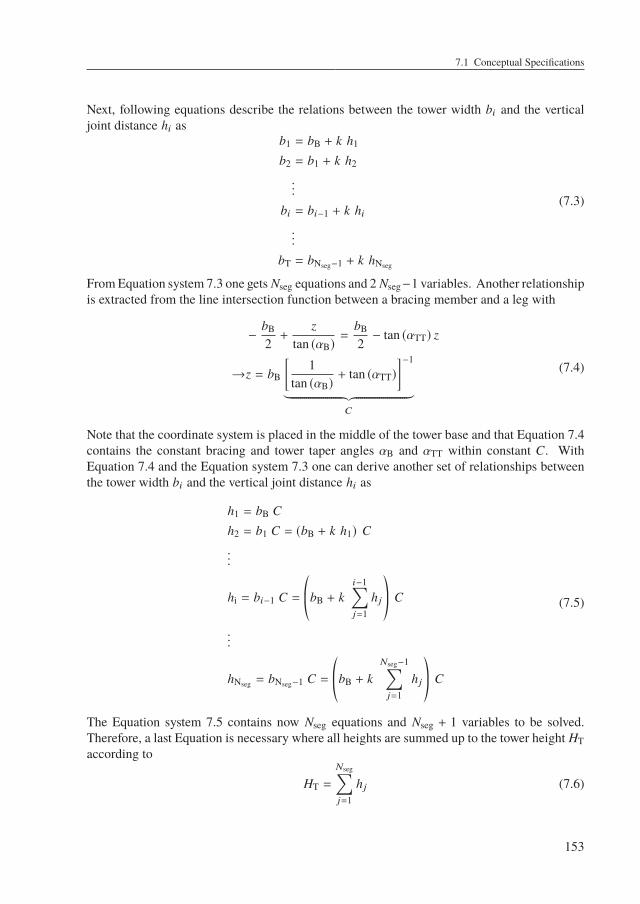
7.1 Conceptual Specifications
Next, following equations describe the relations between the tower width bi and the verticaljoint distance hi as
b1 = bB + k h1
b2 = b1 + k h2
...
bi = bi−1 + k hi...
bT = bNseg−1 + k hNseg
(7.3)
FromEquation system 7.3 one gets Nseg equations and 2 Nseg−1 variables. Another relationshipis extracted from the line intersection function between a bracing member and a leg with
−bB
2+
ztan (αB)
=bB
2− tan (αTT) z
→z = bB
[1
tan (αB)+ tan (αTT)
]−1
︸ ︷︷ ︸C
(7.4)
Note that the coordinate system is placed in the middle of the tower base and that Equation 7.4contains the constant bracing and tower taper angles αB and αTT within constant C. WithEquation 7.4 and the Equation system 7.3 one can derive another set of relationships betweenthe tower width bi and the vertical joint distance hi as
h1 = bB C
h2 = b1 C = (bB + k h1) C...
hi = bi−1 C = ©«bB + ki−1∑j=1
hjª®¬ C
...
hNseg = bNseg−1 C = ©«bB + kNseg−1∑j=1
hjª®¬ C
(7.5)
The Equation system 7.5 contains now Nseg equations and Nseg + 1 variables to be solved.Therefore, a last Equation is necessary where all heights are summed up to the tower height HTaccording to
HT =
Nseg∑j=1
hj (7.6)
153
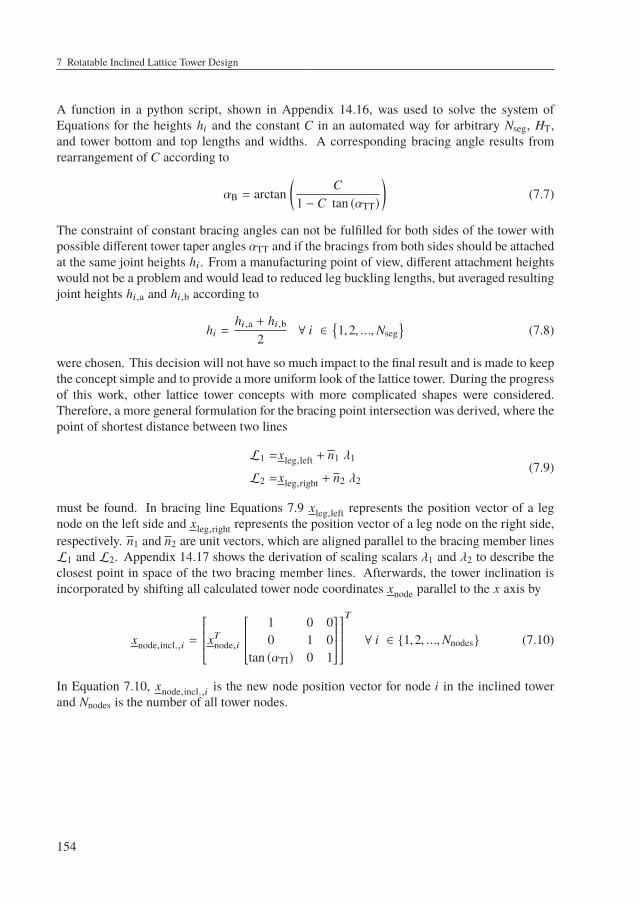
7 Rotatable Inclined Lattice Tower Design
A function in a python script, shown in Appendix 14.16, was used to solve the system ofEquations for the heights hi and the constant C in an automated way for arbitrary Nseg, HT,and tower bottom and top lengths and widths. A corresponding bracing angle results fromrearrangement of C according to
αB = arctan(
C1 − C tan (αTT)
)(7.7)
The constraint of constant bracing angles can not be fulfilled for both sides of the tower withpossible different tower taper angles αTT and if the bracings from both sides should be attachedat the same joint heights hi . From a manufacturing point of view, different attachment heightswould not be a problem and would lead to reduced leg buckling lengths, but averaged resultingjoint heights hi,a and hi,b according to
hi =hi,a + hi,b
2∀ i ∈
1,2, ...,Nseg
(7.8)
were chosen. This decision will not have so much impact to the final result and is made to keepthe concept simple and to provide a more uniform look of the lattice tower. During the progressof this work, other lattice tower concepts with more complicated shapes were considered.Therefore, a more general formulation for the bracing point intersection was derived, where thepoint of shortest distance between two lines
L1 =xleg,left + n1 λ1
L2 =xleg,right + n2 λ2(7.9)
must be found. In bracing line Equations 7.9 xleg,left represents the position vector of a legnode on the left side and xleg,right represents the position vector of a leg node on the right side,respectively. n1 and n2 are unit vectors, which are aligned parallel to the bracing member linesL1 and L2. Appendix 14.17 shows the derivation of scaling scalars λ1 and λ2 to describe theclosest point in space of the two bracing member lines. Afterwards, the tower inclination isincorporated by shifting all calculated tower node coordinates xnode parallel to the x axis by
xnode,incl.,i =
xTnode,i
1 0 00 1 0
tan (αTI) 0 1
T
∀ i ∈ 1,2, ...,Nnodes (7.10)
In Equation 7.10, xnode,incl.,i is the new node position vector for node i in the inclined towerand Nnodes is the number of all tower nodes.
154
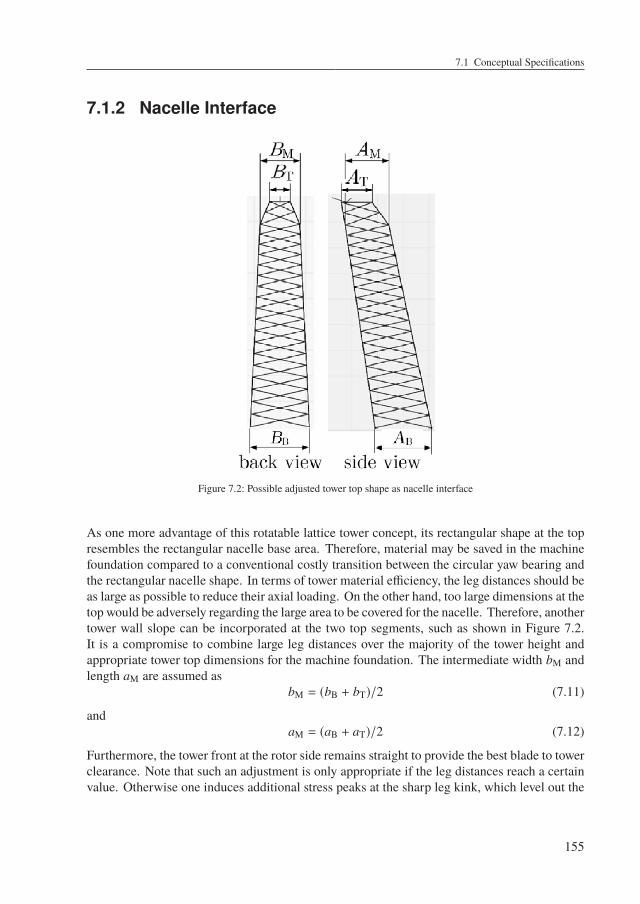
7.1 Conceptual Specifications
7.1.2 Nacelle Interface
Figure 7.2: Possible adjusted tower top shape as nacelle interface
As one more advantage of this rotatable lattice tower concept, its rectangular shape at the topresembles the rectangular nacelle base area. Therefore, material may be saved in the machinefoundation compared to a conventional costly transition between the circular yaw bearing andthe rectangular nacelle shape. In terms of tower material efficiency, the leg distances should beas large as possible to reduce their axial loading. On the other hand, too large dimensions at thetop would be adversely regarding the large area to be covered for the nacelle. Therefore, anothertower wall slope can be incorporated at the two top segments, such as shown in Figure 7.2.It is a compromise to combine large leg distances over the majority of the tower height andappropriate tower top dimensions for the machine foundation. The intermediate width bM andlength aM are assumed as
bM = (bB + bT)/2 (7.11)
andaM = (aB + aT)/2 (7.12)
Furthermore, the tower front at the rotor side remains straight to provide the best blade to towerclearance. Note that such an adjustment is only appropriate if the leg distances reach a certainvalue. Otherwise one induces additional stress peaks at the sharp leg kink, which level out the
155
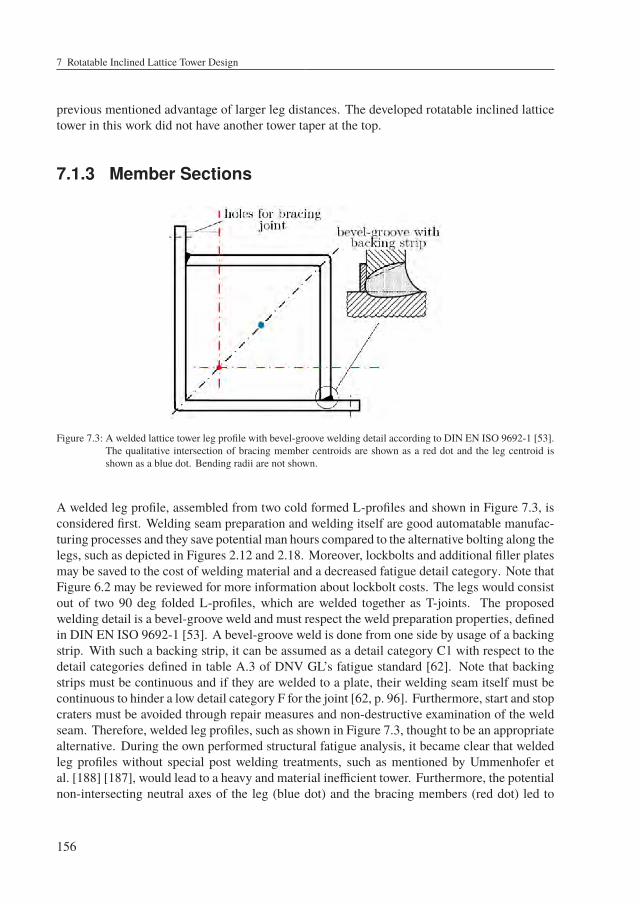
7 Rotatable Inclined Lattice Tower Design
previous mentioned advantage of larger leg distances. The developed rotatable inclined latticetower in this work did not have another tower taper at the top.
7.1.3 Member Sections
Figure 7.3: A welded lattice tower leg profile with bevel-groove welding detail according to DIN EN ISO 9692-1 [53].The qualitative intersection of bracing member centroids are shown as a red dot and the leg centroid isshown as a blue dot. Bending radii are not shown.
A welded leg profile, assembled from two cold formed L-profiles and shown in Figure 7.3, isconsidered first. Welding seam preparation and welding itself are good automatable manufac-turing processes and they save potential man hours compared to the alternative bolting along thelegs, such as depicted in Figures 2.12 and 2.18. Moreover, lockbolts and additional filler platesmay be saved to the cost of welding material and a decreased fatigue detail category. Note thatFigure 6.2 may be reviewed for more information about lockbolt costs. The legs would consistout of two 90 deg folded L-profiles, which are welded together as T-joints. The proposedwelding detail is a bevel-groove weld and must respect the weld preparation properties, definedin DIN EN ISO 9692-1 [53]. A bevel-groove weld is done from one side by usage of a backingstrip. With such a backing strip, it can be assumed as a detail category C1 with respect to thedetail categories defined in table A.3 of DNV GL’s fatigue standard [62]. Note that backingstrips must be continuous and if they are welded to a plate, their welding seam itself must becontinuous to hinder a low detail category F for the joint [62, p. 96]. Furthermore, start and stopcraters must be avoided through repair measures and non-destructive examination of the weldseam. Therefore, welded leg profiles, such as shown in Figure 7.3, thought to be an appropriatealternative. During the own performed structural fatigue analysis, it became clear that weldedleg profiles without special post welding treatments, such as mentioned by Ummenhofer etal. [188] [187], would lead to a heavy and material inefficient tower. Furthermore, the potentialnon-intersecting neutral axes of the leg (blue dot) and the bracing members (red dot) led to
156
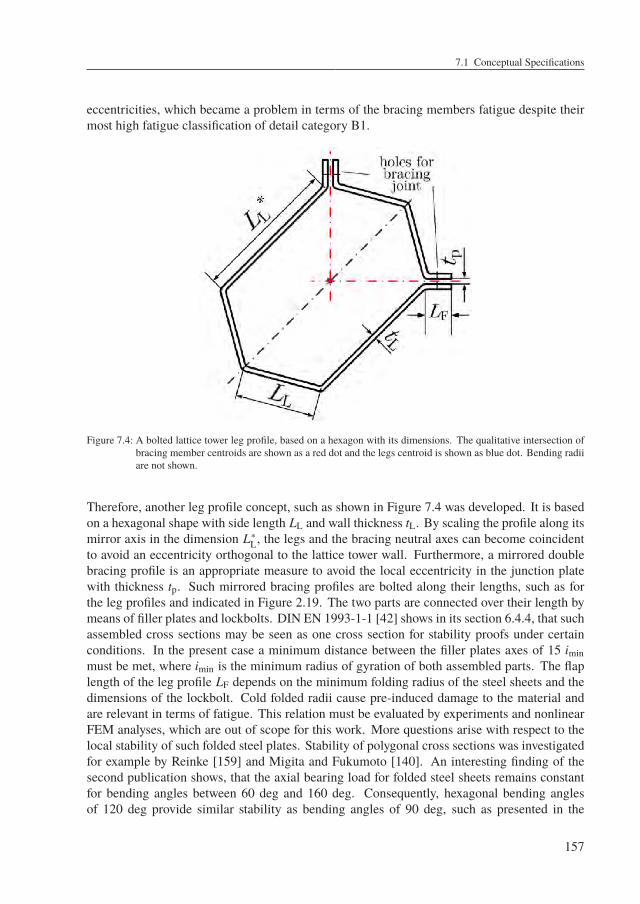
7.1 Conceptual Specifications
eccentricities, which became a problem in terms of the bracing members fatigue despite theirmost high fatigue classification of detail category B1.
Figure 7.4: A bolted lattice tower leg profile, based on a hexagon with its dimensions. The qualitative intersection ofbracing member centroids are shown as a red dot and the legs centroid is shown as blue dot. Bending radiiare not shown.
Therefore, another leg profile concept, such as shown in Figure 7.4 was developed. It is basedon a hexagonal shape with side length LL and wall thickness tL. By scaling the profile along itsmirror axis in the dimension L∗L, the legs and the bracing neutral axes can become coincidentto avoid an eccentricity orthogonal to the lattice tower wall. Furthermore, a mirrored doublebracing profile is an appropriate measure to avoid the local eccentricity in the junction platewith thickness tp. Such mirrored bracing profiles are bolted along their lengths, such as forthe leg profiles and indicated in Figure 2.19. The two parts are connected over their length bymeans of filler plates and lockbolts. DIN EN 1993-1-1 [42] shows in its section 6.4.4, that suchassembled cross sections may be seen as one cross section for stability proofs under certainconditions. In the present case a minimum distance between the filler plates axes of 15 iminmust be met, where imin is the minimum radius of gyration of both assembled parts. The flaplength of the leg profile LF depends on the minimum folding radius of the steel sheets and thedimensions of the lockbolt. Cold folded radii cause pre-induced damage to the material andare relevant in terms of fatigue. This relation must be evaluated by experiments and nonlinearFEM analyses, which are out of scope for this work. More questions arise with respect to thelocal stability of such folded steel plates. Stability of polygonal cross sections was investigatedfor example by Reinke [159] and Migita and Fukumoto [140]. An interesting finding of thesecond publication shows, that the axial bearing load for folded steel sheets remains constantfor bending angles between 60 deg and 160 deg. Consequently, hexagonal bending anglesof 120 deg provide similar stability as bending angles of 90 deg, such as presented in the
157
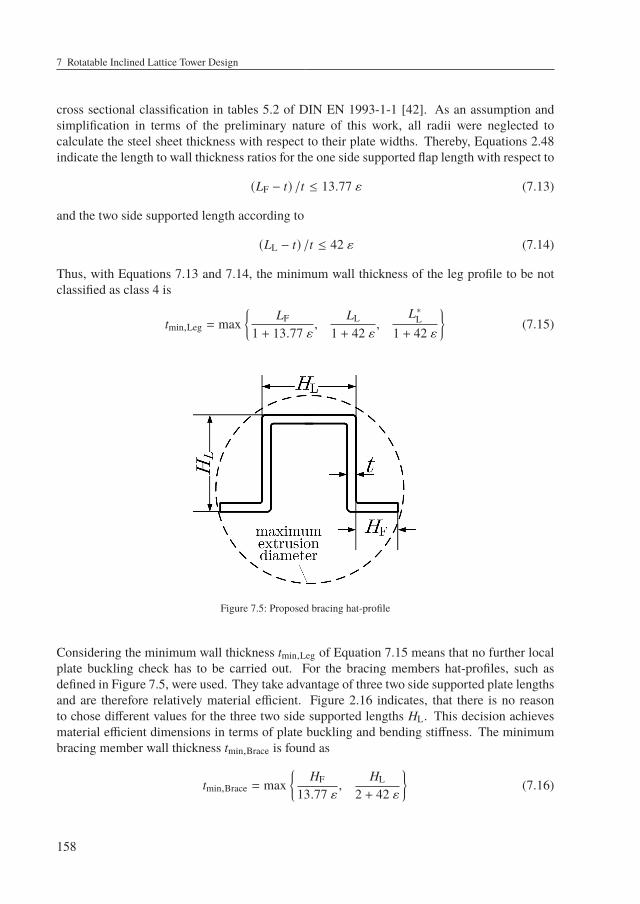
7 Rotatable Inclined Lattice Tower Design
cross sectional classification in tables 5.2 of DIN EN 1993-1-1 [42]. As an assumption andsimplification in terms of the preliminary nature of this work, all radii were neglected tocalculate the steel sheet thickness with respect to their plate widths. Thereby, Equations 2.48indicate the length to wall thickness ratios for the one side supported flap length with respect to
(LF − t) /t ≤ 13.77 ε (7.13)
and the two side supported length according to
(LL − t) /t ≤ 42 ε (7.14)
Thus, with Equations 7.13 and 7.14, the minimum wall thickness of the leg profile to be notclassified as class 4 is
tmin,Leg = max
LF
1 + 13.77 ε,
LL
1 + 42 ε,
L∗L1 + 42 ε
(7.15)
Figure 7.5: Proposed bracing hat-profile
Considering the minimum wall thickness tmin,Leg of Equation 7.15 means that no further localplate buckling check has to be carried out. For the bracing members hat-profiles, such asdefined in Figure 7.5, were used. They take advantage of three two side supported plate lengthsand are therefore relatively material efficient. Figure 2.16 indicates, that there is no reasonto chose different values for the three two side supported lengths HL. This decision achievesmaterial efficient dimensions in terms of plate buckling and bending stiffness. The minimumbracing member wall thickness tmin,Brace is found as
tmin,Brace = max
HF
13.77 ε,
HL
2 + 42 ε
(7.16)
158
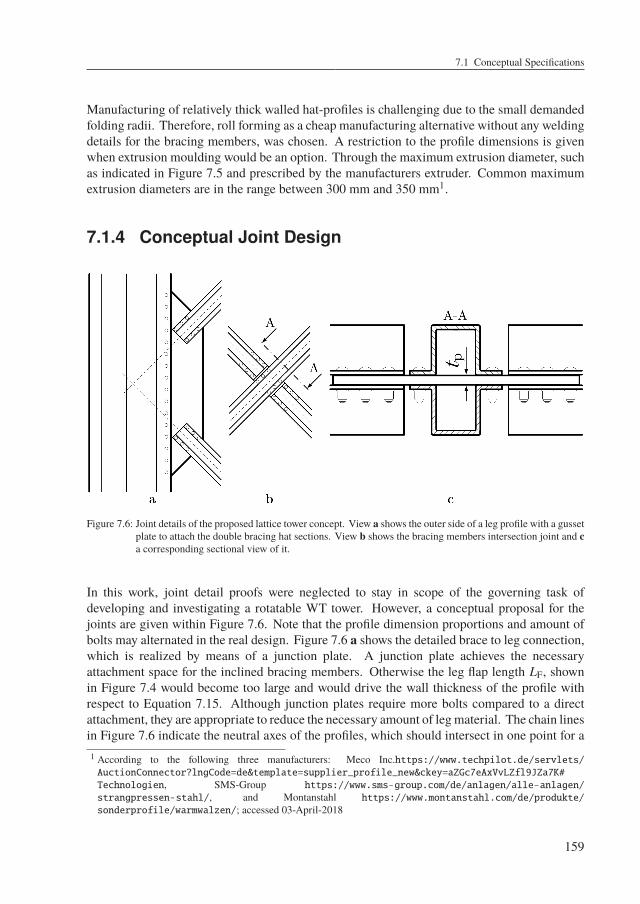
7.1 Conceptual Specifications
Manufacturing of relatively thick walled hat-profiles is challenging due to the small demandedfolding radii. Therefore, roll forming as a cheap manufacturing alternative without any weldingdetails for the bracing members, was chosen. A restriction to the profile dimensions is givenwhen extrusion moulding would be an option. Through the maximum extrusion diameter, suchas indicated in Figure 7.5 and prescribed by the manufacturers extruder. Common maximumextrusion diameters are in the range between 300 mm and 350 mm1.
7.1.4 Conceptual Joint Design
Figure 7.6: Joint details of the proposed lattice tower concept. View a shows the outer side of a leg profile with a gussetplate to attach the double bracing hat sections. View b shows the bracing members intersection joint and ca corresponding sectional view of it.
In this work, joint detail proofs were neglected to stay in scope of the governing task ofdeveloping and investigating a rotatable WT tower. However, a conceptual proposal for thejoints are given within Figure 7.6. Note that the profile dimension proportions and amount ofbolts may alternated in the real design. Figure 7.6 a shows the detailed brace to leg connection,which is realized by means of a junction plate. A junction plate achieves the necessaryattachment space for the inclined bracing members. Otherwise the leg flap length LF, shownin Figure 7.4 would become too large and would drive the wall thickness of the profile withrespect to Equation 7.15. Although junction plates require more bolts compared to a directattachment, they are appropriate to reduce the necessary amount of legmaterial. The chain linesin Figure 7.6 indicate the neutral axes of the profiles, which should intersect in one point for a1 According to the following three manufacturers: Meco Inc.https://www.techpilot.de/servlets/AuctionConnector?lngCode=de&template=supplier_profile_new&ckey=aZGc7eAxVvLZfl9JZa7K#Technologien, SMS-Group https://www.sms-group.com/de/anlagen/alle-anlagen/strangpressen-stahl/, and Montanstahl https://www.montanstahl.com/de/produkte/sonderprofile/warmwalzen/; accessed 03-April-2018
159
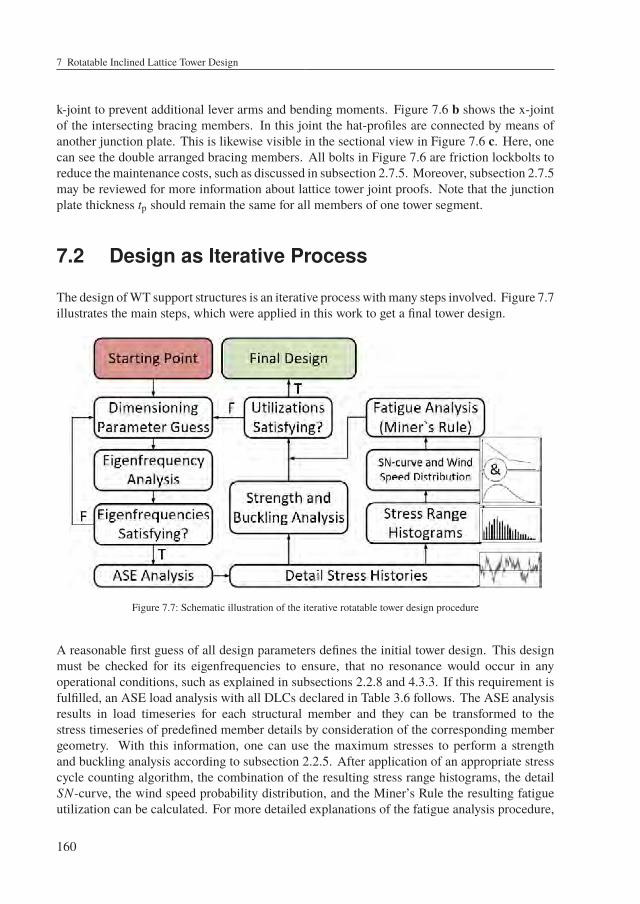
7 Rotatable Inclined Lattice Tower Design
k-joint to prevent additional lever arms and bending moments. Figure 7.6 b shows the x-jointof the intersecting bracing members. In this joint the hat-profiles are connected by means ofanother junction plate. This is likewise visible in the sectional view in Figure 7.6 c. Here, onecan see the double arranged bracing members. All bolts in Figure 7.6 are friction lockbolts toreduce themaintenance costs, such as discussed in subsection 2.7.5. Moreover, subsection 2.7.5may be reviewed for more information about lattice tower joint proofs. Note that the junctionplate thickness tp should remain the same for all members of one tower segment.
7.2 Design as Iterative Process
The design ofWT support structures is an iterative process withmany steps involved. Figure 7.7illustrates the main steps, which were applied in this work to get a final tower design.
Figure 7.7: Schematic illustration of the iterative rotatable tower design procedure
A reasonable first guess of all design parameters defines the initial tower design. This designmust be checked for its eigenfrequencies to ensure, that no resonance would occur in anyoperational conditions, such as explained in subsections 2.2.8 and 4.3.3. If this requirement isfulfilled, an ASE load analysis with all DLCs declared in Table 3.6 follows. The ASE analysisresults in load timeseries for each structural member and they can be transformed to thestress timeseries of predefined member details by consideration of the corresponding membergeometry. With this information, one can use the maximum stresses to perform a strengthand buckling analysis according to subsection 2.2.5. After application of an appropriate stresscycle counting algorithm, the combination of the resulting stress range histograms, the detailSN-curve, the wind speed probability distribution, and the Miner’s Rule the resulting fatigueutilization can be calculated. For more detailed explanations of the fatigue analysis procedure,
160
7.2 Design as Iterative Process
subsection 2.2.6 may be reviewed. If the resulting utilizations of all analyses are satisfied,the design is finished. Otherwise the process repeats and starts again by guessing a newdesign parameter set. Note that the parameter guess may be automated based on optimizationalgorithms, such as multidimensional gradient searches, particle swarm algorithms, or geneticalgorithms. According to the own experience, optimization with multidimensional parameterspaces and fitness functions with high computational costs is a subject on its own. Therefore,and because of the limited scope of this work, automated optimization procedures were notapplied in this work. However, with some experience one can identify design driving DLCsand neglect the other DLCs to accelerate the design iteration duration. Moreover, studyingthe qualitative influence of parameter changes can help to reach a good utilization withoutautomated optimization procedures.
161

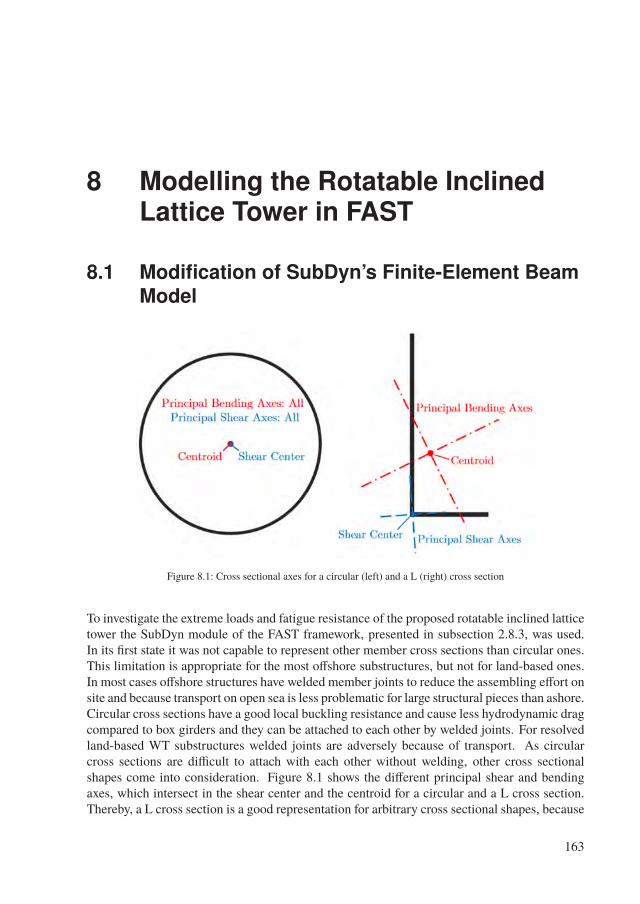
8 Modelling the Rotatable InclinedLattice Tower in FAST
8.1 Modification of SubDyn’s Finite-Element BeamModel
Figure 8.1: Cross sectional axes for a circular (left) and a L (right) cross section
To investigate the extreme loads and fatigue resistance of the proposed rotatable inclined latticetower the SubDyn module of the FAST framework, presented in subsection 2.8.3, was used.In its first state it was not capable to represent other member cross sections than circular ones.This limitation is appropriate for the most offshore substructures, but not for land-based ones.In most cases offshore structures have welded member joints to reduce the assembling effort onsite and because transport on open sea is less problematic for large structural pieces than ashore.Circular cross sections have a good local buckling resistance and cause less hydrodynamic dragcompared to box girders and they can be attached to each other by welded joints. For resolvedland-based WT substructures welded joints are adversely because of transport. As circularcross sections are difficult to attach with each other without welding, other cross sectionalshapes come into consideration. Figure 8.1 shows the different principal shear and bendingaxes, which intersect in the shear center and the centroid for a circular and a L cross section.Thereby, a L cross section is a good representation for arbitrary cross sectional shapes, because
163
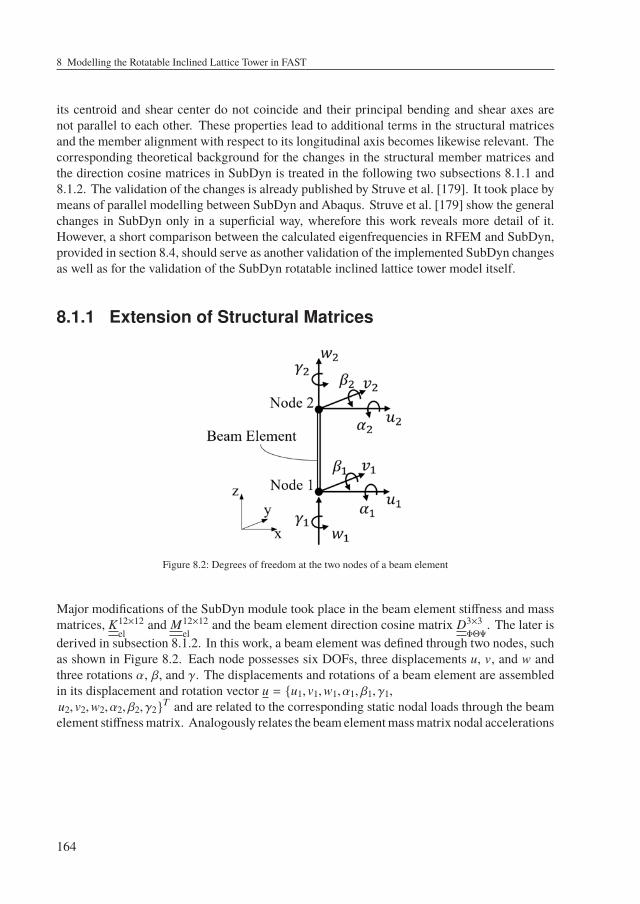
8 Modelling the Rotatable Inclined Lattice Tower in FAST
its centroid and shear center do not coincide and their principal bending and shear axes arenot parallel to each other. These properties lead to additional terms in the structural matricesand the member alignment with respect to its longitudinal axis becomes likewise relevant. Thecorresponding theoretical background for the changes in the structural member matrices andthe direction cosine matrices in SubDyn is treated in the following two subsections 8.1.1 and8.1.2. The validation of the changes is already published by Struve et al. [179]. It took place bymeans of parallel modelling between SubDyn and Abaqus. Struve et al. [179] show the generalchanges in SubDyn only in a superficial way, wherefore this work reveals more detail of it.However, a short comparison between the calculated eigenfrequencies in RFEM and SubDyn,provided in section 8.4, should serve as another validation of the implemented SubDyn changesas well as for the validation of the SubDyn rotatable inclined lattice tower model itself.
8.1.1 Extension of Structural Matrices
Figure 8.2: Degrees of freedom at the two nodes of a beam element
Major modifications of the SubDyn module took place in the beam element stiffness and massmatrices, K12×12
eland M12×12
eland the beam element direction cosine matrix D3×3
ΦΘΨ. The later is
derived in subsection 8.1.2. In this work, a beam element was defined through two nodes, suchas shown in Figure 8.2. Each node possesses six DOFs, three displacements u, v, and w andthree rotations α, β, and γ. The displacements and rotations of a beam element are assembledin its displacement and rotation vector u = u1, v1,w1, α1, β1, γ1,u2, v2,w2, α2, β2, γ2
T and are related to the corresponding static nodal loads through the beamelement stiffnessmatrix. Analogously relates the beam elementmassmatrix nodal accelerations
164
8.1 Modification of SubDyn’s Finite-Element Beam Model
Üu =∂2 u∂t2 =
Üu1, Üv1, Üw1, Üα1, Üβ1, Üγ1, Üu2, Üv2, Üw2, Üα2, Üβ2, Üγ2
T to corresponding dynamic loads. Notethat the symbol t represents time in this context. The nodal forces of a beam element result to
f = Kel
u︸︷︷︸static loads
+ MelÜu︸︷︷︸
dynamic loads
(8.1)
where damping is neglected because it is accounted for the whole system instead, such as notedin subsection 2.8.3. The resulting load vectorf =
Fu1,Fv1,Fw1,Mα1,Mβ1,Mγ1,Fu2,Fv2,Fw2,Mα2,Mβ2,Mγ2
T contains the load response tothe displacements and rotations and the corresponding accelerations. The structural matricesK
eland M
elwere changed to account for arbitrary orientations of principal bending and shear
axes and for potential unequal centroid and shear center positions, such as arbitrary crosssections may have. K
eland M
elare calculated by the integration of the cross sectional stiffness
and mass matrices K6×6c
and M6×6c
over the beam length. For arbitrary cross sections thesecross sectional structuralmatrices contain additional off-diagonal terms compared to the circularcross section formulation. Equations 8.2 and 8.3 show these matrices for the case that they aredefined with respect to the centroid of the cross section. A review of Bauchau’s work [7] showshow to derive these cross sectional structural matrices also for arbitrary reference points.
Kc=
G Ax −G Axy 0 0 0 −G Ax ys − G Axy xsG Ay 0 0 0 G Ay xs + G Axy ys
E A 0 0 0sym. E Ix −E Ixy 0
E Iy 0G Ax y2
s + G Ay x2s + 2 G Axy xs ys + G It
(8.2)
Mc= ρ
A 0 0 0 0 0A 0 0 0 0
A 0 0 0sym. Ix −Ixy 0
Iy 0Ip
(8.3)
Besides the material properties, shear modulus G, Young’s modulus E , and density ρ, Equa-tions 8.2 and 8.3 contain the engineering constants: cross sectional area A, corrected shear areasAx, Ay, and Axy, second area moments of inertia Ix and Iy, product of inertia Ixy, the torsionalconstant It, and the polar moment of inertia Ip. xs and ys are the shear centre coordinates. Thecalculation of these engineering constants for different kinds of cross sections, such as open orclosed ones is documented in many textbooks, such as in Dankert [35], Bauchau [9], and Cookand Young [30]. A Axy = Ixy = 0 implies, that the principal bending and shear axes are parallelto each other. This is for example the case for circular cross sections. Note that xs and ys isequal to the centroid for circular cross sections. Taeseong, Hansen, and Branner [181] derive
165
8 Modelling the Rotatable Inclined Lattice Tower in FAST
the beam element structural matrices out of the potential and kinetic beam energies, Epot, andEkin according to
Epot =12
∫ L
0εT K
cε dz (8.4)
Ekin =12
∫V
ρ ÛrT Ûr dV, (8.5)
where L is the beam length, V is the beam volume,
ε =γzx, γzy, εz, κx, κy, κz
T=
∂ u∂z− β,
∂ v
∂z+ α,
∂ w
∂z,∂ α
∂z,∂ β
∂z,∂ γ
∂z
Tis the generalized
strain vector according to Timoshenko beam kinematics, and Ûr is the velocity vector of a mate-rial point within the beam. Integration of the cross sectional structural matrices along the beamrequires knowledge about the deflection and rotation functional shapes between the nodes.Therefore, Taeseong, Hansen, and Branner [181] assume polynomial shape functions of arbi-trarily high order and minimize the elastic energy of Equation 8.4 to extract the correspondingpolynomial coefficients. After introducing the correct shape function matrices and boundaryconditions and carrying out mathematical transformations, the structural beam matrices can bederived as follows
Epot =12
uT NT
α
[∫ L
0BT K
cB dz
]Nα︸ ︷︷ ︸
Kc
u (8.6)
Ekin =12ÛuT NT
α
[∫ L
0N(z)T M
cN(z) dz
]Nα︸ ︷︷ ︸
Mc
Ûu, (8.7)
where the transformation matrix N6p×12α
for the generalized degrees of freedom vector is used.B6×6p is the strain-displacement matrix and N(z)6×6p is the polynomial matrix. Furthermore,p − 1 is the highest power of the assumed polynomials. Such rigorous beam element approachprovides more generality than necessary for isotropic straight beams with arbitrary cross sec-tions, but achieves more flexibility for future research projects. The user has now the option toprovide either the engineering constants in Equations 8.2 and 8.3 or to provide full 6 × 6 crosssectional stiffness and mass matrices, such as shown in Equations 8.8 and 8.9 for each member.
Kc=
K11 K12 K13 K14 K15 K16K21 K22 K23 K24 K25 K26K31 K32 K33 K34 K35 K36K41 K42 K43 K44 K45 K46K51 K52 K53 K54 K55 K56K61 K62 K63 K64 K65 K66
(8.8)
166
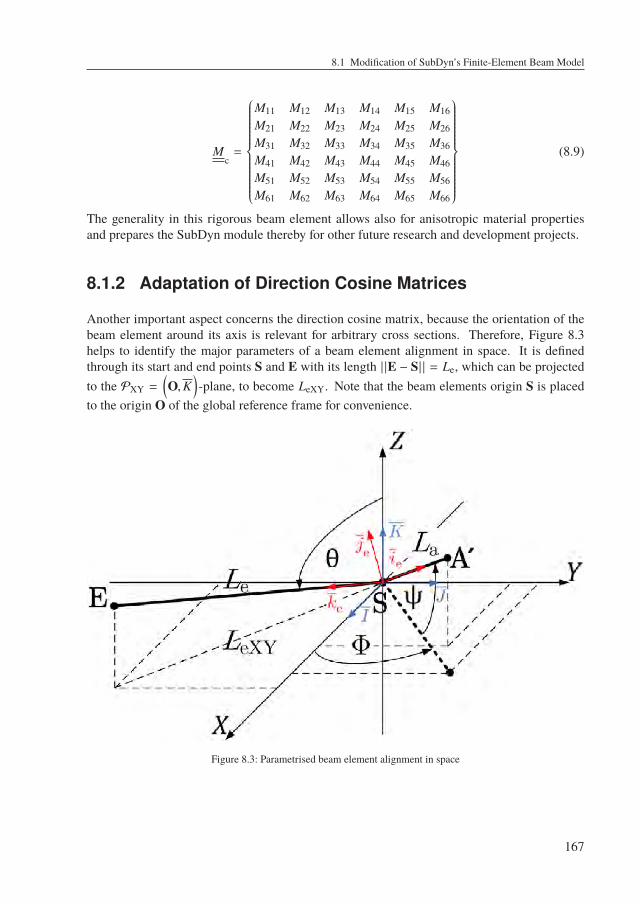
8.1 Modification of SubDyn’s Finite-Element Beam Model
Mc=
M11 M12 M13 M14 M15 M16M21 M22 M23 M24 M25 M26M31 M32 M33 M34 M35 M36M41 M42 M43 M44 M45 M46M51 M52 M53 M54 M55 M56M61 M62 M63 M64 M65 M66
(8.9)
The generality in this rigorous beam element allows also for anisotropic material propertiesand prepares the SubDyn module thereby for other future research and development projects.
8.1.2 Adaptation of Direction Cosine Matrices
Another important aspect concerns the direction cosine matrix, because the orientation of thebeam element around its axis is relevant for arbitrary cross sections. Therefore, Figure 8.3helps to identify the major parameters of a beam element alignment in space. It is definedthrough its start and end points S and E with its length | |E − S| | = Le, which can be projectedto the PXY =
(O,K
)-plane, to become LeXY. Note that the beam elements origin S is placed
to the origin O of the global reference frame for convenience.
Figure 8.3: Parametrised beam element alignment in space
167
8 Modelling the Rotatable Inclined Lattice Tower in FAST
The restriction of the original SubDyn version for the local member axis ie to be parallel to thePXY-plane prohibits arbitrary cross section orientations in space. Euler angles can bring anyorthonormal basis to an arbitrary other one by viewing its overall rotation as a succession ofthree planar rotations. Thereby, the rotations happen around different axes, which means thatno rotation will occur twice in a row around the same axis [8]. By allowing a third rotationaround the member axis instead of the previous mentioned restriction, arbitrary cross sectionorientations are achievable. In this case, the direction cosine matrix is defined to describe thelocal beam element orthonormal basis Ee =
(ie, je, ke
)with respect to the global orthonormal
basis I =(I, J,K
). The order of rotations is defined by a certain sequence. Here, it is the
rotation from II to EI1 around unit vector KIby angle Φ, from EE1
1 to EE12 around unit vector
iE11 by angle Θ, and from EE2
2 to EE2e around unit vector k
E22 by angle Ψ. In this notation,
the upper indices indicate the orthonormal basis in which a vector is resolved. Note that allrotations taking place in the mathematical positive counter clockwise convention when lookingalong the negative direction of the rotation axis.
iI
1
jI
1
kI
1
T
=
CΦ −SΦ 0SΦ CΦ 00 0 1
︸ ︷︷ ︸D
ΦI
II
JI
KI
T
(8.10)
iE12
jE12
kE12
T
=
1 0 00 CΘ −SΘ0 SΘ CΘ
︸ ︷︷ ︸D
ΘE1
iE11
jE11
kE11
T
(8.11)
iE2e
jE2e
kE2e
T
=
CΨ −SΨ 0SΨ CΨ 00 0 1
︸ ︷︷ ︸D
ΨE2
iE22
jE22
kE22
T
(8.12)
The abbreviations S and C are representative for the geometric sine and cosine functions,and its indices show its corresponding Euler angle arguments. Note that Equations 8.10 to8.12 describe only rotations in their own orthonormal bases, but a description of all tensorsaccording to the global orthonormal basis I is required to get EIe . Therefore, the directioncosine matrices have to be transformed with respect to I by
DIΘ= DI
ΦDE1
ΘDI T
Φ(8.13)
168
8.1 Modification of SubDyn’s Finite-Element Beam Model
DE1
Ψ= DE1
ΘDE2
ΨDE1 T
Θ(8.14)
DIΨ= DI
ΦDE1
ΨDI T
Φ(8.15)
Using Equations 8.13 to 8.15 in 8.10 to 8.12, whereby all tensors of Equations 8.10 to 8.12 aredescribed with respect to I delivers
iI
e
jI
e
kI
e
T
︸ ︷︷ ︸EIe
= DIΨ
DIΘ
DIΦ
II
JI
KI
T
= DIΦ
DE1
ΘDE2
Ψ
II
JI
KI
T
= DIΦΘΨ
II
JI
KI
T
︸ ︷︷ ︸II
(8.16)
with
DIΦΘΨ=
CΦ CΨ − SΦ CΘ SΨ −CΦ SΨ − SΦ CΘ CΨ SΦ SΘSΦ CΨ + CΦ CΘ SΨ −SΦ SΨ + CΦ CΘ CΨ −CΦ SΘ
SΘ SΨ SΘ CΨ CΘ
=[iI
e jI
e kI
e
](8.17)
Note that the unit vector containing vectors, resolved in their own orthonormal basis are identitymatrices, such as indicated by Equation 8.18.
II
JI
KI
T
=
iE11
jE11
kE11
T
=
iE22
jE22
kE22
T
= I3×3 (8.18)
The sines and cosines of Euler angles Φ and Θ are defined through the beam axis, given by SEaccording to
SΦ =E1 − S1
LeXYSΘ =
LeXY
Le
CΦ =E2 − S2
LeXYCΘ =
E3 − S3
LeXY
(8.19)
Additional information is necessary to define the cross sectional orientation, either by settingΨ directly or by defining a projected point A′ in space. The projected point A′ can be used tocalculate the local element unit vector ie according to
iI
e =A′ − S| |A′ − S| |
(8.20)
and the other axes arekI
e =E − S| |E − S| |
(8.21)
jI
e = kI
e × iI
e (8.22)
169
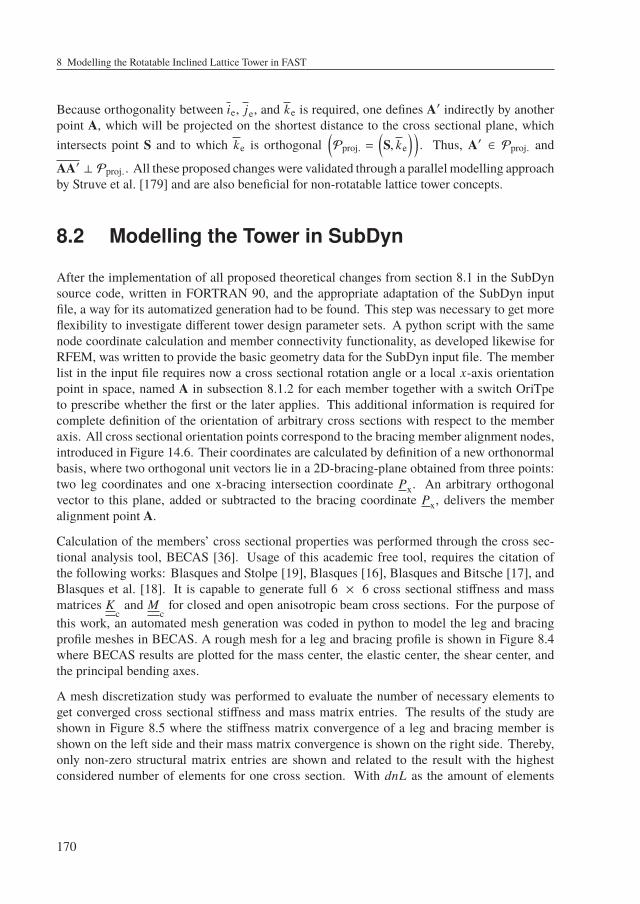
8 Modelling the Rotatable Inclined Lattice Tower in FAST
Because orthogonality between ie, je, and ke is required, one defines A′ indirectly by anotherpoint A, which will be projected on the shortest distance to the cross sectional plane, whichintersects point S and to which ke is orthogonal
(Pproj. =
(S, ke
)). Thus, A′ ∈ Pproj. and
AA′ ⊥ Pproj.. All these proposed changes were validated through a parallel modelling approachby Struve et al. [179] and are also beneficial for non-rotatable lattice tower concepts.
8.2 Modelling the Tower in SubDyn
After the implementation of all proposed theoretical changes from section 8.1 in the SubDynsource code, written in FORTRAN 90, and the appropriate adaptation of the SubDyn inputfile, a way for its automatized generation had to be found. This step was necessary to get moreflexibility to investigate different tower design parameter sets. A python script with the samenode coordinate calculation and member connectivity functionality, as developed likewise forRFEM, was written to provide the basic geometry data for the SubDyn input file. The memberlist in the input file requires now a cross sectional rotation angle or a local x-axis orientationpoint in space, named A in subsection 8.1.2 for each member together with a switch OriTpeto prescribe whether the first or the later applies. This additional information is required forcomplete definition of the orientation of arbitrary cross sections with respect to the memberaxis. All cross sectional orientation points correspond to the bracing member alignment nodes,introduced in Figure 14.6. Their coordinates are calculated by definition of a new orthonormalbasis, where two orthogonal unit vectors lie in a 2D-bracing-plane obtained from three points:two leg coordinates and one x-bracing intersection coordinate Px. An arbitrary orthogonalvector to this plane, added or subtracted to the bracing coordinate Px, delivers the memberalignment point A.
Calculation of the members’ cross sectional properties was performed through the cross sec-tional analysis tool, BECAS [36]. Usage of this academic free tool, requires the citation ofthe following works: Blasques and Stolpe [19], Blasques [16], Blasques and Bitsche [17], andBlasques et al. [18]. It is capable to generate full 6 × 6 cross sectional stiffness and massmatrices K
cand M
cfor closed and open anisotropic beam cross sections. For the purpose of
this work, an automated mesh generation was coded in python to model the leg and bracingprofile meshes in BECAS. A rough mesh for a leg and bracing profile is shown in Figure 8.4where BECAS results are plotted for the mass center, the elastic center, the shear center, andthe principal bending axes.
A mesh discretization study was performed to evaluate the number of necessary elements toget converged cross sectional stiffness and mass matrix entries. The results of the study areshown in Figure 8.5 where the stiffness matrix convergence of a leg and bracing member isshown on the left side and their mass matrix convergence is shown on the right side. Thereby,only non-zero structural matrix entries are shown and related to the result with the highestconsidered number of elements for one cross section. With dnL as the amount of elements
170
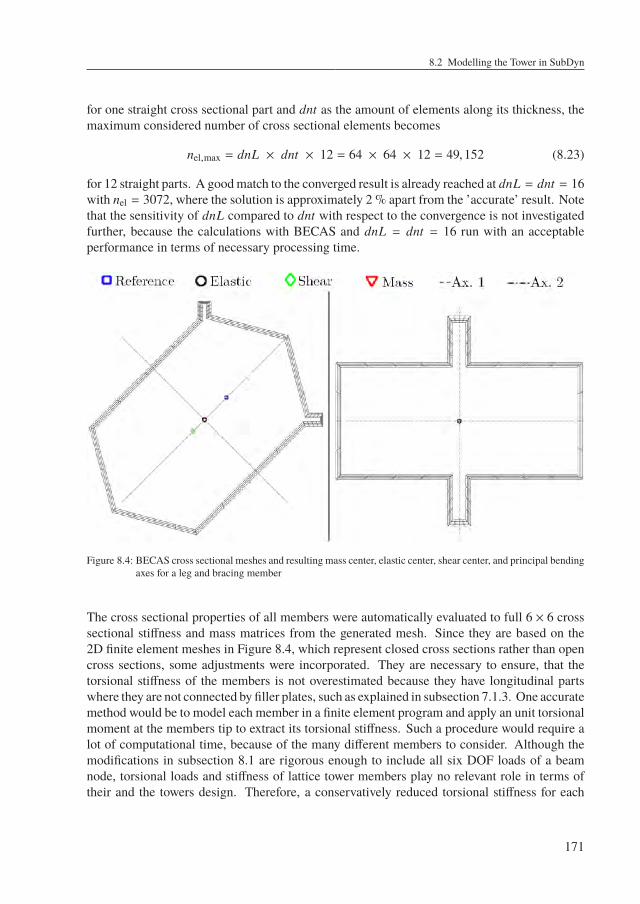
8.2 Modelling the Tower in SubDyn
for one straight cross sectional part and dnt as the amount of elements along its thickness, themaximum considered number of cross sectional elements becomes
nel,max = dnL × dnt × 12 = 64 × 64 × 12 = 49,152 (8.23)
for 12 straight parts. A goodmatch to the converged result is already reached at dnL = dnt = 16with nel = 3072, where the solution is approximately 2 % apart from the ’accurate’ result. Notethat the sensitivity of dnL compared to dnt with respect to the convergence is not investigatedfurther, because the calculations with BECAS and dnL = dnt = 16 run with an acceptableperformance in terms of necessary processing time.
Figure 8.4: BECAS cross sectional meshes and resulting mass center, elastic center, shear center, and principal bendingaxes for a leg and bracing member
The cross sectional properties of all members were automatically evaluated to full 6 × 6 crosssectional stiffness and mass matrices from the generated mesh. Since they are based on the2D finite element meshes in Figure 8.4, which represent closed cross sections rather than opencross sections, some adjustments were incorporated. They are necessary to ensure, that thetorsional stiffness of the members is not overestimated because they have longitudinal partswhere they are not connected by filler plates, such as explained in subsection 7.1.3. One accuratemethod would be to model each member in a finite element program and apply an unit torsionalmoment at the members tip to extract its torsional stiffness. Such a procedure would require alot of computational time, because of the many different members to consider. Although themodifications in subsection 8.1 are rigorous enough to include all six DOF loads of a beamnode, torsional loads and stiffness of lattice tower members play no relevant role in terms oftheir and the towers design. Therefore, a conservatively reduced torsional stiffness for each
171
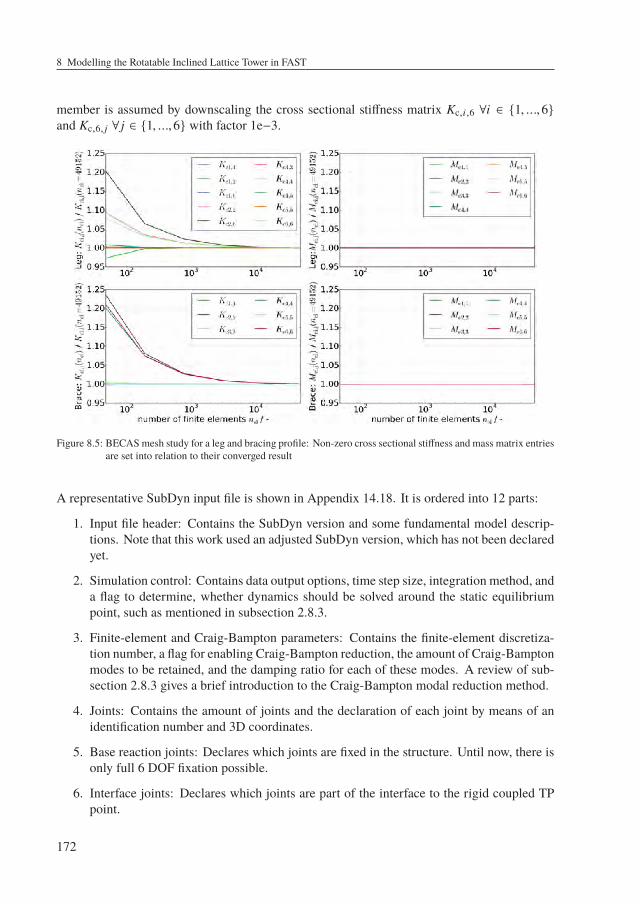
8 Modelling the Rotatable Inclined Lattice Tower in FAST
member is assumed by downscaling the cross sectional stiffness matrix Kc,i,6 ∀i ∈ 1, ...,6and Kc,6, j ∀ j ∈ 1, ...,6 with factor 1e−3.
Figure 8.5: BECASmesh study for a leg and bracing profile: Non-zero cross sectional stiffness and mass matrix entriesare set into relation to their converged result
A representative SubDyn input file is shown in Appendix 14.18. It is ordered into 12 parts:
1. Input file header: Contains the SubDyn version and some fundamental model descrip-tions. Note that this work used an adjusted SubDyn version, which has not been declaredyet.
2. Simulation control: Contains data output options, time step size, integration method, anda flag to determine, whether dynamics should be solved around the static equilibriumpoint, such as mentioned in subsection 2.8.3.
3. Finite-element and Craig-Bampton parameters: Contains the finite-element discretiza-tion number, a flag for enabling Craig-Bampton reduction, the amount of Craig-Bamptonmodes to be retained, and the damping ratio for each of these modes. A review of sub-section 2.8.3 gives a brief introduction to the Craig-Bampton modal reduction method.
4. Joints: Contains the amount of joints and the declaration of each joint by means of anidentification number and 3D coordinates.
5. Base reaction joints: Declares which joints are fixed in the structure. Until now, there isonly full 6 DOF fixation possible.
6. Interface joints: Declares which joints are part of the interface to the rigid coupled TPpoint.
172
8.3 Validation of the SubDyn Model
7. Members: Declares all structural members by setting a member identification number,listing its two joints, define the cross sectional property set of both member ends, chosethe orientation type OriTpe, explained in the first paragraph of this subsection, and thecorresponding information for themembers rotation angle around its axis or the alignmentpoint coordinates A, introduced in the end of subsection 8.1.2. The orientation type andthe corresponding member alignment information were added to the original SubDyninput layout and functionality for the purposes of this work.
8. Member cross section properties: Declares member material properties, such as theYoung’s and shearmodulus and thematerial density. Furthermore, it takes cross sectionalgeometrical properties for each property in one of three ways: (1) a circular cross section,(2) a general cross section, defined by engineering constants, such as the cross sectionalarea, the corrected shear areas, the shear center coordinates, the second area momentsof inertia, and the torsional constant or (3) full 6 × 6 cross sectional stiffness and massmatrices, explained in subsection 8.1.1. The later two options were added to the originalSubDyn input layout and functionality for the purposes of this work.
9. Joint additional mass: Declares additional concentrated masses and rotational inertias tocertain joints.
10. Outputs: Contains information and flags of how and which results should be written tothe output files.
11. Member outputs: Declares members fromwhich more detailed outputs should be writtento the output files, such as the loads and deflections of certain beam nodes within amember.
12. Global outputs: Declares global outputs, such as interface and boundary loads anddeflections or modal parameters.
8.3 Validation of the SubDyn Model
Asmentioned in subsection 8.1, the changes in SubDyn have already been validated by Struve etal. [179]. Changes were carried out to account for arbitrary member cross sections, rather thanonly circular member cross sections in the original version. The validation in the cited referencewas done by an parallel modelling approach between SubDyn and ABAQUS. In the presentvalidation case, the civil engineering software RFEM, was used instead of ABAQUS for tworeasons: (1) Validation against another software increases the reliability of the implementedSubDyn changes. (2) In the cited reference, the option of engineering constants was used todescribe the beam properties, but in this work full 6 × 6 cross sectional stiffness and massmatrices were used as input for SubDyn structural members. Appendix 14.19 may be reviewedfor more detailed information about the parallel implementation in RFEM. Thereby, a certaintower design parameter set, such as discussed in section 9.1, was chosen for the tower and anatural frequency analysis was performed for comparison of both implementations.
173
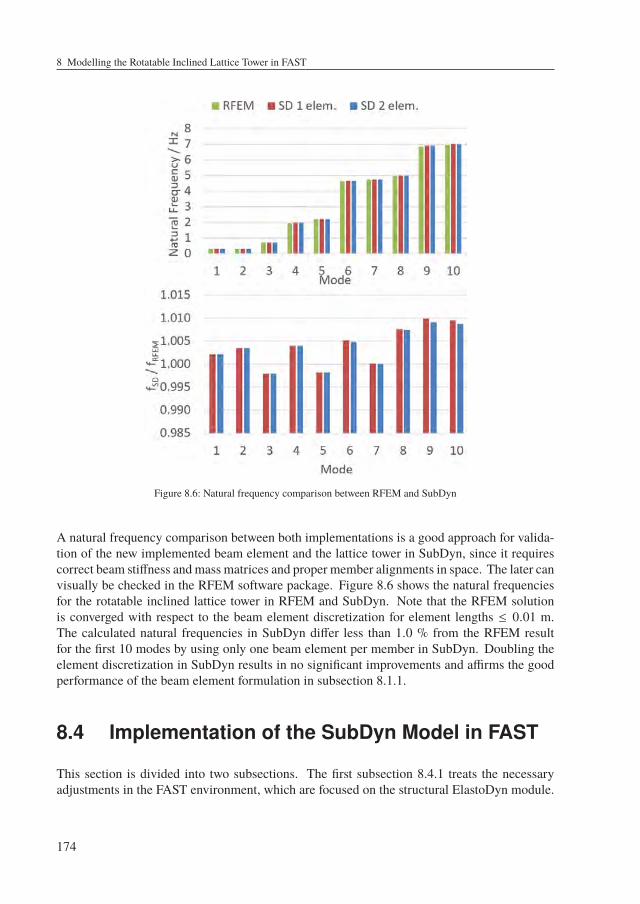
8 Modelling the Rotatable Inclined Lattice Tower in FAST
Figure 8.6: Natural frequency comparison between RFEM and SubDyn
A natural frequency comparison between both implementations is a good approach for valida-tion of the new implemented beam element and the lattice tower in SubDyn, since it requirescorrect beam stiffness and mass matrices and proper member alignments in space. The later canvisually be checked in the RFEM software package. Figure 8.6 shows the natural frequenciesfor the rotatable inclined lattice tower in RFEM and SubDyn. Note that the RFEM solutionis converged with respect to the beam element discretization for element lengths ≤ 0.01 m.The calculated natural frequencies in SubDyn differ less than 1.0 % from the RFEM resultfor the first 10 modes by using only one beam element per member in SubDyn. Doubling theelement discretization in SubDyn results in no significant improvements and affirms the goodperformance of the beam element formulation in subsection 8.1.1.
8.4 Implementation of the SubDyn Model in FAST
This section is divided into two subsections. The first subsection 8.4.1 treats the necessaryadjustments in the FAST environment, which are focused on the structural ElastoDyn module.
174
8.4 Implementation of the SubDyn Model in FAST
The second subsection 8.4.2 discusses the necessary simulation settings in the SubDyn module,where the rotatable inclined lattice tower was modelled.
8.4.1 Adjustments to the FAST Environment
A switch, called CompSub in the main FAST input file and the provision of the correspondingSubDyn input files path is enough to incorporate SubDyn in the FAST framework. Nevertheless,a few other settings in the ElastoDyn module had to be adjusted to account for the SubDynstructure in the right way. First, the yaw compliance and ElastoDyn tower mode DOFs in the FAand SS direction, YawDOF, TwFADOF1, TwFADOF2, TwSSDOF1, and TwSSDOF2 had tobe disabled. Secondly, the platform DOFs in horizontal surge and sway directions PtfmSgDOFand PtfmSwDOF, in vertical heave direction PtfmHvDOF, and around its roll PtfmRDOF,pitch PtfmPDOF, and yaw PtfmYDOF axes had to be enabled. For offshore WTs, the platformDOFs are used to connect the substructure rigidly with the tower. In case of a land-based fulllattice tower, the platform becomes the connection between the tower and the RNA. It is notpossible to disable the ElastoDyn tower completely, wherefore it remained in an artificial wayby setting the tower height value in ElastoDyn to TowerHt = TowerBsHt + 0.001 m, where theElastoDyn tower base height TowerBsHt = HT equals to the full lattice tower height.
Initial ConditionsThe required platform coordinates are given as
PtfmCMxt = tan (αTI)HT −aT
2+
DT,NREL
2PtfmCMyt = 0PtfmCMzt = HT
(8.24)
The tower top diameter of the Baseline NREL reference WT was used to place the RNA tothe same relative tower top position as for the conventional reference WT. The same relativeposition means, that the RNA distance to the front outer border of the rotatable inclined latticetower was the same as to the outer tower border of the reference WT. To reach numericalstability, the definition of platform inertias > 0 was required. Here, a platform roll inertiaPtfmRIner = 1/2 NacYIner and a platform pitch inertia of PtfmPIner = NacYIner wereset, where NacYIner denotes the given nacelle inertia about its yaw axis. Neglecting theinitialization of the self-weight-displaced platform DOFs led to numerical instabilities in thebeginning of the simulation, because of high tower head accelerations. Therefore, it wasimportant to prescribe a good approximation of the initial platform position under self weightof the structure. The SubDyn manual [32, p. 31] proposes the calculation of the initial verticalplatform displacement to be
PtfmHeave = −
(M (SD)
BB,33 + M (ED))g
K (SD)BB,33
(8.25)
175
8 Modelling the Rotatable Inclined Lattice Tower in FAST
where K (SD)BB,33 and M (SD)
BB,33 are the 3,3 elements of the equivalent stiffness and mass matricesof the substructure, resolved with respect to the TP point. The equivalent stiffness and massmatrices are mentioned before in subsection 2.8.3 and may be evaluated with help of the stand-alone SubDyn driver. M (ED) is the mass from ElastoDyn, which equals to the RNA mass inthe present case. Since an inclined tower does not only have vertical initial displacements, butalso displacements along x and a rotation about y, the whole equivalent stiffness matrix K
BBwas used to calculate all tower head (platform) displacements. Note that the tower head, theplatform and the TP are all the same for this structure. First, the stand-alone SubDyn driverwas used to calculate the resulting reaction interface loads of the rotatable inclined lattice towerunder RNA and self weight at the TP. The RNA weight was modelled through point masses,attached to ultra stiff and low mass members, such as likewise applied in the RFEM model,shown in Figure 14.6. Next, the initial platform displacements and rotations are calculatedfrom Equation 8.26 as follows
PtfmSurgePtfmSwayPtfmHeave
PtfmRoll180 deg
π
PtfmPitch180 deg
π
PtfmYaw180 deg
π
=
[K
BB
]−1
−IntfFXss−IntfFYss−IntfFZss−IntfMXss−IntfMYss−IntfMZss
(8.26)
where PtfmSurge, PtfmSway, PtfmHeave, PtfmRoll, PtfmPitch, and PtfmYaw are the platformsurge, sway, and heave displacements and roll, pitch, and yaw rotations. IntfFXss, IntfFYss,IntfFZss, IntfMXss, IntfMYss, IntfMZss are the TP interface reaction forces and moments,whose signs must be turned. To get converged interface loads, the SubDyn stand-alone drivercalculates 300 time steps under RNA and self weight. Note that an applied artificial highstructural damping of 50 % increased a converged result in this analysis.
Artificial Damping through HydroDynNumerical problems arise in SubDyn if the Craig-Bampton1 reduction is applied, because theinterface modes experience no damping. This problem is mentioned by Damiani, Jonkman, andHayman [32, p. 30-31] where they suggest to incorporate an augmented overall system dampingby enabling the HydroDyn module [113]. HydroDyn is capable, to define a linear damper forthe platform DOFs in form of a 6×6 damping matrix C(HD). In the present work, an augmentedplatform-heave damping of ζ (HD) = 0.012, was likewise necessary to reach numerical stability.The equation to calculate the the corresponding element in the damping matrix is
C(HD)33 = 2 ζ (HD)
√K (SD)
BB,33
(M (SD)
BB,33 + M (ED))
(8.27)
1 Subsection 2.8.3 provides a brief introduction to the Craig-Bampton modal reduction method.2 This value is the critical damping ratio.
176
8.4 Implementation of the SubDyn Model in FAST
8.4.2 SubDyn Simulation Settings
After incorporation of all these model pre-sets, a Craig-Bampton reduction was used to retain20 Craig-Bampton eigenvalues in the FAST embedded simulation. With this, all WT systemfrequencies up to 4.29 Hzmay potentially couple with the rotatable inclined lattice tower naturalfrequencies. The value of 4.29 Hz depends on the design parameters and is calculated for theparameter set in Table 9.1. Considering the full-system linearized natural frequency analysis ofthe land-based Baseline NREL reference WT in [109, p. 30], no frequencies ≥ 2.02 Hz shouldoccur for the relevant first and second blade flapwise modes, the first blade edgewise mode,and the first drivetrain torsional mode. Thus, 20 Craig-Bampton eigenvalues were sufficient.Furthermore, an appropriate member discretization should be found. The natural frequencyresults in Figure 8.6 justify a member discretization of NDiv = 1, because it reaches alreadygood accordance to the converged RFEM results. This is caused by the rigorous anisotropicbeam element approach, explained in subsection 8.1.1. Moreover, the dynamic solution aroundthe static equilibrium point SttcSolve was enabled to ensure a correct self weight inclusion ofthe lattice structure, such as suggested in the SubDyn manual [32, p. 32]. The last importantparameter was the integration step size. Since equations 3 and 4 in [32, p. 32] do not applyproperly to an inclined tower, the necessary maximum time step size had to be estimated onanother way. Experience has shown, that ASE simulations with a time step size of ≤ 0.0125 s incase of the implicit second-order Adams-Moulton integration method behave numerical stable.Unfortunately, this is a very small time step size, which causes long simulation times of morethan 2 h to simulate 630 s of one timeseries.
177

9 Structural Analysis of a RotatableInclined Lattice Tower
9.1 Choosing Design Parameter Values
Since a material efficient design requires comparison between the performance of differentinput parameter sets, a flexible way for geometry and input data generation was needed. In thiscontext, a good performance means low structural mass and a high member utilization. Bymeans of self-written python scripts, which create the SubDyn input file automatically fromthe input design parameters, different designs could be tested in comparatively low amounts oftime. It follows the explanation for the first design parameter set.
Parameter AssumptionsThe flap lengths of the leg and bracing hat-profiles were set to LF = 0.09 m and HF = 0.07 mto ensure enough space for bolts. The material thickness of the legs and bracing membersdepends on Equations 7.15 and 7.16 and is therefore not a directly adjustable design parameter.Assuming a maximum extrusion moulding diameter of Dextr = 0.35 m for the hat-profiles,restricts the two side supported length to
HL,max = minDextr − 2 HF , −
HF
2+
√(HF
2
)2+
Dextr − H2F
2
= 0.21 m (9.1)
For comparison, the same tower hight as for the Baseline NREL reference tower was chosenwith HT = 87.6 m. Moreover, the steel density was increased to ρsteel = 8500 kg/m3 to accountfor the additional weight of bolts, filler plates, paintings, cables, and structural attachments,such as the lift cage. Note that this material density is the same as assumed for the conventionalreference tower and makes it therefore more comparable. Moreover, a common WT supportstructure steel grade with a yield strength of 355 N/mm2 was chosen. Cost intensive highersteel grades are uncommon, because theWT support structure design is often driven by fatigue,where higher grades are not advantageous. A bracing segment number, analogous to theButzkies tower in Figure 2.12 was assumed. With Nseg = 20, it is one less than for the 12.4 mhigher Butzkies tower. Tower bottom length aB and width bB should be as large as possibleto reduce the leg axial loading through the tower bending moment. On the other hand, thebuckling lengths of the x-bracings should not become too big and increased leg distancesincrease the tower stiffness and thereby the amount of load cycles over the lifetime. Note thatthese load load cycles would be smaller. At this point it should be noted that the bottom tower
179
9 Structural Analysis of a Rotatable Inclined Lattice Tower
dimensions are likewise important for the tower base yaw system. The influence is determinedby the chosen tower base yaw concept, discussed in chapter 4.2. In the end it is a complexoptimization problem to find optimal tower base dimensions. For this preliminary study onlythe material saving potential of the tower was evaluated, without accounting for a specific towerbase yaw system. Therefore, the tower length and width were oriented at common lattice towerbase dimensions for this hub height and rated power. Eigenfrequency analyses revealed, thatfirst FA and SS bending frequencies reach easily the 3p excitation frequency range of the WT.A review of Figure 4.4 shows the excitation frequency ranges. Thus, the tower base length andthe width were equal and relatively small with aB = bB = 6.8 m.
Common machine foundations have already rectangular shapes, which can be seen as towertop length and width limitation. In case of a conventional WT, the width of the machineframe would have a value, which is slightly larger than the tower top diameter. The towertop diameter of the Baseline NREL reference WT is DT,NREL = 3.87 m and a correspondingmachine frame could have a width of ≈ 4 m. In the present eigenfrequency driving case forthe outer dimensions, relatively small tower top dimensions of aT = 4.5 m and bT = 4.5 mwere chosen. It was assumed that large machine foundations would become too heavy andreduce the material saving potential of the concept. On the other hand, a certain space isnecessary to cover all nacelle mountings, such as the drivetrain and the generator. However,further investigations with respect to the machine foundation are out of scope for this work.Future research projects should consider the machine foundation weight as function of towerhead dimensions for rotatable WT support structures.
For the previous explained tower dimensions, the tower inclination angle is calculated with helpof Equations 6.5, 6.6, and 6.7. To avoid a cone position for the blades and a rotor shaft tilt, thecorresponding parameters had to become zero: αPC = αST = 0 deg. From this, the minimumdemanded tower inclination angle results to
αTI = − arctan©«
clear. − lOH + dT −
(12
aT −12
DT,NREL
)HT − zTip
ª®®®®¬→αTI
180 degπ
= −7.721 deg
(9.2)
where the calculated blade to tower clearance for the conventional configuration is clear. =10.539 m. Furthermore, the parameters in the Equations 6.6 and 6.7 change for the reorderedEquation 9.2: DB → aB, DT → aB, zTip = HT + lTS − Rrot. Note that the additional term12
aT −12
DT,NREL in Equation 9.2 was necessary to shift the nacelle from the tower centrelineto a value, that corresponds to the same distance between the rotor and the tower edge, as forthe conventional configuration. With these settings, energy harvest from the wind is increased,such as discussed in subsection 6.2.3. Table 9.1 shows the assumed parameter set, where LLand HL were determined to reach a good material utilization. LL and HL were given for thebottom of the tower and for the top of the tower, marked by indexes B and T, respectively.All members in-between had linear interpolated values. The constant filler plate thickness
180
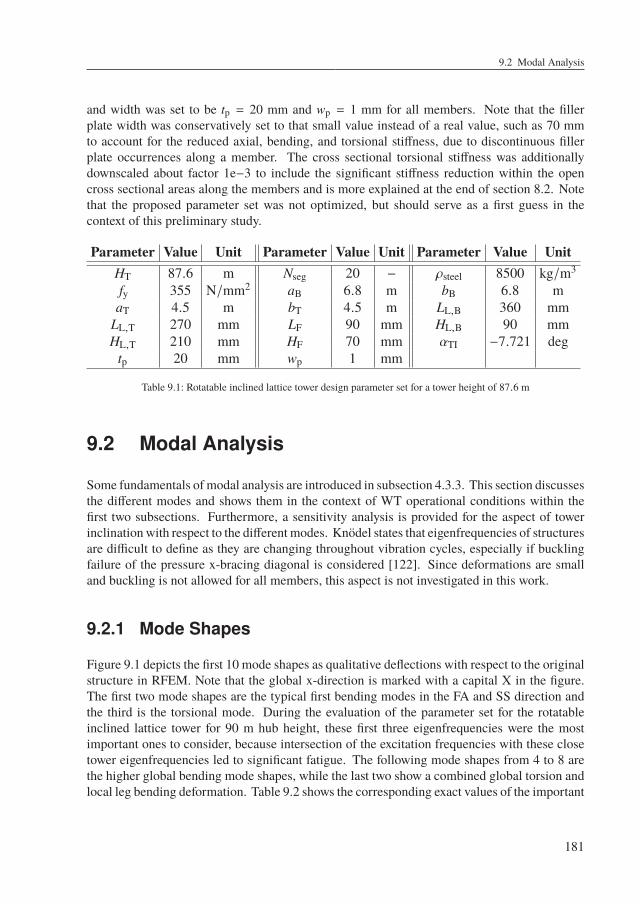
9.2 Modal Analysis
and width was set to be tp = 20 mm and wp = 1 mm for all members. Note that the fillerplate width was conservatively set to that small value instead of a real value, such as 70 mmto account for the reduced axial, bending, and torsional stiffness, due to discontinuous fillerplate occurrences along a member. The cross sectional torsional stiffness was additionallydownscaled about factor 1e−3 to include the significant stiffness reduction within the opencross sectional areas along the members and is more explained at the end of section 8.2. Notethat the proposed parameter set was not optimized, but should serve as a first guess in thecontext of this preliminary study.
Parameter Value Unit Parameter Value Unit Parameter Value UnitHT 87.6 m Nseg 20 − ρsteel 8500 kg/m3
fy 355 N/mm2 aB 6.8 m bB 6.8 maT 4.5 m bT 4.5 m LL,B 360 mm
LL,T 270 mm LF 90 mm HL,B 90 mmHL,T 210 mm HF 70 mm αTI −7.721 deg
tp 20 mm wp 1 mm
Table 9.1: Rotatable inclined lattice tower design parameter set for a tower height of 87.6 m
9.2 Modal Analysis
Some fundamentals of modal analysis are introduced in subsection 4.3.3. This section discussesthe different modes and shows them in the context of WT operational conditions within thefirst two subsections. Furthermore, a sensitivity analysis is provided for the aspect of towerinclination with respect to the different modes. Knödel states that eigenfrequencies of structuresare difficult to define as they are changing throughout vibration cycles, especially if bucklingfailure of the pressure x-bracing diagonal is considered [122]. Since deformations are smalland buckling is not allowed for all members, this aspect is not investigated in this work.
9.2.1 Mode Shapes
Figure 9.1 depicts the first 10 mode shapes as qualitative deflections with respect to the originalstructure in RFEM. Note that the global x-direction is marked with a capital X in the figure.The first two mode shapes are the typical first bending modes in the FA and SS direction andthe third is the torsional mode. During the evaluation of the parameter set for the rotatableinclined lattice tower for 90 m hub height, these first three eigenfrequencies were the mostimportant ones to consider, because intersection of the excitation frequencies with these closetower eigenfrequencies led to significant fatigue. The following mode shapes from 4 to 8 arethe higher global bending mode shapes, while the last two show a combined global torsion andlocal leg bending deformation. Table 9.2 shows the corresponding exact values of the important
181
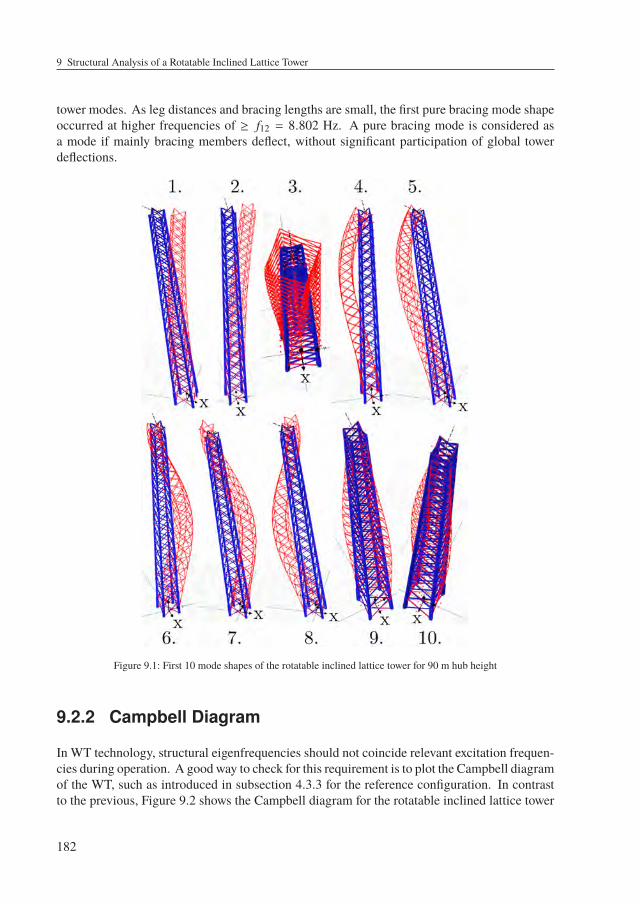
9 Structural Analysis of a Rotatable Inclined Lattice Tower
tower modes. As leg distances and bracing lengths are small, the first pure bracing mode shapeoccurred at higher frequencies of ≥ f12 = 8.802 Hz. A pure bracing mode is considered asa mode if mainly bracing members deflect, without significant participation of global towerdeflections.
Figure 9.1: First 10 mode shapes of the rotatable inclined lattice tower for 90 m hub height
9.2.2 Campbell Diagram
In WT technology, structural eigenfrequencies should not coincide relevant excitation frequen-cies during operation. A good way to check for this requirement is to plot the Campbell diagramof the WT, such as introduced in subsection 4.3.3 for the reference configuration. In contrastto the previous, Figure 9.2 shows the Campbell diagram for the rotatable inclined lattice tower
182
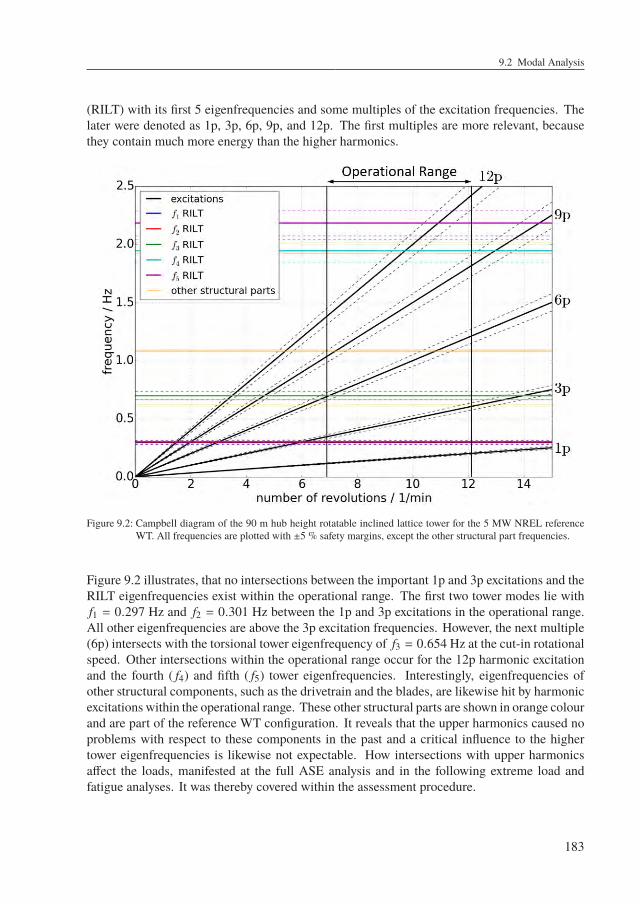
9.2 Modal Analysis
(RILT) with its first 5 eigenfrequencies and some multiples of the excitation frequencies. Thelater were denoted as 1p, 3p, 6p, 9p, and 12p. The first multiples are more relevant, becausethey contain much more energy than the higher harmonics.
Figure 9.2: Campbell diagram of the 90 m hub height rotatable inclined lattice tower for the 5 MW NREL referenceWT. All frequencies are plotted with ±5 % safety margins, except the other structural part frequencies.
Figure 9.2 illustrates, that no intersections between the important 1p and 3p excitations and theRILT eigenfrequencies exist within the operational range. The first two tower modes lie withf1 = 0.297 Hz and f2 = 0.301 Hz between the 1p and 3p excitations in the operational range.All other eigenfrequencies are above the 3p excitation frequencies. However, the next multiple(6p) intersects with the torsional tower eigenfrequency of f3 = 0.654 Hz at the cut-in rotationalspeed. Other intersections within the operational range occur for the 12p harmonic excitationand the fourth ( f4) and fifth ( f5) tower eigenfrequencies. Interestingly, eigenfrequencies ofother structural components, such as the drivetrain and the blades, are likewise hit by harmonicexcitations within the operational range. These other structural parts are shown in orange colourand are part of the reference WT configuration. It reveals that the upper harmonics caused noproblems with respect to these components in the past and a critical influence to the highertower eigenfrequencies is likewise not expectable. How intersections with upper harmonicsaffect the loads, manifested at the full ASE analysis and in the following extreme load andfatigue analyses. It was thereby covered within the assessment procedure.
183
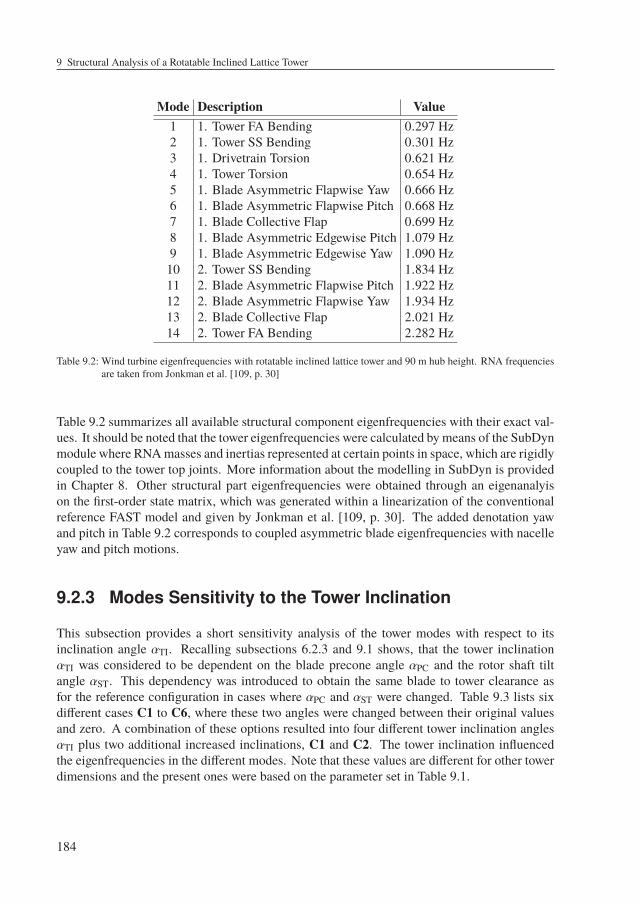
9 Structural Analysis of a Rotatable Inclined Lattice Tower
Mode Description Value1 1. Tower FA Bending 0.297 Hz2 1. Tower SS Bending 0.301 Hz3 1. Drivetrain Torsion 0.621 Hz4 1. Tower Torsion 0.654 Hz5 1. Blade Asymmetric Flapwise Yaw 0.666 Hz6 1. Blade Asymmetric Flapwise Pitch 0.668 Hz7 1. Blade Collective Flap 0.699 Hz8 1. Blade Asymmetric Edgewise Pitch 1.079 Hz9 1. Blade Asymmetric Edgewise Yaw 1.090 Hz
10 2. Tower SS Bending 1.834 Hz11 2. Blade Asymmetric Flapwise Pitch 1.922 Hz12 2. Blade Asymmetric Flapwise Yaw 1.934 Hz13 2. Blade Collective Flap 2.021 Hz14 2. Tower FA Bending 2.282 Hz
Table 9.2: Wind turbine eigenfrequencies with rotatable inclined lattice tower and 90 m hub height. RNA frequenciesare taken from Jonkman et al. [109, p. 30]
Table 9.2 summarizes all available structural component eigenfrequencies with their exact val-ues. It should be noted that the tower eigenfrequencies were calculated by means of the SubDynmodule where RNAmasses and inertias represented at certain points in space, which are rigidlycoupled to the tower top joints. More information about the modelling in SubDyn is providedin Chapter 8. Other structural part eigenfrequencies were obtained through an eigenanalyison the first-order state matrix, which was generated within a linearization of the conventionalreference FAST model and given by Jonkman et al. [109, p. 30]. The added denotation yawand pitch in Table 9.2 corresponds to coupled asymmetric blade eigenfrequencies with nacelleyaw and pitch motions.
9.2.3 Modes Sensitivity to the Tower Inclination
This subsection provides a short sensitivity analysis of the tower modes with respect to itsinclination angle αTI. Recalling subsections 6.2.3 and 9.1 shows, that the tower inclinationαTI was considered to be dependent on the blade precone angle αPC and the rotor shaft tiltangle αST. This dependency was introduced to obtain the same blade to tower clearance asfor the reference configuration in cases where αPC and αST were changed. Table 9.3 lists sixdifferent cases C1 to C6, where these two angles were changed between their original valuesand zero. A combination of these options resulted into four different tower inclination anglesαTI plus two additional increased inclinations, C1 and C2. The tower inclination influencedthe eigenfrequencies in the different modes. Note that these values are different for other towerdimensions and the present ones were based on the parameter set in Table 9.1.
184
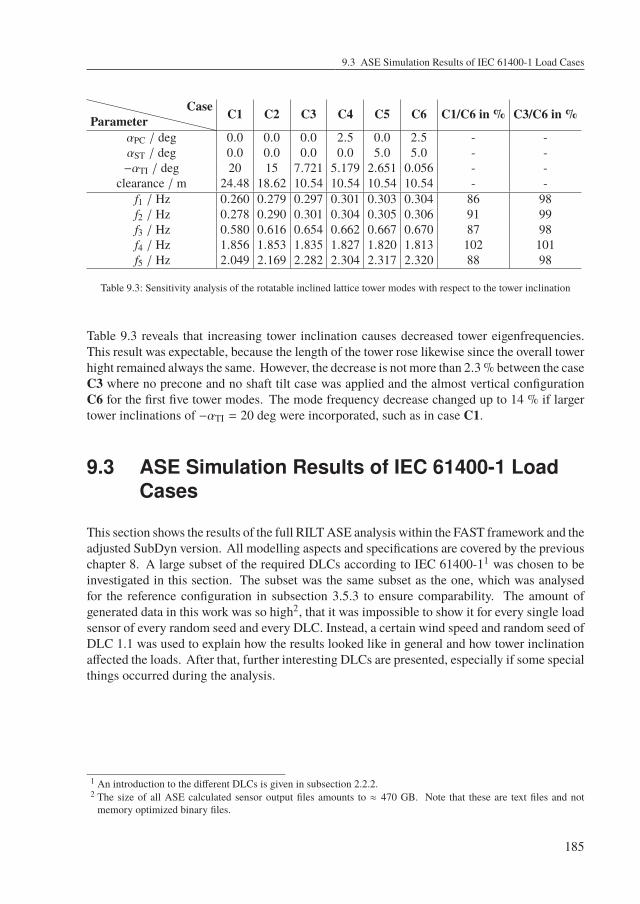
9.3 ASE Simulation Results of IEC 61400-1 Load Cases
ParameterCase C1 C2 C3 C4 C5 C6 C1/C6 in % C3/C6 in %
αPC / deg 0.0 0.0 0.0 2.5 0.0 2.5 - -αST / deg 0.0 0.0 0.0 0.0 5.0 5.0 - -−αTI / deg 20 15 7.721 5.179 2.651 0.056 - -
clearance / m 24.48 18.62 10.54 10.54 10.54 10.54 - -f1 / Hz 0.260 0.279 0.297 0.301 0.303 0.304 86 98f2 / Hz 0.278 0.290 0.301 0.304 0.305 0.306 91 99f3 / Hz 0.580 0.616 0.654 0.662 0.667 0.670 87 98f4 / Hz 1.856 1.853 1.835 1.827 1.820 1.813 102 101f5 / Hz 2.049 2.169 2.282 2.304 2.317 2.320 88 98
Table 9.3: Sensitivity analysis of the rotatable inclined lattice tower modes with respect to the tower inclination
Table 9.3 reveals that increasing tower inclination causes decreased tower eigenfrequencies.This result was expectable, because the length of the tower rose likewise since the overall towerhight remained always the same. However, the decrease is not more than 2.3 % between the caseC3 where no precone and no shaft tilt case was applied and the almost vertical configurationC6 for the first five tower modes. The mode frequency decrease changed up to 14 % if largertower inclinations of −αTI = 20 deg were incorporated, such as in case C1.
9.3 ASE Simulation Results of IEC 61400-1 LoadCases
This section shows the results of the full RILTASE analysis within the FAST framework and theadjusted SubDyn version. All modelling aspects and specifications are covered by the previouschapter 8. A large subset of the required DLCs according to IEC 61400-11 was chosen to beinvestigated in this section. The subset was the same subset as the one, which was analysedfor the reference configuration in subsection 3.5.3 to ensure comparability. The amount ofgenerated data in this work was so high2, that it was impossible to show it for every single loadsensor of every random seed and every DLC. Instead, a certain wind speed and random seed ofDLC 1.1 was used to explain how the results looked like in general and how tower inclinationaffected the loads. After that, further interesting DLCs are presented, especially if some specialthings occurred during the analysis.
1 An introduction to the different DLCs is given in subsection 2.2.2.2 The size of all ASE calculated sensor output files amounts to ≈ 470 GB. Note that these are text files and notmemory optimized binary files.
185
9 Structural Analysis of a Rotatable Inclined Lattice Tower
9.3.1 Normal Power Production
In the normal power production DLC 1.1 with NTM, mean wind speeds between the cut-in andcut-out wind speed were considered for 6 different random seeds and a mean wind directionof −8 deg, 0 deg and 8 deg. DLC 1.1 accounts for no transient wind or WT events. In thissubsection, a RILT according to case C3 in Table 9.3 was used.
The first (top) diagram in Figure 9.3 shows the stochastic wind with a mean value, equal to therated wind speed of 11.4 m/s and with a mean wind direction of 0 deg over the time periodof 600 s3. In this case, the main wind direction was parallel to the WTs rotor axis, whichwas parallel to the global x-axis. The blue coloured sensor Wind1VelY is the wind speedin y-direction and the red sensor Wind1VelX represents the wind speed in the x-direction,respectively.
In the second diagram the blade 1 pitch angle BldPitch1 is shown in blue. The WT has acollective pitch drive, wherefore a given pitch angle of one blade can be seen as equivalent tothe other two blades. Since the wind speed was around the rated wind speed, the pitch actuatorhad to increase the blades pitch angle from 0 deg in cases where the wind speed became morethan the rated wind speed. This happens to restrict the generator power to ≈ 5 MW and tolimit the loads in the system. The blade to tower clearance TipClrnc1 is shown in red andit was calculated with respect to its perpendicular distance to the tower wall in the case, thatthe blade tip pointed vertically downwards. In cases where the blade tip was above the yawbearing, TipClrnc1 represented the absolute distance to it4. Therefore, only the minima of thissensor were interesting. Note that the blade to tower clearance was already transformed into apercentage value of its unloaded state and accounts for tower inclination as well as for a PSFof γf γm γn = 1.35 × 1.1 × 1.0 = 1.4855. In subsection 2.2.8, the minimum allowed clearancefor different blade manufacturing testing procedures and operational conditions is discussed.Assuming the reference WT has blades with continuous bending stiffness control during theblade series production, the minimum allowed clearance is 20 % of its unloaded state. In thepresent case, the clearances became not less than 34.2 %.
The third diagram shows the rotor thrust RotThrust in blue and the rotor torque RotTorq in red.It can be seen, that the rotor torque rose only to about 4,500 kNm, because the blades pitchedout of the wind to reduce it at higher wind speeds. At time periods with less wind speed, therotor thrust and torque may fall to lower values. Then, the blades are fully pitched in, to 0 deg.A corresponding dip in the main wind speed Wind1VelX led consequently to a rotor thrustRotThrust and rotor torque RotTorq dip, such as shown at the time mark around 390 s. Notethat this was just a dip of the wind speed in the main wind direction. Since the wind speed rosesimultaneously in the transverse direction, this was rather a wind direction change than a windspeed dip.
3 The diagram shows a 600 s time period, which starts at 30 s to avoid the initialization influences. This commonpractice was likewise mentioned in subsection 3.5.1
4 Jonkman and Marshall [112, p. 95] explain how TipClrnc1 is calculated.5 The partial safety factors are chosen according to IEC 61400-1 [50, p. 48]
186
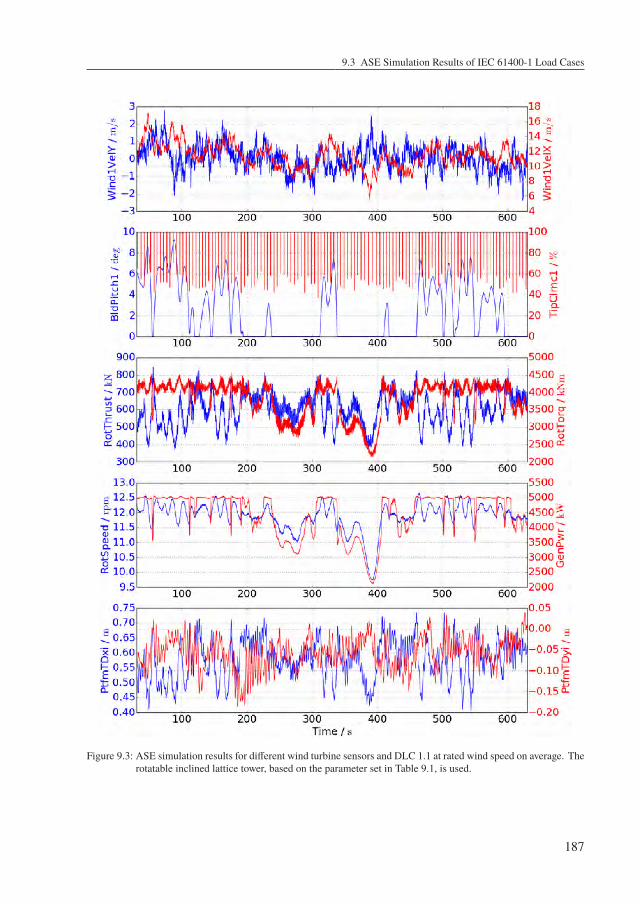
9.3 ASE Simulation Results of IEC 61400-1 Load Cases
Figure 9.3: ASE simulation results for different wind turbine sensors and DLC 1.1 at rated wind speed on average. Therotatable inclined lattice tower, based on the parameter set in Table 9.1, is used.
187
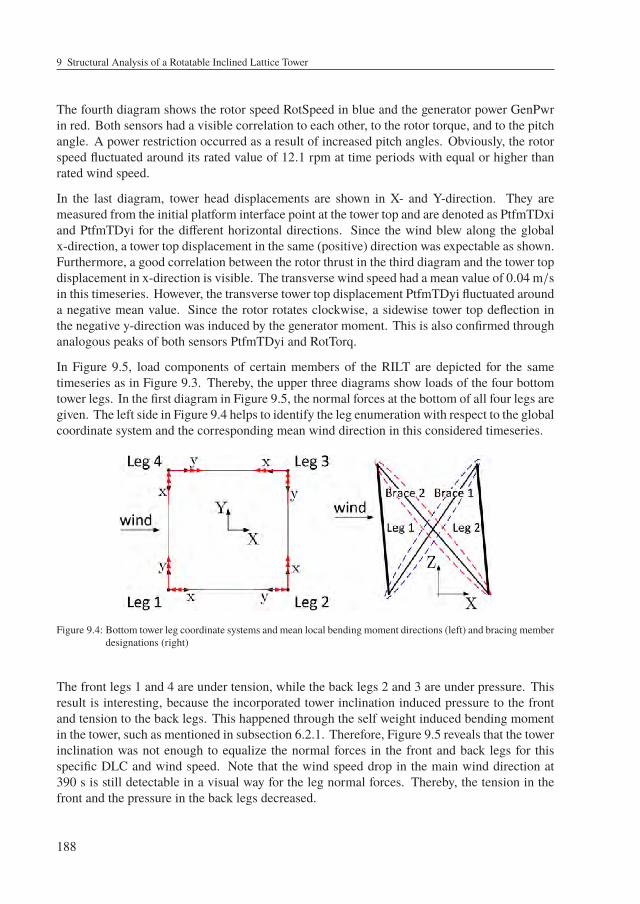
9 Structural Analysis of a Rotatable Inclined Lattice Tower
The fourth diagram shows the rotor speed RotSpeed in blue and the generator power GenPwrin red. Both sensors had a visible correlation to each other, to the rotor torque, and to the pitchangle. A power restriction occurred as a result of increased pitch angles. Obviously, the rotorspeed fluctuated around its rated value of 12.1 rpm at time periods with equal or higher thanrated wind speed.
In the last diagram, tower head displacements are shown in X- and Y-direction. They aremeasured from the initial platform interface point at the tower top and are denoted as PtfmTDxiand PtfmTDyi for the different horizontal directions. Since the wind blew along the globalx-direction, a tower top displacement in the same (positive) direction was expectable as shown.Furthermore, a good correlation between the rotor thrust in the third diagram and the tower topdisplacement in x-direction is visible. The transverse wind speed had a mean value of 0.04 m/sin this timeseries. However, the transverse tower top displacement PtfmTDyi fluctuated arounda negative mean value. Since the rotor rotates clockwise, a sidewise tower top deflection inthe negative y-direction was induced by the generator moment. This is also confirmed throughanalogous peaks of both sensors PtfmTDyi and RotTorq.
In Figure 9.5, load components of certain members of the RILT are depicted for the sametimeseries as in Figure 9.3. Thereby, the upper three diagrams show loads of the four bottomtower legs. In the first diagram in Figure 9.5, the normal forces at the bottom of all four legs aregiven. The left side in Figure 9.4 helps to identify the leg enumeration with respect to the globalcoordinate system and the corresponding mean wind direction in this considered timeseries.
Figure 9.4: Bottom tower leg coordinate systems and mean local bending moment directions (left) and bracing memberdesignations (right)
The front legs 1 and 4 are under tension, while the back legs 2 and 3 are under pressure. Thisresult is interesting, because the incorporated tower inclination induced pressure to the frontand tension to the back legs. This happened through the self weight induced bending momentin the tower, such as mentioned in subsection 6.2.1. Therefore, Figure 9.5 reveals that the towerinclination was not enough to equalize the normal forces in the front and back legs for thisspecific DLC and wind speed. Note that the wind speed drop in the main wind direction at390 s is still detectable in a visual way for the leg normal forces. Thereby, the tension in thefront and the pressure in the back legs decreased.
188
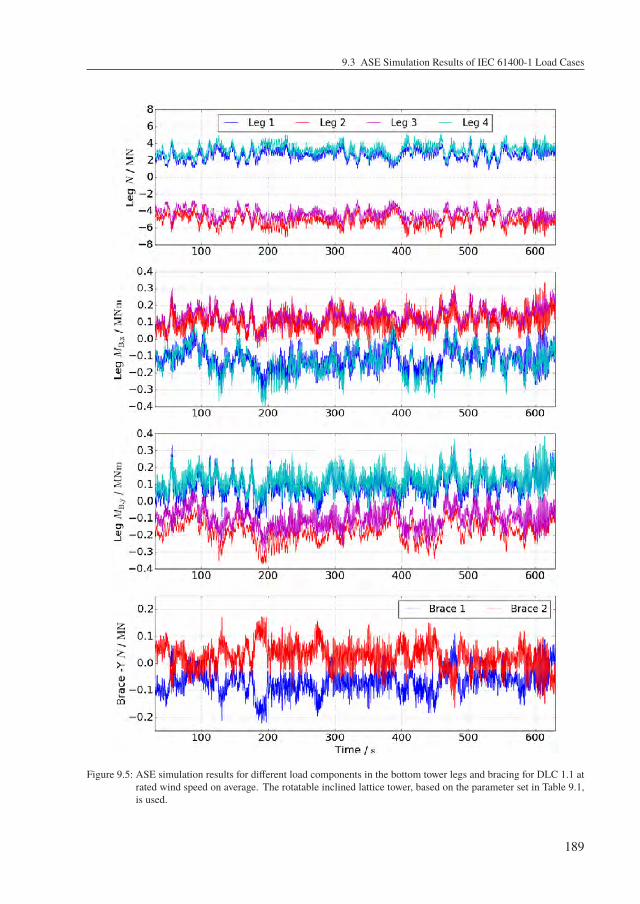
9.3 ASE Simulation Results of IEC 61400-1 Load Cases
Figure 9.5: ASE simulation results for different load components in the bottom tower legs and bracing for DLC 1.1 atrated wind speed on average. The rotatable inclined lattice tower, based on the parameter set in Table 9.1,is used.
189
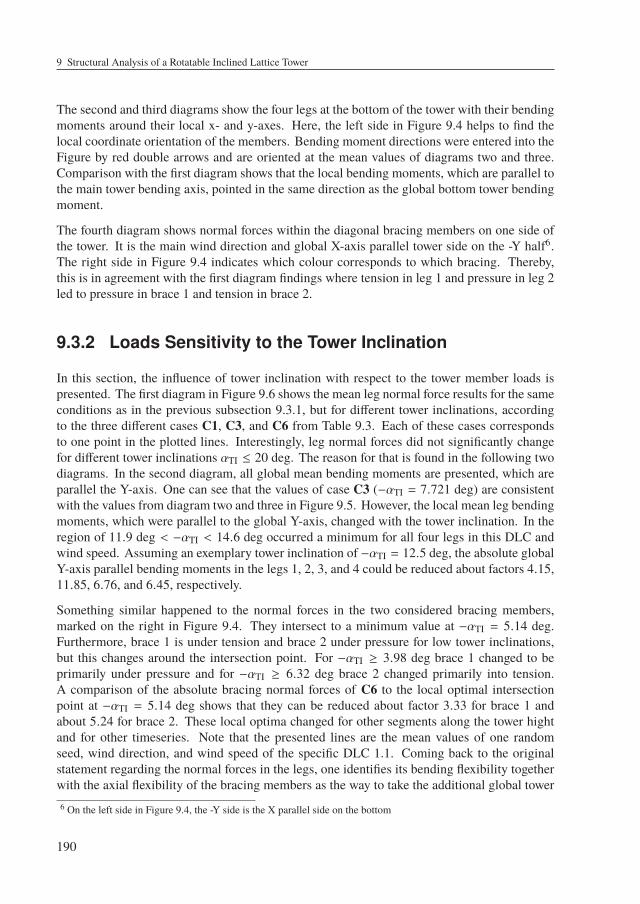
9 Structural Analysis of a Rotatable Inclined Lattice Tower
The second and third diagrams show the four legs at the bottom of the tower with their bendingmoments around their local x- and y-axes. Here, the left side in Figure 9.4 helps to find thelocal coordinate orientation of the members. Bending moment directions were entered into theFigure by red double arrows and are oriented at the mean values of diagrams two and three.Comparison with the first diagram shows that the local bending moments, which are parallel tothe main tower bending axis, pointed in the same direction as the global bottom tower bendingmoment.
The fourth diagram shows normal forces within the diagonal bracing members on one side ofthe tower. It is the main wind direction and global X-axis parallel tower side on the -Y half6.The right side in Figure 9.4 indicates which colour corresponds to which bracing. Thereby,this is in agreement with the first diagram findings where tension in leg 1 and pressure in leg 2led to pressure in brace 1 and tension in brace 2.
9.3.2 Loads Sensitivity to the Tower Inclination
In this section, the influence of tower inclination with respect to the tower member loads ispresented. The first diagram in Figure 9.6 shows the mean leg normal force results for the sameconditions as in the previous subsection 9.3.1, but for different tower inclinations, accordingto the three different cases C1, C3, and C6 from Table 9.3. Each of these cases correspondsto one point in the plotted lines. Interestingly, leg normal forces did not significantly changefor different tower inclinations αTI ≤ 20 deg. The reason for that is found in the following twodiagrams. In the second diagram, all global mean bending moments are presented, which areparallel the Y-axis. One can see that the values of case C3 (−αTI = 7.721 deg) are consistentwith the values from diagram two and three in Figure 9.5. However, the local mean leg bendingmoments, which were parallel to the global Y-axis, changed with the tower inclination. In theregion of 11.9 deg < −αTI < 14.6 deg occurred a minimum for all four legs in this DLC andwind speed. Assuming an exemplary tower inclination of −αTI = 12.5 deg, the absolute globalY-axis parallel bending moments in the legs 1, 2, 3, and 4 could be reduced about factors 4.15,11.85, 6.76, and 6.45, respectively.
Something similar happened to the normal forces in the two considered bracing members,marked on the right in Figure 9.4. They intersect to a minimum value at −αTI = 5.14 deg.Furthermore, brace 1 is under tension and brace 2 under pressure for low tower inclinations,but this changes around the intersection point. For −αTI ≥ 3.98 deg brace 1 changed to beprimarily under pressure and for −αTI ≥ 6.32 deg brace 2 changed primarily into tension.A comparison of the absolute bracing normal forces of C6 to the local optimal intersectionpoint at −αTI = 5.14 deg shows that they can be reduced about factor 3.33 for brace 1 andabout 5.24 for brace 2. These local optima changed for other segments along the tower hightand for other timeseries. Note that the presented lines are the mean values of one randomseed, wind direction, and wind speed of the specific DLC 1.1. Coming back to the originalstatement regarding the normal forces in the legs, one identifies its bending flexibility togetherwith the axial flexibility of the bracing members as the way to take the additional global tower6 On the left side in Figure 9.4, the -Y side is the X parallel side on the bottom
190
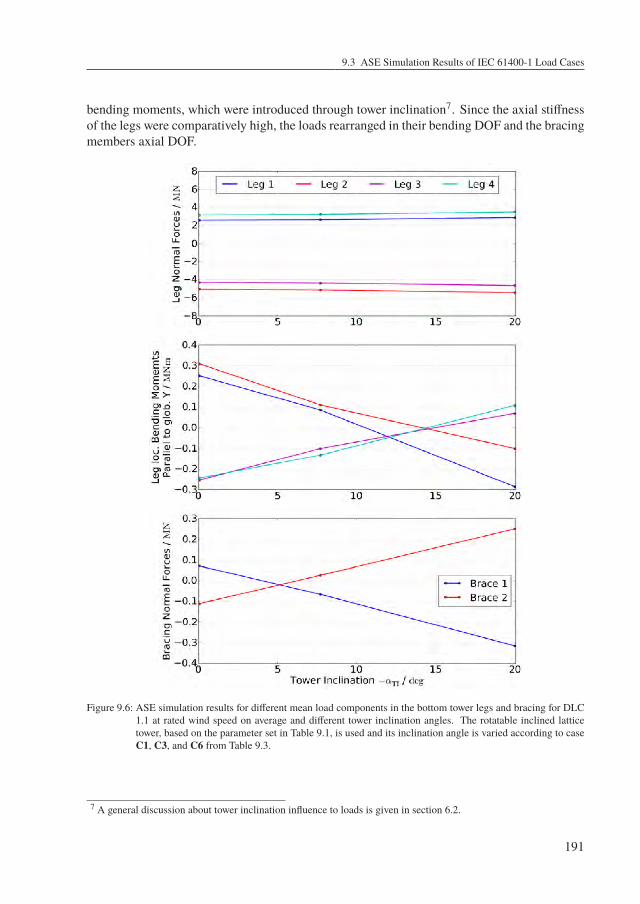
9.3 ASE Simulation Results of IEC 61400-1 Load Cases
bending moments, which were introduced through tower inclination7. Since the axial stiffnessof the legs were comparatively high, the loads rearranged in their bending DOF and the bracingmembers axial DOF.
Figure 9.6: ASE simulation results for different mean load components in the bottom tower legs and bracing for DLC1.1 at rated wind speed on average and different tower inclination angles. The rotatable inclined latticetower, based on the parameter set in Table 9.1, is used and its inclination angle is varied according to caseC1, C3, and C6 from Table 9.3.
7 A general discussion about tower inclination influence to loads is given in section 6.2.
191
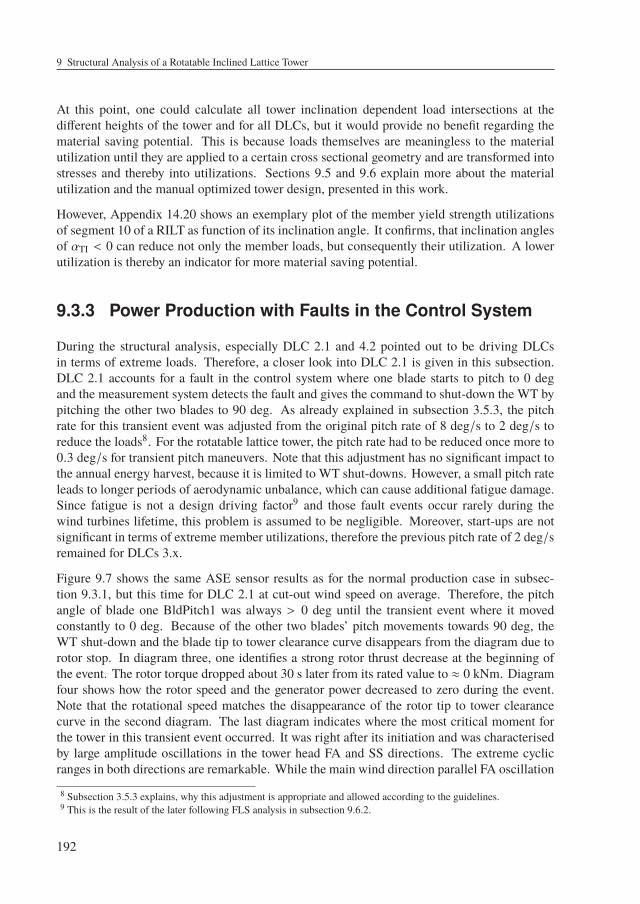
9 Structural Analysis of a Rotatable Inclined Lattice Tower
At this point, one could calculate all tower inclination dependent load intersections at thedifferent heights of the tower and for all DLCs, but it would provide no benefit regarding thematerial saving potential. This is because loads themselves are meaningless to the materialutilization until they are applied to a certain cross sectional geometry and are transformed intostresses and thereby into utilizations. Sections 9.5 and 9.6 explain more about the materialutilization and the manual optimized tower design, presented in this work.
However, Appendix 14.20 shows an exemplary plot of the member yield strength utilizationsof segment 10 of a RILT as function of its inclination angle. It confirms, that inclination anglesof αTI < 0 can reduce not only the member loads, but consequently their utilization. A lowerutilization is thereby an indicator for more material saving potential.
9.3.3 Power Production with Faults in the Control System
During the structural analysis, especially DLC 2.1 and 4.2 pointed out to be driving DLCsin terms of extreme loads. Therefore, a closer look into DLC 2.1 is given in this subsection.DLC 2.1 accounts for a fault in the control system where one blade starts to pitch to 0 degand the measurement system detects the fault and gives the command to shut-down the WT bypitching the other two blades to 90 deg. As already explained in subsection 3.5.3, the pitchrate for this transient event was adjusted from the original pitch rate of 8 deg/s to 2 deg/s toreduce the loads8. For the rotatable lattice tower, the pitch rate had to be reduced once more to0.3 deg/s for transient pitch maneuvers. Note that this adjustment has no significant impact tothe annual energy harvest, because it is limited to WT shut-downs. However, a small pitch rateleads to longer periods of aerodynamic unbalance, which can cause additional fatigue damage.Since fatigue is not a design driving factor9 and those fault events occur rarely during thewind turbines lifetime, this problem is assumed to be negligible. Moreover, start-ups are notsignificant in terms of extreme member utilizations, therefore the previous pitch rate of 2 deg/sremained for DLCs 3.x.
Figure 9.7 shows the same ASE sensor results as for the normal production case in subsec-tion 9.3.1, but this time for DLC 2.1 at cut-out wind speed on average. Therefore, the pitchangle of blade one BldPitch1 was always > 0 deg until the transient event where it movedconstantly to 0 deg. Because of the other two blades’ pitch movements towards 90 deg, theWT shut-down and the blade tip to tower clearance curve disappears from the diagram due torotor stop. In diagram three, one identifies a strong rotor thrust decrease at the beginning ofthe event. The rotor torque dropped about 30 s later from its rated value to ≈ 0 kNm. Diagramfour shows how the rotor speed and the generator power decreased to zero during the event.Note that the rotational speed matches the disappearance of the rotor tip to tower clearancecurve in the second diagram. The last diagram indicates where the most critical moment forthe tower in this transient event occurred. It was right after its initiation and was characterisedby large amplitude oscillations in the tower head FA and SS directions. The extreme cyclicranges in both directions are remarkable. While the main wind direction parallel FA oscillation
8 Subsection 3.5.3 explains, why this adjustment is appropriate and allowed according to the guidelines.9 This is the result of the later following FLS analysis in subsection 9.6.2.
192
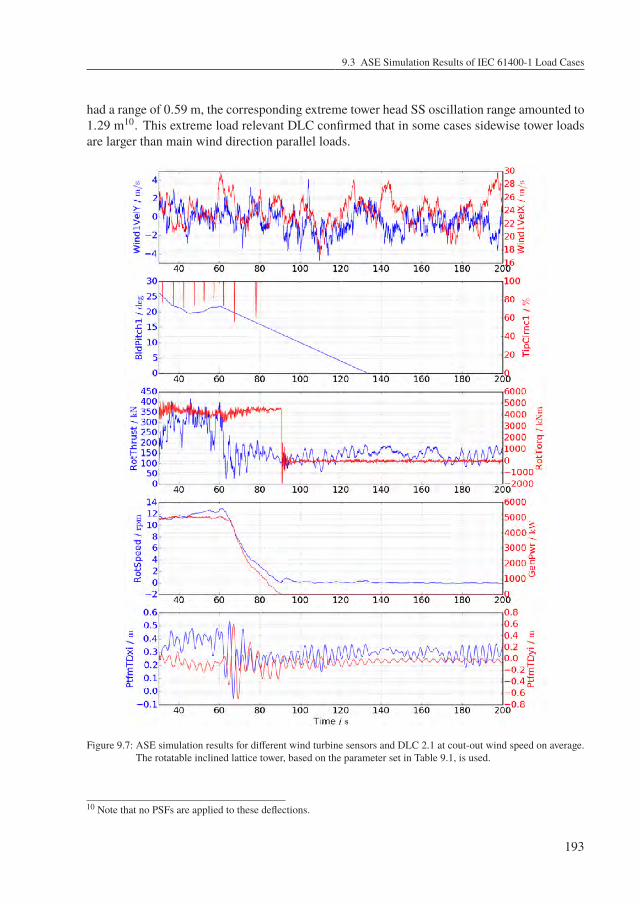
9.3 ASE Simulation Results of IEC 61400-1 Load Cases
had a range of 0.59 m, the corresponding extreme tower head SS oscillation range amounted to1.29 m10. This extreme load relevant DLC confirmed that in some cases sidewise tower loadsare larger than main wind direction parallel loads.
Figure 9.7: ASE simulation results for different wind turbine sensors and DLC 2.1 at cout-out wind speed on average.The rotatable inclined lattice tower, based on the parameter set in Table 9.1, is used.
10 Note that no PSFs are applied to these deflections.
193
9 Structural Analysis of a Rotatable Inclined Lattice Tower
9.3.4 Shut-Down with EOG (Mexican Hat)
Figure 9.8: ASE simulation results for different wind turbine sensors and DLC 2.2 at cout-out wind speed on average.The rotatable inclined lattice tower, based on the parameter set in Table 9.1, is used.
The other extreme load relevant DLC is 4.2. In DLC 4.2, a normal WT shut-down is performedwhile the Mexican hat shaped wind speed change, called EOG, happens simultaneously. Fig-ure 9.8 shows its results for a mainly constant cut-out wind speed and the WT shut-down starts
194
9.4 Post Processing Loads
6.3 s after the Mexican hat initiation. The critical aspect of this DLC is the wind speed drop atthe beginning of the wind event where the WT drives the pitch to lower values, such as shownin the first two diagrams. The following rapid increase in the wind speed was faster than thepitch system was able to follow it. Therefore, the rotor thrust increased drastically, such asshown in the third diagram. Since the wind speed dropped very quick after the tip of the hatand thereby the rotor thrust, a large tower head oscillation range along the main wind directionwas the consequence. Its range amounted to 1.145 m in this case.
Note that the fist bending eigenfrequencies of the tower got hit by the 3p excitation frequenciesduring the WTs shut-down. The resonance, shown in the last diagram, started at a rotationalspeed of RotSpeed ≤ 6 rpm, such as predicted by the Campbell diagram in Figure 9.2. Theresonance time period was elongated through the decreased pitch rate, such as introduced inthe previous subsection 9.3.3. However, start-up and shut-down ASE timeseries were includedin the fatigue analysis where this effect was covered.
9.3.5 Transport and Installation
The transport and installation DLCs are not part of the ASE analyses. Transport of singlelattice members was not expected to play a crucial role in terms of their loads. However,caution should be given to their storage in the workshop and on the transport trucks. Forall cases, scratches on the surfaces of lattice members should be avoided to hinder lifetimereductions. Installation of the proposed lattice tower should be carried out according to state-of-the-art procedures. Thereby, settlement in the bolted joints requires attention regardingpre-loading losses. Moreover, an inclined lattice tower would show other settlement patternsthan conventional ones. At this point, some more work is required to develop an appropriateinstallation procedure, but it was out of scope for this work.
9.4 Post Processing Loads
In the past, WT lattice structures have been analysed by using an equivalent stiffness and massmatrix beneath the RNA within the ASE simulation. Thereby, the extracted tower head loadshave been applied to the full FEM structure in another software solution to obtain all necessaryproofs. FAST and the in this work adjusted SubDyn module provided timeseries of all sixload components at each joint of all members within the tower for all DLCs, random seeds,wind speeds, and wind directions. Therefore, usage of another FEM software was not morenecessary. Instead all load timeseries had to be transformed into stress timeseries throughconsideration of the members geometry. In the following subsection 9.4.1, the influence ofwarping stresses is estimated and afterwards the considered stresses for this work are presentedin subsection 9.4.2.
195
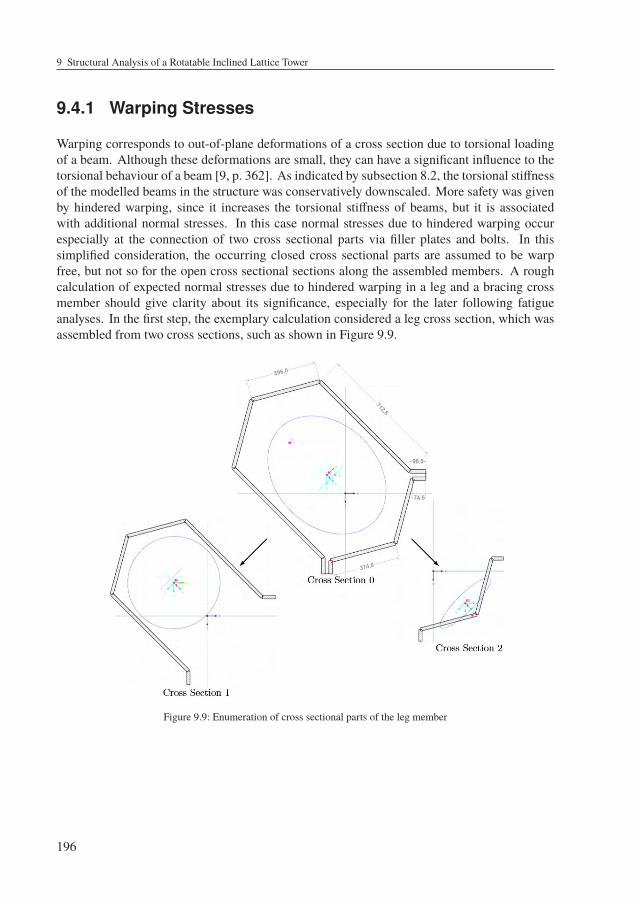
9 Structural Analysis of a Rotatable Inclined Lattice Tower
9.4.1 Warping Stresses
Warping corresponds to out-of-plane deformations of a cross section due to torsional loadingof a beam. Although these deformations are small, they can have a significant influence to thetorsional behaviour of a beam [9, p. 362]. As indicated by subsection 8.2, the torsional stiffnessof the modelled beams in the structure was conservatively downscaled. More safety was givenby hindered warping, since it increases the torsional stiffness of beams, but it is associatedwith additional normal stresses. In this case normal stresses due to hindered warping occurespecially at the connection of two cross sectional parts via filler plates and bolts. In thissimplified consideration, the occurring closed cross sectional parts are assumed to be warpfree, but not so for the open cross sectional sections along the assembled members. A roughcalculation of expected normal stresses due to hindered warping in a leg and a bracing crossmember should give clarity about its significance, especially for the later following fatigueanalyses. In the first step, the exemplary calculation considered a leg cross section, which wasassembled from two cross sections, such as shown in Figure 9.9.
Figure 9.9: Enumeration of cross sectional parts of the leg member
196
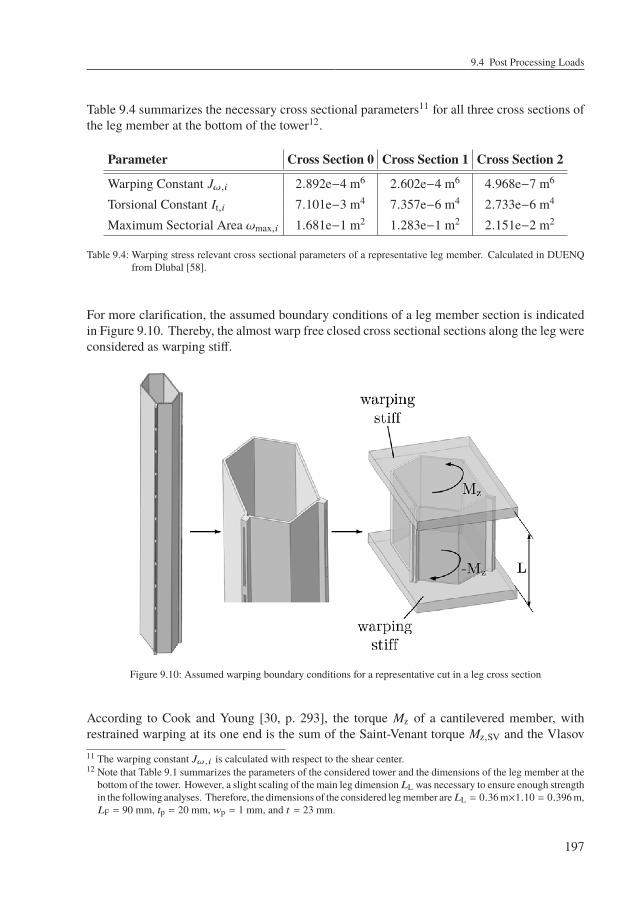
9.4 Post Processing Loads
Table 9.4 summarizes the necessary cross sectional parameters11 for all three cross sections ofthe leg member at the bottom of the tower12.
Parameter Cross Section 0 Cross Section 1 Cross Section 2
Warping Constant Jω,i 2.892e−4 m6 2.602e−4 m6 4.968e−7 m6
Torsional Constant It,i 7.101e−3 m4 7.357e−6 m4 2.733e−6 m4
Maximum Sectorial Area ωmax,i 1.681e−1 m2 1.283e−1 m2 2.151e−2 m2
Table 9.4: Warping stress relevant cross sectional parameters of a representative leg member. Calculated in DUENQfrom Dlubal [58].
For more clarification, the assumed boundary conditions of a leg member section is indicatedin Figure 9.10. Thereby, the almost warp free closed cross sectional sections along the leg wereconsidered as warping stiff.
Figure 9.10: Assumed warping boundary conditions for a representative cut in a leg cross section
According to Cook and Young [30, p. 293], the torque Mz of a cantilevered member, withrestrained warping at its one end is the sum of the Saint-Venant torque Mz,SV and the Vlasov11 The warping constant Jω,i is calculated with respect to the shear center.12 Note that Table 9.1 summarizes the parameters of the considered tower and the dimensions of the leg member at the
bottom of the tower. However, a slight scaling of the main leg dimension LL was necessary to ensure enough strengthin the following analyses. Therefore, the dimensions of the considered legmember are LL = 0.36 m×1.10 = 0.396 m,LF = 90 mm, tp = 20 mm, wp = 1 mm, and t = 23 mm.
197
9 Structural Analysis of a Rotatable Inclined Lattice Tower
torque Mz,q. The first is associated with the cross sectional shear stresses and the second withrestrained warping. Thus
Mz = Mz,SV + Mz,q = G It κz + Mz,q (9.3)
Cook and Young [30, p. 281] present the general solution for the twist rate κz(z) as a resultof integration of the differential equation. It is given for arbitrary locations along the beam inEquation 9.4.
κz(z) =Mz
G It+ C1 sinh (k z) + C2 cosh (k z) (9.4)
C1 and C2 in Equation 9.4 are integration constants, which can be calculated with respect tothe assumed boundary conditions. In the present case, boundary conditions were no warpingat both ends of the beam, thus κz(z = 0) = 0 and κz(z = L) = 0. Using these conditions inEquation 9.4 delivers the twist rate as function of z according to
κz(z) =Mz
G It
[1 − cosh (k z) −
(1 − cosh (k L))sinh (k L)
sinh (k z)]
(9.5)
where k =√
G It
E Jωand L = 10 m was the intentionally conservative13 assumed length of
the considered member. In this case, the warping constant Jω and torsional constant It werechosen to be the sum of the values of both open cross sections 1 and 2 in Figure 9.9, instead ofthe values of the closed cross section 0. For more clarification, this is likewise represented inEquation 9.6.
It =It,1 + It,2 = 7.357e−6 m4 + 2.733e−6 m4 = 1.010e−5m4 , It,0
Jω =Jω,1 + Jω,2 = 2.602e−4 m6 + 4.968e−7 m6 = 2.607e−4m6 , Jω,0(9.6)
As introduced, the previous Equation 9.5 led to κz(z = 0) = κz(z = L) = 0 deg/m and byconsideration of Equation 9.3 the Saint-Venant torque became Mz,SV(z = 0) = Mz,SV(z = L) =G It 0 deg/m = 0 Nm and consequently Mz(z = 0) = Mz,q(z = 0) = Mz,q(z = L).
Since the cross section 0 was assembled from two other cross sections 1 and 2, the torsionalmoments on cross section 0 were split-up according to Equation 9.7 from PCAE [147, p. 31].
Mz,SV,i =It,i
ItMz,SV
Mz,q,i =Jω,iJω
Mz,q
(9.7)
13 Since the leg members were assembled from two cross sectional parts, which were connected to each other indistances of < 1 m << 10 m, the chosen length L accounts for the leg member, as if it would not be assembledover its whole length. The critical part with respect to normal stresses appears, where the two separated open crosssectional parts were connected through bolts and filler plates.
198
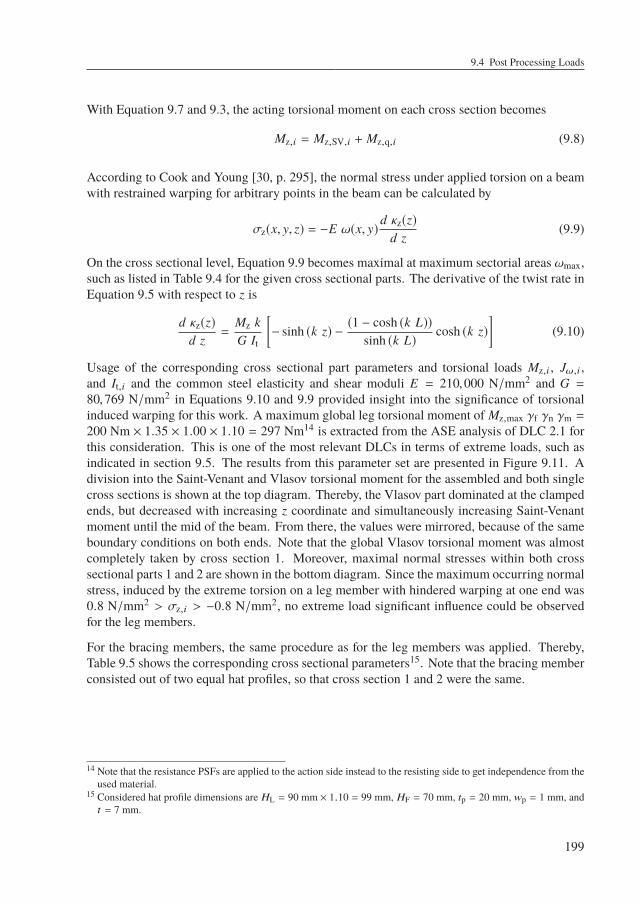
9.4 Post Processing Loads
With Equation 9.7 and 9.3, the acting torsional moment on each cross section becomes
Mz,i = Mz,SV,i + Mz,q,i (9.8)
According to Cook and Young [30, p. 295], the normal stress under applied torsion on a beamwith restrained warping for arbitrary points in the beam can be calculated by
σz(x, y, z) = −E ω(x, y)d κz(z)
d z(9.9)
On the cross sectional level, Equation 9.9 becomes maximal at maximum sectorial areas ωmax,such as listed in Table 9.4 for the given cross sectional parts. The derivative of the twist rate inEquation 9.5 with respect to z is
d κz(z)d z
=Mz kG It
[− sinh (k z) −
(1 − cosh (k L))sinh (k L)
cosh (k z)]
(9.10)
Usage of the corresponding cross sectional part parameters and torsional loads Mz,i , Jω,i ,and It,i and the common steel elasticity and shear moduli E = 210,000 N/mm2 and G =80,769 N/mm2 in Equations 9.10 and 9.9 provided insight into the significance of torsionalinduced warping for this work. A maximum global leg torsional moment of Mz,max γf γn γm =
200 Nm × 1.35 × 1.00 × 1.10 = 297 Nm14 is extracted from the ASE analysis of DLC 2.1 forthis consideration. This is one of the most relevant DLCs in terms of extreme loads, such asindicated in section 9.5. The results from this parameter set are presented in Figure 9.11. Adivision into the Saint-Venant and Vlasov torsional moment for the assembled and both singlecross sections is shown at the top diagram. Thereby, the Vlasov part dominated at the clampedends, but decreased with increasing z coordinate and simultaneously increasing Saint-Venantmoment until the mid of the beam. From there, the values were mirrored, because of the sameboundary conditions on both ends. Note that the global Vlasov torsional moment was almostcompletely taken by cross section 1. Moreover, maximal normal stresses within both crosssectional parts 1 and 2 are shown in the bottom diagram. Since the maximum occurring normalstress, induced by the extreme torsion on a leg member with hindered warping at one end was0.8 N/mm2 > σz,i > −0.8 N/mm2, no extreme load significant influence could be observedfor the leg members.
For the bracing members, the same procedure as for the leg members was applied. Thereby,Table 9.5 shows the corresponding cross sectional parameters15. Note that the bracing memberconsisted out of two equal hat profiles, so that cross section 1 and 2 were the same.
14 Note that the resistance PSFs are applied to the action side instead to the resisting side to get independence from theused material.
15 Considered hat profile dimensions are HL = 90 mm × 1.10 = 99 mm, HF = 70 mm, tp = 20 mm, wp = 1 mm, andt = 7 mm.
199
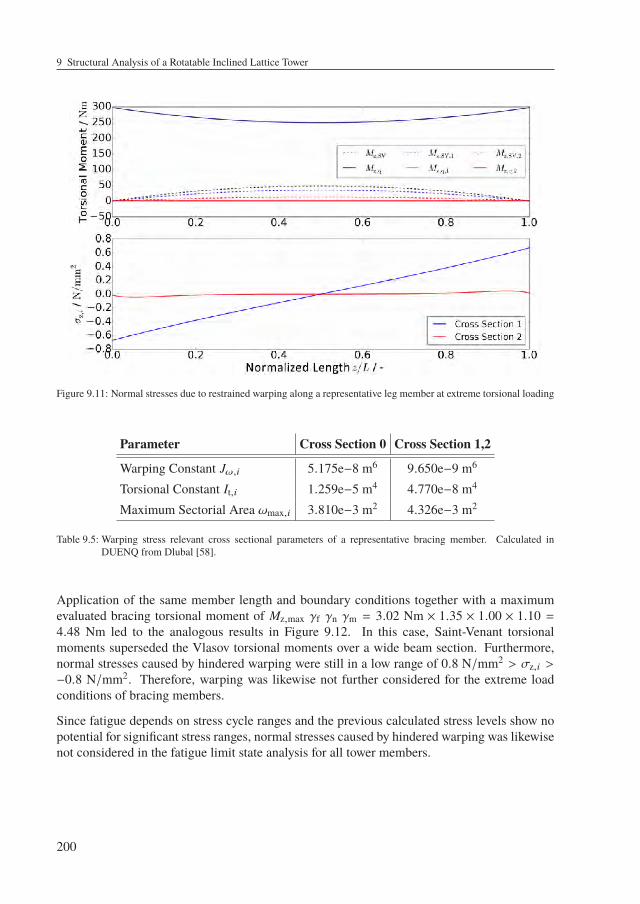
9 Structural Analysis of a Rotatable Inclined Lattice Tower
Figure 9.11: Normal stresses due to restrained warping along a representative leg member at extreme torsional loading
Parameter Cross Section 0 Cross Section 1,2
Warping Constant Jω,i 5.175e−8 m6 9.650e−9 m6
Torsional Constant It,i 1.259e−5 m4 4.770e−8 m4
Maximum Sectorial Area ωmax,i 3.810e−3 m2 4.326e−3 m2
Table 9.5: Warping stress relevant cross sectional parameters of a representative bracing member. Calculated inDUENQ from Dlubal [58].
Application of the same member length and boundary conditions together with a maximumevaluated bracing torsional moment of Mz,max γf γn γm = 3.02 Nm × 1.35 × 1.00 × 1.10 =4.48 Nm led to the analogous results in Figure 9.12. In this case, Saint-Venant torsionalmoments superseded the Vlasov torsional moments over a wide beam section. Furthermore,normal stresses caused by hindered warping were still in a low range of 0.8 N/mm2 > σz,i >−0.8 N/mm2. Therefore, warping was likewise not further considered for the extreme loadconditions of bracing members.
Since fatigue depends on stress cycle ranges and the previous calculated stress levels show nopotential for significant stress ranges, normal stresses caused by hindered warping was likewisenot considered in the fatigue limit state analysis for all tower members.
200
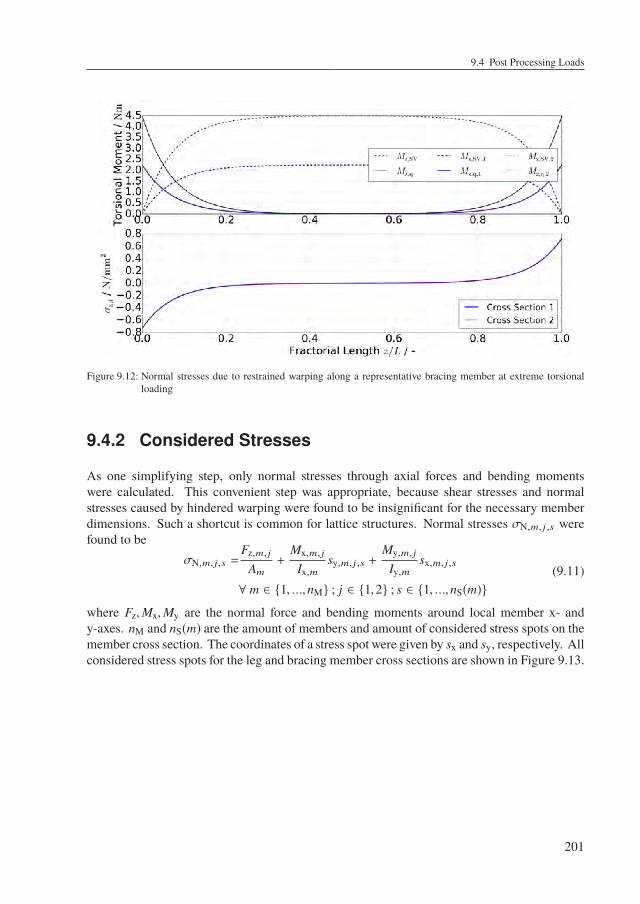
9.4 Post Processing Loads
Figure 9.12: Normal stresses due to restrained warping along a representative bracing member at extreme torsionalloading
9.4.2 Considered Stresses
As one simplifying step, only normal stresses through axial forces and bending momentswere calculated. This convenient step was appropriate, because shear stresses and normalstresses caused by hindered warping were found to be insignificant for the necessary memberdimensions. Such a shortcut is common for lattice structures. Normal stresses σN,m, j ,s werefound to be
σN,m, j ,s =Fz,m, j
Am+
Mx,m, j
Ix,msy,m, j ,s +
My,m, j
Iy,msx,m, j ,s
∀ m ∈ 1, ...,nM ; j ∈ 1,2 ; s ∈ 1, ...,nS(m)(9.11)
where Fz,Mx,My are the normal force and bending moments around local member x- andy-axes. nM and nS(m) are the amount of members and amount of considered stress spots on themember cross section. The coordinates of a stress spot were given by sx and sy, respectively. Allconsidered stress spots for the leg and bracing member cross sections are shown in Figure 9.13.
201
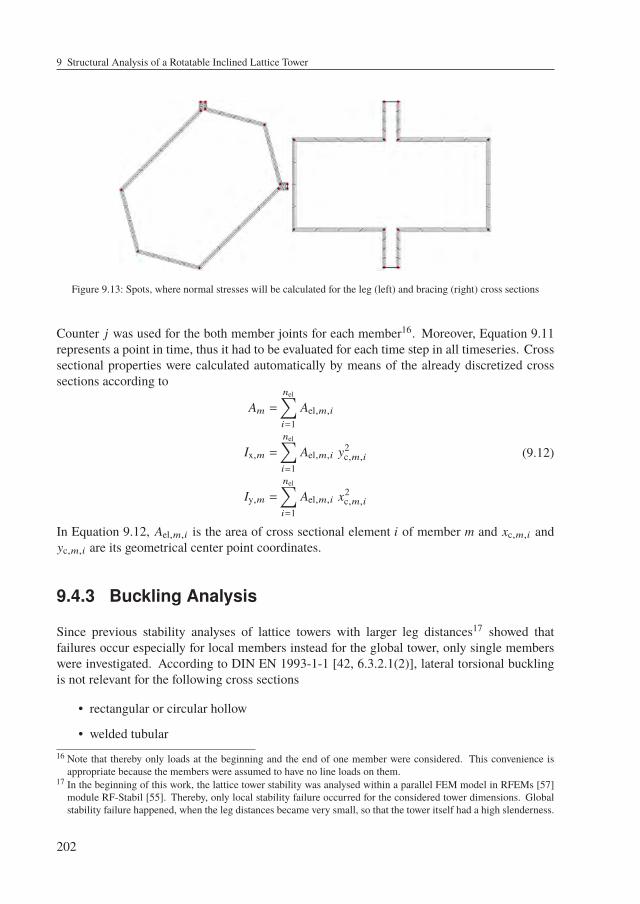
9 Structural Analysis of a Rotatable Inclined Lattice Tower
Figure 9.13: Spots, where normal stresses will be calculated for the leg (left) and bracing (right) cross sections
Counter j was used for the both member joints for each member16. Moreover, Equation 9.11represents a point in time, thus it had to be evaluated for each time step in all timeseries. Crosssectional properties were calculated automatically by means of the already discretized crosssections according to
Am =
nel∑i=1
Ael,m,i
Ix,m =
nel∑i=1
Ael,m,i y2c,m,i
Iy,m =
nel∑i=1
Ael,m,i x2c,m,i
(9.12)
In Equation 9.12, Ael,m,i is the area of cross sectional element i of member m and xc,m,i andyc,m,i are its geometrical center point coordinates.
9.4.3 Buckling Analysis
Since previous stability analyses of lattice towers with larger leg distances17 showed thatfailures occur especially for local members instead for the global tower, only single memberswere investigated. According to DIN EN 1993-1-1 [42, 6.3.2.1(2)], lateral torsional bucklingis not relevant for the following cross sections
• rectangular or circular hollow
• welded tubular16 Note that thereby only loads at the beginning and the end of one member were considered. This convenience is
appropriate because the members were assumed to have no line loads on them.17 In the beginning of this work, the lattice tower stability was analysed within a parallel FEM model in RFEMs [57]
module RF-Stabil [55]. Thereby, only local stability failure occurred for the considered tower dimensions. Globalstability failure happened, when the leg distances became very small, so that the tower itself had a high slenderness.
202
9.5 Ultimate Limit State Analysis
• box
Since all leg and bracing cross sections were assembled cross sections, which have theminimumfiller plate distance of 15 imin
18, they could be seen as one cross section in stability analyses.By that they built a box like shape, wherefore lateral torsional buckling should not becomerelevant according to the previous list. The applied analyses in this work took place accordingto an equivalent member method, such as suggested in the first part of the buckling analysisparagraph in subsection 2.2.5. This means that only buckling of single members subject tonormal forces was considered. For the equivalent leg and bracing members, the system lengthbetween two joints was the buckling length Lcr and the buckling curve b19 was chosen for allmembers and all bending axes. The choice of the buckling curve was based on the assumptionthat the cross sections were like hot manufactured hollow boxes. Although this would lead toa higher buckling curve a, the more conservative one b was used.
This approach was a very fundamental and rough way to get a first guess for the stability ofthe structure, since the proof was carried out for all members of all time steps in all computedtimeseries. Procedures, such as full FEM analyses with introduced imperfections can bringmore accurate results. For example they account for the influence of additional bendingmoments and their interaction with the axial loads or they can model the members with theirassembled and discontinuous cross section more precisely, but for the scope of this work thestandard hand calculation was chosen to be sufficient.
9.5 Ultimate Limit State Analysis
In this section, three different parts are considered for the ULS of the RILT and the performedASE simulation. In the first subsection 9.5.1, the influence of tower aerodynamics on themember loads is predicted, the second subsection 9.5.2 presents the resulting extreme load uti-lization for the RILTwith 87.6 m tower height according to caseC3, and the last subsection 9.8.2analyses the occurring blade tip to tower clearances.
9.5.1 Tower Aerodynamic Induced Loads
Since SubDyn has no capability to account for aerodynamic tower loads, they were not includedin the ASE load analyses. Therefore, this subsection shows an estimation for loads due toaerodynamic drag on the tower itself. The general procedure how aerodynamic lattice towerloads are calculatedwith respect to the Eurocode 3 standard, are summarized in subsection 2.7.6.For this investigation, the tower defined in Table 9.1 was used and analytically analysed fortwo wind situations. Situation (1) corresponded to a 50 year extreme wind speed of 50 m/saccording to DLC 6.2 with a load PSF of γf = 1.1 and power law exponent of α = 0.11. In thesecond situation (2), an arbitrary DLC at cut-out wind speed of 25 m/s was considered with18 This aspect was explained in subsection 7.1.3.19 This corresponds to an imperfection coefficient of α = 0.34 in Equation 2.33.
203
9 Structural Analysis of a Rotatable Inclined Lattice Tower
γf = 1.35 and α = 0.2. In both wind situations, two different wind directions were investigated:(a) frontal and (b) diagonal with respect to the square tower cross section. In this investigation,the tower was seen as being vertical, but with an artificial increased height HT,aero, namely
HT,aero =HT
cos (αTI)= 88.4 m (9.13)
The conservative tower height scaling in Equation 9.13 is applied to both wind directions. Thewind force on a lattice structure is defined by Equation 2.52 where the structural coefficientbecame cscd = 1, because wind gusts and major structural dynamic effects were alreadyrepresented in the ASE analyses. The force coefficient cf required two other values, namelythe basic force coefficient cf,0 and the reduction factor ψλ. cf,0 could be extracted from thebottom diagrams in Figure 2.22 for the present situations. The required Reynolds number wascalculated with respect to the NWP, and a kinematic viscosity of ν = 13.3e−6 m2/s20 for air.Appendix 14.21 shows the calculated Reynolds numbers for the RILT, which were in the regionof 4.6e4 ≤ Re ≤ 2.3e5 for all lattice tower members and considered wind speeds. The towerwall area could be calculated according to Equation 9.14
Ac,front =HT,aero
(aT +
aT + aB
2
)Ac,diag =Ac,front
√2
(9.14)
where the index front and diag correspond to the considered different wind directions (a) and (b),respectively. Analogously, the reference area for both situations is calculated as
Aref,front =SFA
Nseg∑i=1
Aref,front,i = SFA
Nseg∑i=1
2 bL,p,i hi + 2 bB,p,i
√h2i + a2
i − b2B,p,i
Aref,diag =Aref,front√
2
(9.15)
where SFA = 1.1 is a scaling factor to account for additional tower attachments, such as aladder, cables, and gusset plates. bL,p,i and bB,p,i in Equation 9.15 are the projected widths inair flow direction of the leg and bracing members of segment i. These projected widths arecalculated as
bL,p,i =2 LL,i
bB,p,i =
√(HL,i + 2 HF,i
)2+ H2
L,i
∀ i ∈1, ...,Nseg
(9.16)
where all member dimensions are linear interpolated between their tower top and bottom valuesin Table 9.1. Due to the following utilization study, some member dimensions had manually
20 This value was taken from Kuchling [127, p. 622] and an air temperature of 20 C.
204
9.5 Ultimate Limit State Analysis
been adjusted to slightly larger or smaller values. All exact used member parameters aredocumented in Appendix 14.22. Using Equations 9.14 and 9.15 in Equation 2.54 delivers
ϕfront =Aref,front
Ac,front=
178.26 m2
499.47 m2 = 0.36
ϕdiag =Aref,diag
Ac,diag=
188.80 m2
706.35 m2 = 0.27(9.17)
These member densities together with the evaluated Reynolds number range was used to extractcf,0,front = 1.65 and cf,0,diag = 1.95 from the bottom diagrams in Figure 2.22. The slendernessof the structure was calculated with respect to Equation 2.56 by
λfront =min1.4
HT,aero
(aB + aT) /2,70
= 21.90
λdiag =min
1.4
HT,aero
(aB + aT) /√
2,70
= 15.49
(9.18)
and was used together with the corresponding member density to read the reduction factorsψλ,front = ψλ,diag = 0.94 out of Figure 2.23. By collecting all these factors, one can calculatethe shear forces at each tower segment by
Fw,front,i =cf,front VH
(zizH
)αAref,front,i
Fw,diag,i =cf,diag VH
(zizH
)αAref,diag,i
(9.19)
where zi was conservatively assumed to be the altitude of the top of segment i. The resultingshear forces are accumulated by
Facc,front,i =
Nseg∑j=i
Fw,front, j (9.20)
to get the accumulated shear force distribution at the first row diagrams in Figure 9.14. The sec-ond row represents the corresponding bending moments, which can be calculated by numericalintegration of the accumulated shear force distribution along the tower with Equation 9.21.
Mw,front,i =
Nseg−1∑j=i
Facc,front, j+1(zj+1 − zj
)(9.21)
205
9 Structural Analysis of a Rotatable Inclined Lattice Tower
The more interesting findings are the utilizations, which were calculated out of the axial normalforces within the leg and bracing members. In analogy to Petersen [149, p. 895], the legs wereconsidered to take the global tower bending moments according to
NL,front,i = ±Mw,front,i
2 ai
NL,diag,i = ±Mw,diag,i√
2 ai
(9.22)
The bracing members were considered to take the shear forces according to
NB,front,i = ±Facc,front,i
4 cos (αB ± αTI)
NB,diag,i = ±Facc,diag,i
4√
2 cos (αB ± αTI)
(9.23)
Thereby, the utilizations in terms of yield strength and buckling follow from
a − yield strength :γf γn γm Nfront,i
A,i fy
b − yield strength :γf γn γm Ndiag,i
A,i fy
a − buckling :γf γn γm Nfront,i
A,i χfront fy
b − buckling :γf γn γm Ndiag,i
A,i χdiag fy
(9.24)
where the normal forces Nfront,i and Ndiag,i and cross sectional areas Ai correspond to the legor bracing member loads and cross sections for segment i.
The results for both situations (1) and (2), both considered wind directions (a) and (b), andfor the leg and bracing members along the tower height are summarized in the bottom fourdiagrams in Figure 9.14 in terms of their yield strength and buckling utilization. In general,utilizations for all members were larger in the extreme wind situation (1), than in the cut-outwind speed situation (2).
206
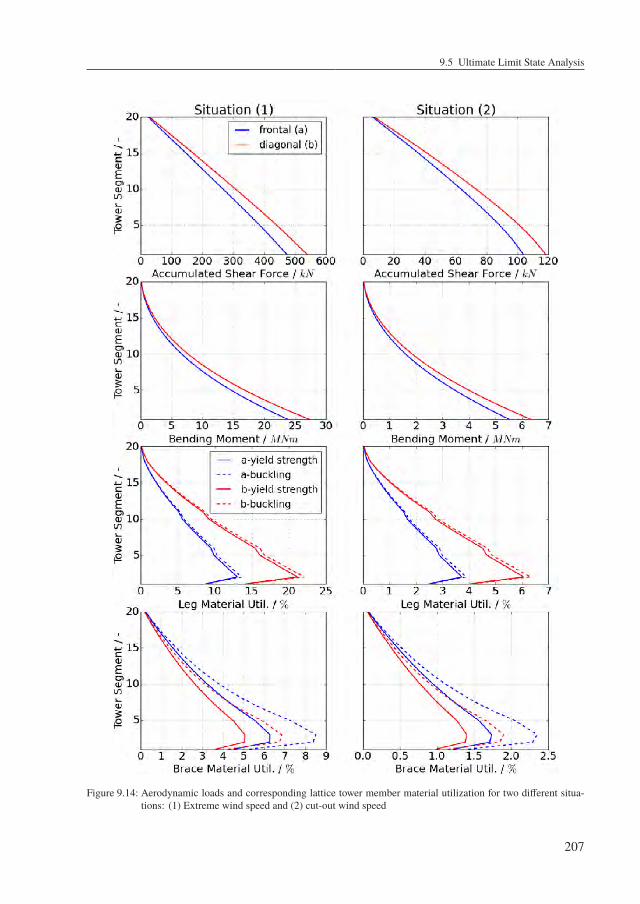
9.5 Ultimate Limit State Analysis
Figure 9.14: Aerodynamic loads and corresponding lattice tower member material utilization for two different situa-tions: (1) Extreme wind speed and (2) cut-out wind speed
207
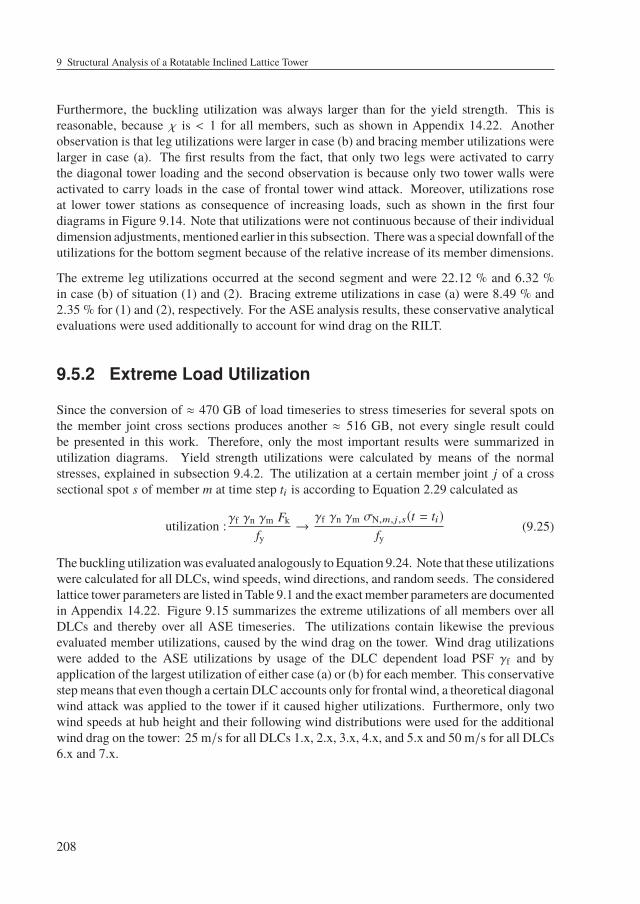
9 Structural Analysis of a Rotatable Inclined Lattice Tower
Furthermore, the buckling utilization was always larger than for the yield strength. This isreasonable, because χ is < 1 for all members, such as shown in Appendix 14.22. Anotherobservation is that leg utilizations were larger in case (b) and bracing member utilizations werelarger in case (a). The first results from the fact, that only two legs were activated to carrythe diagonal tower loading and the second observation is because only two tower walls wereactivated to carry loads in the case of frontal tower wind attack. Moreover, utilizations roseat lower tower stations as consequence of increasing loads, such as shown in the first fourdiagrams in Figure 9.14. Note that utilizations were not continuous because of their individualdimension adjustments, mentioned earlier in this subsection. Therewas a special downfall of theutilizations for the bottom segment because of the relative increase of its member dimensions.
The extreme leg utilizations occurred at the second segment and were 22.12 % and 6.32 %in case (b) of situation (1) and (2). Bracing extreme utilizations in case (a) were 8.49 % and2.35 % for (1) and (2), respectively. For the ASE analysis results, these conservative analyticalevaluations were used additionally to account for wind drag on the RILT.
9.5.2 Extreme Load Utilization
Since the conversion of ≈ 470 GB of load timeseries to stress timeseries for several spots onthe member joint cross sections produces another ≈ 516 GB, not every single result couldbe presented in this work. Therefore, only the most important results were summarized inutilization diagrams. Yield strength utilizations were calculated by means of the normalstresses, explained in subsection 9.4.2. The utilization at a certain member joint j of a crosssectional spot s of member m at time step ti is according to Equation 2.29 calculated as
utilization :γf γn γm Fk
fy→
γf γn γm σN,m, j ,s(t = ti)fy
(9.25)
The buckling utilizationwas evaluated analogously to Equation 9.24. Note that these utilizationswere calculated for all DLCs, wind speeds, wind directions, and random seeds. The consideredlattice tower parameters are listed in Table 9.1 and the exact member parameters are documentedin Appendix 14.22. Figure 9.15 summarizes the extreme utilizations of all members over allDLCs and thereby over all ASE timeseries. The utilizations contain likewise the previousevaluated member utilizations, caused by the wind drag on the tower. Wind drag utilizationswere added to the ASE utilizations by usage of the DLC dependent load PSF γf and byapplication of the largest utilization of either case (a) or (b) for each member. This conservativestepmeans that even though a certain DLC accounts only for frontal wind, a theoretical diagonalwind attack was applied to the tower if it caused higher utilizations. Furthermore, only twowind speeds at hub height and their following wind distributions were used for the additionalwind drag on the tower: 25 m/s for all DLCs 1.x, 2.x, 3.x, 4.x, and 5.x and 50 m/s for all DLCs6.x and 7.x.
208
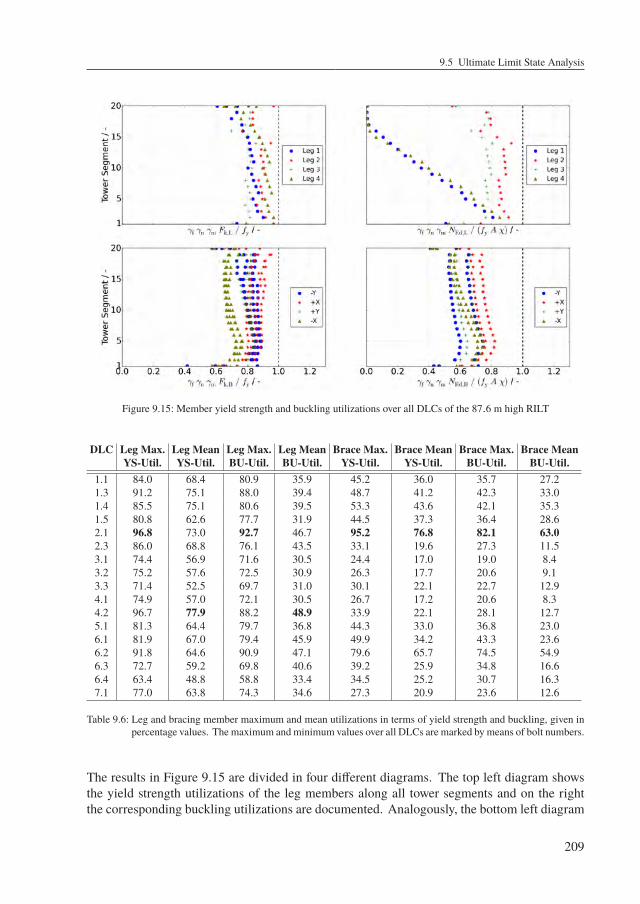
9.5 Ultimate Limit State Analysis
Figure 9.15: Member yield strength and buckling utilizations over all DLCs of the 87.6 m high RILT
DLC Leg Max. Leg Mean Leg Max. Leg Mean Brace Max. Brace Mean Brace Max. Brace MeanYS-Util. YS-Util. BU-Util. BU-Util. YS-Util. YS-Util. BU-Util. BU-Util.
1.1 84.0 68.4 80.9 35.9 45.2 36.0 35.7 27.21.3 91.2 75.1 88.0 39.4 48.7 41.2 42.3 33.01.4 85.5 75.1 80.6 39.5 53.3 43.6 42.1 35.31.5 80.8 62.6 77.7 31.9 44.5 37.3 36.4 28.62.1 96.8 73.0 92.7 46.7 95.2 76.8 82.1 63.02.3 86.0 68.8 76.1 43.5 33.1 19.6 27.3 11.53.1 74.4 56.9 71.6 30.5 24.4 17.0 19.0 8.43.2 75.2 57.6 72.5 30.9 26.3 17.7 20.6 9.13.3 71.4 52.5 69.7 31.0 30.1 22.1 22.7 12.94.1 74.9 57.0 72.1 30.5 26.7 17.2 20.6 8.34.2 96.7 77.9 88.2 48.9 33.9 22.1 28.1 12.75.1 81.3 64.4 79.7 36.8 44.3 33.0 36.8 23.06.1 81.9 67.0 79.4 45.9 49.9 34.2 43.3 23.66.2 91.8 64.6 90.9 47.1 79.6 65.7 74.5 54.96.3 72.7 59.2 69.8 40.6 39.2 25.9 34.8 16.66.4 63.4 48.8 58.8 33.4 34.5 25.2 30.7 16.37.1 77.0 63.8 74.3 34.6 27.3 20.9 23.6 12.6
Table 9.6: Leg and bracing member maximum and mean utilizations in terms of yield strength and buckling, given inpercentage values. The maximum and minimum values over all DLCs are marked by means of bolt numbers.
The results in Figure 9.15 are divided in four different diagrams. The top left diagram showsthe yield strength utilizations of the leg members along all tower segments and on the rightthe corresponding buckling utilizations are documented. Analogously, the bottom left diagram
209
9 Structural Analysis of a Rotatable Inclined Lattice Tower
shows the bracing member yield strength utilizations along the tower segments and on thebottom right, bracing member buckling utilizations are depicted. Note that bracing membersare distinguished with respect to their global coordinate system position. Legend entries -Y,+X, +Y, and -X indicate the respective bracing wall of the tower, according to the left drawingin Figure 9.4 or in Figure 14.6. Two examples should help for more clarification: Bracingmembers, denoted with +X were those members along the tower height, which were positionedon the downwind side of the tower. Bracing members, denoted with -Y were those, which coulddirectly be seen on the left side in Figure 14.621.
Figure 9.15 reveals, that buckling was not as relevant as the yield strength for the memberdimensions. Note that the column buckling proof considered only axial forces, but the yieldstrength proof considered bending moments and axial forces. Since, the scope of this work wasnot to optimize the tower automatically, it was optimized manually by dimension scaling factorsfor each segments members. For this approach, each segment got three scaling factors, one forthe upwind legs, one for the downwind legs, and one for the bracing members22. Thereby, amaximum utilization of 96.8 % was reached for the leg 2 of the top and bottom segment, buta mean yield strength utilization of 83.3 % suggests still some more optimization potential forthe legs. A closer view on the top left diagram in Figure 9.15 shows that leg 2 and 4 experiencea higher utilization than leg 1 and 3. Considering only leg 2 and 4, the average utilizationamounts to 87.6 %, which is a good utilization for the preliminary study and limited amountof design parameters. However, scaling of each leg dimensions, more optimization iterations,and a less conservative tower wind drag approach would certainly improve the utilization andthereby lead to further material savings. A view on the leg buckling utilization in the top rightdiagram indicates that the front legs 1 and 4 were always under tension at the top tower sections,while the back legs 2 and 3 experience a reasonable column buckling utilization around 80 %along the whole tower. Since self-weight induced pressure was higher at all legs of the towerbottom, the buckling utilization of the front legs reached the same level as the back legs at thatsection. Bracing members experienced an average yield strength utilization of 78.3 %, whilethe front bracing members on the -X side had the lowest and the back bracing members on the+X side had the highest utilizations. Bracing members obtain still material saving potential.Appendix 14.23 shows the corresponding utilizations of all individual DLCs. Thereby, onlythe maximum utilizations over all of their different wind speeds, wind directions, and randomseeds are depicted. A corresponding summary of the utilizations of the different DLCs isgiven in Table 9.6. It shows the maximum and mean of the leg and bracing member yieldstrength (YS) and buckling (BU) utilizations. As mentioned in subsection 9.3.3, DLC 2.1 and4.2 were the driving DLCs, even though adjustments in the control regimes in fault situationswere implemented to decrease their influence23.
21 Note the global coordinate system at the bottom of the tower. It indicates, that the global Y axis points into thepaper, so that the visible bracing members are the ones, denoted with -Y.
22 A review of Appendix 14.22 shows the results of the different scaled member dimensions23 Subsection 9.3.3 explains more about these adjustments, which aimed to the blades pitch rates in fault situations.
210
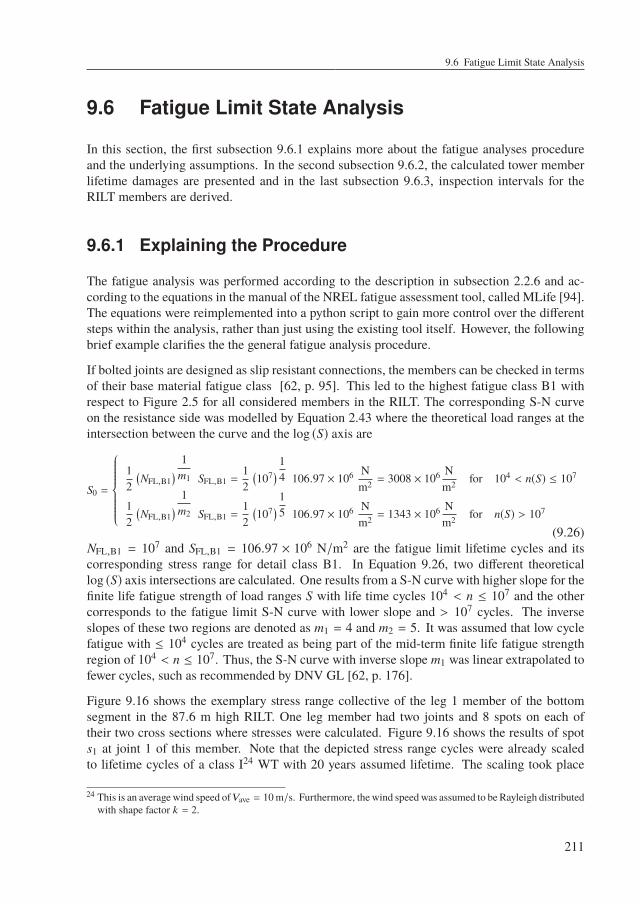
9.6 Fatigue Limit State Analysis
9.6 Fatigue Limit State Analysis
In this section, the first subsection 9.6.1 explains more about the fatigue analyses procedureand the underlying assumptions. In the second subsection 9.6.2, the calculated tower memberlifetime damages are presented and in the last subsection 9.6.3, inspection intervals for theRILT members are derived.
9.6.1 Explaining the Procedure
The fatigue analysis was performed according to the description in subsection 2.2.6 and ac-cording to the equations in the manual of the NREL fatigue assessment tool, called MLife [94].The equations were reimplemented into a python script to gain more control over the differentsteps within the analysis, rather than just using the existing tool itself. However, the followingbrief example clarifies the the general fatigue analysis procedure.
If bolted joints are designed as slip resistant connections, the members can be checked in termsof their base material fatigue class [62, p. 95]. This led to the highest fatigue class B1 withrespect to Figure 2.5 for all considered members in the RILT. The corresponding S-N curveon the resistance side was modelled by Equation 2.43 where the theoretical load ranges at theintersection between the curve and the log (S) axis are
S0 =
12
(NFL,B1
) 1m1 SFL,B1 =
12
(107) 1
4 106.97 × 10⁶ Nm2 = 3008 × 106 N
m2 for 104 < n(S) ≤ 107
12
(NFL,B1
) 1m2 SFL,B1 =
12
(107) 1
5 106.97 × 10⁶ Nm2 = 1343 × 106 N
m2 for n(S) > 107
(9.26)NFL,B1 = 107 and SFL,B1 = 106.97 × 10⁶ N/m2 are the fatigue limit lifetime cycles and itscorresponding stress range for detail class B1. In Equation 9.26, two different theoreticallog (S) axis intersections are calculated. One results from a S-N curve with higher slope for thefinite life fatigue strength of load ranges S with life time cycles 104 < n ≤ 107 and the othercorresponds to the fatigue limit S-N curve with lower slope and > 107 cycles. The inverseslopes of these two regions are denoted as m1 = 4 and m2 = 5. It was assumed that low cyclefatigue with ≤ 104 cycles are treated as being part of the mid-term finite life fatigue strengthregion of 104 < n ≤ 107. Thus, the S-N curve with inverse slope m1 was linear extrapolated tofewer cycles, such as recommended by DNV GL [62, p. 176].
Figure 9.16 shows the exemplary stress range collective of the leg 1 member of the bottomsegment in the 87.6 m high RILT. One leg member had two joints and 8 spots on each oftheir two cross sections where stresses were calculated. Figure 9.16 shows the results of spots1 at joint 1 of this member. Note that the depicted stress range cycles were already scaledto lifetime cycles of a class I24 WT with 20 years assumed lifetime. The scaling took place
24 This is an average wind speed ofVave = 10 m/s. Furthermore, the wind speedwas assumed to be Rayleigh distributedwith shape factor k = 2.
211
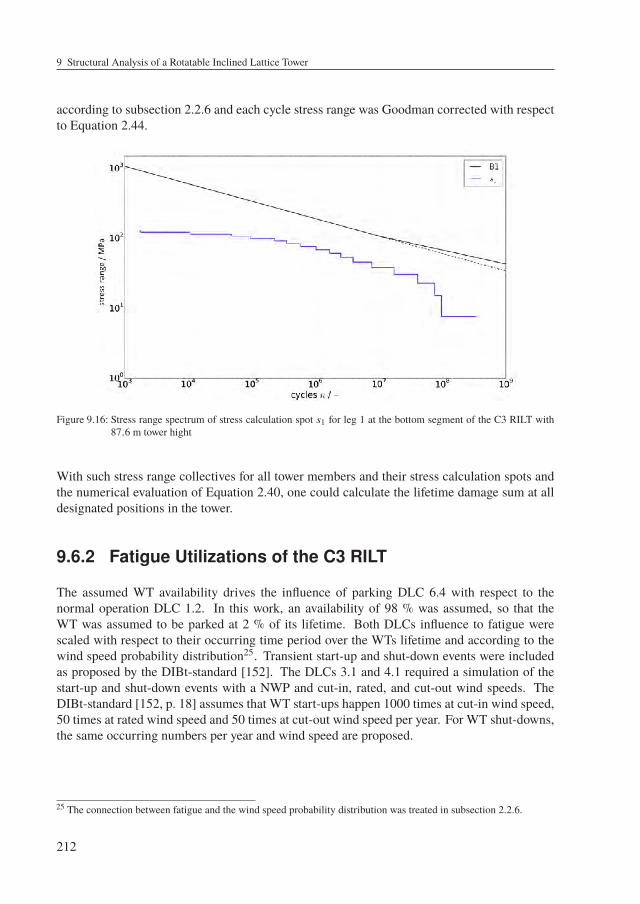
9 Structural Analysis of a Rotatable Inclined Lattice Tower
according to subsection 2.2.6 and each cycle stress range was Goodman corrected with respectto Equation 2.44.
Figure 9.16: Stress range spectrum of stress calculation spot s1 for leg 1 at the bottom segment of the C3 RILT with87.6 m tower hight
With such stress range collectives for all tower members and their stress calculation spots andthe numerical evaluation of Equation 2.40, one could calculate the lifetime damage sum at alldesignated positions in the tower.
9.6.2 Fatigue Utilizations of the C3 RILT
The assumed WT availability drives the influence of parking DLC 6.4 with respect to thenormal operation DLC 1.2. In this work, an availability of 98 % was assumed, so that theWT was assumed to be parked at 2 % of its lifetime. Both DLCs influence to fatigue werescaled with respect to their occurring time period over the WTs lifetime and according to thewind speed probability distribution25. Transient start-up and shut-down events were includedas proposed by the DIBt-standard [152]. The DLCs 3.1 and 4.1 required a simulation of thestart-up and shut-down events with a NWP and cut-in, rated, and cut-out wind speeds. TheDIBt-standard [152, p. 18] assumes that WT start-ups happen 1000 times at cut-in wind speed,50 times at rated wind speed and 50 times at cut-out wind speed per year. For WT shut-downs,the same occurring numbers per year and wind speed are proposed.
25 The connection between fatigue and the wind speed probability distribution was treated in subsection 2.2.6.
212
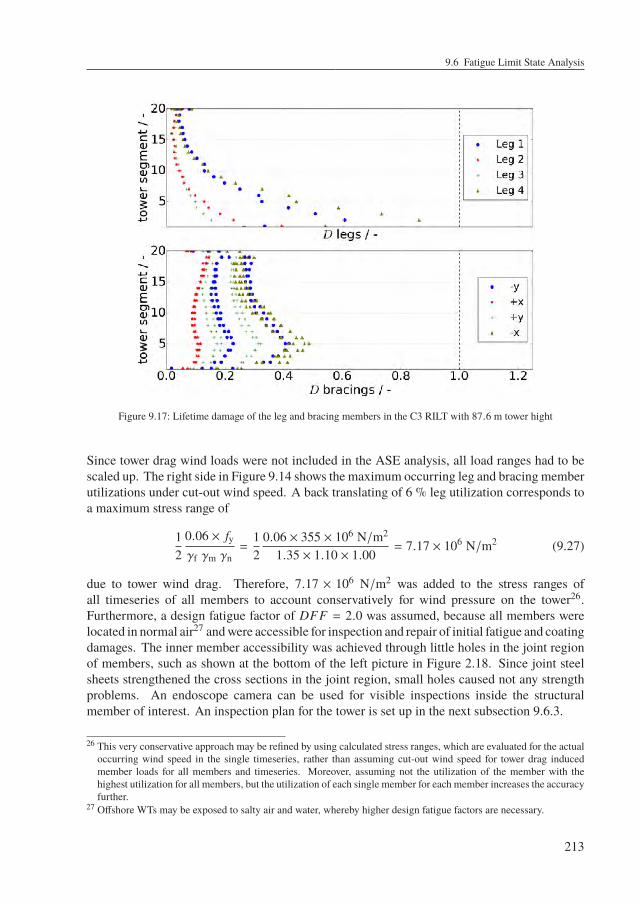
9.6 Fatigue Limit State Analysis
Figure 9.17: Lifetime damage of the leg and bracing members in the C3 RILT with 87.6 m tower hight
Since tower drag wind loads were not included in the ASE analysis, all load ranges had to bescaled up. The right side in Figure 9.14 shows the maximum occurring leg and bracing memberutilizations under cut-out wind speed. A back translating of 6 % leg utilization corresponds toa maximum stress range of
12
0.06 × fyγf γm γn
=12
0.06 × 355 × 106 N/m2
1.35 × 1.10 × 1.00= 7.17 × 10⁶ N/m2 (9.27)
due to tower wind drag. Therefore, 7.17 × 10⁶ N/m2 was added to the stress ranges ofall timeseries of all members to account conservatively for wind pressure on the tower26.Furthermore, a design fatigue factor of DFF = 2.0 was assumed, because all members werelocated in normal air27 andwere accessible for inspection and repair of initial fatigue and coatingdamages. The inner member accessibility was achieved through little holes in the joint regionof members, such as shown at the bottom of the left picture in Figure 2.18. Since joint steelsheets strengthened the cross sections in the joint region, small holes caused not any strengthproblems. An endoscope camera can be used for visible inspections inside the structuralmember of interest. An inspection plan for the tower is set up in the next subsection 9.6.3.
26 This very conservative approach may be refined by using calculated stress ranges, which are evaluated for the actualoccurring wind speed in the single timeseries, rather than assuming cut-out wind speed for tower drag inducedmember loads for all members and timeseries. Moreover, assuming not the utilization of the member with thehighest utilization for all members, but the utilization of each single member for each member increases the accuracyfurther.
27 Offshore WTs may be exposed to salty air and water, whereby higher design fatigue factors are necessary.
213
9 Structural Analysis of a Rotatable Inclined Lattice Tower
Under the conditions, described in subsection 9.6.1 and this subsection, Figure 9.17 shows themaximum lifetime damages for the 87.6 m high C3 RILT. Since all lifetime damages werebelow 128, the WT could sustain a 20 year operation. In case of the leg members, the maximumlifetime damage of D = DFF Dc = 0.86 occurred in the leg 4 of segment 2. Only tower bottomleg members up to the fourth segment experienced a significant lifetime damage of > 0.5. Allother leg and bracing members experienced lower lifetime damages. A comparison with theextreme utilizations in Figure 9.15 reveals that fatigue was not the driving factor for this WTand tower configuration.
9.6.3 Periodical Inspection of the C3 RILT
DNVGL provides guidance notes to the required periodical inspection intervalsTPII as functionof the chosen design fatigue factor and the calculated lifetime of a component [63, p. 131]. InEquation 9.28 it is adjusted with respect to
TPII,m, j ,s = TL,m, j ,sDFF
3=
TDL
Dc,m, j ,s
DFF3
(9.28)
whereTL,m, j ,s is the calculated lifetime of a stress calculation spot s on the cross section in jointj of member m and Dc,m, j ,s is its corresponding characteristic lifetime damage. For the leg4 member of tower segment 2, which experienced the most damage over lifetime, a minimuminspection interval of
TPII,min =TDL
0.43DFF
3=
20 years0.43
23= 30.94 years (9.29)
showed that no fatigue related inspections of the RILT were necessary throughout the designlifetime of the WT.
9.7 Accidental Limit State Analysis
Although dropped objects, collision impact, fire, or explosion are accidental cases which mayhappen to the RILT, they were not analysed in this work to limit its scope. However, for a fullassessment, these aspects have to be taken into account.
28 Thus, they met the requirement in Equation 2.39
214
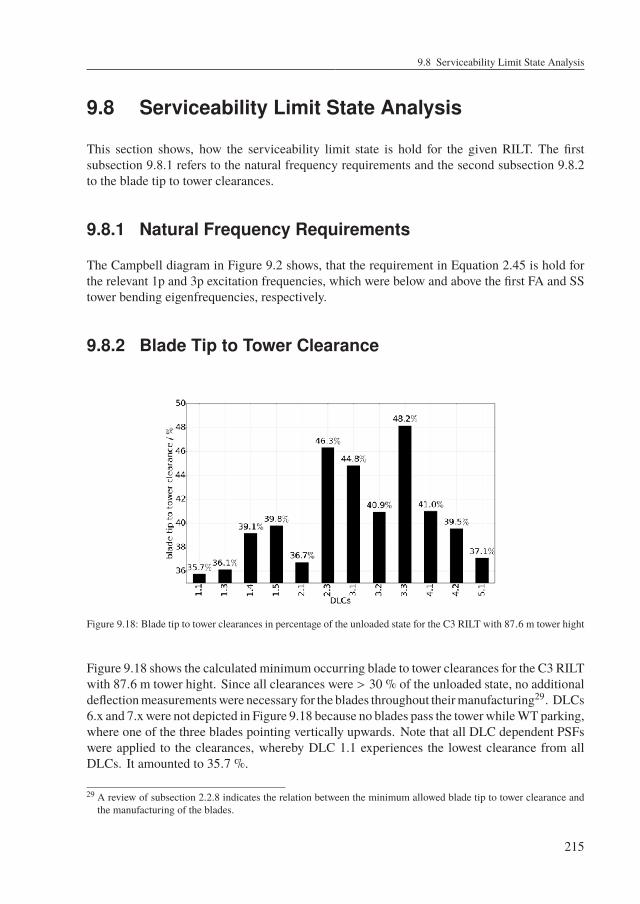
9.8 Serviceability Limit State Analysis
9.8 Serviceability Limit State Analysis
This section shows, how the serviceability limit state is hold for the given RILT. The firstsubsection 9.8.1 refers to the natural frequency requirements and the second subsection 9.8.2to the blade tip to tower clearances.
9.8.1 Natural Frequency Requirements
The Campbell diagram in Figure 9.2 shows, that the requirement in Equation 2.45 is hold forthe relevant 1p and 3p excitation frequencies, which were below and above the first FA and SStower bending eigenfrequencies, respectively.
9.8.2 Blade Tip to Tower Clearance
Figure 9.18: Blade tip to tower clearances in percentage of the unloaded state for the C3 RILT with 87.6 m tower hight
Figure 9.18 shows the calculated minimum occurring blade to tower clearances for the C3 RILTwith 87.6 m tower hight. Since all clearances were > 30 % of the unloaded state, no additionaldeflectionmeasurementswere necessary for the blades throughout theirmanufacturing29. DLCs6.x and 7.xwere not depicted in Figure 9.18 because no blades pass the tower whileWT parking,where one of the three blades pointing vertically upwards. Note that all DLC dependent PSFswere applied to the clearances, whereby DLC 1.1 experiences the lowest clearance from allDLCs. It amounted to 35.7 %.
29 A review of subsection 2.2.8 indicates the relation between the minimum allowed blade tip to tower clearance andthe manufacturing of the blades.
215

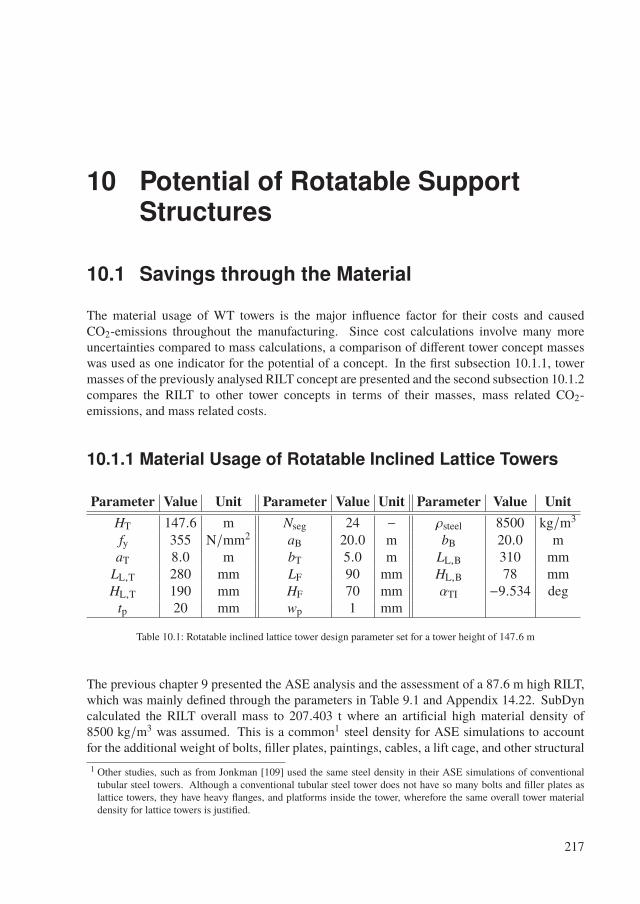
10 Potential of Rotatable SupportStructures
10.1 Savings through the Material
The material usage of WT towers is the major influence factor for their costs and causedCO2-emissions throughout the manufacturing. Since cost calculations involve many moreuncertainties compared to mass calculations, a comparison of different tower concept masseswas used as one indicator for the potential of a concept. In the first subsection 10.1.1, towermasses of the previously analysed RILT concept are presented and the second subsection 10.1.2compares the RILT to other tower concepts in terms of their masses, mass related CO2-emissions, and mass related costs.
10.1.1 Material Usage of Rotatable Inclined Lattice Towers
Parameter Value Unit Parameter Value Unit Parameter Value UnitHT 147.6 m Nseg 24 − ρsteel 8500 kg/m3
fy 355 N/mm2 aB 20.0 m bB 20.0 maT 8.0 m bT 5.0 m LL,B 310 mm
LL,T 280 mm LF 90 mm HL,B 78 mmHL,T 190 mm HF 70 mm αTI −9.534 deg
tp 20 mm wp 1 mm
Table 10.1: Rotatable inclined lattice tower design parameter set for a tower height of 147.6 m
The previous chapter 9 presented the ASE analysis and the assessment of a 87.6 m high RILT,which was mainly defined through the parameters in Table 9.1 and Appendix 14.22. SubDyncalculated the RILT overall mass to 207.403 t where an artificial high material density of8500 kg/m3 was assumed. This is a common1 steel density for ASE simulations to accountfor the additional weight of bolts, filler plates, paintings, cables, a lift cage, and other structural1 Other studies, such as from Jonkman [109] used the same steel density in their ASE simulations of conventionaltubular steel towers. Although a conventional tubular steel tower does not have so many bolts and filler plates aslattice towers, they have heavy flanges, and platforms inside the tower, wherefore the same overall tower materialdensity for lattice towers is justified.
217
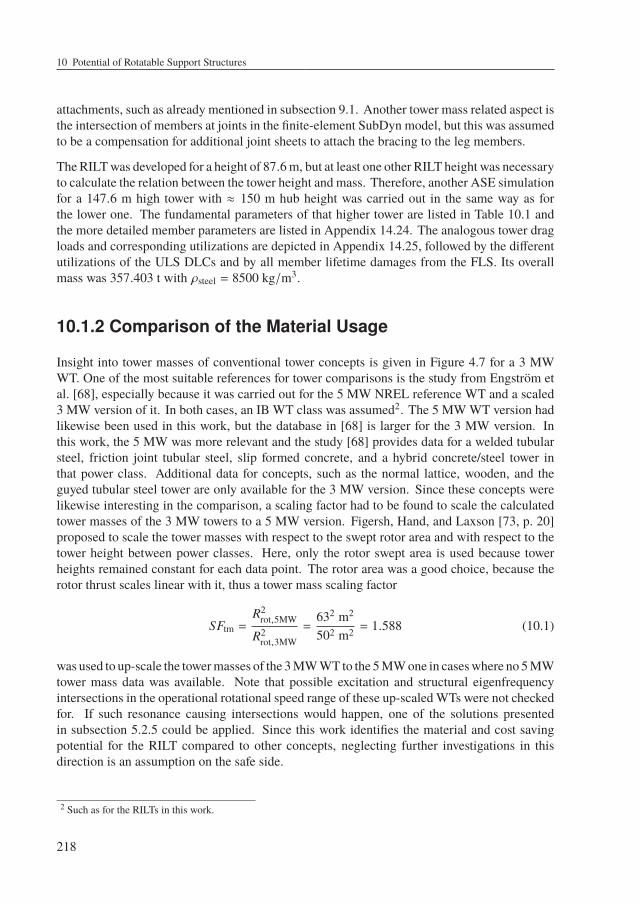
10 Potential of Rotatable Support Structures
attachments, such as already mentioned in subsection 9.1. Another tower mass related aspect isthe intersection of members at joints in the finite-element SubDyn model, but this was assumedto be a compensation for additional joint sheets to attach the bracing to the leg members.
The RILTwas developed for a height of 87.6 m, but at least one other RILT height was necessaryto calculate the relation between the tower height and mass. Therefore, another ASE simulationfor a 147.6 m high tower with ≈ 150 m hub height was carried out in the same way as forthe lower one. The fundamental parameters of that higher tower are listed in Table 10.1 andthe more detailed member parameters are listed in Appendix 14.24. The analogous tower dragloads and corresponding utilizations are depicted in Appendix 14.25, followed by the differentutilizations of the ULS DLCs and by all member lifetime damages from the FLS. Its overallmass was 357.403 t with ρsteel = 8500 kg/m3.
10.1.2 Comparison of the Material Usage
Insight into tower masses of conventional tower concepts is given in Figure 4.7 for a 3 MWWT. One of the most suitable references for tower comparisons is the study from Engström etal. [68], especially because it was carried out for the 5 MW NREL reference WT and a scaled3 MW version of it. In both cases, an IB WT class was assumed2. The 5 MW WT version hadlikewise been used in this work, but the database in [68] is larger for the 3 MW version. Inthis work, the 5 MW was more relevant and the study [68] provides data for a welded tubularsteel, friction joint tubular steel, slip formed concrete, and a hybrid concrete/steel tower inthat power class. Additional data for concepts, such as the normal lattice, wooden, and theguyed tubular steel tower are only available for the 3 MW version. Since these concepts werelikewise interesting in the comparison, a scaling factor had to be found to scale the calculatedtower masses of the 3 MW towers to a 5 MW version. Figersh, Hand, and Laxson [73, p. 20]proposed to scale the tower masses with respect to the swept rotor area and with respect to thetower height between power classes. Here, only the rotor swept area is used because towerheights remained constant for each data point. The rotor area was a good choice, because therotor thrust scales linear with it, thus a tower mass scaling factor
SFtm =R2
rot,5MW
R2rot,3MW
=632 m2
502 m2 = 1.588 (10.1)
was used to up-scale the towermasses of the 3 MWWTto the 5 MW one in caseswhere no 5 MWtower mass data was available. Note that possible excitation and structural eigenfrequencyintersections in the operational rotational speed range of these up-scaledWTs were not checkedfor. If such resonance causing intersections would happen, one of the solutions presentedin subsection 5.2.5 could be applied. Since this work identifies the material and cost savingpotential for the RILT compared to other concepts, neglecting further investigations in thisdirection is an assumption on the safe side.
2 Such as for the RILTs in this work.
218
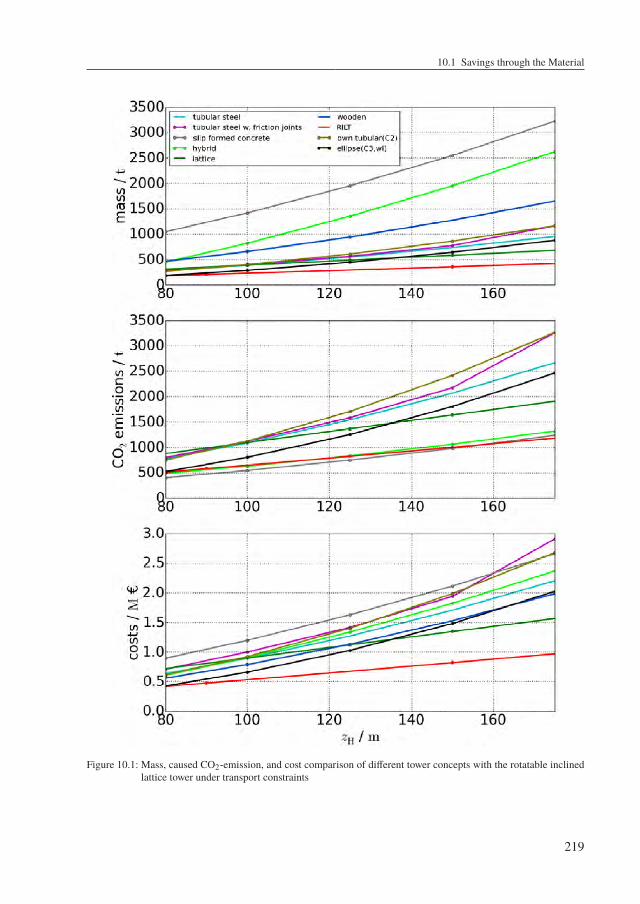
10.1 Savings through the Material
Figure 10.1: Mass, caused CO2-emission, and cost comparison of different tower concepts with the rotatable inclinedlattice tower under transport constraints
219
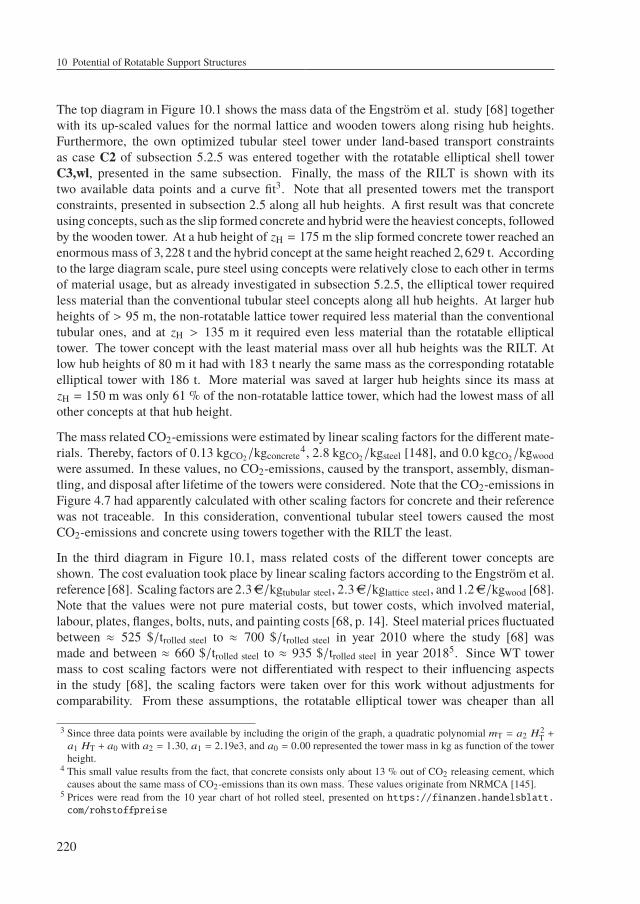
10 Potential of Rotatable Support Structures
The top diagram in Figure 10.1 shows the mass data of the Engström et al. study [68] togetherwith its up-scaled values for the normal lattice and wooden towers along rising hub heights.Furthermore, the own optimized tubular steel tower under land-based transport constraintsas case C2 of subsection 5.2.5 was entered together with the rotatable elliptical shell towerC3,wl, presented in the same subsection. Finally, the mass of the RILT is shown with itstwo available data points and a curve fit3. Note that all presented towers met the transportconstraints, presented in subsection 2.5 along all hub heights. A first result was that concreteusing concepts, such as the slip formed concrete and hybrid were the heaviest concepts, followedby the wooden tower. At a hub height of zH = 175 m the slip formed concrete tower reached anenormousmass of 3,228 t and the hybrid concept at the same height reached 2,629 t. Accordingto the large diagram scale, pure steel using concepts were relatively close to each other in termsof material usage, but as already investigated in subsection 5.2.5, the elliptical tower requiredless material than the conventional tubular steel concepts along all hub heights. At larger hubheights of > 95 m, the non-rotatable lattice tower required less material than the conventionaltubular ones, and at zH > 135 m it required even less material than the rotatable ellipticaltower. The tower concept with the least material mass over all hub heights was the RILT. Atlow hub heights of 80 m it had with 183 t nearly the same mass as the corresponding rotatableelliptical tower with 186 t. More material was saved at larger hub heights since its mass atzH = 150 m was only 61 % of the non-rotatable lattice tower, which had the lowest mass of allother concepts at that hub height.
The mass related CO2-emissions were estimated by linear scaling factors for the different mate-rials. Thereby, factors of 0.13 kgCO2/kgconcrete
4, 2.8 kgCO2/kgsteel [148], and 0.0 kgCO2/kgwoodwere assumed. In these values, no CO2-emissions, caused by the transport, assembly, disman-tling, and disposal after lifetime of the towers were considered. Note that the CO2-emissions inFigure 4.7 had apparently calculated with other scaling factors for concrete and their referencewas not traceable. In this consideration, conventional tubular steel towers caused the mostCO2-emissions and concrete using towers together with the RILT the least.
In the third diagram in Figure 10.1, mass related costs of the different tower concepts areshown. The cost evaluation took place by linear scaling factors according to the Engström et al.reference [68]. Scaling factors are 2.3AC/kgtubular steel, 2.3AC/kglattice steel, and 1.2AC/kgwood [68].Note that the values were not pure material costs, but tower costs, which involved material,labour, plates, flanges, bolts, nuts, and painting costs [68, p. 14]. Steel material prices fluctuatedbetween ≈ 525 $/trolled steel to ≈ 700 $/trolled steel in year 2010 where the study [68] wasmade and between ≈ 660 $/trolled steel to ≈ 935 $/trolled steel in year 20185. Since WT towermass to cost scaling factors were not differentiated with respect to their influencing aspectsin the study [68], the scaling factors were taken over for this work without adjustments forcomparability. From these assumptions, the rotatable elliptical tower was cheaper than all
3 Since three data points were available by including the origin of the graph, a quadratic polynomial mT = a2 H2T +
a1 HT + a0 with a2 = 1.30, a1 = 2.19e3, and a0 = 0.00 represented the tower mass in kg as function of the towerheight.
4 This small value results from the fact, that concrete consists only about 13 % out of CO2 releasing cement, whichcauses about the same mass of CO2-emissions than its own mass. These values originate from NRMCA [145].
5 Prices were read from the 10 year chart of hot rolled steel, presented on https://finanzen.handelsblatt.com/rohstoffpreise
220
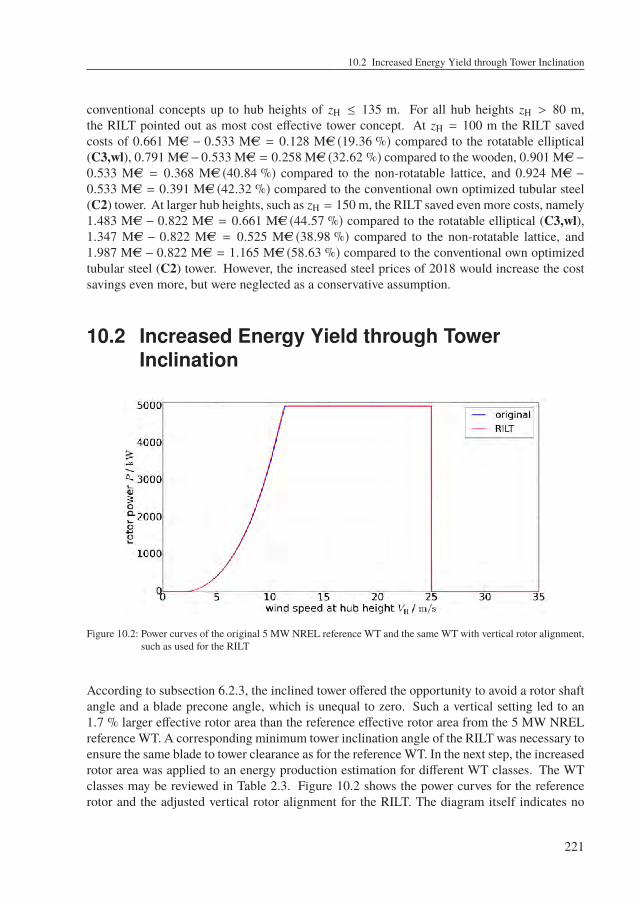
10.2 Increased Energy Yield through Tower Inclination
conventional concepts up to hub heights of zH ≤ 135 m. For all hub heights zH > 80 m,the RILT pointed out as most cost effective tower concept. At zH = 100 m the RILT savedcosts of 0.661 MAC − 0.533 MAC = 0.128 MAC (19.36 %) compared to the rotatable elliptical(C3,wl), 0.791 MAC− 0.533 MAC = 0.258 MAC (32.62 %) compared to the wooden, 0.901 MAC−0.533 MAC = 0.368 MAC (40.84 %) compared to the non-rotatable lattice, and 0.924 MAC −0.533 MAC = 0.391 MAC (42.32 %) compared to the conventional own optimized tubular steel(C2) tower. At larger hub heights, such as zH = 150 m, the RILT saved even more costs, namely1.483 MAC − 0.822 MAC = 0.661 MAC (44.57 %) compared to the rotatable elliptical (C3,wl),1.347 MAC − 0.822 MAC = 0.525 MAC (38.98 %) compared to the non-rotatable lattice, and1.987 MAC − 0.822 MAC = 1.165 MAC (58.63 %) compared to the conventional own optimizedtubular steel (C2) tower. However, the increased steel prices of 2018 would increase the costsavings even more, but were neglected as a conservative assumption.
10.2 Increased Energy Yield through TowerInclination
Figure 10.2: Power curves of the original 5 MW NREL reference WT and the same WT with vertical rotor alignment,such as used for the RILT
According to subsection 6.2.3, the inclined tower offered the opportunity to avoid a rotor shaftangle and a blade precone angle, which is unequal to zero. Such a vertical setting led to an1.7 % larger effective rotor area than the reference effective rotor area from the 5 MW NRELreferenceWT. A corresponding minimum tower inclination angle of the RILT was necessary toensure the same blade to tower clearance as for the referenceWT. In the next step, the increasedrotor area was applied to an energy production estimation for different WT classes. The WTclasses may be reviewed in Table 2.3. Figure 10.2 shows the power curves for the referencerotor and the adjusted vertical rotor alignment for the RILT. The diagram itself indicates no
221
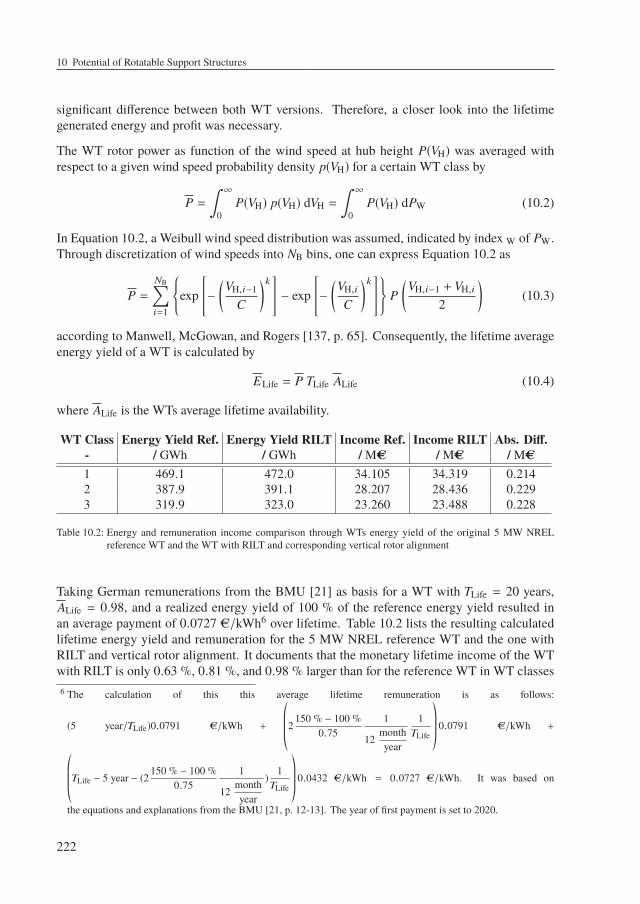
10 Potential of Rotatable Support Structures
significant difference between both WT versions. Therefore, a closer look into the lifetimegenerated energy and profit was necessary.
The WT rotor power as function of the wind speed at hub height P(VH) was averaged withrespect to a given wind speed probability density p(VH) for a certain WT class by
P =∫ ∞
0P(VH) p(VH) dVH =
∫ ∞
0P(VH) dPW (10.2)
In Equation 10.2, a Weibull wind speed distribution was assumed, indicated by index W of PW.Through discretization of wind speeds into NB bins, one can express Equation 10.2 as
P =NB∑i=1
exp
[−
(VH,i−1
C
)k ]− exp
[−
(VH,i
C
)k ]P
(VH,i−1 + VH,i
2
)(10.3)
according to Manwell, McGowan, and Rogers [137, p. 65]. Consequently, the lifetime averageenergy yield of a WT is calculated by
ELife = P TLife ALife (10.4)
where ALife is the WTs average lifetime availability.
WT Class Energy Yield Ref. Energy Yield RILT Income Ref. Income RILT Abs. Diff.- / GWh / GWh / MAC / MAC / MAC1 469.1 472.0 34.105 34.319 0.2142 387.9 391.1 28.207 28.436 0.2293 319.9 323.0 23.260 23.488 0.228
Table 10.2: Energy and remuneration income comparison through WTs energy yield of the original 5 MW NRELreference WT and the WT with RILT and corresponding vertical rotor alignment
Taking German remunerations from the BMU [21] as basis for a WT with TLife = 20 years,ALife = 0.98, and a realized energy yield of 100 % of the reference energy yield resulted inan average payment of 0.0727 AC/kWh6 over lifetime. Table 10.2 lists the resulting calculatedlifetime energy yield and remuneration for the 5 MW NREL reference WT and the one withRILT and vertical rotor alignment. It documents that the monetary lifetime income of the WTwith RILT is only 0.63 %, 0.81 %, and 0.98 % larger than for the reference WT in WT classes6 The calculation of this this average lifetime remuneration is as follows:
(5 year/TLife)0.0791 AC/kWh +
©«2150 % − 100 %
0.751
12monthyear
1TLife
ª®®®¬ 0.0791 AC/kWh +
©«TLife − 5 year − (2150 % − 100 %
0.751
12monthyear
)1
TLife
ª®®®¬ 0.0432 AC/kWh = 0.0727 AC/kWh. It was based on
the equations and explanations from the BMU [21, p. 12-13]. The year of first payment is set to 2020.
222
10.3 Yaw System Costs
1, 2, and 3, respectively. An expression in absolute values of 214 kAC, 229 kAC, and 228 kACshows that it was a not negligible amount of additional money, which was generated by usingthe RILT instead of a conventional WT tower.
10.3 Yaw System Costs
Reliable costs for yaw systems at WT tower bases are difficult to estimate without deeperinvestigations. Table 2.6 reveals a wide range of 180 kAC to 450 kAC for a yaw bearing at the baseof a 2.5 MW WT with 79.43 m hub height. According to Malcolm and Hansen [136], the yawsystem costs are twice as high as the yaw bearing costs alone. Considering this and a discountof 10 % for mass production of these bearings leads to yaw system costs of 324 kAC to 810 kACfor a conventional roller bearing with outer diameters of 6000 mm and 5500 mm, respectively.Table 2.6 suggests, that the bearing costs may be reduced by increasing diameters, which werenecessary for the RILT with larger hub heights7. One counter acting cost factor is the omissionof the yaw system at the tower top. Malcolm and Hansen [136, p. 21] propose a table with costsfor conventional tower top yaw bearings where a mass production discount is already included.In the curve fit of the data [136, p. 21], the maximum overturning moment on the yaw bearingand its diameter is included to calculate its mass. That curve fit is described as
myaw bear. = 0.0152(
Mmax
Dyaw bear.− 36
)1.489(10.5)
where the maximum overturning moment Mmax must be given in kNm and the yaw bearingdiameter Dyaw bear. must be given in m to get the yaw bearing mass myaw bear. in kg. The massto cost relation is curve fitted by
Cyaw bear. =(myaw bear. 6.689 + 953
) $US
kg(10.6)
Using Equation 10.5 in 10.6 with a yaw bearing diameter of 3.87 m8 and a tower top maximumbending moment of 3.02e4 kNm9 resulted to costs of 112 kAC10 for the whole yaw system.
Assuming the validity of Equations 10.5 and 10.6 for the RILT base yaw bearing led to costs of296 kAC and 127 kAC for the yaw system of the 87.6 m high and 147.6 m high RILT. Note that theyaw system costs for the smaller RILTweremore than twice as high as for the larger RILT. Theseresultswere based on the extreme tower base reactionmoments, extracted from theASE analysesof the 87.6 m and 147.6 m highRILT. The largest tower base reactionmoments occurred for bothtower heights in DLC 2.3 at rated wind speed and were 132 kNm γf = 132 kNm 1.1 = 145 kNmand 219 kNm γf = 219 kNm 1.1 = 241 kNm for HT = 87.6 m and HT = 147.6 m, respectively.RILT yaw bearing diameters were calculated, based on Tables 9.1 and 10.1 and result to
7 A comparison of Tables 9.1 and 10.1 indicates, that RILTs bottom leg widths increase with larger hub heights.8 This value is the tower top diameter of the 5 MW reference WT from [109].9 This value was taken from the conventional ASE load analysis results in Appendix 14.910 The yaw system costs were assumed to be twice as the yaw bearing costs alone.
223
10 Potential of Rotatable Support Structures
Dyaw bear. =√
2 × 6.8 m = 9.62 m and Dyaw bear. =√
2 × 20 m = 28.28 m for the smalland high tower. Although extreme tower base overturning moments of the higher RILT werelarger the costs for the bearing were lower, because of its disproportionately larger yaw bearingdiameter and the resulting lower local bearing loads. This results may contain truth, but largerbearings rise also other costs, such as transport, segmentation, assembly, and meeting tighttolerances over large dimensions. The RILT has four legs at the tower base, wherefore loadsare induced punctually into the yaw system. This may require additional local strengtheningof the bearing at the leg to bearing joints and thereby cause more costs. It must be noted thatEquations 10.5 and 10.6 are very simple and rough estimates, which do not account for transport,segmentation, assembly, and tolerances for yaw bearings with very large diameters. Therefore,the above calculated values were the result of a given limited model from the literature andmust be considered critically. Other yaw bearing cost models may be derived from a morecomprehensive database. Some additional yaw bearing and yaw system costs are provided byHau [92], Gasch [77], and Manwell, McGowan, and Rogers [137]. Manufacturers data sheetsmay also be consulted, but must be investigated carefully because of their non-WT-specificcharacter.
10.4 Economical Potential
The final result of this work is the economical potential of rotatable support structures for WTsand specifically for the RILT. It is a preliminary end result, because more accurate tower baseyaw system costs were not available for the given tower configuration at that state of research.One major aspect of the RILT economics were the cost savings, which result from the lessrequired material for RILTs, compared to all other support structure concepts. This aspectwas investigated in subsection 10.1.2. For the end result, the difference between the cheapestconventional tower concept11 material costs and the RILT material costs was considered forhub heights 80 m ≤ zH ≤ 175 m. This means for example that at zH = 80 m, the RILT materialrelated cost savings SRILT,mat. were those, which result from the difference to a wooden towerand at zH = 175 m those, which resulted from the difference to a conventional lattice tower.12An increasedWT energy yield was achievable through the vertical alignment of the rotor, whichwas possible through the tower inclination. The resulting additional money income ∆IRILT,calculated in subsection 10.2, could be added to the profitability of RILTs together with thesaved money Cyaw sys. conv. through avoiding the tower top yaw system. On the other hand,the tower base yaw system costs Cyaw sys. RILT had to be included in the balance to achieve arotatable tower. The underlying cost model for the yaw systemwas explained in subsection 10.3.Potential foundation cost increases were assumed to be ∆Cfound. = Cyaw sys.. This assumptionwas made without any reference, because of the lack of literature for foundations of WTs withyaw system at the tower base and may be adjusted throughout future research activities. If thoseactivities find higher tower base yaw system and additional foundation costs, other concepts,
11 This includes the tubular steel, tubular steel with friction joints, slip formed concrete, hybrid, lattice, wooden, andown tubular tower concepts (C2 and C3,wl).
12 A review of the bottom diagram in Figure 10.1 may clarify this statement.
224
10.4 Economical Potential
such as discussed in subsection 4.2.2 may be considered. The overall RILT cost savings wereconsequently calculated as
SRILT(zH) = SRILT,mat.(zH) + ∆IRILT + Cyaw sys. conv. − Cyaw sys. RILT(zH) − ∆Cfound.(zH) (10.7)
Figure 10.3 shows the result of Equation 10.7 and its different terms. Note that a WT class Iwas assumed and the corresponding wind speed was always acting at the hub height, wherefore∆IRILT remained constant along zH. From this assumption and the assumption that the towertop yaw bearing diameter remains constant for all conventional tower concepts and hub heights,constant costsCyaw sys. conv. were likewise justified. TheRILTbase extreme overturningmomentand the yaw bearing diameter was modelled by polynomials of the second order, fitted to thedata points, presented in subsection 10.3 as function of the hub height. This led to the followingEquations 10.8 and 10.9.
Mmax,RILT(zH) = −1.511e−1 z2H + 1.625e3 zH (10.8)
where Mmax,RILT results in kNm if zH is given in m and
Dyaw,RILT(zH) = 1.362e−3 z2H−1.571e−2 zH (10.9)
where Dyaw,RILT results inm if zH is given inm. Each inconstant continuous curve in Figure 10.3is modelled by a polynomial of the fourth order to smooth the plot. The polynomials are
Cyaw sys. RILT = ∆Cfound. = −3.424e−3 z4H + 1.596 z3
H − 2.530e2 z2H + 1.403e4 zH + 2.187e1
(10.10)SRILT,mat. = 2.761e−3 z4
H − 1.479 z3H + 2.548e2 z2
H − 1.070e4 zH + 1.254e2 (10.11)
SRILT = 9.609e−3 z4H − 4.670 z3
H + 7.607e2 z2H − 3.876e4 zH + 2.705e5 (10.12)
and produce results in AC. Its determination coefficient
R2 =
∑(yi − y)2∑(yi − y)2
(10.13)
is given on the right hand of the diagram where yi is the modelled value, yi is the calculatedvalue, and y is the arithmetic mean of all yi . It shows a good fitting quality of R2 ≥ 0.997 forall three curves.
The overall cost savings of the RILT increase with rising hub heights from 45 kAC at zH = 80 mto 768 kAC at zH = 175 m. These cost savings amount to 8.05 % of the cheapest conventionalconcept, the wooden tower, at zH = 80 m and 48.97 % of the cheapest conventional concept,the lattice tower, at zH = 175 m. Thereby, the developed RILT shows a huge material, CO2, andcost saving potential for large hub heights of zH ≥ 100 m for transport constrained land-basedWTs.
225
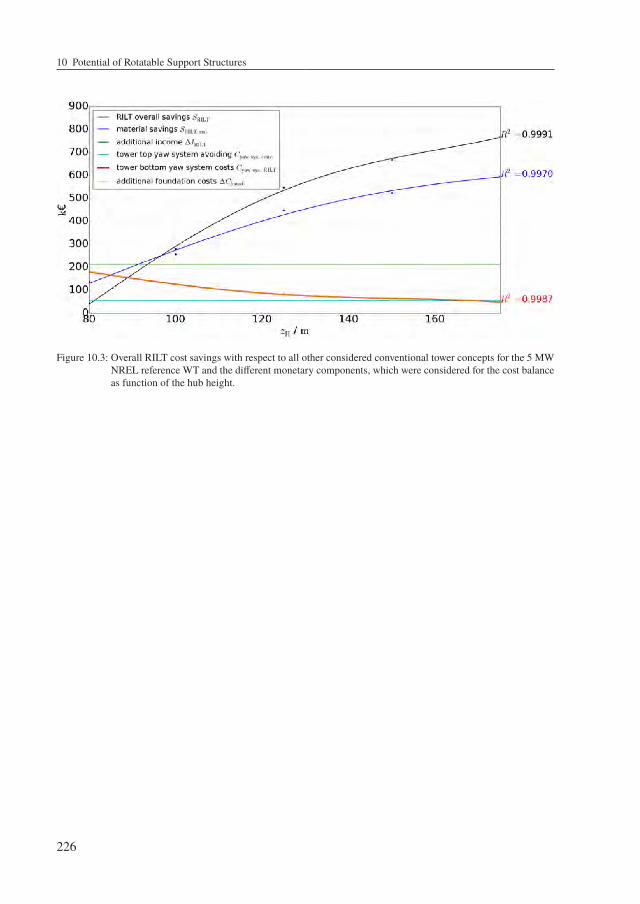
10 Potential of Rotatable Support Structures
Figure 10.3: Overall RILT cost savings with respect to all other considered conventional tower concepts for the 5 MWNREL reference WT and the different monetary components, which were considered for the cost balanceas function of the hub height.
226
11 Summary
This work presents the development and potential analysis of a new and sustainable rotatablewind turbine tower by means of aero-servo-elastic load simulations. The idea of rotatable windturbine towers is not new, but it was never investigated on a scientific way and a meaningfuldepth. One obvious advantage is the permanent alignment of the tower with respect to thewind turbine rotor. Thereby, the tower can be designed less stiff lateral to the rotor axis paralleldirection and less material is required. Furthermore, it can be shaped more aerodynamically todecrease its drag loads in the rotor area orthogonal direction. Such slim tower profiles achievea better transportability under bridges and tunnels, wherefore they are appropriate for largerhub heights where conventional tubular steel towers reach their economical limits.
Another advantage is the improved accessibility of the yaw system at the tower base. Atechnology research revealed that yaw systems are applied for heavy structures such as railwayturntables, rotatable buildings, mobile cranes, bucket wheel excavators, and rotatable shortwaveantennas, which experience large axial forces and overturning moments at the rotatable joint.Thereby, a technical feasibility for yaw systems at wind turbine tower bases was given andadditionally confirmed through an expertise survey. Considering the low amount of scientificresearch about rotatable wind turbine support structures and the scope of this work, it wasfocussed on the tower advantages instead of the tower base yaw system as a first research step.
The aero-servo-elastic load simulation is an appropriate tool to investigate wind turbine supportstructures and was carried out in the FAST environment for this work. A first aero-servo-elasticanalysis with most of the design load cases of IEC 61400-1 took place with the 5 MW NRELreferencewind turbine and a conventional tubular steel tower. This stepwas necessary to achievecomparability to the developed rotatable wind turbine tower and validity of the procedure itself.The calculated loads were used for the design of an own reference conventional tubular steeltower and an elliptical rotatable tower under extreme load conditions and transport constraints.The results were 28.94 %material savings for an 80 m high elliptical tower and 26.69%materialsavings for an 180 m high elliptical tower compared to the conventional tubular one with sameheights. The reason for not more material savings of the elliptical tower at larger hub heightswas found in the transport constraint.
Therefore, a four-legged lattice tower was used as underlying concept for the rotatable towerinstead of a shell concept, such as an elliptical or aerodynamically shaped one. Lattice towers arematerial saving and transport constraint respecting for larger hub heights. Especially transport isno problem, because lattice tower members are small compared to huge tubular tower segmentsand maintenance costs remain low if slip resisting lockbolts are used for the joints. Anothercontroversy discussed aspect, the outer appearance and acceptance of lattice towers, may beimproved by usage of coverings or by application in areas with low population density. For
227
11 Summary
the rotatable lattice tower the focus was not on a different stiffness in the fore-aft and side-sidedirection, but on increased leg distances in all directions to save as much material as possible.This aspect leads especially to more material savings at the upper part of a lattice tower, becauseleg distances are not restricted by the blade to tower clearance on three sides of the tower. Thisis because of the fixed rotor position with respect to it. An additional tower inclination againstthe main wind direction is another advantage for rotatable wind turbine towers. It achieves alarger blade to tower clearance on the rotor side of the tower, whereby a vertical rotor alignmentis possible or/and less blade material is necessary to reach its required stiffness. Throughsuch a vertical rotor alignment, the effective rotor area increases and the wind turbine yieldsmore energy over its lifetime and becomes more profitable. Furthermore, additional bendingmoments are induced into the structure through the mass eccentricities. Since, the tower isinclined against the main wind direction, it acts as counter weight, which reduces extreme loadswithin the members and more material is saved. Concerning yaw movements of such eccentrichigh masses higher loads occur only as consequence of yaw accelerations, but not because ofyaw velocities. This leads to no considerable losses in the energy yield over lifetime, becausethe yaw speed must not be reduced for a rotatable inclined tower.
The rotatable inclined lattice tower was modelled in the linear-beam-finite-element submoduleSubDyn, which is part of the FAST framework. Since SubDyn was only capable to modelcircular member cross sections in a lattice structure, some changes were required. The stiffnessand mass matrix formulations changed to account for arbitrary centroids, shear centers andprincipal bending, and shear axes on lattice member cross sections. Another adjustment wasdone in the direction cosine matrices to achieve control over member alignments around theirlength axes. After the validation of all changes, rotatable inclined lattice towers with twodifferent heights, 87.6 m and 147.6 m were modelled and investigated via aero-servo-elasticload simulations and structural analyses. Thereby, the ultimate, fatigue, and serviceability limitstates were met over the assumed wind turbines lifetime of 20 years according to IEC 61400-1and with the support of DNV GL guidelines ST-0126 and RP-C203.
After the rotatable inclined lattice tower design, its cost savings were evaluated with respectto its saved material, the increased energy yield from the vertical rotor alignment, and theomission of the tower top yaw system. On the other side are tower base yaw system costs andassumed increased foundation costs, which reduced these cost savings. From the preliminaryassumptions in this work the rotatable inclined lattice tower saved 45 kAC at 80 m to 768 kACat 175 m hub height compared to the most cost-effective conventional concepts, such as thetubular steel, tubular steel with friction joints, slip formed concrete, hybrid, lattice, and woodentower. This amounts to 8.05 % and 48.97 % in tower cost savings and indicates the huge costsaving potential of rotatable inclined lattice towers for larger hub heights.
This result reveals a new, sustainable, and profitable support structure concept for land-basedwind turbines with large hub heights under transport constraints. Although the amount ofinstalled offshore wind turbines increases, this concept has the potential to make land-basedwind energy more attractive, especially for weak wind areas with bad accessibility. Therefore,it is a contribution to the profitability of renewable energies.
228
12 Outlook
The scope of this work hindered detailed proofs for the friction joints of the rotatable inclinedlattice tower. Their impact on the overall structural mass and thereby on the costs was assumedto be subordinative. However, proofs are necessary to providemore comprehensive and accurateconclusions.
One main field of future research will be the tower bottom yaw system, because it was onlyinvestigated at the surface in this work. Thereby, not only conventional roller bearings, butalso other concepts should be considered, such as introduced in this work. Furthermore, it isimportant that yaw acceleration will be limited and controllable to hinder the induction of largeand periodic gyroscopic loads on the structure. The same request for more detailed analysesapplies consequently to the foundation and the machinery bed interface.
Other questions rose regarding the wind turbine controls. In this work, only the standardreference NREL controller was used, while some small adjustments to the controls wereimplemented to react on special events, such as wind turbine shut-downs or parking design loadcases with extreme wind conditions. This work showed that extreme loads depend on thosecontrol adjustments, but it was out of scope to investigate the larger influence of the adjustmentswith respect to thewind turbines efficiency and the loads on other structural components. Futureresearch activities may investigate the interdependency between controls, loads, and the energyyield of wind turbines with rotatable support structure on a deeper level.
This work indicates that lattice towers are not necessarily bad in their appearance, but the visualacceptance of land-based rotatable inclined lattice towers has likewise to be investigated inmore detail in the future.
229

13 References
[1] Abbott, I. H., and von Doenhoff, A. E. Theory of wing sections: including a summeryof airfoil data. Dover Publ, New York, USA, 2010. ISBN 978-0-486-60586-9.
[2] Albertsen, H. Überschlägige Dimensionierung eines Azimutlagers am Turmfuß. Tech.rep., IMO Energy GmbH und Co. KG, Gremsdorf, 2012.
[3] Anderson, J. D. Fundamentals of aerodynamics, 3 ed. McGraw-Hill series in aeronauti-cal and aerospace engineering. McGraw-Hill, Boston, 2001. ISBN 978-0-07-237335-6.
[4] Ashuri, T., Martins, J. R. R. A., Zaaijer, M. B., van Kuik, G. A. M., and vanBussel, G. J. W. Aeroservoelastic design definition of a 20 MW common research windturbine model: A 20 MW common research wind turbine model. Wind Energy (2016).ISSN 10954244, DOI 10.1002/we.1970.
[5] Bak, C., Zahle, F., Bitsche, R., Taeseong, K., Yde, A., Henriksen, L. C., Natarajan,A., and Hansen, M. H. Description of the DTU 10 MW reference wind turbine. Tech.Rep. DTUWind Energy Report-I-0092, Technical University of Denmark (DTU) Institutfor Vindenergi, Roskilde, DK, July 2013.
[6] Bashforth, F. An attempt to test the theories of capillary action by comparing thetheoretical andmeasured forms of drops of fluid. Tech. rep., Cambridge: at theUniversityPress, Cambridge, USA, 1883.
[7] Bauchau, O. A. Section Builder Users Manual. Manual, School of Aerospace Engi-neering, Georgia Institute of Technology, Atlanta, USA, Feb. 2007.
[8] Bauchau, O. A. Flexible multibody dynamics. No. 176 in Solid mechanics and itsapplications. Springer Dordrecht, Heidelberg, London, New York, 2011. ISBN 978-94-007-0334-6.
[9] Bauchau, O. A., and Craig, J. I. Structural analysis: with applications to aerospacestructures. No. v. 163 in Solid mechanics and its applications. Springer Dordrecht,Heidelberg, London, New York, Atlanta, USA, 2009. ISBN 978-90-481-2515-9.
[10] Bendix, H., Peschke, J., and Hofmann, K. Windenergieanlage mit horizontaler Ro-torachse und mit unten liegendem Antrieb, June 2013. Patent No. DE102011119776A1.
[11] Bertagnolio, F., Rasmussen, F., Sørensen, N. N., Johansen, J., and Madsen, H. A.A stochastic model for the simulation of wind turbine blades in static stall. Wind Energy13, 4 (May 2010), pp. 323–338. ISSN 10954244, 10991824, DOI 10.1002/we.342.
[12] Betz, A. Windenergie und ihre Ausnutzung durch Windmühlen. Ökobuch, Göttingen,1926. ISBN 978-3-922964-11-7.
[13] Beye, T. Konzeptstudie über die Verlegung des Azimutlagers an den Turmfuß einerWindenergieanlage. Bachelor Thesis, Hochschule Flensburg University of AppliedSciences, Flensburg, 2012.
231
References
[14] Beye, T., Rudolf, R., and Faber, T. Konzeptstudie für Windenergieanlage mit Az-imutlager am Turmfuß. Bauingenieur Band 88 (2013), pp. 269–274.
[15] Bianculli, A. J. Trains and technology: the American railroad in the nineteenth century.University of Delaware Press, Newark, 2001. ISBN 978-0-87413-802-3.
[16] Blasques, J. P. Multi-material topology optimization of laminated composite beamswith eigenfrequency constraints. Composite Structures 111 (May 2014), pp. 45–55.ISSN 02638223, DOI 10.1016/j.compstruct.2013.12.021.
[17] Blasques, J. P., and Bitsche, R. D. An efficient and accurate method for com-putation of energy release rates in beam structures with longitudinal cracks. En-gineering Fracture Mechanics 133 (Jan. 2015), pp. 56–69. ISSN 00137944, DOI10.1016/j.engfracmech.2014.11.002.
[18] Blasques, J. P., Bitsche, R. D., Fedorov, V., and Lazarov, B. S. Accuracy of anefficient framework for structural analysis of wind turbine blades. Wind Energy 19, 9(Sept. 2016), pp. 1603–1621. ISSN 10954244, DOI 10.1002/we.1939.
[19] Blasques, J. P., and Stolpe, M. Multi-material topology optimization of laminatedcomposite beam cross sections. Composite Structures 94, 11 (Nov. 2012), pp. 3278–3289. ISSN 02638223, DOI 10.1016/j.compstruct.2012.05.002.
[20] Blevins, R. D. Flow-induced vibration, 2 ed. Van Nostrand Reinhold, New York, 1990.ISBN 978-0-442-20651-2.
[21] BMU. Vergütungssätze, Degression und Berechnungsbeispiele nach dem neuenErneuerbare-Energien-Gesetz (EEG) vom 04. August 2011 (EEG2012). Tech. Rep.BMU KI III 1, Bundesministerium für Umwelt, Naturschutz und nukleare Sicherheit,Berlin, May 2012.
[22] Bossanyi, E. A. GH Bladed Theory Manual. Tech. Rep. 282/BR/009, Garrad Hassan,Bristol, United Kingdom, 2009.
[23] Bošnjak, S. M., Gnjatovic, N., Savicevic, A. D., Pantelic, M. P., and L., M. I. Basicparameters of the static stability, loads and strength of the vital parts of a bucket wheelexcavators slewing superstructure. Journal of Zhejiang University Science A 17 (May2016), pp. 353–365. ISSN 1673-565X, 1862-1775, DOI 10.1631/jzus.A1500037.
[24] Brebbia, C. A., and Dominguez, J. Boundary elements: an introductory course, 2 ed.Computational Mechanics Publications [u.a.], Southampton, 1991. ISBN 978-1-85312-160-9.
[25] Bruger, P., Buchmann, B., Kurrer, K.-E., and Ozimek, C. Rotatable shortwavecurtain antenna operable at very high wind speeds. IEEE Transactions on Broadcasting42, 1 (Mar. 1996), pp. 50–54. ISSN 00189316, DOI 10.1109/11.486075.
[26] Buhl, M., Pierce, K., Laino, D., Hansen, C., Suzuki, A., Wright, A., Jonkman, J.,Hand, M., and Jonkman, B. AeroDyn Change Log, Apr. 2016.
[27] Buhl, M. L., and Manjock, A. A comparison of wind turbine aeroelastic codes usedfor certification. Tech. Rep. AIAA-2006-0786, National Renewable Energy Laboratoryand Germanischer Lloyd WindEnergie GmbH, Colorado, USA and Hamburg, 2006.
232
References
[28] Bundesverband WindEnergie e.V. Maschinenhaus / Antriebstrang. https://www.wind-energie.de/infocenter/technik/konstruktiver-aufbau/maschinenhaus-antriebstrang, Mar. 2018. [Online; accessed 14-February-2019].
[29] Collins, J. A. Mechanical design of machine elements and machines: a failure preven-tion perspective, 2 ed. Wiley, Hoboken, USA, 2010. ISBN 978-0-470-41303-6.
[30] Cook, R. D., and Young, W. C. Advanced mechanics of materials, 2 ed. Prentice Hall,Upper Saddle River, USA, 1999. ISBN 978-0-13-396961-0.
[31] Corporation, T. M. MACTON®Transportation Products - Rail vehicle turntable forlocomotive and railcar maintenance yards. Product Description, 2012.
[32] Damiani, R., Jonkman, J., and Hayman, G. SubDyn Users Guide and Theory Manual.Tech. Rep. NREL/TP-5000-63062, National Renewable Energy Laboratory, Golden,USA, Mar. 2015.
[33] Damiani, R., and Song, H. A Jacket Sizing Tool for Offshore Wind Turbines within theSystems Engineering Initiative. 2013. DOI 10.4043/24140-MS.
[34] Damiani, R., Song, H., Robertson, A., and Jonkman, J. Assessing the Importance ofNonlinear Structural Characteristics in the Development of a Jacket Model for the WindTurbine CAE Tool FAST. 2013. DOI 10.1115/OMAE2013-11434.
[35] Dankert, J., and Dankert, H. Technische Mechanik: Statik, Festigkeitslehre, Kine-matik/Kinetik, 7 ed. Springer Vieweg, Wiesbaden, 2013. ISBN 978-3-8348-1809-6.
[36] Department of Wind Energy DTU. User’sManual for BECASA cross section analysistool for anisotropic and inhomogeneous beam sections of arbitrary geometry. Tech. rep.,Technical University of Denmark, Risø,DK, Apr. 2016.
[37] Desmond, C., Murphy, J., Blonk, L., and Haans, W. Description of an 8 MWreference wind turbine. Journal of Physics: Conference Series 753 (Sept. 2016). ISSN1742-6588, 1742-6596, DOI 10.1088/1742-6596/753/9/092013.
[38] Deutsches Institut für Bautechnik. Z-14.4-591: Schließringbolzen ohne Abrissteil.Allgemeine bauaufsichtliche Zulassung. Tech. Rep. | 36-1. 14.4-104/14, Zulassungsstellefür Bauprodukte und Bauarten Bautechnisches Prüfamt, Berlin, July 2015.
[39] DIN 22261-2:2015-11. Excavators, spreaders and auxiliary equipment in opencast lignitemines - Part 2: Calculation principles. Norm, Beuth Verlag GmbH, Berlin, Nov. 2015.
[40] DIN EN 13000:2014-11. Cranes - Mobile Cranes; German Version EN13000:2010+A1:2014. Norm, Beuth Verlag GmbH, Berlin, Nov. 2014.
[41] DIN EN 1991-1-4/NA. National Annex - Nationally determined parameters - Eurocode1: Actions on structures - Part 1-4: General actions - Wind actions. Norm, Beuth VerlagGmbH, Berlin, Dec. 2010.
[42] DIN EN 1993-1-1:2010-12. Design of steel structures - Part 1-1: General rules andrules for buildings; German Version EN 1993-1-1:2005 + AC:2009. Norm, BeuthVerlag GmbH, Berlin, Dec. 2010.
[43] DIN EN 1993-1-5:2010-12. Design of steel structures - Part 1-5: Plated structuralelements; German version EN 1993-1-5:2006 + AC:2009. Norm, Beuth Verlag GmbH,Berlin, Dec. 2010.
233
References
[44] DIN EN 1993-1-6:2010-12. Design of steel structures - Part 1-6: Strength and stabilityof shell structures; German version EN 1993-1-6:2007 + AC:2009. Norm, Beuth VerlagGmbH, Berlin, Dec. 2010.
[45] DIN EN 1993-1-8:2010-12. Design of steel structures - Part 1-8: Design of joints;German Version EN 1993-1-8:2005 + AC:2009. Norm, Beuth Verlag GmbH, Berlin,Dec. 2010.
[46] DIN EN 1993-1-8/NA:2010-12. National Annex - Nationally determined parameters -Eurocode 3: Design of steel structures - Part 1-8: Design of joints. Norm, Beuth VerlagGmbH, Berlin, Dec. 2010.
[47] DIN EN 1993-1-9:2010-12. Design of steel structures - Part 1-9: Fatigue; Germanversion EN 1993-1-9:2005 + AC:2009. Norm, Beuth Verlag GmbH, Berlin, Dec. 2010.
[48] DIN EN 1993-3-1:2010-12. Design of steel structures - Part 3-1: Towers, masts andchimneys - Towers and masts; German version EN 1993-3-1:2006 + AC:2009. Norm,Beuth Verlag GmbH, Berlin, Dec. 2010.
[49] DIN EN 1993-3-1/NA:2015-11. National Annex - Nationally determined parameters -Eurocode 3: Design of steel structures - Part 3-1: Towers, masts and chimneys - Towersand masts. Norm, Beuth Verlag GmbH, Berlin, Nov. 2015.
[50] DIN EN 61400-1 VDE 0127-1:2011-08. Wind turbines - Part 1: Design requirements(IEC 61400-1:2005 + A1:2010); German version En 61400-1:2005 + A1:2010. Norm,Beuth Verlag GmbH, Berlin, Aug. 2011.
[51] DIN EN 61400-1:2015-09; VDE 0127-1:2015-09. Entwurf - Windenergieanlagen -Teil 1: Auslegungsanforderungen (IEC 88/521/CD:2014). Norm, Beuth Verlag GmbH,Berlin, Sept. 2015.
[52] DIN EN ISO 4063. Welding and allied processes - Nomenclature of processes andreference numbers (ISO 4063:2009, Corrected version 2010-03-01); Trilingual versionEN ISO 4063:2010. Norm, Beuth Verlag GmbH, Berlin, Mar. 2011.
[53] DIN EN ISO 9692-1. Welding and allied processes - Types of joint preparation - Part 1:Manual metal-arc welding, gas-shielded metal-arc welding, gas welding, TIG weldingand beam welding of steels (ISO 9692-1:2013); German version EN ISO 9692-1:2013.Norm, Beuth Verlag GmbH, Berlin, Dec. 2013.
[54] Dlubal Software GmbH. Programm RF-DYNAM Dynamische Analyse. ProgramDescription, Tiefenbach, 2010.
[55] Dlubal Software GmbH. Zusatzmodul RF-STABILVerzweigungslastfaktoren, Knick-längen und Eigenformen. Program Description, Tiefenbach, May 2014.
[56] Dlubal Software GmbH. Zusatzmodul RF-IMP Generierung geometrischer Ersatz-imperfektionen und verformter Ersatzmodelle. Program Description, Tiefenbach, May2015.
[57] Dlubal Software GmbH. Programm RFEM 5 Räumliche Tragwerke nach der Finite-Elemente Methode. Program Description, Tiefenbach, 2016.
[58] Dlubal Software GmbH. Programm DUENQ 8 Querschnittswerte und Nachweisedünnwandiger Querschnitte. Program Description, Tiefenbach, 2017.
234
References
[59] Dlubal Software GmbH. Zusatzmodul RF-STAHL Allgemeine Spannungsanalysevon Flächen und Stäben. Program Description, Tiefenbach, 2017.
[60] DNV GL Group. Standard DNVGL-OS-C101 Design of offshore steel structures,general - LRFD method. Guideline, DNV GL Group, July 2015.
[61] DNV GL Group. Standard DNVGL-ST-0376 Rotor blades for wind turbines. Guideline,DNV GL Group, Dec. 2015.
[62] DNV GL Group. StandardDNVGL-RP-C203 Fatigue design of offshore steel structures.Guideline, DNV GL Group, Apr. 2016.
[63] DNV GL Group. Standard DNVGL-ST-0126: Support structures for wind turbines.Guideline, DNV GL Group, Apr. 2016.
[64] DNV GL Group. Standard DNVGL-ST-0437 Loads and site conditions for wind tur-bines. Guideline, DNV GL Group, Nov. 2016.
[65] DNV GL Group. Standard DNVGL-RP-C204 Design against accidental loads. Guide-line, DNV GL Group, Aug. 2017.
[66] DTU. Global Wind Atlas 2.0 a free, web-based application developed, owned, andoperated by the technical university of denmark (DTU) in partnership with the worldbank group, utilizing data provided by vortex, with funding provided by the energysector management assistance program (esmap). https://globalwindatlas.info.[Online; accessed 05-July-2018].
[67] EN 1991-1-4:2005 + A1:2010 + AC:2010. Actions on structures - Part 1-4: Generalactions - Wind actions; German version EN 1991-1-4:2005 + A1:2010 + AC:2010.Norm, Beuth Verlag GmbH, Berlin, Dec. 2010.
[68] Engström, S., Lyrner, T., Hassanzadeh, M., Stalin, T., and J., J. Tall towers forlarge wind turbines Report from Vindforsk project V-342 Höga torn för vindkraftverk.Tech. Rep. 10:48, Stockholm, July 2010.
[69] Euler, L. Découverte d’un nouveau principe de mécanique. Mémoires de l’Académiedes Sciences de Berlin 6, Berlin, 1750. pp. 185–217.
[70] Euler, L. Novamethodus motum corporum rigidorum determinandi. Novi CommentariAcademiae Scientiarum Imperialis Petropolitanae 20, St. Petersburg, Russia, 1775. pp.208–238.
[71] Faber, T. Einführung in die Windenergietechnik Kapitel 7 - Turm und Gründung, 2 ed.Fachbuchverlag Leipzig im Carl Hanser Verlag, München, 2016. ISBN 978-3-446-44982-4.
[72] Faber, T., and Struve, A. Innovative Structures for Wind Turbines. In WindAc Africa(Cape Town, South Africa, Oct. 2016).
[73] Fingersh, L., Hand, M., and Laxson, A. Wind turbine design cost and scaling model.Tech. Rep. NREL/TP-500-40566, National Renewable Energy Laboratory, Colorado,USA, Dec. 2006.
[74] Forschungsgesellschaft für Straßen- und Verkehrswesen, Ed. Richtlinien fürdie Anlage von Landstraßen: RAL. No. 201 in FGSV R1, Regelwerk. FGSV-Verl,Cologne, 2012. ISBN 978-3-86446-039-5.
235
References
[75] Fröde, E., and Fröde, F. Windmühlen. Du Mont Buchverlag, Cologne, 1981.[76] Gardner, L., Chan, T. M., and Abela, J. M. Structural behaviour of elliptical hollow
sections under combined compression and uniaxial bending. Advanced Steel Construc-tion 7, 1 (2011), pp. 86 – 112.
[77] Gasch, R., Ed. Wind power plants: fundamentals, design, construction and operation,2 ed. Springer, Berlin, 2012. ISBN 978-3-642-22937-4.
[78] GE. Txchnologist - A look inside the space frame tower, a new wind turbine proto-type created by GE engineers. http://txchnologist.com/post/131761453820/a-look-inside-the-space-frame-tower-a-new-wind, 2015. [Online; accessed14-February-2019].
[79] Germanischer Lloyd Industrial Services GmbH. Guideline for the certification ofoffshore wind turbines, Dec. 2005.
[80] Germanischer Lloyd Industrial Services GmbH. Guideline for the certification ofwind turbines, July 2010.
[81] Gernandt, R. Windkraftanlage mit hintereinander angeordneten Rotoren auf hori-zontalen Wellen und drehendem Turm zur Kraftübertragung, June 2009. Patent No.DE102007057919A1.
[82] Gillebaart, T., Bernhammer, L., Zuijlen, A., and Kuik, G. Active flap controlon an aeroelastic wind turbine airfoil in gust conditions using both a cfd and an engi-neering model. Journal of Physics: Conference Series 524 (06 2014), 012060. DOI10.1088/1742-6596/524/1/012060.
[83] Glienke, R., Kupzok, A., Ebert, A., and Wanner, M.-C. Anforderungen andie mechanische Fügetechnik für Türme von WEA in Stahlbauweise für großeNabenhöhen. Stahlbau 84, 8 (Aug. 2015), pp. 556–570. ISSN 00389145, DOI10.1002/stab.201510296.
[84] Golding, E. W. The generation of electricity by wind power. E. & F. N. Spon Ltd., NewYork, 1977. ISBN 978-0-470-14986-7.
[85] Goldstein, L. Theoretical analysis of an airborne wind energy conversion system witha ground generator and fast motion transfer. Energy 55 (June 2013), pp. 987–995. ISSN03605442, DOI 10.1016/j.energy.2013.03.087.
[86] Gröger, K. Passivhausprojektierung des Rinn-Drehhauses. Bachelor Thesis,Hochschule Rhein Main, Rüsselsheim, Aug. 2010.
[87] Grote, K.-H., Feldhusen, J., and Dubbel, H., Eds. Taschenbuch für den Maschinen-bau, 24 ed. Springer Vieweg, Berlin, 2014. ISBN 978-3-642-38890-3.
[88] Gumusel, B., Kavurmacioglu, L., and Camci, C. Aerodynamic drag characteristicsand shape design of a radar antenna used for airport ground traffic control. Tech. rep.,Turbomachinery Aero-Heat Transfer Laboratory, Pennsylvania State University, Hawaii,USA, Feb. 2006.
[89] Haibach, E. Betriebsfestigkeit: Verfahren und Daten zur Bauteilberechnung, 3 ed.VDI-Buch. Springer, Berlin, 2006. ISBN 978-3-540-29363-7.
236
References
[90] Haid, L., Matha, D., Stewart, G., Lackner, M., Jonkman, J., and Robertson,A. Simulation-Length Requirements in the Loads Analysis of Offshore Floating WindTurbines. 2013. DOI 10.1115/OMAE2013-11397.
[91] Hamme, U., and Henkel, J. NeueKonzepte imLeichtbau - Innovativer Teleskopauslegereines Mobilkrans. Stahlbau 82, 4 (Apr. 2013), pp. 246–249. ISSN 00389145, DOI10.1002/stab.201310037.
[92] Hau, E. Wind turbines: fundamentals, technologies, application, economics, 3 ed.Springer, Berlin, 2013. ISBN 978-3-642-27151-9.
[93] Hau, E. Windkraftanlagen - Grundlagen, Technik, Einsatz, Wirtschaftlichkeit, 5 ed.Springer Berlin Heidelberg, 2014. ISBN 978-3-642-28876-0, DOI 10.1007/978-3-642-28877-7.
[94] Hayman, G. J. MLife Theory Manual for Version 1.00. Tech. rep., National RenewableEnergy Laboratory, Colorado, USA, Oct. 2012.
[95] Himmelmann, R. Airfoil Design for Wakeless Wind Turbine Tower Structures, June2013. Patent No. US20130156596A1.
[96] Himmelmann, R., and Tongue, S. E. Hybrid Wind Turbine Tower with Integrated YawBearing System, July 2013. Patent No. US20130171002A1.
[97] Hodges, D. H. Nonlinear composite beam theory. No. 213 in Progress in astronauticsand aeronautics. American Institute of Aeronautics and Astronautics, Reston, USA,2006. ISBN 978-1-56347-697-6.
[98] Hoerner, S. F., and Borst, H. V. Fluid-dynamic lift: Practical information on aero-dynamic and hydrodynamic lift, 2 ed. Hoerner, Albuquerque/N.M, 1992. ISBN 978-99-988-3163-6.
[99] Hofmann, K., Bendix, H., and Peschke, J. Windenergieanlage mit horizontalerRotorwelle und mit drehbarem Turm, Nov. 2013. Patent No. DE102012009145A1.
[100] Hucho, W.-H., and Ahmed, S. R., Eds. Aerodynamics of road vehicles: from fluidmechanics to vehicle engineering, 1 ed. Butterworths, London, 1987. ISBN 978-0-408-01422-9.
[101] Ignjatović, D., Petrović, B., Jovančić, P., and Bošković, S. Impact of the BucketWheel Support at Technical Parameters of the Block and Bucket Wheel ExcavatorCapacity. In Proceedings of the 12th International Symposium Continuous SurfaceMining -Aachen 2014, C.Niemann-Delius, Ed. Springer International Publishing, Cham,2015, pp. 73–81. ISBN 978-3-319-12300-4.
[102] International Electrotechnical Comission. IEC 61400-3:2009 - Wind Turbines -Part 3: Design Requirements for Offshore Wind Turbines. Norm, Geneva, CH, Nov.2009.
[103] International Electrotechnical Comission. IEC 61400-1:2005 Wind turbines -Part 1: Design requirements. Norm, Geneva, CH, Aug. 2011.
[104] Jones, E., Oliphant, T., Peterson, P., et al. SciPy: Open source scientific tools forPython. http://www.scipy.org/, 2001–. [Online; accessed 14-February-2019].
237
References
[105] Jonkman, B., and Jonkman, J. FAST v8.16.00a-bjj. Guide to changes in FAST v8,National Renewable Energy Laboratory, Colorado, USA, July 2016.
[106] Jonkman, B. J., and Kilcher, L. TurbSim User’s Guide: Version 1.06.00. Tech. rep.,National Renewable Energy Laboratory, Golden, USA, Sept. 2012.
[107] Jonkman, J. Overview of the FAST Servo-Elastic Module - NREL Wind TurbineModeling Workshop with Jason Jonkman, Ph.D., Mar. 2012.
[108] Jonkman, J. Personal communication, 2016-2018.[109] Jonkman, J., Butterfield, S., Musial, W., and Scott, G. Definition of a 5-MW
Reference Wind Turbine for Offshore System Development. Tech. Rep. NREL/TP-500-38060, National Renewable Energy Laboratory, Colorado, USA, 2009.
[110] Jonkman, J. M. Dynamics Modeling and Loads Analysis of an Offshore Floating WindTurbine. Tech. Rep. NREL/TP-500-41958, National Renewable Energy Laboratory,Colorado, USA, Nov. 2007.
[111] Jonkman, J. M., Hayman, G. J., Jonkman, B. J., Damiani, R. R., and Murray, R. E.AeroDyn v15 User’s Guide and Theory Manual. Tech. rep., National Renewable EnergyLaboratory, Golden, USA, Apr. 2017.
[112] Jonkman, J. M., and Marshall, L. B. FAST Users Guide. Tech. Rep. NREL/EL-500-38230, National Renewable Energy Laboratory, Golden, USA, Aug. 2005.
[113] Jonkman, J. M., Robertson, A. N., and Hayman, G. J. HydroDyn Users Guide andTheory Manual - Draft Version. Tech. rep., National Renewable Energy Laboratory,Golden, USA, 2016.
[114] Jovašević, S., Shah Mohammadi, M. R., Rebelo, C., Pavlović, M., and Veljković,M. New Lattice-Tubular Tower for Onshore WEC âĂŞ Part 1: Structural Opti-mization. Procedia Engineering 199 (2017), pp. 3236–3241. ISSN 18777058, DOI10.1016/j.proeng.2017.09.336.
[115] Kane, T. R., and Levinson, D. A. Dynamics: theory and applications. McGrawHill series in mechanical engineering. McGraw Hill, New York, USA, 1985. ISBN978-0-07-037846-9.
[116] Karkos, T., and Writer, S. Wind-turbine sections squeezethrough 1935 Rumford bridge. http://www.sunjournal.com/wind-turbine-sections-squeeze-1935-rumford-bridge/, Aug. 2010.[Online; accessed 05-June-2020].
[117] Keindorf, C. Tragverhalten und Ermüdungsfestigkeit von Sandwichtürmen für Winden-ergieanlagen. No. 25 in Schriftenreihe des Instituts für Stahlbau der Gottfried WilhelmLeibniz Universität Hannover. Shaker, Aachen, 2010. ISBN 978-3-8322-8791-7.
[118] Keystone Tower Systems. Technology - Keystone Tower Systems. http://keystonetowersystems.com/technology-2/. [Online; accessed 14-February-2019].
[119] Kim, M.-G., and Dalhoff, P. H. Yaw Systems for wind turbines: Overview of concepts,current challenges and designmethods. Journal of Physics: Conference Series 524 (June2014). ISSN 1742-6596, DOI 10.1088/1742-6596/524/1/012086.
238
References
[120] Kleinhenz, F. Denkschrift 6 - Das Großwindkraftwerk MAN-Kleinhenz (ErweiterterAbdruck aus "DerBauingenieur" 1942, Heft 23/24, Kleinhenz: "Projekt einesGroßwind-kraftwerkes".). Mar. 1943.
[121] Kloos, K.-H., Thomala, W., and Wiegand, H. Schraubenverbindungen: Grundlagen,Berechnung, Eigenschaften, Handhabung, 5 ed. Springer, Berlin, 2007. ISBN 978-3-540-21282-9.
[122] Knoedel, P. On the dynamics of steel structures with x-type bracing. Stahlbau 80, 8(2011), 566–571. DOI 10.1002/stab.201101457.
[123] Kooijman, H. J. T., and et al. DOWEC 6MWPre-Design aero-elastic modelling of theDOWEC 6 MW pre-design in PHATAS. Report DOWEC-F1W2-HJK-01-046/9, DutchMinistry of Economic Affairs, Sept. 2003.
[124] Koppány, S. Loss of prestress in spiral strand guy ropes in masts. ce/papers 3, 3-4(2019), 785–790. DOI 10.1002/cepa.1134.
[125] Krausen, K., and Schuh, B. Antennentechnik in Stahl. Stahlbau 66, 3 (1997), pp. 110– 119. ISSN 0038-9145.
[126] Kreiner, S. überschlaegige Dimensionierung eines Azimutlagers am Turmfuß vonLiebherr Components Biberach GmbH. Tech. rep., Liebherr Components BiberachGmbH, Biberach an der Riss, 2012.
[127] Kuchling, H. Taschenbuch der Physik: mit Tabellen, 20 ed. Fachbuchverl. Leipzig imCarl Hanser Verl, München, 2011. ISBN 978-3-446-42457-9.
[128] Kutta, W. Beitrag zur näherungsweisen Integration totaler Differentialgleichungen.Dissertation, München, 1901.
[129] Liebherr-Werk Ehingen GmbH. Mobile crane LTM 1100-4.2 - product advantage.Product Description, 2009.
[130] Liebherr-Werk Ehingen GmbH. Mobile crane LTM 1100-4.2 - technical data. ProductDescription, 2012.
[131] Liebherr-Werk Ehingen GmbH. Lattice boom mobile crane LG 1750 - technical data.Product Description, 2015.
[132] Liu, K.-S. Windenergieanlage mit drehbarem Turm, Oct. 2009. Patent No.DE202009009517U1.
[133] Loth, E., and Selig, M. S. 2-D fairing for a wind turbine tower, Dec. 2014. Patent No.WO2014205348A1.
[134] Lutz, P. Windkraftanlage, Aug. 2014. Patent No. WO2014122165A1.[135] Madsen, H. A., Johansen, J., Sørensen, N., Larsen, G., and Hansen, M. Simulation
of Low Frequency Noise from a Downwind Wind Turbine Rotor. American Institute ofAeronautics and Astronautics. ISBN 978-1-62410-012-3,DOI 10.2514/6.2007-623.
[136] Malcolm, D. J., and Hansen, A. C. WindPACT Turbine Rotor Design Study. Tech.Rep. NREL/SR-500-32495, National Renewable Energy Laboratory, Golden, USA, Apr.2006.
[137] Manwell, J. F., McGowan, J. G., and Rogers, A. L. Wind energy explained: theory,design and application, 2 ed. Wiley, Chichester, 2011. ISBN 978-0-470-01500-1.
239
References
[138] Matsuishi, M., and Endo, T. Fatigue of metals subjected to varying stress. Tech. rep.,Fukuoka, Japan, Mar. 1968.
[139] Meslkouris, K., and Hake, E. Statik der Stabtragwerke, 2 ed. Springer-Lehrbuch.Springer Berlin Heidelberg, Berlin, Heidelberg, 2009. ISBN 978-3-540-88992-2,DOI10.1007/978-3-540-88993-9.
[140] Migita, Y., and Fukumoto, Y. Local buckling behaviour of polygonal sections. Journalof Constructional Steel Research 41, 2-3 (Feb. 1997), pp. 221–233. ISSN 0143974X,DOI 10.1016/S0143-974X(97)00008-4.
[141] Miner, M. A. Cumulative damage in fatigue, 1945. Trans. Amer. Soc. Mech. Eng. 67,A159-164.
[142] Moriarty, P. J., and Hansen, A. C. AeroDyn theory manual. Tech. Rep. NREL/TP-500-36881, National Renewable Energy Laboratory, Colorado, USA, Jan. 2005.
[143] Moulton, F. R. Discussions: NewMethods in Exterior Ballistics. The American Math-ematical Monthly 35, 5 (May 1928), p. 246. ISSN 00029890, DOI 10.2307/2299587.
[144] Nies, J. J. Kopfteil eines vorgeneigten Turms, July 2009. Patent No. EP2075464A2.[145] NRMCA. Concrete CO2 fact sheet. Publication, National Ready Mixed Concrete
Association, Maryland, USA, 2012. No. 2PCO2.[146] Patankar, S. V. Numerical heat transfer and fluid flow. Series in computational methods
in mechanics and thermal sciences. Hemisphere Pub. Corp.; New York : McGraw-Hill,Washington, 1980. ISBN 978-0-07-048740-6.
[147] PCAE. Documentation of static software 4h-EC3fs for end plate butts. software docu-mentation, Hannover, Apr. 2017.
[148] Penman, J., and et al. 2006 IPCC Guidelines for National Greenhouse Gas Inven-tories. Tech. Rep. volume 3 industrial processes and product use, chapter 4 MetalIndustry Emissions, World Meteorological Organization, United Nations EnvironmentProgramme, 2006.
[149] Petersen, C. Stahlbau: Grundlagen der Berechnung und baulichen Ausbildung vonStahlbauten, 4 ed. Springer Vieweg, Wiesbaden, 2013. ISBN 978-3-8348-8610-1.
[150] Powles, S. R. J. The effects of tower shadow on the dynamics of a horizontal-axis windturbine. Wind Engineering 7, 1 (1983), pp. 26–42.
[151] Prandtl, L., and Tietjens, O. J. Applied Hydro- and Aeromechanics. Dover Publica-tions, Inc., New York, USA, 1934.
[152] Projektgruppe Windenergieanlagen des Deutschen Instituts für Bautechnik.Richtlinie für Windenergieanlagen Einwirkungen und Standsicherheitsnachweise fürTurm und Gründung, 2012.
[153] Przemieniecki, J. S. Theory of Matrix Structural Analysis. Dover, New York, 1985.ISBN 978-0-486-64948-1.
[154] Radaj, D., and Vormwald, M. Ermüdungsfestigkeit: Grundlagen für Ingenieure, 3 ed.Springer, Berlin, 2007. ISBN 978-3-540-71458-3.
240
References
[155] Ransford, T. Potential theory in the complex plane. No. 28 in London MathematicalSociety student texts. Cambridge Univ. Press, Cambridge, 1995. ISBN 978-0-521-46654-7.
[156] Rayleigh, W. S. B. J. The theory of sound. 1st ed., vol I and vol II, Macmillan, London,United Kingdom, 1887, 1888.
[157] Reddy, J. N., and Gartling, D. K. The finite element method in heat transfer and fluiddynamics. CRC Press, Boca Raton, Fla., 1994. ISBN 978-0-8493-9410-2.
[158] Reichsarbeitsgemeinschaft Windkraft. Denkschrift 1 über die Arbeiten der Reich-sarbeitsgemeinschaft "Windkraft" im Geschäftsjahr 1939-1940. Sept. 1940.
[159] Reinke, T. Tragverhalten von biegebeanspruchten Stahlmasten mit polygonalen Quer-schnitten. Dissertation, Karlsruher Institut für Technologie, Karlsruhe, 2015.
[160] Reiso, M. The tower shadow effect in downwind wind turbines. Dissertation, NorwegianUniversity of Science and Technology, Trondheim, May 2013.
[161] Richard, H. A., and Sander, M. TechnischeMechanik - Festigkeitslehre, 2 ed. Studium.Vieweg + Teubner, Wiesbaden, 2008. ISBN 978-3-8348-0454-9.
[162] Rinn, H. W. Gebäude mit verbesserter Energieausnutzung, Nov. 1986. Patent No.EP0091626B1.
[163] Roshko, A. Experiments on the flow past a circular cylinder at very high Reynolds num-ber. Tech. rep., GuggenheimAeronautical Laboratory, California Institute of Technology,California, USA, Nov. 1960.
[164] Rudolf, T., R. Taller Towers for Larger Wind Turbines: a Market Study of SupportStructure Technology for Onshore Wind Turbines. Master Thesis supervised by Prof.Dr.-Ing. Torsten Faber, Wind Energy Technology Insitute, FH Flensburg, Flensburg,Nov. 2013.
[165] Runge, C. über die numerische Auflösung von Differentialgleichungen. MathematischeAnnalen 46 (1895), pp. 167–178.
[166] SCD Technology. Data sheet SCD nezzy 8.0 MW, Jan. 2015.[167] Schlichting, H., and Gersten, K. Boundary-layer theory, 8 ed. Springer, Berlin ;
New York, 2000. ISBN 978-3-540-66270-9.[168] Schulte, H., and Bruger, P. Drehbare Kurzwellen-Vorhangantenne auf der
Funksendestelle Marlow. Stahlbau 69, 10 (Oct. 2000), pp. 781–787. ISSN 00389145,DOI 10.1002/stab.200002870.
[169] Scrouton, C., and Walshe, D. E. A means for avoiding wind-excited oscillations ofstructures with circular or nearly circular cross-section. aero report: National PhsysicalLaboratory (Great Britain) 335 (1957).
[170] Scruton, C. Wind effects on structures. James Clayton Lecture Proc. Inst. of Mech.Eng, 185/23 (1971), pp. 301–317.
[171] Shkara, Y., Werkmeister, A., Fontecha, R., Jacobs, G., and Schelenz, R. Anexperimental and computational investigation of wind turbine blade-tower aerodynamicinteraction. In Proceedings of 13th biennial German Wind Energy Conference DEWEK2017 (Bremen, Oct. 2017).
241
References
[172] Skrzypinski, W. R. Analysis and modeling of unsteady aerodynamics with applicationto wind turbine blade vibration at standstill conditions. Dissertation, DTUWind Energy,Roskilde, DK.
[173] Smith, C. On some recent applications of the coanda effect to acoustics. The Journal ofthe Acoustical Society of America 128 (10 2010), 2286. DOI 10.1121/1.3508016.
[174] Smith, E., and Slocum, A. Tapered spiral welded structure, May 2014. Patent No.US8720153B2.
[175] Sockel, H. Aerodynamik der Bauwerke. Vieweg, Braunschweig, 1984. ISBN 978-3-528-08845-3.
[176] Song, H., Damiani, R., Robertson, A., and Jonkman, J. New Structural-DynamicsModule for Offshore Multimember Substructures within the Wind Turbine Computer-Aided Engineering Tool FAST. Proceedings of the International Offshore and PolarEngineering Conference (01 2013), pp. 383–391.
[177] Steel Pro Maschinenbau GmbH. ASPARAGO®Neue Türme für die Windenergie.Information Brochure, Berlin, 2016.
[178] Strømmen, E. N. Structural Dynamics, vol. 2 of Springer Series in Solid and StructuralMechanics. Springer International Publishing, Cham, 2014. ISBN 978-3-319-01801-0.
[179] Struve, A., Faber, T., Damiani, R., Jonkman, J., and Ummenhofer, T. Load-Direction-Derived Support Structures for Wind Turbines: A Lattice Tower Concept andPreparations for Future Certifications. In Proceedings of 13th biennial German WindEnergy Conference DEWEK 2017 (Bremen, Oct. 2017).
[180] Svensson, H. Design of foundations for wind turbines. Master Thesis, Lund University,Lund, S, 2010.
[181] Taesong, K., Hansen, A. M., and Branner, K. Development of an anisotropic beamfinite element for composite wind turbine blades inmultibody system. Renewable Energy59 (Nov. 2013), pp. 172–183. ISSN 09601481, DOI 10.1016/j.renene.2013.03.033.
[182] Teal, D. L. E. Wind turbine tower having rotatable shroud/fairing, Mar. 2001. PatentNo. GB2353825A.
[183] Team Optimus150. Presentation of WETI reference wind turbine Optimus150, Feb.2016.
[184] Theodorsen, T. General theory of aerodynamic instability and the mechanism of flutter.Tech. Rep. 496, National Advisory Committee for Aeronautics, USA, 1934.
[185] Thompson, A. Wind turbine appartus, Apr. 2012. Patent No. EP2436924A1.[186] Timoshenko, S. P., and Gere, J. M. Theory of elastic stability, 2 ed. McGraw-Hill,
New York, 1961. ISBN 0-07-Y85821-7.[187] Ummenhofer, T., and Weich, I. Hochfrequente Haemmerverfahren - Steigerung der
Ermuedungsfestigkeit neuer und bestehender geschweisster Stahlkonstruktionen. Bauin-genieur 2007, 82 (2007), pp. 237–244.
[188] Ummenhofer, T., Weich, I., Bergers, J., and Herion, S. Reduktion der Wand-dicken bei Tragtürmen von Windenergieanlagen durch den Einsatz höherfester Stähle.Stahlbau 76, 9 (Sept. 2007), pp. 643–649. ISSN 00389145, 14371049, DOI10.1002/stab.200710068.
242
References
[189] van der Tempel, J. Design of Support Structures for Offshore Wind Turbines. Disser-tation, Delft University of Technology, Delft, Apr. 2006.
[190] Vestas. V80-2.0 MW Versatile megawattage brochure. http://pdf.directindustry.com/pdf/vestas/v80-20-mw-brochure/20680-53605.html,2003. [Online; accessed 14-February-2019].
[191] Wallasch, A.-K., Lüers, S., and Rehfeldt, K. Wirtschaftlichkeit unterschiedlicherNabenhöhen von Windenergieanlagen. Studie im Auftrag des Bundesministeriumsfür Wirtschaft und Energie, Deutsche WindGuard, Varel, Germany, June 2017. No.SP17012A1.
[192] Wang, Q., Jonkman, J., Sprague, M., and Jonkman, B. BeamDyn user’s guide andtheory manual. Tech. rep., Golden, USA, Mar. 216.
[193] Whitbread, R. E. Practical solutions to some windinduced vibration problems. Nat.Phys. Lab. NPL Rep. Sci. R 124 (1975).
[194] White, F. M. Fluid mechanics, 5 ed. McGraw-Hill series in mechanical engineering.McGraw-Hill, Boston, 2003. ISBN 978-0-07-283180-1.
[195] Wiedemann, J. Leichtbau 1: Elemente, 2 ed. No. 1 in Leichtbau. Springer, Berlin,1996. ISBN 3-540-60746-3.
[196] Wiedemann, J. Leichtbau: Elemente und Konstruktion, 3 ed. Klassiker der Technik.Springer, Berlin, 2007. ISBN 978-3-540-33656-3.
[197] Woodhouse, P. R., Jacobson, D., and Petersen, B. The Everett and Monte CristoRailway. Oso Pub, Arlington, USA, 2000. ISBN 978-0-9647521-8-4.
[198] Zahm, A. F., Smith, R. H., and Louden, F. A. Forces on elliptic cylinders in uniformair stream. Tech. Rep. Report No. 289, National Advisory Committee for Aeronautics,Washington D.C., USA, 1928.
243

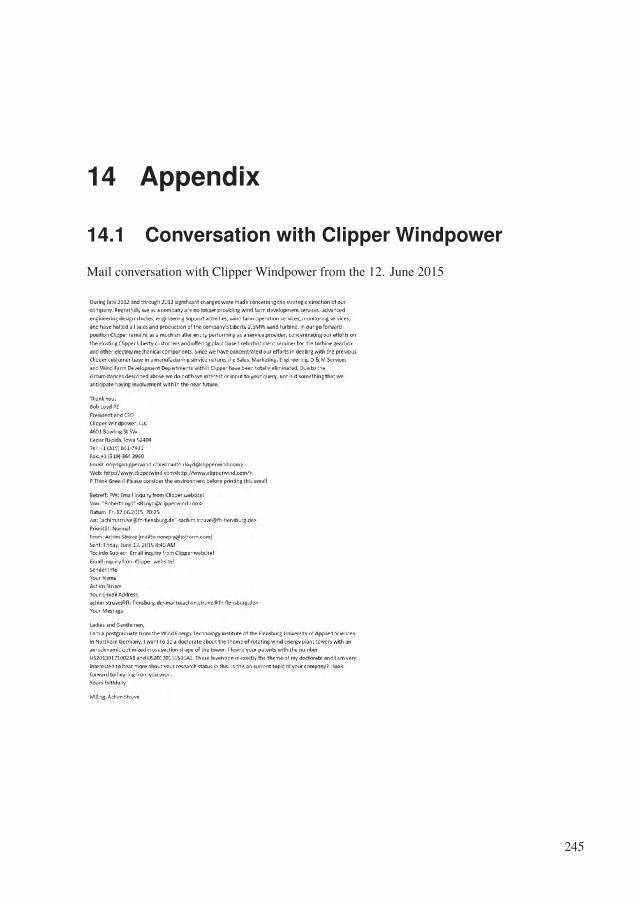
14 Appendix
14.1 Conversation with Clipper Windpower
Mail conversation with Clipper Windpower from the 12. June 2015
245
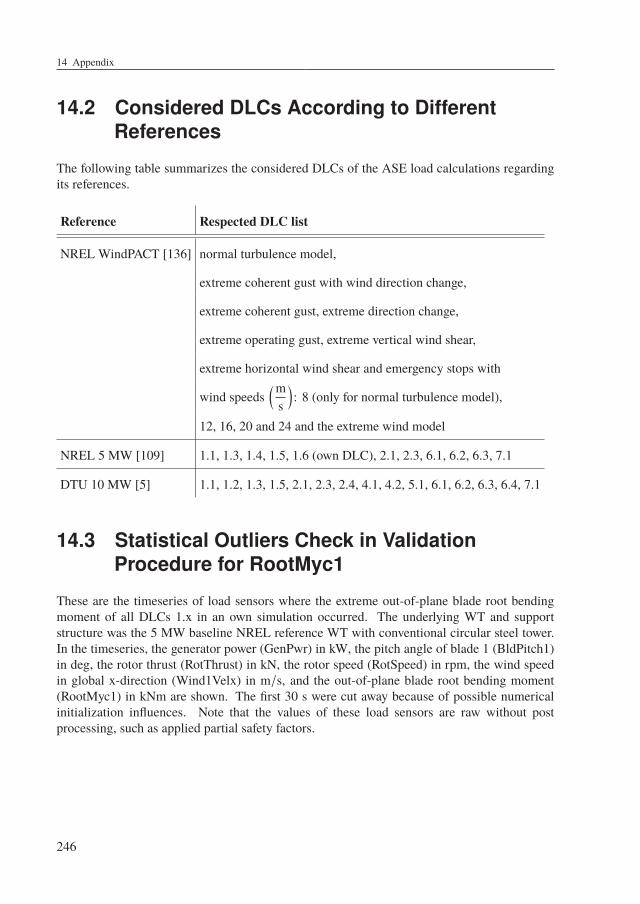
14 Appendix
14.2 Considered DLCs According to DifferentReferences
The following table summarizes the considered DLCs of the ASE load calculations regardingits references.
Reference Respected DLC list
NREL WindPACT [136] normal turbulence model,
extreme coherent gust with wind direction change,
extreme coherent gust, extreme direction change,
extreme operating gust, extreme vertical wind shear,
extreme horizontal wind shear and emergency stops with
wind speeds(m
s
): 8 (only for normal turbulence model),
12, 16, 20 and 24 and the extreme wind model
NREL 5 MW [109] 1.1, 1.3, 1.4, 1.5, 1.6 (own DLC), 2.1, 2.3, 6.1, 6.2, 6.3, 7.1
DTU 10 MW [5] 1.1, 1.2, 1.3, 1.5, 2.1, 2.3, 2.4, 4.1, 4.2, 5.1, 6.1, 6.2, 6.3, 6.4, 7.1
14.3 Statistical Outliers Check in ValidationProcedure for RootMyc1
These are the timeseries of load sensors where the extreme out-of-plane blade root bendingmoment of all DLCs 1.x in an own simulation occurred. The underlying WT and supportstructure was the 5 MW baseline NREL reference WT with conventional circular steel tower.In the timeseries, the generator power (GenPwr) in kW, the pitch angle of blade 1 (BldPitch1)in deg, the rotor thrust (RotThrust) in kN, the rotor speed (RotSpeed) in rpm, the wind speedin global x-direction (Wind1Velx) in m/s, and the out-of-plane blade root bending moment(RootMyc1) in kNm are shown. The first 30 s were cut away because of possible numericalinitialization influences. Note that the values of these load sensors are raw without postprocessing, such as applied partial safety factors.
246

14.3 Statistical Outliers Check in Validation Procedure for RootMyc1
247
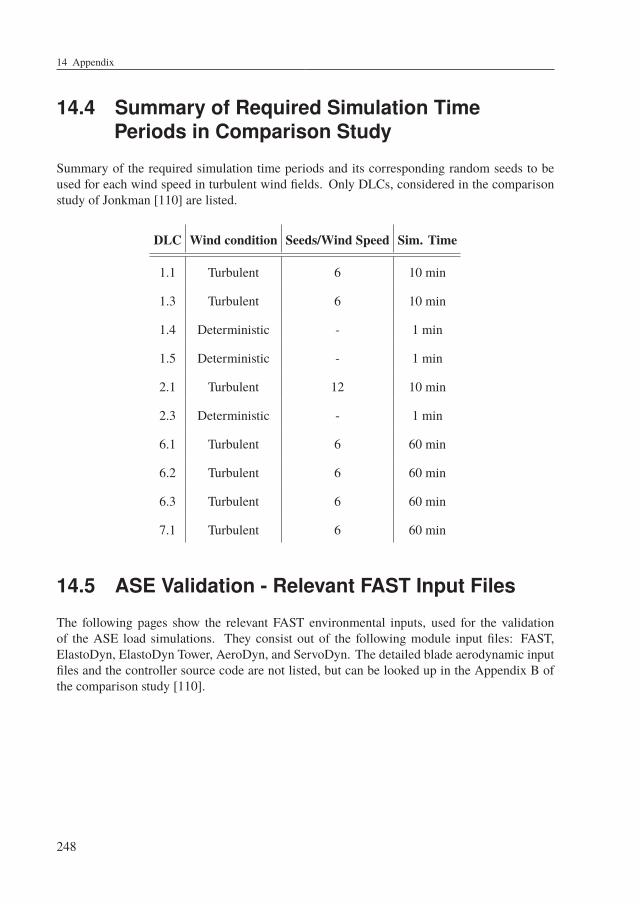
14 Appendix
14.4 Summary of Required Simulation TimePeriods in Comparison Study
Summary of the required simulation time periods and its corresponding random seeds to beused for each wind speed in turbulent wind fields. Only DLCs, considered in the comparisonstudy of Jonkman [110] are listed.
DLC Wind condition Seeds/Wind Speed Sim. Time
1.1 Turbulent 6 10 min
1.3 Turbulent 6 10 min
1.4 Deterministic - 1 min
1.5 Deterministic - 1 min
2.1 Turbulent 12 10 min
2.3 Deterministic - 1 min
6.1 Turbulent 6 60 min
6.2 Turbulent 6 60 min
6.3 Turbulent 6 60 min
7.1 Turbulent 6 60 min
14.5 ASE Validation - Relevant FAST Input Files
The following pages show the relevant FAST environmental inputs, used for the validationof the ASE load simulations. They consist out of the following module input files: FAST,ElastoDyn, ElastoDyn Tower, AeroDyn, and ServoDyn. The detailed blade aerodynamic inputfiles and the controller source code are not listed, but can be looked up in the Appendix B ofthe comparison study [110].
248
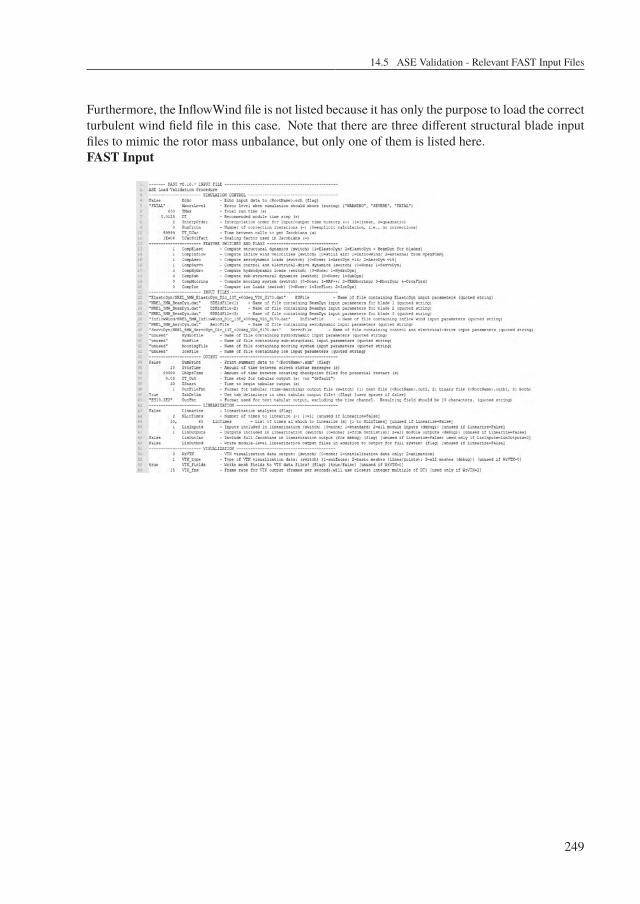
14.5 ASE Validation - Relevant FAST Input Files
Furthermore, the InflowWind file is not listed because it has only the purpose to load the correctturbulent wind field file in this case. Note that there are three different structural blade inputfiles to mimic the rotor mass unbalance, but only one of them is listed here.FAST Input
249
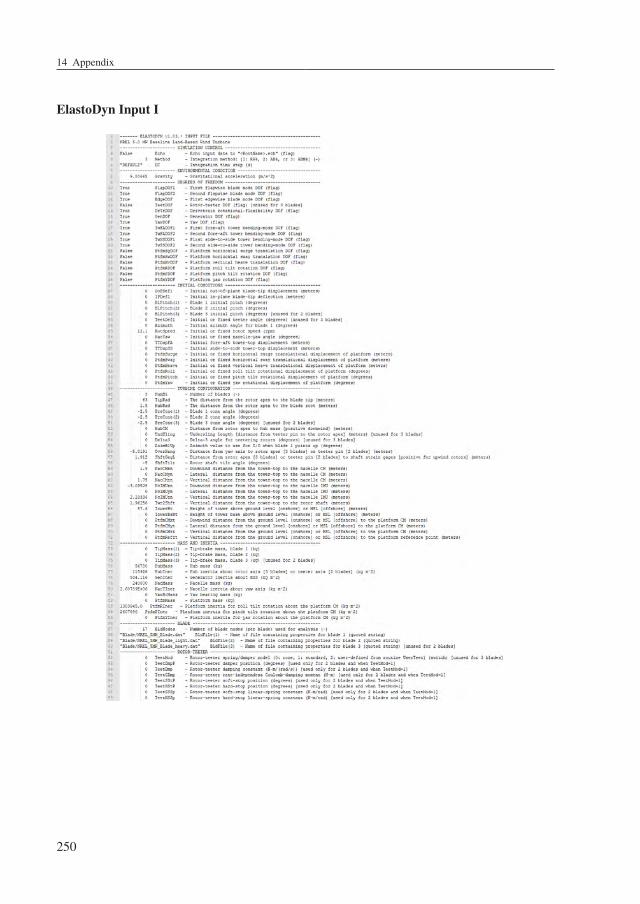
14 Appendix
ElastoDyn Input I
250
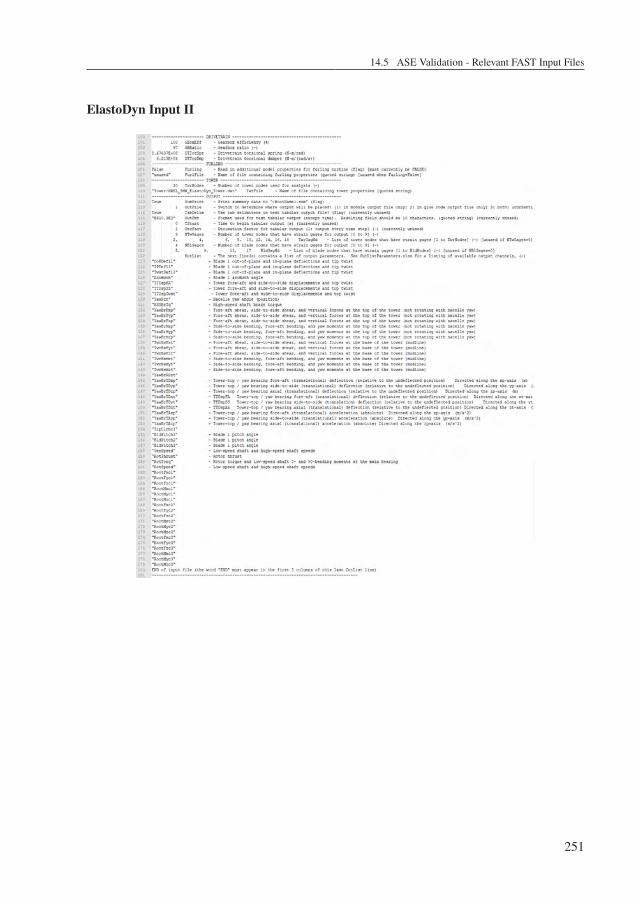
14.5 ASE Validation - Relevant FAST Input Files
ElastoDyn Input II
251
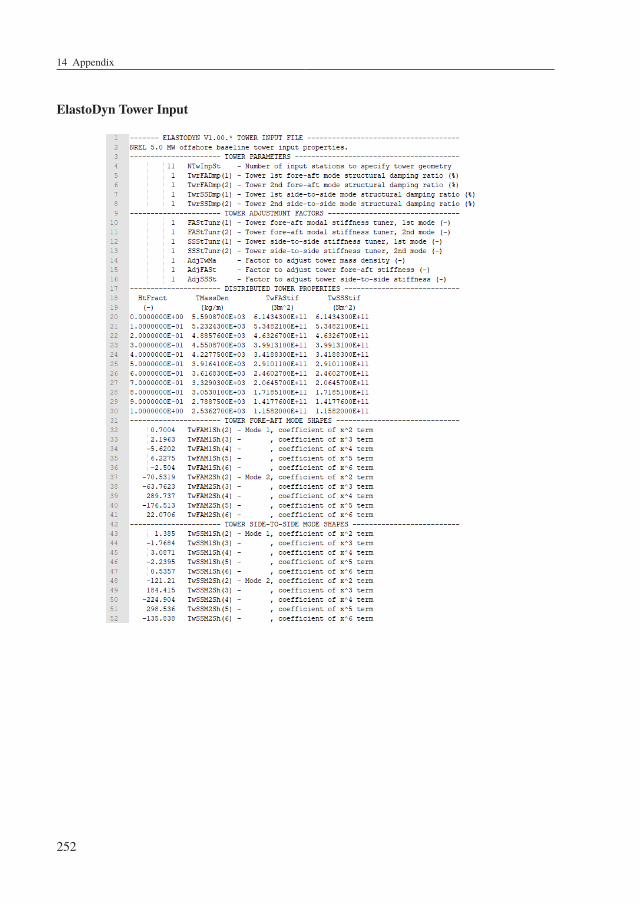
14 Appendix
ElastoDyn Tower Input
252
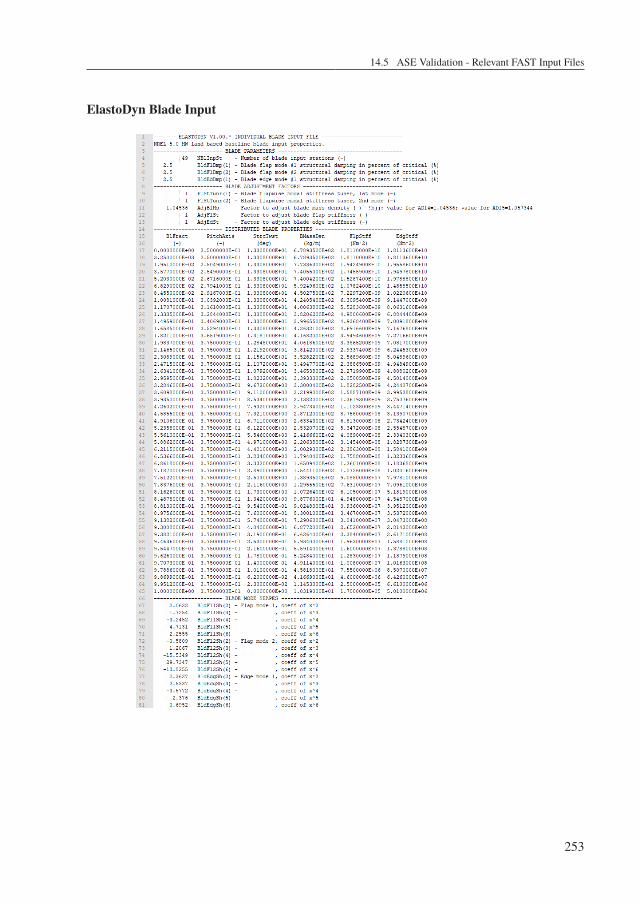
14.5 ASE Validation - Relevant FAST Input Files
ElastoDyn Blade Input
253
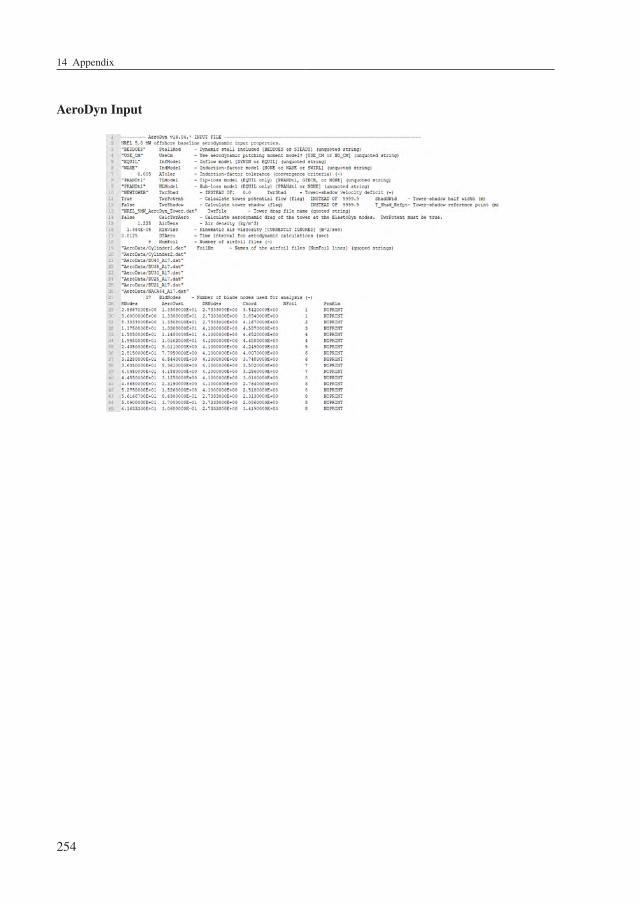
14 Appendix
AeroDyn Input
254
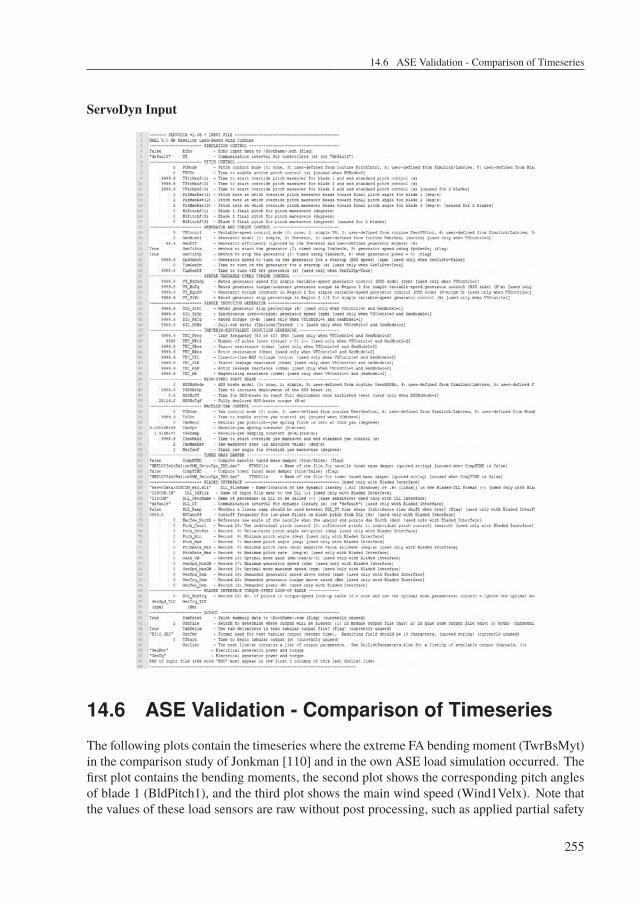
14.6 ASE Validation - Comparison of Timeseries
ServoDyn Input
14.6 ASE Validation - Comparison of Timeseries
The following plots contain the timeseries where the extreme FA bending moment (TwrBsMyt)in the comparison study of Jonkman [110] and in the own ASE load simulation occurred. Thefirst plot contains the bending moments, the second plot shows the corresponding pitch anglesof blade 1 (BldPitch1), and the third plot shows the main wind speed (Wind1Velx). Note thatthe values of these load sensors are raw without post processing, such as applied partial safety
255
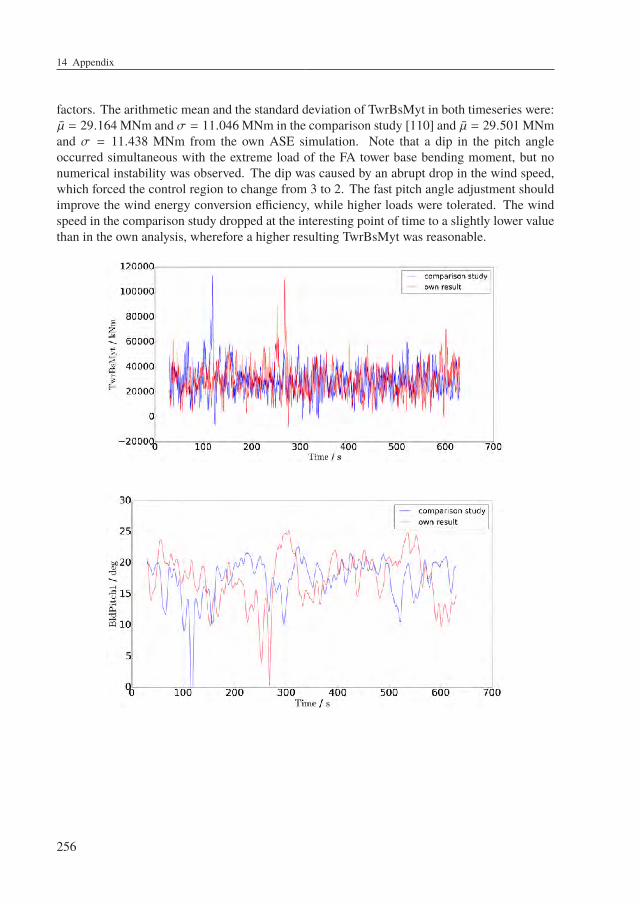
14 Appendix
factors. The arithmetic mean and the standard deviation of TwrBsMyt in both timeseries were:µ = 29.164 MNm and σ = 11.046 MNm in the comparison study [110] and µ = 29.501 MNmand σ = 11.438 MNm from the own ASE simulation. Note that a dip in the pitch angleoccurred simultaneous with the extreme load of the FA tower base bending moment, but nonumerical instability was observed. The dip was caused by an abrupt drop in the wind speed,which forced the control region to change from 3 to 2. The fast pitch angle adjustment shouldimprove the wind energy conversion efficiency, while higher loads were tolerated. The windspeed in the comparison study dropped at the interesting point of time to a slightly lower valuethan in the own analysis, wherefore a higher resulting TwrBsMyt was reasonable.
256
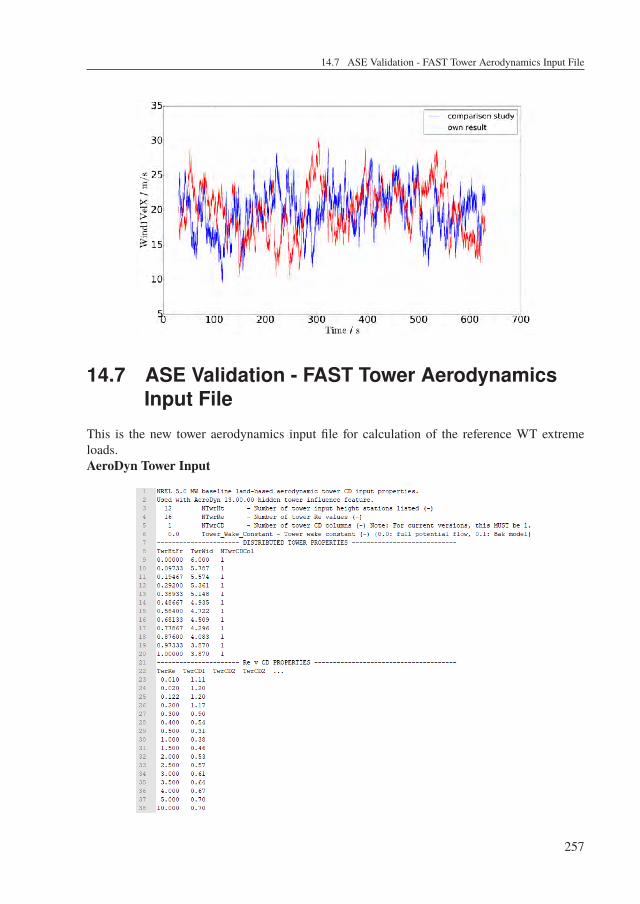
14.7 ASE Validation - FAST Tower Aerodynamics Input File
14.7 ASE Validation - FAST Tower AerodynamicsInput File
This is the new tower aerodynamics input file for calculation of the reference WT extremeloads.AeroDyn Tower Input
257
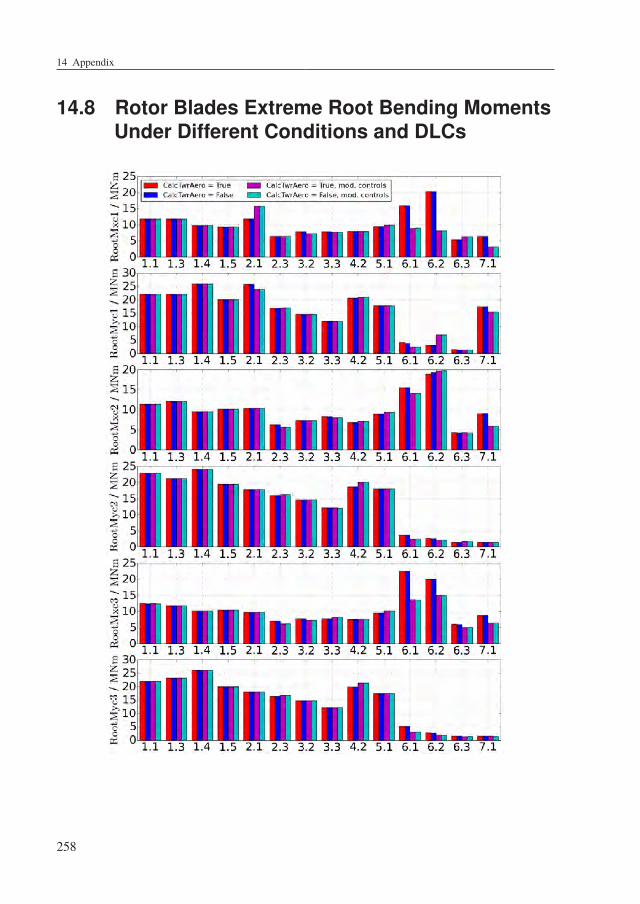
14 Appendix
14.8 Rotor Blades Extreme Root Bending MomentsUnder Different Conditions and DLCs
258
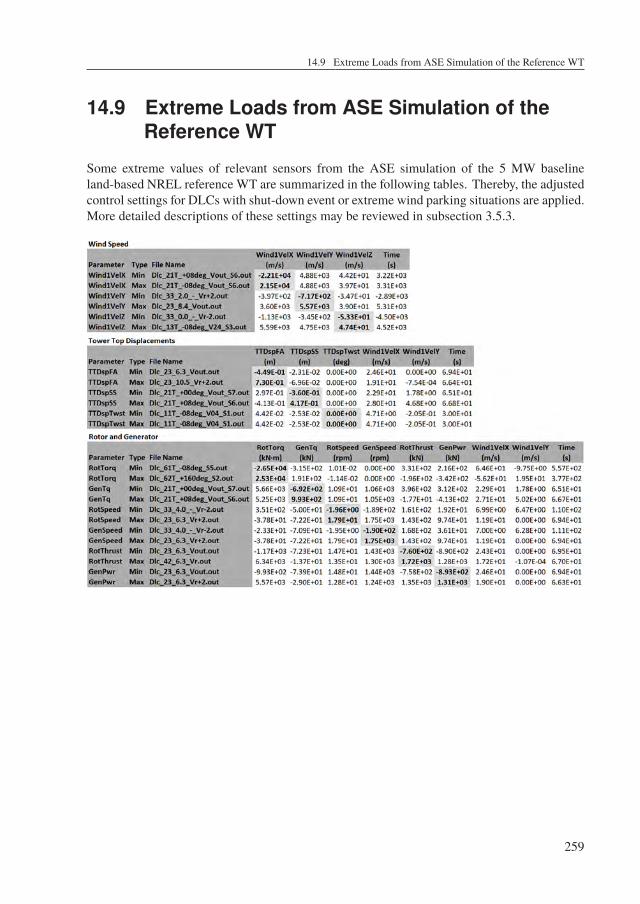
14.9 Extreme Loads from ASE Simulation of the Reference WT
14.9 Extreme Loads from ASE Simulation of theReference WT
Some extreme values of relevant sensors from the ASE simulation of the 5 MW baselineland-based NREL reference WT are summarized in the following tables. Thereby, the adjustedcontrol settings for DLCs with shut-down event or extreme wind parking situations are applied.More detailed descriptions of these settings may be reviewed in subsection 3.5.3.
259
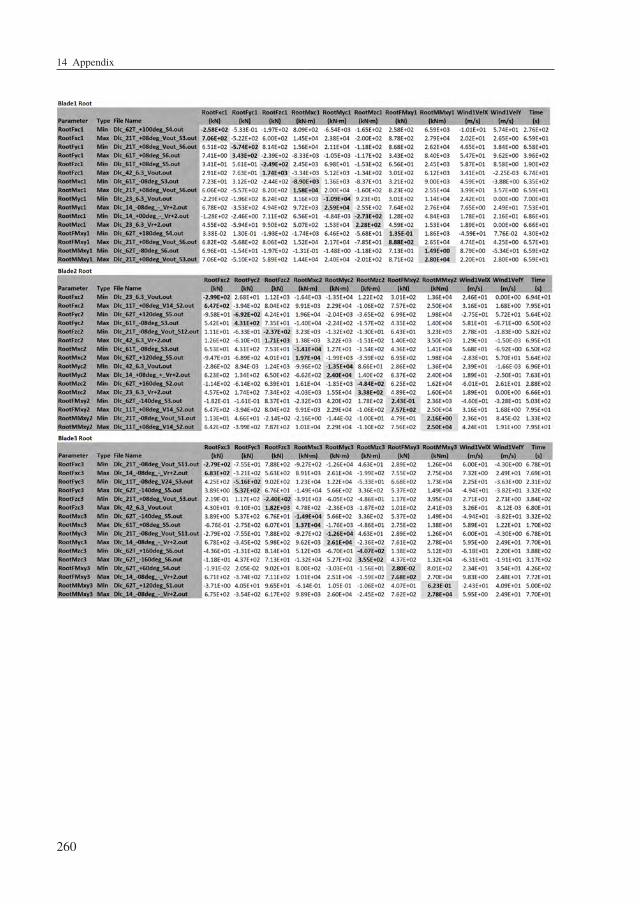
14 Appendix
260
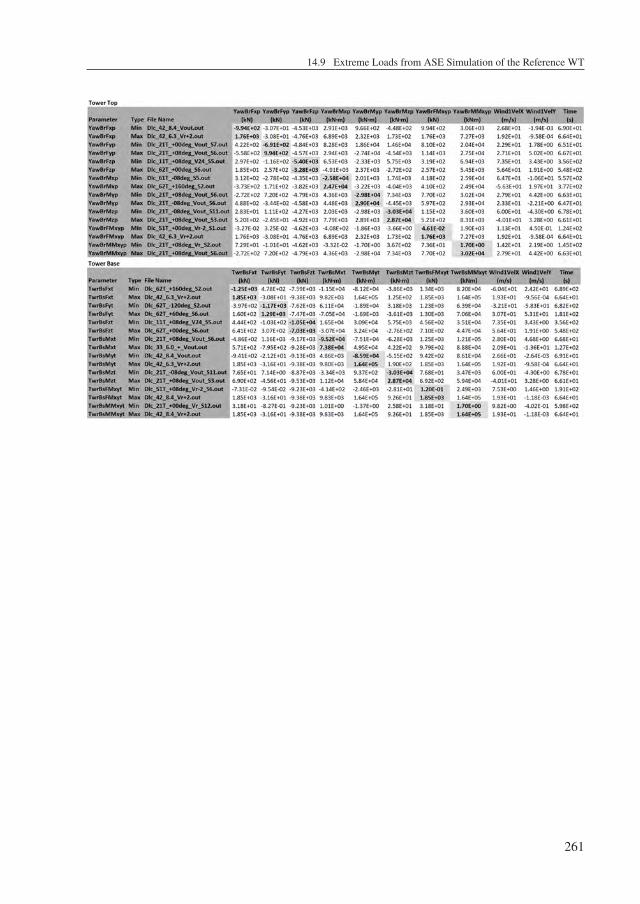
14.9 Extreme Loads from ASE Simulation of the Reference WT
261
14 Appendix
14.10 Expertise Survey - Yaw Bearing at WT TowerBase
262
14.10 Expertise Survey - Yaw Bearing at WT Tower Base
263
14 Appendix
264
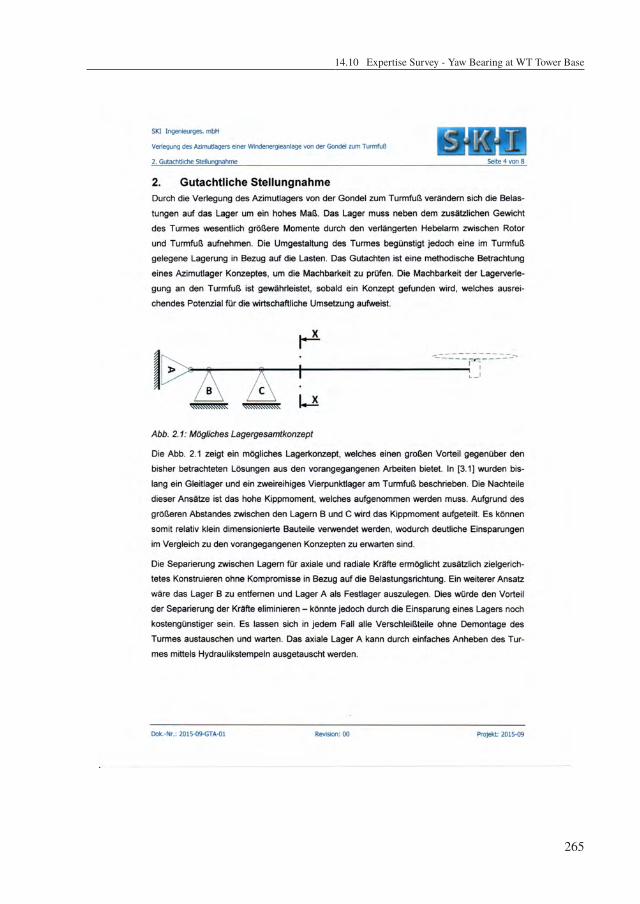
14.10 Expertise Survey - Yaw Bearing at WT Tower Base
265
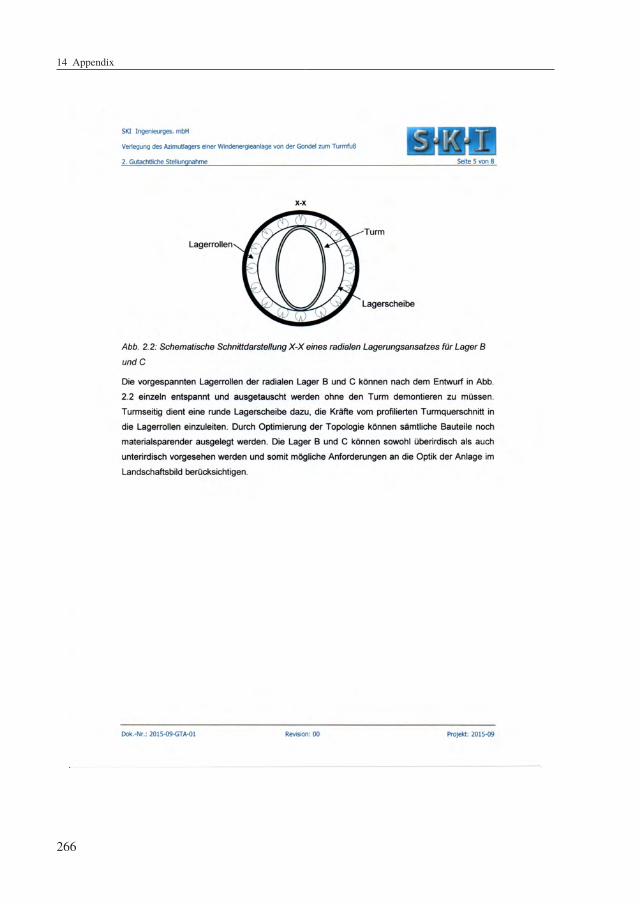
14 Appendix
266
14.10 Expertise Survey - Yaw Bearing at WT Tower Base
267
14 Appendix
268
14.10 Expertise Survey - Yaw Bearing at WT Tower Base
269
14 Appendix
14.11 Transition between Shells and Plates
Local stability failures are based on the stresses inside a shell or a plate and its boundaryconditions where plates are shells with radius r = ∞. In general, plates are treated withinthe plate theory and shells are treated within the membrane theory. Different profiles, such asplate like, ideal shell like and intermediates are expectable for rotatable tubular WT towers.Therefore, following statements should lead to extract the most relevant influences in terms ofstability for arbitrary plates and shells, respectively. Shells with an ideal shape and withoutimperfections such as small local buckles and residual stresses sustain the membrane state ofstress if deformations are not hindered [149]. Local shell buckling depends on the relationr/t, with r as the shell radius. This is visible through the statements within the Eurocode 3DIN EN 1993-1-6:2010-12 [44], which regulates steel shell designs and provides r/t limitsaccording to meridian buckling
rt≤ 0.03
Efyk, (14.1)
circumferential bucklingrt≤ 0.21
√Efyk
(14.2)
and shear bucklingrt≤ 0.16
(Efyk
)0.67(14.3)
for unstiffed cylinder shells with constant wall thickness. If these limits are respected, cor-responding buckling checks need not to be done. The general meaning of this is that localshell buckling resistance increases with decreasing r/t. This relation alone is insufficient torepresent plate like profiles and to compare them with shell-like profiles, because r/t = ∞ forplates. But plates have the ability to sustain normal stresses, which is not suggested by the r/tratio. However, to acquire this problem, explanations from Wiedemann [195] are used. Platebuckling can be described according to the expansion of the fourth order bending line theorydifferential equation for beams with constant bending stiffness under axial force N
E IB∂4w
∂x4 + N∂w
∂x2 = q(x), (14.4)
where q(x) equals to a line load. The expansion of equation 14.4 for plates considers pressureloads Nx , Ny and shear loads Nxy = Nyx at the borders according to Petersen [149].
E IB
1 − ν2
(∂4w
∂x4 + 2∂4w
∂x2 ∂y2 +∂4w
∂y4
)+ Nx
∂2w
∂x2 + 2 Nxy∂2w
∂x ∂y+ Ny
∂2w
∂y2 = q(x, y). (14.5)
Practical civil engineering checks without the over critical nonlinear behaviour of a plate arebased on equation 14.5. Solving this equation for specific load cases leads to the critical platebuckling stress
σKi = kσ E( t
b
)2(14.6)
270
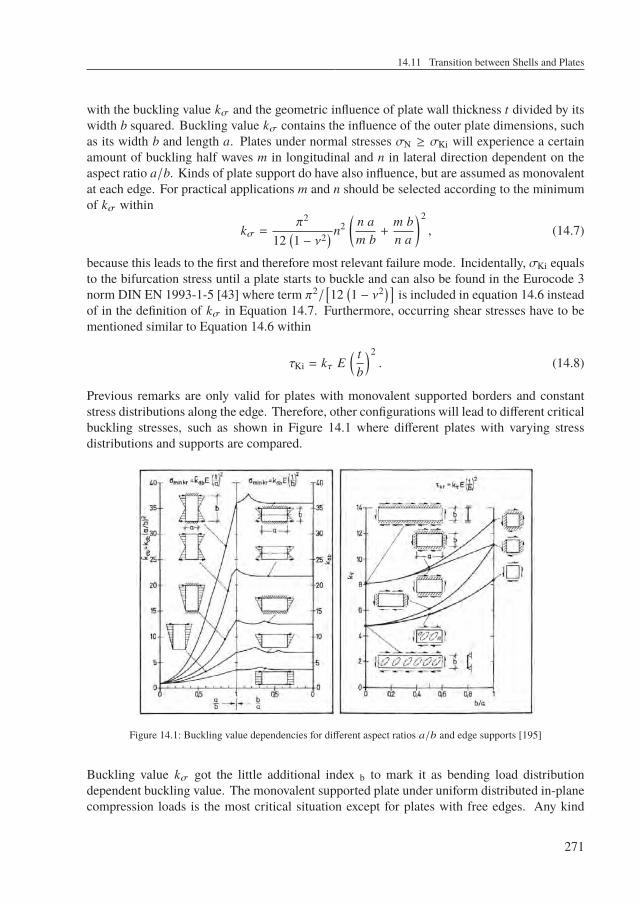
14.11 Transition between Shells and Plates
with the buckling value kσ and the geometric influence of plate wall thickness t divided by itswidth b squared. Buckling value kσ contains the influence of the outer plate dimensions, suchas its width b and length a. Plates under normal stresses σN ≥ σKi will experience a certainamount of buckling half waves m in longitudinal and n in lateral direction dependent on theaspect ratio a/b. Kinds of plate support do have also influence, but are assumed as monovalentat each edge. For practical applications m and n should be selected according to the minimumof kσ within
kσ =π2
12(1 − ν2) n2
(n am b+
m bn a
)2, (14.7)
because this leads to the first and therefore most relevant failure mode. Incidentally, σKi equalsto the bifurcation stress until a plate starts to buckle and can also be found in the Eurocode 3norm DIN EN 1993-1-5 [43] where term π2/
[12
(1 − ν2) ] is included in equation 14.6 instead
of in the definition of kσ in Equation 14.7. Furthermore, occurring shear stresses have to bementioned similar to Equation 14.6 within
τKi = kτ E( t
b
)2. (14.8)
Previous remarks are only valid for plates with monovalent supported borders and constantstress distributions along the edge. Therefore, other configurations will lead to different criticalbuckling stresses, such as shown in Figure 14.1 where different plates with varying stressdistributions and supports are compared.
Figure 14.1: Buckling value dependencies for different aspect ratios a/b and edge supports [195]
Buckling value kσ got the little additional index b to mark it as bending load distributiondependent buckling value. The monovalent supported plate under uniform distributed in-planecompression loads is the most critical situation except for plates with free edges. Any kind
271
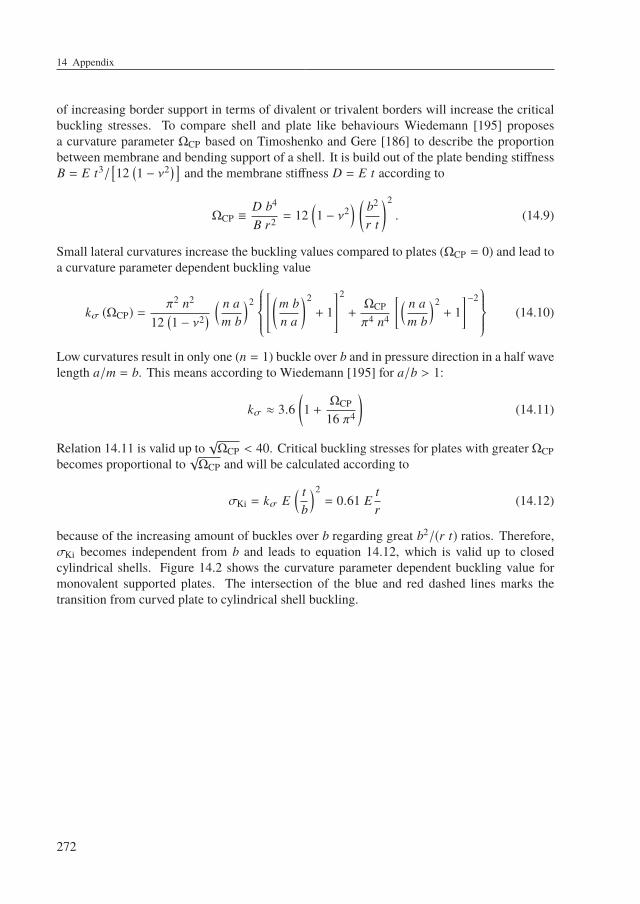
14 Appendix
of increasing border support in terms of divalent or trivalent borders will increase the criticalbuckling stresses. To compare shell and plate like behaviours Wiedemann [195] proposesa curvature parameter ΩCP based on Timoshenko and Gere [186] to describe the proportionbetween membrane and bending support of a shell. It is build out of the plate bending stiffnessB = E t3/
[12
(1 − ν2) ] and the membrane stiffness D = E t according to
ΩCP ≡D b4
B r2 = 12(1 − ν2
) (b2
r t
)2
. (14.9)
Small lateral curvatures increase the buckling values compared to plates (ΩCP = 0) and lead toa curvature parameter dependent buckling value
kσ (ΩCP) =π2 n2
12(1 − ν2) ( n a
m b
)2[(
m bn a
)2+ 1
]2
+ΩCP
π4 n4
[( n am b
)2+ 1
]−2 (14.10)
Low curvatures result in only one (n = 1) buckle over b and in pressure direction in a half wavelength a/m = b. This means according to Wiedemann [195] for a/b > 1:
kσ ≈ 3.6(1 +ΩCP
16 π4
)(14.11)
Relation 14.11 is valid up to√ΩCP < 40. Critical buckling stresses for plates with greater ΩCP
becomes proportional to√ΩCP and will be calculated according to
σKi = kσ E( t
b
)2= 0.61 E
tr
(14.12)
because of the increasing amount of buckles over b regarding great b2/(r t) ratios. Therefore,σKi becomes independent from b and leads to equation 14.12, which is valid up to closedcylindrical shells. Figure 14.2 shows the curvature parameter dependent buckling value formonovalent supported plates. The intersection of the blue and red dashed lines marks thetransition from curved plate to cylindrical shell buckling.
272
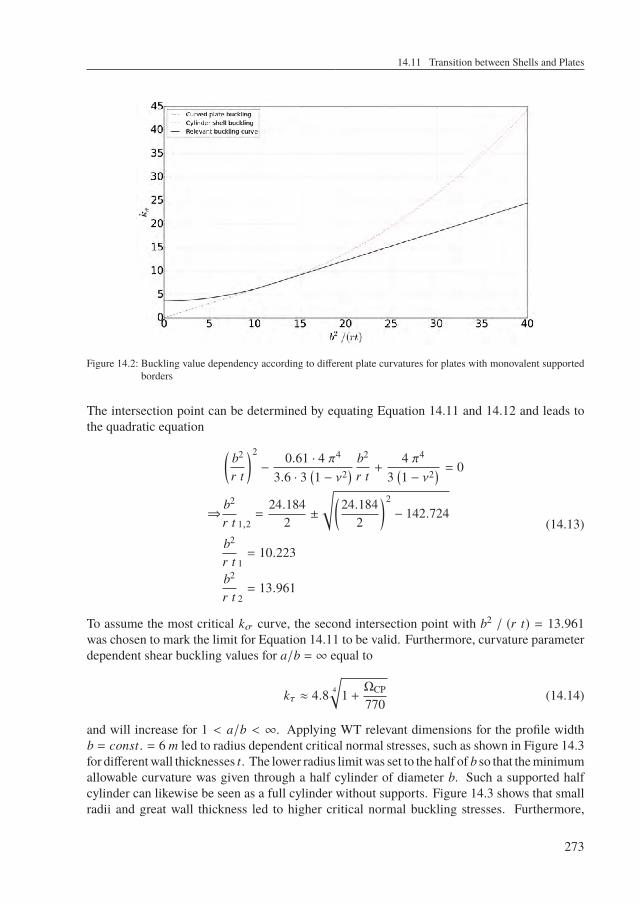
14.11 Transition between Shells and Plates
Figure 14.2: Buckling value dependency according to different plate curvatures for plates with monovalent supportedborders
The intersection point can be determined by equating Equation 14.11 and 14.12 and leads tothe quadratic equation (
b2
r t
)2
−0.61 · 4 π4
3.6 · 3(1 − ν2) b2
r t+
4 π4
3(1 − ν2) = 0
⇒b2
r t 1,2=
24.1842±
√(24.184
2
)2− 142.724
b2
r t 1= 10.223
b2
r t 2= 13.961
(14.13)
To assume the most critical kσ curve, the second intersection point with b2 / (r t) = 13.961was chosen to mark the limit for Equation 14.11 to be valid. Furthermore, curvature parameterdependent shear buckling values for a/b = ∞ equal to
kτ ≈ 4.8 4
√1 +ΩCP
770(14.14)
and will increase for 1 < a/b < ∞. Applying WT relevant dimensions for the profile widthb = const. = 6 m led to radius dependent critical normal stresses, such as shown in Figure 14.3for differentwall thicknesses t. The lower radius limitwas set to the half of b so that theminimumallowable curvature was given through a half cylinder of diameter b. Such a supported halfcylinder can likewise be seen as a full cylinder without supports. Figure 14.3 shows that smallradii and great wall thickness led to higher critical normal buckling stresses. Furthermore,
273
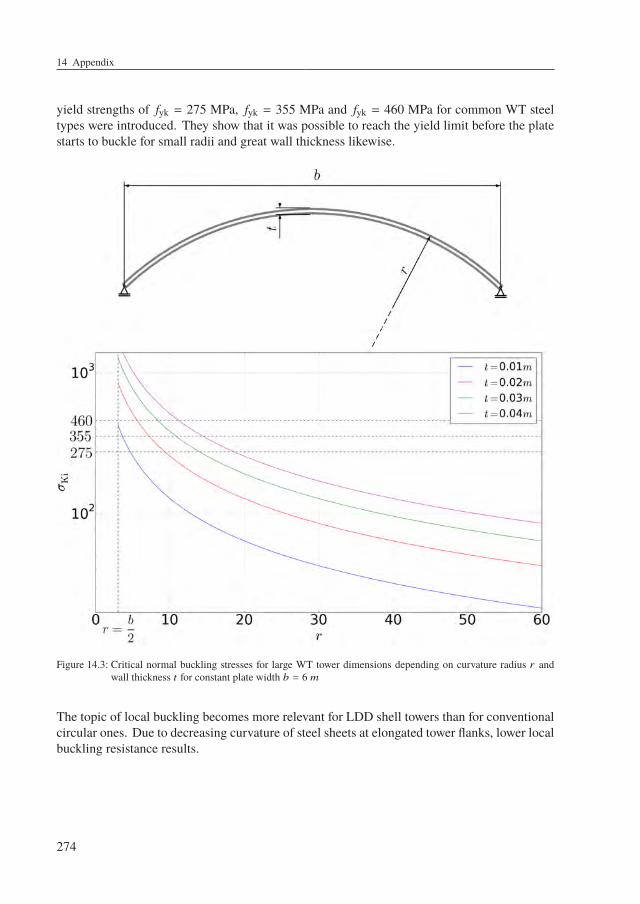
14 Appendix
yield strengths of fyk = 275 MPa, fyk = 355 MPa and fyk = 460 MPa for common WT steeltypes were introduced. They show that it was possible to reach the yield limit before the platestarts to buckle for small radii and great wall thickness likewise.
Figure 14.3: Critical normal buckling stresses for large WT tower dimensions depending on curvature radius r andwall thickness t for constant plate width b = 6 m
The topic of local buckling becomes more relevant for LDD shell towers than for conventionalcircular ones. Due to decreasing curvature of steel sheets at elongated tower flanks, lower localbuckling resistance results.
274
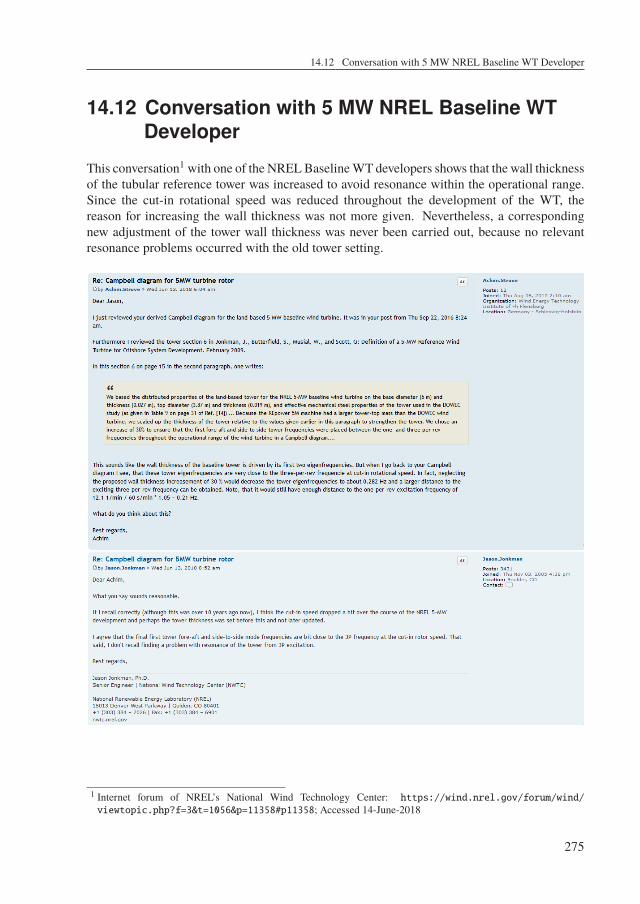
14.12 Conversation with 5 MW NREL Baseline WT Developer
14.12 Conversation with 5 MW NREL Baseline WTDeveloper
This conversation1 with one of the NRELBaselineWT developers shows that the wall thicknessof the tubular reference tower was increased to avoid resonance within the operational range.Since the cut-in rotational speed was reduced throughout the development of the WT, thereason for increasing the wall thickness was not more given. Nevertheless, a correspondingnew adjustment of the tower wall thickness was never been carried out, because no relevantresonance problems occurred with the old tower setting.
1 Internet forum of NREL’s National Wind Technology Center: https://wind.nrel.gov/forum/wind/viewtopic.php?f=3&t=1056&p=11358#p11358; Accessed 14-June-2018
275
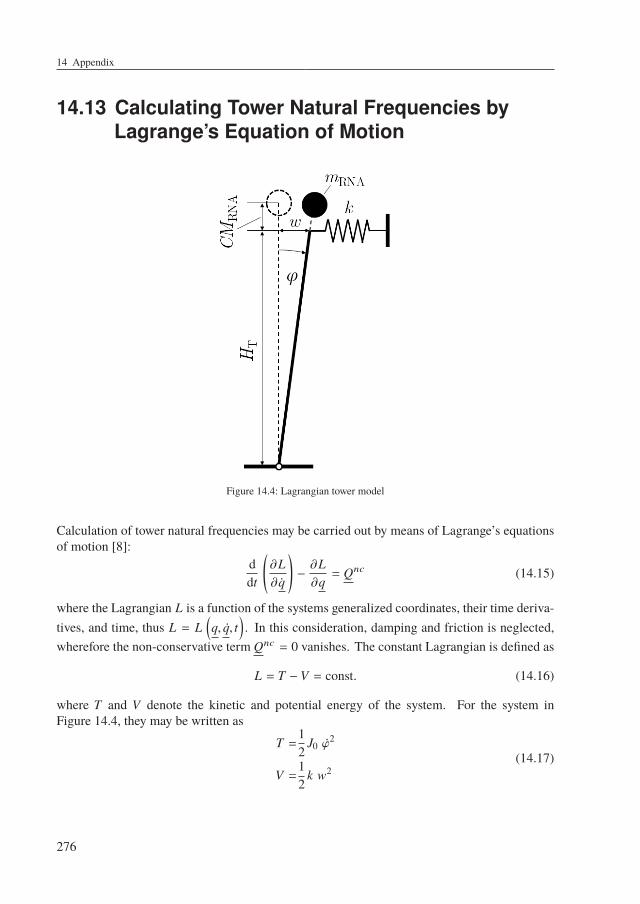
14 Appendix
14.13 Calculating Tower Natural Frequencies byLagrange’s Equation of Motion
Figure 14.4: Lagrangian tower model
Calculation of tower natural frequencies may be carried out by means of Lagrange’s equationsof motion [8]:
ddt
(∂L∂ Ûq
)−∂L∂q= Qnc (14.15)
where the Lagrangian L is a function of the systems generalized coordinates, their time deriva-tives, and time, thus L = L
(q, Ûq, t
). In this consideration, damping and friction is neglected,
wherefore the non-conservative term Qnc = 0 vanishes. The constant Lagrangian is defined as
L = T − V = const. (14.16)
where T and V denote the kinetic and potential energy of the system. For the system inFigure 14.4, they may be written as
T =12
J0 Ûϕ2
V =12
k w2(14.17)
276
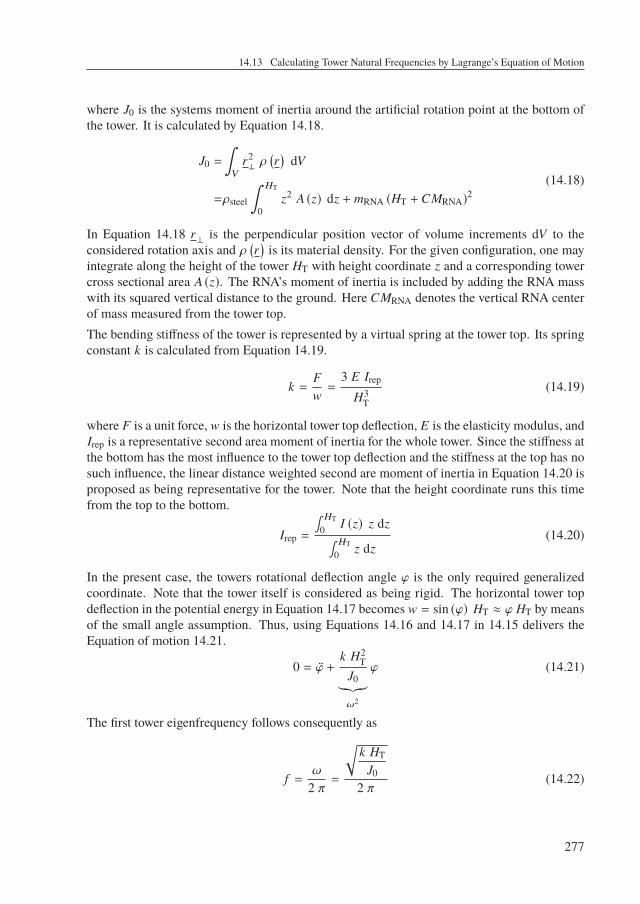
14.13 Calculating Tower Natural Frequencies by Lagrange’s Equation of Motion
where J0 is the systems moment of inertia around the artificial rotation point at the bottom ofthe tower. It is calculated by Equation 14.18.
J0 =
∫V
r2⊥ρ(r)
dV
=ρsteel
∫ HT
0z2 A (z) dz + mRNA (HT + CMRNA)
2(14.18)
In Equation 14.18 r⊥is the perpendicular position vector of volume increments dV to the
considered rotation axis and ρ(r)is its material density. For the given configuration, one may
integrate along the height of the tower HT with height coordinate z and a corresponding towercross sectional area A (z). The RNA’s moment of inertia is included by adding the RNA masswith its squared vertical distance to the ground. Here CMRNA denotes the vertical RNA centerof mass measured from the tower top.The bending stiffness of the tower is represented by a virtual spring at the tower top. Its springconstant k is calculated from Equation 14.19.
k =Fw=
3 E Irep
H3T
(14.19)
where F is a unit force, w is the horizontal tower top deflection, E is the elasticity modulus, andIrep is a representative second area moment of inertia for the whole tower. Since the stiffness atthe bottom has the most influence to the tower top deflection and the stiffness at the top has nosuch influence, the linear distance weighted second are moment of inertia in Equation 14.20 isproposed as being representative for the tower. Note that the height coordinate runs this timefrom the top to the bottom.
Irep =
∫ HT
0 I (z) z dz∫ HT
0 z dz(14.20)
In the present case, the towers rotational deflection angle ϕ is the only required generalizedcoordinate. Note that the tower itself is considered as being rigid. The horizontal tower topdeflection in the potential energy in Equation 14.17 becomes w = sin (ϕ) HT ≈ ϕ HT by meansof the small angle assumption. Thus, using Equations 14.16 and 14.17 in 14.15 delivers theEquation of motion 14.21.
0 = Üϕ +k H2
TJ0︸︷︷︸ω2
ϕ (14.21)
The first tower eigenfrequency follows consequently as
f =ω
2 π=
√k HT
J0
2 π(14.22)
277
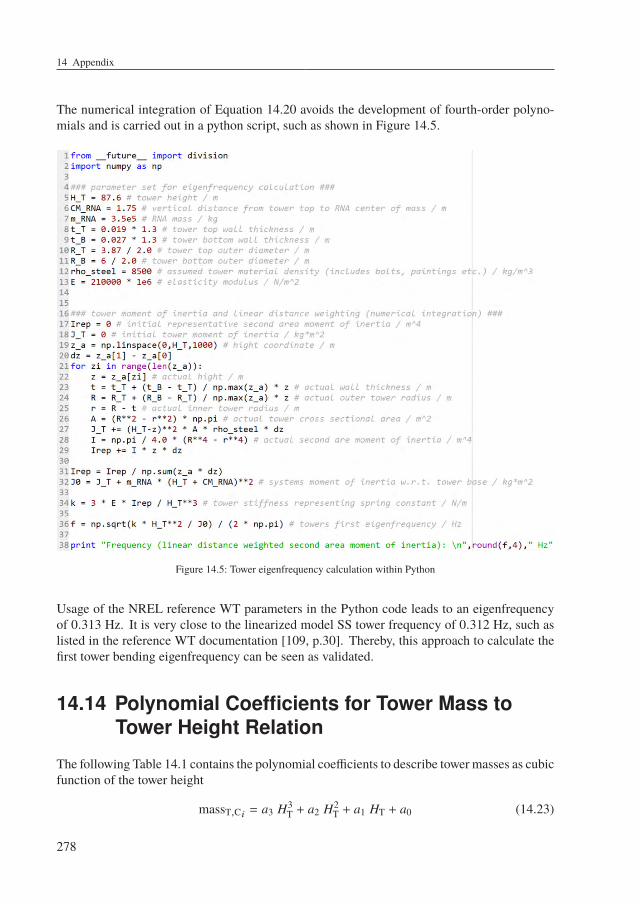
14 Appendix
The numerical integration of Equation 14.20 avoids the development of fourth-order polyno-mials and is carried out in a python script, such as shown in Figure 14.5.
Figure 14.5: Tower eigenfrequency calculation within Python
Usage of the NREL reference WT parameters in the Python code leads to an eigenfrequencyof 0.313 Hz. It is very close to the linearized model SS tower frequency of 0.312 Hz, such aslisted in the reference WT documentation [109, p.30]. Thereby, this approach to calculate thefirst tower bending eigenfrequency can be seen as validated.
14.14 Polynomial Coefficients for Tower Mass toTower Height Relation
The following Table 14.1 contains the polynomial coefficients to describe tower masses as cubicfunction of the tower height
massT,Ci = a3 H3T + a2 H2
T + a1 HT + a0 (14.23)
278
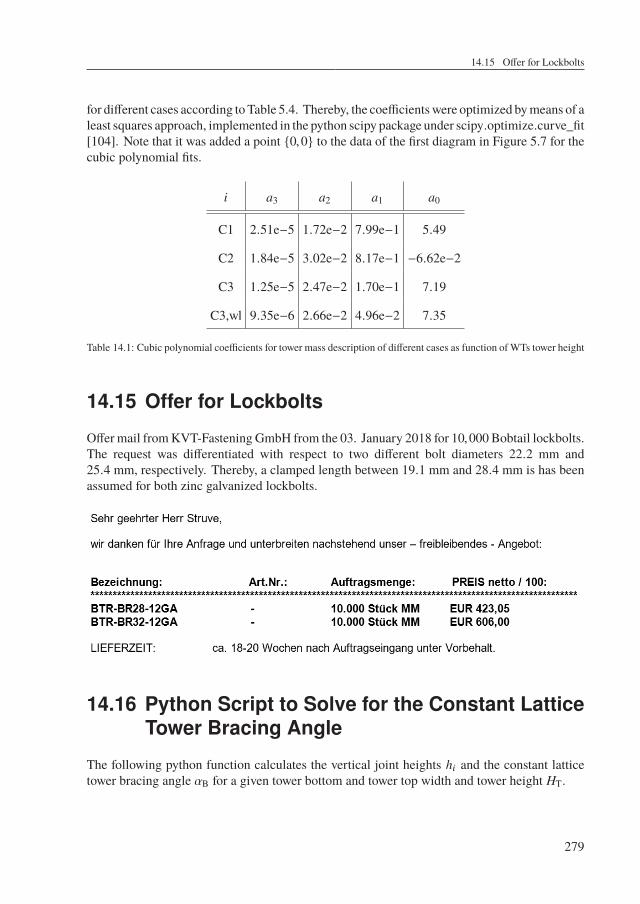
14.15 Offer for Lockbolts
for different cases according toTable 5.4. Thereby, the coefficientswere optimized bymeans of aleast squares approach, implemented in the python scipy package under scipy.optimize.curve_fit[104]. Note that it was added a point 0,0 to the data of the first diagram in Figure 5.7 for thecubic polynomial fits.
i a3 a2 a1 a0
C1 2.51e−5 1.72e−2 7.99e−1 5.49
C2 1.84e−5 3.02e−2 8.17e−1 −6.62e−2
C3 1.25e−5 2.47e−2 1.70e−1 7.19
C3,wl 9.35e−6 2.66e−2 4.96e−2 7.35
Table 14.1: Cubic polynomial coefficients for tower mass description of different cases as function ofWTs tower height
14.15 Offer for Lockbolts
Offermail fromKVT-Fastening GmbH from the 03. January 2018 for 10,000Bobtail lockbolts.The request was differentiated with respect to two different bolt diameters 22.2 mm and25.4 mm, respectively. Thereby, a clamped length between 19.1 mm and 28.4 mm is has beenassumed for both zinc galvanized lockbolts.
14.16 Python Script to Solve for the Constant LatticeTower Bracing Angle
The following python function calculates the vertical joint heights hi and the constant latticetower bracing angle αB for a given tower bottom and tower top width and tower height HT.
279
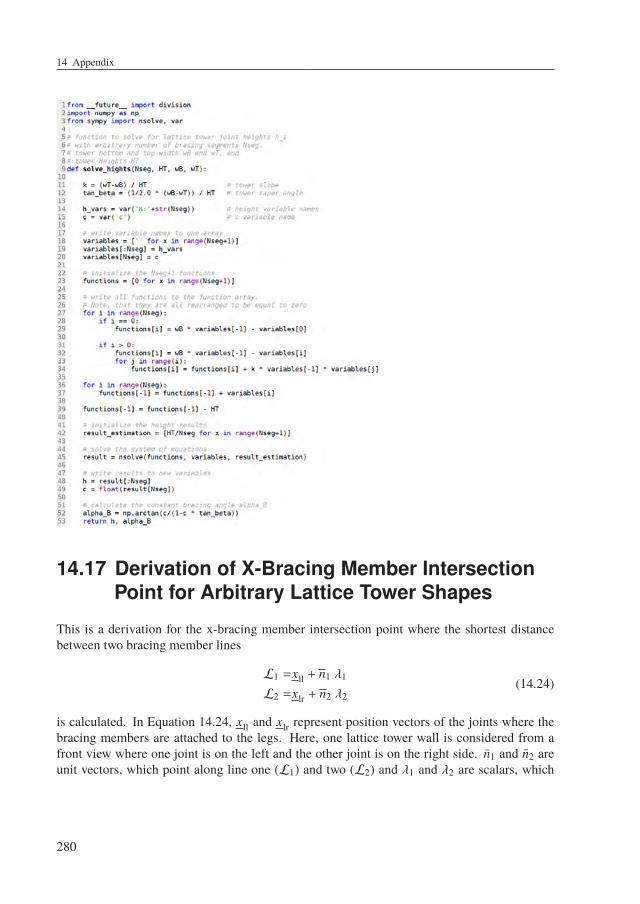
14 Appendix
14.17 Derivation of X-Bracing Member IntersectionPoint for Arbitrary Lattice Tower Shapes
This is a derivation for the x-bracing member intersection point where the shortest distancebetween two bracing member lines
L1 =xll + n1 λ1
L2 =xlr + n2 λ2(14.24)
is calculated. In Equation 14.24, xll and xlr represent position vectors of the joints where thebracing members are attached to the legs. Here, one lattice tower wall is considered from afront view where one joint is on the left and the other joint is on the right side. n1 and n2 areunit vectors, which point along line one (L1) and two (L2) and λ1 and λ2 are scalars, which
280
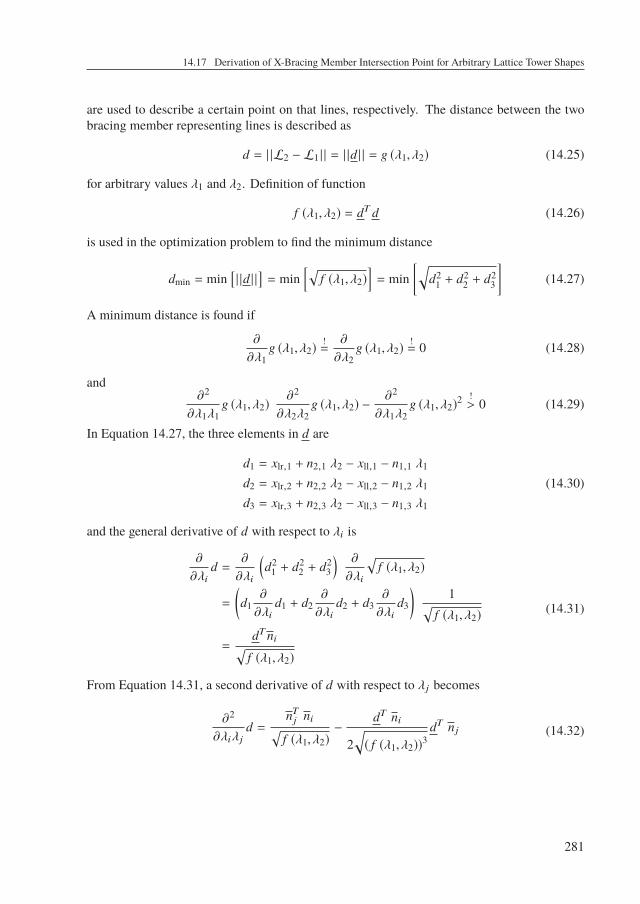
14.17 Derivation of X-Bracing Member Intersection Point for Arbitrary Lattice Tower Shapes
are used to describe a certain point on that lines, respectively. The distance between the twobracing member representing lines is described as
d = | |L2 − L1 | | = | |d | | = g (λ1, λ2) (14.25)
for arbitrary values λ1 and λ2. Definition of function
f (λ1, λ2) = dT d (14.26)
is used in the optimization problem to find the minimum distance
dmin = min[| |d | |
]= min
[√f (λ1, λ2)
]= min
[√d2
1 + d22 + d2
3
](14.27)
A minimum distance is found if
∂
∂λ1g (λ1, λ2)
!=
∂
∂λ2g (λ1, λ2)
!= 0 (14.28)
and∂2
∂λ1λ1g (λ1, λ2)
∂2
∂λ2λ2g (λ1, λ2) −
∂2
∂λ1λ2g (λ1, λ2)
2 !> 0 (14.29)
In Equation 14.27, the three elements in d are
d1 = xlr,1 + n2,1 λ2 − xll,1 − n1,1 λ1
d2 = xlr,2 + n2,2 λ2 − xll,2 − n1,2 λ1
d3 = xlr,3 + n2,3 λ2 − xll,3 − n1,3 λ1
(14.30)
and the general derivative of d with respect to λi is
∂
∂λid =
∂
∂λi
(d2
1 + d22 + d2
3
) ∂
∂λi
√f (λ1, λ2)
=
(d1
∂
∂λid1 + d2
∂
∂λid2 + d3
∂
∂λid3
)1√
f (λ1, λ2)
=dTni√
f (λ1, λ2)
(14.31)
From Equation 14.31, a second derivative of d with respect to λj becomes
∂2
∂λiλjd =
nTj ni√f (λ1, λ2)
−dT ni
2√( f (λ1, λ2))
3dT n j (14.32)
281
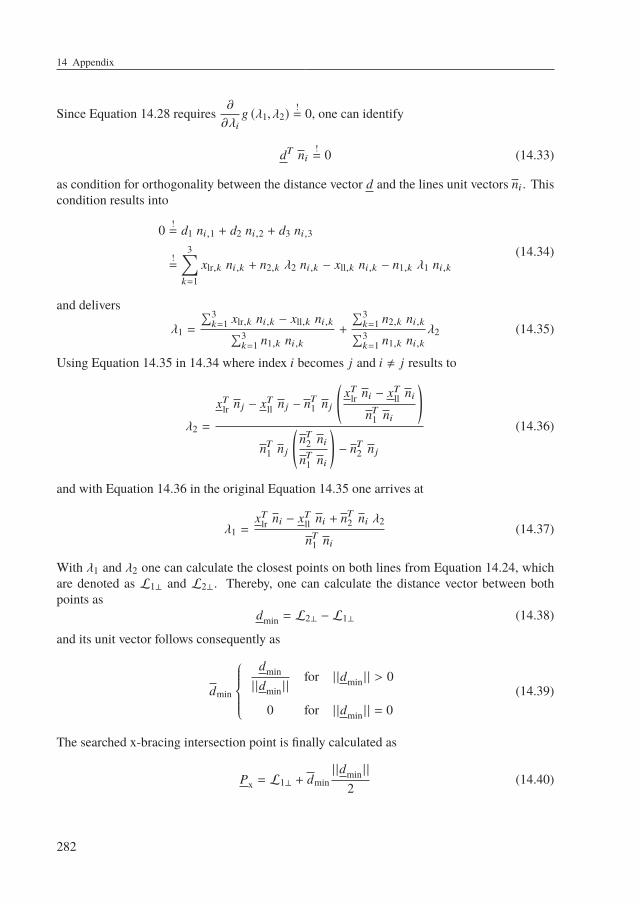
14 Appendix
Since Equation 14.28 requires∂
∂λig (λ1, λ2)
!= 0, one can identify
dT ni!= 0 (14.33)
as condition for orthogonality between the distance vector d and the lines unit vectors ni . Thiscondition results into
0 != d1 ni,1 + d2 ni,2 + d3 ni,3
!=
3∑k=1
xlr,k ni,k + n2,k λ2 ni,k − xll,k ni,k − n1,k λ1 ni,k(14.34)
and delivers
λ1 =
∑3k=1 xlr,k ni,k − xll,k ni,k∑3
k=1 n1,k ni,k+
∑3k=1 n2,k ni,k∑3k=1 n1,k ni,k
λ2 (14.35)
Using Equation 14.35 in 14.34 where index i becomes j and i , j results to
λ2 =
xTlr n j − xTll n j − nT1 n j
(xTlr ni − xTll ni
nT1 ni
)nT1 n j
(nT2 ninT1 ni
)− nT2 n j
(14.36)
and with Equation 14.36 in the original Equation 14.35 one arrives at
λ1 =xTlr ni − xTll ni + nT2 ni λ2
nT1 ni(14.37)
With λ1 and λ2 one can calculate the closest points on both lines from Equation 14.24, whichare denoted as L1⊥ and L2⊥. Thereby, one can calculate the distance vector between bothpoints as
dmin = L2⊥ − L1⊥ (14.38)
and its unit vector follows consequently as
dmin
dmin| |dmin | |
for | |dmin | | > 0
0 for | |dmin | | = 0(14.39)
The searched x-bracing intersection point is finally calculated as
Px = L1⊥ + dmin| |dmin | |
2(14.40)
282
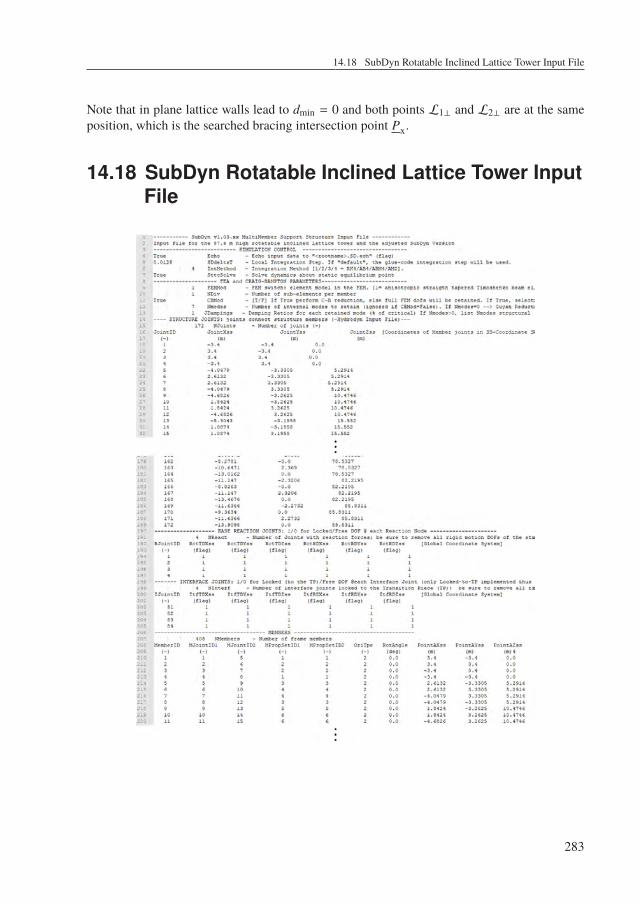
14.18 SubDyn Rotatable Inclined Lattice Tower Input File
Note that in plane lattice walls lead to dmin = 0 and both points L1⊥ and L2⊥ are at the sameposition, which is the searched bracing intersection point Px.
14.18 SubDyn Rotatable Inclined Lattice Tower InputFile
283
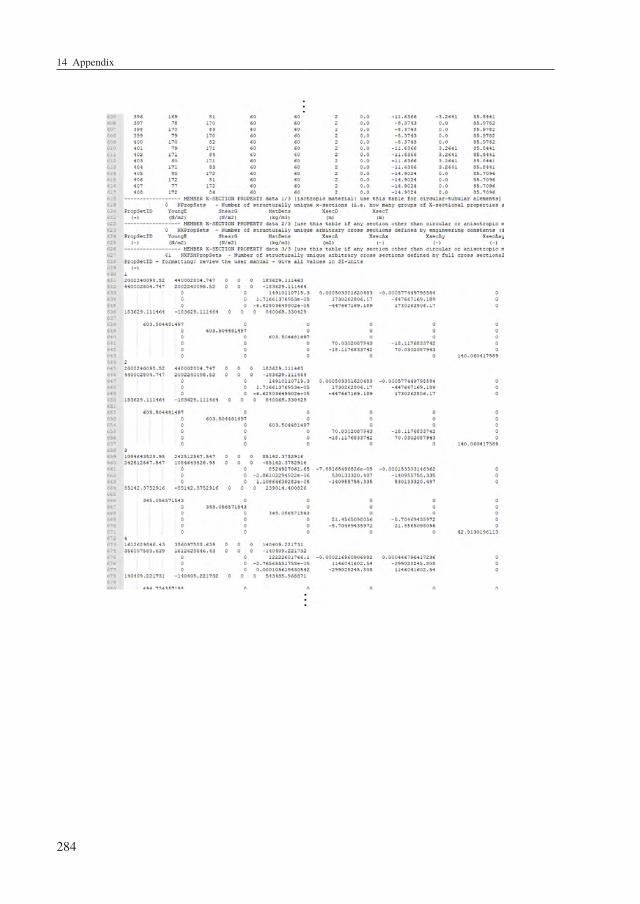
14 Appendix
284
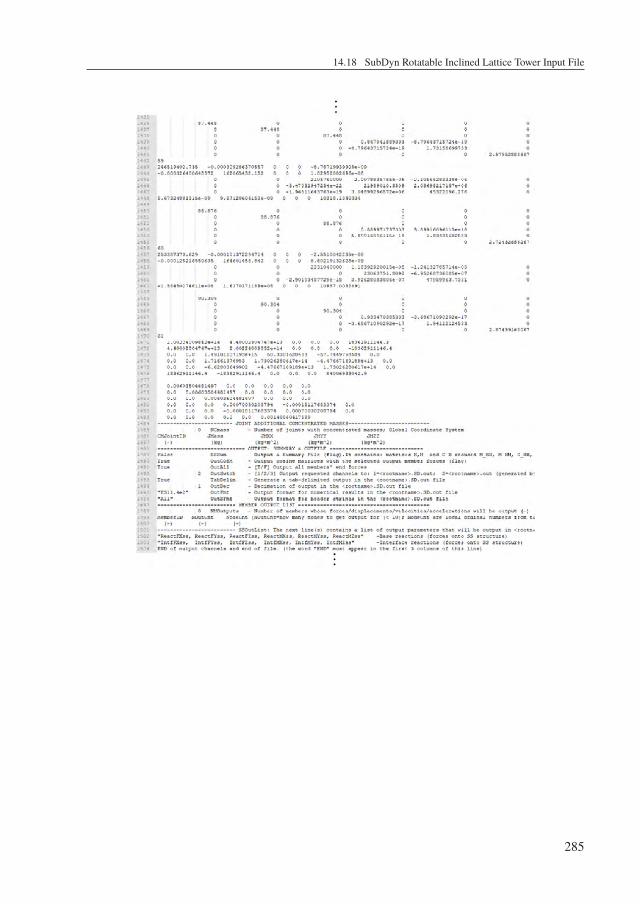
14.18 SubDyn Rotatable Inclined Lattice Tower Input File
285
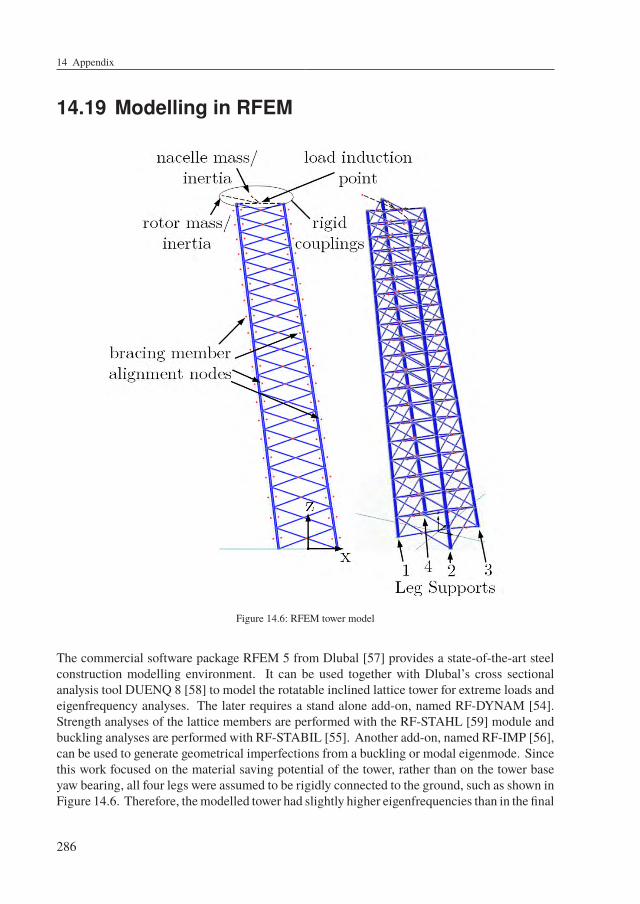
14 Appendix
14.19 Modelling in RFEM
Figure 14.6: RFEM tower model
The commercial software package RFEM 5 from Dlubal [57] provides a state-of-the-art steelconstruction modelling environment. It can be used together with Dlubal’s cross sectionalanalysis tool DUENQ 8 [58] to model the rotatable inclined lattice tower for extreme loads andeigenfrequency analyses. The later requires a stand alone add-on, named RF-DYNAM [54].Strength analyses of the lattice members are performed with the RF-STAHL [59] module andbuckling analyses are performed with RF-STABIL [55]. Another add-on, named RF-IMP [56],can be used to generate geometrical imperfections from a buckling or modal eigenmode. Sincethis work focused on the material saving potential of the tower, rather than on the tower baseyaw bearing, all four legs were assumed to be rigidly connected to the ground, such as shown inFigure 14.6. Therefore, themodelled tower had slightly higher eigenfrequencies than in the final
286
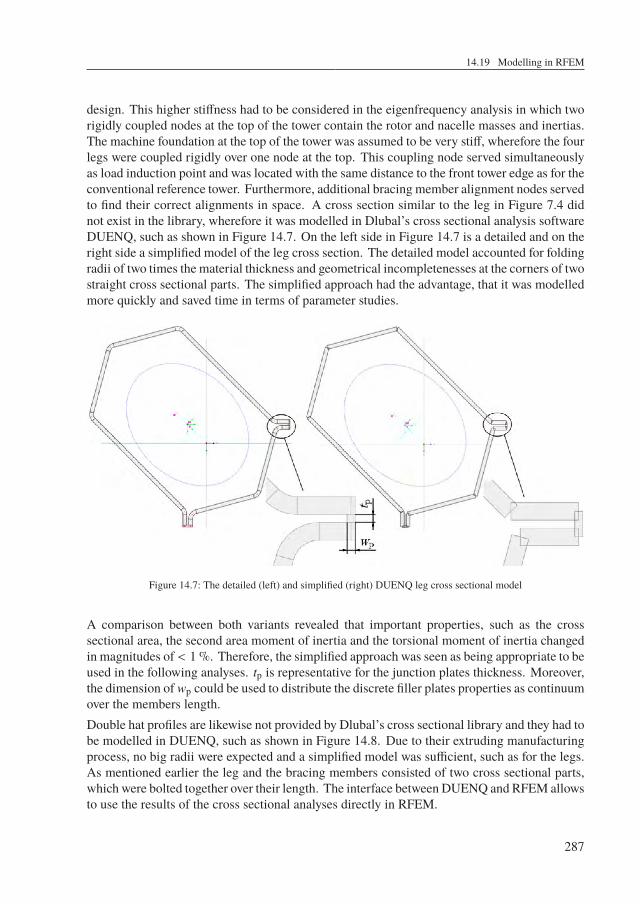
14.19 Modelling in RFEM
design. This higher stiffness had to be considered in the eigenfrequency analysis in which tworigidly coupled nodes at the top of the tower contain the rotor and nacelle masses and inertias.The machine foundation at the top of the tower was assumed to be very stiff, wherefore the fourlegs were coupled rigidly over one node at the top. This coupling node served simultaneouslyas load induction point and was located with the same distance to the front tower edge as for theconventional reference tower. Furthermore, additional bracing member alignment nodes servedto find their correct alignments in space. A cross section similar to the leg in Figure 7.4 didnot exist in the library, wherefore it was modelled in Dlubal’s cross sectional analysis softwareDUENQ, such as shown in Figure 14.7. On the left side in Figure 14.7 is a detailed and on theright side a simplified model of the leg cross section. The detailed model accounted for foldingradii of two times the material thickness and geometrical incompletenesses at the corners of twostraight cross sectional parts. The simplified approach had the advantage, that it was modelledmore quickly and saved time in terms of parameter studies.
Figure 14.7: The detailed (left) and simplified (right) DUENQ leg cross sectional model
A comparison between both variants revealed that important properties, such as the crosssectional area, the second area moment of inertia and the torsional moment of inertia changedin magnitudes of < 1 %. Therefore, the simplified approach was seen as being appropriate to beused in the following analyses. tp is representative for the junction plates thickness. Moreover,the dimension of wp could be used to distribute the discrete filler plates properties as continuumover the members length.Double hat profiles are likewise not provided by Dlubal’s cross sectional library and they had tobe modelled in DUENQ, such as shown in Figure 14.8. Due to their extruding manufacturingprocess, no big radii were expected and a simplified model was sufficient, such as for the legs.As mentioned earlier the leg and the bracing members consisted of two cross sectional parts,which were bolted together over their length. The interface between DUENQ and RFEM allowsto use the results of the cross sectional analyses directly in RFEM.
287
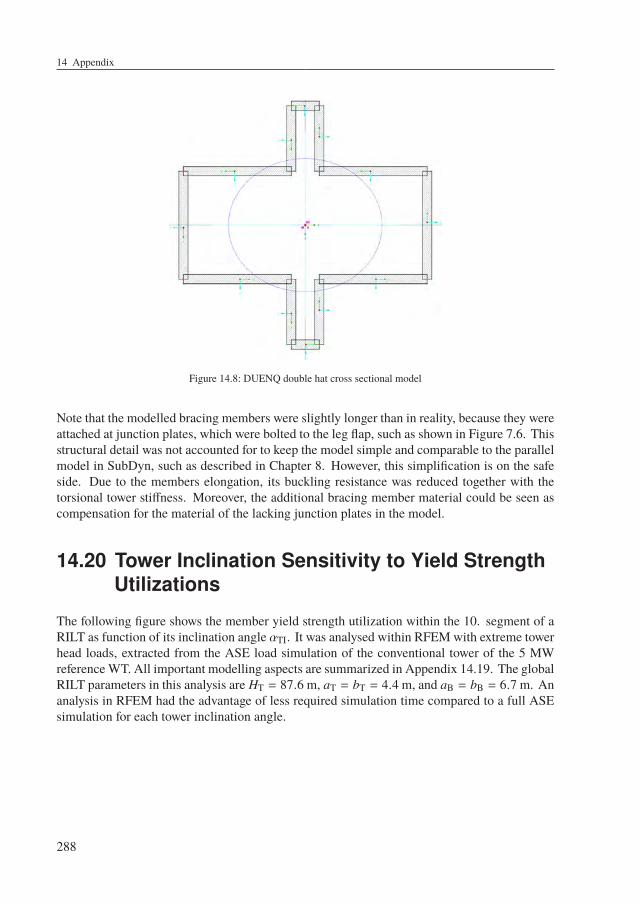
14 Appendix
Figure 14.8: DUENQ double hat cross sectional model
Note that the modelled bracing members were slightly longer than in reality, because they wereattached at junction plates, which were bolted to the leg flap, such as shown in Figure 7.6. Thisstructural detail was not accounted for to keep the model simple and comparable to the parallelmodel in SubDyn, such as described in Chapter 8. However, this simplification is on the safeside. Due to the members elongation, its buckling resistance was reduced together with thetorsional tower stiffness. Moreover, the additional bracing member material could be seen ascompensation for the material of the lacking junction plates in the model.
14.20 Tower Inclination Sensitivity to Yield StrengthUtilizations
The following figure shows the member yield strength utilization within the 10. segment of aRILT as function of its inclination angle αTI. It was analysed within RFEM with extreme towerhead loads, extracted from the ASE load simulation of the conventional tower of the 5 MWreferenceWT. All important modelling aspects are summarized in Appendix 14.19. The globalRILT parameters in this analysis are HT = 87.6 m, aT = bT = 4.4 m, and aB = bB = 6.7 m. Ananalysis in RFEM had the advantage of less required simulation time compared to a full ASEsimulation for each tower inclination angle.
288
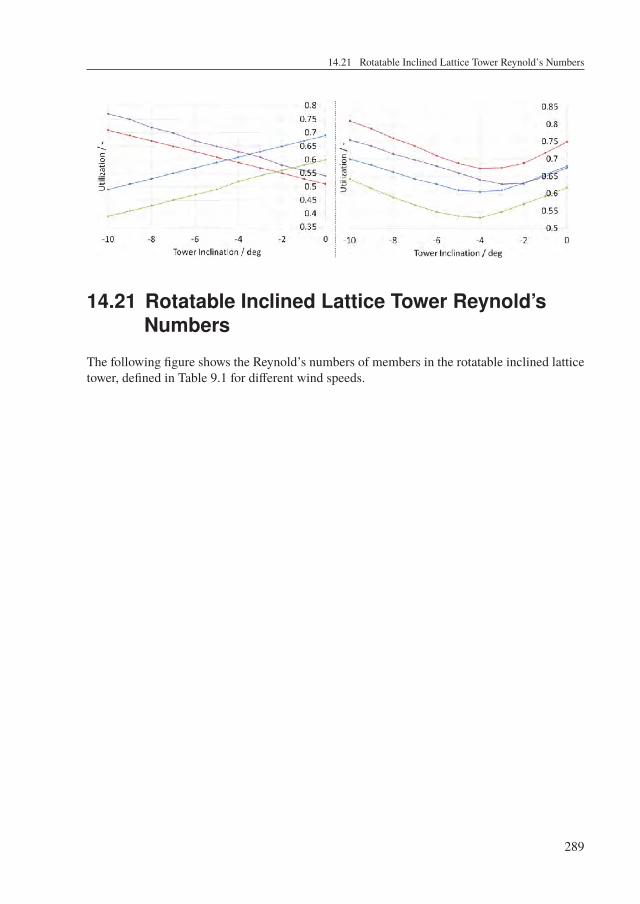
14.21 Rotatable Inclined Lattice Tower Reynold’s Numbers
14.21 Rotatable Inclined Lattice Tower Reynold’sNumbers
The following figure shows the Reynold’s numbers of members in the rotatable inclined latticetower, defined in Table 9.1 for different wind speeds.
289
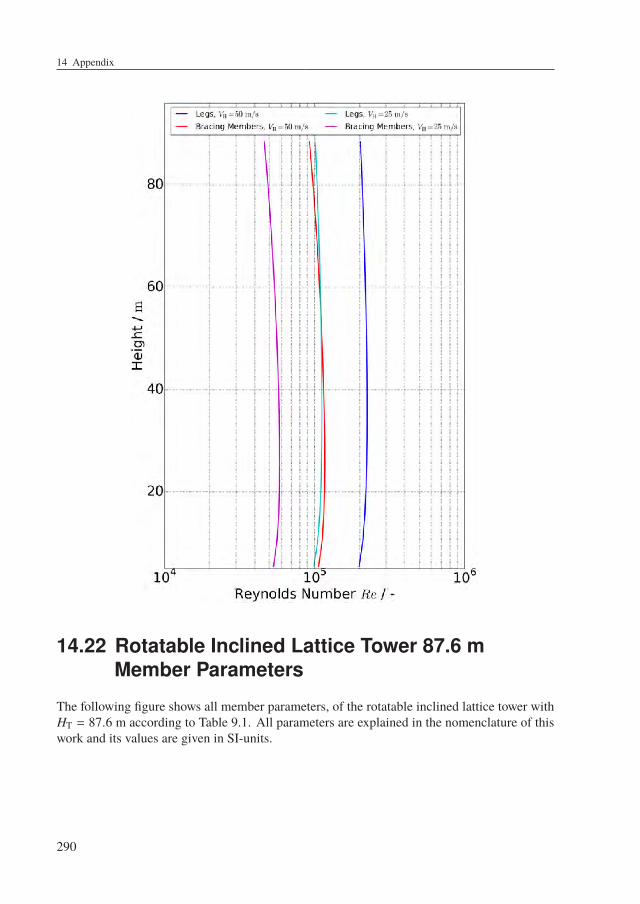
14 Appendix
14.22 Rotatable Inclined Lattice Tower 87.6 mMember Parameters
The following figure shows all member parameters, of the rotatable inclined lattice tower withHT = 87.6 m according to Table 9.1. All parameters are explained in the nomenclature of thiswork and its values are given in SI-units.
290
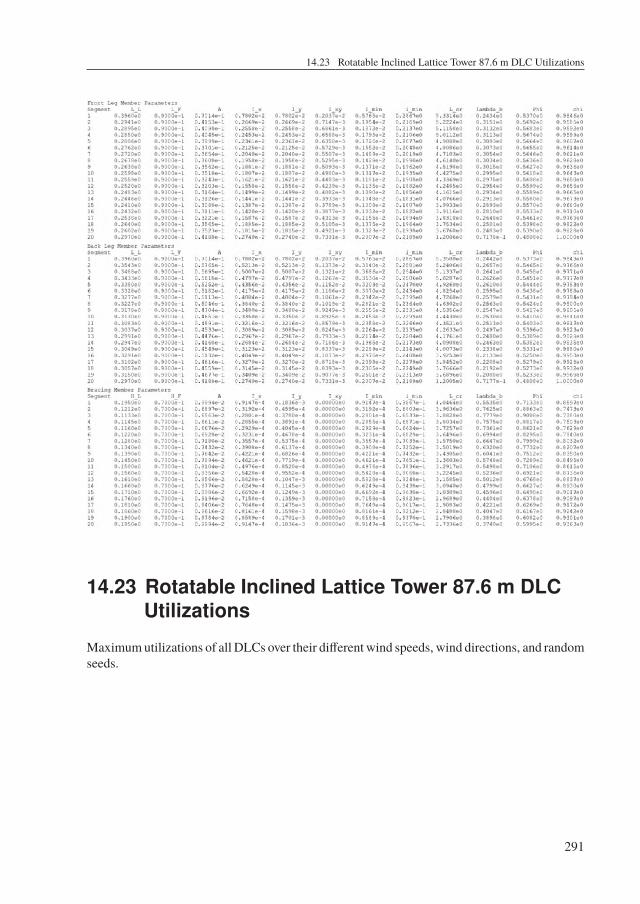
14.23 Rotatable Inclined Lattice Tower 87.6 m DLC Utilizations
14.23 Rotatable Inclined Lattice Tower 87.6 m DLCUtilizations
Maximumutilizations of all DLCs over their different wind speeds, wind directions, and randomseeds.
291
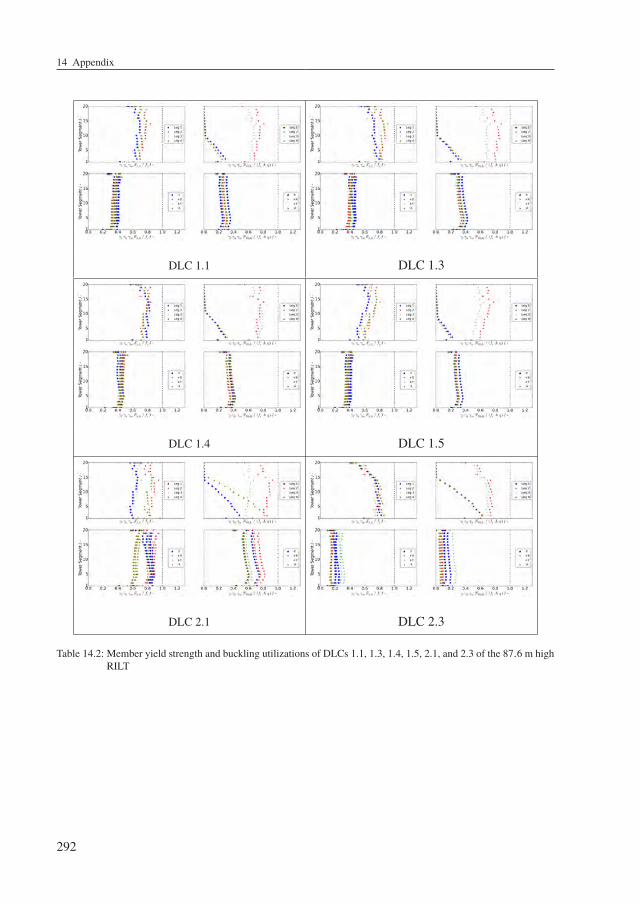
14 Appendix
DLC 1.1 DLC 1.3
DLC 1.4 DLC 1.5
DLC 2.1 DLC 2.3
Table 14.2: Member yield strength and buckling utilizations of DLCs 1.1, 1.3, 1.4, 1.5, 2.1, and 2.3 of the 87.6 m highRILT
292
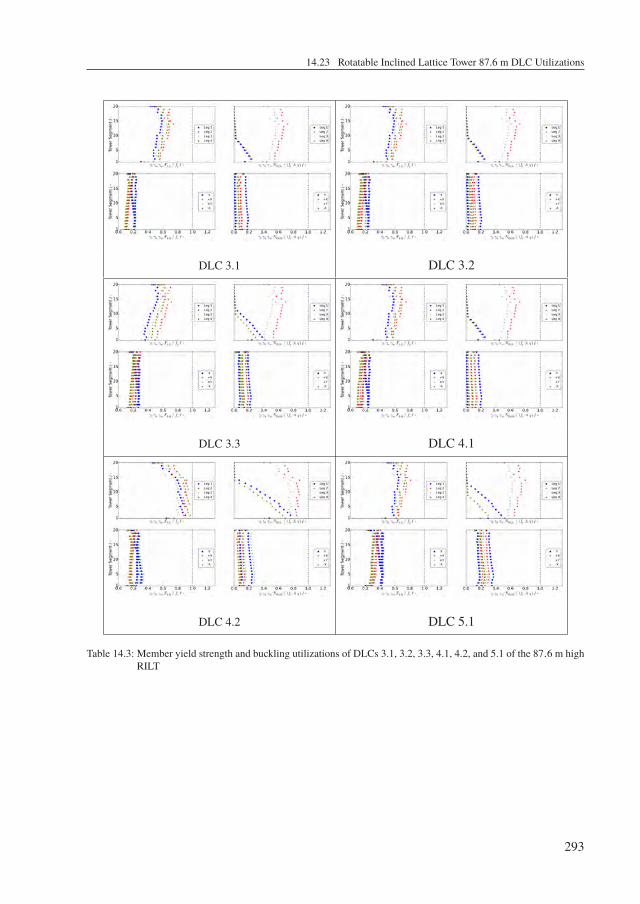
14.23 Rotatable Inclined Lattice Tower 87.6 m DLC Utilizations
DLC 3.1 DLC 3.2
DLC 3.3 DLC 4.1
DLC 4.2 DLC 5.1
Table 14.3: Member yield strength and buckling utilizations of DLCs 3.1, 3.2, 3.3, 4.1, 4.2, and 5.1 of the 87.6 m highRILT
293
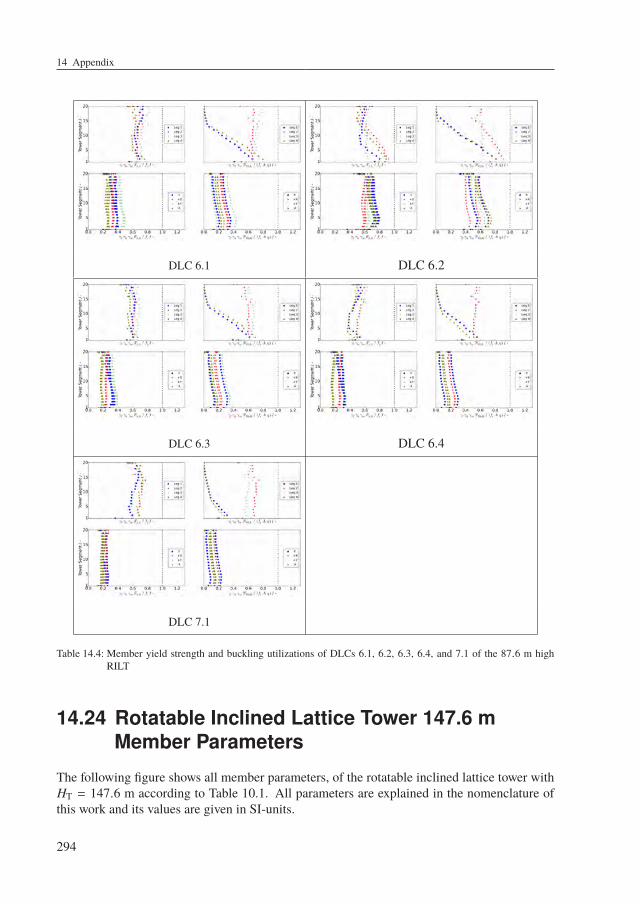
14 Appendix
DLC 6.1 DLC 6.2
DLC 6.3 DLC 6.4
DLC 7.1
Table 14.4: Member yield strength and buckling utilizations of DLCs 6.1, 6.2, 6.3, 6.4, and 7.1 of the 87.6 m highRILT
14.24 Rotatable Inclined Lattice Tower 147.6 mMember Parameters
The following figure shows all member parameters, of the rotatable inclined lattice tower withHT = 147.6 m according to Table 10.1. All parameters are explained in the nomenclature ofthis work and its values are given in SI-units.
294
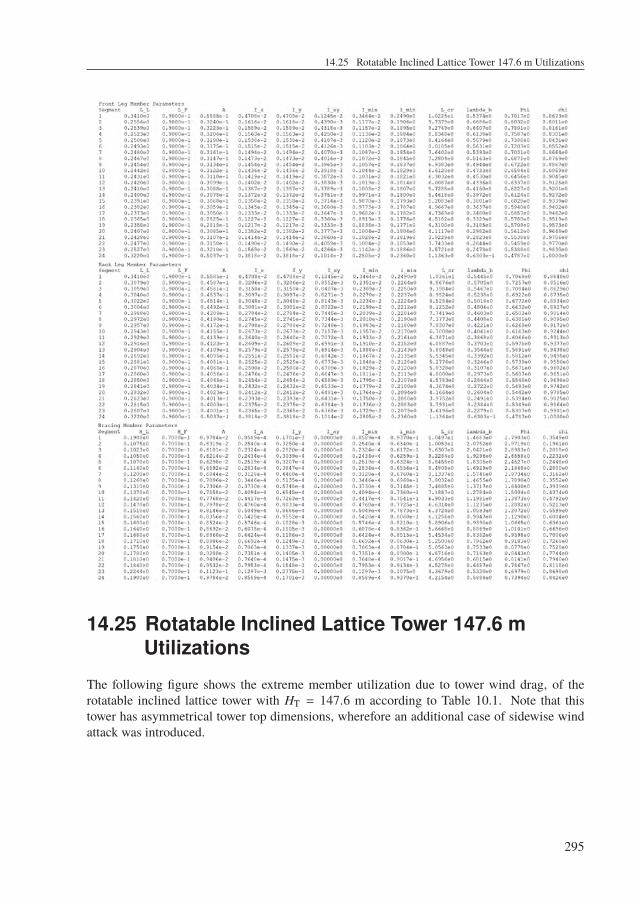
14.25 Rotatable Inclined Lattice Tower 147.6 m Utilizations
14.25 Rotatable Inclined Lattice Tower 147.6 mUtilizations
The following figure shows the extreme member utilization due to tower wind drag, of therotatable inclined lattice tower with HT = 147.6 m according to Table 10.1. Note that thistower has asymmetrical tower top dimensions, wherefore an additional case of sidewise windattack was introduced.
295
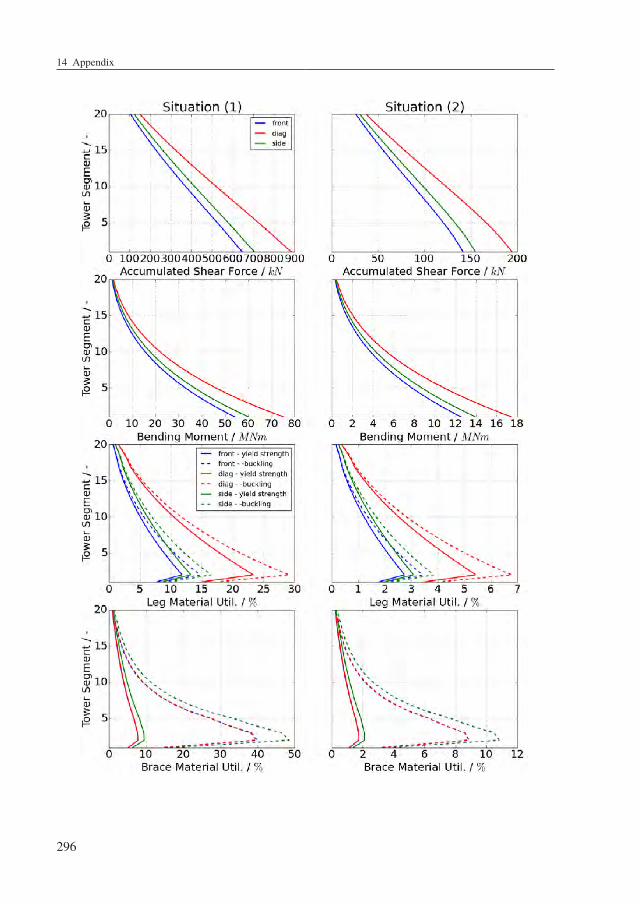
14 Appendix
296
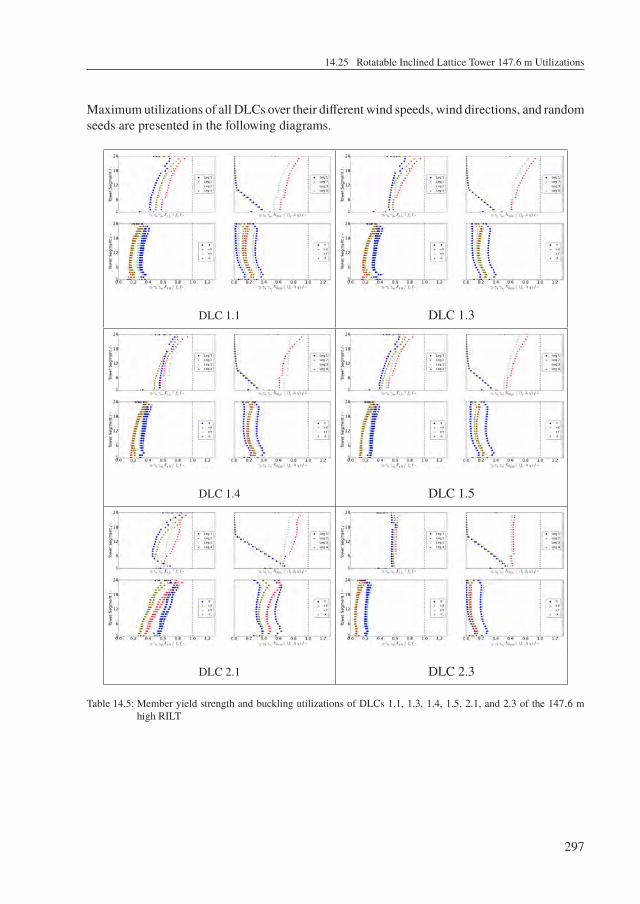
14.25 Rotatable Inclined Lattice Tower 147.6 m Utilizations
Maximumutilizations of all DLCs over their different wind speeds, wind directions, and randomseeds are presented in the following diagrams.
DLC 1.1 DLC 1.3
DLC 1.4 DLC 1.5
DLC 2.1 DLC 2.3
Table 14.5: Member yield strength and buckling utilizations of DLCs 1.1, 1.3, 1.4, 1.5, 2.1, and 2.3 of the 147.6 mhigh RILT
297
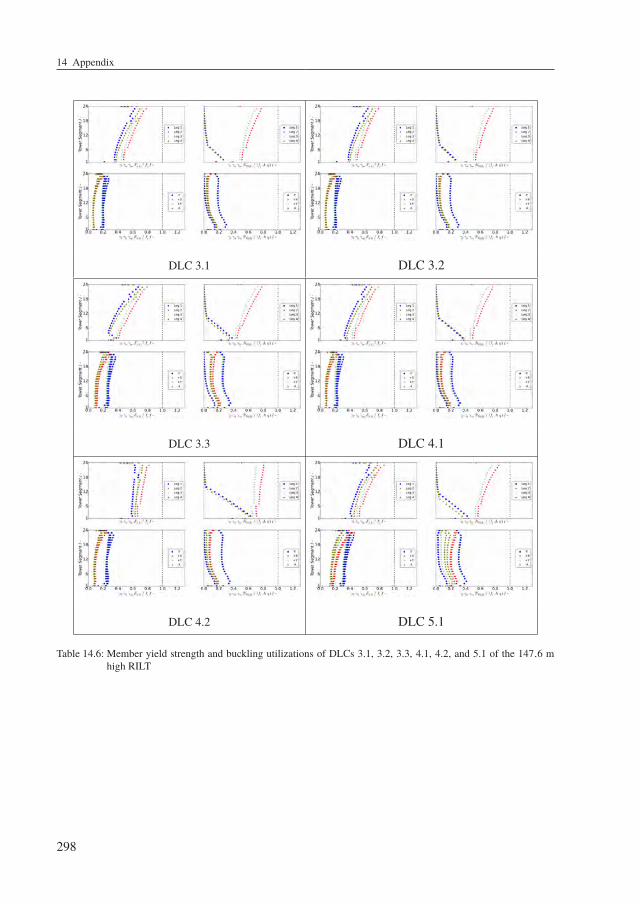
14 Appendix
DLC 3.1 DLC 3.2
DLC 3.3 DLC 4.1
DLC 4.2 DLC 5.1
Table 14.6: Member yield strength and buckling utilizations of DLCs 3.1, 3.2, 3.3, 4.1, 4.2, and 5.1 of the 147.6 mhigh RILT
298
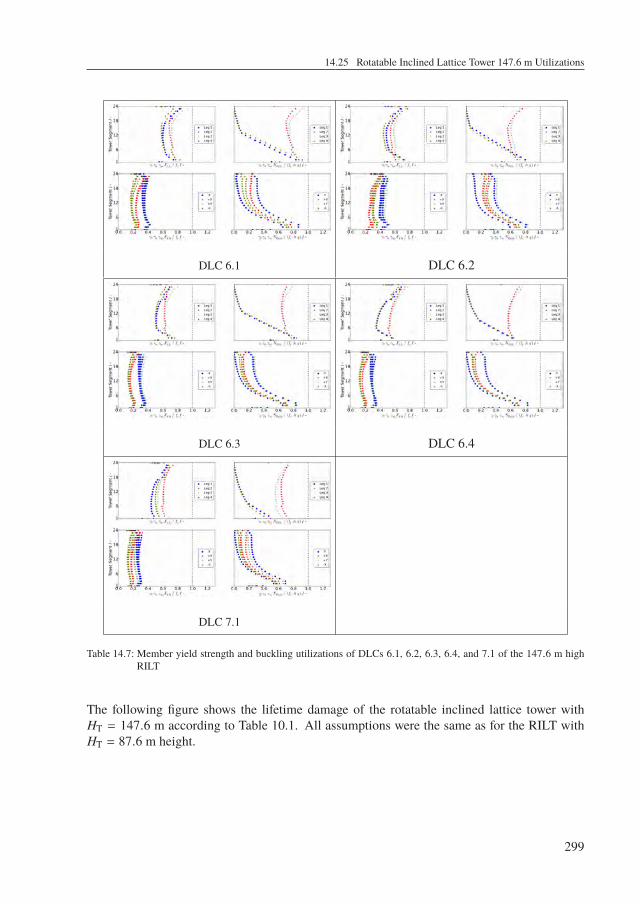
14.25 Rotatable Inclined Lattice Tower 147.6 m Utilizations
DLC 6.1 DLC 6.2
DLC 6.3 DLC 6.4
DLC 7.1
Table 14.7: Member yield strength and buckling utilizations of DLCs 6.1, 6.2, 6.3, 6.4, and 7.1 of the 147.6 m highRILT
The following figure shows the lifetime damage of the rotatable inclined lattice tower withHT = 147.6 m according to Table 10.1. All assumptions were the same as for the RILT withHT = 87.6 m height.
299
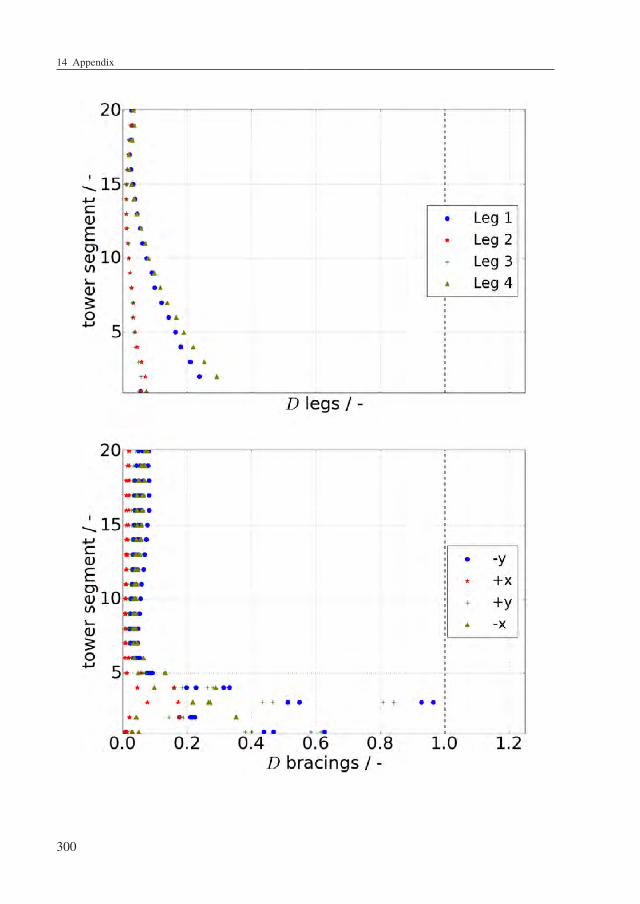
14 Appendix
300


Die Bände sind unter www.ksp.kit.edu als PDF frei verfügbar oder als Druckausgabe bestellbar.
Eine Übersicht der Berichte der Versuchsanstalt für Stahl, Holz und Steine ab dem Jahr 1963 finden Sie unter folgender URL: http://stahl.vaka.kit.edu/berichte.php
Band 1 Oliver Fleischer Axial beanspruchte K-Knoten aus dünnwandigen Rechteckhohlprofilen. 2014
ISBN 978-3-7315-0190-9
Band 2 ThOmas reinke Tragverhalten von biegebeanspruchten Stahlmasten mit polygonalen Querschnitten. 2015
ISBN 978-3-7315-0398-9
Band 3 rObin marc Plum Fatigue crack detection on structural steel members by using ultrasound
excited thermography. Erkennung von Ermüdungsrissen in Stahlbauteilen durch ultraschallangeregte Thermografie. 2015 ISBN 978-3-7315-0417-7
Band 4 Tim Zinke Nachhaltigkeit von Infrastrukturbauwerken – Ganzheitliche Bewertung von
Autobahnbrücken unter besonderer Berücksichtigung externer Effekte. 2016 ISBN 978-3-7315-0509-9
Band 5 max JOnas sPannaus Bemessung von Erzeugnissen aus Stahlguss unter vorwiegend ruhender Beanspruchung. 2016
ISBN 978-3-7315-0560-0
Band 6 maTThias Friedrich albieZ Zur statischen Tragfähigkeit geklebter Kreishohlprofilverbindungen im Stahlbau. 2016
ISBN 978-3-7315-0561-7
Band 7 andreas liPP Kreishohlprofil-X-Knoten aus nichtrostenden Stählen unter Axialbeanspruchung. 2016
ISBN 978-3-7315-0569-3
Band 8 Paul dariO TOasa caiZa Consideration of runouts by the evaluation of fatigue experiments. 2019
ISBN 978-3-7315-0900-4
Band 9 JenniFer c. hrabOwski Ermüdungsverhalten von Schweißverbindungen aus höchstfestem Stahl
im Kurzzeitfestigkeitsbereich. 2019 ISBN 978-3-7315-0931-8
Berichte zum Stahl- und leichtBauVersuchsanstalt für Stahl, Holz und Steine, Stahl- und Leichtbau Karlsruher Institut für Technologie (KIT) | ISSN 2198-7912

Die Bände sind unter www.ksp.kit.edu als PDF frei verfügbar oder als Druckausgabe bestellbar.
Band 10 sTeFan rack Formadaptive Tensegrity-Strukturen – Ein Beitrag zur numerischen Simulation. 2019
ISBN 978-3-7315-0574-7
Band 11 achim sTruve Analysis of a Rotatable Wind Turbine Tower by means of Aero-Servo-Elastic
Load Simulations. 2021 ISBN 978-3-7315-1045-1


Ged
ruck
t au
f FS
C-z
erti
fi zi
erte
m P
apie
r
9 783731 510451
ISBN 978-3-7315-1045-1
This work contributes to the improvement of renewable energy competitiveness over con-ventional fossil and nuclear energy sources. It highlights how the costs and CO2-emissions of land-based wind turbines can be reduced by means of an innovative and material ef-ficient support structure concept. The fundamental approach for the concept is to place the yaw system at the tower base, allowing the whole wind turbine tower to be rotated so that it always has the same alignment as the rotor. The potential of a rotatable inclined lattice tower concept was analysed by means of aero-servo-elastic load simulations in the FAST environment. These simulations are important for a rotatable inclined lattice tower design according to IEC 61400-1 and to DNV GL standards. A balance between dif-ferent cost aspects revealed significant savings. The analysis implies up to 49 % in cost savings and indicates the big economical potential of land-based rotatable towers.
VER
SU
CH
SAN
STA
LT F
ÜR
STA
HL,
HO
LZ U
ND
STE
INE
BER
ICH
TE Z
UM
STA
HL-
UN
D L
EIC
HTB
AU
11
Anal
ysis
of
a Ro
tata
ble
Win
d Tu
rbin
e To
wer
ACH
IM S
TRU
VE
ISSN 2198-7912 | ISBN 978-3-7315-1045-1
Related Documents


