Atmospheric Environment 39 (2005) 2759–2773 Analysis and evaluation of selected local-scale PM 10 air pollution episodes in four European cities: Helsinki, London, Milan and Oslo Jaakko Kukkonen a, , Mia Pohjola a , Ranjeet S Sokhi b , Lakhu Luhana b , Nutthida Kitwiroon b , Lia Fragkou b , Minna Rantama¨ki a , Erik Berge c , Viel Ødegaard d , Leiv Ha˚vard Slørdal e , Bruce Denby e , Sandro Finardi f a Air Quality Research, Finnish Meteorological Institute, Sahaajankatu 20 E, Helsinki, Finland b University of Hertfordshire, ASRG, Science and Technology Centre, Hatfield, UK c Kjeller Vindteknikk, P.O.Box 122, 2007 Kjeller, Norway d Norwegian Meteorological Institute, Postboks 43, Oslo, Norway e Norwegian Institute for Air Research, Postboks 100, Norway f ARIANET, via Gilino 9, 20128 Milano, Italy Received 18 February 2004; received in revised form 8 September 2004; accepted 20 September 2004 Abstract We have analysed in detail four selected episodes involving substantially high concentrations of PM 10 that occurred in Oslo on 4–10 January 2003, in Helsinki on 3–14 April 2002, in London on 18–27 February 2003 and in Milan on 14–19 December 1998. We have also utilised a more extensive dataset containing relevant information regarding 21 episodes from seven cities in six countries. The four episodes analysed in detail were recently occurring cases that were at least partly caused by various local emission sources. In particular, we have addressed the evolution of the measured concentrations in terms of the measured, meteorologically pre-processed and predicted (using numerical weather prediction models and a meso-scale meteorological model) meteorological variables. All the four episodes addressed were associated with areas of high pressure (Oslo, Helsinki and London) or a high-pressure ridge (Milan). The best meteorological prediction variables were found to be the temporal evolution of the temperature inversions and atmospheric stability and, in some of the cases, wind speed. Strong ground-based or slightly elevated temperature inversions prevailed in the course of the episodes in Oslo, Helsinki and Milan, and there was a slight ground-based inversion also in London; their occurrence coinciding with the highest PM 10 concentrations. The same result was also obtained by considering an additional set of seven PM 10 episodes from the larger dataset. The inversions in Oslo and Milan were mainly caused by the advection of warmer air above a relatively colder surface, and that in Helsinki by radiation cooling of snow-covered ground. It was also found that a low wind speed is not necessarily a good indicator of episodes; this is the case, e.g., in the Po valley, due to the frequently occurring calm and low wind speed conditions there. r 2005 Elsevier Ltd. All rights reserved. Keywords: Episode; Urban; PM 10 ; Inversion; Forecasting ARTICLE IN PRESS www.elsevier.com/locate/atmosenv 1352-2310/$ - see front matter r 2005 Elsevier Ltd. All rights reserved. doi:10.1016/j.atmosenv.2004.09.090 Corresponding author. Tel.: +358 9 1929 5450; fax: +358 9 1929 5403. E-mail address: jaakko.kukkonen@fmi.fi (J. Kukkonen).

Welcome message from author
This document is posted to help you gain knowledge. Please leave a comment to let me know what you think about it! Share it to your friends and learn new things together.
Transcript
ARTICLE IN PRESS
1352-2310/$ - se
doi:10.1016/j.at
�CorrespondE-mail addr
Atmospheric Environment 39 (2005) 2759–2773
www.elsevier.com/locate/atmosenv
Analysis and evaluation of selected local-scale PM10 airpollution episodes in four European cities: Helsinki, London,
Milan and Oslo
Jaakko Kukkonena,�, Mia Pohjolaa, Ranjeet S Sokhib, Lakhu Luhanab,Nutthida Kitwiroonb, Lia Fragkoub, Minna Rantamakia, Erik Bergec,Viel Ødegaardd, Leiv Havard Slørdale, Bruce Denbye, Sandro Finardif
aAir Quality Research, Finnish Meteorological Institute, Sahaajankatu 20 E, Helsinki, FinlandbUniversity of Hertfordshire, ASRG, Science and Technology Centre, Hatfield, UK
cKjeller Vindteknikk, P.O.Box 122, 2007 Kjeller, NorwaydNorwegian Meteorological Institute, Postboks 43, Oslo, NorwayeNorwegian Institute for Air Research, Postboks 100, Norway
fARIANET, via Gilino 9, 20128 Milano, Italy
Received 18 February 2004; received in revised form 8 September 2004; accepted 20 September 2004
Abstract
We have analysed in detail four selected episodes involving substantially high concentrations of PM10 that occurred in
Oslo on 4–10 January 2003, in Helsinki on 3–14 April 2002, in London on 18–27 February 2003 and in Milan on 14–19
December 1998. We have also utilised a more extensive dataset containing relevant information regarding 21 episodes
from seven cities in six countries. The four episodes analysed in detail were recently occurring cases that were at least
partly caused by various local emission sources. In particular, we have addressed the evolution of the measured
concentrations in terms of the measured, meteorologically pre-processed and predicted (using numerical weather
prediction models and a meso-scale meteorological model) meteorological variables. All the four episodes addressed were
associated with areas of high pressure (Oslo, Helsinki and London) or a high-pressure ridge (Milan). The best
meteorological prediction variables were found to be the temporal evolution of the temperature inversions and
atmospheric stability and, in some of the cases, wind speed. Strong ground-based or slightly elevated temperature
inversions prevailed in the course of the episodes in Oslo, Helsinki and Milan, and there was a slight ground-based
inversion also in London; their occurrence coinciding with the highest PM10 concentrations. The same result was also
obtained by considering an additional set of seven PM10 episodes from the larger dataset. The inversions in Oslo and
Milan were mainly caused by the advection of warmer air above a relatively colder surface, and that in Helsinki by
radiation cooling of snow-covered ground. It was also found that a low wind speed is not necessarily a good indicator of
episodes; this is the case, e.g., in the Po valley, due to the frequently occurring calm and low wind speed conditions there.
r 2005 Elsevier Ltd. All rights reserved.
Keywords: Episode; Urban; PM10; Inversion; Forecasting
e front matter r 2005 Elsevier Ltd. All rights reserved.
mosenv.2004.09.090
ing author. Tel.: +358 9 1929 5450; fax: +3589 1929 5403.
ess: [email protected] (J. Kukkonen).
ARTICLE IN PRESSJ. Kukkonen et al. / Atmospheric Environment 39 (2005) 2759–27732760
1. Introduction
European cities have major problems in coping with
the current, and especially the indicative stage-two air
quality limit values set in the Council Directive 1999/30/
EC for concentrations of PM10. The EU Directives
require practical measures to be taken, if air quality
limits are exceeded. The current and future situation for
PM10 concentrations was recently assessed in the
AutoOil-II programme (http://europa.eu.int/comm/en-
vironment/autooil/index.htm). The conclusion reached
was that by 2010, PM10 limit values are expected to be
exceeded in possibly half the European cities. There is,
therefore, an urgent need for action at European as well
as on national and local scales in order to reduce
particulate matter (PM) concentrations.
Under episodic conditions, concentrations of air
pollutants can considerably exceed national and inter-
national standards and limit values. Available informa-
tion concerning European peak pollution episodes in 13
countries has been reviewed within the COST 715
Action ‘‘Meteorology applied to Urban Air Pollution
Problems’’ (e.g., Fisher et al., 2001) by Kukkonen
(2001a). However, this report does not include a
systematic analysis of the meteorological conditions in
the course of such cases.
The causes of air pollution episodes include various
factors, e.g., emissions, local and synoptic-scale meteor-
ological conditions, topography and atmospheric che-
mical processes. The relative importance of such factors
is dependent on the geographical region, its surrounding
emission source areas and the related climatic character-
istics, as well as the season of the year (Piringer and
Kukkonen, 2002). For example, in many cities PM
episodes are experienced in winter and spring. Nitrogen
dioxide episodes can occur both in winter and in
summer, and ozone levels can be particularly high
during summer periods. Previously, the present authors
have analysed selected specific historic episodes in Oslo
(Berge et al., 2002), Helsinki (Pohjola et al., 2004) and
various Northern Italian cities (Finardi et al., 2002).
Berge et al. (2002) presented results from numerical
weather prediction (NWP) modelling in Northern
Europe during strong wintertime inversions. They
utilised the numerical results produced by two NWP
models (High-Resolution Limited Area Model (HIR-
LAM) and European Centre for Medium-range Weath-
er Forecasts (ECMWF)), combined with the non-
hydrostatic MM5 model. The numerical runs for Oslo
using 10, 3 and 1 km nesting revealed the necessity of
high resolution for resolving topographical features.
They also simulated an episode in Helsinki in December
1995 that involved an extremely strong ground-based
temperature inversion, and compared the predicted
results with those measured at the radio tower Kiven-
lahti.
At present, the formation and evolution of air
pollution episodes is only understood in general terms.
A more thorough analysis and understanding would be
needed, before it would be possible to forecast such
cases with sufficient reliability and accuracy. The present
paper aims to improve such an understanding. Actually,
present-day models for predicting or forecasting air
pollution episodes have serious deficiencies (e.g., Bakla-
nov et al., 2002). Major international efforts, such as
COST 715, the EU-funded FUMAPEX project (Inte-
grated Systems for Forecasting Urban Meteorology, Air
Pollution and Population Exposure, http://fumapex.d-
mi.dk/) and COST 728, have therefore been initiated in
order to reduce these deficiencies.
This study is partially based on an inventory of
episodes that has been compiled within COST 715 and
the FUMAPEX project (Valkama and Kukkonen,
2004). A total of 21 episodes from seven cities or
metropolitan areas in six countries were examined. The
cities include Castellon (Spain), Helsinki (Finland),
Turin (Italy), Bologna (Italy), Oslo (Norway), London
(UK) and Paris (France). These cities represent North-
ern, Western (Atlantic and continental) and Mediterra-
nean regions of Europe.
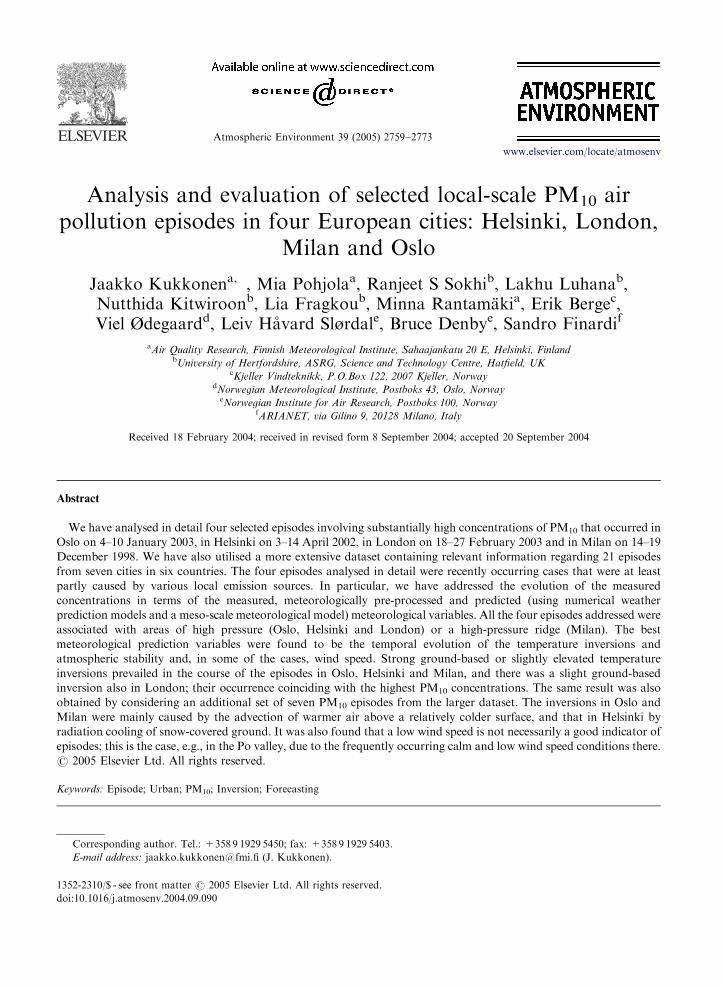
Based on the above-mentioned survey, an overview
of European air quality episodes is presented in
Tables 1a–b. The episodes can be broadly categorised
into two classes according to the scale of the main source
areas, i.e., those originating mainly from local emissions,
and those connected with regionally and long-range
transported (LRT) polluted air masses. The local-scale
episodes can be further classified as those caused
predominantly by either mobile or stationary sources.
The so-called ‘‘spring dust episodes’’ refer to those
caused by PM that is suspended from road and street
surfaces; these cases are especially characteristic of
northern parts of Europe.
The larger-scale episodes can be schematically classi-
fied as either those involving photochemical pollution
from both local, and regional and LRT sources, or those
caused by LRT air masses. Photochemical episodes are
especially prevalent in Southern European cities. These
may characteristically involve recirculation of air
masses, caused by meso-scale meteorological (MM)
effects (such as the land-sea breeze) and orographic
flows. Episodes can also be influenced by the interaction
of phenomena at different meteorological scales; e.g.,
the meso-scale forces can perturb the synoptic condi-
tions (e.g., Millan, 2002; Gangoiti et al., 2002). The
transport of dust from the Saharan desert, and from
Iraq, Kuwait, and Saudi Arabia has been addressed by
Grigoryan and Erdman (1996), and Draxler et al.
(2001), respectively.
The present paper is based on the above-mentioned
inventory of episodes, but undertakes a more detailed
evaluation of selected PM10 episodes. We have analysed
ARTIC
LEIN
PRES
S
Table 1a–b
Classification of European air quality episodes
1. Local-scale episodes
Characteristic pollutants Characteristic season of the year Characteristic meteorological
factors
Main emission source category European regions affected
1.1 Wintertime inversion-induced episodes
PM10, PM2.5 Winter half-year Inversion, stable stratification Local traffic All regions
NO2, CO Winter half-year Inversion, stable stratification,
low wind velocity
Local traffic All regions
1.2 Spring dust episodes
PM10 Spring, autumn Dry conditions, melting snow Suspended dust, mainly due to
local traffic
All regions, except for southern
Europe
1.3 Episodes caused in part or wholly by stationary emission sources
PM10, PM2.5, SO2 Winter, spring Inversion, stable stratification,
low wind velocity
Local stationary sources All regions
2. Regional and long-range transport episodes
Characteristic pollutants Characteristic season of the year Characteristic meteorological
factors
Main emission source category European regions affected
2.1 Photochemical pollution episodes
O3, PM10, PM2.5, other
photochemical species
Summer half-year High pressure, strong radiation,
recirculation
Various precursor emissions, on
a regional and urban scale
Especially in Southern Europe
2.2 Long-range and regional transport episodes
PM2.5 All seasons Stable stratification, low wind
speed
Primary and precursor
emissions, on LRT and regional
scales
All regions
PM10 Winter half-year Stable stratification, low wind
speed
Primary emissions, on LRT and
regional scales
All regions
NO2, CO, SO2 Winter half-year Stable stratification, low wind
speed
Primary or precursor emissions,
on LRT and regional scales
All regions
Local-scale episodes are presented in the upper table, while episodes that are caused mainly by regional and long-range transport appear in the lower table.
J.
Ku
kk
on
enet
al.
/A
tmo
sph
ericE
nviro
nm
ent
39
(2
00
5)
27
59
–2
77
32761
ARTICLE IN PRESSJ. Kukkonen et al. / Atmospheric Environment 39 (2005) 2759–27732762
the episodes in four European cities in relation to
prevailing meteorological conditions, local emissions,
and regionally and LRT background concentrations.
We have primarily analysed PM10 concentrations
instead of those of PM2.5, due both to the better
availability of experimental data, and the fact that the
European Union has only issued PM air quality
directives for the PM10 fraction. However, the PM2.5concentrations are included in the analysis wherever
such measurements were available.
The literature on urban air pollution episodes is
scarce, especially that regarding their systematic char-
acterisation in terms of the prevailing meteorological
conditions. Furthermore, in previous literature usually
specific episodes have been analysed separately, or, at
best, a few episodes within one specific country. In the
present study, we have aimed at a structured and
homogeneous analysis in all the four cities. A particular
aim of this study is to gain a better insight of the
influence of various meteorological variables on the
evolution of high pollutant concentrations in European
cities.
2. Material and methods
The cities considered in this study are located in
geographic and climatic regions of Northern (Oslo and
Helsinki), Northwestern (London) and Southern (Mi-
lan) Europe. These areas represent maritime climate
(London and Oslo), a partly maritime-influenced and
partly continental climate (Helsinki), and a mainly
continental climate (Milan). Two of the cities are located
in or surrounded by mountainous terrain (Oslo and
Milan, respectively) and two cities are situated in fairly
flat areas (Helsinki and London). London and Milan are
amongst some of the largest cities in Europe (their
populations are 7.5 and 3.5 million, respectively), while
the metropolitan areas of Oslo and Helsinki are
relatively smaller conurbations (the populations of both
of these are approximately 1.0 million).
For the analysis we have selected recently occurring
(1998–2003) episodes that were predominantly caused
by various local emission sources. Study by Valkama
and Kukkonen (2004) has indicated that episodes having
similar levels of concentrations and belonging to the
same episode category (described above) tend to occur
regularly every year, or at least every other year. Hence,
the episodes considered in this paper may be considered
as being characteristic of each region.
Corresponding spring dust episodes have occurred in
Helsinki every year during the last few years, sometimes
several times in the same spring. Spring dust episodes
are the most common category of PM10 episodes in
Helsinki. In Oslo, both ‘‘wood-burning’’ and ‘‘road-
dust’’ episodes of varying strengths are to be expected
every winter or spring. The wood-burning episodes
characteristically occur in cold, calm and stable winter
conditions, in which the ground is covered with ice and
snow, and the traffic- induced suspension of road dust is
therefore of minor importance. In Milan, from one to
two corresponding PM10 episodes have occurred every
winter during recent years; these events are characterised
by simultaneous infringements of PM10 and NO2 limit
values, and by similar meteorological conditions (Fi-
nardi and Pellegrini, 2004).
Some published studies on UK episodes (Ryall et. al.,
2002; Malcolm et. al., 2000) have shown that they can
arise because of local emissions (such as traffic or
industrial emissions) under stagnant conditions as well
as because of contributions from long-range transport of
polluted air masses including Saharan dust storms.
However, these studies have considered the UK as whole
and have not focused on urban areas. An analysis of the
occurrence of elevated 24 hour mean concentrations of
PM10 in London (that is, concentrations greater than
50mgm�3 lasting for two or more days) for 2000–2003
has shown that five out of eight episodes occurred
during late winter or spring periods.
2.1. Topography of the cities and the main emission
sources
The city of Oslo is located at the northern end of the
Oslo fjord, surrounded by a large topographical pot
formation. The topographical features of the area tend
to worsen the dispersion conditions, capturing pollu-
tants emitted within the urban airshed. The most
important local sources of PM in Oslo are domestic
wood-burning in stoves that are used for wintertime
house heating, and vehicular traffic (Laupsa and
Slørdal, 2002). The influence of wood-burning PM
emissions is most dominant in the densely populated
central city area, where a large fraction of the flats are
equipped with strongly polluting old stoves.
The city of Helsinki and its surrounding regions are
situated in a fairly flat coastal area. The PM10concentrations in street level air are dominated by the
combustion, non-combustion and suspension emissions
originating from vehicular traffic (e.g., Kukkonen et al.,
2001b). The influence of small-scale local sources, such
as that of domestic wood burning, is negligible.
London is situated in relatively flat terrain with
shallow hills to the west and south. London is one of
the most congested cities in Europe; most of the CO and
more than half of NOx emissions result from road
transport (GLA, 2002). In central London, approxi-
mately 80% of road-transport-related PM10 originates
from diesel vehicles, such as taxis, buses and goods
vehicles (GLA, 2002).
The city of Milan and its surrounding urban area are
located in the central part of the Po river basin, in a flat
ARTICLE IN PRESSJ. Kukkonen et al. / Atmospheric Environment 39 (2005) 2759–2773 2763
area. The atmospheric circulation of the Po valley is
characterised by the strong modification of synoptic
flow due to the high mountains (Alps and Apennines)
that surround the valley on three sides. Calm conditions
(defined as conditions in which the hourly-averaged
wind speed at a height of 10m is lower than 1.0m s�1)
and light winds occur frequently. The most severe winter
episodes are commonly associated with elevated tem-
perature inversions. According to the regional emission
inventory, road traffic is mostly responsible for the PM10emissions in the Milan Province.
2.2. The selected air quality and meteorological
measuring stations
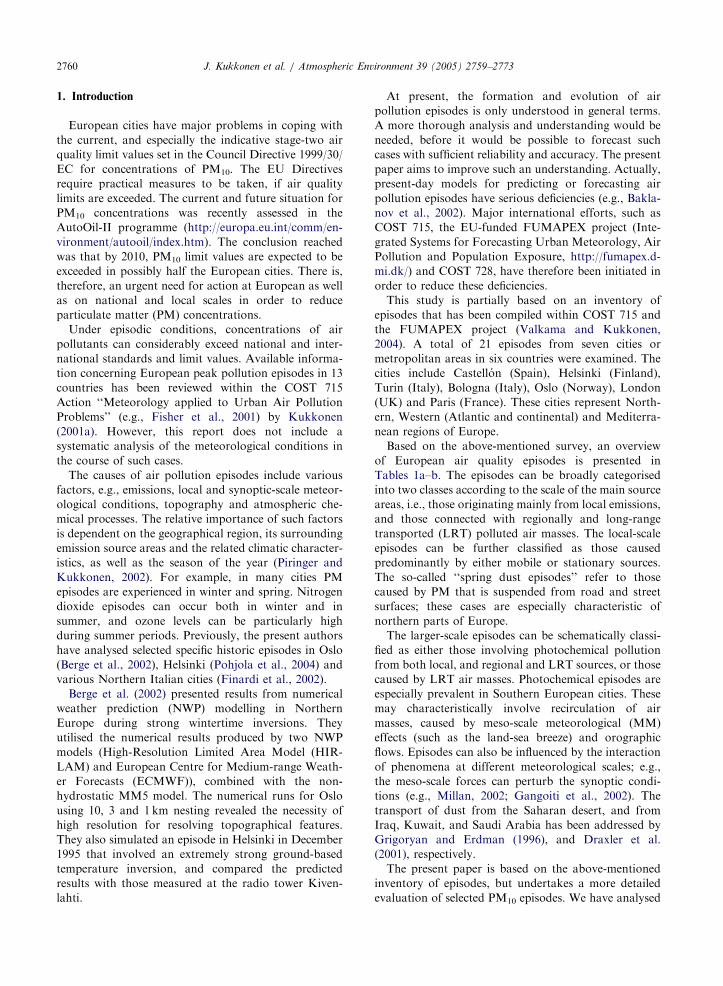
The locations of the air quality and meteorological
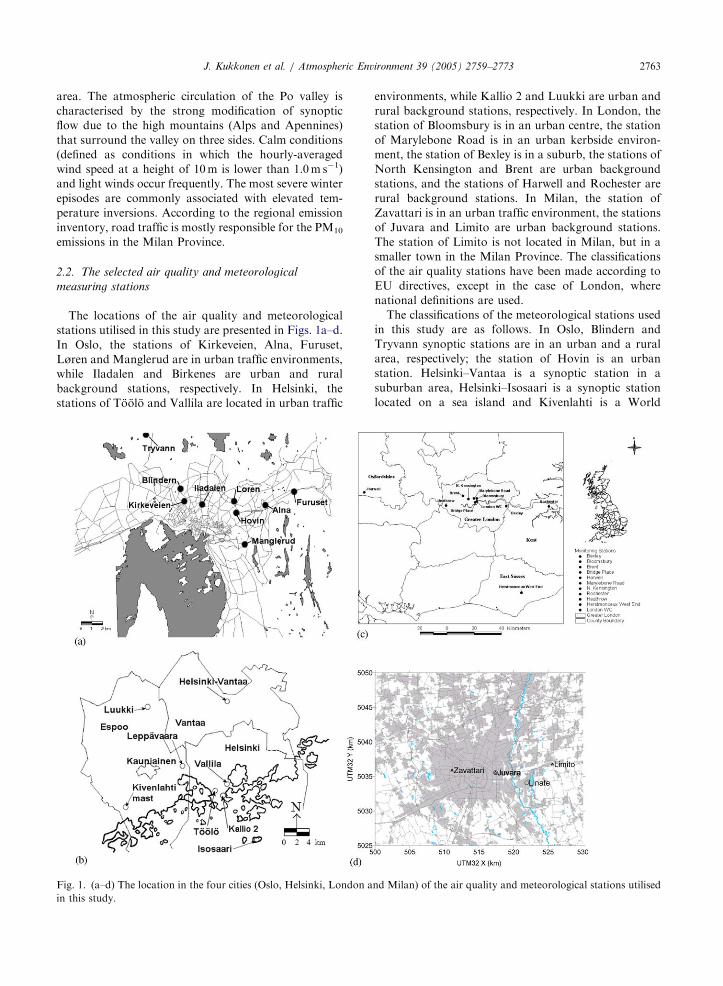
stations utilised in this study are presented in Figs. 1a–d.
In Oslo, the stations of Kirkeveien, Alna, Furuset,
Løren and Manglerud are in urban traffic environments,
while Iladalen and Birkenes are urban and rural
background stations, respectively. In Helsinki, the
stations of Toolo and Vallila are located in urban traffic
Fig. 1. (a–d) The location in the four cities (Oslo, Helsinki, London a
in this study.
environments, while Kallio 2 and Luukki are urban and
rural background stations, respectively. In London, the
station of Bloomsbury is in an urban centre, the station
of Marylebone Road is in an urban kerbside environ-
ment, the station of Bexley is in a suburb, the stations of
North Kensington and Brent are urban background
stations, and the stations of Harwell and Rochester are
rural background stations. In Milan, the station of
Zavattari is in an urban traffic environment, the stations
of Juvara and Limito are urban background stations.
The station of Limito is not located in Milan, but in a
smaller town in the Milan Province. The classifications
of the air quality stations have been made according to
EU directives, except in the case of London, where
national definitions are used.
The classifications of the meteorological stations used
in this study are as follows. In Oslo, Blindern and
Tryvann synoptic stations are in an urban and a rural
area, respectively; the station of Hovin is an urban
station. Helsinki–Vantaa is a synoptic station in a
suburban area, Helsinki–Isosaari is a synoptic station
located on a sea island and Kivenlahti is a World
nd Milan) of the air quality and meteorological stations utilised
ARTICLE IN PRESSJ. Kukkonen et al. / Atmospheric Environment 39 (2005) 2759–27732764
Meteorological Organisation (WMO) station that is on
a 327-m-high radio tower situated in a partly rural,
partly suburban environment. London Weather Center
is located in central London, Heathrow airport is a
synoptic station in a suburban area, and Herstmonceux
is a WMO station in a rural area. Milano Linate Airport
is a WMO station in a suburban area, and Juvara is an
urban background station.
2.3. Experimental methods for measuring PM10 and
PM2.5 concentrations
In Oslo, a Tapered Element Oscillating Micro-balance
(TEOM) was used at all of the stations where both PM10and PM2.5 are measured. At two stations, Alna and
Iladalen, the Eberline FH 62 IR (based on b-attenua-tion) was employed. The measurement height at all
stations was 3.5m. These instruments are maintained on
a three-monthly basis, and the flow rates are calibrated
on a six-monthly basis against the BIOS DC-2 primary
flow meter. The Partisol 2025 sequential air-sampling
instrument was utilised at the rural background station
of Birkenes. A national quality control system is now
implemented in Oslo based on criteria developed in
EUROAIRNET (Larssen et al., 1999) and EU direc-
tives.
In Helsinki, at the station of Toolo, the concentration
of PM10 was measured with a TEOM, and at the
stations of Vallila, Kallio 2 and Luukki, with Eberline
FH 62 I-R. The concentration of PM2.5 was measured at
the stations of Vallila and Kallio 2, with Eberline FH 62
I-R instruments. Sillanpaa et al. (2002) compared the
results of these continuously-operating monitors (Eber-
line and TEOM) with the reference gravimetric sampler
(Standard EN 12341, LVS-PM10). The sampling was
carried out in autumn for 7 weeks, and in winter and
spring for 8 weeks. The correction factors k (defined as:
reference sampler ¼ k�test instrument) for the concen-trations measured by the Eberline and TEOM varied in
autumn from 0.95 to 1.07, and in winter and spring from
0.84 to 0.86. These factors are near unity, probably
caused by the smaller semi-volatile proportion of aerosol
mass in Helsinki, compared with that in most other
European areas (Sillanpaa et al., 2002).
In London, the PM10 measurements are conducted
with TEOM instruments. The network in London
incorporates comprehensive QA/QC procedures (Ste-
venson, 2003). As part of the process, a six-monthly
audit is conducted; this involves flow checks, sample
inlet checks, as well as checks of site infrastructure and
location classification. The filters are changed when they
approach a mass loading of 80% or more.
In Milan, at the monitoring stations utilised here,
PM10 is measured with TEOM instruments. The QA/QC
of the air quality monitoring network of the Lombardia
Region is performed by the European Reference
Laboratory for Air Pollution. These procedures have
been evaluated in comparison with the EUROAIRNET
scheme for a complete QA/QC by the National
Environmental Protection Agency (Desiato et al., 2000).
2.4. Modelling methods
At present, there are no generally applicable theore-
tical schemes for the interpretation of the data measured
in episodic conditions, both due to the related extremely
stable atmospheric conditions and to the characteristics
of the urban meteorology. However, some improve-
ments have recently been achieved in the urbanisation of
NWP, MM and meteorological pre-processing (MPP)
models (e.g., Baklanov et al., 2002).
The synoptic-scale meteorological analyses are based
on the results computed by the national versions of the
NWP model HIRLAM in the case of Norway and
Finland, and on the ECMWF model in the case of UK
and Italy. The HIRLAM and ECMWF models are used
only for the synoptic analysis. The meso- and micro-
scale meteorological conditions are analysed using
locally measured data and sounding data for all the
cities. In addition, we have utilised the predictions of the
two MPP models (for Helsinki and Milan), and the
MM5 model (for London).
The MM5 model has been used to predict the
conditions in London, as additional meso- and micro-
scale data was especially needed in order to interpret
that episodic case. We have used five nesting levels in the
MM5 computations with the horizontal resolutions of
81, 27, 9, 3 and 1 km; the finest grid covers the entire
London area. We utilised the land cover information
from the US Geology Survey, and the reanalysis data of
the National Centers for Environment Prediction and
Atmospheric Research (NCEP and NCAR) as meteor-
ological input data. The physical schemes were as
follows: Simple Ice Explicit Moisture Scheme and
Multi-Layer Soil Surface Scheme (Dudhia, 1996),
MRF boundary layer scheme (Hong and Pan, 1996),
and Grell Convective Parameterisation (Grell et al.,
1994).
In Helsinki, the Monin–Obukhov length was eval-
uated using a MPP model, MPP-FMI, that has been
adapted for an urban environment (Karppinen et al.,
2000a); this model was originally based on the energy
budget method of van Ulden and Holtslag (1985). The
model utilises meteorological synoptic and sounding
observations, and its output consists of estimates of the
hourly time series of the relevant atmospheric turbulence
parameters and the boundary layer height. The compu-
tation is based on a combination of the data from the
stations at Helsinki–Vantaa and Helsinki–Isosaari. The
performance of the integrated modelling system contain-
ing the MPP-FMI model has been evaluated, e.g., by
Kousa et al. (2001).
ARTICLE IN PRESSJ. Kukkonen et al. / Atmospheric Environment 39 (2005) 2759–2773 2765
In Milan, the Monin–Obukhov length was evaluated
using a meteorological pre-processor, SURFPRO (Fi-
nardi et al., 1997 and Arianet, 2002); the model is based
on the energy budget method of van Ulden and Holtslag
(1985), and Paine (1988). The model utilises surface-
based data and vertical profiles of temperature, and
evaluates atmospheric turbulence scaling parameters
and the boundary layer height. The computation is
based on the data from the stations of Juvara and
Linate. The performance of an integrated modelling
system containing SURFPRO and a Lagrangian particle
dispersion model has been evaluated for urban air
quality applications by Calori et al. (2004).
3. Results
3.1. Concentration time series
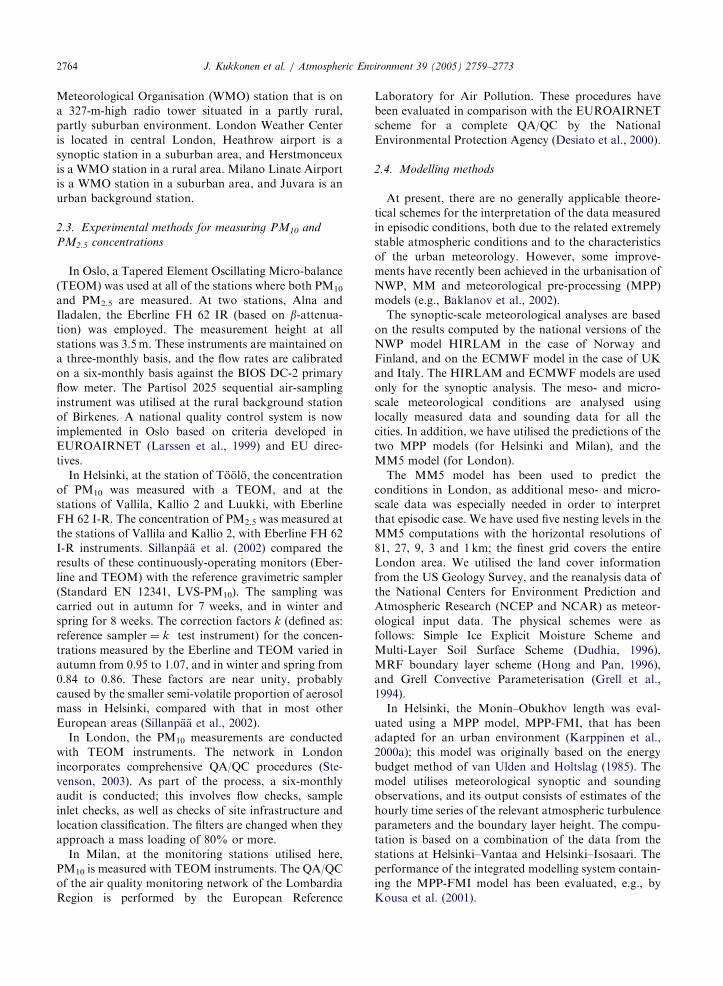
The evolution of measured hourly pollutant concen-
trations that were considered relevant for an analysis of
the PM10 episodes is presented in Figs. 2a–d. In all
figures, the ticks on the horizontal axis indicate the
beginning of the day marked. The measured PM10concentration may also contain a substantial secondary
component, as well as a non-exhaust component, such
as suspended dust. The secondary photo-chemically-
formed aerosol can be especially important in southern
European cities, while suspended dust can play an
Oslo, 2003
0
50
100
150
200
250
300
3 4 5 6 7 8 9 10 11
Day of January
PM
10, µ
g/m
3
KirkeveienAlnaFurusetLøren ManglerudIladalen
Helsinki, 2002
0
50
100
150
200
250
1 2 3 4 5 6 7 8 9 10 11 12 13 14
Day of April
PM
10 µg
/m3
TöölöPM10Kallio 2PM10Kallio 2PM2,5
(a)
(b)
(c
(d
Fig. 2. (a–d) The concentrations of PM10 in the course of the sel
important role especially in northern and central
Europe. A comparison of the concentrations measured
at various site categories makes it possible to evaluate
the importance of local emissions.
3.1.1. Periods of elevated PM10 concentrations
The periods of elevated concentrations are sum-
marised in Table 2. For the episodes in Oslo and
Helsinki, there were two separate periods of elevated
PM10 concentrations at the urban measurement stations.
In London, the elevated concentrations prevailed for
approximately 10 days, a more extended period than the
other episodes considered in this study. The character-
istically lower emissions during weekends (12–13 and
18–19 December, 1998; 6–7 and 13–14 April, 2002; 4–5
January, 2003; and 22–23 February, 2003) did not
substantially affect the concentrations in any of the cases
considered.
3.1.2. Evaluation of PM10 and PM2.5 concentrations at
various sites
The measured regional background PM10 levels
measured at a station southwest of Oslo (Birkenes) were
below 4mgm�3 during the whole time period considered
here. These levels are negligible compared with the
corresponding measured urban concentrations; the
episode, therefore, was not significantly influenced by
regional or LRT.
London, 2003
0
20
40
60
80
100
120
140
160
15 16 17 18 19 20 21 22 23 24 25 26 27 28
Day of February
PM
10, µ
g/m
3
BloomsburyMaryleboneRoadHarwell
Milan, 1998
0
100
200
300
400
10 11 12 13 14 15 16 17 18 19 20 21
Day of December
PM
10 µg
/m3
JuvaraZavattariLimito
)
)
ected episodes in the four cities. All hours are in local time.
ARTICLE IN PRESS
Table 2
A summary of the selected episodes and the main findings
City and episode
duration
Characteristic
synoptic
meteorological
conditions
Characteristic local
scale meteorological
factors
Type of temperature
inversion
Main pollutant
source category for
PM10
Brief classification
of the episode
Oslo, 4–5 and 7–10
January 2003
An area of high
pressure
Temperature
inversion, low wind
speed, stable
stratification
Ground-based,
advection, (max
15 1C)
Local wood
combustion and
local vehicular
emissions
Wintertime
inversion-induced
episode
Helsinki, 3 and 8–13
April 2002
An area of high
pressure
Temperature
inversion, low wind
speed, stable
stratification
Ground-based,
radiation, (max
8 1C/50m)
Suspended dust and
local vehicular
emissions
Spring dust episode
London, 18 to 27
February 2003
Varying high and
low pressure areas
Slight temperature
inversion, varying
wind speed
Ground-based (less
than 1 1C/50m)
Urban vehicular
emissions and
suspended dust, and
long-range
transport
Partly local, partly
long-range
transport episode
Milan, 14–19
December 1998
High pressure ridge Temperature
inversion, stable
stratification
Elevated, advection
(max 15 1C/1500m)
Vehicular emissions
and long-range
transport
Wintertime
inversion-induced
episode
J. Kukkonen et al. / Atmospheric Environment 39 (2005) 2759–27732766
At the urban stations of Oslo, the PM2.5 concentra-
tions (not shown here) were elevated during the same
periods as the PM10 concentrations. A detailed analysis
of the observed daily average values at the urban traffic
station of Kirkeveien shows that very high ratios of
PM2.5–PM10 prevailed during the period considered
(from 3 to 11 January 2003), varying between 0.83 and
0.94. The suspended road dust episodes are, however,
characterised by low PM2.5/PM10 ratios, commonly
ranging from 0.2 to 0.3 (Laupsa and Slørdal, 2002).
Both the high PM2.5/PM10 ratios and the occurrence of
the highest measured concentrations at the urban
background station (Iladalen) indicate that local traffic
emissions were not the most important pollution source.
The other substantial local source of PM10 in Oslo,
domestic wood-burning, is therefore probably the most
dominant source during the episode considered.
In Helsinki, the regional background PM10 levels (at
Luukki) were substantially lower (below 70 mgm�3) than
the corresponding highest measured urban traffic-site
concentrations (at Toolo and Vallila) during the whole
time period. The local sources were therefore mainly
responsible for the highest concentrations. The PM2.5concentrations at both the urban traffic-site (Vallila) and
the urban background site (Kallio 2) are clearly lower
than the corresponding concentrations of PM10; this is
an indication of the mainly local origin of the PM
pollution.
In London, we mainly consider the Bloomsbury
(urban centre), Marylebone Road (urban kerbside) and
Harwell (rural) sites, as the concentrations of both PM10and PM2.5 are monitored at these stations. The PM10
concentrations at these two urban sites are higher, on
the average by a factor of two, than those at the rural
site. A similar temporal variation of the PM10 concen-
trations was also observed for the same period at other
London sites including Brent, Bexley and North
Kensington. The PM2.5 concentrations (not shown here)
at the urban sites (Bloomsbury and Marylebone Road)
were comparable with those at the rural sites (Harwell
and Rochester). These results indicate that the local
contribution to the PM10 concentrations is approxi-
mately one half, while the PM2.5 concentrations are
probably mainly of LRT origin.
A charging scheme for reducing traffic congestion
came into effect in part of Central London on 17
February 2003. The stations of Bloomsbury and
Marylebone Road are inside and on the periphery of
the charging zone, respectively. However, as the
corresponding concentrations of PM10 at the other
urban stations in London showed similar temporal
evolutions, the influence of the charging scheme on
pollution does not seem to be significant compared to
the meteorological and other factors during the period
considered.
In Milan, the PM10 concentrations measured at the
urban background site (Juvara) are of the same order of
magnitude or are higher, compared with those at the
urban traffic station (Zavattari). The values measured at
both of these stations in Milan are only slightly higher
than those measured at the urban site of Limito that is
located in a smaller town in the Milan Province. The
measurements of PM10 are not conducted at rural
stations within the region. These results indicate that the
ARTICLE IN PRESSJ. Kukkonen et al. / Atmospheric Environment 39 (2005) 2759–2773 2767
elevated concentrations prevailed over a region, and did
not solely originate from urban sources in Milan.
3.2. Synoptic-scale meteorological conditions
The synoptic-scale meteorological analyses are based
on the results of the Norwegian and Finnish variants of
the HIRLAM model and the NWP model at ECMWF.
On 3 January 2003, an area of high pressure prevailed
over the Atlantic sea region; this high moved eastwards,
arriving in the sea area between the UK and Southern
Norway on 7 January. The measured ground tempera-
tures at the beginning of January in Oslo were low,
approximately �20 1C. On 6 January, relatively warmer
air masses were transported in at higher altitudes from
the northwest; this led to the formation of a strong
ground-based advection inversion that lasted from 7th
to 10th of January. The ground surface was covered
with snow or ice during the course of the episode.
During the episode in Helsinki, an area of high
pressure extended from northwestern Russia to Finland.
There was a fan of snow at the beginning of the episode
period (from 3rd to 4th of April 2002), and the sky was
overcast during the remaining period (until 13 April).
The ground surface was partly covered with snow. The
Oslo, 2003
-202468
101214161820
1 2 3 4 5 6 7 8 9 10 11
Day of January
Ob
serv
ed d
iffe
ren
ce in
Po
ten
tial
Tem
per
atu
re (
K)
0
1
2
3
4
5
6
7
8
9
Win
d s
pee
d. m
/s
Helsinki, 2002
0123456789
1 2 3 4 5 6 7 8 9 10 1112 13 14
Day of April
Win
d s
pee
d (
m/s
)
-0.2
-0.10
0.10.2
0.3
0.40.5
0.6
Inve
rse
Mo
nin
-O
bu
kho
v le
ng
th (
1/m
)
Tem
per
atu
re (
C).
win
d
(a) (c
(b) (d)
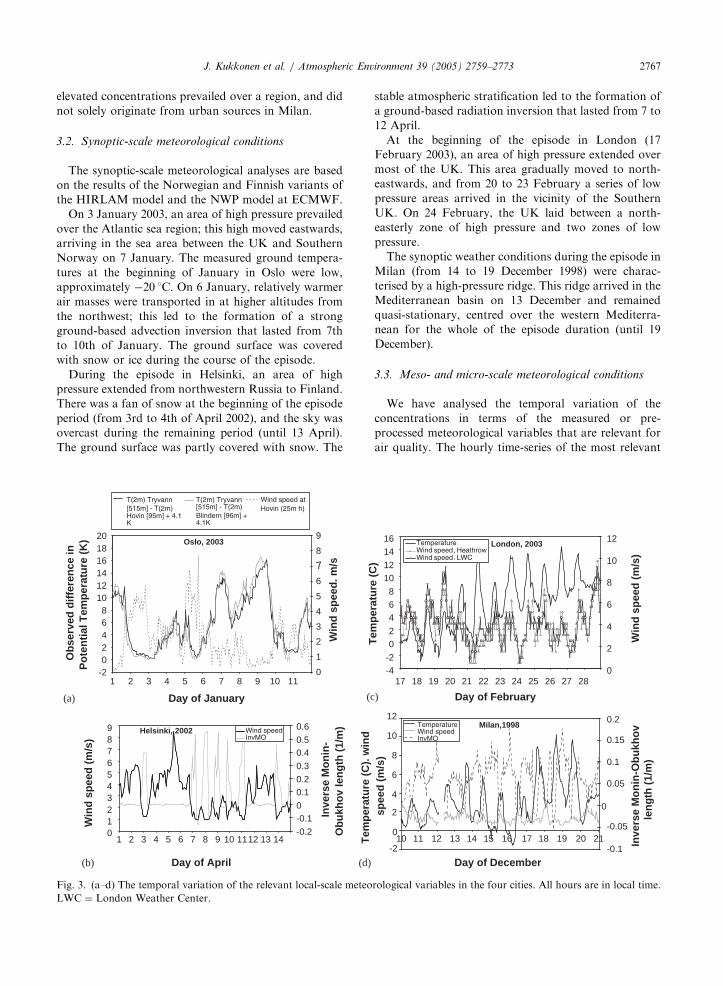
Fig. 3. (a–d) The temporal variation of the relevant local-scale meteo
LWC ¼ London Weather Center.
stable atmospheric stratification led to the formation of
a ground-based radiation inversion that lasted from 7 to
12 April.
At the beginning of the episode in London (17
February 2003), an area of high pressure extended over
most of the UK. This area gradually moved to north-
eastwards, and from 20 to 23 February a series of low
pressure areas arrived in the vicinity of the Southern
UK. On 24 February, the UK laid between a north-
easterly zone of high pressure and two zones of low
pressure.
The synoptic weather conditions during the episode in
Milan (from 14 to 19 December 1998) were charac-
terised by a high-pressure ridge. This ridge arrived in the
Mediterranean basin on 13 December and remained
quasi-stationary, centred over the western Mediterra-
nean for the whole of the episode duration (until 19
December).
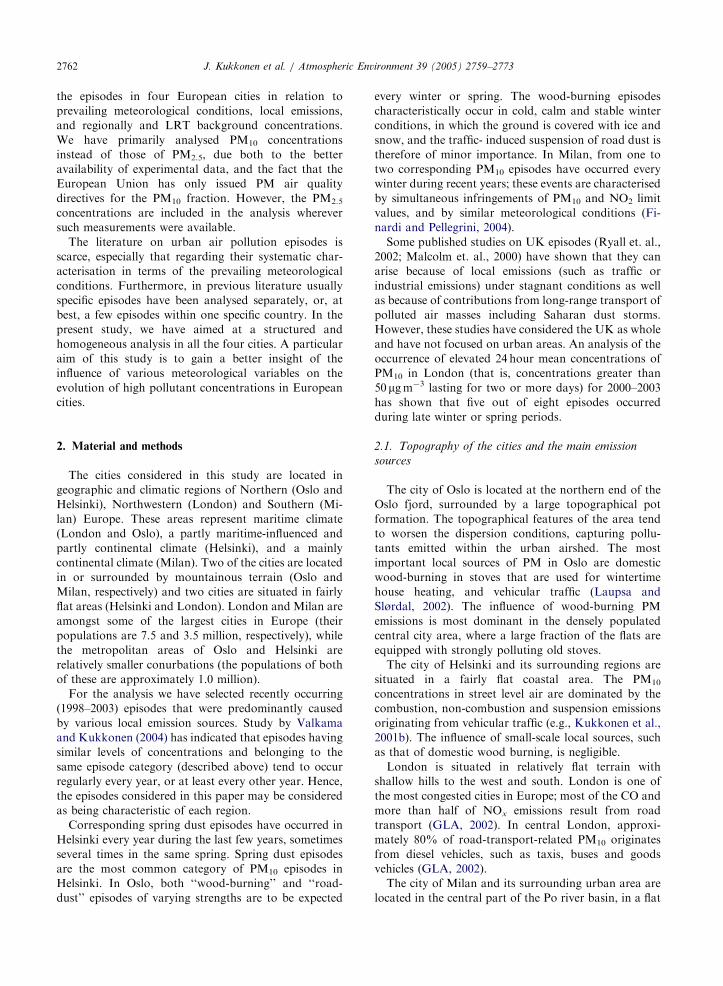
3.3. Meso- and micro-scale meteorological conditions
We have analysed the temporal variation of the
concentrations in terms of the measured or pre-
processed meteorological variables that are relevant for
air quality. The hourly time-series of the most relevant
London, 2003
-4-2
02
468
1012
1416
17 18 19 20 21 22 23 24 25 26 27 28
Day of February
Tem
per
atu
re (
C)
0
2
4
6
8
10
12
Win
d s
pee
d (
m/s
)
Milan,1998
-2
0
2
4
6
8
10
12
10 11 12 13 14 15 16 17 18 19 20 21
Day of December
spee
d (
m/s
)
-0.1
-0.05
0
0.05
0.1
0.15
0.2
Inve
rse
Mo
nin
-Ob
ukh
ov
le
ng
th (
1/m
)
)
,,
rological variables in the four cities. All hours are in local time.
ARTICLE IN PRESSJ. Kukkonen et al. / Atmospheric Environment 39 (2005) 2759–27732768
meteorological variables are presented in Figs. 3a–d; the
vertical temperature profiles are presented separately in
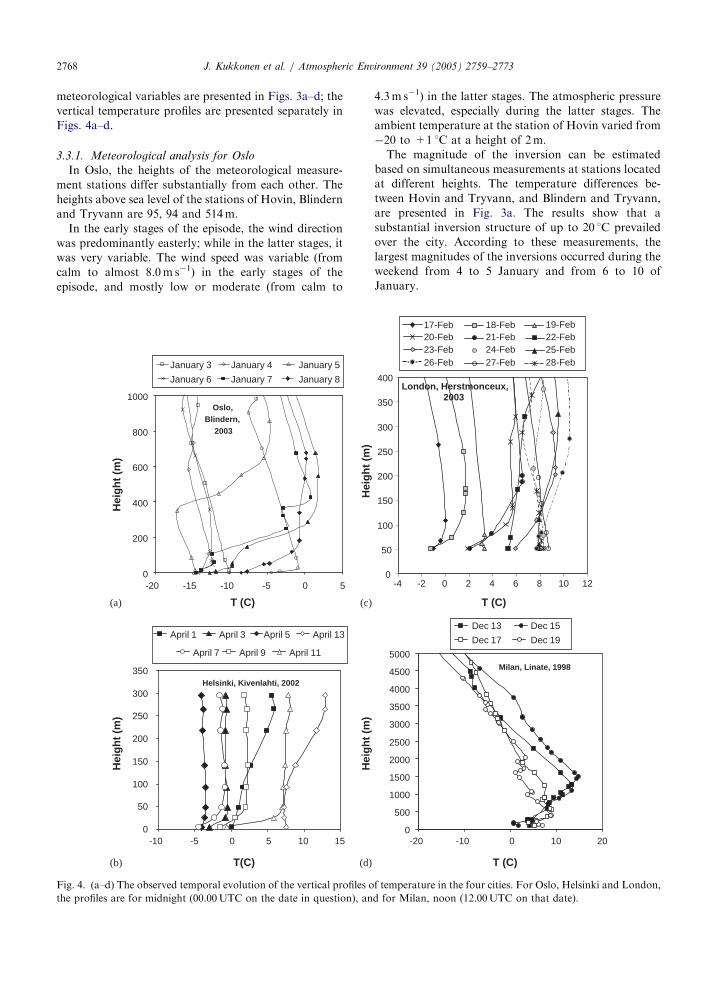
Figs. 4a–d.
3.3.1. Meteorological analysis for Oslo
In Oslo, the heights of the meteorological measure-
ment stations differ substantially from each other. The
heights above sea level of the stations of Hovin, Blindern
and Tryvann are 95, 94 and 514m.
In the early stages of the episode, the wind direction
was predominantly easterly; while in the latter stages, it
was very variable. The wind speed was variable (from
calm to almost 8.0m s�1) in the early stages of the
episode, and mostly low or moderate (from calm to
Oslo,Blindern,
2003
0
200
400
600
800
1000
-20 -15 -10 -5 0 5
T (C)
Hei
gh
t (m
)
January 3 January 4 January 5
January 6 January 7 January 8
Helsinki, Kivenlahti, 2002
0
50
100
150
200
250
300
350
-10 -5 0 5 10 15
T(C)
Hei
gh
t (m
)
April 1 April 3 April 5
April 7 April 9 April 11
April 13
Hei
gh
t (m
)
(a)
(b) (d)
Hei
gh
t (m
)
(c)
Fig. 4. (a–d) The observed temporal evolution of the vertical profiles o
the profiles are for midnight (00.00UTC on the date in question), an
4.3m s�1) in the latter stages. The atmospheric pressure
was elevated, especially during the latter stages. The
ambient temperature at the station of Hovin varied from
�20 to +1 1C at a height of 2m.
The magnitude of the inversion can be estimated
based on simultaneous measurements at stations located
at different heights. The temperature differences be-
tween Hovin and Tryvann, and Blindern and Tryvann,
are presented in Fig. 3a. The results show that a
substantial inversion structure of up to 20 1C prevailed
over the city. According to these measurements, the
largest magnitudes of the inversions occurred during the
weekend from 4 to 5 January and from 6 to 10 of
January.
Milan, Linate, 1998
0
500
1000
1500
2000
2500
3000
3500
4000
4500
5000
-20 -10 0 10 20
T (C)
Dec 13 Dec 15
Dec 17 Dec 19
London, Herstmonceux,2003
0
50
100
150
200
250
300
350
400
-4 -2 0 8 10 12
T (C)
17-Feb 18-Feb 19-Feb20-Feb 21-Feb 22-Feb23-Feb 24-Feb 25-Feb26-Feb 27-Feb 28-Feb
642
f temperature in the four cities. For Oslo, Helsinki and London,
d for Milan, noon (12.00UTC on that date).
ARTICLE IN PRESSJ. Kukkonen et al. / Atmospheric Environment 39 (2005) 2759–2773 2769
The evolution of the nocturnal vertical profiles
(measured at 00UTC) of the ambient temperature at
the station of Blindern is presented in Fig. 4a. The
results show that there were ground-based inversions on
all days from 6 to 10 January. The main reason for the
formation of the inversion was the advection of warm
air above the lowest atmospheric layers, in combination
with the intensive radiative cooling of the ground. The
occurrence of the inversions mostly coincides with the
very highest concentrations that occurred from 7 to 10
January.
3.3.2. Meteorological analysis for Helsinki
The ground surface temperatures at the station of
Helsinki–Vantaa varied from �4 to +15 1C. The wind
direction, speed, atmospheric pressure and Monin–O-
bukhov length values have been evaluated for the central
Helsinki area, using a MPP model. In the early stages of
the episode, during the period 1–6 December, the wind
speed varied from low (on 3 April) to high; during the
period from 7 to 10 April, the wind speed was low or
moderate. The wind direction was predominantly
between north and west. The highest PM10 concentra-
tions (during 3rd of April and from 8 to 13 April 2002)
show correlation with the occurrence of low and
moderate wind speeds.
Regarding PM10 episodes related to the suspension of
road and street material, the wind speed actually has two
opposite effects. A low wind speed is commonly related
to stable atmospheric stratification, favouring the
occurrence of high concentrations. On the other hand,
a strong wind tends to increase the suspension of road
and street materials in the air.
The evolution of the inverse Monin–Obukhov length
(L�1) is presented in Fig. 3b. The atmospheric pressure
started to increase on 1 April, and remained at an
elevated level until approximately 13th of April. The
atmospheric stability can be classified approximately as
stable or neutral during the whole period considered
(i.e., L40), except for short periods on 7 and 8 April.There were several periods of very stable atmospheric
conditions (classified as L�140.1m�1); these follow a
diurnal variation, in which the most stable conditions
commonly occur at night. L�1 values, as those of the
wind speed, correlate with the occurrence of the highest
PM10 concentrations.
The evolution of the nocturnal vertical temperature
profiles at the Kivenlahti mast is presented in Figs. 4b.
This mast represents the meteorological conditions in
the vicinity of Helsinki, although the mast is not located
in the urban area (its distance from the centre of
Helsinki is 15 km). The measured midnight temperature
profiles show that there was a moderate ground-based
temperature inversion on 3 April, and moderate or
strong ground-based inversions on all days from 7 to 12
April. The maximum ground-based inversion occurred
on 11 April, when the measured temperature increased
8 1C within the lowest 50m of the atmosphere. The
inversions were radiation inversions, caused by the
cooling of the ground surface by outgoing long-wave
radiation. The highest PM10 concentrations (during 3rd
of April and from 8 to 13 April 2002) coincided with the
occurrence of ground-based inversions.
3.3.3. Meteorological analysis for London
The atmospheric pressure, ambient temperature, and
wind speed and direction measured at the stations of
London Weather Center (LWC) and Heathrow and
vertical temperature profiles at the sounding station of
Herstmonceux were used for this analysis. The corre-
sponding meteorological parameters were also predicted
using the MM5 model. The temporal variation of all the
meteorological parameters considered (wind speed and
direction, pressure and temperature) measured at the
Heathrow station did not substantially differ from the
corresponding data measured at the LWC. As an
example, the wind speeds measured at these two stations
have been presented in Fig. 3c.
Wind speeds at a height of 10m varied substantially
during the period considered, from calm to almost
10m s�1; these values do not show any systematic
variation during the period addressed. The wind
direction was predominantly easterly. The atmospheric
pressure was fairly high during most of the period
considered. The ambient temperatures varied from �3
to +14 1C, and the daily average values show an
increasing trend during this period (Fig. 3c). There was
no rainfall throughout the period. Most of the time, the
predicted planetary boundary layer (PBL) height was
not especially low, although some values of less than
100m occurred during 20 and 21 February.
The measured nocturnal temperature profiles show
that there was a slight ground-based temperature
inversion continuously from 17 to 18, and from 20 to
24 February. However, the temperature only increased
from approximately 1 to 4 1C within the lowest 200m of
the atmosphere. In summary, an analysis of the
meteorological variables at Heathrow, LWC and
Herstmonceux did not reveal any exceptional condi-
tions, except for the ground-based inversions.
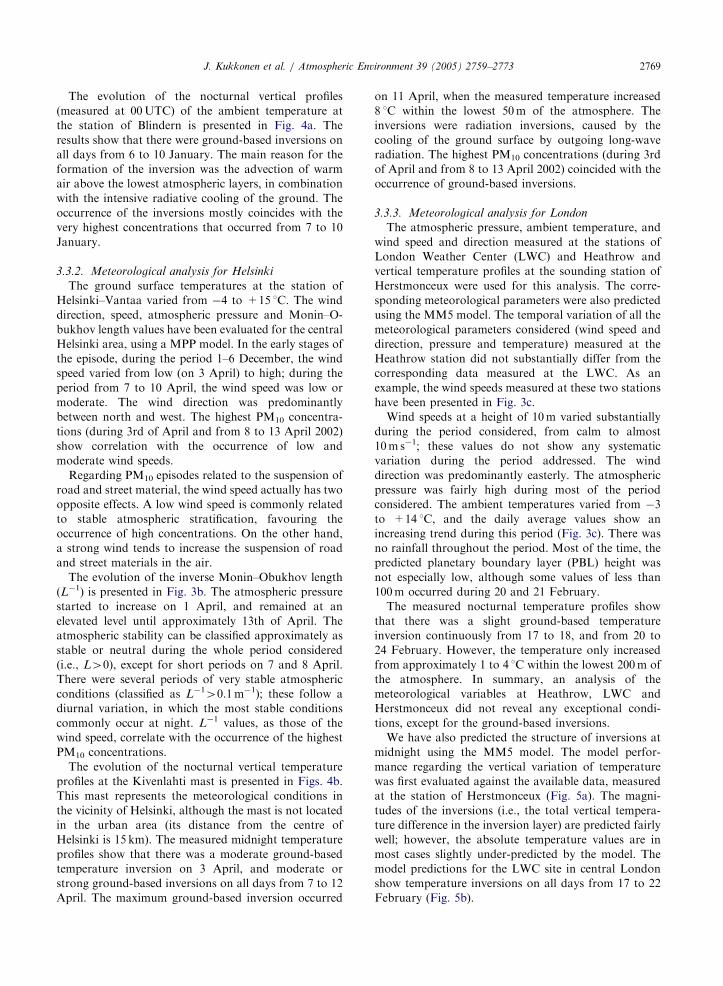
We have also predicted the structure of inversions at
midnight using the MM5 model. The model perfor-
mance regarding the vertical variation of temperature
was first evaluated against the available data, measured
at the station of Herstmonceux (Fig. 5a). The magni-
tudes of the inversions (i.e., the total vertical tempera-
ture difference in the inversion layer) are predicted fairly
well; however, the absolute temperature values are in
most cases slightly under-predicted by the model. The
model predictions for the LWC site in central London
show temperature inversions on all days from 17 to 22
February (Fig. 5b).
ARTICLE IN PRESS
London,Herstmonceux,
2003
0
250
500
750
1000
-4 -2 0 2 4 6 8 10
T (C)
Geo
po
ten
tial
Hei
gh
t (m
)
OBS Feb 21 MM5 Feb 21
OBS Feb 22 MM5 Feb 22
OBS Feb 23 MM5 Feb 23
London,London WeatherStation 2003
0
250
500
750
1000
-10 -8 -6 -4 -2 0 2 4 6
T (C)
Geo
po
ten
tial
Hei
gh
t (m
)
17 FEB 18 FEB
19 FEB 20 FEB
21 FEB 22 FEB
23 FEB
(a)
(b)
Fig. 5. The temperature profiles predicted by the MM5 model
at midnight (a) compared with the corresponding data
measured at the Herstmonceux station, and (b) for the LWC
site in central London.
J. Kukkonen et al. / Atmospheric Environment 39 (2005) 2759–27732770
3.3.4. Meteorological analysis for Milan
The wind direction, speed, atmospheric pressure,
temperature and humidity values were measured at the
urban station of Juvara, located in Milan. The
Monin–Obukhov length values have been evaluated
for the central Milan area, using the MPP model
SURFPRO, based on the data from the Juvara station.
From 12 to 17 December, the atmospheric pressure
remained at an elevated level. The wind speed was low
or it was calm during the whole period considered (Fig.
3d); light winds are one of the main prevailing features
of the Po valley climatology. Long-term statistics during
the period 1951–1991 for the Milano–Linate synoptic
station show a yearly frequency of calms (0–1 knots)
larger than 50 % (ENEL-AM, 1994). These conditions
are mainly due to the blocking effect of the high
mountains that surround the valley on three sides;
this orography tends to prevent synoptic flows from
reaching the lower atmospheric layers in the valley. The
city of Milan is at a substantial distance from the
mountains (approximately 40 km), and is therefore
usually only weakly influenced by a mountain breeze
circulation. The wind speed is therefore not a good
predictor variable in terms of peak pollution episodes
within this area.
Based on the predicted values of the Monin–Obukhov
length, the atmospheric stability can be classified as
stable or neutral during the whole period considered
(i.e., L40), except for short daytime periods (Fig. 3d).There was an extended period with very stable
stratification (L�140.1m�1) during the nights of 13 to
18 December. An intense slightly elevated temperature
inversion was formed on 13 December that reached its
maximum depth and magnitude (with a temperature
increase in height of about 15 1C in the lowest 1500m)
on 15 December and prevailed until 19 December (Fig.
4d). This period nearly coincided with the occurrence of
the highest concentrations from 14 to 19 December. The
inversions were caused by the advection of warm air
associated with the incoming high-pressure ridge. The
maximum temperature warming occurred between
heights of 1000 and 1500m above ground level, where
the temperature reached values of up to 15 1C. The
temperature of the surface layer did not change
substantially during the course of the episode.
4. Conclusions
This paper presents an analysis and evaluation of air
pollution episodes of PM10 concentrations in four
European cities. We have also utilised the episode
inventory within the FUMAPEX project. The discus-
sion is based on meteorological observations, accom-
panied by computations with NWP models and MPP
models.
ARTICLE IN PRESSJ. Kukkonen et al. / Atmospheric Environment 39 (2005) 2759–2773 2771
A summary of some of the key factors for the selected
episodes is presented in Table 3. Based on an examina-
tion of the concentrations of PM10 and PM2.5 measured
at various site categories, we concluded that the selected
episodes were caused in Oslo mainly by domestic wood
burning, partly also by local traffic, in Helsinki mainly
by suspended dust and local traffic emissions, in London
by both urban traffic and LRT, and in Milan partly by
local traffic, partly by LRT. All the episodes considered
were associated with the influence of areas of high
pressure (Oslo, Helsinki and London) or of a high-
pressure ridge (Milan). High atmospheric pressure is
commonly related to stable stratification; clearly, how-
ever, it does not necessarily lead to extremely stable
conditions or strong inversions near the ground level.
Strong ground-based or slightly elevated temperature
inversions prevailed in the course of the episodes in
Oslo, Helsinki and Milan, and there was also a slight
ground-based inversion present in London. Inversions
can be caused by various atmospheric processes, such as
subsidence, fronts, radiation and advection; radiation
and advection inversions are those that occur most
frequently in the course of air pollution episodes. In the
cases examined here, the inversions in Oslo and Milan
were mainly caused by advection, and that in Helsinki
was a radiation inversion. Clearly, the influence of
inversions on air quality crucially depends on their
detailed vertical structure and magnitude (elevation,
temperature gradient and the total temperature differ-
ence over the inversion layer) and the temporal
evolution (e.g., lasting only during the night or
continuously over several days and nights).
In order to find out whether temperature inversions
would also be concomitant with the highest concentra-
tions of PM10 in other corresponding episodic cases, we
investigated the episodes contained in the FUMAPEX
database. The result found was that, in all the
corresponding episodes included in the inventory, in
Oslo (three local wood combustion-originated cases and
two spring dust cases), Helsinki (two spring dust cases)
and Milan (two wintertime inversion-induced cases),
and London (two cases), this was indeed the case. The
evolution of the measured temperature inversions could
therefore be recommended—at least for some loca-
tions—as one predictor variable for forecasting the
likelihood of the formation of air pollution episodes in,
e.g., statistical and semi-empirical models.
The more pronounced maritime climatological con-
ditions in London tend to moderate the most extreme
local meteorological conditions, when compared with
the mountainous areas in Northern Italy and Southern
Norway, and the partly continental climate in Finland.
London also differs from the other cities considered here
because of its severe traffic congestion situation,
especially in the central parts of the city. For instance,
the average vehicle speed in central London has fallen
from 20 to about 16 kmh�1 over the last 20 years (Tfl,
2000). A peak pollution episode could, therefore, be
caused by high local emissions during relatively less
severe meteorological conditions, compared with smaller
cities that have a substantially better situation in terms
of traffic flow and the resulting emissions.
In the cases studied here, the best meteorological
predictors for the elevated concentrations of PM10 were
the temporal (hourly) evolutions of temperature inver-
sions, atmospheric stability and in some cases, wind
speed. However, in some cases a high wind speed can
also increase PM10 concentrations, due to an increased
suspension of particles from street and ground surfaces.
It was also discovered that a low wind speed is not
necessarily a good indicator of poor air quality or
pollution episodes in the case of all European regions. In
particular, in the Po valley, wind speed is a poor
indicator of peak pollution episodes, due to frequently
occurring calm and low wind speed conditions.
Acknowledgements
We wish to acknowledge the financial support of the
European Commission for the FUMAPEX project and
the Cluster of European Air Quality Research
(CLEAR). In addition, the support of the COST 715
Action and the Academy of Finland for the FORE-
CAST project is appreciated. The following are thanked
for their help in provision of air quality and meteor-
ological data: OPHA—the Municipality of Oslo, the
Helsinki Metropolitan Area Council, the Department
for Environment Food and Rural Affairs and the British
Atmospheric Data Centre, and the ARPA Lombardia
and Regione Lombardia.
References
Arianet, 2002. SURFPRO, SURface-atmosphere interFace
PROcessor user’s guide. Arianet Report, 2002.
Baklanov, A., Rasmussen, A., Fay, B., Berge, E., Finardi, S.,
2002. Potential and shortcomings of numerical weather
prediction models in providing meteorological data for
urban air pollution forecasting. International Journal of
Water, Air and Soil Pollution: Focus 2, 43–60.
Berge, E., Karppinen, A., Kukkonen, J., Køltzow, M.Ø.,
Slørdal, L.H., 2002. Simulations of wintertime inversions in
northern European cities by use of NWP-models. In:
Piringer, M., Kukkonen, J. (Eds.), Proceedings of the
Workshop 3 and 4 October 2001, Toulouse, France. COST
Action 715, EUR 20451, European Commission, Brussels,
pp. 75–88.
Calori, G., Clemente, M., De Maria, R., Finardi, S.,
Lollobrigida, F., Tinarelli G., 2004. Air quality integrated
modelling in Turin urban area. Environmental Modelling
Software, accepted for publication.
ARTICLE IN PRESSJ. Kukkonen et al. / Atmospheric Environment 39 (2005) 2759–27732772
Desiato F., Galliani G. and Menini L., 2000. Le reti di
monitoraggio della qualita dell’aria in Italia., Report of the
Italian National Environmental Protection Agency ANPA/
CTN ACE, RTI CTN_ACE 3/2000, Roma, Italy
2000, 81pp. http://www.sinanet.apat.it/documentazione/
QT_ACE_3_2000.ZIP
Draxler, R.R., Gillette, D.A., Kirkpatrick, J.S., Heller, J., 2001.
Estimating PM10 air concentrations from dust storms in
Iraq, Kuwait, and Saudi Arabia. Atmospheric Environment
35, 4315–4330.
Dudhia, J., 1996. A multi-layer soil temperature model for
MM5. Preprints, The Sixth PSU/NCAR Mesoscale Model
Users’ Workshop, 22–24 July 1996, Boulder, Colorado,
pp. 49–50. Available from http://www.mmm.ucar.edu/
mm5/mm5v2/whatisnewinv2.html.
ENEL-AM, 1994. Caratteristiche diffusive dell’atmosfera.
Report and Database, ENEL Aeronautica militare ITAV-
Servizio Meteorologico, Roma, Italy 1994, 80pp.
Finardi, S., Pellegrini, U., 2004. Systematic analysis of
meteorological conditions causing severe urban air pollution
episodes in the central Po valley. In: Proceedings of the
Ninth International Conference on Harmonisation within
Atmospheric Dispersion Modelling for Regulatory Pur-
poses. Forschungszentrum Karlsruhe, vol. 2. Garmisch-
Partenkirchen, Germany, pp. 250–254.
Finardi, S., Morselli, M.G., Brusasca, G., Tinarelli, G., 1997. A
2D meteorological pre-processor for real-time 3D ATD
Models. International Journal of Environmental Pollution
8, 478–488.
Finardi, S., Carboni, G., and Tinarelli, G., 2002. Analysis
of three air pollution episodes driven by a temperature
inversion in a sub-alpine Italian region. In: Piringer, M.,
Kukkonen, J. (Eds.), Proceedings of the Workshop 3
and 4 October 2001, Toulouse, France. COST Action 715,
EUR 20451, European Commission, Brussels, pp. 99–109.
Fisher, B.E.A., Kukkonen, J., Schatzmann, M., 2001. Meteorol-
ogy applied to urban air pollution problems COST 715.
International Journal of Environment and Pollution 16 (1–6).
Gangoiti, G., Alonso, L., Navazo, M., Albizuri, A., Perez-
Landa, G., Matabuen, M., Valdenebro, V., Maruri, M.,
Garcia, J.A., Millan, M., 2002. Regional transport of
pollutants over the Bay of Biscay: analysis of an ozone
episode under a blocking anticyclone in West-Central
Europe. Atmospheric Environment 36, 1349–1361.
GLA, 2002. Cleaning London’s air—the mayor’s air quality
strategy, Report published by Greater London Authority,
City Hall, London, pp. 35–36.
Grell, G.A., Dudhia, J., Stauffer, D.R., 1994. A description of
the fifth-generation Penn State/NCAR mesoscale model
(MM5). NCAR Technical Note, NCAR/TN-398+STR,
117pp.
Grigoryan, S., Erdman, L., 1996. The preliminary modeling
results of Saharan dust transport to the Mediterranean Sea
and Europe. In: Guerzoni, S., Chester, R. (Eds.), The
Impact of Desert Dust Across the Mediterranean. Kluwer
Academic Publishers, The Netherlands, pp. 59–67.
Hong, S.-Y., Pan, H.-L., 1996. Nonlocal boundary layer
vertical diffusion in a medium-range forecast model.
Monthly Weather Review 124, 2322–2339.
Karppinen, A., Joffre, S.M., Kukkonen, J., 2000a. The
refinement of a meteorological preprocessor for the urban
environment. International Journal of Environment and
Pollution 14 (1–6), 565–572.
Kousa, A., Kukkonen, J., Karppinen, A., Aarnio, P., Kosken-
talo, T., 2001. Statistical and diagnostic evaluation of a new-
generation urban dispersion modelling system against an
extensive dataset in the Helsinki area. Atmospheric Envir-
onment 35/27, 4617–4628.
Kukkonen, J. (Ed.), 2001a. COST action 715, meteorology
applied to urban air pollution problems. Working Group 3,
Status Report, Directorate-General for Research, Informa-
tion and Communication Unit, European Commission.
Brussels, 73pp. (http://cost.fmi.fi/statusreportprinted.pdf)
Kukkonen, J., Harkonen, J., Karppinen, A., Pohjola, M.,
Pietarila, H., Koskentalo, T., 2001b. A semi-empirical
model for urban PM10 concentrations, and its evaluation
against data from an urban measurement network. Atmo-
spheric Environment 35, 4433–4442.
Larssen, S., Sluyter, R., Helmis, C., 1999. Criteria for EURO-
AIRNET—the EEA air quality monitoring and information
network. Technical Report No. 12. European Environment
Agency (EEA) Publication, Copenhagen, pp. 52–54.
Laupsa, H., Slørdal, L.H., 2002. Applying model calculations
to estimate urban air quality with respect to the require-
ments of the EU directives on NO2, PM10 and C6H6. In:
Proceedings of the Eighth International Conference on
Harmonisation within atmospheric dispersion modelling
for regulatory purposes. Demetra Ltd., Sofia, Bulgaria,
pp. 429–433.
Millan, M. (Ed.), 2002. Ozone dynamics in the Mediterranean
basin. Air Pollution Research Report 78, Collection of
Scientific Papers Resulting from the MECAPIP, RECAP-
MA and SECAP Projects. European Commission and
CEAM, La Imprenta Comunication Grafica, Spain.
Paine, R.J., 1988. User’s guide to the CTDM meteorological
preprocessor (METPRO) program. US EPA Report EPA/
600/8-88/004. Research Triangle Park, NC, USA, 1988,
149pp.
Piringer, M., Kukkonen, J., (Eds.), 2002. Mixing height and
inversions in urban areas. Proceedings of the Workshop 3
and 4 October 2001, Toulouse, France. COST Action 715,
EUR 20451, European Commission, Brussels, 113pp. http://
cost.fmi.fi/proceedingsotoulouse.pdf
Pohjola, M.A., Rantamaki, M., Kukkonen, J., Karppinen, A.,
Berge, E., 2004. Meteorological evaluation of a severe air
pollution episode in Helsinki on 27–29 December 1995.
Boreal Environment Research 9 (1), 75–87.
Sillanpaa, M., Saarikoski, S., Koskentalo, T., Hillamo, R.,
Kerminen, V.-M., 2002. PM10 monitoring and intercom-
parison with the reference samples in Helsinki. Finnish
Meteorological Institute, Report, 12 December 2002.
Stevenson, K., 2003. QA/QC procedures for automatic air
quality monitoring networks in the UK. Presented at the
Conference on QA/QC in the Field of Emission and Air
Quality Measurements: Harmonization, Standardization
and Accreditation, 20–23 May 2003, Praha, Czech Republic.
Tfl, 2000. Transport Statistics for London 2000. Transport for
London, UK.
Valkama, I., Kukkonen, J. (Eds.), 2004. Identification and
classification of air pollution episodes in terms of pollutants,
concentration levels and meteorological conditions. Deliver-
able 2.1 of the FUMAPEX Project, Helsinki, 30pp.

ARTICLE IN PRESSJ. Kukkonen et al. / Atmospheric Environment 39 (2005) 2759–2773 2773
van Ulden, A.P., Holtslag, A.A.M., 1985. Estimation of
atmospheric boundary layer parameters for diffusion
applications. Journal of Climate and Applied Meteorology
24, 1196–1207.
Further reading
Karppinen, A., Kukkonen, J., Elolahde, T., Konttinen, M.,
Koskentalo, T., Rantakrans, E., 2000b. A modelling system
for predicting urban air pollution, model description and
applications in the Helsinki metropolitan area. Atmospheric
Environmant 34–22, 3723–3733.
Karppinen, A., Joffre, S.M., Kukkonen, J., 2002. Evaluation of
meteorological data measured at a radio tower in the
Helsinki Metropolitan Area. In: Piringer, M., Kukkonen, J.
(Eds.), Proceedings of the Workshop 3 and 4 October 2001,
Toulouse, France. COST Action 715, EUR 20451, Eur-
opean Commission, Brussels, pp. 89–98.
Related Documents